
Lamination and Its Impact on the Physical and Mechanical Properties of the Permian and Triassic Terrestrial Sandstones


1
Mineral and Energy Economy Research Institute, Polish Academy of Sciences, Wybickiego 7A, 31-261 Kraków, Poland
2
Faculty of Geology, Geophysics and Environmental Protection, AGH University of Science and Technology, Mickiewicza Av. 30, 30-059 Kraków, Poland
*
Author to whom correspondence should be addressed.
Resources 2021, 10(5), 42; https://doi.org/10.3390/resources10050042
Submission received: 8 February 2021
/
Revised: 29 April 2021
/
Accepted: 29 April 2021
/
Published: 1 May 2021
(This article belongs to the Special Issue Mineral Resource Management: Assessment, Mining and Processing)
Abstract
:The sandstones with a laminated structure are common building materials. Lamination is macroscopically expressed as colour and grain size variations observed both in the deposit and within individual beds; therefore, the properties of such sandstones are diverse depending on the spatial distribution of the binding mass and framework components. For the terrestrial sandstones of different genesis, four types of laminae have been distinguished based on petrographic studies. They have a siliceous binder or a mixed ferruginous–siliceous–argillaceous binder with different proportions of these components. In laminae of types I–III, the grain framework is built mainly of quartz grains, and in type IV, it is accompanied by numerous lithoclasts and feldspars. Knoop hardness and CERCHAR abrasivity were tested in each lamina variety, and the results were correlated with the equivalent quartz content and the longitudinal ultrasonic wave velocity measured perpendicular and parallel to the lamination. The proposed research methodology was not used in previous studies on terrestrial laminated sandstones. The results explain a strong dependence between mineral composition, structure of laminae, and technical parameters of rocks. The knowledge of this relationship facilitates the selection of rocks that meet the relevant technical requirements and helps to optimally manage the resources of sandstone deposits.
1. Introduction
The sandstones with the laminated structure and colours from pink to dark red due to different ratios of their ferruginous, argillaceous, and siliceous binding mass are common building materials. Some worldwide examples include China (China Maple Red Sandstone, Red Vein Sandstone), India (Agra Red Sandstone), the USA (Lyons Red Sandstone), Spain (Red Sunset Sandstone), the Great Britain (Stoneraise Red Sandstone—Lazenby), and Poland (Kopulak Sandstone, Tumlin Sandstone, Bieganów Sandstone). These rocks are decorative and easy for tooling, which are two main reasons for their frequent use. Despite generally advantageous technical parameters, the properties of such sandstones are greatly diversified, depending on the spatial distribution of the binding mass and framework components [1,2,3,4,5,6,7,8]. This petrographic variability is present not only in the scale of the entire deposit but also within individual beds. The knowledge of that makes selecting the rocks that meet requirements of their planned use easy [9,10,11] and helps with applying proper rock tooling [12] and setting up stone elements in the appropriate predicted position. The designers’ disregard for the diversity of the stone technical parameters (in turn, controlled by the rock lithology) may lead to grave planning error and result not only in damage of the stone elements themselves but also in more serious construction disasters that put at a risk human health and life. As an example, we can give the problem of exposing mechanically weak laminae prone to excessive wear in sandstone setts and paving flagstones (Figure 1A). Another example is provided by the way of anchoring elevation wallboards. The presence of a mechanically resistant outer lamina is not sufficient to secure a firm setting of the stone, because the construction stability depends on deeper laminae in which the anchor bolts are fixed. If the mechanical resistance of such inner laminae happens to be weak, the resulting stress may finally lead to defoliation of the wallboard and peeling off elevation fragments (Figure 1B).
The aim of the work was the investigations on the impact of the lithological diversification of thin layers—laminae present in some terrigenous sandstones of a various genesis on the selected physical and mechanical properties of these rocks. The low thickness of the laminae, below several millimetres, induced the authors to use the methods applicable in the studies of microareas, such as the determination of the Knoop microhardness (HK) and the CERCHAR abrasiveness (CAI), which were supported with optical and scanning microscopy. The results have been correlated with the velocities of the longitudinal ultrasonic waves and with the apparent density and water absorbability of the sandstone samples. Detailed knowledge of the quality variation of laminated sandstones makes it possible to manage rock material of different properties and to reduce waste production. Thus, it significantly contributes to the protection of such rock deposits.
2. Materials
Samples of laminated sandstones of the terrestrial origin from three Polish quarries were collected as the material for the study. They represent examples of rocks formed in different sedimentary environments and subjected to successive processes under arid or semi-arid conditions.
The sediments of the Tumlin Member from the Zagnańsk Formation (the uppermost part of the Lower Buntsandstein, late Induan) developed in the Permian-Mesozoic sedimentary cover of the northern part of the Holy Cross Mountains [13,14,15]. Their samples were taken from the Tumlin-Gród quarry, located on the southeastern slope of the Grodowa Hill, ca. 12 km north of the town of Kielce. The Tumlin Member is built of sandstones that are mainly of aeolian origin attributed to the deposition in lee slopes of coastal dunes [16,17,18,19].
The Lower Triassic sandstones from the Baranów Formation (the Upper Buntsandstein, late Olenekian, lower Roetian) represent another example of terrestrial deposits of the Permian-Mesozoic Marginal Zone of the Holy Cross Mts. [13,19,20,21]. The sediments from the Kopulak quarry, located 2 km east of the town of Suchedniów, on the southern slope of the Stokowiec Hill, belong to the Wąchock beds (informal unit) and represent a facies succession typical of braiding rivers that existed in the southeastern margin of the Central European Basin [18,21,22,23].
The lower Permian sandstones from the lower part of the Słupiec Formation (the Middle Rotliegendes, late Autunian), locally referred to as the Building Sandstones [24,25,26,27,28,29,30] have a similar origin, since they belong to detrital succession filling the Intra-Sudetic Trough (the Central Sudetes Mountains, SW Poland). The Bieganów quarry (German: Biehals) lies on the NE flank of this sedimentary basin and is located between the town of Nowa Ruda and the village of Słupiec, on the northern slope of the All Saints’ Mountain. The sandy-gravel deposits of the Słupiec Formation were formed probably in a fluvial system of the terminal fan environment in an arid or semi-arid climate. The most common in these sediments are channel facies, but overbank and lacustrine sediments are also present [25,27,30,31].
3. Methods
Several (10–23) cubic samples with edges 50 ± 2 mm oriented to the main direction of lamination were cut from the material representing each of the three geological formations. Some of them were selected to prepare also microscopic thin sections and to polish the cube surfaces perpendicular to the lamination for tests of microhardness and abrasivity.
The first stage of examinations included general petrographic descriptions of the sandstones and was followed by detailed characteristics of the lamina varieties distinguished on the basis of hand specimen observations.
The sandstones from Tumlin-Gród, whose petrographical properties are most differentiated among the three rock deposits, had the thickness of the laminae measured with a calliper gauge, and their percentage was calculated in individual samples. The data obtained were used for estimating the qualitative and quantitative impact of the lamina varieties on the physical and mechanical properties of the whole rock samples.
These initial investigations were supplemented by microscopic observations with an optical transmitting light microscope and a scanning electron microscope FEI Quanta 200 FEG (a low-vacuum SEM) with a BSE detector. They were focused on the mineral identification of the framework grains and the character of grain contacts, the type and amount of the bounding mass, and measurements of microscopic rock porosity. In addition, the grain size distribution was determined in all the lamina varieties. Based on the results of the petrographic analysis, the total equivalent quartz content (Qeq) was determined in the laminae of each variety. Calculations were made according to the formula given by Thuro and Plinninger [32] using the percentages of mineral grains and cements as well as their hardness expressed in the Rosiwal scale corresponding to the Mohs scale values. The following values of the equivalent quartz percentages have been adopted for the individual rock components: quartz—100%, feldspars—31%, muscovite—1%, heavy minerals—125%, silica lithoclasts—100%, magmatic lithoclasts—71%, siliceous cement—100%, ferruginous-argillaceous cement—3%. The calculations also took into account the share of pores, which were assigned a value of 0%.
The basic physical rock properties, i.e., the apparent density and water absorption, were measured in all the samples following the EN 1936 and EN 13755 standards [33,34]. Further investigations included the measurements of the propagation velocity of the longitudinal ultrasonic waves, applying the direct method. These tests employed an apparatus (made by Unipan-Ultrasonic) that records the transit time of the pulse with a pair of the 500 MHz transducers. The wave velocity was measured by the through-transmission technique perpendicular to the lamination, at first in the dry state of the samples (after drying in the temperature 75 ± 5 °C) and then after their saturation with water at atmospheric pressure. Another velocity parameter was also measured in the dry samples applying the pulses propagating parallel to the alignment of distinguished lamina varieties.
The Knoop microhardness was tested on the polished surfaces of the selected cubes, for which microscopic observations had earlier been carried out. The microhardness was determined within selected varieties of the laminae. The measurements were conducted using a Testlab HVKD-1000IS Knoop/Vickers hardness tester meeting the requirements of EN ISO 4516:2002 and JIS B 7725, following the EN 14205 standard [35,36,37]. The Knoop testing points were spread every 1 mm along a measuring line oriented perpendicular to lamination, in each of them determining the lamina variety and the mineral component. The number of testing points was determined on the basis of the degree of microhardness variability in a given variety of laminae. So, for the coefficient of variation below 15%, in the range of 15–50% and above 50%, the number of measurements was 30, 40, and 50, respectively. The test procedure, i.e., shifting the indenter to the measuring position followed by its indenting into the rock surface for 10 s under a load of 0.98 N, was fully automated. The Knoop hardness was calculated according to the expression (Equation (1)):
where HK—Knoop hardness [MPa]; F—load [N]; D—the length of the longer diagonal of the indentation mark [mm].
The distinguished varieties of the laminae visible in the cube samples of the sandstones were subjected to the CERCHAR abrasivity test, which can shed light on the impact of petrography on the physical and mechanical characteristics of the laminae. The investigations were conducted in accordance with ASTM D7625-10 standard and ISRM recommendations [38,39,40]. An apparatus for immobilising the samples and moving special scratching styli with required force, distance, and velocity was used. The styli, whose tips have the conical shape with an opening angle of 90°, were made of the steel tempered to the Rockwell hardness HRC 55 ± 1. During the abrasivity tests, the stylus being under a load of 70 N was moved 10.0 mm for 1 ± 0.5 s along the selected sandstone lamina.
The diameter (d) of the wear flat of the stylus was measured with an accuracy of 0.01 mm using a microscope. Abrasiveness (CAI) was calculated according to the formula given below (Equation (2)) as the arithmetic mean of four replications made on the surface of each lamina variety.
The results are expressed as the CAI (CERCHAR Abrasivity Index) dimensionless values together with their standard deviations.
Subsequently, the estimated values of uniaxial compressive strength for each lamina variety were calculated on the basis of the equations presented in the literature, desribing the relationship between this parameter and the CAI value. Direct measurements of this property have not been carried out due to the small thickness of the laminae and inability to prepare 5 cm cubic samples compliant with the ISRM recommendations.
4. Results
4.1. Petrographical Description of the Rocks
4.1.1. Sandstones from the Zagnańsk Formation (Tumlin Sandstones)
Aeolian sandstones of the Tumlin Member (the Zagnańsk Formation) are characterised by a very large-scale cross stratification [16]. The samples taken in the Tumlin-Gród quarry represent fine- and medium-grained [41], red-orange sandstones with clearly visible lamination (Figure 2). According to the classification of Pettijohn et al. [42], they belong to the sublithic arenites.
Based on microscopic observations, it can be concluded that the framework of these rocks consists almost entirely of quartz grains, marginally muscovite, feldspar, heavy minerals and, exceptionally, lithoclasts, cemented by pore or contact-pore matrix. The quartz grains are mainly monocrystalline, occasionally polycrystalline. They are not fractured, but some of them show signs of diagenetic dissolution.
The sandstone structure is distinctly directional and visible in the samples as parallel lamination emphasised mainly by differences of colours. On the basis of macroscopically visible colour, four varieties of laminae were identified: light grey (T1), light red-orange (T2), dark red (T3), and cherry brown (T4). The transitions between the laminae are also expressed as the changes of grain sizes and matrix contents as well as the distribution of the latter within sandstone pores.
4.1.2. Sandstones from the Baranów Formation (Kopulak Sandstones)
The purplish red sandstones from the Kopulak quarry (the Baranów Formation) are mainly medium-grained with large-scale planar or trough cross bedding, as well as ripple bedding. According to the classification of Pettijohn et al. [42], they represent the sublithic arenites.
The rock fabric consists almost entirely of quartz, much less frequently of siliceous rock fragments, and sporadically of muscovite. Quartz grains are of irregular shapes and various sizes, and they often show straight or notched walls, which is a result of the formation of authigenic silica on the detrital material. Lithoclasts are predominantly well rounded and elongated. The presence of hematite pebbles is the specific feature of these rocks [21]. The groundmass, mainly siliceous or ferruginous, is present usually in the form of the contact-pore cement and often as regeneration quartz overgrowths.
The sandstones are characterised by a directional structure observable in samples as parallel or diagonal lamination less distinct than that from Tumlin (Figure 2). Four varieties of laminae have been distinguished: compact, purplish red (K1), porous, purplish red (K2), violet brown (K3) and dark brown, sometimes almost black (K4). The boundaries between all the lamina varieties are gradational similarly to those in the sandstones from the Tumlin Member.
4.1.3. Sandstones from the Słupiec Formation (Bieganów Sandstones)
The samples of red sandstones from the Bieganów quarry (the Słupiec Formation) represent sublithic to subarkosic arenites [42] with grains of various sizes [30]. They are mainly medium- to fine-grained, but an admixture of coarser detritus is quite frequent (Figure 2).
The detrital material comprises mainly mono- and polycrystalline quartz and weathered feldspars with irregular, sharp-edged shapes. Numerous grains of both minerals reveal overgrowths of the parental matter, as well as rims and larger accumulations of a ferrous substance [43]. The overgrowths and rims form together the contact-pore cement. Lithoclasts of granitoids are also the significant components of these sandstones.
The sandstones reveal horizontal or cross bedding and contain the lenses of coarser material, which is observable in a few samples as evidently distinguishable horizontal laminae differing from each other due to their colour and texture. The light red laminae of fine-grained sandstone (B1) are accompanied by laminae built of clearly different coarse-grained material (B2) and fine-grained laminae with dark red colour (B3).
4.2. Characteristics of Lamina Varieties
4.2.1. Light Grey Lamina Variety (T1)
The light grey laminae (variety T1) of the aeolian sandstones from the Zagnańsk Formation contain detrital material in an amount of 71.0%–74.5% by vol. (Figure 3). This framework is almost exclusively built of the grains in the size range 0.063–1.00 mm with the prevailing fraction 0.125–0.500 mm. The characteristic of this rock type is an entire lack of finest clasts (below 0.063 mm, Figure 4).
Small and quite occasional (1.1%–6.3%) voids have regular shapes and are limited by walls of authigenic quartz crystals (Figure 3). Interstices between subangular or subrounded quartz grains are filled with well-developed, thick silica overgrowths, which favour straight and sutured contacts. Rims of iron compounds and fine accumulations of siliceous cement also occur on some detrital grains. The total share of the binder is 19.8%–24.7% by vol. The equivalent quartz content determined in this lamina variety is 94.8%.
The thickness of laminae of the variety T1 usually does not exceed a few fractions of a millimetre, and it sporadically reaches 2–3 cm. Thin laminae have distinct borders and are easily visible against a background of the rock (Figure 2). Those above 1 cm thick form rather light grey zones that gradually turn into the red laminae. The average share of the T1 laminae is only ca. 17%.
4.2.2. Light Red-Orange Lamina Variety (T2)
The fabric grains of the light red-orange laminae (variety T2) are within 0.031–1.00 mm range, with the main fraction being 0.125–0.500 mm, as it is in the variety T1 (Figure 4). The T2 laminae are characterised by a low content of the finest fractions. The share of detrital grains is 62.1%–66.9% by vol. They are most often subangular or subrounded, and they are rarely angular. Quite well-rounded framework grains show point or long contacts (Figure 3).
Interstices with numerous throats among detrital grains are of irregular shapes and various sizes (up to 0.6 mm). Pore walls are mostly lined with thin layers of a clay substance and iron compounds. Quartz overgrowths are thin and occur rather seldom. They are accompanied by fine clusters of clay minerals. The content of cement is low (6.3%–12.0%), and the pores occupy 21.1%–31.7% of the rock volume, which results in a low equivalent quartz content (Qeq = 68.6%).
The thickness of the T2 laminae is usually in the range 0.5–3.5 cm. Their distinction is possible rather by colour than by the presence of pores, which are macroscopically hardly visible (Figure 2).
4.2.3. Dark Red Lamina Variety (T3)
In the dark red laminae (variety T3) the most grains represent finer fractions (0.031–0.50 mm, Figure 4). They are mainly angular, less frequently rounded or subrounded, of various shapes from irregular to elongated and isometric (Figure 3). They reveal point or long, sporadically sutured contacts. The amount of detrital grains reaches 72.7%–75.1% by vol., depending on a sample.
Clay minerals and iron compounds form thin envelopes around quartz grains. These components together with the silica cement and, sometimes, bent flakes of muscovite fill also some small pores. The total share of cement is 15.3%–18.1%, whereas the amount of pores is 8.2%–11.5% by vol. Together, these features contribute to a low equivalent quartz content (Qeq = 76.0%) in laminae of this variety.
This variety of laminae together with the porous laminae of the variety T2 prevail in the rock (60%–90% by vol.). The range thickness of the variety T3 laminae is 0.1–2.7 cm, but those that are a few millimetres thick (up to 1 cm) dominate (Figure 2).
4.2.4. Cherry Brown Lamina Variety (T4)
The laminae of the variety T4 are characterised by the strong domination of the finest grains (0.031–0.063 mm) and an insignificant amount of the coarsest fractions (Figure 4). The content of grains (71.5%–72.6% by vol.) is similar to that of the variety T1 laminae, but they are usually angular or subangular and less often subrounded (Figure 3). Point and long contacts are frequent. Sutured joints are sometimes also visible in thin sections.
The framework is bound together by abundant ferruginous cement (hematite?) and, to a lesser extent, by clay and silica accumulations. The pore space constitutes only 5.3%–8.2% by vol. of the sandstones. The low equivalent quartz content value in laminae of this variety is similar to that of the T3 variety and amounts to 79.1%.
Thin laminae of the variety T4 are no more than 1.35 cm thick, usually ranging 0.1–0.4 cm. Their specific brownish colour allows easily distinguishing them from other laminae, although they are the least frequent (the average content is ca. 7%, Figure 2).
4.2.5. Purplish Red, Compact Lamina Variety (K1)
The characteristic of all the laminae in the Baranów Formation sandstones (Figure 5) is almost an entire lack of the finest fraction (0.031–0.063 mm) with a domination of grains in the size range 0.125–0.50 mm (Figure 6). The same concerns the laminae of the variety K1, which are specific due to the very low content (1.2% by vol.) of small and regular-shaped pores formed among the crystal walls of authigenic quartz.
The detrital grains, amounting to 67.3%, are subrounded and covered by thick overgrowths of quartz (Figure 5). The latter have favoured the formation of the sutured and convex–concave grain contacts. Abundant siliceous cement is accompanied by small clusters of ferruginous compounds. The cement content is high and amounts to 31.5% by vol., which contributes to the high equivalent quartz content (Qeq = 95.6%).
The laminae of the variety K1 have the thickness in the range 0.1–1.0 cm, usually 0.2–0.3 cm. They are rather widespread, and their average content is around 40%.
4.2.6. Purplish Red, Porous Lamina Variety (K2)
The grain size distribution and the share of detrital matter in the laminae of the variety K2 is almost alike as in the variety K1. However, the significant differences are in the amount of cement (7.3% by vol.) and pores (18.6% by vol., Figure 5). This results in a lower equivalent quartz content of up to 80.6%.
The framework grains, especially of quartz, are most often subangular and angular, less frequently subrounded, and in that case, they show regeneration rims. The contacts among them are long or tangential. Interstices and voids are of irregular shapes and various sizes. Some of them are filled with sparse ferruginous and clay matter.
The laminae of the variety K2 are slightly thicker than those of the variety K1. Their thickness reaches 1.5 cm, being usually 0.5 cm. They make up around 50% on average (Figure 2).
4.2.7. Violet Brown Lamina Variety (K3)
The grain size within the laminae of the variety K3 is slightly more differentiated than in the laminae described above. The predominantly angular, less frequently subangular, and poorly rounded grains of the fabric, with numerous sutured and long contacts (Figure 5), occur mostly in the range 0.063–0.50 mm (Figure 6).
Due to the presence of quartz overgrowths as well as the accumulations of iron compounds (hematite?) and clay minerals, a lot of spaces between grains are filled with cement (17.6% by vol.). The total equivalent quartz content for this type of laminate is quite high at 90.6%.
The laminae of this variety are much thinner, from fractions of millimetres to around 3 mm, than those described above (Figure 2). Their content is variable and ranges from around 1% to 10%.
4.2.8. Dark Brown Lamina Variety (K4)
Dark brown laminae of the variety K4 from the sandstones of the Baranów Formation have a similar amount of framework grains (66.2%), cement (28.8%), and pores (5.0%) as the laminae of the variety K1 (Figure 5) but differ particularly in the composition of cement. Subangular to subrounded grains of various size, connected usually by long contacts, are bound together first of all by clusters of a dark substance (probably a mixture of iron and manganese compounds) that fully fills interstices. The quartz overgrowths and in some pore fillings of microcrystalline, authigenic silica are additional features. The above features result in a lower value of equivalent quartz content equal to 80.7%.
The laminae of the variety K4 occur occasionally and not in all samples. Usually, they are short, discontinuous, and their thickness does not exceed 2–3 mm (Figure 2).
4.2.9. Light Red, Fine-Grained Lamina Variety (B1)
The light red laminae of the variety B1 (sandstones of the Słupiec Formation) are composed of the framework grains in 78.5% by vol. (Figure 7). The range of their sizes is 0.031–1.00 mm with the prevalence of the fraction 0.125–0.25 mm (Figure 8). The grains are usually subrounded and subangular, with shapes differing from isometric to slightly elongated.
The framework consists mainly of monocrystalline quartz grains, which are accompanied by fragments of granitoids, feldspars, and micas. Many grains of quartz reveal thick, fully developed regeneration rims, and for that reason, such grains have developed long or convex–concave contacts.
Among the sandstones of the Słupiec Formation, these laminae have the lowest amount of the cement, 16.3% by vol., but it is mainly the siliceous cement that rather fully fills intergranular spaces. Silica is sometimes accompanied in pores and along the intergranular contacts by fine accumulations of iron compounds and clay minerals. Empty pores make up only 5.2% by vol. Such a mineral composition of the laminae of this variety results in an 77.1% equivalent quartz content.
The thickness of the variety B1 laminae ranges from 2 to 10 mm (Figure 2). Their contribution to the total of the laminae in the Słupiec sandstones is 25%–50%, usually 30% in individual samples.
4.2.10. Light Red, Coarse-Grained Lamina Variety (B2)
The framework grains in the red laminae of the variety B2 make up 67.1% by vol., and their size range is 0.063–2.00 mm (Figure 8). The most common are grains 0.125–0.50 mm large, usually angular with irregular shapes. Some of them have triangular or rectangular cross-sections and reveal only in the coarsest fractions imperceptible rounding (Figure 7).
The framework consists mostly of quartz grains accompanied by significant amounts of the fragments of granitoids and siliceous rocks. The list is completed by rather numerous alkali feldspars, plagioclases, and micas.
The cement is dominated by iron compounds that fill pores or form fine accumulations along the grain contacts. Less frequent is the microcrystalline siliceous cement, rather tightly filling part of pores. In addition, few quartz grains reveal the presence of not fully developed regeneration rims, surrounding two or three neighbouring grains. A few of the pores are filled with the clay cement. The total content of the cement of all the types is 20.1% by vol. Hollow pores are rather widespread, as their contribution is 12.7% by vol. The total equivalent quartz content is 67.7%.
The laminae of the variety B2 occur in highly variable amounts, from 10% to 55%, and their thickness changes from 0.1 to 2.2 cm (Figure 2). They usually form thick, horizontal layers or fine lenses visible in the samples.
4.2.11. Dark Red, Fine-Grained Lamina Variety (B3)
The content of the framework in the dark red laminae of the variety B3 (58% by vol.) is the lowest of all the distinguished lamina varieties. As identified in the light red, fine-grained variety B1, it also consists mainly of monocrystalline quartz grains, accompanied by minor fragments of granitoids and siliceous rocks, grains of feldspars, and mica flakes (Figure 7). There is also a similarity in the range of the grain sizes, among which the fraction 0.063–0.125 mm distinctly dominates (Figure 8). The framework grains are usually semi-rounded and semi-angular, isometric, and rather seldom slightly elongated.
The cement content is high, as it makes 33.7% by vol., and it is composed mainly of the ferruginous substance, which fills pores or is developed as fine accumulations among the framework grains. The remaining components of cement include silica and clay minerals, both occurring in low amounts as infillings of small pores. The high contribution of the cement results in low porosity (8.5% by vol.) of the sandstones within such a variety of laminae. The total equivalent quartz content is only 62.4%.
Dark-coloured laminae of the variety B3, although rather frequent (7–12 laminae in a sample), are thinner than 5 mm, usually in the range 1–3 mm (Figure 2). Mostly, they surround coarse-grained laminae of the variety B2. The contribution of the B3 laminae ranges between 20% and 55%.
4.3. Water Absorbability and Apparent Density
In the laboratory tests, the lowest water absorption (mean 3.36%) was revealed by the aeolian sandstones from the Zagnańsk Formation, which, simultaneously, have the highest apparent density (2.30 g/cm3). Within the three sandstone sets (Table 1), they are characterised by a relatively high variability of their physical properties. A higher average water absorption of 4.33% showed the sandstones of the Baranów Formation. Additionally in this case, the absorption covers a rather wide range of 3.80–4.68%. The most water-absorbing are the sandstones of the Bieganów Formation (mean 6.23%), and the results obtained in individual samples were close to each other, changing from 6.07% to 6.47%.
4.4. The Velocity of the Longitudinal Ultrasonic Waves and Rock Hardness
The velocity of the longitudinal ultrasonic waves was measured first with the pulses propagating perpendicular to the lamination visible in the sandstone cube samples. The highest values of this parameter, both in the dry state of the samples and after their saturation with water, were recorded for the samples from the Baranów Formation (Kopulak sandstones): the means are 3.980 km/s and 4.143 km/s, respectively (Table 1). Lower wave velocity revealed the sandstones from the Zagnańsk Formation (mean 3.234 km/s in the dry state), while the variability of that parameter was the highest of the three locations as the standard deviation is 0.156 km/s. In addition, saturation of the Tumlin sandstones samples with water resulted in the highest increase of the velocity: about 0.6 km/s on the average. Moreover, the dependence between the water absorbability and the ultrasonic wave velocity exists only in the Tumlin sandstones (Figure 9). The increase of the absorbability from ca 3% to 4% resulted in a lowering of the velocities by ca 0.5 km/s, which was measured both in the dry and water-saturated samples. The lowest were the ultrasonic velocities in the Permian sandstones from the Słupiec Formation: in the dry samples, 2.618 km/s, and in the water-saturated ones, 2.722 km/s (both figures are average values).
The measurements of the ultrasonic wave velocities in single laminae had to be done only parallel to the laminae direction because their thicknesses were too low to prepare the samples on which the tests in the perpendicular direction could have been done. The velocity values considerably differ among the laminae even within the same type of the sandstones. It is expressed most in the aeolian Tumlin sandstones: the mean wave velocity in the porous laminae of the variety T2 was 3.169 km/s, but in the compact laminae of the variety T1, it was ca 30% higher, i.e., 4.150 km/s (Table 2). Comparable high values were recorded in the compact laminae of the sandstone varieties K1 and K3 from the Baranów Formation, 3.910 and 4.173 km/s, respectively. With regard to a very low thicknesses and a discontinuity of the variety K4, the measurements were impossible to be carried out. In turn, the B1, B2, and B3 laminae of the Słupiec Formation sandstones, likewise the whole samples from that location, had the lowest values of the ultrasonic velocities (from 2.468 to 2.749 km/s), with the significantly lowest ones in case of the coarse-grained laminae of the variety B2.
An impact of lamination on the velocity of the longitudinal ultrasonic waves was investigated by comparing the velocity values with the share of the distinguished lamina varieties within each of the sandstone cubic samples from the Zagnańsk Formation. The samples from that location were chosen as they reveal the highest diversification of their features, i.e., colours, water absorption, apparent density, and velocities of the ultrasonic waves. The comparison shows that there is no direct dependency between the wave velocities measured in the entire rock samples, perpendicular to the laminae and the total shares of the lamina variety T1, and of the lamina variety T4 as well. A possible reason of that can be explained by a low thickness of these laminae and their relatively low amount. The velocities of the ultrasonic waves are more affected by the presence of the porous laminae of the T2 variety (R2 = 56%) and the dark red laminae of the T3 variety (R2 = 43%). Next, the multiple regression was used for the comparisons, accepting the content of laminae and the rock physical parameters as independent variables. In the samples of the Tumlin sandstones, it is the content of the laminae of the T2 variety and the water absorbability that explain around 75% of the variance in the ultrasonic wave velocity, while the content of the T1 lamina variety and the water absorbability explain ca 78% of that variance.
Taking into account the share of laminae of different varieties and the ultrasonic wave velocity measured parallel to their direction, it has been possible to calculate theoretical values of this velocity (Vt) for the whole rock samples. The theoretical, i.e., estimated values, calculated as a weighted arithmetic mean, correlate with the real values (Vr) measured perpendicular to lamination (R2 = 51%) although being higher by 0.089–0.487 km/s (0.304 km/s in the average, Figure 10). The discrepancies may result from different directions of the measurements across and along the laminae but also from the problems of measuring the velocity in thin laminae.
Some relations have also been found between the presence of the laminae of different varieties and the sandstone properties within three groups of the Tumlin samples distinguished in the hand specimens. The first group consists of rocks in which prevail porous, orange-red laminae of the variety T2 (57.2% in the average), while the total of the dark red (T3) and brown laminae (T4) is low (19% in the average) (Table 3). The second group includes the samples with a considerably higher content of the variety T3 (35%), and the third one includes the generally darker red samples, in which the T3 laminae make up as high as 72.3% and the T4 laminae make up 20.1%. The apparent density of the three groups consecutively increases from 2.29 to 2.32 g/cm3, whereas the water absorbability decreases from 3.48% to 3.15%. The respective velocities of the ultrasonic waves measured in the dry samples are 3.11 km/s in the first group, 3.29 km/s in the second one, and 3.39 km/s in the third one.
With regard to a considerable majority of quartz grains in the composition of all the sandstones, it is just the content of this mineral affecting most the microhardness values of individual laminae (Table 2). The impact of the mineral substance that binds the framework grains is minor but also important, because in some cases, the binder reduced the HK value of the lamina. The highest Knoop microhardness (above 300 MPa) was recorded when indenting the tester into the large quartz grains and their regeneration rims or into the suturing contacts between such grains (Figure 11A). The microhardness decreased even to 150 MPa when indentations were made into the borders of quartz grains surrounded by ferruginous-argillaceous matrix, which resulted in the fracturing and displacing the mineral fragments (Figure 11B). The measurements falling on the ferruginous-argillaceous binding mass or rock pores recorded the lowest microhardness, i.e., below 100 MPa (Figure 11C,D).
The obtained results of microhardness prove that the values of this parameter vary considerably not only between varieties of laminae but also within the given lamina variety (Table 2). The average microhardness of lamina varieties ranges between 146.5 and 315.4 MPa. Porous laminae of K2 variety are characterised by the greatest variability of this parameter (coefficient of variation equal to 62.2%), at the same time assuming one of its lowest values (mean approximately 150 MPa). Not only the porosity but also the presence of a clay-ferruginous binder and diversified mineral composition contribute to the high variability of microhardness in laminae of the T2, T3, T4, B1, B2, and B3 varieties (coefficient of variation in the range of 15–50%). In turn, the compact laminae with a significant content of either the siliceous (T1 and K1 varieties) or siliceous-ferruginous (K3 and K4 varieties) cements have their microhardness high (mean approximately 300 MPa) and contained in narrow ranges (coefficient of variation below 15%).
The lowest values of the CAI index revealed the laminae in the sandstones from the Słupiec Formation (Bieganów quarry): their means are 1.6 or 1.8. In the Alber et al. classification [40], such figures indicate the low abrasiveness category, typical of the relatively soft rocks, which enable easy quarrying and tooling. The medium values of this parameter (in the range of 2.2–3.1) were measured in laminae of the T2, T3, T4, K2, and K4 varieties, whereas very high CAI values (4.0–4.6) have been recorded in the compact laminae of the varieties T1 as well as K1 and K3 (Figure 12). The relation between the average Knoop microhardness and the velocity of ultrasonic waves obtained for distinguished lamina varieties reveals a moderate positive correlation (R2 = 37.78%). It is much more distinct for laminae with a similar petrographic composition, e.g., from aeolian Tumlin sandstones (Figure 13A). The rock abrasiveness is correlated moderately with the Knoop hardness (R2 = 57.72%) but very highly with the velocity of ultrasonic waves (R2 = 87.57%) (Figure 13B,C).
The high correlation between the values of the abrasivity index (CAI) and uniaxial compressive strength (UCS), reported by many authors, allows the estimation of the latter parameter without the need to perform destructive tests. The minimum and maximum results of the relevant calculations based on the equations obtained from the data included in the works by Majeed and Abu Bakar [44], Capik and Yilmaz [45], and Teymen [46] are presented in Table 4 and apply to all varieties of laminae.
The mineral composition obtained from the analysis of thin sections was the basis for assessing the influence of petrographic characteristics of the laminae on their mechanical properties. In the case of the sandstone laminae tested, a strong positive correlation was found between the equivalent quartz content and CERCHAR abrasivity (R = 0.93) as well as fairly strong (R = 0.84) between the equivalent quartz content and Knoop microhardness (Figure 14). Similar results were previously reported by other authors [45,49,50,51] also for sedimentary rocks. The obtained equivalent quartz content ranges from 62.4% to 95.6%. Lamina varieties with a high content of silica binder are characterised by quartz equivalent values above 90%, while for porous laminae with complex petrographic composition, the values of this parameter are below 80%.
5. Discussion
Studies conducted on sandstone samples containing laminae of various varieties have shown that the general trend of decreasing the ultrasonic wave velocity with increasing water absorption (Figure 9) in porous sandstones is explained by suppressing wave pulses in the pore spaces and extending the route of the waves along the framework with weakly developed intergrain contacts. The commonly known other property of the velocity of the longitudinal ultrasonic waves that increases in the water-saturated samples in relation to the dry ones [52] has also been supported by the results obtained in the laminated sandstones of this study (Table 1). The increase of the velocities in the saturated samples from the Baranów and Słupiec Formations is low (0.16 and 0.10 km/s, respectively), being the highest (0.60 km/s) in the sandstone samples from the Zagnańsk Formation, where it is additionally affected by water absorbability (the higher the absorbability, the higher the velocity increase). The lowest increase of the ultrasonic wave velocities in the sandstone samples from Bieganów which, simultaneously, are the most water-absorbable may be linked to their ferruginous-argillaceous binding matrix. Such a matrix on saturation with water becomes liquefied and weakens the intergranular contacts [53]. An increase of wave velocities in the case of sandstones from Tumlin may result from their rather significant content of the lamina variety T2, whose porous space after water saturation represents a more favourable medium for the propagation of ultrasonic pulses. The importance of porosity for the mechanical properties of sandstones was also stated by Ludovico-Marques et al. [54]. For example, these authors demonstrated a strong relationship between porosity and compressive strength, allowing the estimation of the latter parameter based on non-destructive testing.
The content of laminae of individual varieties is an important factor affecting the properties of the sandstones [55]. First of all, it has been expressed using the example of aeolian sandstones from Tumlin, in which the presence of the porous T2 and the compact T1 lamina varieties and, additionally, water absorbability plays an important role (Table 3). It can be assumed that the microhardness and the velocity of the longitudinal ultrasonic waves established in whole rock samples depend to a large extent on these parameters measured in the distinguished lamina varieties. However, it should be emphasised that sufficiently high correlation coefficients between these parameters have not been obtained for most of the lamina varieties. A certain shortcoming in determining such relations may be attributed, among other reasons, to difficulties in precise measurements within thin laminae. Moreover, although most of the laminae turn gradually into another varieties (it is visible particularly in microscopic images, as shown in Figure 2), the borders of some of them, for instance of the laminae T1 or K4, are distinctly sharp and become zones of lower resistance. As a consequence, such rocks split along these surfaces, which is a property used for sandstone quarrying and tooling. Despite their low thickness, if such laminae are abundant in the profile, they lower the velocity of the ultrasonic waves measured perpendicular to their direction.
The results show that the physical and mechanical properties of the Triassic sandstones from the Zagnańsk and Baranów Formations are close to each other and better than those of the Permian sandstones from the Słupiec Formation (Table 1). Detailed investigations of the distinguished lamina varieties indicate that they sometimes reveal significant differences (Table 2). On the other hand, there are lamina varieties similar to each other in terms of both their physical and mechanical parameters as well as internal structure, but belonging to the sandstones of different origin. Considering these conclusions, the following main types of laminae have been distinguished.
To the type I belong the compact lamina varieties T1, K1, and K4. They are composed mainly of subrounded quartz grains of comparable sizes, mostly within the range 0.125–0.50 mm, being totally devoid of the finest grain fractions, i.e., below 0.063 mm, or containing very low amounts (Figure 3, Figure 4, Figure 5 and Figure 6). The finest grains in the primary sediment, if they had been present at all, must have been dissolved during the sediment diagenesis and provided silica for the regeneration rims so abundant in the type I laminae. For this reason, the prevailing grain contacts are long, concave–convex, or suture. The abundant cement (23–32%) is formed generally of silica, sometimes with an addition of iron compounds, probably of hematite. The compact and rigid silica-rich framework with an insignificant content of hollow spaces (below 5%) is a reason for the highest Knoop microhardness ranging between 220 and 407 MPa (approximately 310 MPa on average) in that lamina type (Table 2). Their internal rock structure facilitates a fast propagation of ultrasonic pulses; therefore, the velocities of the longitudinal waves are 3.692–4.252 km/s (the velocity could not be evaluated in the K4 lamina). The presence of hard quartz grains and the siliceous cement also determine the high and very high resistance to abrasion (scratching of these laminae), as their mean CAI index ranges between 3.1 and 4.6. The theoretical UCS values for type I laminae are within the range of 106–207 MPa (Table 4).
Laminae of the type I have petrographic features (fine clast diameters, presence of quartz regeneration rims and siliceous cement) such as quartz arenite from the Wiśniówka quarry in the Holly Cross Mts. [47]. Additionally, there is also a great similarity between them in terms of ultrasonic wave velocity and porosity. The sandstones from that location, in the test conducted at the load increase rate of 0.5–1.0 MPa/s, obtained the uniaxial compressive strength in the range of 62.0–309.0 MPa (Table 4). According to the ISRM classification [56], it is in the range for the grade R5 and R6, which means very strong and extremely strong rock, respectively. These values evidently correspond to the UCS values calculated from the CAI relationship and to the Knoop microhardness results determined in laminae of the type I (Table 2 and Table 4). For the above-mentioned sandstones from the Wiśniówka quarry, the post-critical behaviour belonging to the class II according to the Wawersik and Fairhurst classification [57] is typical. The amount of strain energy accumulated in these rocks is so large that it is sufficient for thespontaneous disintegration of the sample after reaching the critical load value. The curve illustrating the relationship between an axial strain and stress, obtained during uniaxial compression of samples, is characterised by a large angle of inclination for both the pre-critical and the post-critical deformation phase. One characteristic of this sandstone is that the pre-critical state is the value of the static elastic modulus E (Young’s modulus) in the range of 11.6–29.1 GPa. The shear modulus G is in the range 5.7–14.3 GPa, while the Poisson’s ratio ν ranges from 0.02 to 0.13. The volumetric strain (ε) of failure is 0.45%, and in the post-failure condition is only 1.20%. In the post-critical state, from 1 to 3, major fracturing phases are recorded (macrocrackings) without the presence of additional microcracks. The absence or small values of post-critical deformation indicate a rapid, brittle failure occurring in one phase. According to Pinińska [58], this type of deformation is typical for high-strength clastic rocks and corresponds to the MI model.
To the type II belong dark red and brownish laminae of T3, T4, and K3 varieties, in which major semi-angular and angular quartz grains are bound with a rather widespread, mostly ferruginous, but in places siliceous and argillaceous cement (17–21%) (Figure 3 and Figure 5). In this type of laminae, the suture contacts among grains are more frequent than in type I and are often lined with iron compounds. On the other hand, some spaces among the framework grains are devoid of any binding mass; thus, these laminae are more porous (6–10%) than the laminae of type I. Much finer granulation is another characteristic feature of the type II laminae (Figure 4 and Figure 6). The finest grains (below 0.063 mm) represent sometimes the dominant fraction, whereas the grains exceeding 0.5 mm are rare and constitute less than 10%. In the laminae of such a structure, the Knoop microhardness values highly depend on the position of the indentation point, be it within a quartz grain or a cement and highly varying from 68 to 356 MPa, reaching average values for individual lamina varieties of approximately 200–270 MPa (Table 2). The velocities of the ultrasonic waves in the laminae T3 and T4 cover the range 3.640–3.983 km/s, being higher (3.954–4.304 km/s) only in the least porous (around 6%) laminae K3. In the latter, many close, sutured contacts among quartz grains increase not only the wave velocity but also the capability of the rock resistance to scratching implements (the CAI is 4.4 on the average). If the framework grains are more rounded, the rocks have lower CAI indices that vary in the range 2.8–3.0. Such a level of abrasiveness gives UCS estimated values in the range of 93–196 MPa (Table 4).
Laminae of type II are very similar in terms of grain size, binder type, and framework grains to the sublithic arenites studied by Pinińska [48] from the Szczytna quarry in the Sudetes. Physical properties such as ultrasonic wave velocity and porosity of these sandstones are also similar to those obtained for the type II laminae. The uniaxial compressive strength values (determined at the rate of load increase in the range of 0.5–1.0 MPa/s) of the sandstone from Szczytna are in the range of 105.2–135.6 MPa, which corresponds to the range of UCS values estimated from the CAI results (Table 4) and qualifies it according to the ISRM classification [56] to the R5 grade (very strong rock). In the pre-critical state, sandstone is characterised by the value of the static elastic modulus E in the range of 11.9–26.2 GPa; the shear modulus G is 4.6–10.3 GPa, while the Poisson’s ratio ν (static tests) ranges from 0.21 to 0.43. The volumetric strain (ε) of failure is –0.56%, and in the post-failure state, it is 9.51%. The residual strength is in the range of 3.4–5.6 MPa with an average of 4.6 MPa. The process of rock destruction caused by the uniaxial stress is characterised by the presence of five to seven cyclic main fracturing phases with eight to 30 single microcracking phases visible in the post-failure part of the stress–strain curve. The discussed sandstone, due to the manner of post-critical behavior, represents the MII model of deformation, which is typical for rocks of medium strength and was classified by Pinińska [48] as the class II according to the Wawersik and Fairhurst classification [57].
To type III belong the laminae of T2 and K2 varieties. Their mineral composition and grain size distribution are close to those of type I (i.e., to the laminae T1 and K1) (Figure 3, Figure 4, Figure 5 and Figure 6). However, their porosity is much higher and reaches 19–26%, which is a result of the scarce binding mass composed mainly of the ferruginous–argillaceous mixture. The quartz regeneration rims are occasional and thin, making mostly the grain contacts of the point type and only sometimes long ones. The presence of many hollows and a weakly binding ferruginous–argillaceous mass attenuates the ultrasonic pulses and lowers the wave velocities to 2.996–3.836 km/s (Table 2). This structure also affects hardness measurements: when the Knoop indenter is pushed into the weak binding mass or into the margins of quartz grains that contact with pores, it results in fracturing and displacing mineral fragments into free spaces and lowers measurement values in such points even below 30 MPa. The average value of microhardness in laminae of this type is approximately 150 MPa. The weaker intergranular bonds also facilitate removal of the framework grains by the stylus moving along the surface of such laminae; therefore, their abrasivity index is lower (the average CAI ranges between 2.2 and 3.0) than in the I and II types. As a result, the UCS for laminae of this type can reach values in the range 68–130 MPa (Table 4).
Laminae of the type III have petrographic features, as well as ultrasonic wave velocity and porosity similar to those found in the sublithic arenites from the Parszów quarry in the Holly Cross Mts. [47]. The uniaxial compressive strength of this sandstone is within the range of 58.0–122.0 MPa (Table 4), which corresponds to the grades R4 and R5 according to the ISRM classification [56], i.e., strong and very strong rock, and partially coincides with the theoretical UCS values depending on CAI and with the range of Knoop microhardness values determined in laminae of type III. The stress–strain curve obtained during the uniaxial compression of samples of this sandstone is characterised by a large inclination angle for the pre-critical state. The values of the static elastic modulus E are in the range of 7.1–11.5 GPa, the shear modulus G values are in the range of 3.0–4.8 GPa, and the Poisson’s ratio ν values are in the range of 0.13–0.31. The volumetric strain (ε) of failure is 0.14%, and in the post-critical state, it is 5.0%, whereas the residual strength is in the range 5.0–6.5 MPa with an average of 5.8 MPa. In the post-failure branch of the deformation curve, two to nine main, regular fracture phases are marked, and six to 17 microcrack phases are present within them. According to Pinińska [58], this type of deformation is characteristic of rocks of medium strength, representing the MII model and belonging to the class II due to the Wawersik and Fairhurst classification [57].
Type IV laminae is represented by the varieties from the Bieganów quarry. The sandstones and, obviously, also the laminae of the Słupiec Formation, differ in their mineral composition from those two other formations described above. Its grains of monocrystalline quartz are accompanied by substantial amounts of granitoid fragments, feldspars weathered to a various degree, and micas (Figure 7). The shapes of the framework components are irregular, and some grains are angular, which is a sign of a lower maturity of the parent sediment in comparison with the maturity of the alluvial sandstones of the Baranów Formation. The binding mass is of the ferruginous–siliceous–argillaceous character, while regeneration rims are few and not always fully developed. As a result, the microhardness and the velocity of ultrasonic waves are lower in the lamina varieties B1, B2, and B3 of the Słupiec sandstones than in those previously described (Table 2). The differences in the size, shape, and hardness of the framework grains in these laminae as well as their binding mass weakening the joints of the framework components are the factors lowering the CAI values to below 2.0 (Table 2), which may be associated with low uniaxial compressive strength (UCS) values in the likely range of 51–84 MPa (Table 4).
However, the laminae of the variety B1 slightly resemble the laminae of type I, as they are also compact, which results from low porosity (about 5%), a high amount of detrital grains bound with a rather sparse cement but of the siliceous nature, and the presence of thick regeneration rims. Due to these features, among the laminae of the Bieganów sandstones, those classified as the B1 variety reveal the highest hardness (average approximately 216 MPa) and the highest ultrasonic wave velocity of 2.682 km/s (on average) (Table 2). Based on petrographic characteristics and physical properties, the variety B1 laminae can be compared to quartz arenite from the Wiśniówka quarry, which is classified as very strong (R5 grade) and extremely strong rock (R6 grade). That rock is classified as class II according to Wawersik and Fairhurst classification [57] and corresponds to the MI model according to Pinińska [58], in which the complete brittle destruction of high-strength rock takes place during one phase of deformation.
In turn, the laminae of the variety B3 are fine-grained (as also are the laminae of the type II), and their abundant cement consists mainly of iron compounds that impart their dark red colour. Such cement lowers the microhardness of these laminae to an average value of 152.4 MPa, although the velocity of the ultrasound waves is comparable to that in the B1 lamina variety (Table 2). The laminae of the variety B2 are characterised by coarser grains that may reach even 2 mm (Figure 8) and, simultaneously, are rather highly porous (about 13%) (Figure 7). Additionally in this case, the structural features are conducive to diversifying their microhardness (22–313 MPa) and lowering ultrasonic wave velocities to an average of 2.582 km/s (Table 2). Concluding, the high porosity, coarser granulation, and weaker mechanical properties make them comparable to the type III laminae. Laminae of the varieties B2 and B3 reveal a number of petrographic characteristics typical for the sublithic arenites from the Parszów and Szczytna quarries [47,48]. Due to the uniaxial compressive strength, they are classified according to ISRM [56] as strong and very strong rocks (classes R4 and R5) and class II according to Wawersik and Fairhurst [57], and they also represent the MII deformation model corresponding to rocks of medium strength.
6. Conclusions
The conducted research has shown that in laminated terrestrial sandstones, it is possible to quite precisely determine the physical and mechanical properties of four types of laminae occurring within them. In order to achieve this goal, it is crucial to apply a methodology designed to small areas testing, such as the CERCHAR abrasion (CAI index) and the Knoop microhardness test. Relevant data was also obtained from measurements of the longitudinal ultrasonic wave velocity. The results of studies indicate a distinct mutual correlation between these parameters.
The diversity in the values of the examined features was explained by petrographic research. The equivalent quartz content for individual types of laminae showed a strong relationship with the CAI and HK values. It was found that the type and amount of binder consisting of silica, clay minerals, and iron compounds as well as porosity have an essential impact on the mechanical properties of particular lamina types. The composition of the grain skeleton is of less importance in this respect. The reason for this is a comparable proportion of quartz grains in most laminae, which only in some varieties are accompanied by lithoclasts of granitoids with relatively high Rosival hardness values.
From among the four distinguished types of laminae, type I is characterised by the highest mechanical resistance, which is expressed by high CAI and HK values. These laminae correspond to quartz arenites with a high estimated compressive strength and low deformability in the pre- and post-critical state. Despite their various coloration (light grey, red, and dark brown), they have one common feature, i.e., the domination of fine quartz grains of medium roundness, bound with an abundant siliceous cement of the regeneration nature, while hematite fills the rest of intergranular space.
The laminae belonging to type IV, whose framework is composed not only of quartz, but also of feldspars, micas and lithoclasts, embedded in the ferruginous-siliceous-argillaceous binding mass have the lowest strength. Their mechanical parameters are at least twice as low as those specified in type I laminae. At the same time, they are characterised by significantly greater deformability in the post-critical state.
The values of the mechanical properties of type II and III laminae are a consequence of the mutual relations between the nature of their framework consisting almost entirely of fine-grained quartz, the presence of ferruginous–siliceous–argillaceous binding mass, and pore space of various volumes. Thus, they are intermediate between those of type I and type IV.
A noteworthy effect of these studies is the estimation of the uniaxial compressive strength of the tested sandstone laminae on the basis of the equations presented in the literature, desribing the relationship between this parameter and CAI value (the method used due to the inability to prepare 5 cm cubic samples cut from thin laminae). These UCS values, theoretically resulted for individual types of laminae, are consistent with the values determined for sandstones with an analogous mineral composition and similar physical properties. Thanks to the relationship described above, it is possible to estimate the UCS value on the basis of the known CAI value, which may be useful in the case of some design works related to the selection of laminated sandstone with appropriate strength properties of individual laminae.
The presented research methods can be successfully used to predict the strength characteristics of individual parts of the designed stone elements that differ in their internal structure (mineral composition, type of binding mass, amount of pore space). This is especially important when preparing technical projects involving the use of terrestrial sandstones in building constructions subjected to the forces of friction, bending, or tension. In such cases, the contribution and spatial distribution of the distinguished types of laminae, particularly those of the type IV, should be carefully assessed. In some situations, the properties of the least durable lamina layer will control the mechanical resistance of the entire stone element.
Proper choice of stone material adapted to the character of destructive factors improves the safety and aesthetics of its use, reduces the frequency of renovations, and especially the need to replace elements. As a result, it allows for better management of the deposits of these exceptionally decorative sandstones.
Author Contributions
Both authors contributed equally to the investigations and writing of this editorial. Both authors have read and agreed to the published version of the manuscript.
Funding
This research was funded by the AGH University of Science and Technology, Faculty of Geology, Geophysics and Environmental Protection, subsidy number 16.16.140.315. and by funds for statutory research of MEERI PAS in 2020.
Institutional Review Board Statement
Not applicable.
Informed Consent Statement
Not applicable.
Data Availability Statement
The data presented in this study are available on request from the corresponding author. The data are not publicly available due to planned use in future research.
Acknowledgments
The authors would like to thank the anonymous Reviewers for their efforts towards improving the manuscript.
Conflicts of Interest
The authors declare no conflict of interest.
References
- Lovell, M.A.; Jackson, P.D.; Harvey, P.K.; Flint, R.C. High-resolution petrophysical characterization of samples from an aeolian sandstone: The Permian Penrith sandstone of NW England. Geol. Soc. Spec. Publ. Lond. 2006, 263, 49–63. [Google Scholar] [CrossRef]
- Garagon, M.; Çan, T. Predicting the strength anisotropy in uniaxial compression of some laminated sandstones using multivariate regression analysis. Mater. Struct. 2010, 43, 509–517. [Google Scholar] [CrossRef]
- Yang, S.Q.; Jing, H.W.; Wang, S.Y. Experimental investigation on the strength, deformability, failure behavior and acoustic emission locations of red sandstone under triaxial compression. Rock Mech. Rock Eng. 2012, 45, 583–606. [Google Scholar] [CrossRef]
- Rembiś, M. Modyfikacja Fizyczno-Mechanicznych Właściwości Piaskowców Metodą Strukturalnego Wzmacniania Skał Preparatami Zawierającymi Tetraetoksysilan [Physical and Mechanical Modification of Sandstone Properties Applying the Methods of Structural Rock Strengthening with the Chemicals Containing Tetraethoxysilane]; Wydawnictwa AGH: Kraków, Poland, 2013; Volume 270, pp. 1–181. [Google Scholar]
- Tavallali, A.; Vervoort, A. Behaviour of layered sandstone under Brazilian test conditions: Layer orientation and shape effects. J. Rock Mech. Geotech. Eng. 2013, 5, 366–377. [Google Scholar] [CrossRef] [Green Version]
- Khanlari, G.; Rafiei, B.; Abdilor, Y. An experimental investigation of the Brazilian tensile strength and failure patterns of laminated sandstones. Rock Mech. Rock Eng. 2014, 48, 843–852. [Google Scholar] [CrossRef]
- Figarska-Warchoł, B.; Stańczak, G. Ocena mikrostruktur kierunkowych i ich znaczenie dla właściwości technicznych piaskowców [Directional microstructures and technical properties of sandstones]. Górn. Odkrywk. 2016, 57, 26–38. [Google Scholar]
- Gautam, P.K.; Verma, A.K.; Maheshwar, S.; Singh, T.N. Thermomechanical analysis of different types of sandstone at elevated temperature. Rock Mech. Rock Eng. 2016, 49, 1985–1993. [Google Scholar] [CrossRef]
- Rembiś, M.; Smoleńska, A. Stan zachowania wybranych piaskowców budowlanych Polski poddanych działaniu siarczanu sodu oraz dwutlenku siarki w obecności wilgoci [Preservation of the selected building sandstones of southern Poland exposed to salt and the sulphur dioxide in the presence of moisture]. Geologia 2010, 36, 539–553. [Google Scholar]
- Rembiś, M. Ocena jakości wybranych wapieni jurajskich stosowanych w budownictwie na podstawie pomiaru ich energii pękania przy uderzeniu i mikrotwardości metodą Knoopa [The quality of selected Jurassic limestones utilized for building purposes as determined from their energy of rupture by impact and the Knoop microhardness]. Przegl. Geol. 2017, 65, 1461–1470. [Google Scholar]
- Liakas, S.; O’sullivan, C.; Saroglou, C. Influence of heterogeneity on rock strength and stiffness using discrete element method and parallel bond model. J. Rock Mech. Geotech. Eng. 2017, 9, 575–584. [Google Scholar] [CrossRef]
- Cardu, M.; Giraudi, A.; Rocca, V.; Verga, F. Experimental laboratory tests focused on rock characterisation for mechanical excavation. Int. J. Min. Reclam. Env. 2012, 26, 199–216. [Google Scholar] [CrossRef]
- Kuleta, M.; Nawrocki, J. Litostratygrafia i magnetostratygrafia pstrego piaskowca w północnym obrzeżeniu Gór Świętokrzyskich. Posiedz. Nauk. PIG 2002, 58, 109–111. [Google Scholar]
- Kuleta, M.; Ptaszyński, T.; Niedźwiedzki, G.; Nawrocki, J.; Becker, A. Stops IV.2. and IV.3. Tumlin-Gród Quarry and Sosnowica Quarry. In Pan-European Correlation of the Epicontinental Triassic 4th Meeting, International Workshop on the Triassic of Southern Poland, September 3–8, 2007, Fieldtrip Guide; Szulc, J., Becker, A., Eds.; Polish Geological Institute: Warsaw, Poland, 2007; pp. 67–69. [Google Scholar]
- Urban, J.; Gągol, J. Geological heritage of the Świętokrzyskie (Holly Cross) Mountains (Central Poland). Przeglad Geol. 2008, 56, 618–628. [Google Scholar]
- Gradziński, R.; Gągol, J.; Ślączka, A. The Tumlin Sandstone (Holy Cross Mts, Central Poland): Lower Triassic deposits of aeolian dunes and interdune areas. Acta Geol. Polon. 1979, 29, 151–175. [Google Scholar]
- Gradziński, R.; Uchman, A. Trace fossils from interdune deposits—An example from the Lower Triassic aeolian Tumlin Sandstone, central Poland. Palaeogeogr. Palaeoclimatol. Palaeoecol. 1994, 108, 121–138. [Google Scholar] [CrossRef]
- Szyperko-Teller, A. Trias dolny (pstry piaskowiec). Formalne i nieformalne jednostki litostratygraficzne. In Epikontynentalny perm i mezozoik w Polsce; Marek, S., Pajchlowa, M., Eds.; Prace PIG: Warszawa, Poland, 1997; Volume 153, pp. 112–117. [Google Scholar]
- Kuleta, M.; Zbroja, S. Wczesny etap rozwoju pokrywy permsko-mezozoicznej w Górach Świętokrzyskich. In Proceedings of the Zdarzenia w Historii Geologicznej Gór Świętokrzyskich, 77 Zjazd Naukowy Polskiego Towarzystwa Geologicznego, Ameliówka k, Kielc, Poland, 28–30 June 2006; pp. 105–125. [Google Scholar]
- Kuleta, M. Osady pstrego piaskowca w kamieniołomie Zachełmie. Posiedz. Nauk. PIG 2000, 56, 128–130. [Google Scholar]
- Kuleta, M.; Niedźwiedzki, G.; Ptaszyński, T. Stop IV.5. Kopulak—Sandstone quarry. In Pan-European Correlation of the Epicontinental Triassic 4th Meeting, International Workshop on the Triassic of Southern Poland, September 3–8, 2007, Fieldtrip Guide; Szulc, J., Becker, A., Eds.; Polish Geological Institute: Warsaw, Poland, 2007; pp. 71–73. [Google Scholar]
- Senkowiczowa, H.; Ślączka, A. O wieku piaskowców z Wąchocka. Kwart. Geol. 1962, 6, 35–49. [Google Scholar]
- Senkowiczowa, H. Trias (bez utworów retyku). [Triassic (without Rhaetian deposits)]. In Stratygrafia Mezozoiku Obrzeżenia Gór Świętokrzyskich. Mesozoic Stratigraphy of the Holy Cross Mts. Area; Prace PIG: Warszawa, Poland, 1970; Volume 56, pp. 7–48. [Google Scholar]
- Don, J. Utwory Młodopaleozoiczne Okolic Nowej Rudy [The Permian-Carboniferous of the Nowa Ruda Region]; Zeszyty Naukowe Uniwersytetu Wrocławskiego; Seria B, Nr 6. Nauki Przyrodnicze, Nauka o Ziemi III; Państwowe Wydawnictwo Naukowe: Wrocław, Poland, 1961; pp. 3–54. [Google Scholar]
- Dziedzic, K. Utwory dolnopermskie w niecce śródsudeckiej [Lower Permian sediments in the Intra-Sudetic Basin]. Studia Geol. Polon. 1961, 6, 5–121. [Google Scholar]
- Augustyniak, K.; Grocholski, A. Geological structure and outline of the development of the Intra-Sudetic Depression. Biul. IG 1968, 227, 87–120. [Google Scholar]
- Nemec, W. Tectonically Controlled Alluvial Sedimentation in the Słupiec Formation (Lower Permian) of the Intrasudetic Basin (Poland). In Proceedings of the International Symposium Central European Permian, Jabłonna, Poland, 27–29 April 1978; Geological Institute: Warsaw, Poland, 1981; pp. 294–311. [Google Scholar]
- Mastalerz, K.; Prouza, V.; Kurowski, L.; Bossowski, A.; Ihnatowicz, A.; Nowak, G. Sedimentary record of the Variscian orogeny and climate—Intra-Sudetic Basin, Poland and Czech Republic. Guide to Excursion B1. In Proceedings of the XIII International Congress on Carboniferous–Permian, Kraków, Poland, 28 August–2 September 1995; Państwowy Instytut Geologiczny: Warsaw, Poland, 1995; pp. 5–38. [Google Scholar]
- Pokorski, J. Perm dolny (czerwony spągowiec). Formalne i nieformalne jednostki litostratygraficzne. In Epikontynentalny perm i mezozoik w Polsce; Marek, S., Pajchlowa, M., Eds.; Prace PIG: Warszawa, Poland, 1997; Volume 153, pp. 36–38. [Google Scholar]
- Kurowski, L. Fluvial sedimentation of sandy deposits of the Słupiec Formation (Middle Rotliegendes) near Nowa Ruda (Intra-Sudetic Basin, SW Poland). Geol. Sudet. 2004, 36, 21–38. [Google Scholar]
- Awdankiewicz, M.; Kurowski, L.; Mastalerz, K.; Raczyński, P. The Intra-Sudetic Basin—A Record of Sedimentary and Volcanic Processes in Late–to Post-Orogenic Tectonic Setting. In Proceedings of the 7th Meeting of the Czech Tectonic Studies Group, Żelazno, Poland, 9–12 May 2002; Excursion Guide. Geolines: Albuquerque, NM, USA, 2003; Volume 16, pp. 165–183. [Google Scholar]
- Thuro, K.; Plinninger, R.J. Hard Rock Tunnel Boring, Cutting, Drilling and Blasting: Rock Parameters for Excavatability. In ISRM 2003: 10th Congress of the ISRM: Technology Roadmap for Rock Mechanics: 8–12 September 2003; South African Institute of Mining and Metallurgy: Johannesburg, South Africa, 2003; pp. 1227–1234. [Google Scholar]
- EN 1936. Natural Stone Test Methods—Determination of Real Density and Apparent Density, and of Total and Open Porosity; CEN European Committee for Standarization: Brussels, Belgium, 2006. [Google Scholar]
- EN 13755. Natural Stone Test Methods—Determination of Water Absorption at Atmospheric Pressure; CEN European Committee for Standarization: Brussels, Belgium, 2008. [Google Scholar]
- EN ISO 4516:2002. Metallic and Other Inorganic Coatings. Vickers and Knoop Microhardness Tests; CEN European Committee for Standarization: Brussels, Belgium, 2002. [Google Scholar]
- JIS B 7725, Revision 20J, 2020. Vickers Hardness Test. Verification and Calibration of Testing Machines; Japanese Standards Association (JSA): Tokyo, Japan, 2020.
- EN 14205. Natural Stone Test Methods. Determination of Knoop Hardness; CEN European Committee for Standarization: Brussels, Belgium, 2003. [Google Scholar]
- ASTM D7625-10. Standard Test Method for Laboratory Determination of Abrasiveness of Rock Using the CERCHAR Method (Withdrawn 2019); ASTM International: West Conshohocken, PA, USA, 2010. [Google Scholar]
- West, G. Rock abrasiveness testing for tunnelling. Int. J. Rock Mech. Min. Sci. Geomech. Abstr. 1989, 26, 151–160. [Google Scholar] [CrossRef]
- Alber, M.; Yarali, O.; Dahl, F.; Bruland, A.; Käsling, H.; Michalakopoulos, T.N.; Cardu, M.; Hagan, P.; Aydin, H.; Özarslan, A. ISRM Suggested Method for Determining the Abrasivity of Rock by the CERCHAR Abrasivity Test. In The ISRM Suggested Methods for Rock Characterization, Testing and Monitoring: 2007–2014; Ulusay, R., Ed.; Springer International Publishing: Cham, Switzerland, 2015; pp. 101–106. [Google Scholar] [CrossRef]
- Wentworth, C.K. A scale of grade and class terms for clastic sediments. J. Geol. 1922, 30, 377–392. [Google Scholar] [CrossRef]
- Pettijohn, F.J.; Potter, P.E.; Siever, R. Sand and Sandstone; Springer: New York, NY, USA, 1972; p. 618. [Google Scholar]
- Michalik, M. Diagenetic albite in Rotliegendes sandstones from the Intrasudetic Basin (Poland). Ann. Soc. Geol. Polon. 1998, 68, 85–93. [Google Scholar]
- Majeed, Y.; Abu Bakar, M.Z. Statistical evaluation of CERCHAR Abrasivity Index (CAI) measurement methods and dependence on petrographic and mechanical properties of selected rocks of Pakistan. Bull. Eng. Geol. Environ. 2016, 75, 1341–1360. [Google Scholar] [CrossRef]
- Capik, M.; Yilmaz, A.O. Correlation between Cerchar abrasivity index, rock properties, and drill bit lifetime. Arab. J. Geosci. 2017, 10, 15. [Google Scholar] [CrossRef]
- Teymen, A. The usability of Cerchar abrasivity index for the estimation of mechanical rock properties. Int. J. Rock Mech. Min. Sci. 2020, 128, 104258. [Google Scholar] [CrossRef]
- Pinińska, J. (Ed.) Właściwości Wytrzymałościowe i Odkształceniowe Skał. Cz. I. Skały Osadowe Regionu Świętokrzyskiego. T. 1. Katalog; Zakład Geomechaniki IHiGI, Wydział Geologii, Zakład Geomechaniki, Uniwersytet Warszawski: Warszawa, Poland, 1994. [Google Scholar]
- Pinińska, J. (Ed.) Właściwości Wytrzymałościowe i Odkształceniowe Skał, Część II, Skały Magmowe, Osadowe i Metamorficzne Regionu Sudetów, T.3. Katalog; Zakład Geomechaniki IHiGI, Wydział Geologii, Zakład Geomechaniki, Uniwersytet Warszawski: Warszawa, Poland, 1996. [Google Scholar]
- Suana, M.; Peters, T. The Cerchar Abrasivity Index and its relation to rock mineralogy and petrography. Rock Mech. 1982, 15, 1–7. [Google Scholar] [CrossRef]
- Yaralı, O.; Yaşar, E.; Bacak, G.; Ranjith, P.G. A study of rock abrasivity and tool wear in coal measures rocks. Int. J. Coal Geol. 2008, 74, 53–66. [Google Scholar] [CrossRef]
- Moradizadeh, M.; Cheshomi, A.; Ghafoori, M.; TrighAzali, S. Correlation of equivalent quartz content, Slake durability index and Is50 with Cerchar abrasiveness index for different types of rock. Int. J. Rock Mech. Min. Sci. 2016, 86, 42–47. [Google Scholar] [CrossRef]
- Chawre, B. Correlations between ultrasonic pulse wave velocities and rock properties of quartz-mica schist. J. Rock Mech. Geotech. Eng. 2018, 10, 594–602. [Google Scholar] [CrossRef]
- Azhar, M.U.; Zhou, H.; Yang, F.; Younis, A.; Lu, X.; Fang, H.; Geng, Y. Water-induced softening behavior of clay-rich sandstone in Lanzhou Water Supply Project, China. J. Rock Mech. Geotech. Eng. 2020, 12, 557–570. [Google Scholar] [CrossRef]
- Ludovico-Marques, M.; Chastre, C.; Vasconcelos, G. Modelling the compressive mechanical behaviour of granite and sandstone historical building stones. Constr. Build Mater. 2012, 28, 372–381. [Google Scholar] [CrossRef]
- Khanlari, G.; Rafiei, B.; Abdilor, Y. Evaluation of strength anisotropy and failure modes of laminated sandstones. Arab. J. Geosci. 2014, 8, 3089–3102. [Google Scholar] [CrossRef]
- Barton, N. Coordinator. Suggested Methods for the Quantitative Description of Discontinuities in Rock Masses. In The Complete ISRM Suggested Methods for Rock Characterization, Testing and Monitoring: 1974–2006. Suggested Methods Prepared by the Commission on Testing Methods, International Society for Rock Mechanics; Ulusay, R., Hudson, J.A., Eds.; Turkish National Group: Ankara, Turkey, 2007; pp. 319–368. [Google Scholar]
- Wawersik, W.R.; Fairhurst, C. A study of brittle rock fracture in laboratory compression experiments. Int. J. Rock Mech. Min. Sci. Geomech. Abstr. 1970, 7, 561–564. [Google Scholar] [CrossRef]
- Pinińska, J. (Ed.) Właściwości Wytrzymałościowe i Odkształceniowe Skał. Cz. I. Skały Osadowe Regionu Świętokrzyskiego. T. 2. Objaśnienia i Interpretacja; Zakład Geomechaniki IHiGI, Wydział Geologii, Zakład Geomechaniki, Uniwersytet Warszawski: Warszawa, Poland, 1995. [Google Scholar]
Figure 1.
Examples of damage in laminated sandstones: (A) The floor slab made of the Kopulak sandstone reveals signs of irregular abrasion on the surface, resulting from the presence of laminae with a low mechanical resistance; (B) The cross-section of a wallboard made of the Agra Red sandstone (India) from the façade of a building, from which the wallboards started to fall off. The middle part of the cross-section represents the fracture (black arrow) located near the hole of an anchor bolt that reaches lamina with a low mechanical resistance.

Figure 2.
Photos of the cubic samples of sandstones (upper row) and microphotographs of their thin sections (bottom row).
Figure 2.
Photos of the cubic samples of sandstones (upper row) and microphotographs of their thin sections (bottom row).

Figure 3.
The laminae varieties from the Zagnańsk Formation sandstones: photo micrographs in the plain polarised light (upper row), under the crossed polarizers (bottom row) and their basic components (tables). Abbreviations used: Det—detrital grains, Qz—quartz, Qz(m)—monocrystalline quartz, Qz(p)—polycrystalline quartz, Fsp—feldspar, Ms—muscovite, Hm—heavy minerals, Lth—lithoclasts, Cem—cement, Por—pores, Qeq—equivalent quartz content, Cem.—type of cement (sil—siliceous, fer—ferruginous, cl—argillaceous).

Figure 4.
Grain size distribution in the sandstone laminae varieties from the Zagnańsk Formation (Tumlin Sandstones).
Figure 4.
Grain size distribution in the sandstone laminae varieties from the Zagnańsk Formation (Tumlin Sandstones).

Figure 5.
The laminae varieties from the Baranów Formation sandstones: photo micrographs in the plain polarised light (upper row), under the crossed polarisers (bottom row), and their basic components (tables). Abbreviations used: Det—detrital grains, Qz—quartz, Qz(m)—monocrystalline quartz, Qz(p)—polycrystalline quartz, Fsp—feldspar, Ms—muscovite, Hm—heavy minerals, Lth—lithoclasts, Cem—cement, Por—pores, Qeq—equivalent quartz content, Cem. type—type of cement (sil—siliceous, fer– ferruginous, cl—argillaceous).

Figure 6.
Grain size distribution in the sandstone lamina varieties from the Baranów Formation (Kopulak Sandstones).
Figure 6.
Grain size distribution in the sandstone lamina varieties from the Baranów Formation (Kopulak Sandstones).

Figure 7.
The laminae varieties from the Słupiec Formation sandstones: photo micrographs in the plain polarised light (upper row), under the crossed polarisers (bottom row), and their basic components (tables). Abbreviations used: Det—detrital grains, Qz—quartz, Qz(m)—monocrystalline quartz, Qz(p)—polycrystalline quartz, Fsp—feldspar, Ms—muscovite, Hm—heavy minerals, Lth—lithoclasts, Lth(mag)—magmatic lithoclasts, Cem—cement, Por—pores, Qeq—equivalent quartz content, Cem. type—type of cement (sil—siliceous, fer—ferruginous, cl—argillaceous).

Figure 8.
Grain size distribution in the sandstone laminae varieties from the Słupiec Formation (Bieganów Sandstones).
Figure 8.
Grain size distribution in the sandstone laminae varieties from the Słupiec Formation (Bieganów Sandstones).

Figure 9.
Relation between water absorption and velocity of longitudinal ultrasonic waves in sandstone samples.
Figure 9.
Relation between water absorption and velocity of longitudinal ultrasonic waves in sandstone samples.

Figure 10.
Relation between theoretical (Vt) and real (Vr) velocity of longitudinal ultrasonic waves in samples of sandstone from the Zagnańsk Formation (Tumlin-Gród quarry).
Figure 10.
Relation between theoretical (Vt) and real (Vr) velocity of longitudinal ultrasonic waves in samples of sandstone from the Zagnańsk Formation (Tumlin-Gród quarry).

Figure 11.
Examples of indentations in minerals and cements made in the samples of terrestrial sandstones: (A) The indentation resulted in quartz grain; (B) The indentation formed in quartz grain with ferruginous cementation beside it; (C) The indentation obtained in ferruginous fill of the pore and adjacent quartz grain; (D) Ferruginous and argillaceous cement as well as partially empty pores allowed displacing quartz fragments crushed by the indenter. Explanations: white scale bar—50 μm; red boxes—the ranges of indentations marks.

Figure 12.
The example images of the styli subjected to abrasion within laminae of different varieties. Explanation: d—diameter of the wear flat of the stylus.
Figure 12.
The example images of the styli subjected to abrasion within laminae of different varieties. Explanation: d—diameter of the wear flat of the stylus.

Figure 13.
Relations between physical parameters in distinguished laminae varieties: A—Knoop hardness related to velocity of longitudinal ultrasonic waves, B—Knoop hardness related to CAI abrasivity index, C—CAI abrasivity index related to velocity of longitudinal ultrasonic waves.
Figure 13.
Relations between physical parameters in distinguished laminae varieties: A—Knoop hardness related to velocity of longitudinal ultrasonic waves, B—Knoop hardness related to CAI abrasivity index, C—CAI abrasivity index related to velocity of longitudinal ultrasonic waves.


Figure 14.
Effect of the equivalent quartz content on the CERCHAR abrasivity index and Knoop microhardness.
Figure 14.
Effect of the equivalent quartz content on the CERCHAR abrasivity index and Knoop microhardness.


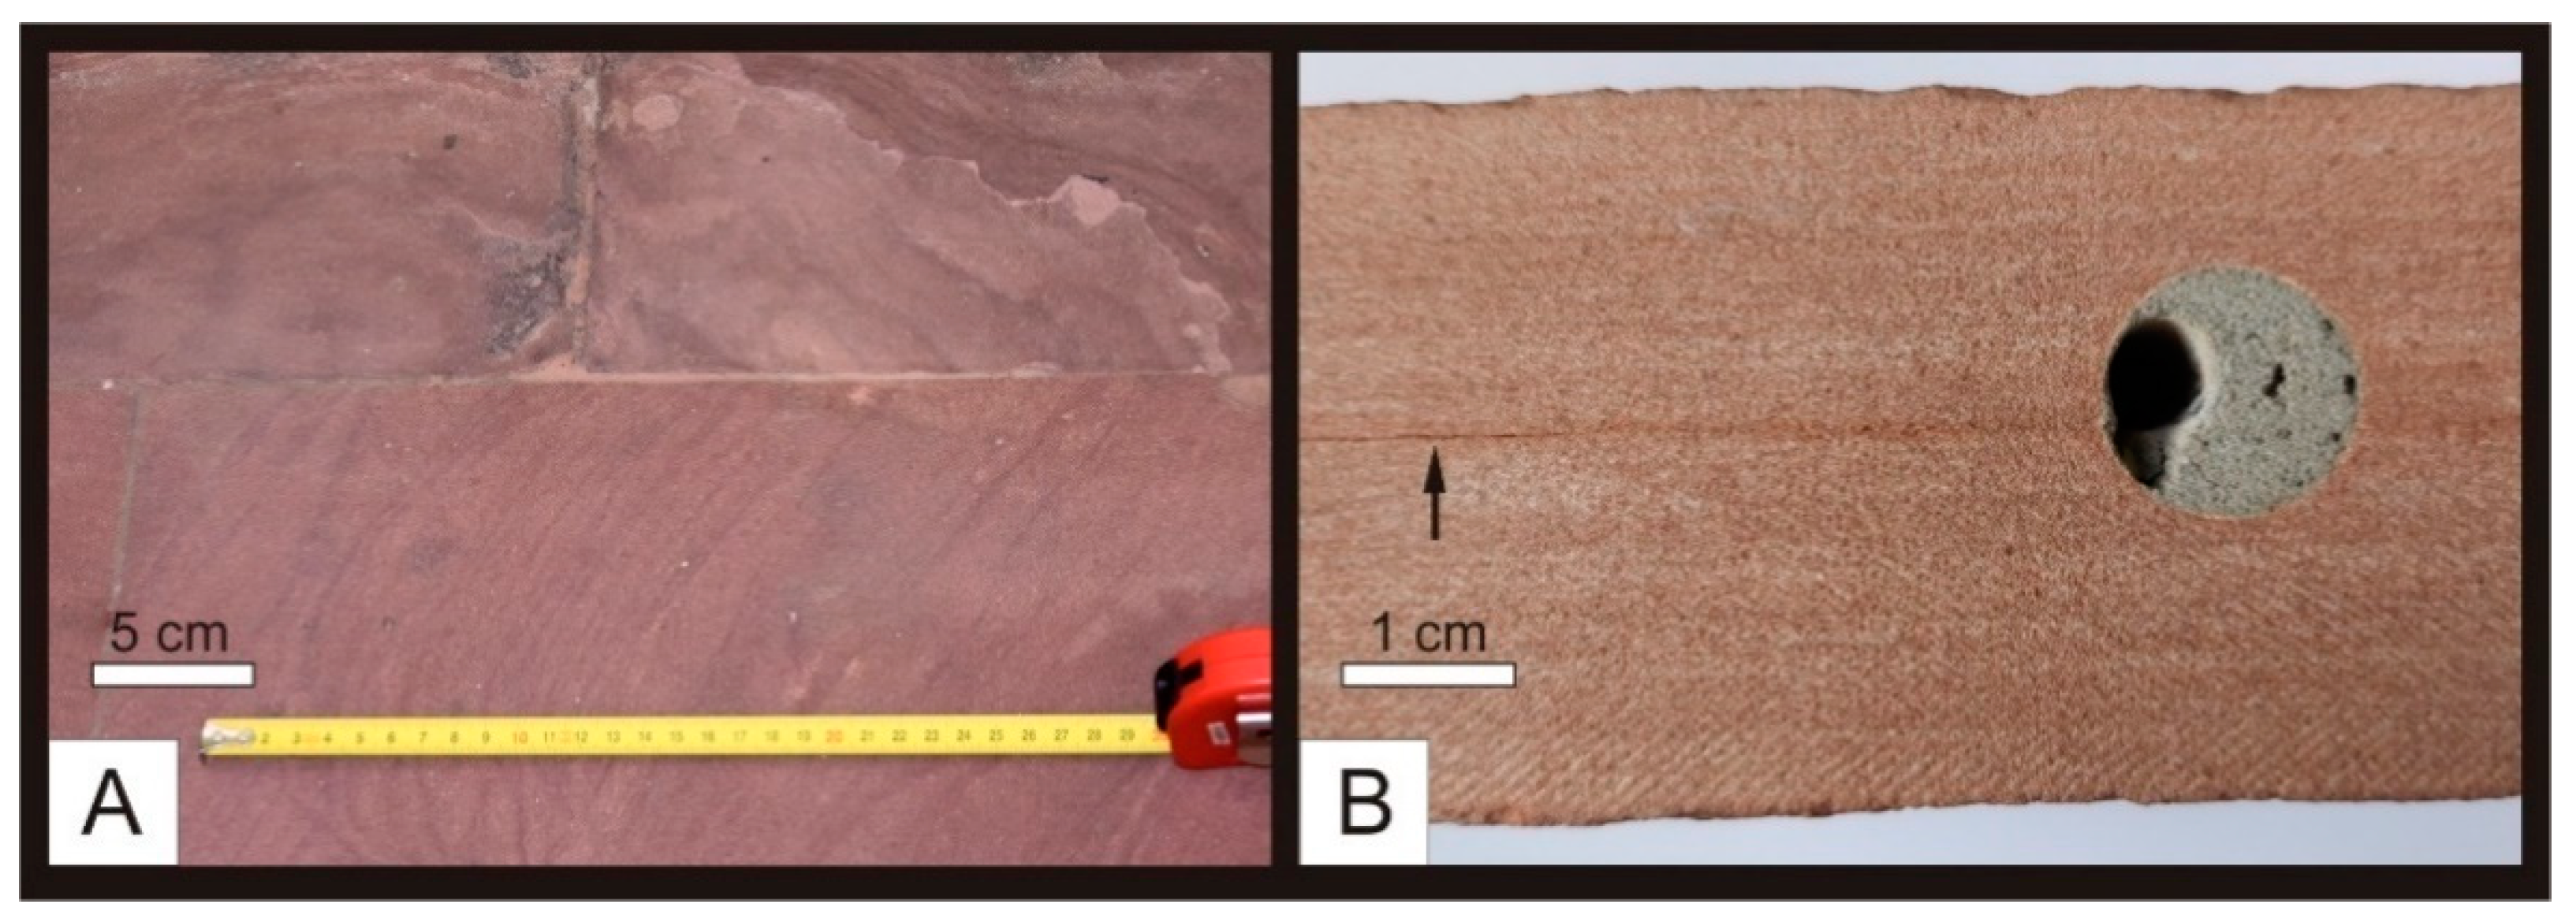
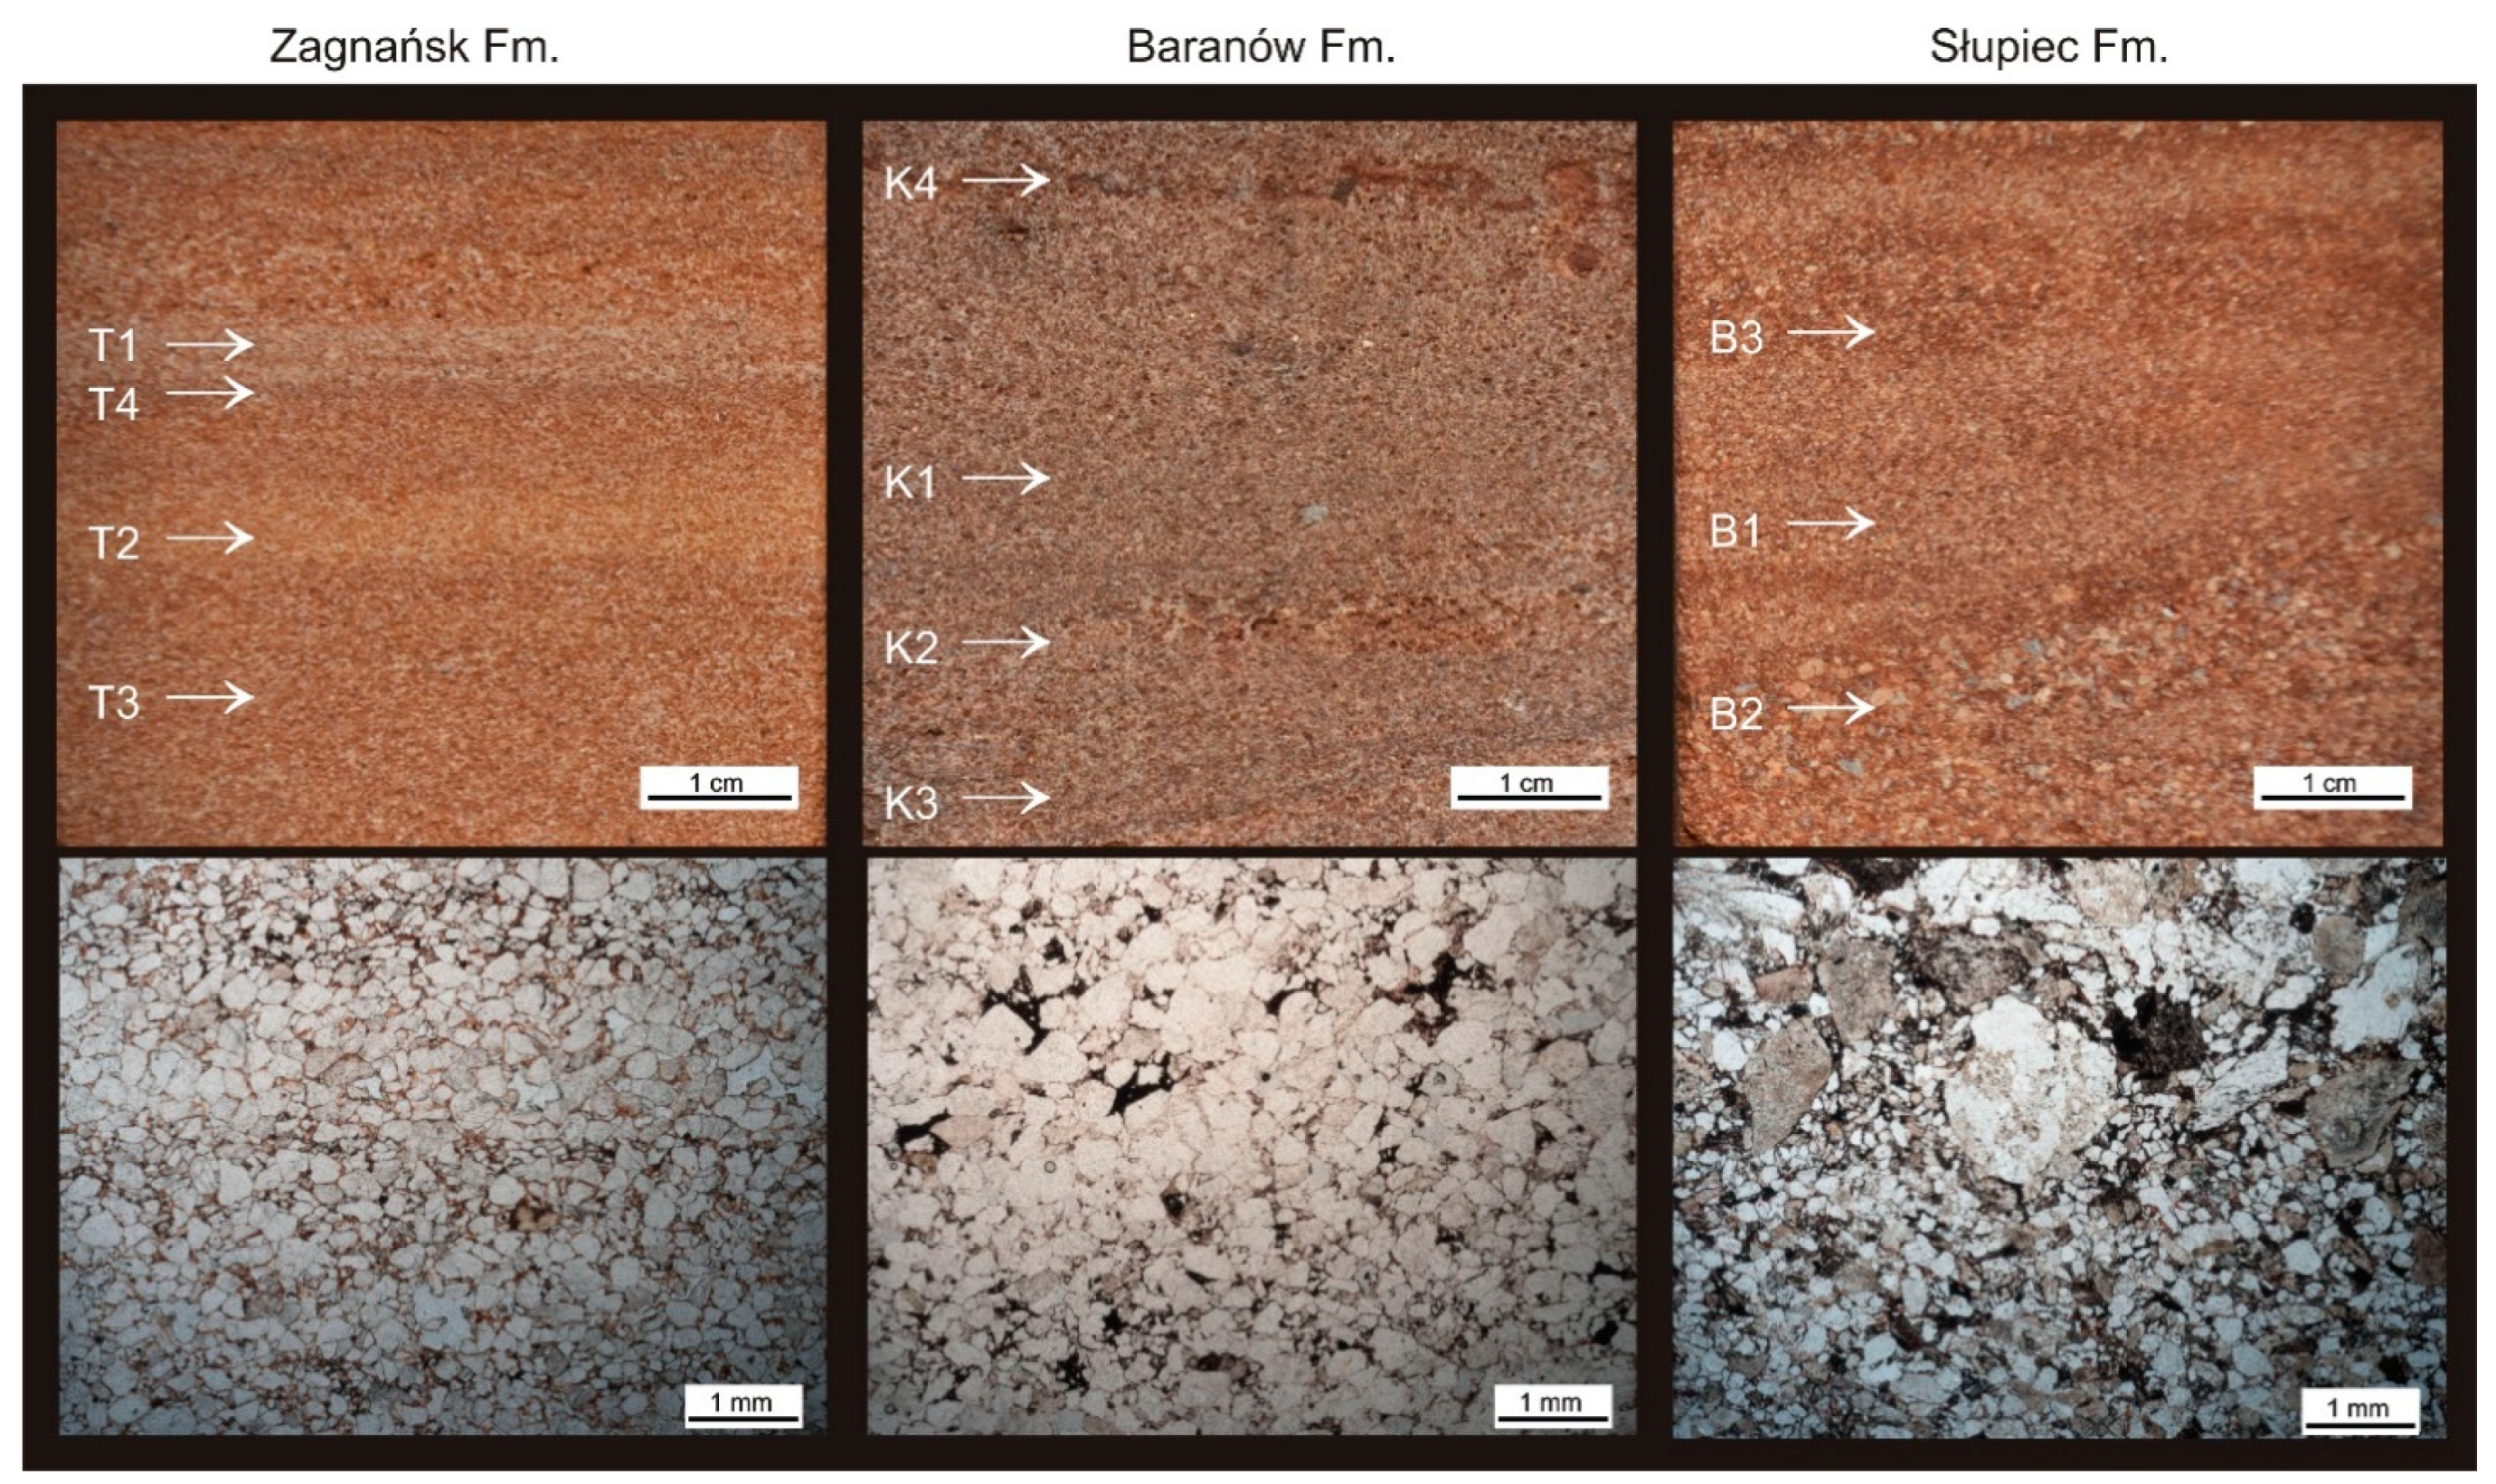
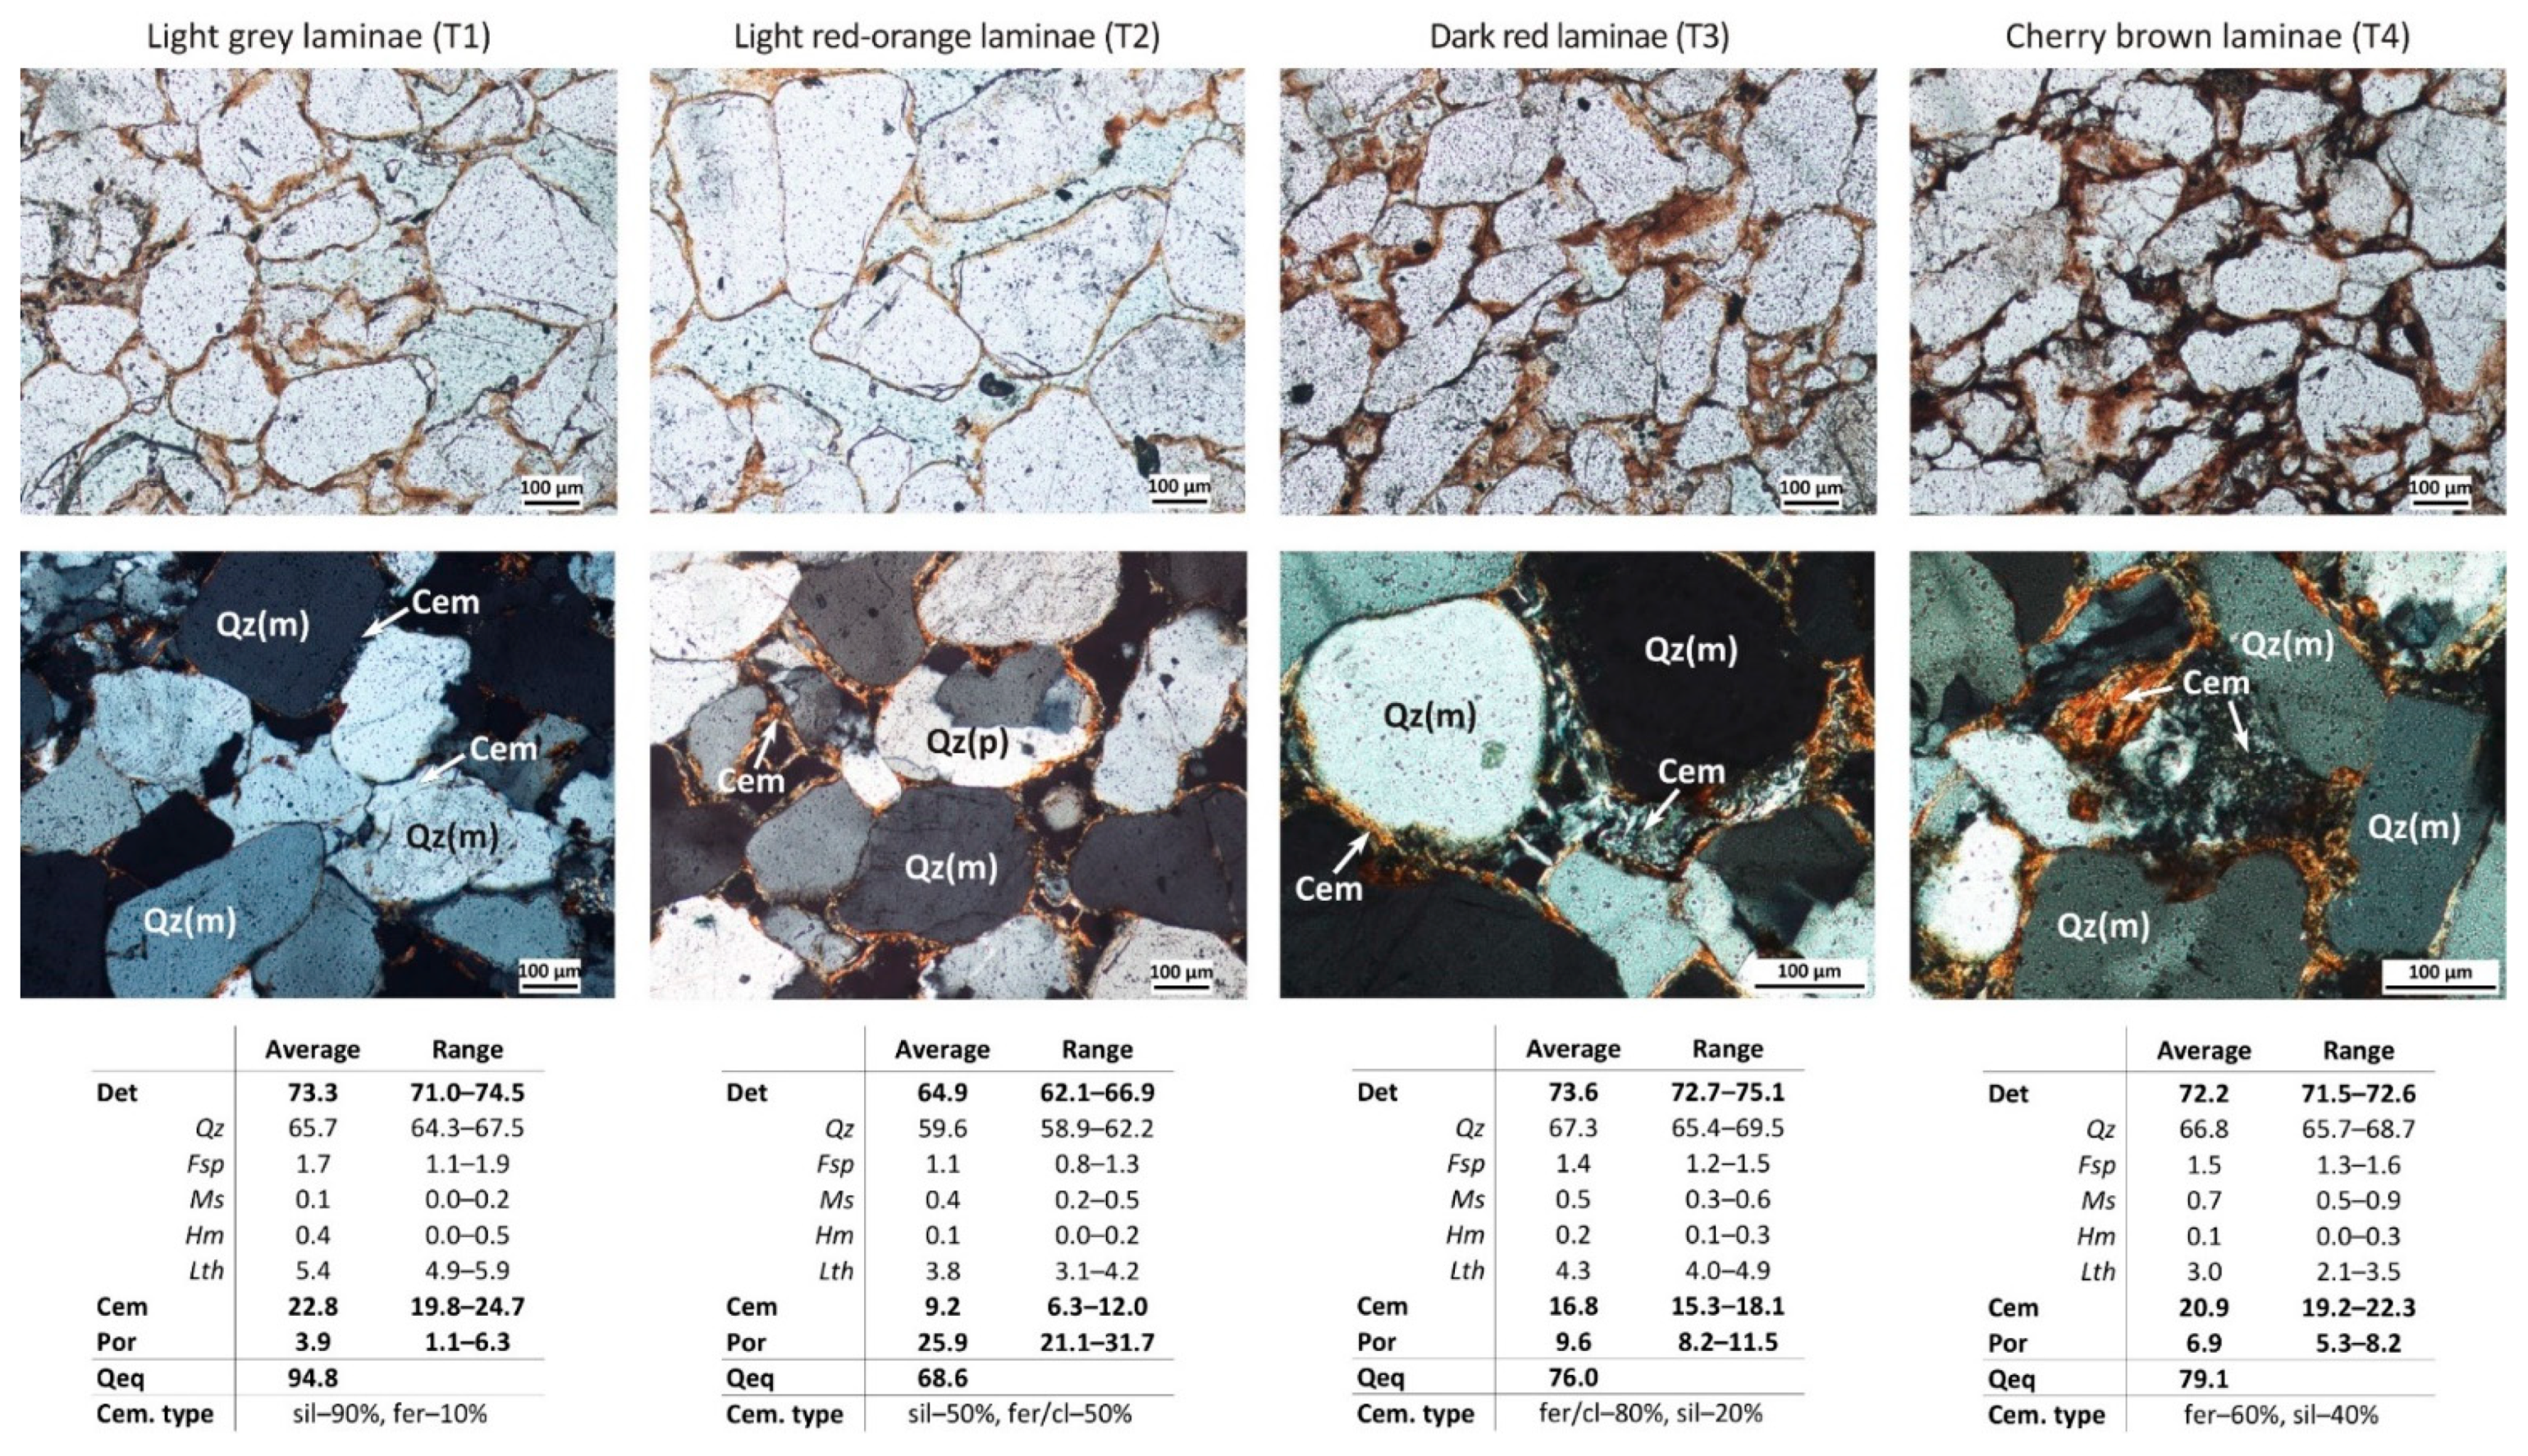
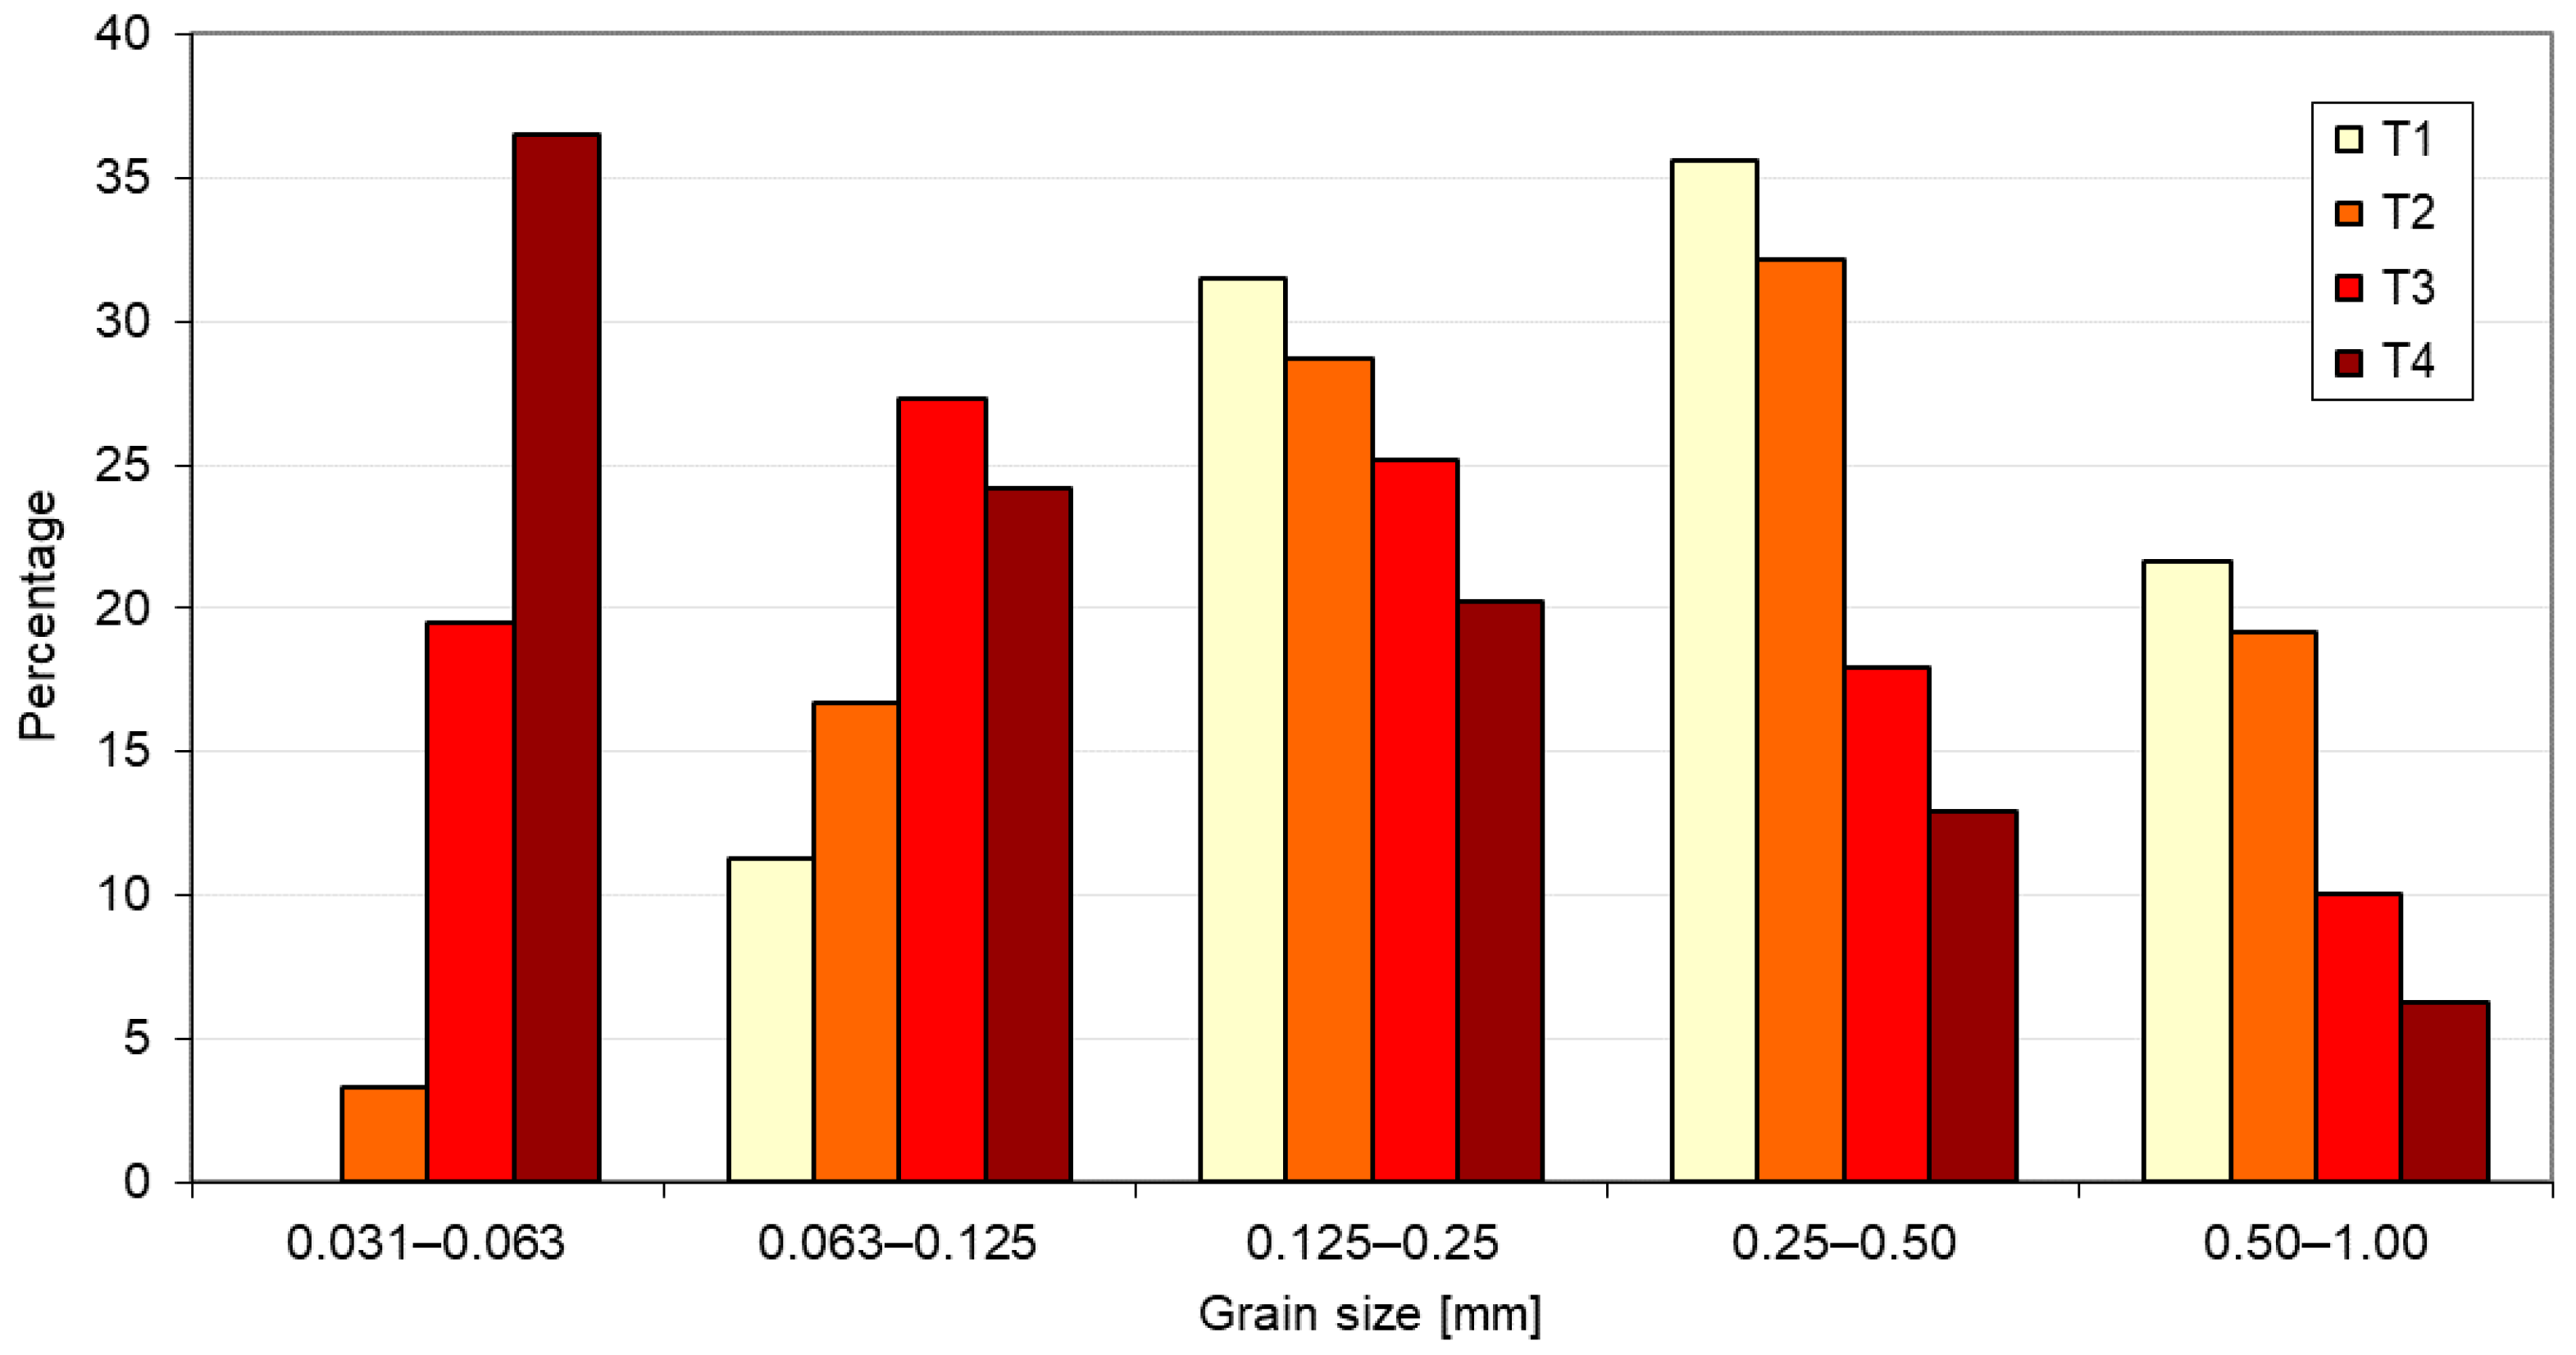
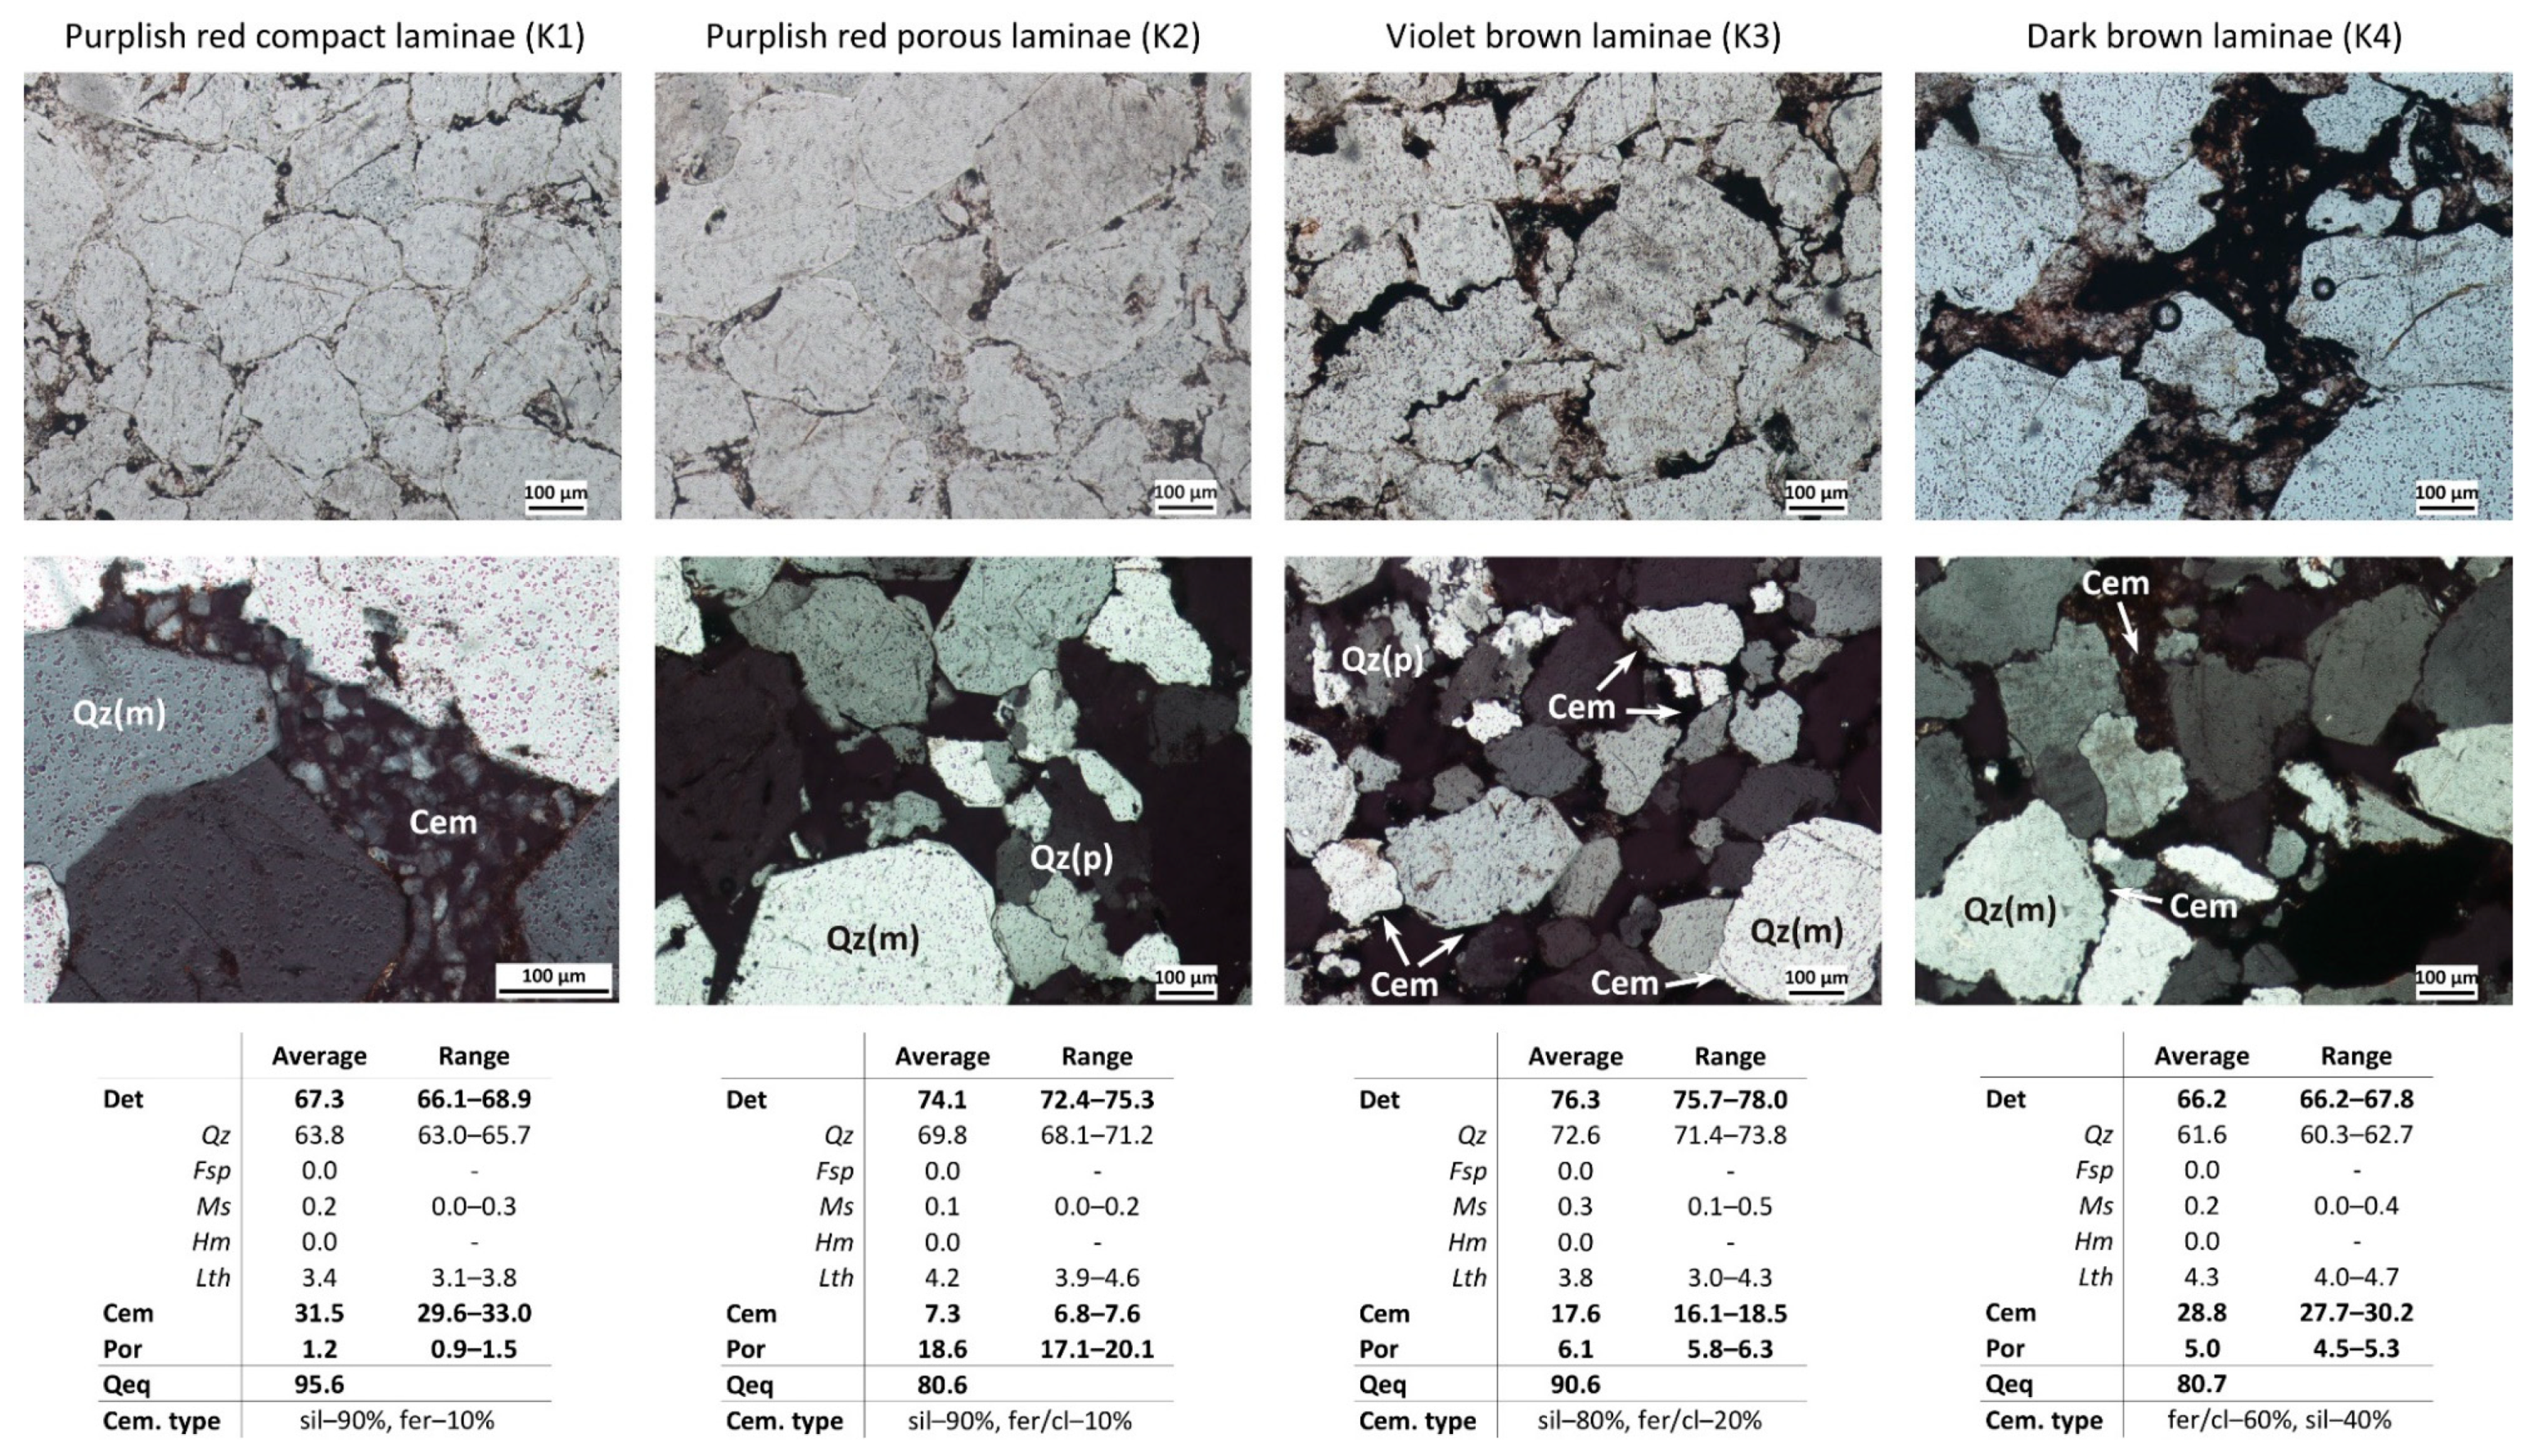
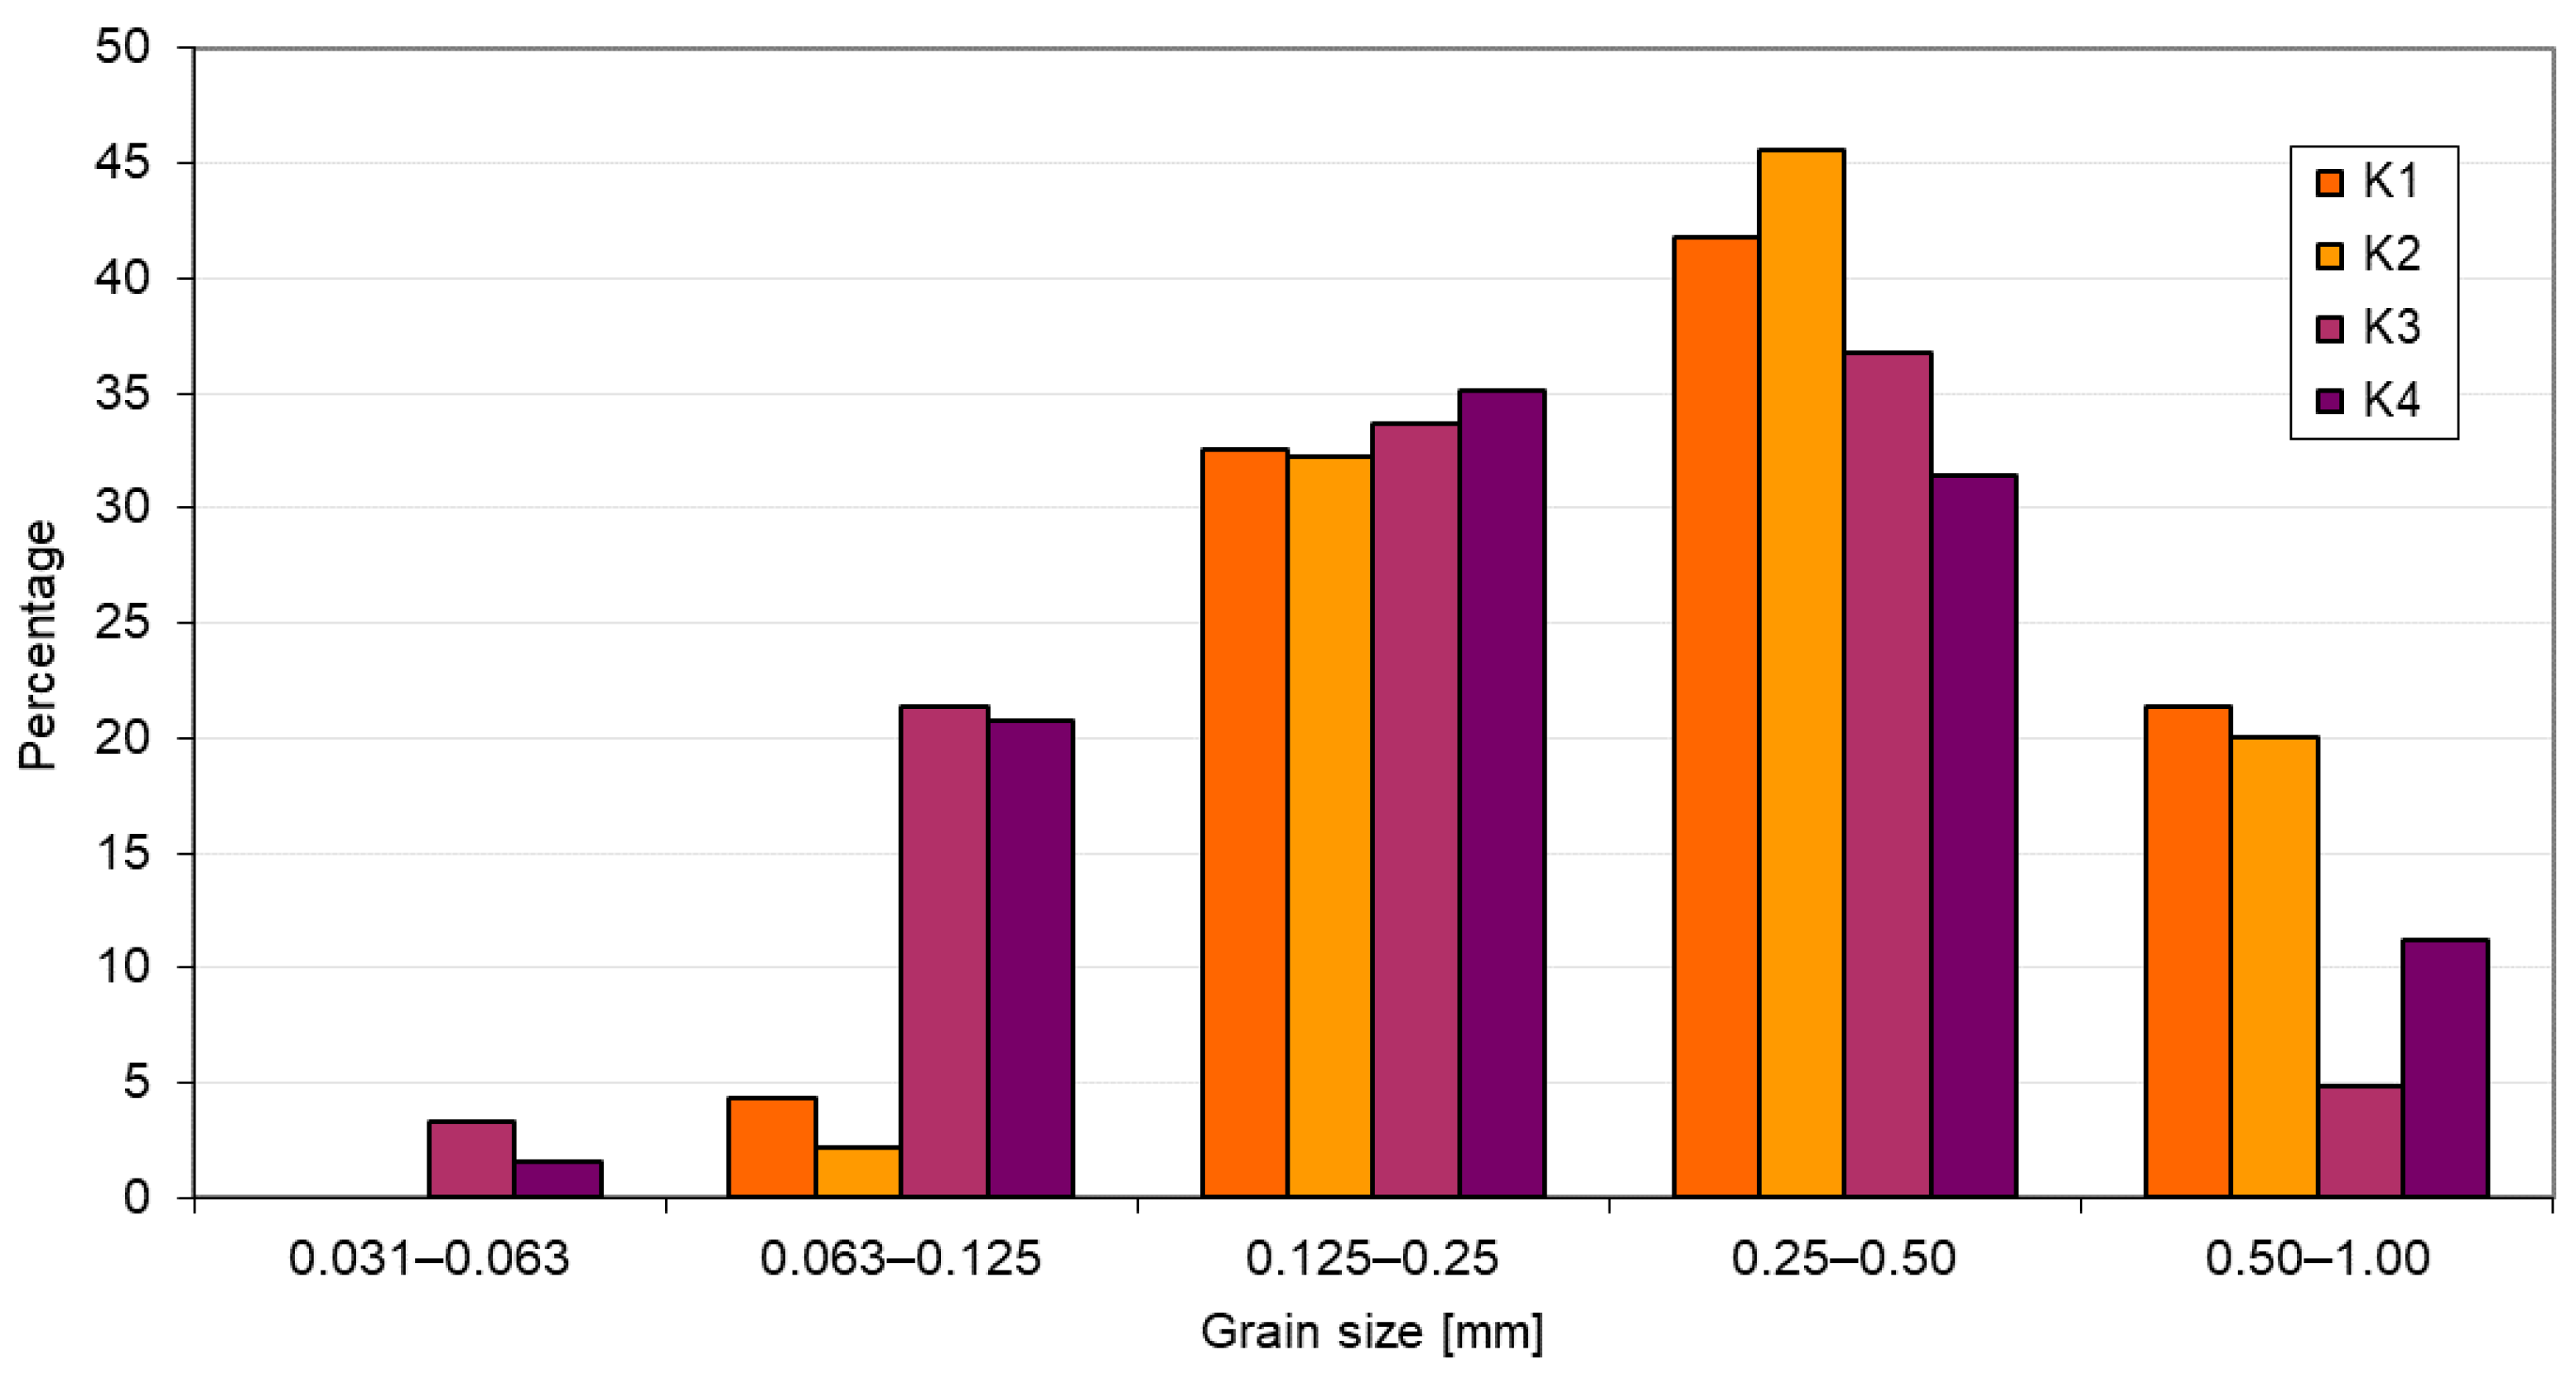
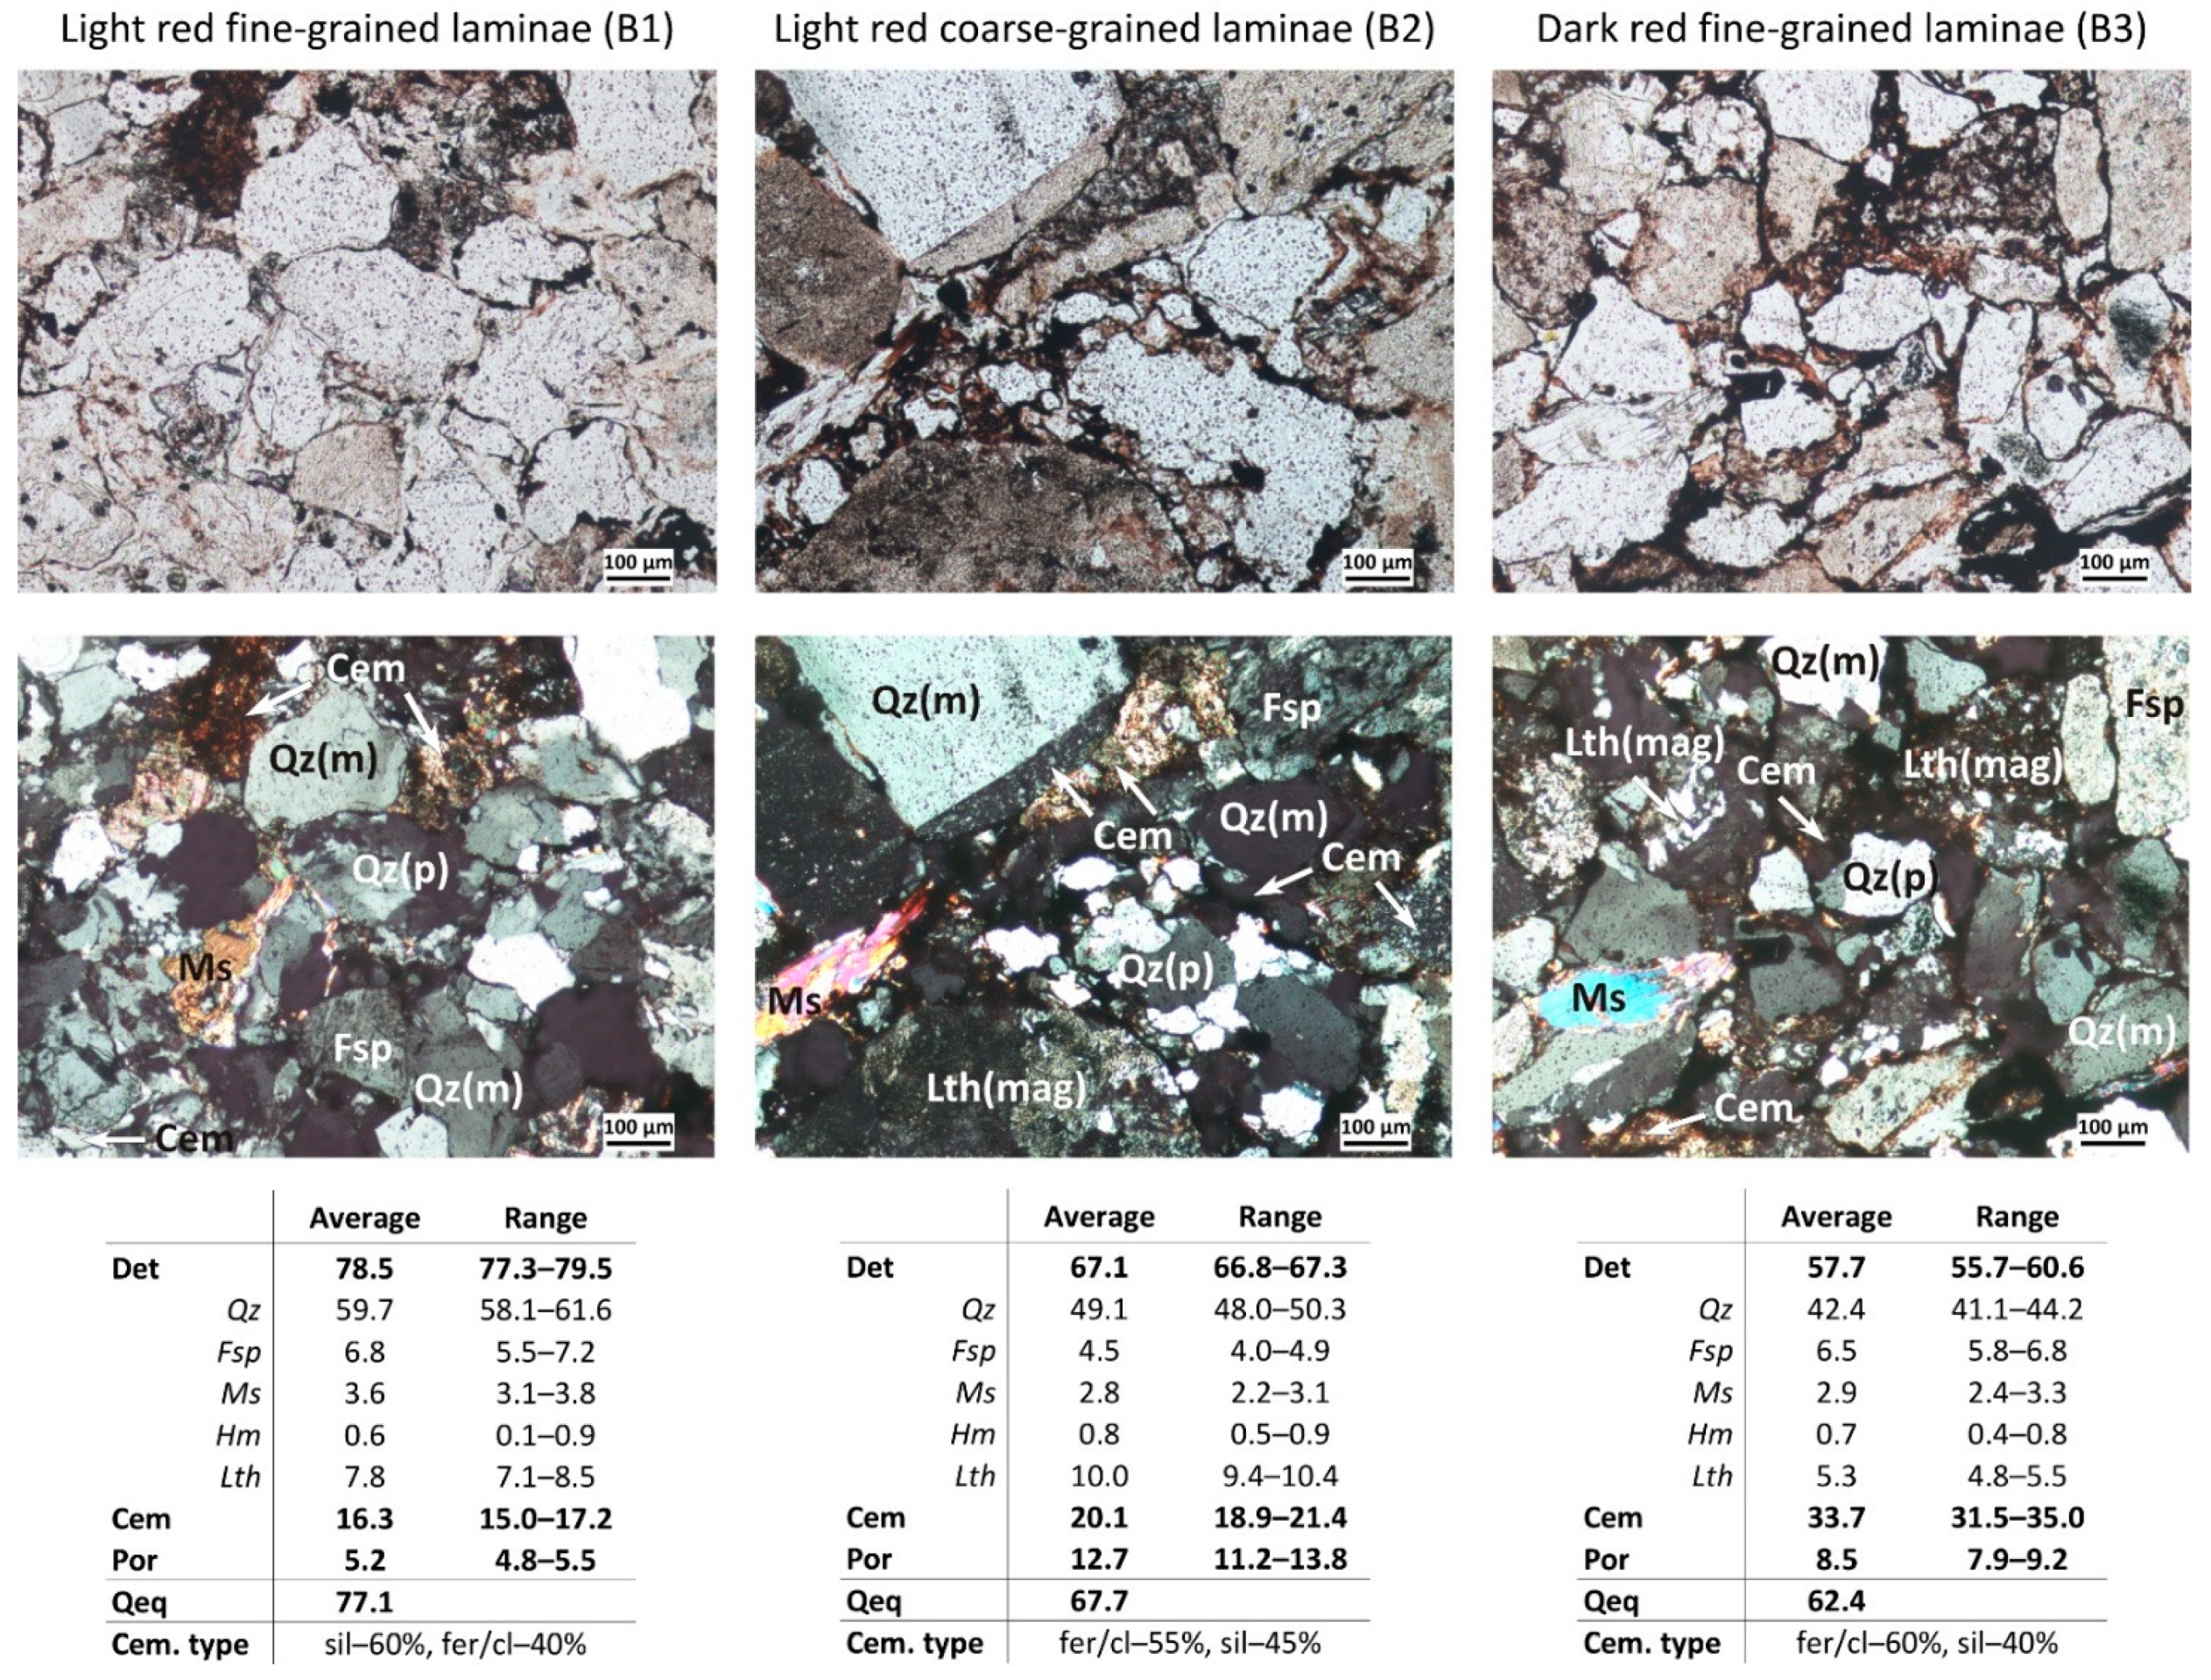
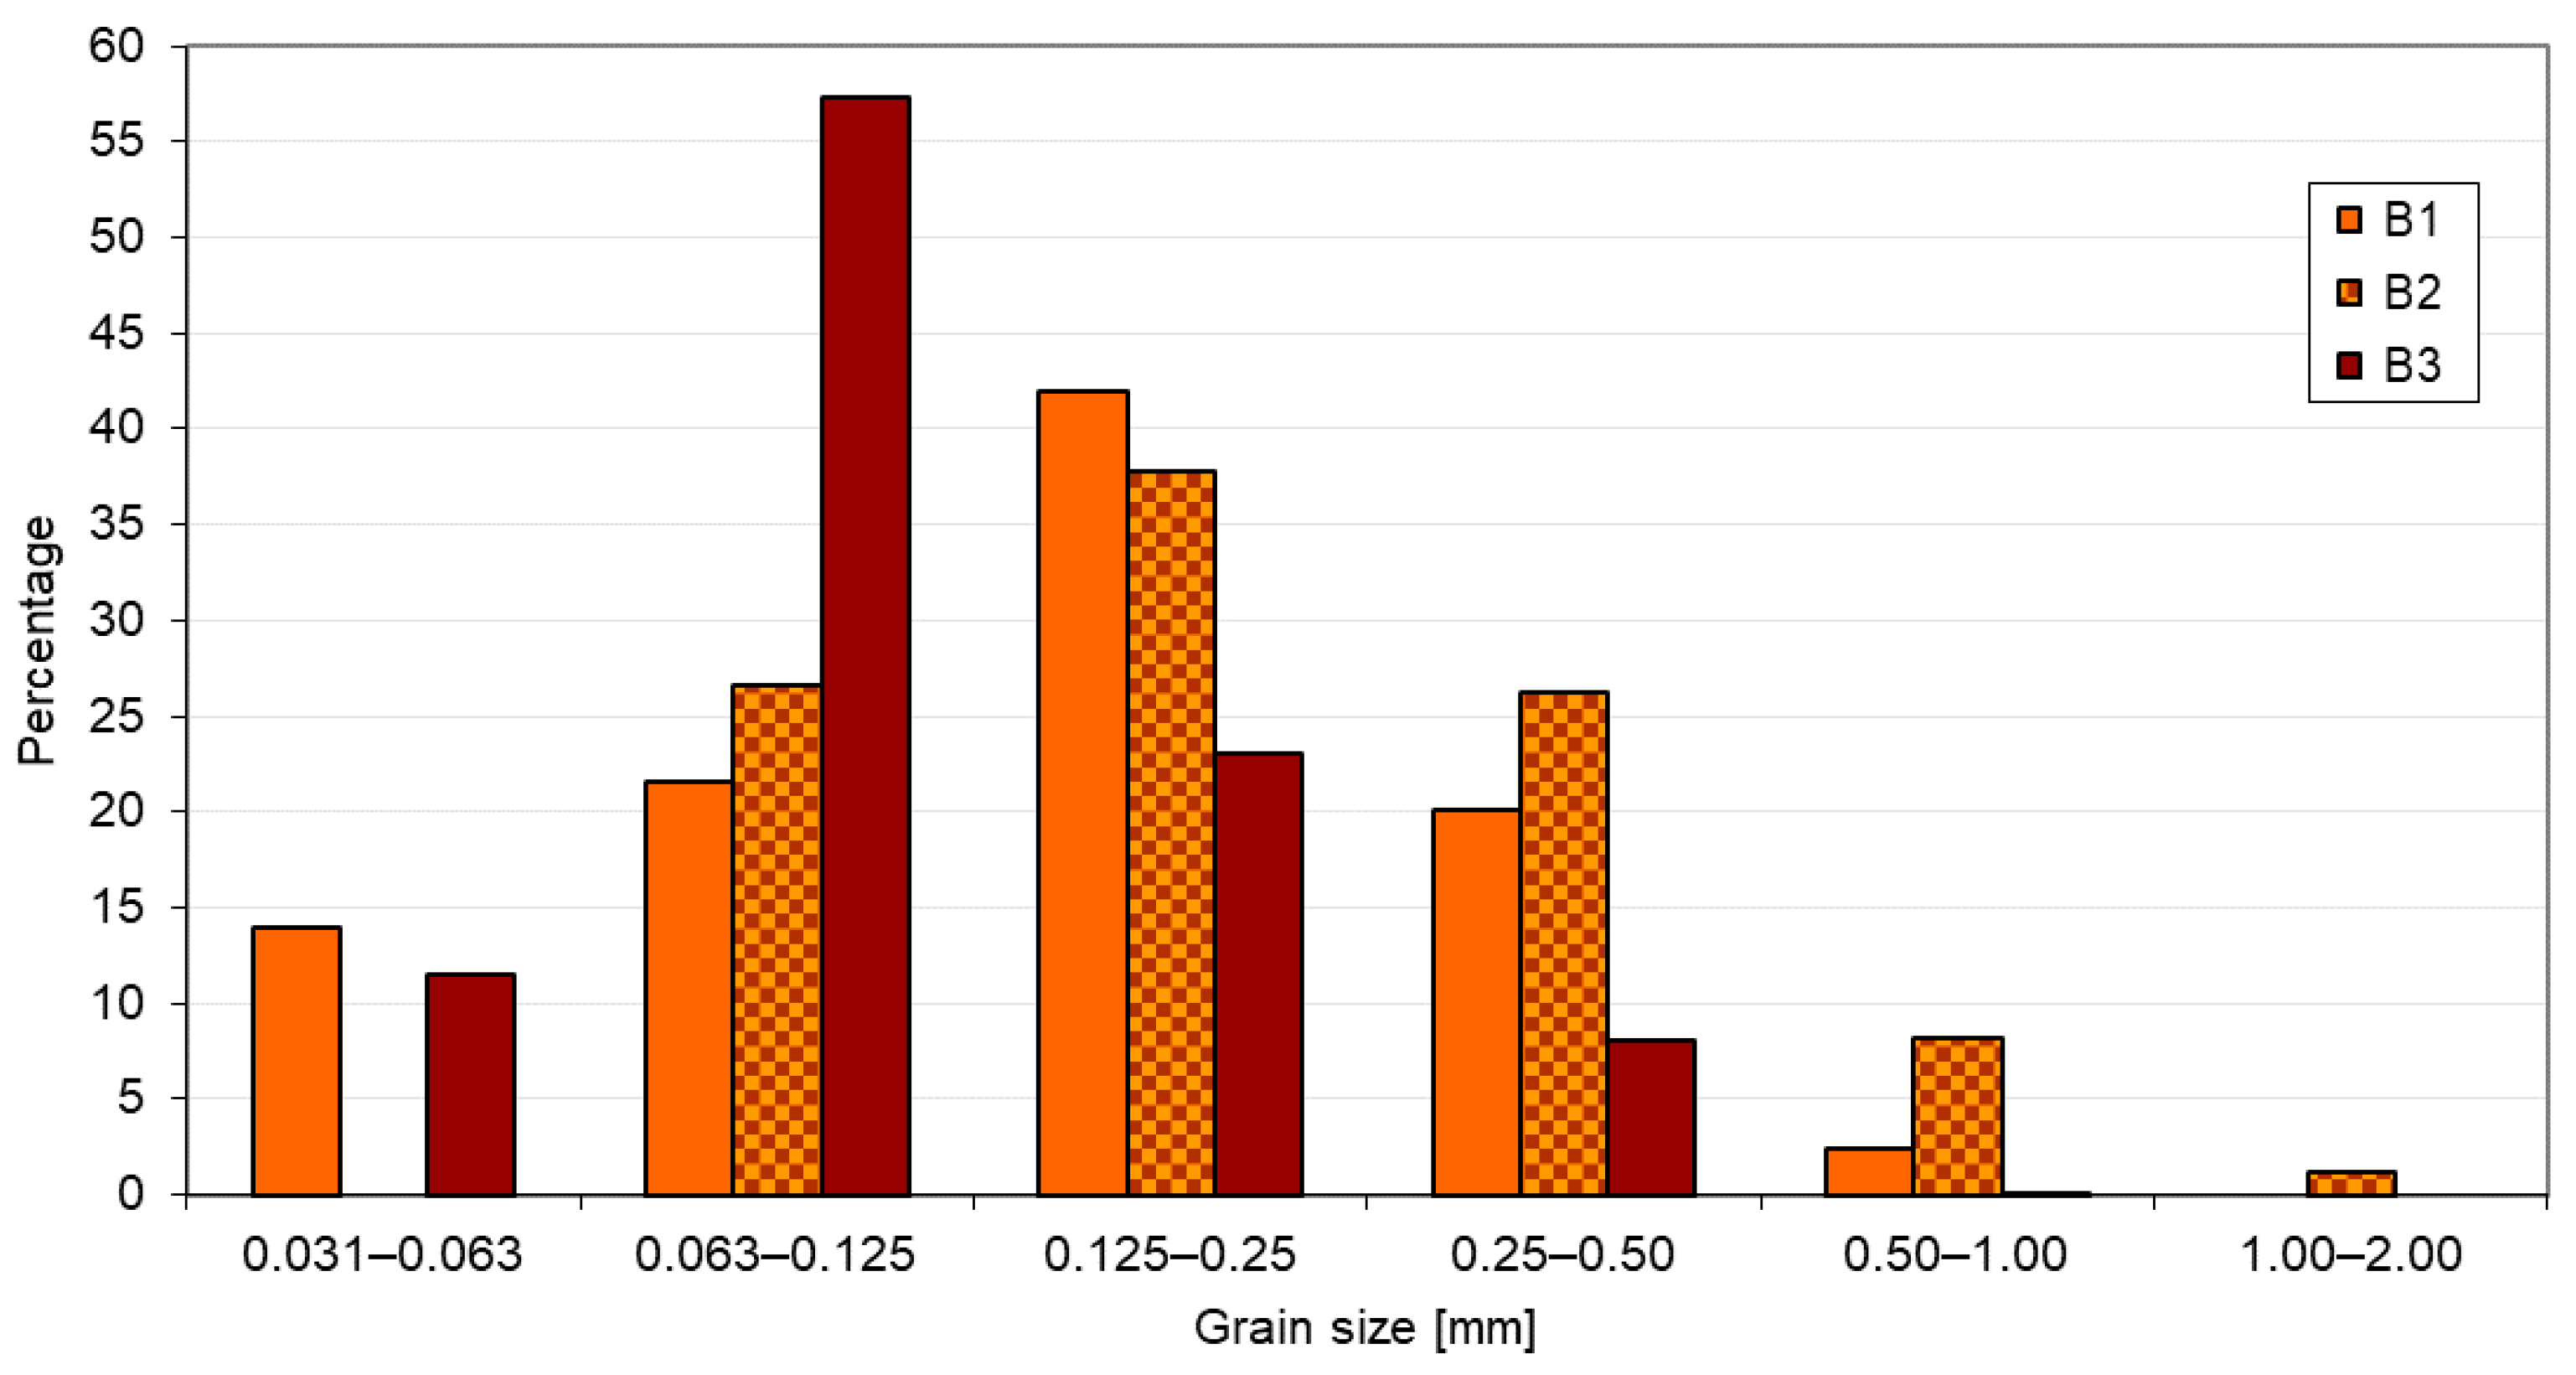
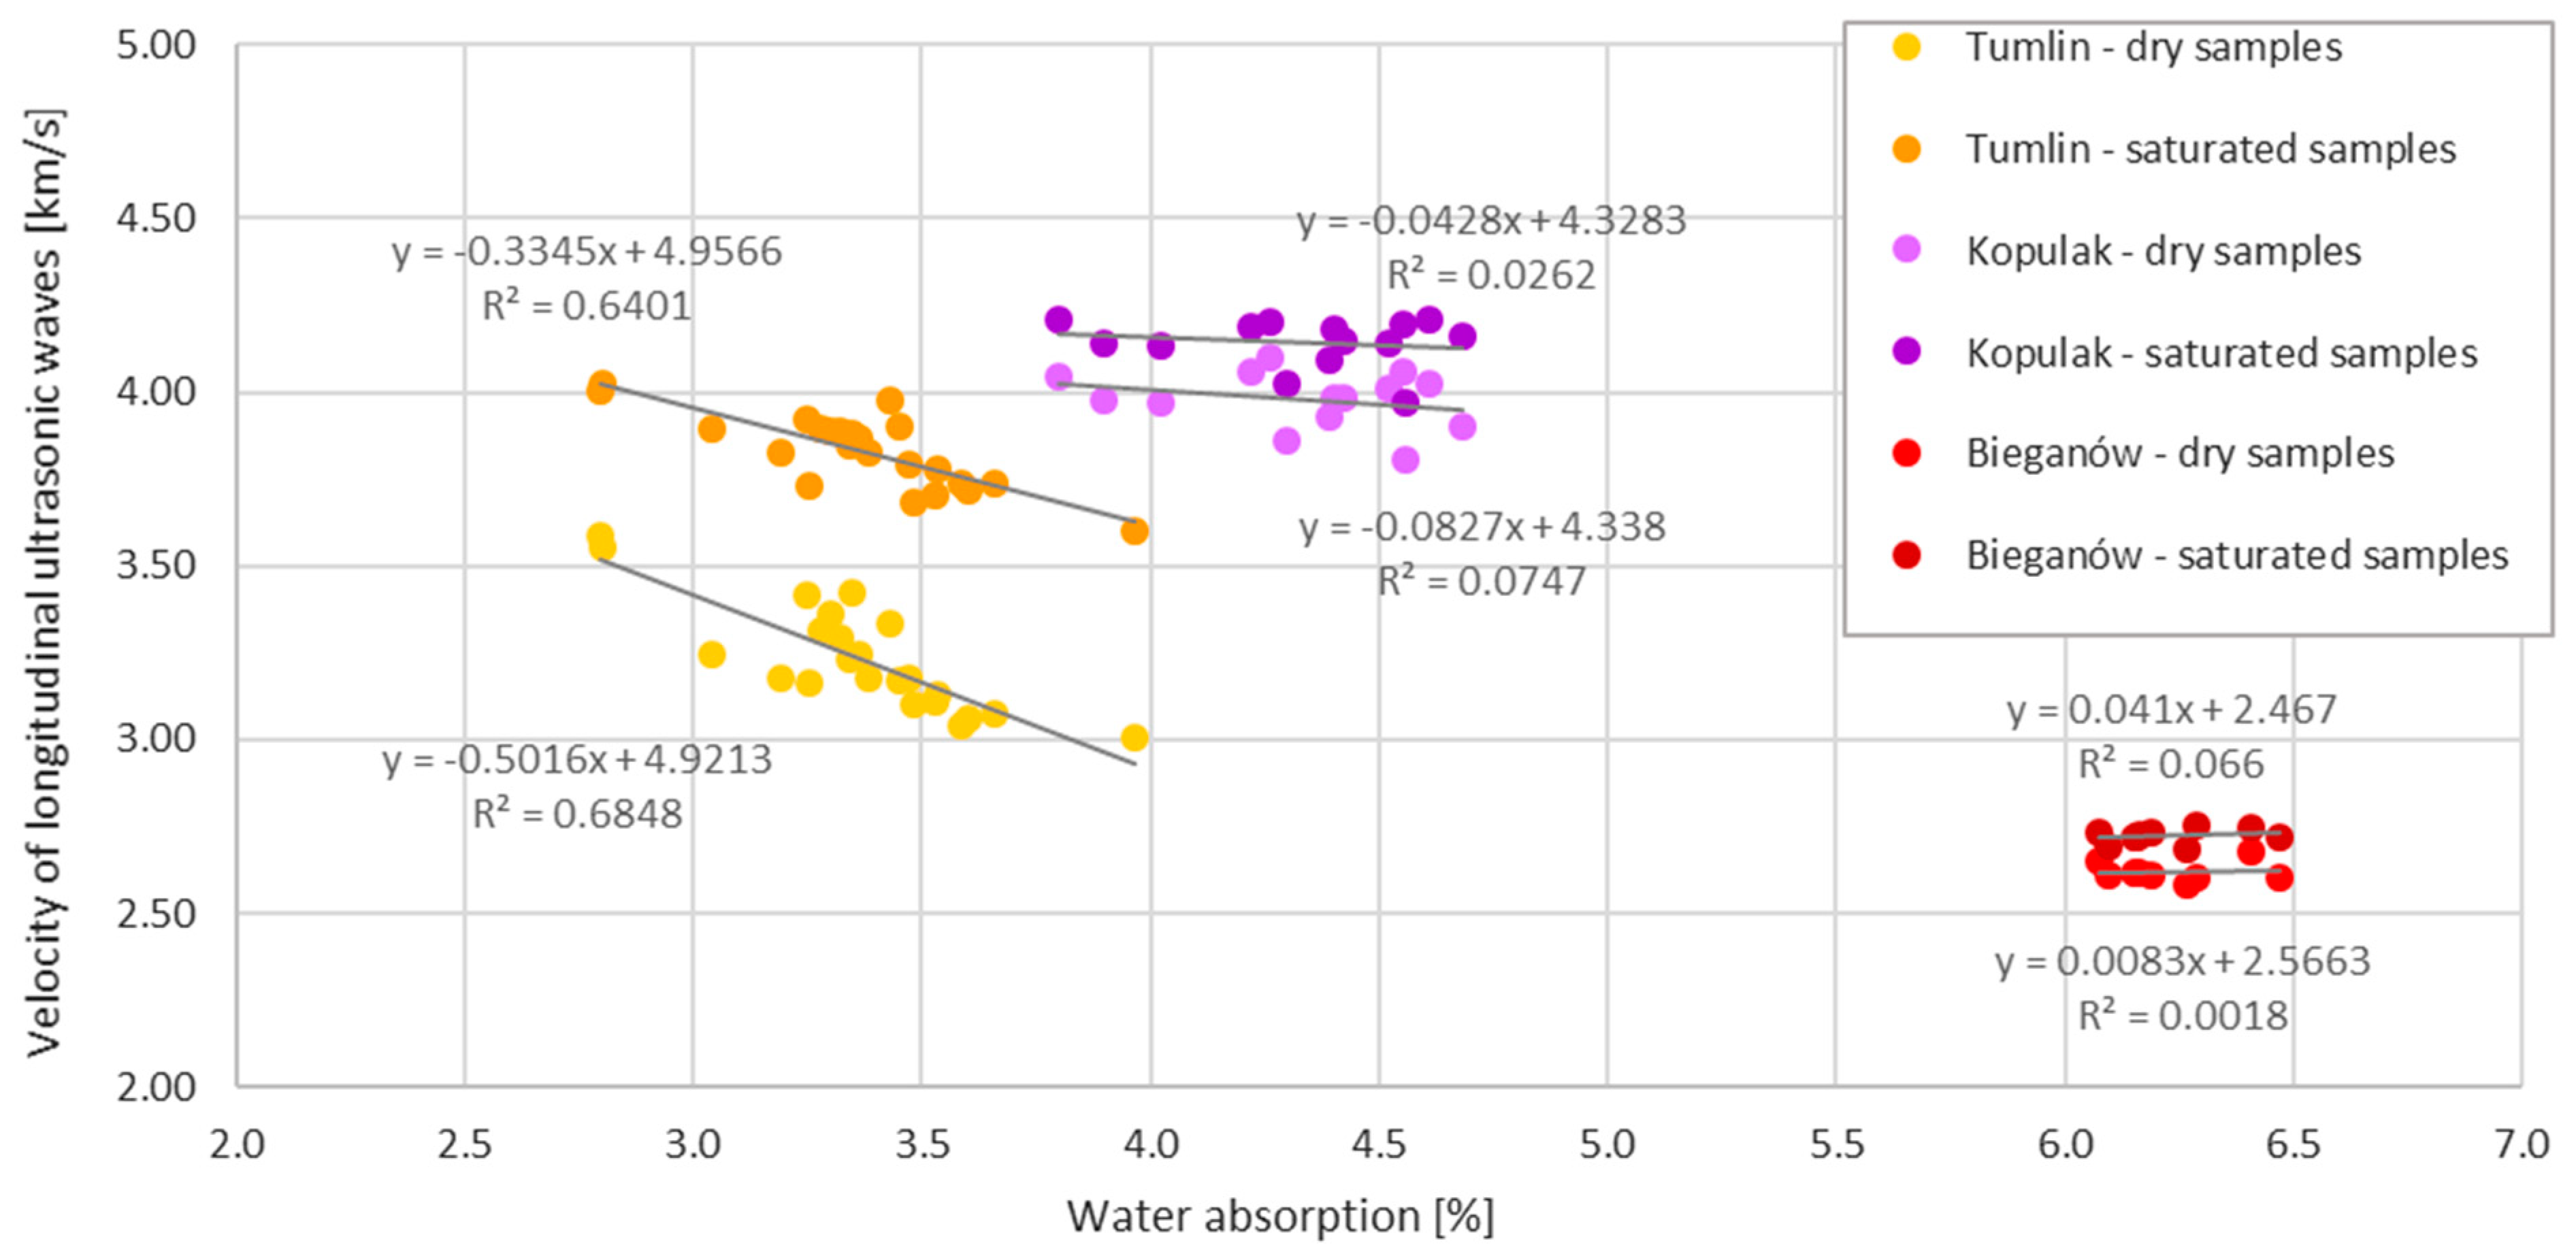
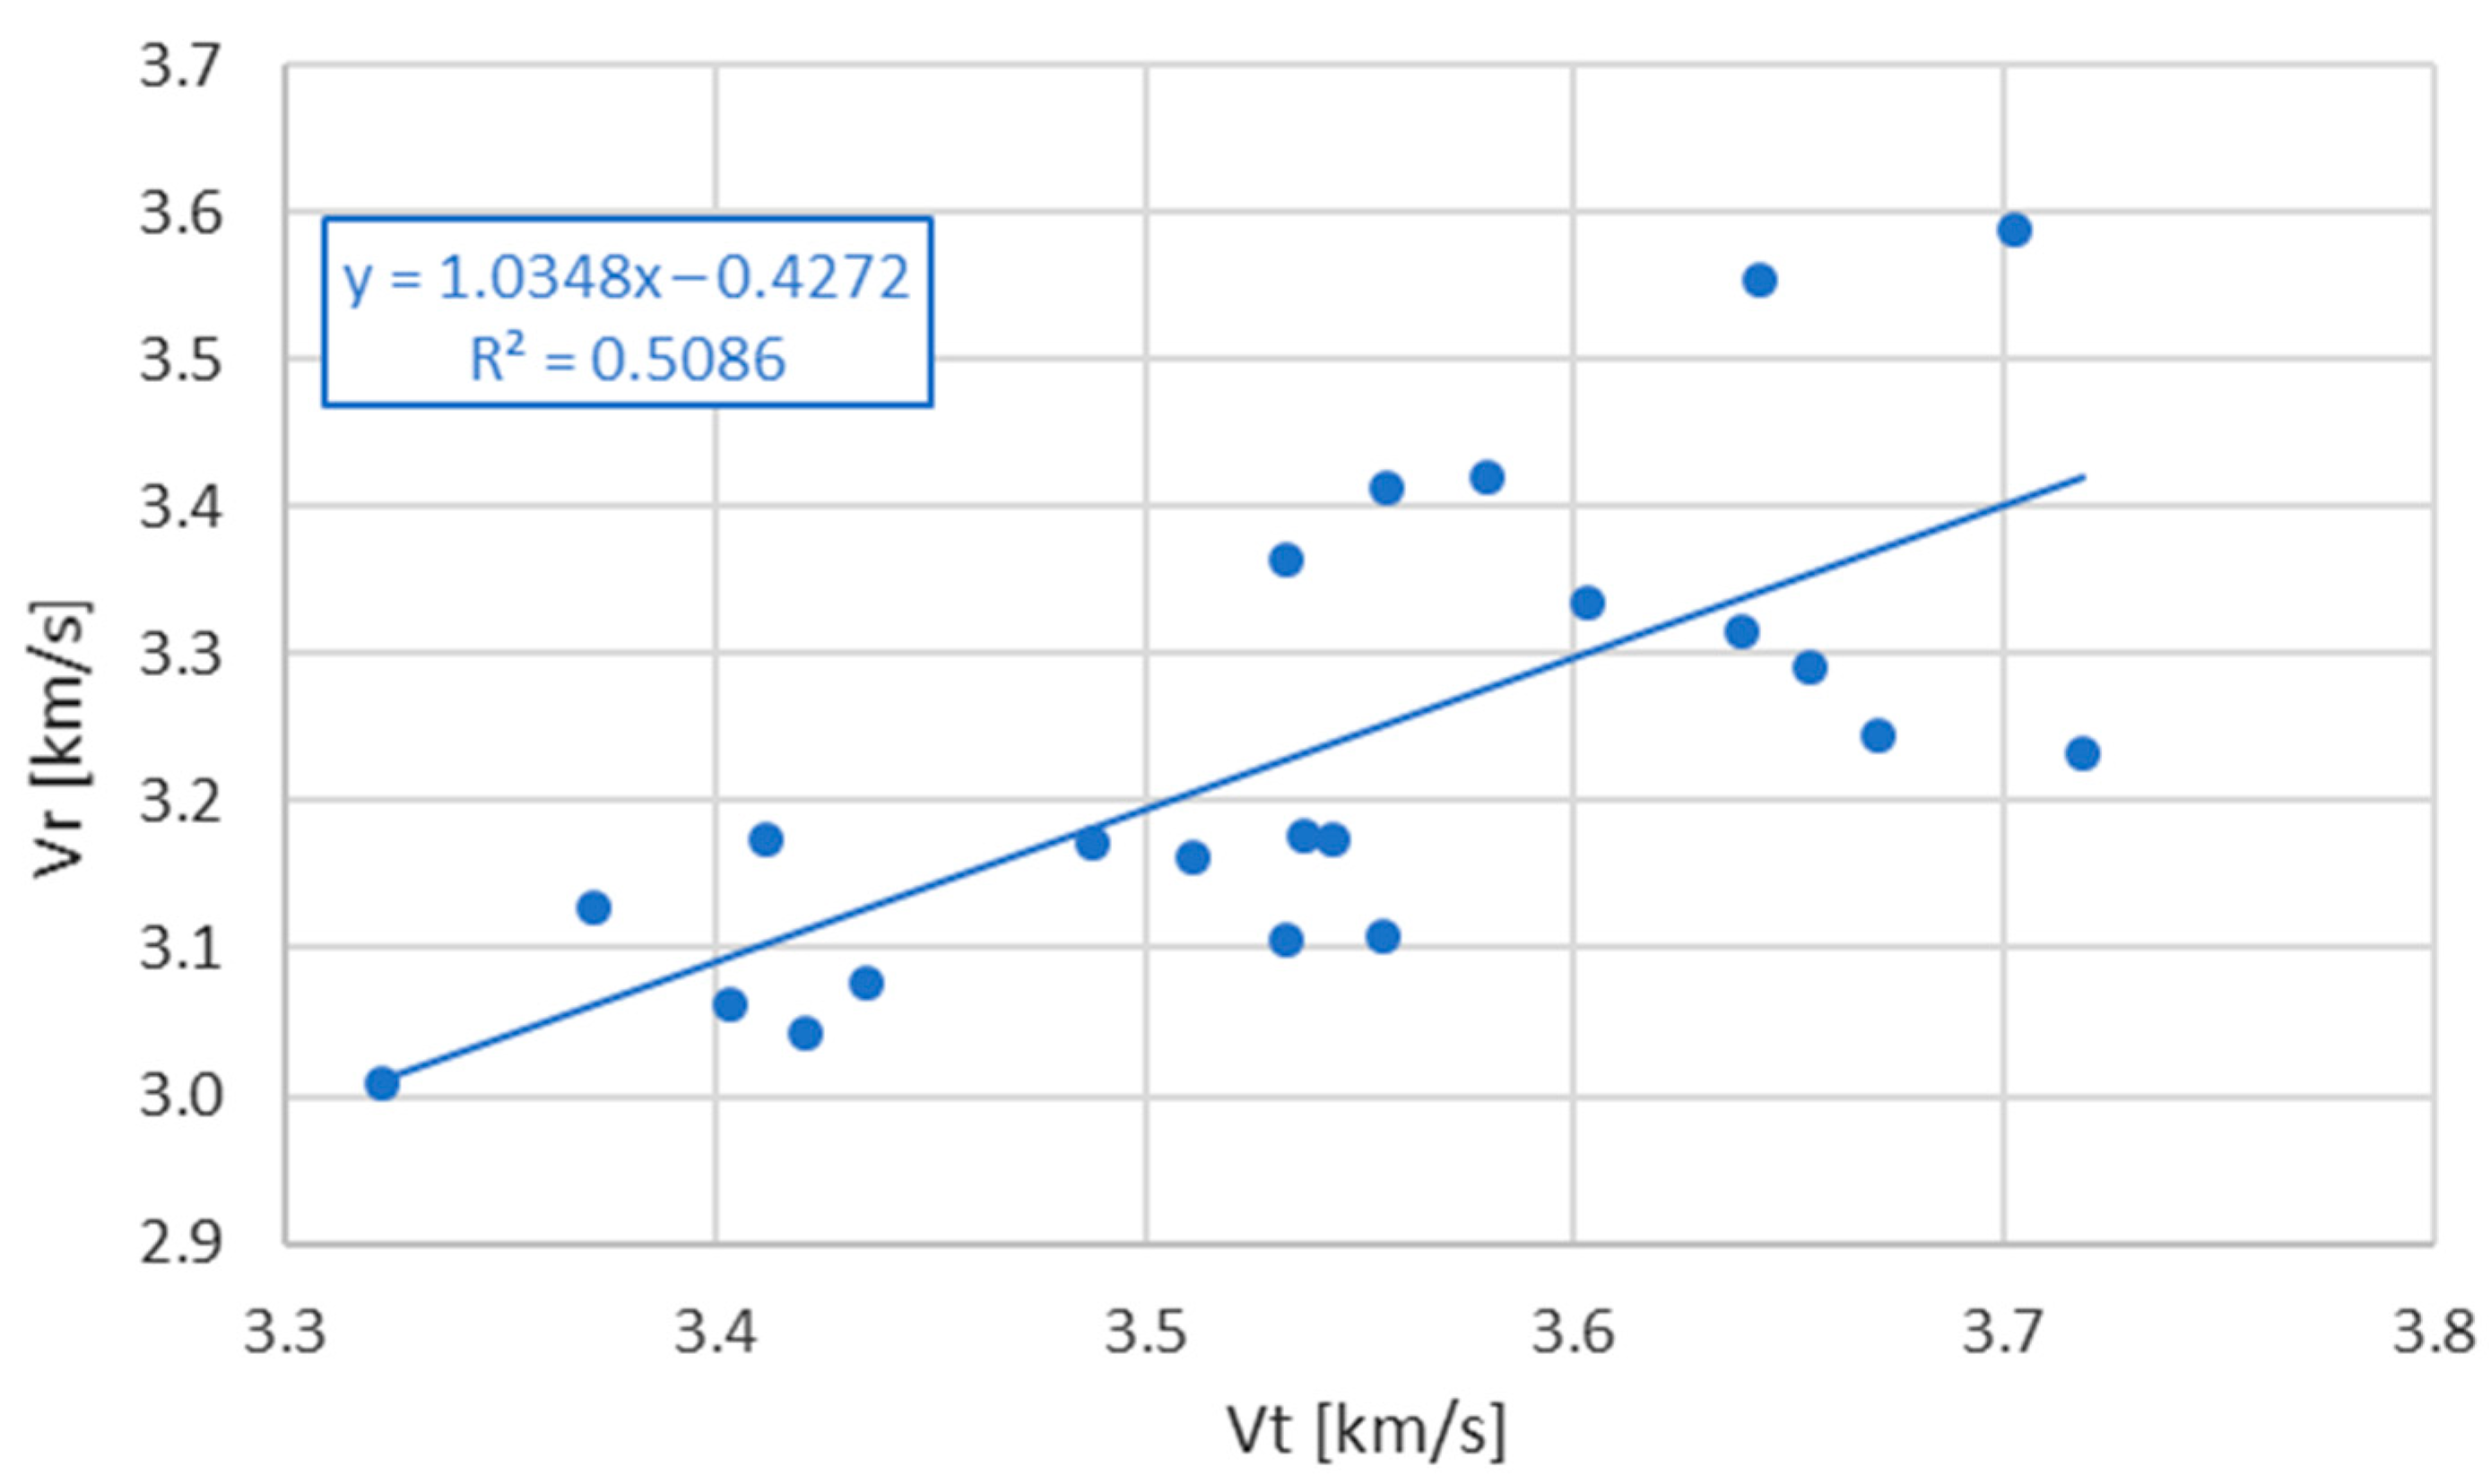
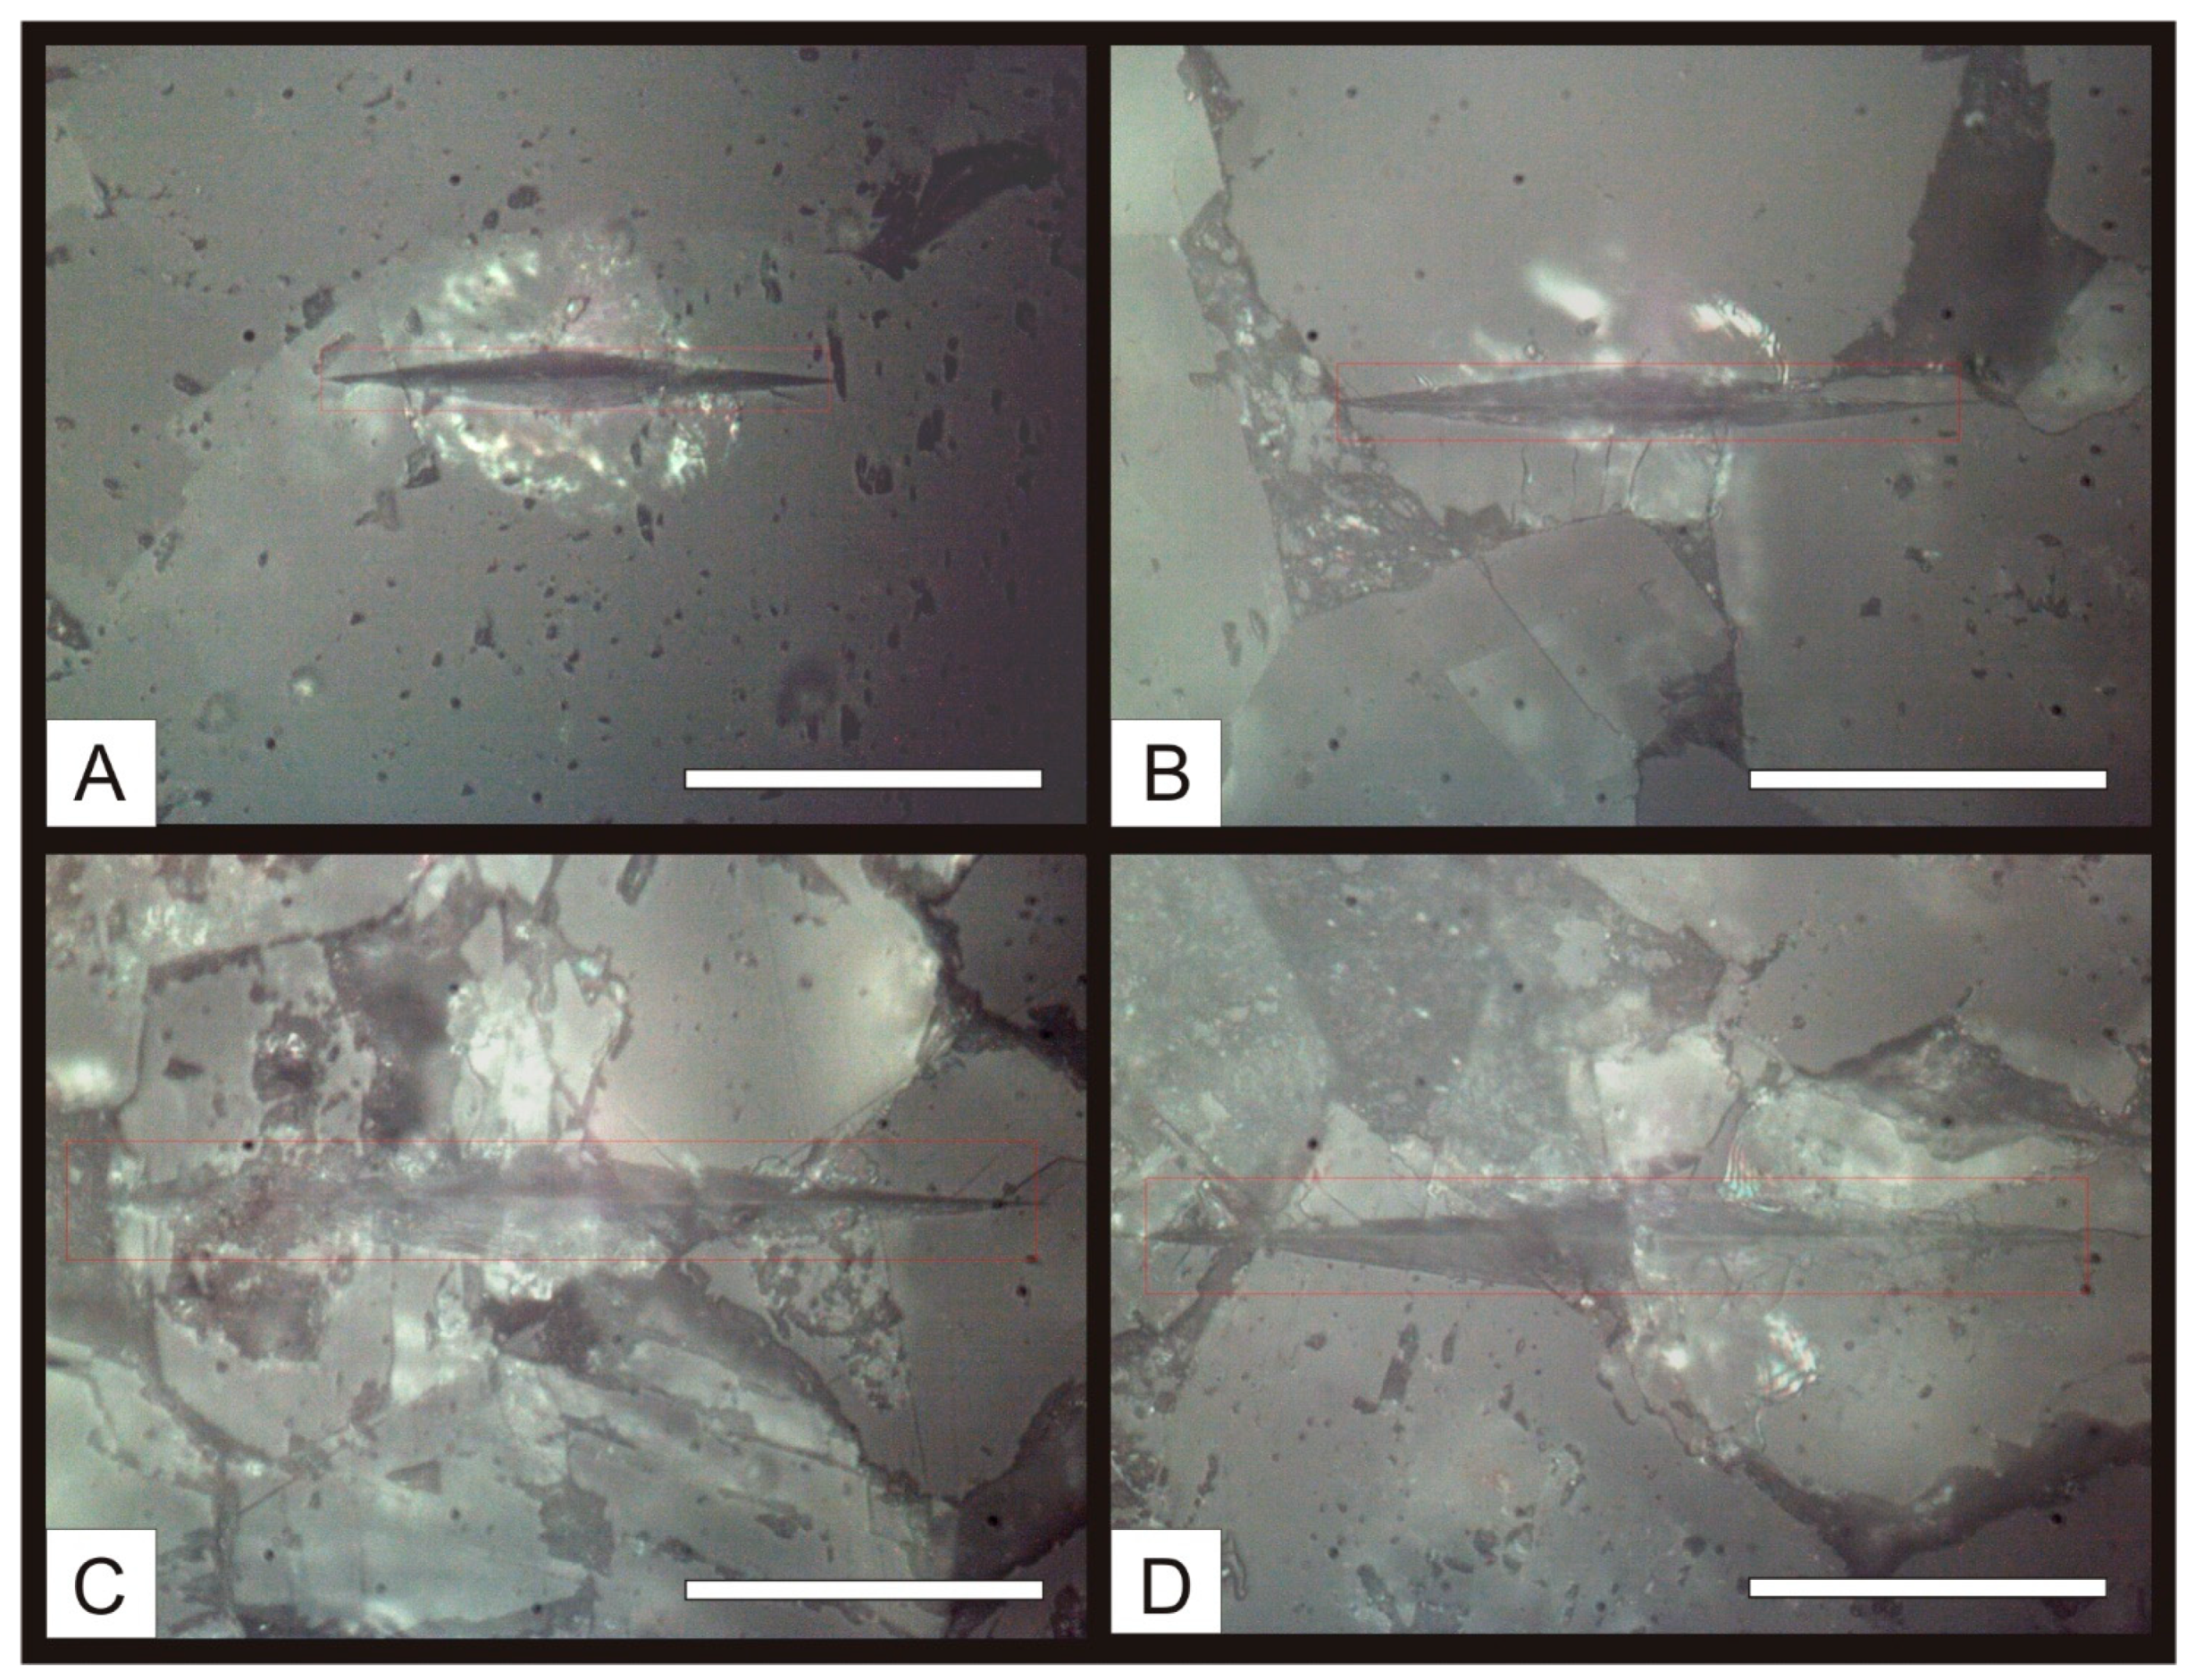
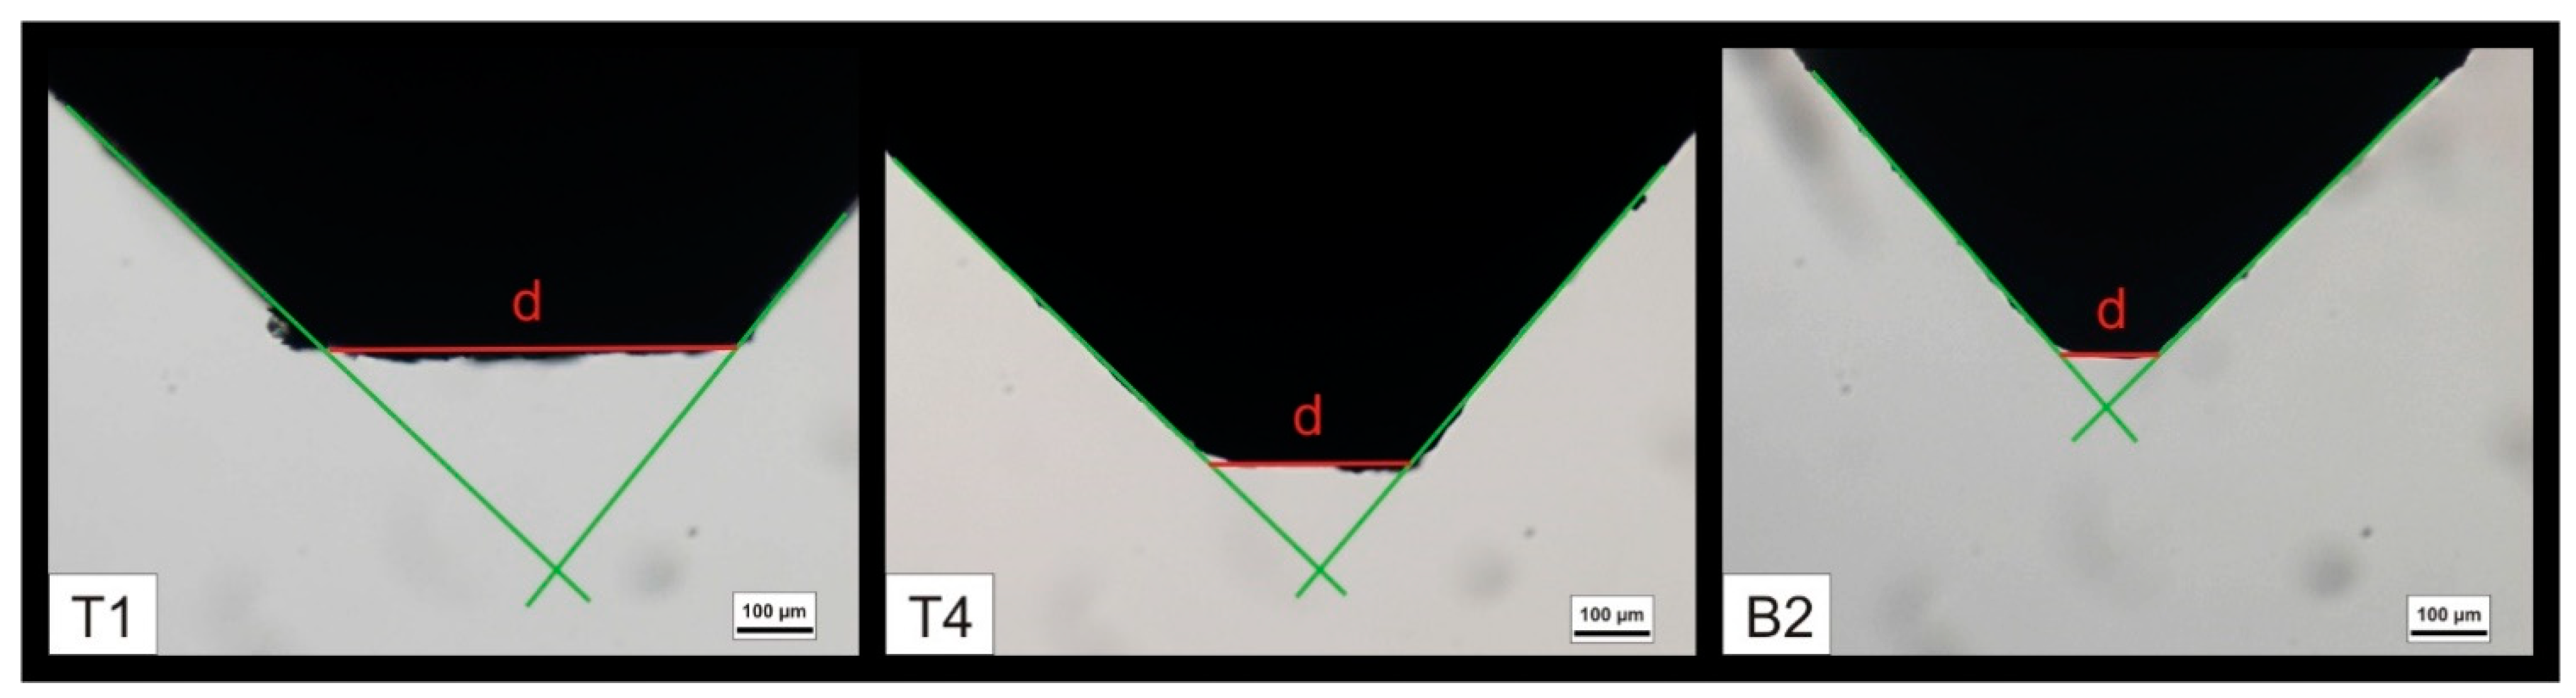
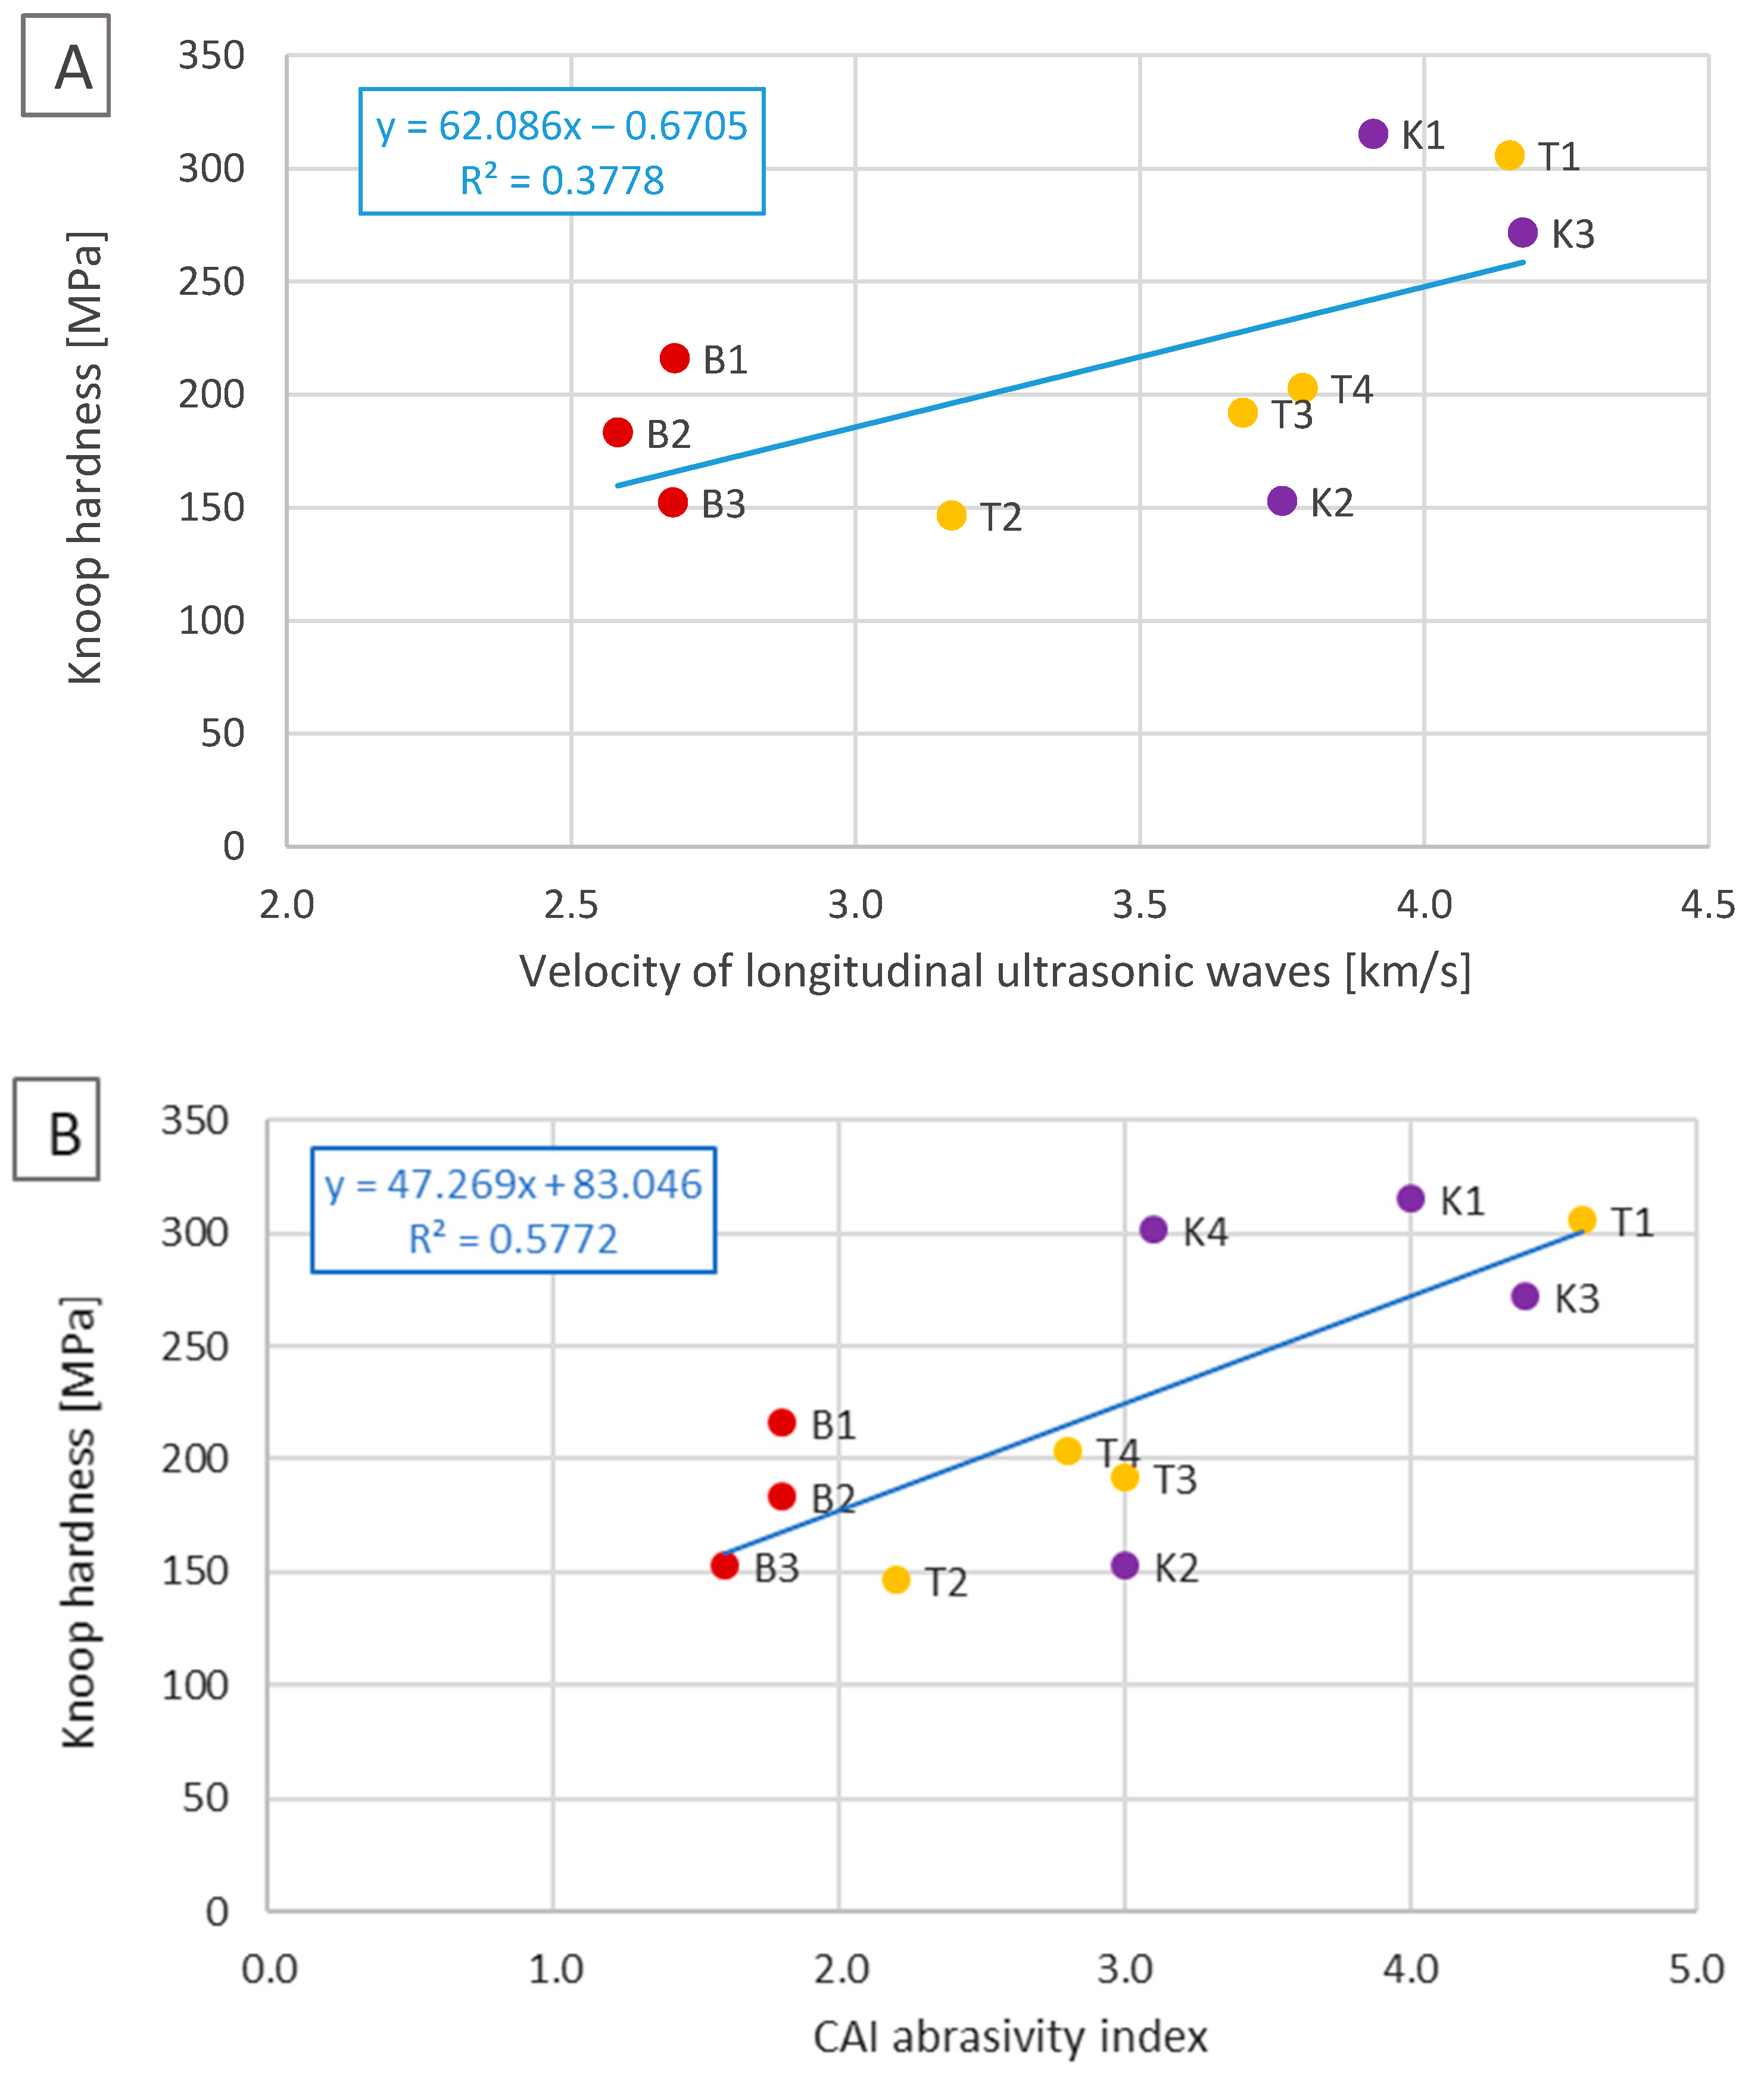
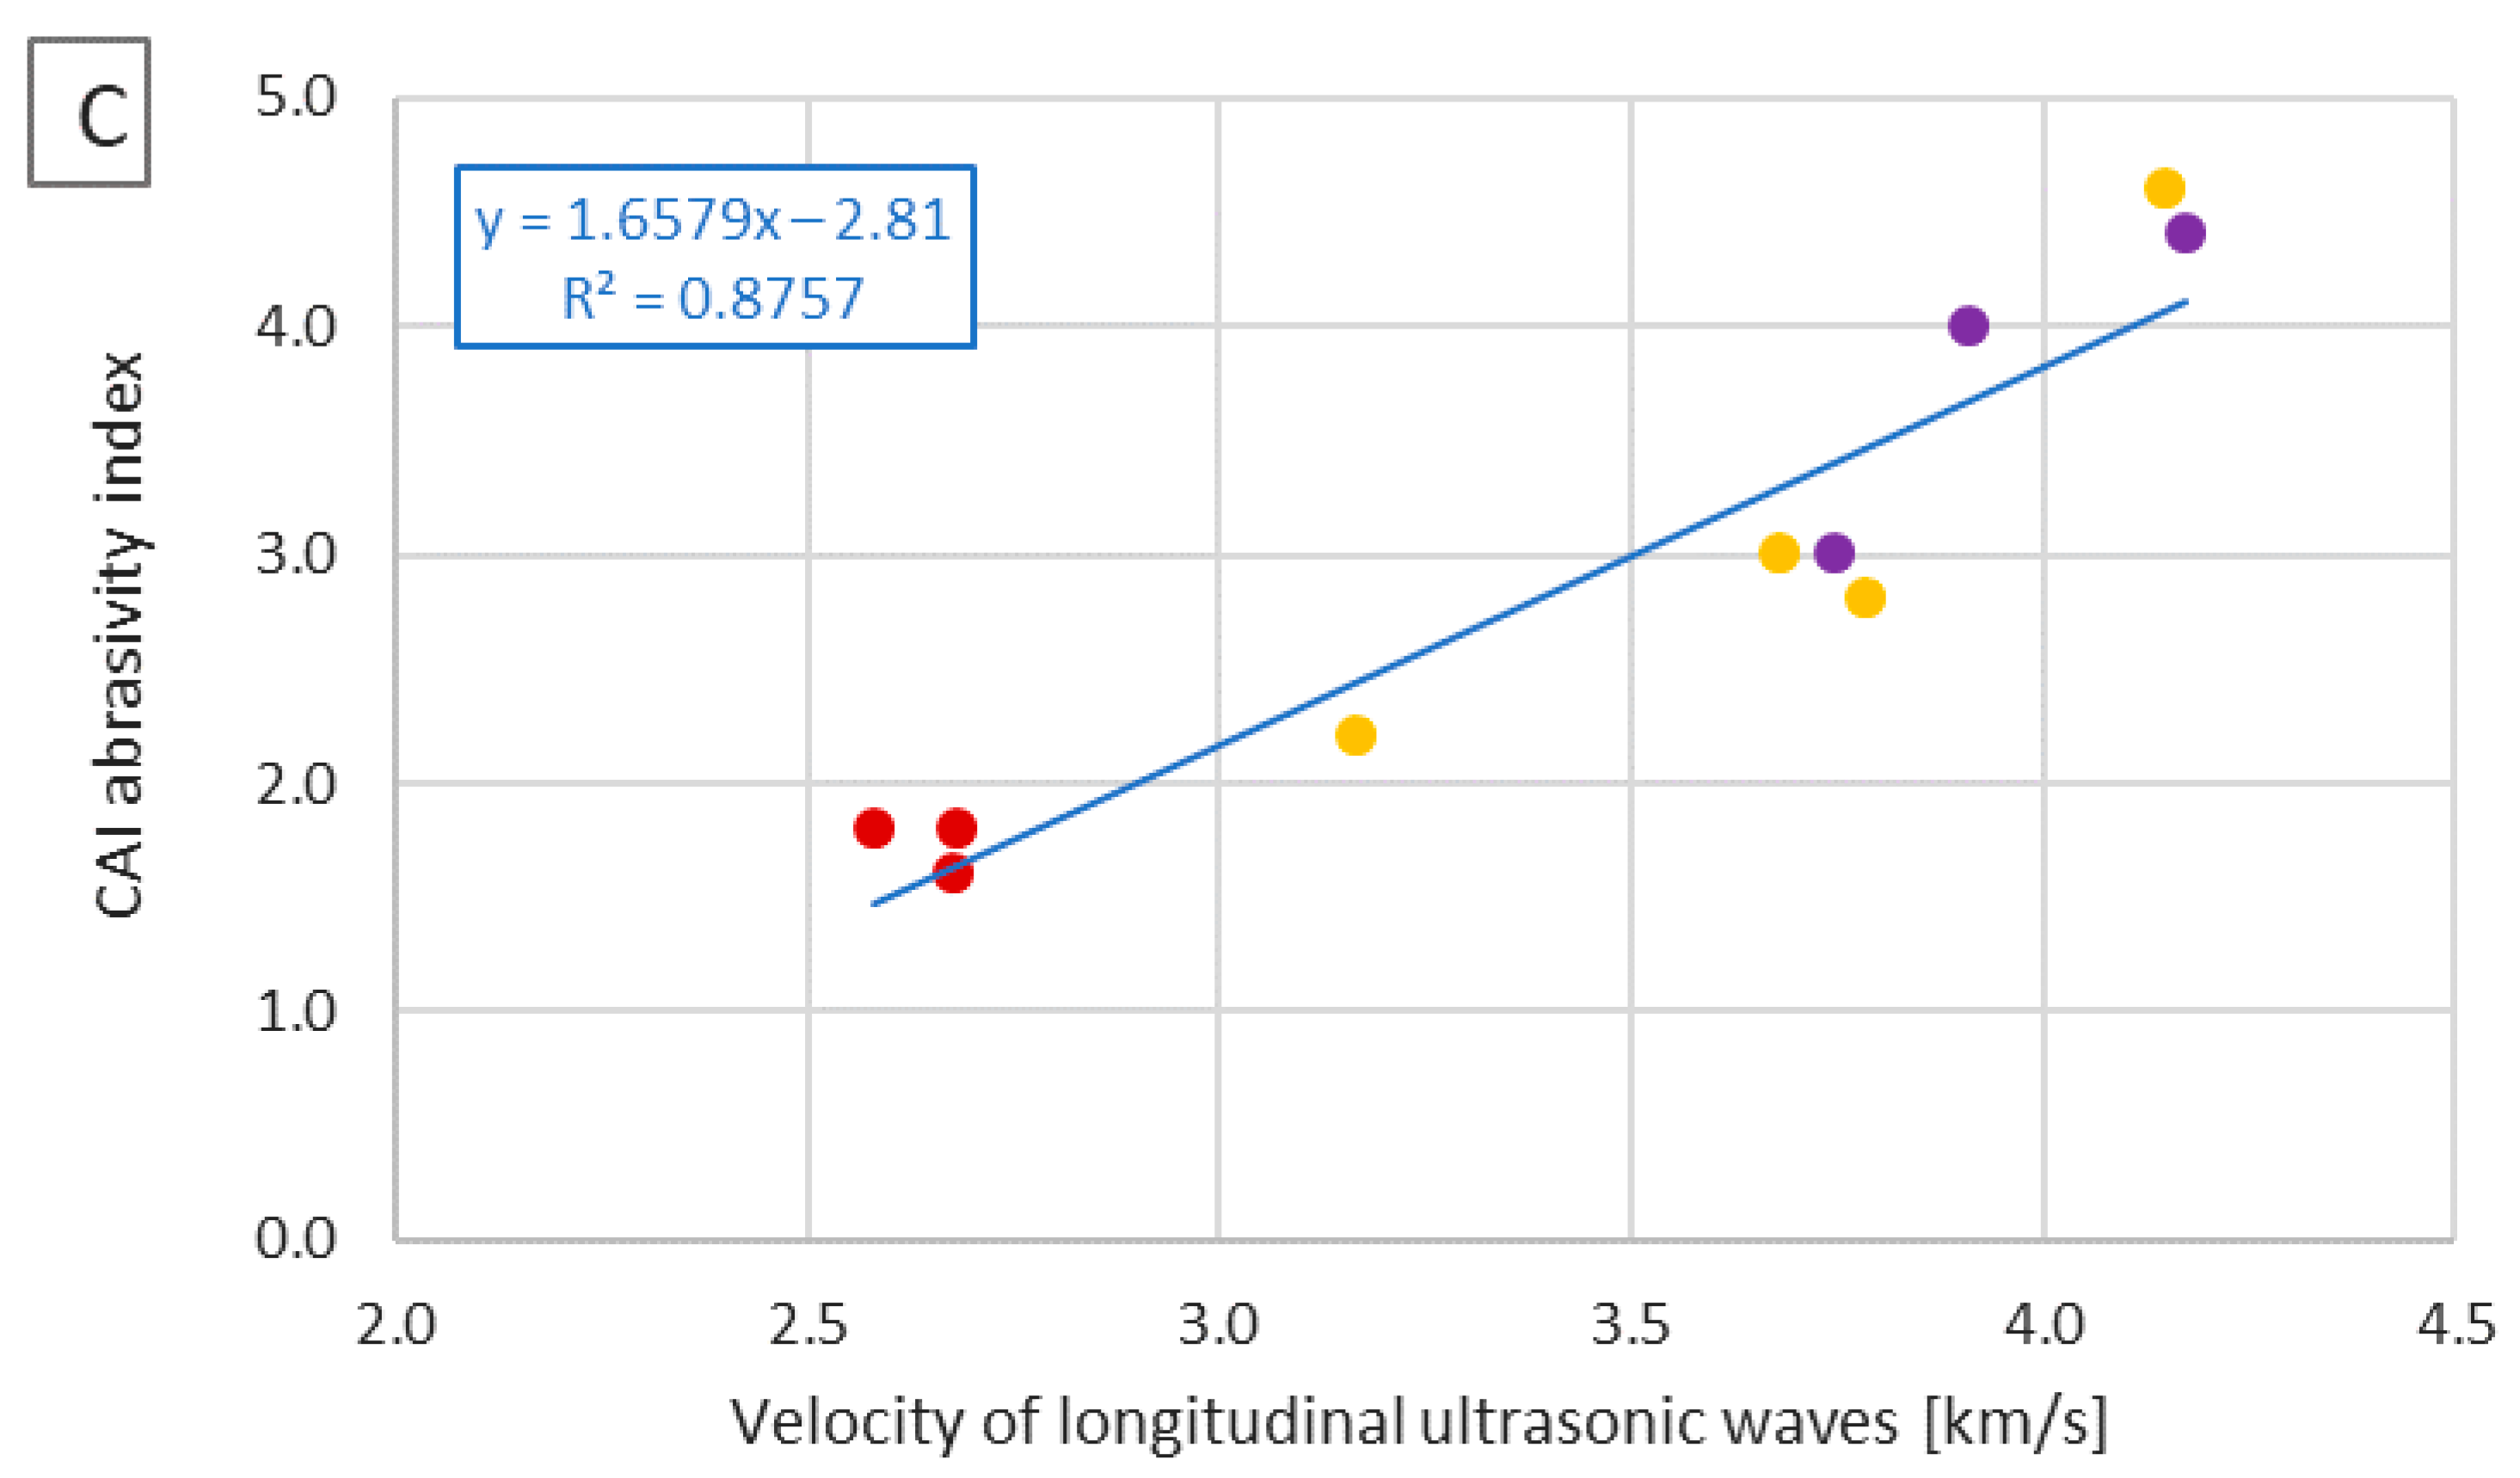
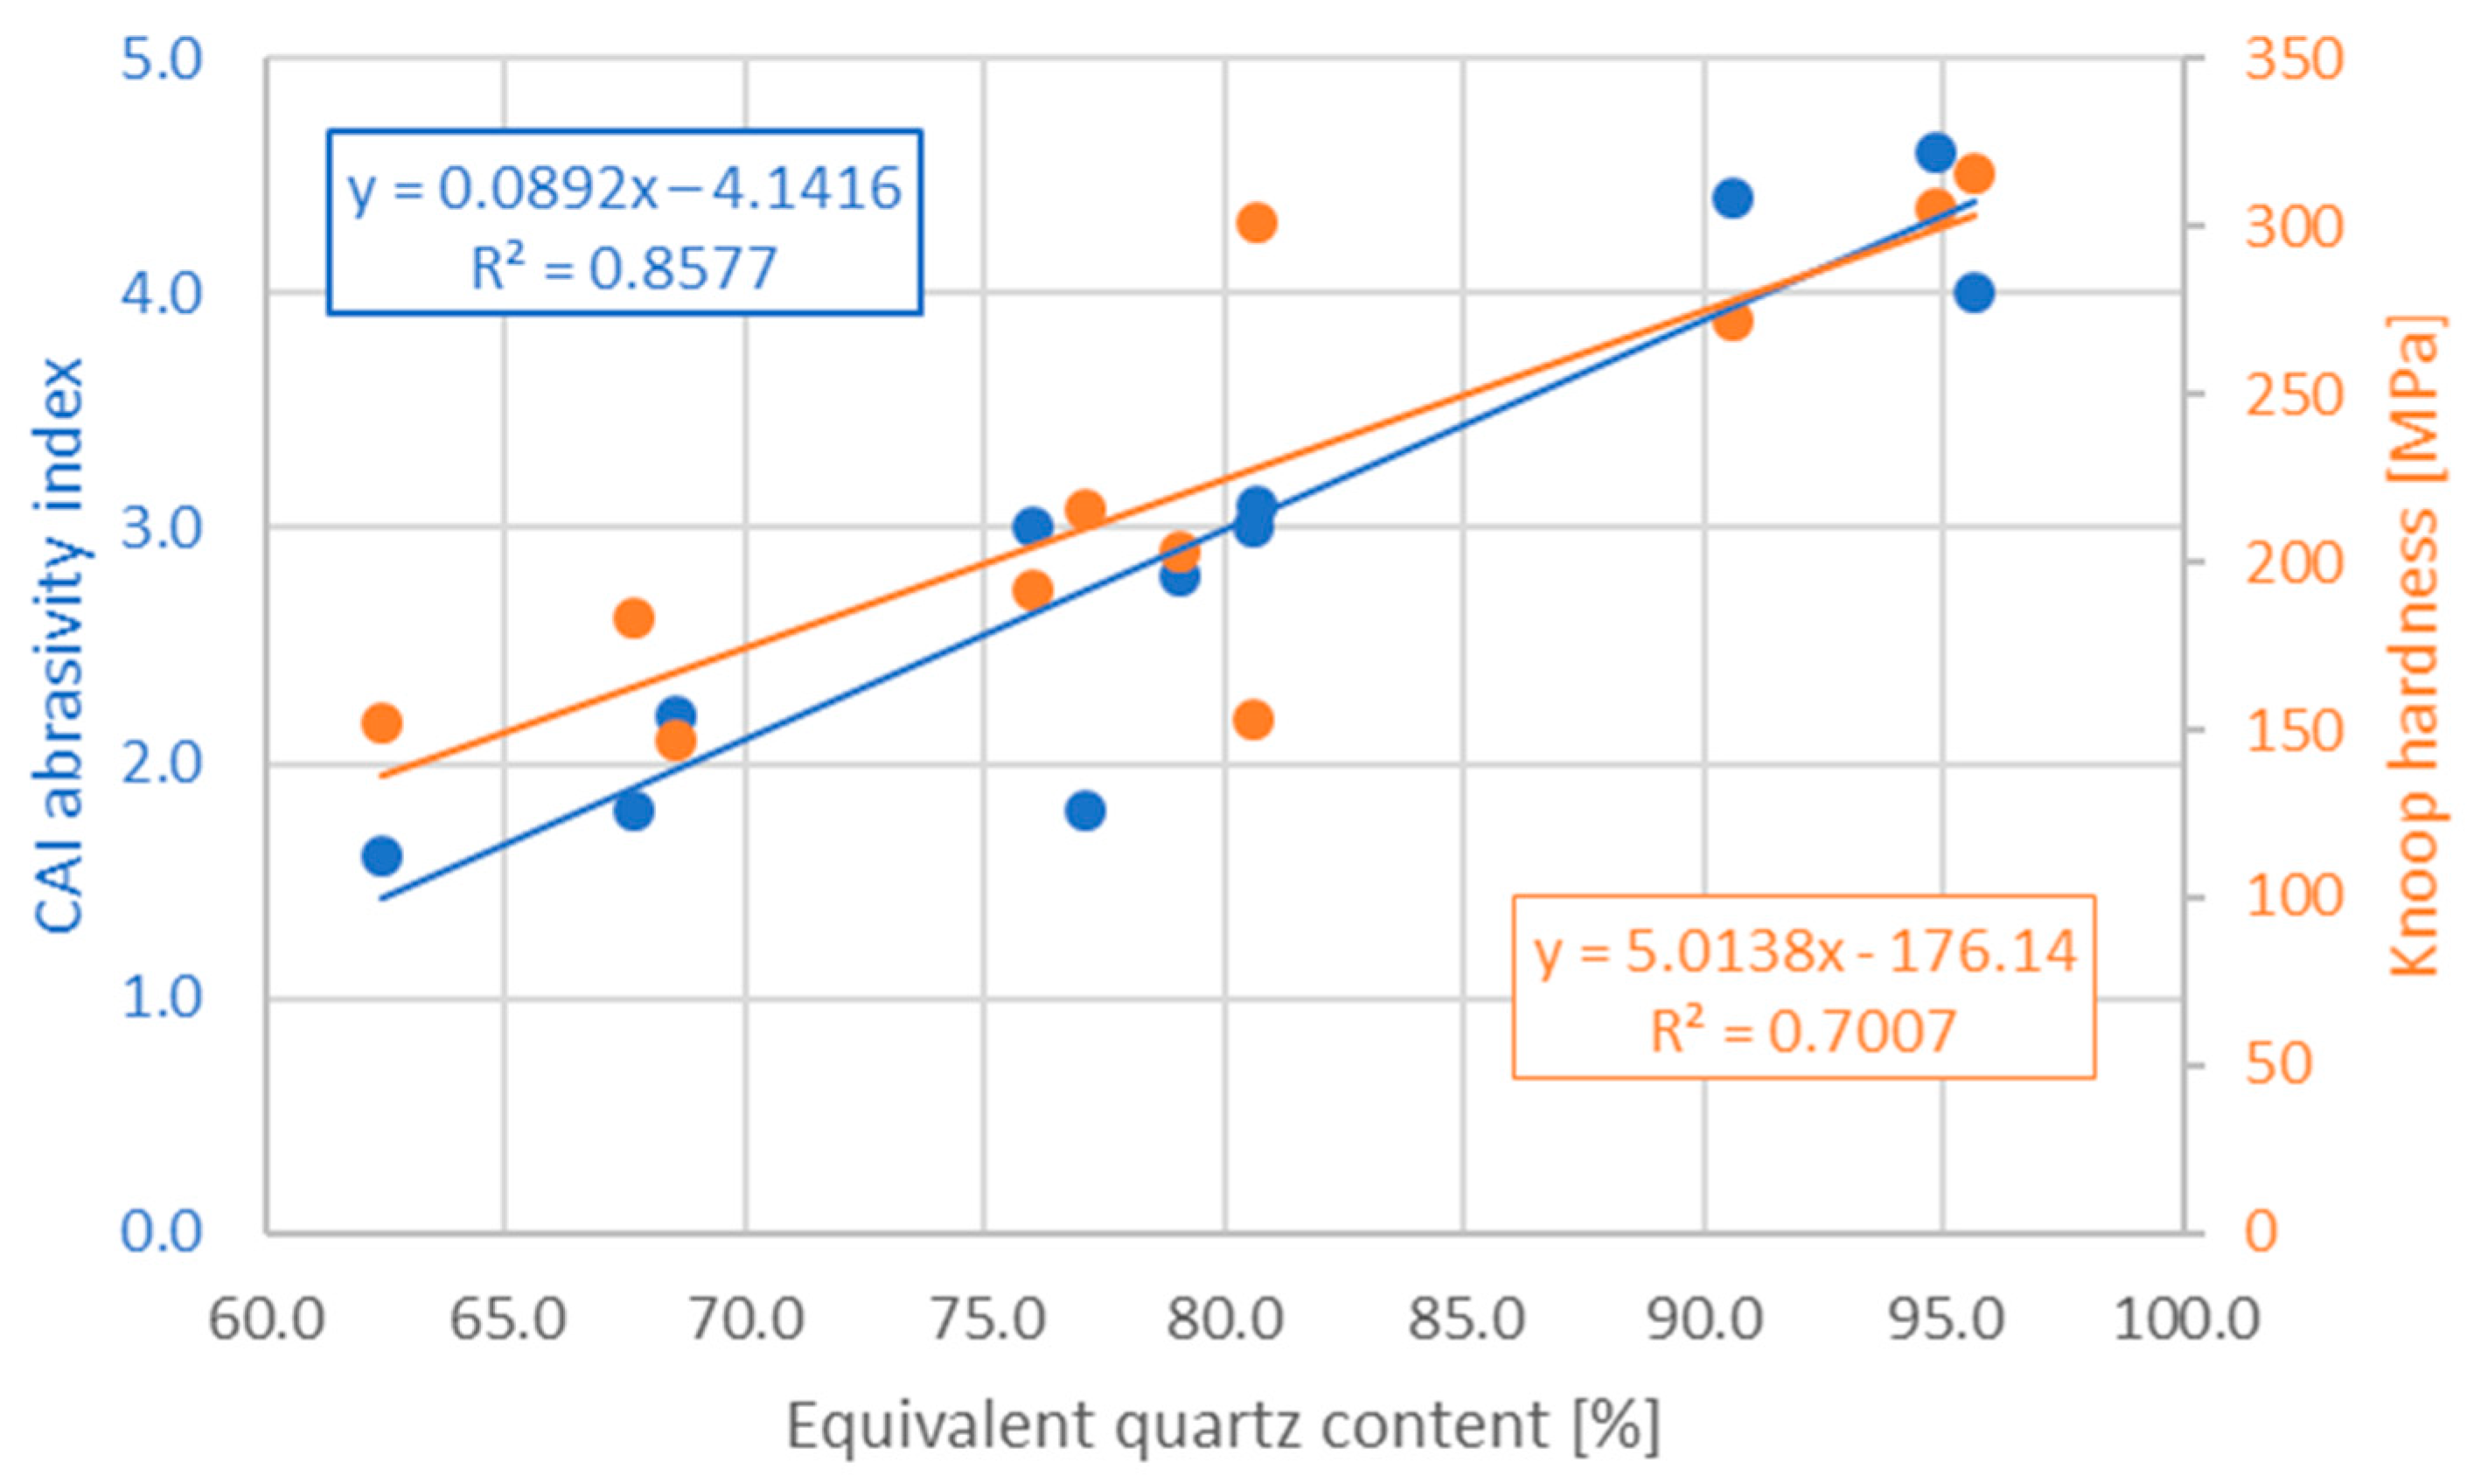
Table 1.
Physical and mechanical properties of the samples (mean, minimum–maximum, and standard deviation).
Table 1.
Physical and mechanical properties of the samples (mean, minimum–maximum, and standard deviation).
| Parameter | Zagnańsk Fm. | Baranów Fm. | Słupiec Fm. |
|---|---|---|---|
| Number of samples | n = 23 | n = 14 | n = 10 |
| Apparent density [Mg/m3] | 2.30 (2.28–2.34) 0.012 | 2.25 (2.22–2.30) 0.024 | 2.20 (2.18–2.21) 0.009 |
| Water absorption [%] | 3.36 (2.79–3.96) 0.258 | 4.33 (3.80–4.68) 0.269 | 6.23 (6.07–6.47) 0.130 |
| Velocity of longitudinal ultrasonic waves [km/s] in dry samples | 3.234 (3.008–3.587) 0.156 | 3.980 (3.808–4.102) 0.081 | 2.618 (2.585–2.676) 0.026 |
| Velocity of longitudinal ultrasonic waves [km/s] in water-saturated samples | 3.832 (3.601–4.024) 0.108 | 4.143 (3.971–4.208) 0.071 | 2.722 (2.687–2.750) 0.021 |
Table 2.
Physical and mechanical properties (mean, minimum–maximum, and standard deviation) of the distinguished lamina varieties.
Table 2.
Physical and mechanical properties (mean, minimum–maximum, and standard deviation) of the distinguished lamina varieties.
| T1 | T2 | T3 | T4 | K1 | K2 | K3 | K4 | B1 | B2 | B3 | |
|---|---|---|---|---|---|---|---|---|---|---|---|
| Velocity of longitudinal ultrasonic waves in dry samples [km/s] | 4.150 4.089–4.252 0.072 | 3.169 2.996–3.268 0.119 | 3.681 3.640–3.735 0.040 | 3.786 3.717–3.983 0.131 | 3.910 3.692–4.084 0.157 | 3.750 3.644–3.836 0.071 | 4.173 3.954–4.304 0.148 | not deter-mined | 2.682 2.584–2.749 0.070 | 2.582 2.468–2.656 0.080 | 2.679 2.661–2.697 0.025 |
| Knoop hardness [MPa] | 305.8 263.5–396.4 25.7 | 146.5 29.5–252.7 46.6 | 192.0 110.3–354.0 48.7 | 202.9 68.2–343.4 76.6 | 315.4 238.9–406.9 44.2 | 153.0 17.6–379.0 95.1 | 271.7 220.4–356.1 31.3 | 301.2 220.8–362.8 34.3 | 216.1 63.5–339.3 70.9 | 183.3 22.3–312.5 88.2 | 152.4 30.0–273.5 58.3 |
| CAI Abrasivity index [-] | 4.6 3.3–5.4 0.90 | 2.2 1.7–2.6 0.35 | 3.0 2.8–3.2 0.16 | 2.8 2.2–3.3 0.48 | 4.0 3.1–4.7 0.69 | 3.0 2.5–3.3 0.37 | 4.4 4.0–4.6 0.26 | 3.1 2.6–3.7 0.59 | 1.8 1.5–2.1 0.28 | 1.8 1.4–2.2 0.39 | 1.6 1.4–1.7 0.14 |
Table 3.
Impact of the share of lamina varieties on the sandstone properties—example from the Zagnańsk Formation (Tumlin-Gród quarry).
Table 3.
Impact of the share of lamina varieties on the sandstone properties—example from the Zagnańsk Formation (Tumlin-Gród quarry).
| Parameter: | Group 1 | Group 2 | Group 3 | |
|---|---|---|---|---|
| Apparent density [g/cm3] | 2.29 | 2.30 | 2.32 | |
| Water absorption [%] | 3.48 | 3.35 | 3.15 | |
| Velocity of longitudinal ultrasonic waves [km/s] | dry state | 3.11 | 3.29 | 3.39 |
| water-saturated | 3.74 | 3.87 | 3.94 | |
| The average share of laminae of different varieties (T1, T2, T3, and T4) in the three sample groups |  | |||
Table 4.
The estimated UCS values calculated for lamina varieties.
| Lamina Variety | UCS1 [MPa] | An Example of Sandstone with Similar Petrographic Properties as the Lamina Variety | |
|---|---|---|---|
| Quarry Name | UCS2 (Mean; Range) [MPa] | ||
| T1 | 170.9–206.8 | Wiśniówka | 185.0; 62.0–309.0 [47] |
| T2 | 67.7–98.4 | Parszów | 94.0; 58.0–122.0 [47] |
| T3 | 102.1–130.2 | Szczytna | 120.4; 105.2–135.6 [48] |
| T4 | 93.5–122.3 | Szczytna | 120.4; 105.2–135.6 [48] |
| K1 | 145.1–175.7 | Wiśniówka | 185.0; 62.0–309.0 [47] |
| K2 | 102.1–130.2 | Parszów | 94.0; 58.0–122.0 [47] |
| K3 | 162.3–196.4 | Szczytna | 120.4; 105.2–135.6 [48] |
| K4 | 106.4–134.2 | Wiśniówka | 185.0; 62.0–309.0 [47] |
| B1 | 50.5–84.1 | Wiśniówka | 185.0; 62.0–309.0 [47] |
| B2 | 50.5–84.1 | Parszów | 94.0; 58.0–122.0 [47] |
| B3 | 41.9–77.0 | Szczytna | 120.4; 105.2–135.6 [48] |
| Calculations of UCS values were performed based on the equations: | |||
| UCS1 = 43.01 ∗ CAI − 26.97 | Majeed and Abu Bakar (2016) [44] | ||
| UCS1 = 39.80 ∗ CAI + 10.83 | Capik and Yilmaz (2017) [45] | ||
| UCS1 = 51.82 ∗ CAI + 31.58 | Teymen (2020) [46] | ||
where UCS1—estimated values of uniaxial compressive strength for lamina variety, CAI—mean values of the CERCHAR abrasivity index obtained in the laboratory (values included in Table 2), UCS2—values of uniaxial compressive strength of sandstones obtained from other publications.
Publisher’s Note: MDPI stays neutral with regard to jurisdictional claims in published maps and institutional affiliations. |
© 2021 by the authors. Licensee MDPI, Basel, Switzerland. This article is an open access article distributed under the terms and conditions of the Creative Commons Attribution (CC BY) license (https://creativecommons.org/licenses/by/4.0/).
Share and Cite
MDPI and ACS Style
Figarska-Warchoł, B.; Rembiś, M. Lamination and Its Impact on the Physical and Mechanical Properties of the Permian and Triassic Terrestrial Sandstones. Resources 2021, 10, 42. https://doi.org/10.3390/resources10050042
AMA Style
Figarska-Warchoł B, Rembiś M. Lamination and Its Impact on the Physical and Mechanical Properties of the Permian and Triassic Terrestrial Sandstones. Resources. 2021; 10(5):42. https://doi.org/10.3390/resources10050042
Chicago/Turabian StyleFigarska-Warchoł, Beata, and Marek Rembiś. 2021. "Lamination and Its Impact on the Physical and Mechanical Properties of the Permian and Triassic Terrestrial Sandstones" Resources 10, no. 5: 42. https://doi.org/10.3390/resources10050042
Note that from the first issue of 2016, this journal uses article numbers instead of page numbers. See further details here.