Article

Geometric Optimization of an Extracorporeal Centrifugal Blood Pump with an Unshrouded Impeller Concerning Both Hydraulic Performance and Shear Stress

1
State Key Laboratory of Hydro Science and Engineering, Department of Energy and Power Engineering, Tsinghua University, Beijing 100084, China
2
Zhejiang Qingke Pumping Medical Technology Limited, Taizhou 318010, China
3
School of Clinical Medicine, Tsinghua University, Beijing 100084, China
*
Authors to whom correspondence should be addressed.
These authors contributed equally to this work.
Processes 2021, 9(7), 1211; https://doi.org/10.3390/pr9071211
Submission received: 31 May 2021 / Revised: 11 July 2021 / Accepted: 13 July 2021 / Published: 15 July 2021

Abstract

:
Centrifugal blood pumps have provided a powerful artificial support system for patients with vascular diseases. In the design process, geometrical optimization is usually needed to acquire a more biocompatible model for clinical uses. In the current paper, we propose a method for multi-objective optimization concerning both the hydraulic and the hemolytic performances of the pump based on the near-orthogonal array in which the traditional hemolysis index (HI) is replaced with the maximum scalar shear stress criteria to reduce the computation load. The method is demonstrated with the optimization of an extracorporeal centrifugal blood pump with an unshrouded impeller. CFD studies on the original and nine modified pump models are carried out. The calculated hydraulic performances of the optimized model are also compared against the experiments for validation of the numeric method, with an error of 3.6% at the original design point. The resulting blood pump with low maximum scalar shear stress (132.2 Pa) shows a low degree of calculated HI (1.69 × 10⁻³).

1. Introduction

Blood pumps containing rotating impellers have been widely used to provide or assist the blood recirculation in clinical applications, including the intraoperative extracorporeal circulation, the extracorporeal membrane oxygenation (ECMO), and the left ventricular assist devices (LVAD). The prevailing products in these fields adopt centrifugal impellers, such as Rotaflow (Maquet, Jostra Medizintechnik AG, Hirrlingen, Germany) and Heartmate 3 (St. Jude Medical, Inc., Pleasanton, CA, USA), and are characterized by lower rotating speeds compared with their axial counterparts.
Although centrifugal blood pumps show great potential as a life-saving technology, a relatively high risk of postoperative complications induced by hemolysis or thromboembolism of the patients has been reported [1,2]. In August 2018, the Food and Drug Administration of USA has issued warnings of these problems in that 28.7% and 12.1% of patients with the HeartWare HVAD and Heartmate II experienced one or more strokes over 2 years [3], while only 0.24% of the general population in the USA suffered from strokes [4]. Similar to implanted assist devices, extracorporeal circulatory systems including Rotaflow and Centrimag (Abbott, Abbott Park, IL, USA) have also demonstrated to have an unacceptably high rate of neurologic events of 24% as reported by Lorts et al. [1], which is mainly induced by the occurrence of hemolysis and thromboembolism. Therefore, the improvement of centrifugal blood pumps is still expected, reducing the incidence of hemolysis, thromboembolism, and other health hazards.
In the clinical practice of blood pumps, hemolysis is often recognized as one of the most severe complications because the coagulation can be temporarily controlled by the anticoagulant drugs. Many factors have been found to be related to hemolysis, including pump surface materials [5,6,7], operative environments [8], and pre-existing illnesses of patients [9,10]. Still, the most essential and fundamental cause of blood cell damage is the excessive mechanical stresses exerted on the blood cells [11].
Current studies on the optimization of the centrifugal blood pumps have considered both the hydraulic and the hemolytic performances simultaneously to avoid such fluid dynamics issues by introducing subtle design variations and optimizing pump components such as impeller and volute geometries. Investigations have shown that the hydraulic and hemolytic performances of the blood pump are better when the blade wrap angle is between 100–140° [12,13,14,15]. As for blade outlet angle, research shows that when the outlet angle is 15–35°, the comprehensive performance of the blood pump is superior [16]. The recommended number of blades N of the centrifugal impeller of the blood pump is 4–7 [16,17]. It is found that when the blade outlet width is about 4 mm, the hydraulic performance of the blood pump (D2 = 31 mm) is higher [16]. Wu et al. have studied the blade tip clearance of a semi-open centrifugal pump (impeller diameter D2 = 46 mm, N = 6) and the recommended clearance value is 0.1 mm [18], while the same parameter is studied by Kim et al. in another centrifugal impeller (D2 = 23 mm, N = 6) and the clearance of 0.05 mm displayed better hemolytic performance [19]. Aka et al. [20] found that the pump with a 20° tongue angle achieved a relatively high hydrodynamic performance and a low blood damage risk.
The above studies have confirmed that many geometric parameters have significant impacts on the hydraulic and the hemolytic performances. Although CFD simulation has become a handy and effective tool in the optimal design, the heavy computation load limits the use of optimization in the engineering field. Therefore, it is necessary to develop an efficient and accurate method for multi-objective optimization.
This paper presents an optimization method based on the near-orthogonal array concerning both the hydraulic and the hemolytic performances of the centrifugal blood pump by varying multiple geometric parameters. The maximum scalar shear stress is used as the optimization objective instead of the hemolysis index calculated by volume or streamline integral. Further CFD studies of the original and nine modified pump models are carried out.

2. Materials and Methods

In this section, the methodologies and processing procedures used in the current study are described in detail. Firstly, the hydraulic design process of our centrifugal blood pump is introduced by considering both the physiological criteria and the hydraulic efficiency. Secondly, according to the proposed optimization process, our designed centrifugal blood pumps are modified based on an original pump by changing the blade wrap angle θw and volute tongue angle θt. Thirdly, a simplified hemolysis criterion is additionally adopted in this study in terms of the maximum scalar shear stress (SSS). Finally, the appropriate numerical modeling and boundary conditions are detailed.
The local ethical committee of Tsinghua University waived the need for formal approval since the study did not involve any human or animal participants.

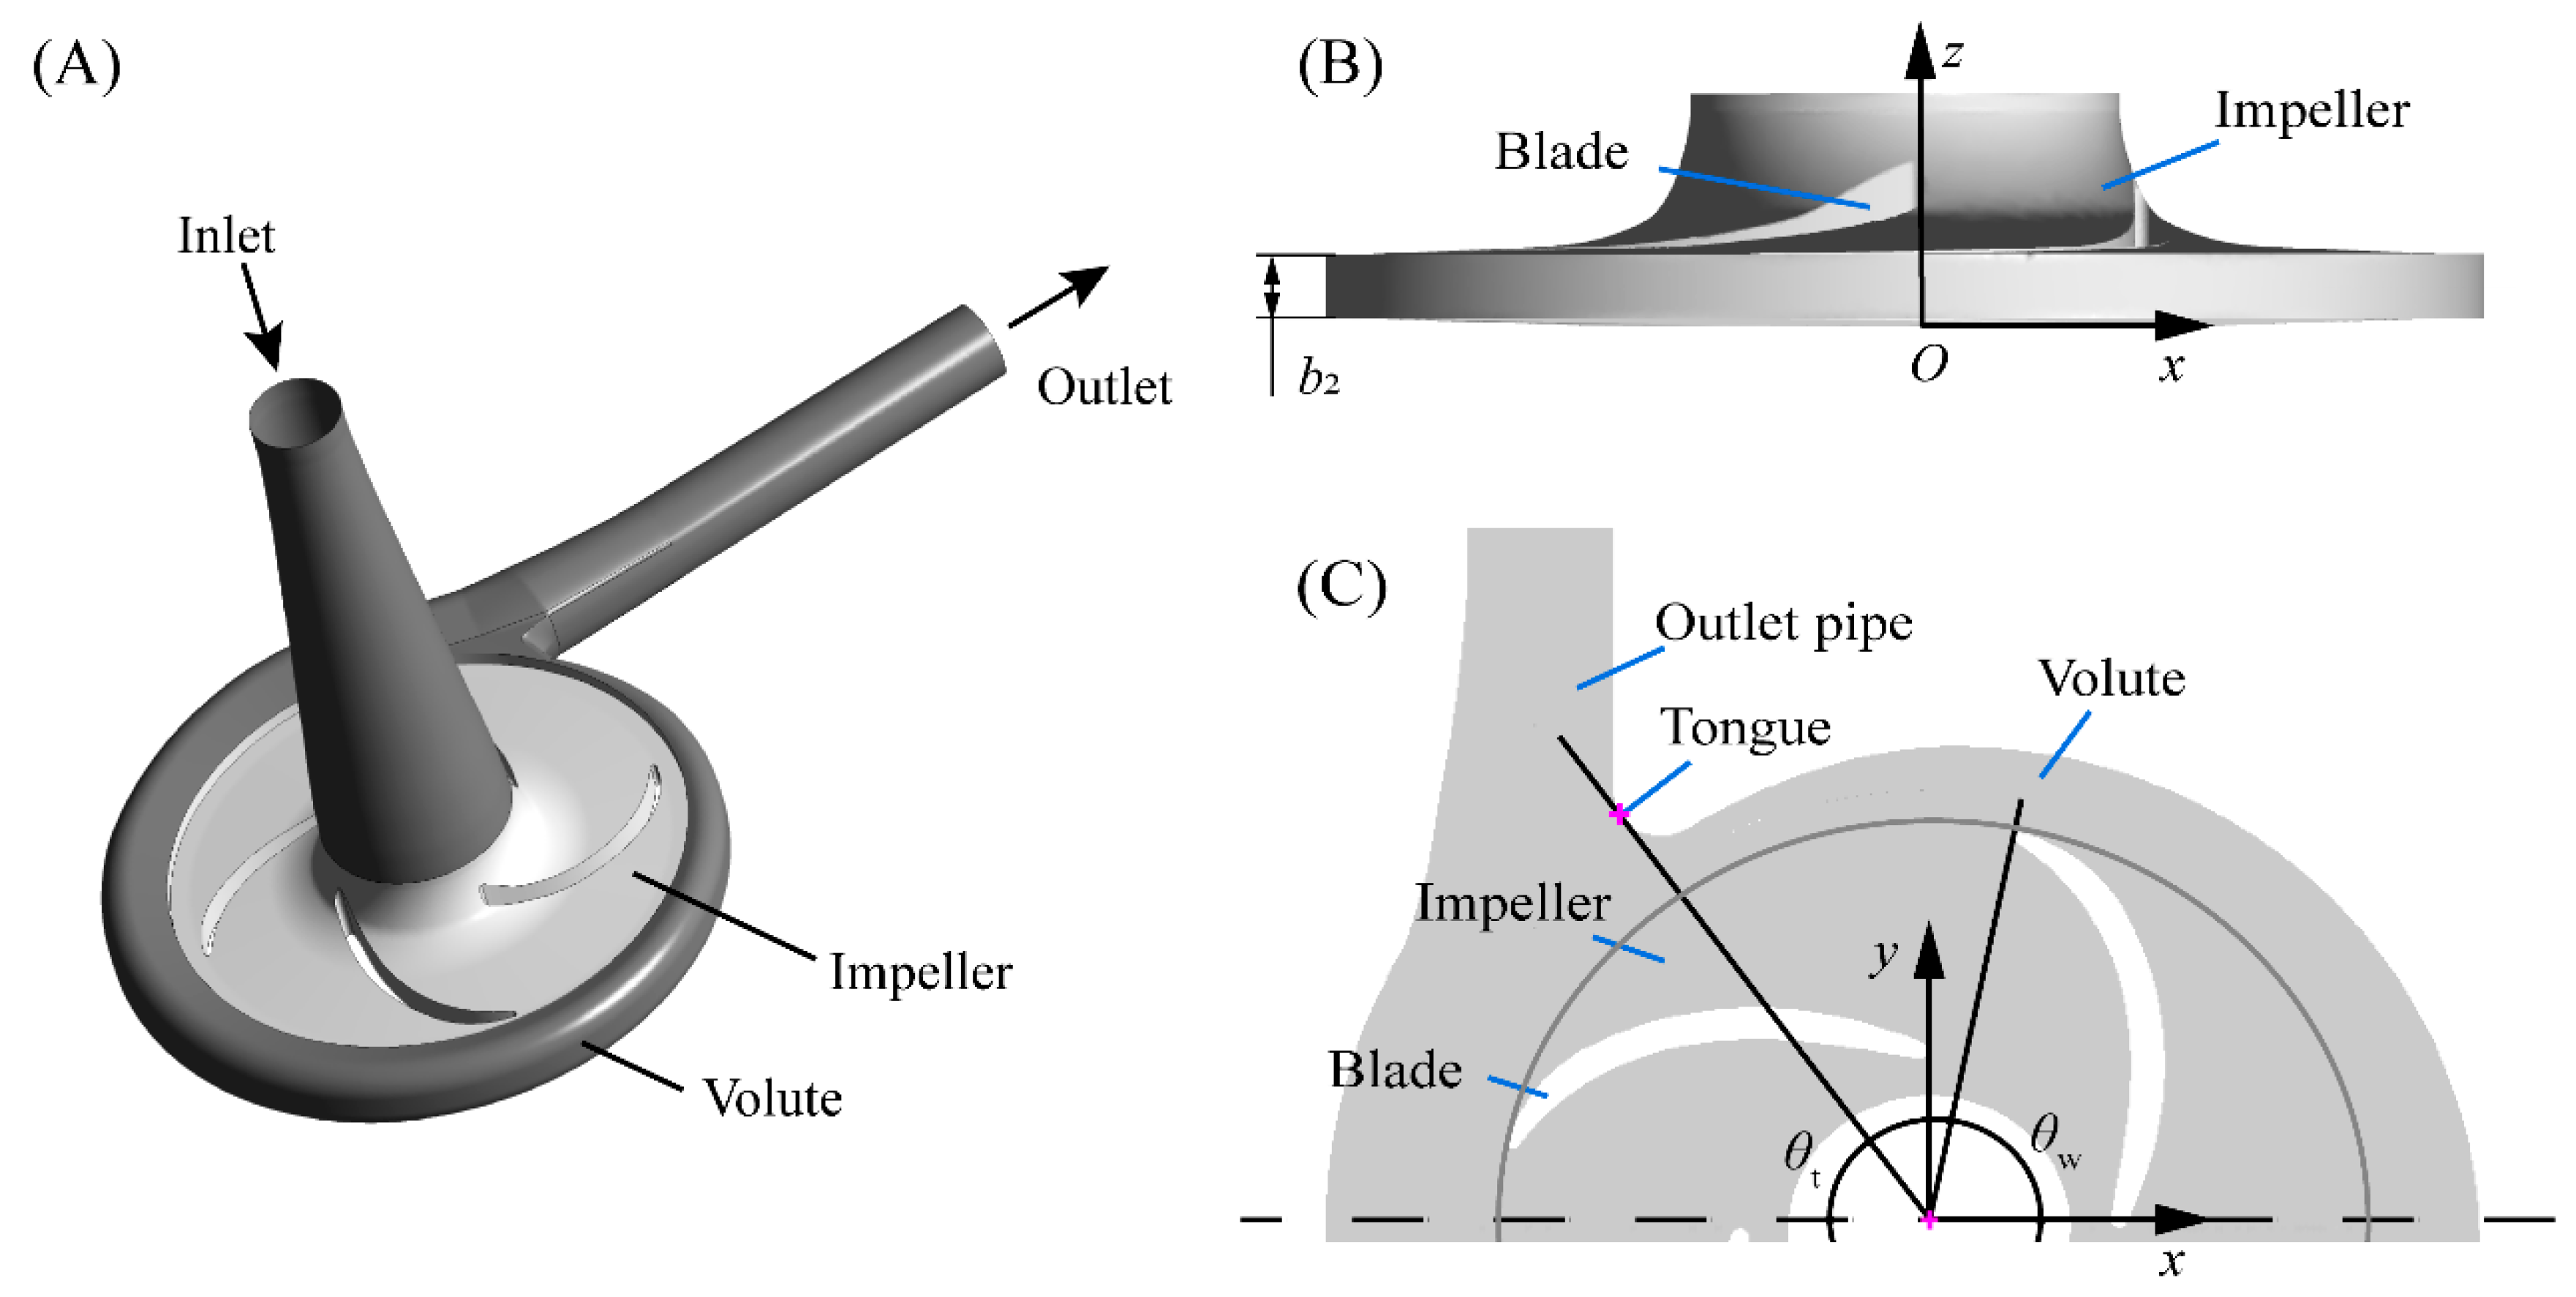
2.1. Original Pump Design

Generally, a healthy adult requires a blood flow rate of 4–6 L/min and has an averaged blood pressure of 80–120 mmHg (1.1–1.6 mH2O) [21,22] based on which the hydraulic performance of a blood pump is usually decided preliminarily. Considering the losses in the filter and the cannula in the extracorporeal membrane oxygenation (ECMO) system [21,22], a design operation point with a pressure head H = 140 mmHg (1.9 mH2O) and a flow rate of Q0 = 5 L/min (8.3 × 10⁻⁵ m3/s) is chosen.
As for the rotating speed, a large rotating speed results in small volume and high efficiency but also high shear stresses in the blood flows. It is noted that several commercial centrifugal blood pumps work between 2000–3000 r/min at the above physiological operation condition [23,24]. Therefore, an average rotating speed of n = 2500 r/min is chosen as the design point in the present research. The outlet diameter of the pump impeller is determined as ~50 mm. Note that a relatively flat H-Q performance curve is favorable for blood pressure control by adjusting the pump rotating speed during clinical practice [25].
The specific speed, which roughly indicates the hydraulic features, configuration, and impeller shape of the pump, can be calculated as the following:
n s = n Q 0 H 3 / 4 = 14.1   m 3 4 / s 3 2
where n denotes the rotating speed (r/min) and Q0 and H denotes the flow rate (m3/s) and the head (m) at the design point, respectively. Note that this relatively low value of ns = 14.1 (<30) for a centrifugal blood pump can cause a high disk fraction loss and narrow impeller passage if the classical design method based on the one-dimensional flow analysis is applied [26]. For a blood pump with relatively small dimensions, a narrow impeller passage can be difficult to manufacture. In order to improve the hydraulic efficiency and manufacturing feasibility of the blood pump, we adopt a specific design approach as described in Ni et al. [27]. The main principles are briefly introduced as follows. A larger specific speed for the design operation point ns = 15.4 is firstly achieved by shifting the design flow rate Q0 to 1.2Q0 = 6 L/min, based on which a classical hydraulic design is performed. As a result, the width of the impeller passage becomes larger. Even the resulting pump is required to work at a part-load condition relative to the new design condition, it still has a smaller disk fraction loss, i.e., a higher hydraulic efficiency. By following this design approach, we derived the hydraulic components for the original pump (shown in Figure 1A with a hydraulic efficiency over 80% at Q0 = 5 L/min, as calculated in Section 3.1 and for which the major parameters are listed in Table 1).

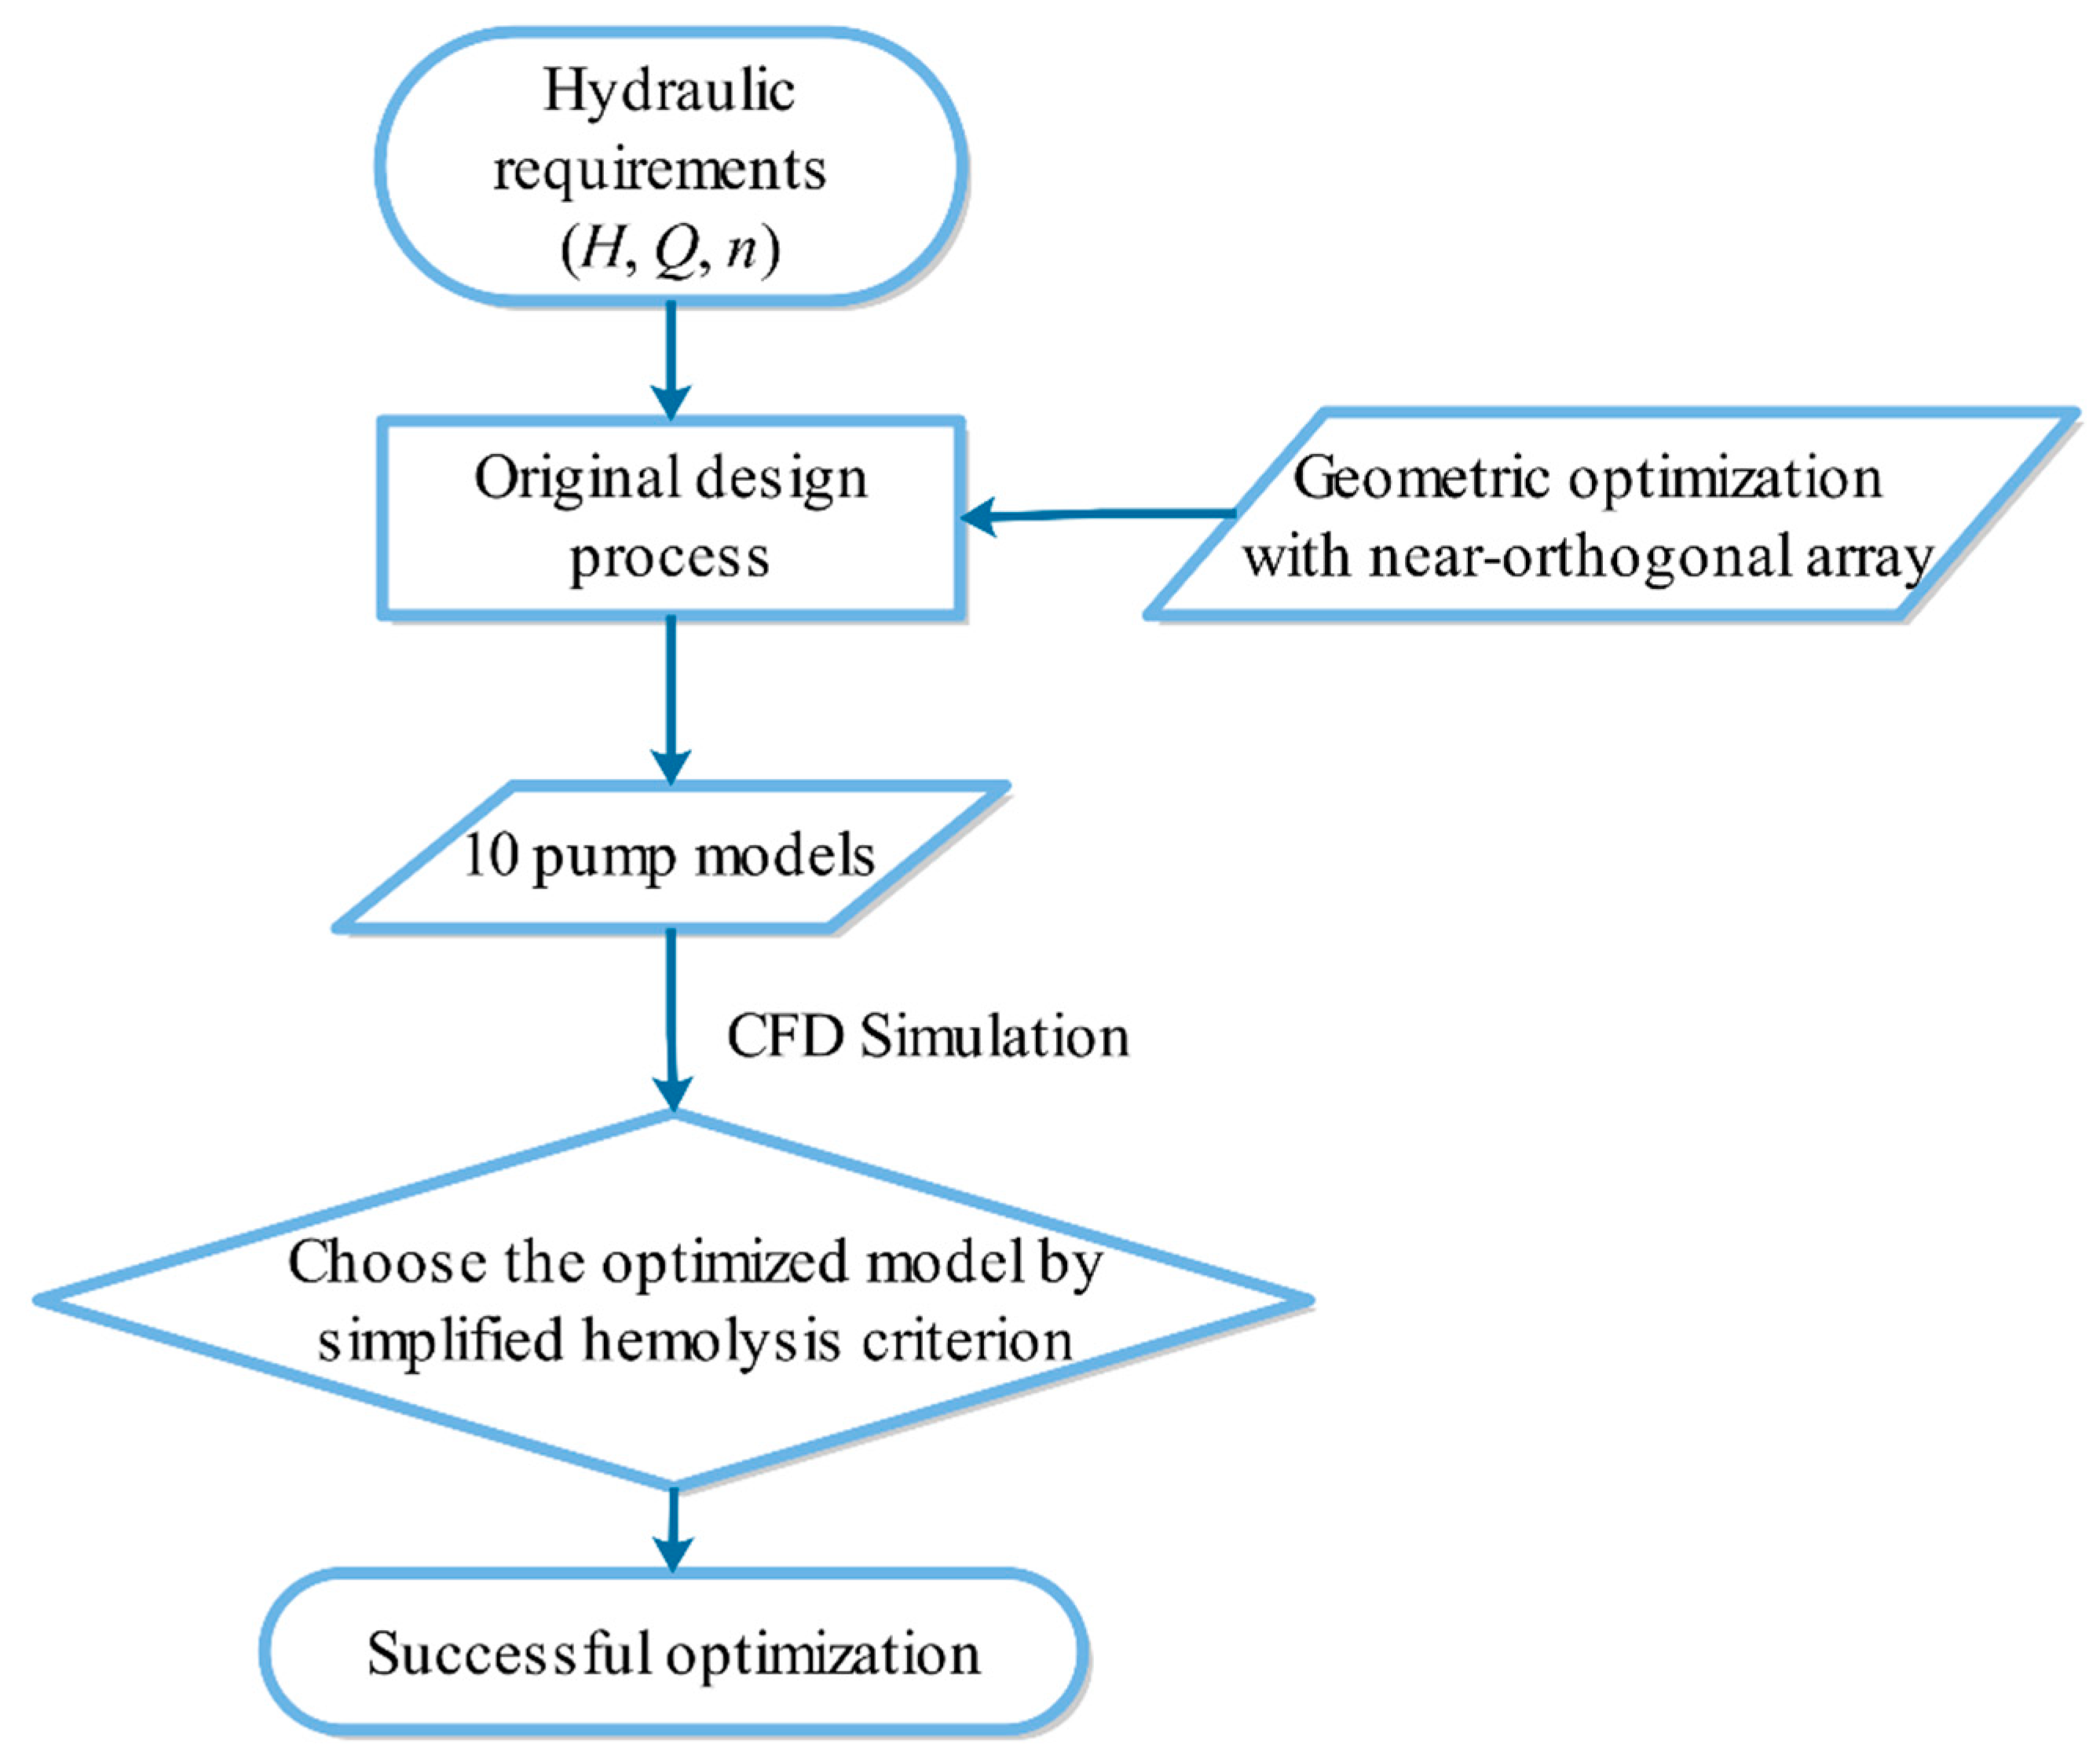
2.2. Optimization Strategy

Since the hemolytic performance of the original blood pump has not been taken into consideration during the design procedure, a multi-objective optimization of the pump geometric parameters based on a near-orthogonal array is conducted to derive an optimized pump with good hydraulic and hemolytic performances. The optimal objective function f (H, 1/τ) is a function of the hydraulic performance (head H) of the blood pump and the simplified hemolysis performance (maximum scalar shear stress τ). Due to the complex implicit relation between the hydraulic performance and hemolysis performance of the blood pump, the specific formula of the objective function cannot be provided in the present paper. However, it is clear that the maximum value of the objective function (i.e., the maximum value of H and the minimum value of τ) represents the optimization design. In order to find this value, we adopt the near-orthogonal optimization scheme. The optimization objectives are described in Section 2.2.1 and the selections of the optimization levels and factors are introduced in Section 2.2.2. Figure 2 shows the flow chart of our optimization procedure. We first select the better hydraulic performance designs in the sufficient initial design samples and then search for the best optimization design of maximum SSS in these designs.

2.2.1. Optimization Objectives

The first objective is the hydraulic performance of the pump, which is evaluated by the head pressure at the original design point (Q0 = 5.0 L/min and n = 2500 r/min). The second objective is the hemolytic performance of the pump. A commonly held hypothesis relative to hemolysis is that red blood cells are deformed and fragmented when undergoing flow shear stresses in the mechanical components over a certain length of residence time. For example, when exposed to a 10 Pa flow shear stress, no obvious rupture of red blood cells occurs even over 4 min [28]. However, with a 400–560 Pa shear stress, red blood cells rupture rapidly within 10−4–10−3 s [29]. The increased shear stress τ and the exposure time t are the major factors responsible for the hemolysis. The identification of hemolysis is usually standardized by the hemolysis index D, a ratio of the plasma-free hemoglobin released by the damaged cells to the total hemoglobin mass [30]. A power-law correlation in terms of the shear stress τ and the exposure time t, which is proposed by Giersiepen et al. [30], is widely used for its evaluation and is defined as the following:
D = d H b H b × 100 % = C τ β t α ,
where dHb is the plasma-free hemoglobin released by the damaged red blood cells and Hb is the total hemoglobin mass. The scalar shear stress (SSS) τ is obtained based on the method proposed by Bludszuweit [31], which is described as follows:
τ = [ 1 6 i j ( τ i i τ j j ) 2 + i j τ i j 2 ] 1 2 ,
τ i j = μ ( u i x j + u j x i ) ,
where τij is the viscous stress tensor and ui (i = 1, 2, 3) are the Cartesian components of the instantaneous velocity field. Particularly, the stress tensors τij here include only the viscous stress tensors rather than the Reynolds stress because the latter is a statistical term and not a physical property causing hemolysis [32,33,34]. Constants α, β, and C in Equation (2) are usually determined by the regression analysis of the experimental data. The values suggested by Heuser and Opitz [35] (α = 0.765, β = 1.991 and C = 1.8 × 10⁻⁶) are chosen in this paper since they have been reported with a lower evaluation error compared to values in other research [34].
Generally, hemolysis models are not combined in commercial software due to the lack of confidence in the currently existing hemolysis models. There are two computational methods that designers often implement to predict the hemolysis in flows by the above correlation: the Eulerian and Lagrangian approaches [16,34]. In the Eulerian approach, the hemolysis index is integrated over the entire computational flow domain, whereas in the Lagrangian formulation, the integration is performed along the flow path lines. Both approaches use Equation (2) for integration. For these two approaches, the calculation results have been reported as well correlated with the experiments [34], but the calculation procedure is always time-consuming and induces obstacles for the rapid screening of optimization in engineering applications. Hence, we propose a reliable and simplified criterion, i.e., the maximum scalar shear stress value to replace the hemolysis index for a more concise and efficient optimization procedure and the justification is presented below.
If the flow field is smooth with no strong vortices, each red blood cell spends roughly the same amount of residence time passing through the blood pump from the inlet to the outlet. This assumption could be verified by the Lagrangian approach by calculating the exposure time of flow path lines in each pump model. The average exposure time of blood for the 10 pumps is about 0.4 s in our research at the original design point for Q0 = 5.0 L/min and n = 2500 r/min. That is, the critical high shear stress is the dominant factor affecting hemolysis in terms of our 10 varied pumps. Hence, it is reasonable to choose the maximum scalar shear stress as the optimization objective instead of the hemolysis index.

2.2.2. Optimization Factors and Levels

As mentioned in the introduction section, many geometric parameters are of great significance to the hydraulic and hemolytic performances of the blood pump. In our study, the external geometries of the origin pump have been fixed and thus we choose two alterable parameters: The wrap angle θw and tongue angle θt as the optimization factors to verify the effectiveness of the optimization method. Other significant geometric parameters remain to be studied in the future. These two geometric parameters are defined in Figure 1C. An L10 near-orthogonal array is applied for this purpose. The curved blade could result in higher efficiency and less vortical structures than the straight blade [17], while the over-curved blade increases the contact area between the surface and the blood, carrying additional friction loss and coagulation risk. Thus, a θw range from 60° to 100° with a 10° increment is chosen. According to the recommended values of θt by Wong et al. and Aka et al., two values (30° and 55°) are chosen with respect to commercial blood pumps (Rotaflow and CentriMag). The selected optimization factors and levels are listed in Table 2, in which model No. 4 is the original pump model.

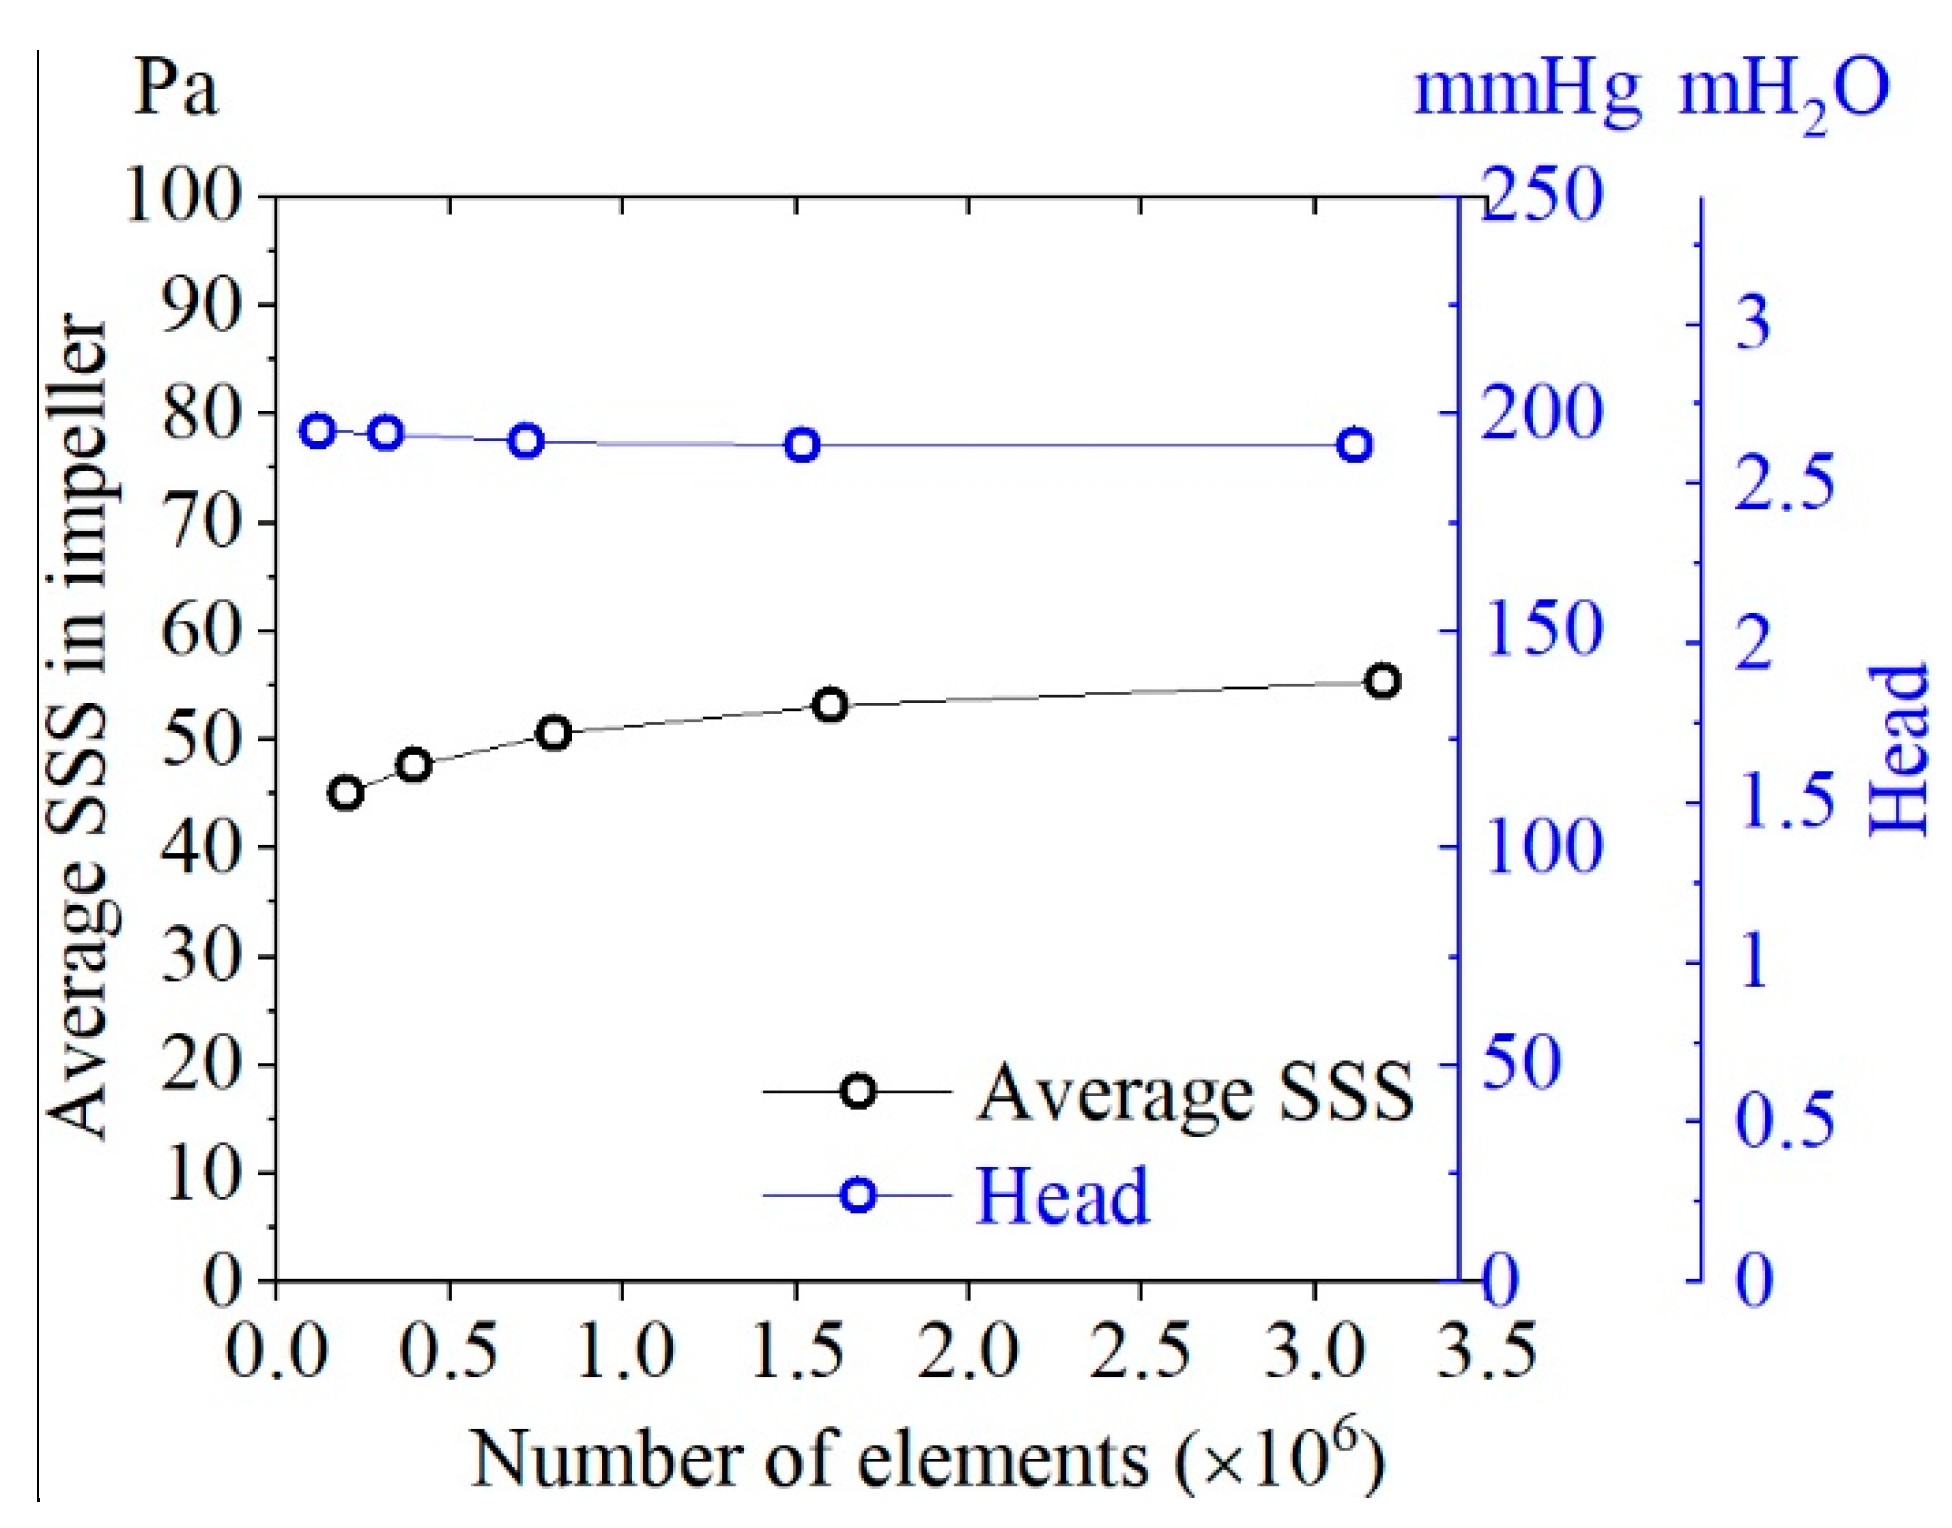
2.3. Computational Model

Numerical simulations are carried out to assess both hydraulic and hemolytic performances for the 10 pumps. Although it is known that blood exhibits non-Newtonian fluid behavior under a low shear rate, it is reasonable to use the Newtonian fluid model because the blood viscosity is close to a constant for high shear rates (>100 s−1), while shear rates in typical rotary blood pumps are relatively higher than 100 s−1 [36]. According to the Cross model, the governing equation for blood viscosity is given as the following:
μ = μ + ( μ 0 μ ) 1 1 + ( λ γ ) n ,
where μ = 0.00345 Pa·s is the high-shear viscosity, μ0 = 0.056 Pa·s is the low-shear viscosity, λ = 1.007 s is the time constant, and n = 1.028 is the power-law index [37]. Equation (5) shows that the blood viscosity maintains a constant for high shear rates (>150 s−1) within a deviation of 8.7%, while shear rates in about 90% of flow passages of the blood pumps are higher than 150 s−1, as calculated in Section 3.3. Previous studies have also reported a small variation of the predicted hydraulic performances by using the Newtonian and non-Newtonian models of blood (maximum deviations of flow rate from experimental data of 6.1% and 3.5%, respectively) [17]. Therefore, it is reasonable to apply the Newtonian fluid model to the calculation of hydraulic performances and shear stresses. The working fluid properties in our simulation are set as density 1060 kg/m3 and viscosity as 0.0035 Pa·s, as recommended by Fraser [38].
A commercial CFD software, ANSYS-CFX 19.2, was applied in 3D flow simulations in the pump to solve the incompressible steady Navier–Stokes equations. Referring to the discussions on the influence of turbulence models on the simulation accuracy of the hydraulic performances by Kannojiya et al. [39], the k-ε model is applied in this study by considering the computational effort. The turbulent intensity is assumed to be 5% (calculated using turbulence intensity = 0.16Re−1/8) [40] at the inlet boundary. The inlet boundary condition is given by the total mass flow rate and the outlet is set to open with the boundary velocity parallel to the outer normal vector. A rotating frame of reference is adopted for the impeller area with no-slip boundary conditions, while the volute is the stationary element of the pump. Each part is discretized separately into tetrahedral meshes and is connected through the relative interface. CFD-Post 19.2 is implemented for the post-processing of the results. The skewness of 97% grids is over 0.8, indicating a reasonable grid quality. The average value of the layer grids y+ ranges from 82 to 100, satisfying the requirements of the selected turbulence model for boundary meshes.
Grid independence tests have been performed for all the pump models regarding the hydraulic performances and the averaged scalar shear stresses. For example, the corresponding results of model No. 4 are shown in Figure 3. It is observed that the head and average scalar shear stresses become almost constant with the number of the elements greater than 1.6 × 10⁶. Similar conclusions can be derived for other pumps. Therefore, the mesh systems with about 1.6 × 10⁶ grids are chosen for the following investigations.

3. Results and Discussion

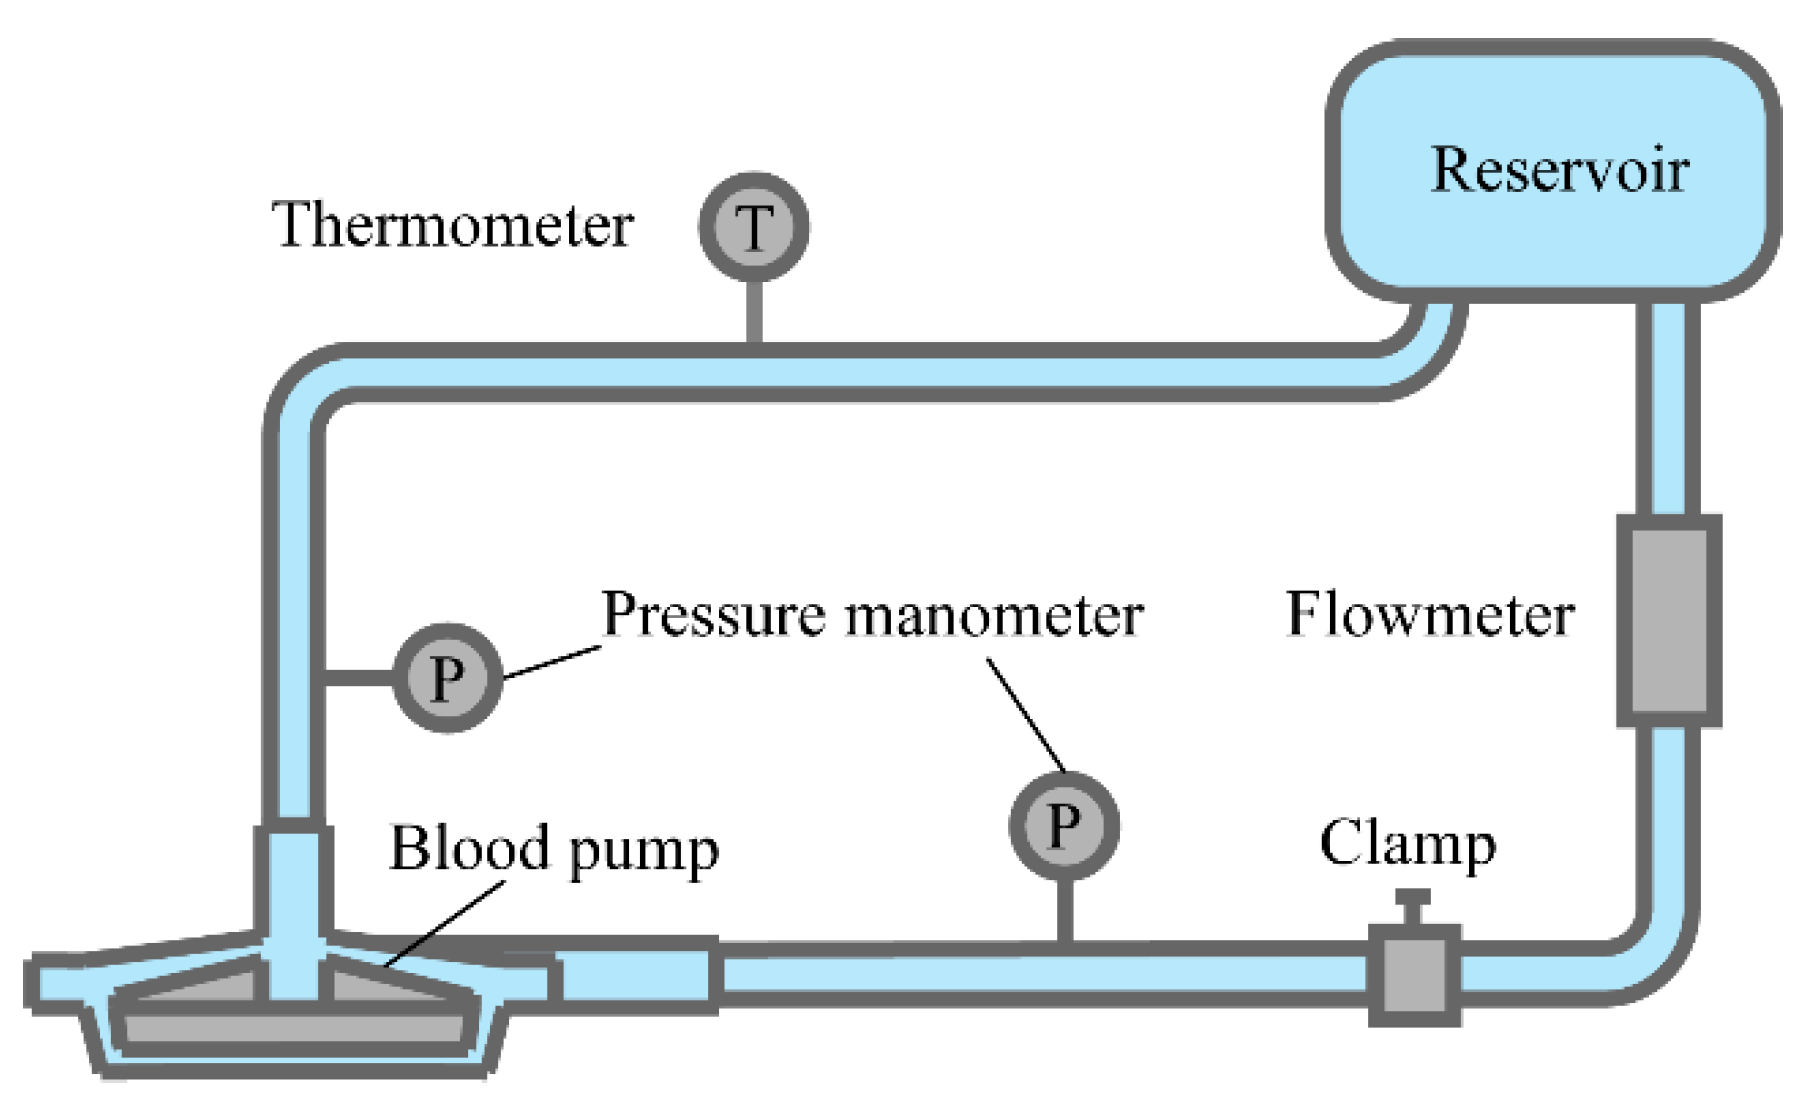
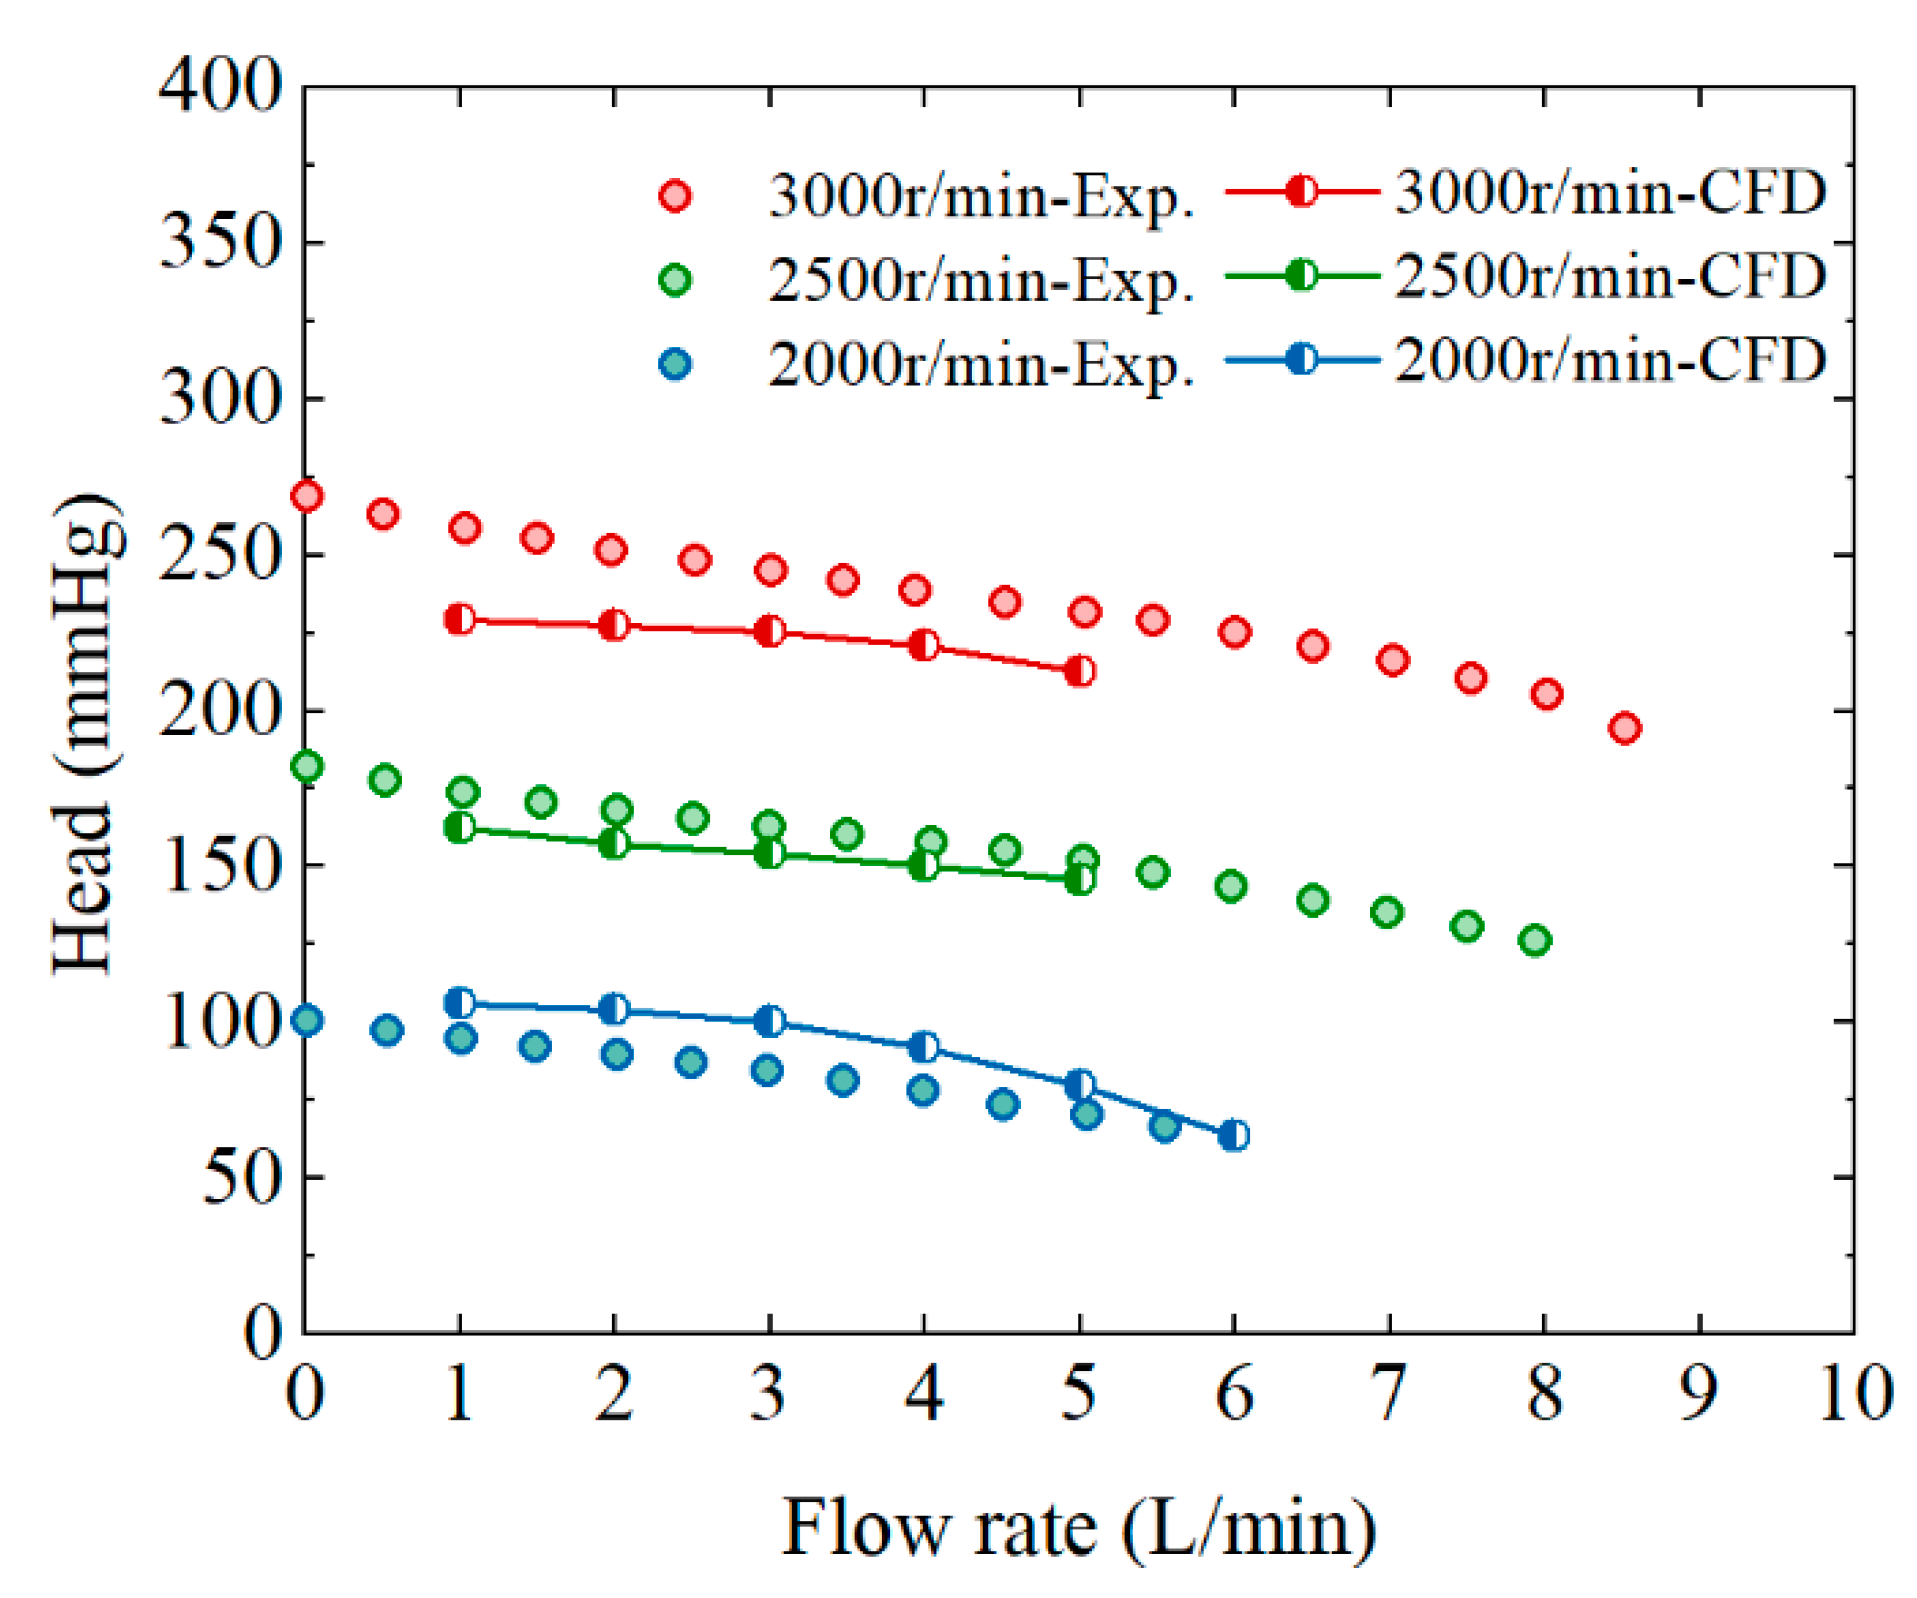
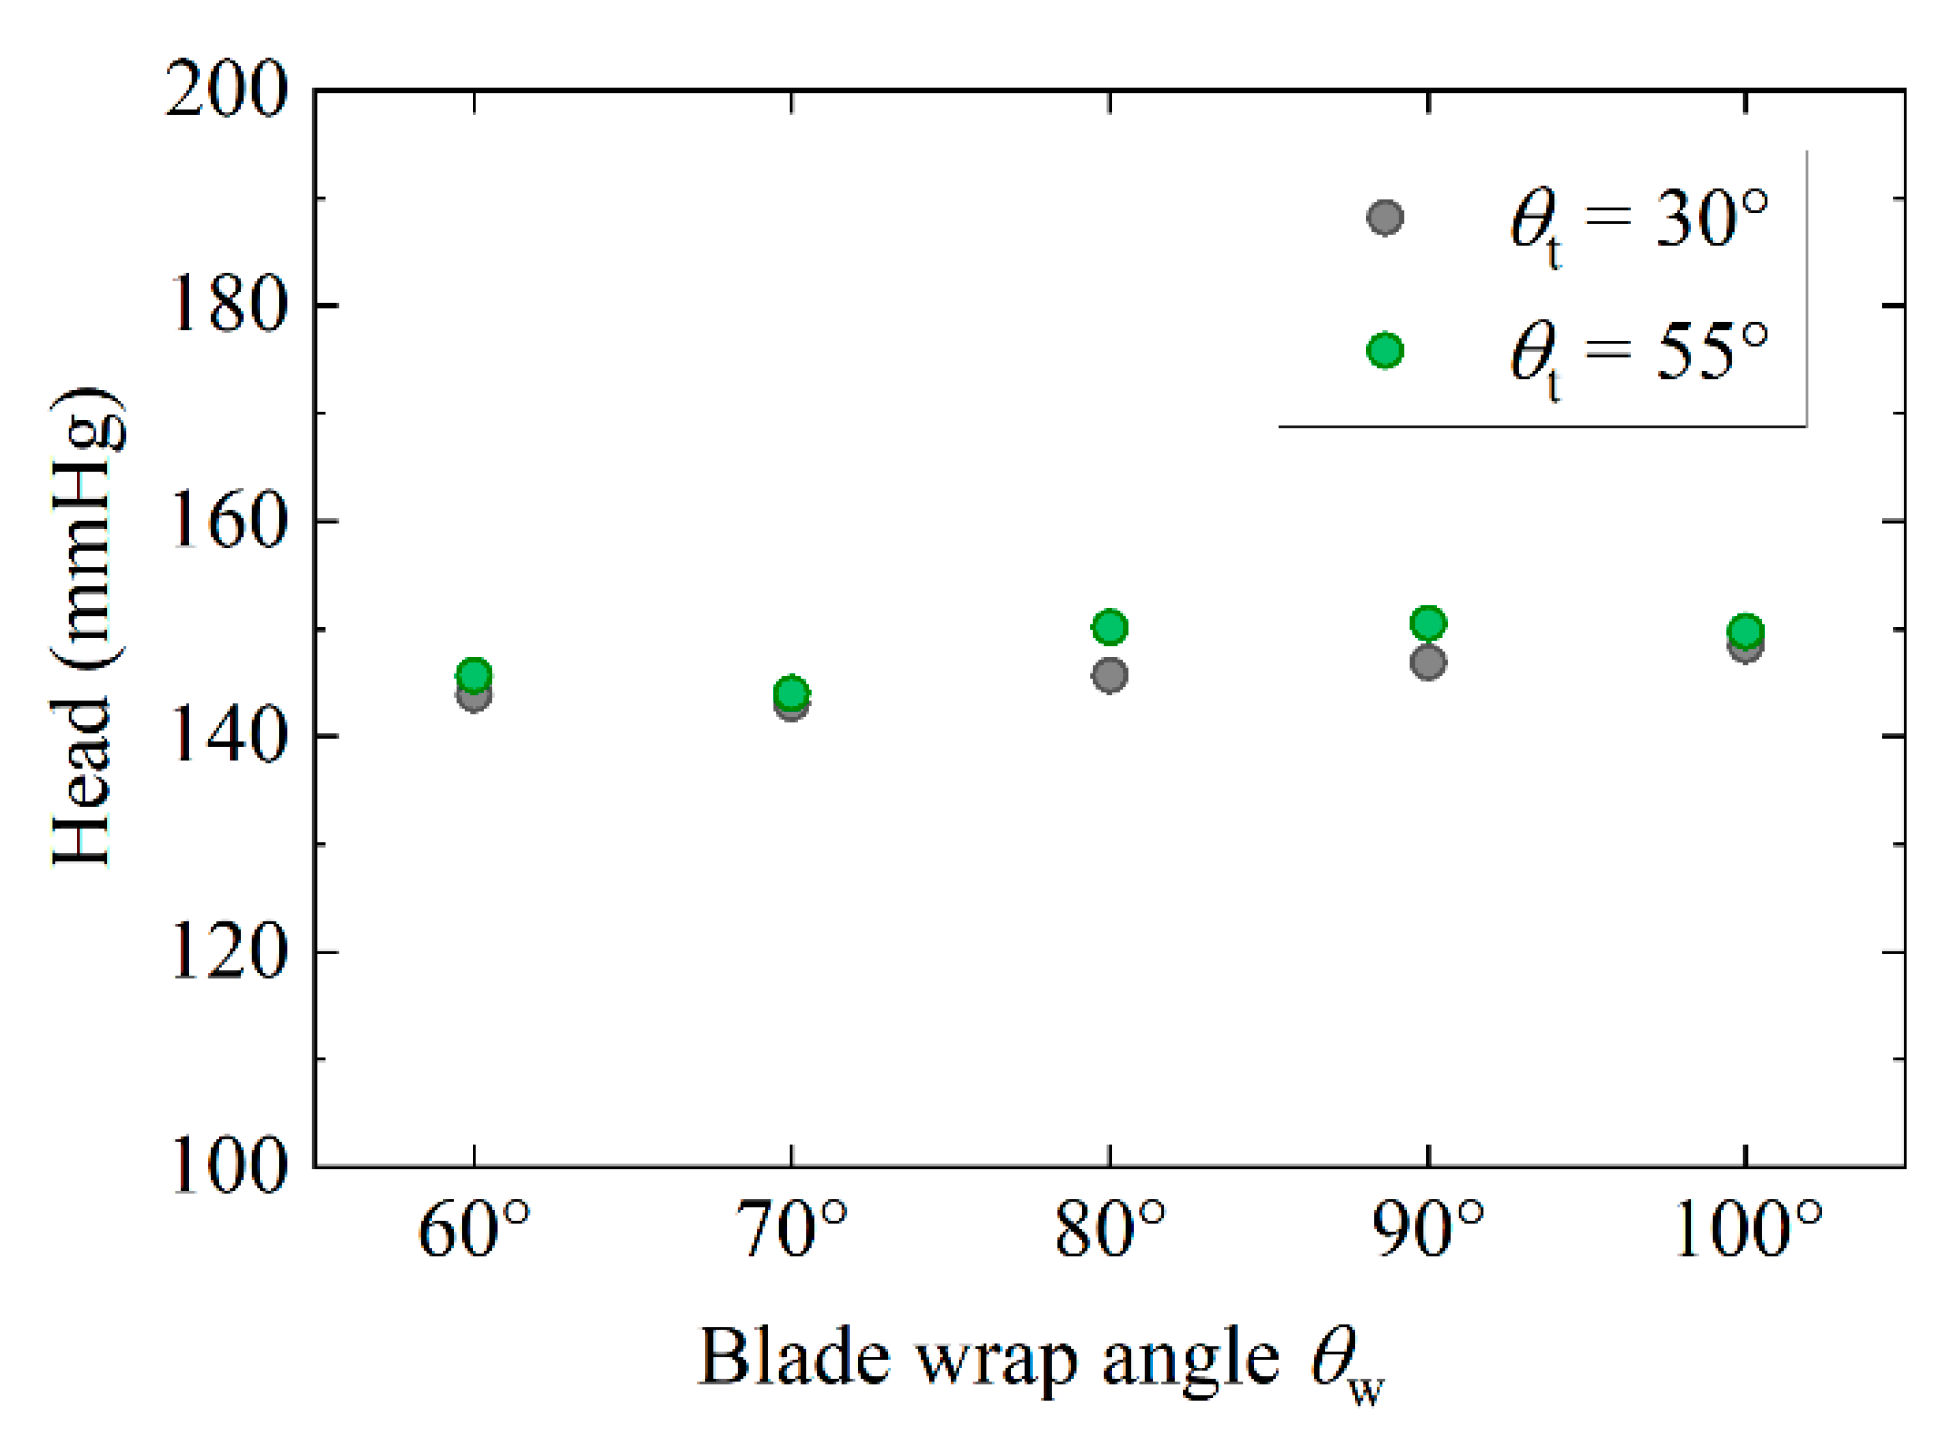
3.1. Hydrodynamic Performance of the Original Pump

Due to the limitation of experimental conditions, a glycerol aqueous solution is used to validate the computational results of hydraulic performance. In this experiment, 37 wt% glycerol–water solution is employed as the working fluid to simulate the blood properties at room temperature (20 °C). The density and viscosity of the glycerol–water solution are 1060 kg/m3 and viscosity is 0.0035 Pa·s and each corresponds to the CFD simulation settings. The simulation results of the model No. 4 have been validated against the experimental results of pressure-flow curves.
The experimental rig has been designed according to ASTM standard F1841-97, “Standard Practice for Assessment of Hemolysis in Continuous Flow Blood Pumps” [41] and consists of the test pump, a reservoir, 3/8-inch tubing, a flowmeter, and two pressure transducers as schematically shown in Figure 4. The reservoir and tubing are clinically available and the priming volume of each circuit is 400 mL. The total head and flow rate could be controlled by adjusting the resistance of a screw clamp attached to the outflow tubing and the pump rotating speed. Pressures at the pump inlet and outlet are measured with the pressure transducer (PX409S, OMEGA, Norwalk, CT, USA, 1% FS accuracy). The blood flow rate is monitored with ultrasound flowmeters (T106, Transonic Systems Inc., Ithaca, NY, USA, 3% FS accuracy). The casing and impeller of the experimental pump are chosen as the original model No. 4 and manufactured from the polymethyl-methacrylate with 3D printing and turning lathe.
Figure 5 shows the experimental and numerical results of the head against flow rate at rotating speeds n = 2000, 2500, and 3000 r/min of the original pump model No. 4 (θw = 70° and θt = 55°). Clearly, both numerical and experimental results show flat performance curves with slightly negative slopes. It is observed that the computational results match the experiments, with an error of 3.6% in the head at the original design point of Q0 = 5.0 L/min and n = 2500 r/min.
Numerical simulations on the 10 test pumps (No. 1–10) are performed at the original design point of Q0 = 5.0 L/min and n = 2500 r/min to study their pressure head difference, as shown in Figure 6 and Table 3. At this condition, the heads of the 10 pumps are all higher than 140 mmHg, indicating that they all meet the optimization objective in terms of hydraulic performance. In addition, results show that the heads of models No. 5–10 with larger wrap angles are greater than the original model No. 4 with a maximum difference of 4.2%. This shows that the larger blade-wrap-angle has a positive influence on the hydraulic performance of the centrifugal blood pump. The head of the pumps with θt = 55° is higher than that with θt = 30°. Thus, θt = 55° could be recognized as an optimal setting angle of the tongue to maximize the head at the design point of our centrifugal blood pumps.

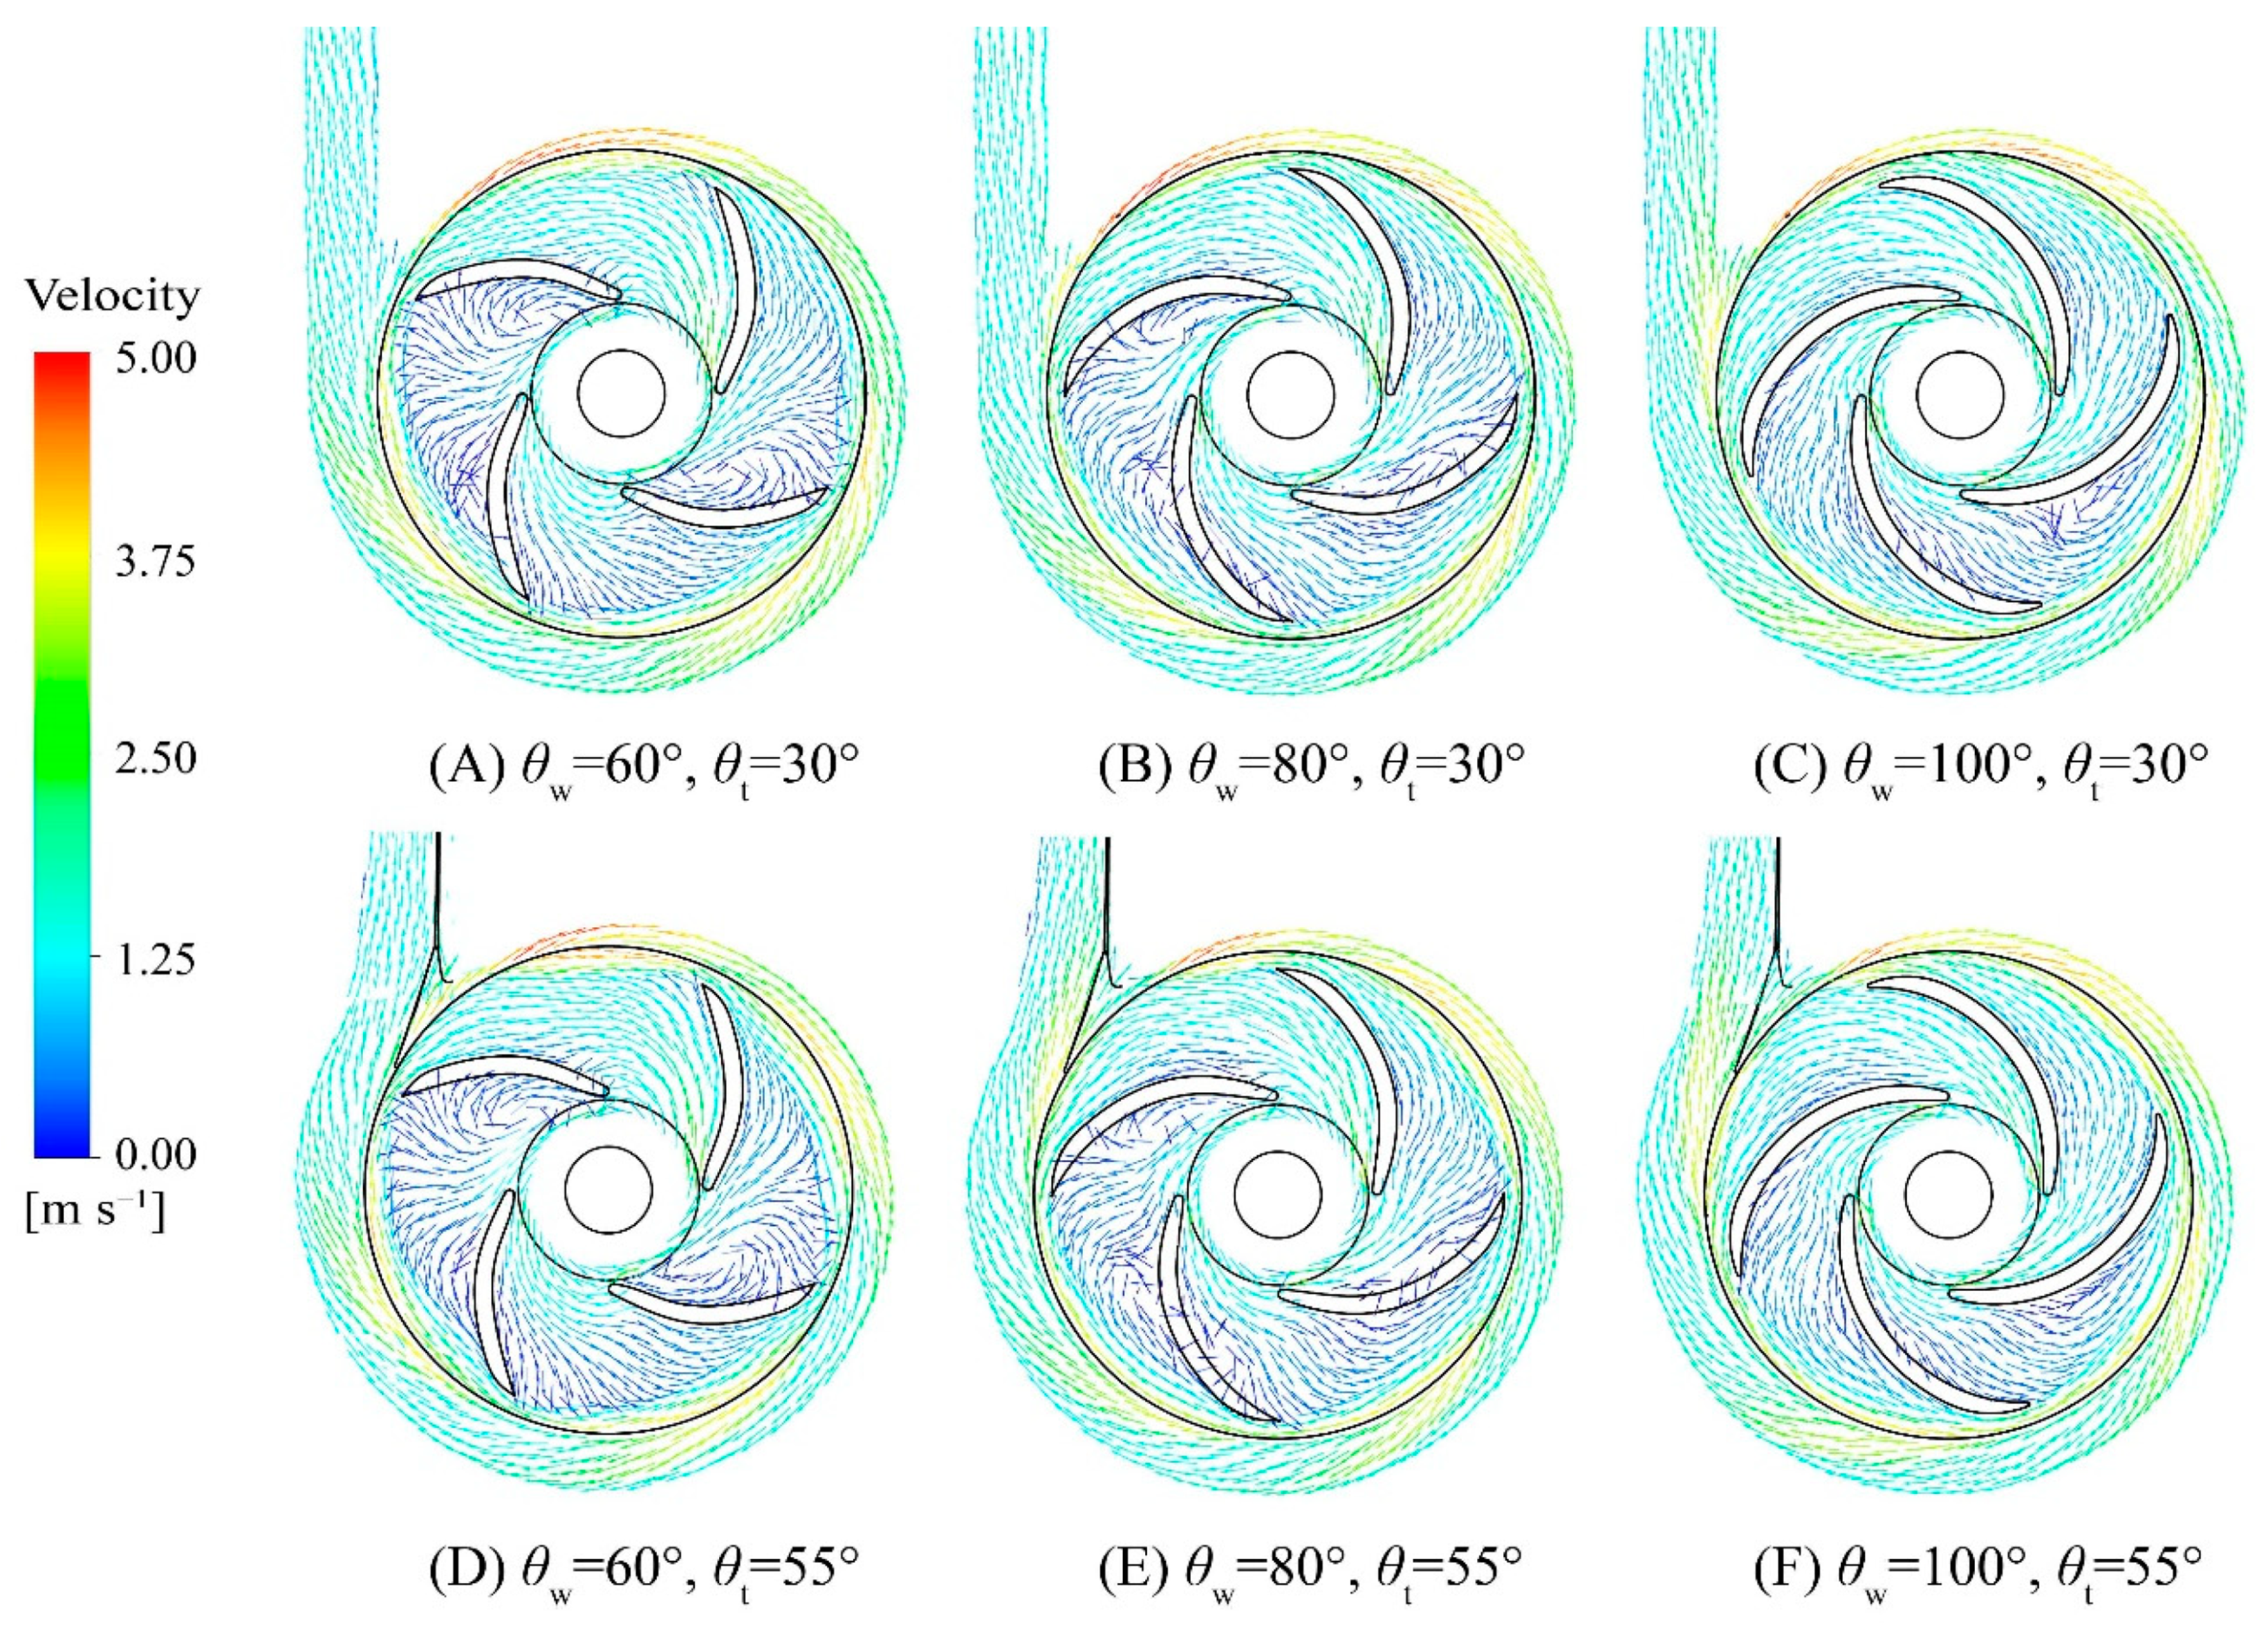
3.2. Velocity Distributions in the Impeller and the Volute

Velocity vectors at the original design point (Q0 = 5.0 L/min, n = 2500 r/min) are shown for the 10 pumps. Figure 7 shows the result on the mid-height plane of the impeller passage of six pumps (No. 1, 2, 5, 6, 9, and 10). The flow in the impeller passage is expressed by relative velocity vectors and the flow in the volute is expressed by absolute velocity vectors. The results indicate that the wrap angle has a great influence on the flow characteristics in the impeller passage. In the less curved blade cases, the large vortices are formed in the blade passages as shown in Figure 7A,D. The flow in the passage between the large curved blades is well-guided as shown in Figure 7C,F. Most of the vortices occur on the suction side of the blade and the average size of the vortices decreases with the increasing wrap angle. Such vortices in the passage prolong the exposure time of the blood cells in the pump, causing adverse clinical effects associated with hemolysis and coagulation. Moreover, the loss caused by the vortex is reduced and the hydraulic efficiencies of the large-wrap-angle pumps are improved. Therefore, models No. 5–10 with fewer vortices in the impeller passage satisfy the assumption of a smooth flow field and are then chosen for further analysis.
The velocity distributions in the volute of the centrifugal blood pump with different tongue angles are rather complicated. Comparisons between Figure 7A–F show that the tongue angle has a limited influence on the flow characteristics in the blade passage. A large tongue angle reduces the high-velocity area around the tongue. In particular, the flow field of model No. 10 with θt = 55° is smoother than that of model No. 9 with θt = 30°. The absence of vortices in the tongue area of all models represents the success of the optimization.

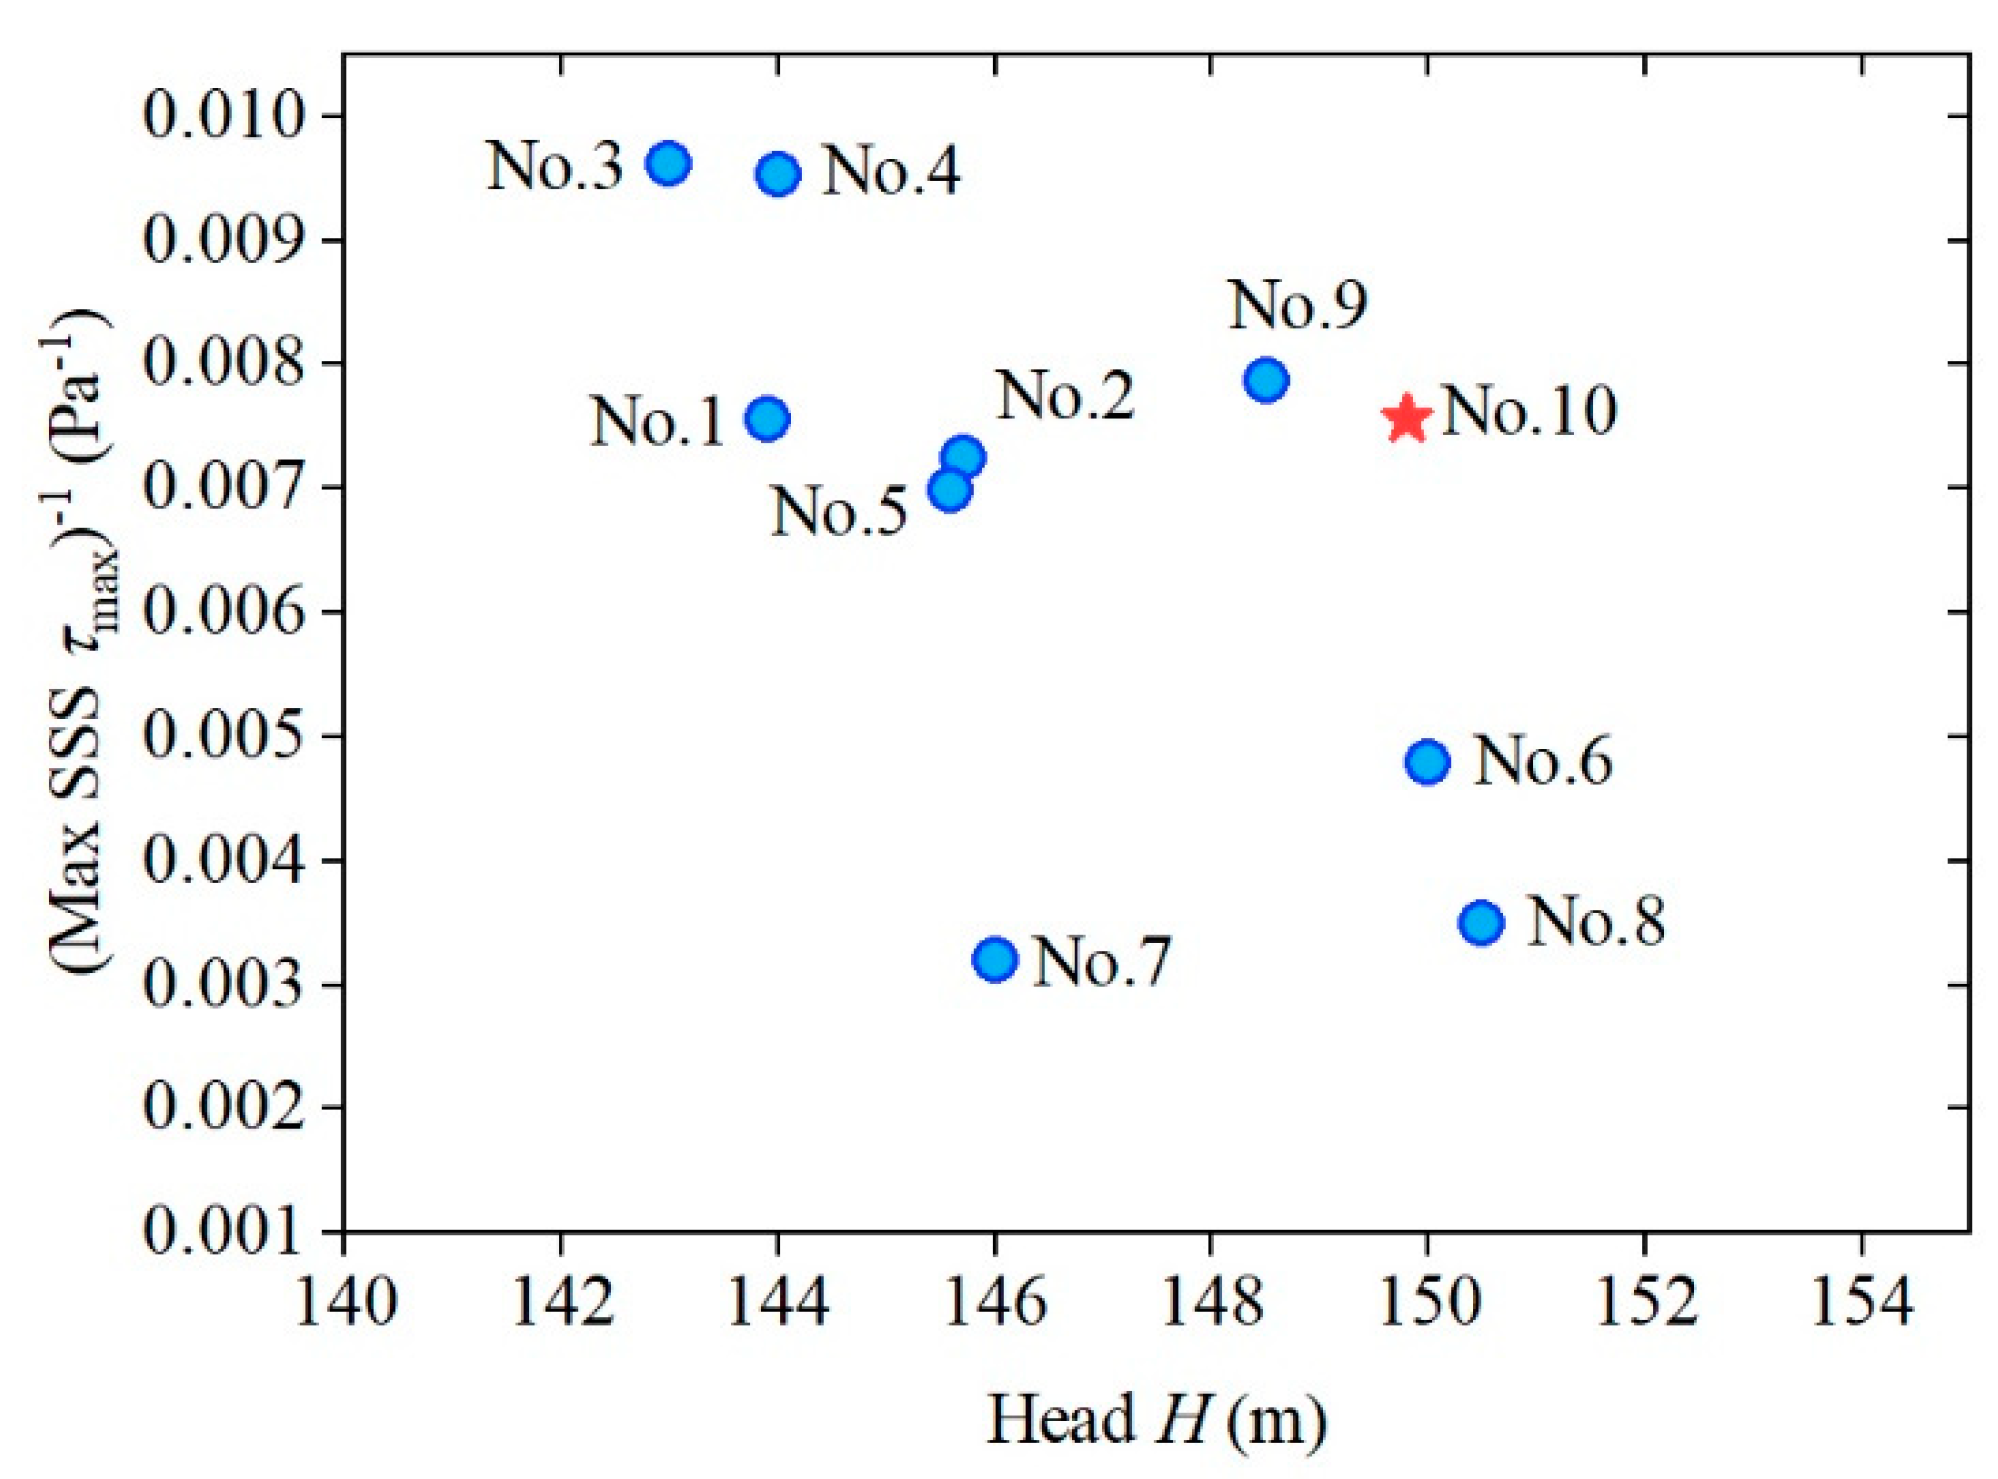
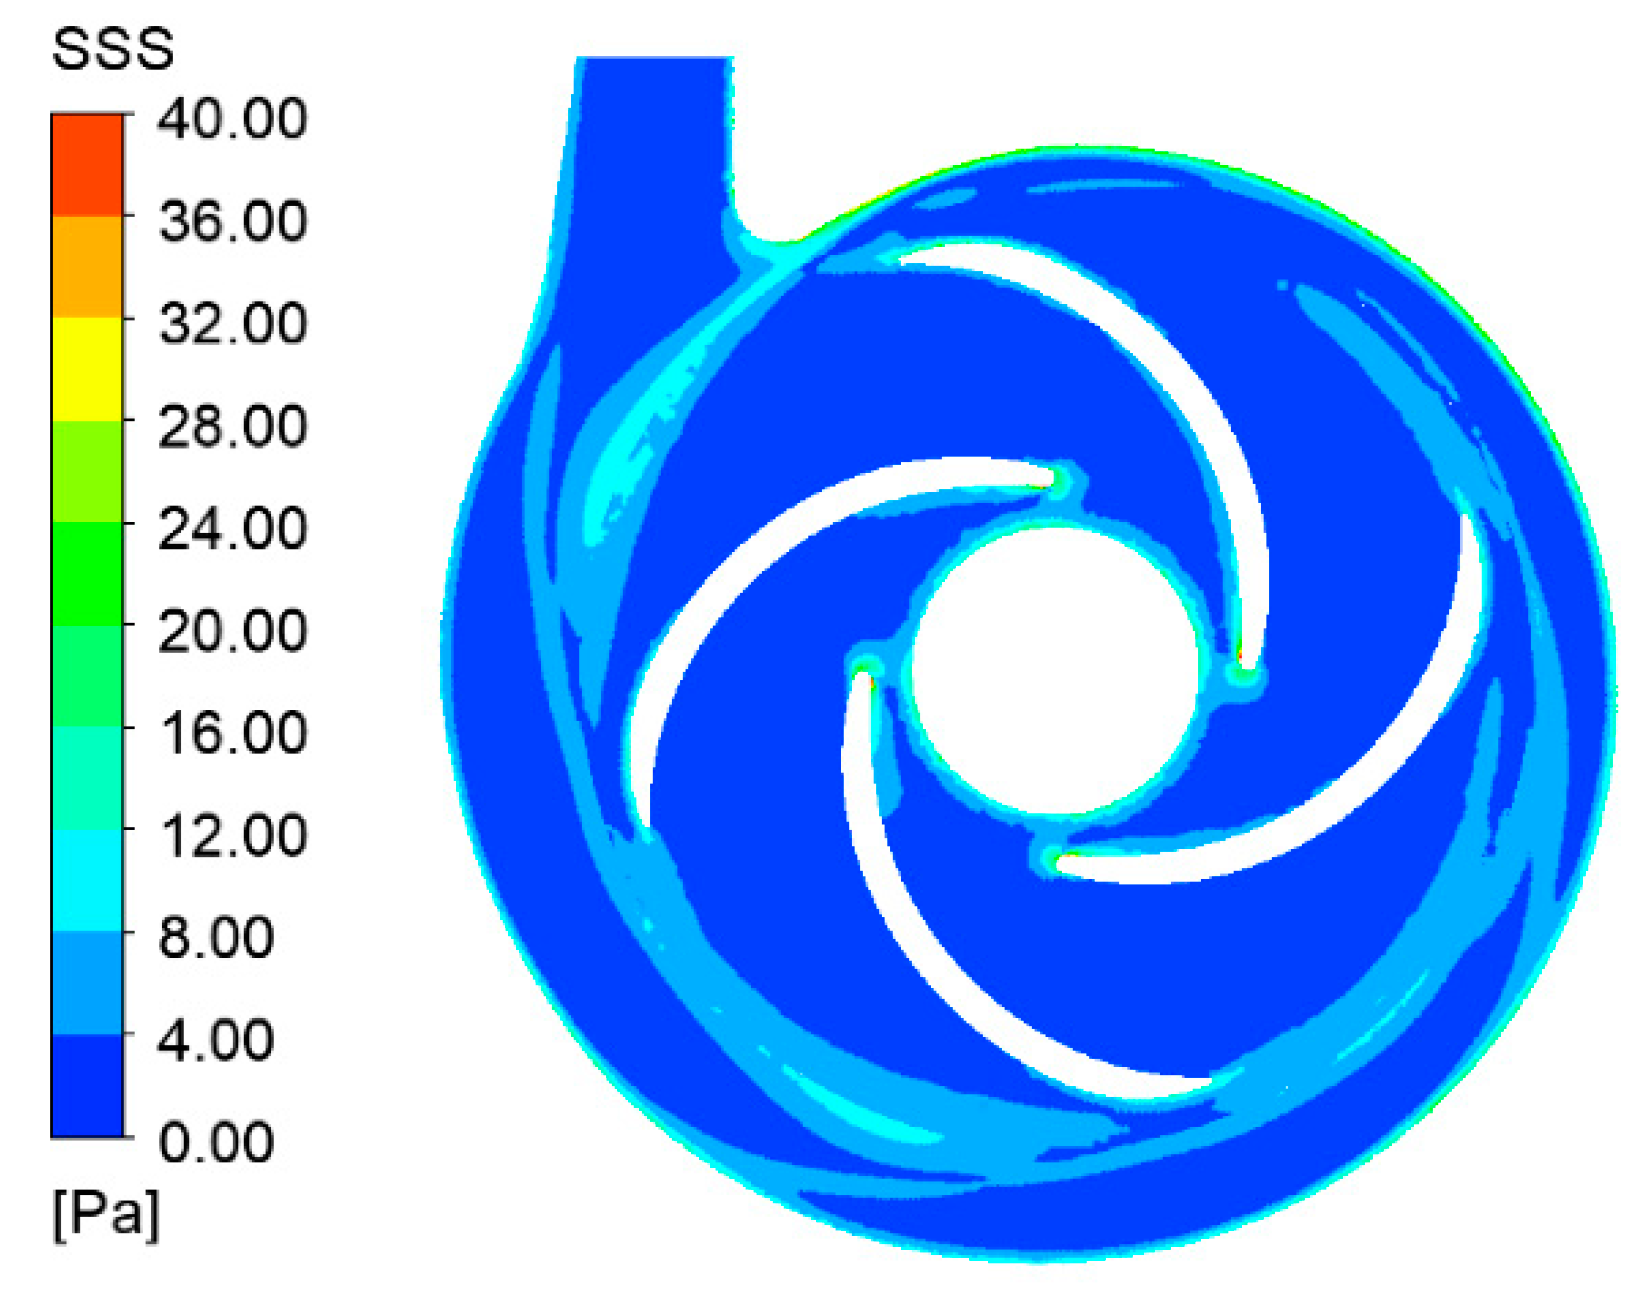
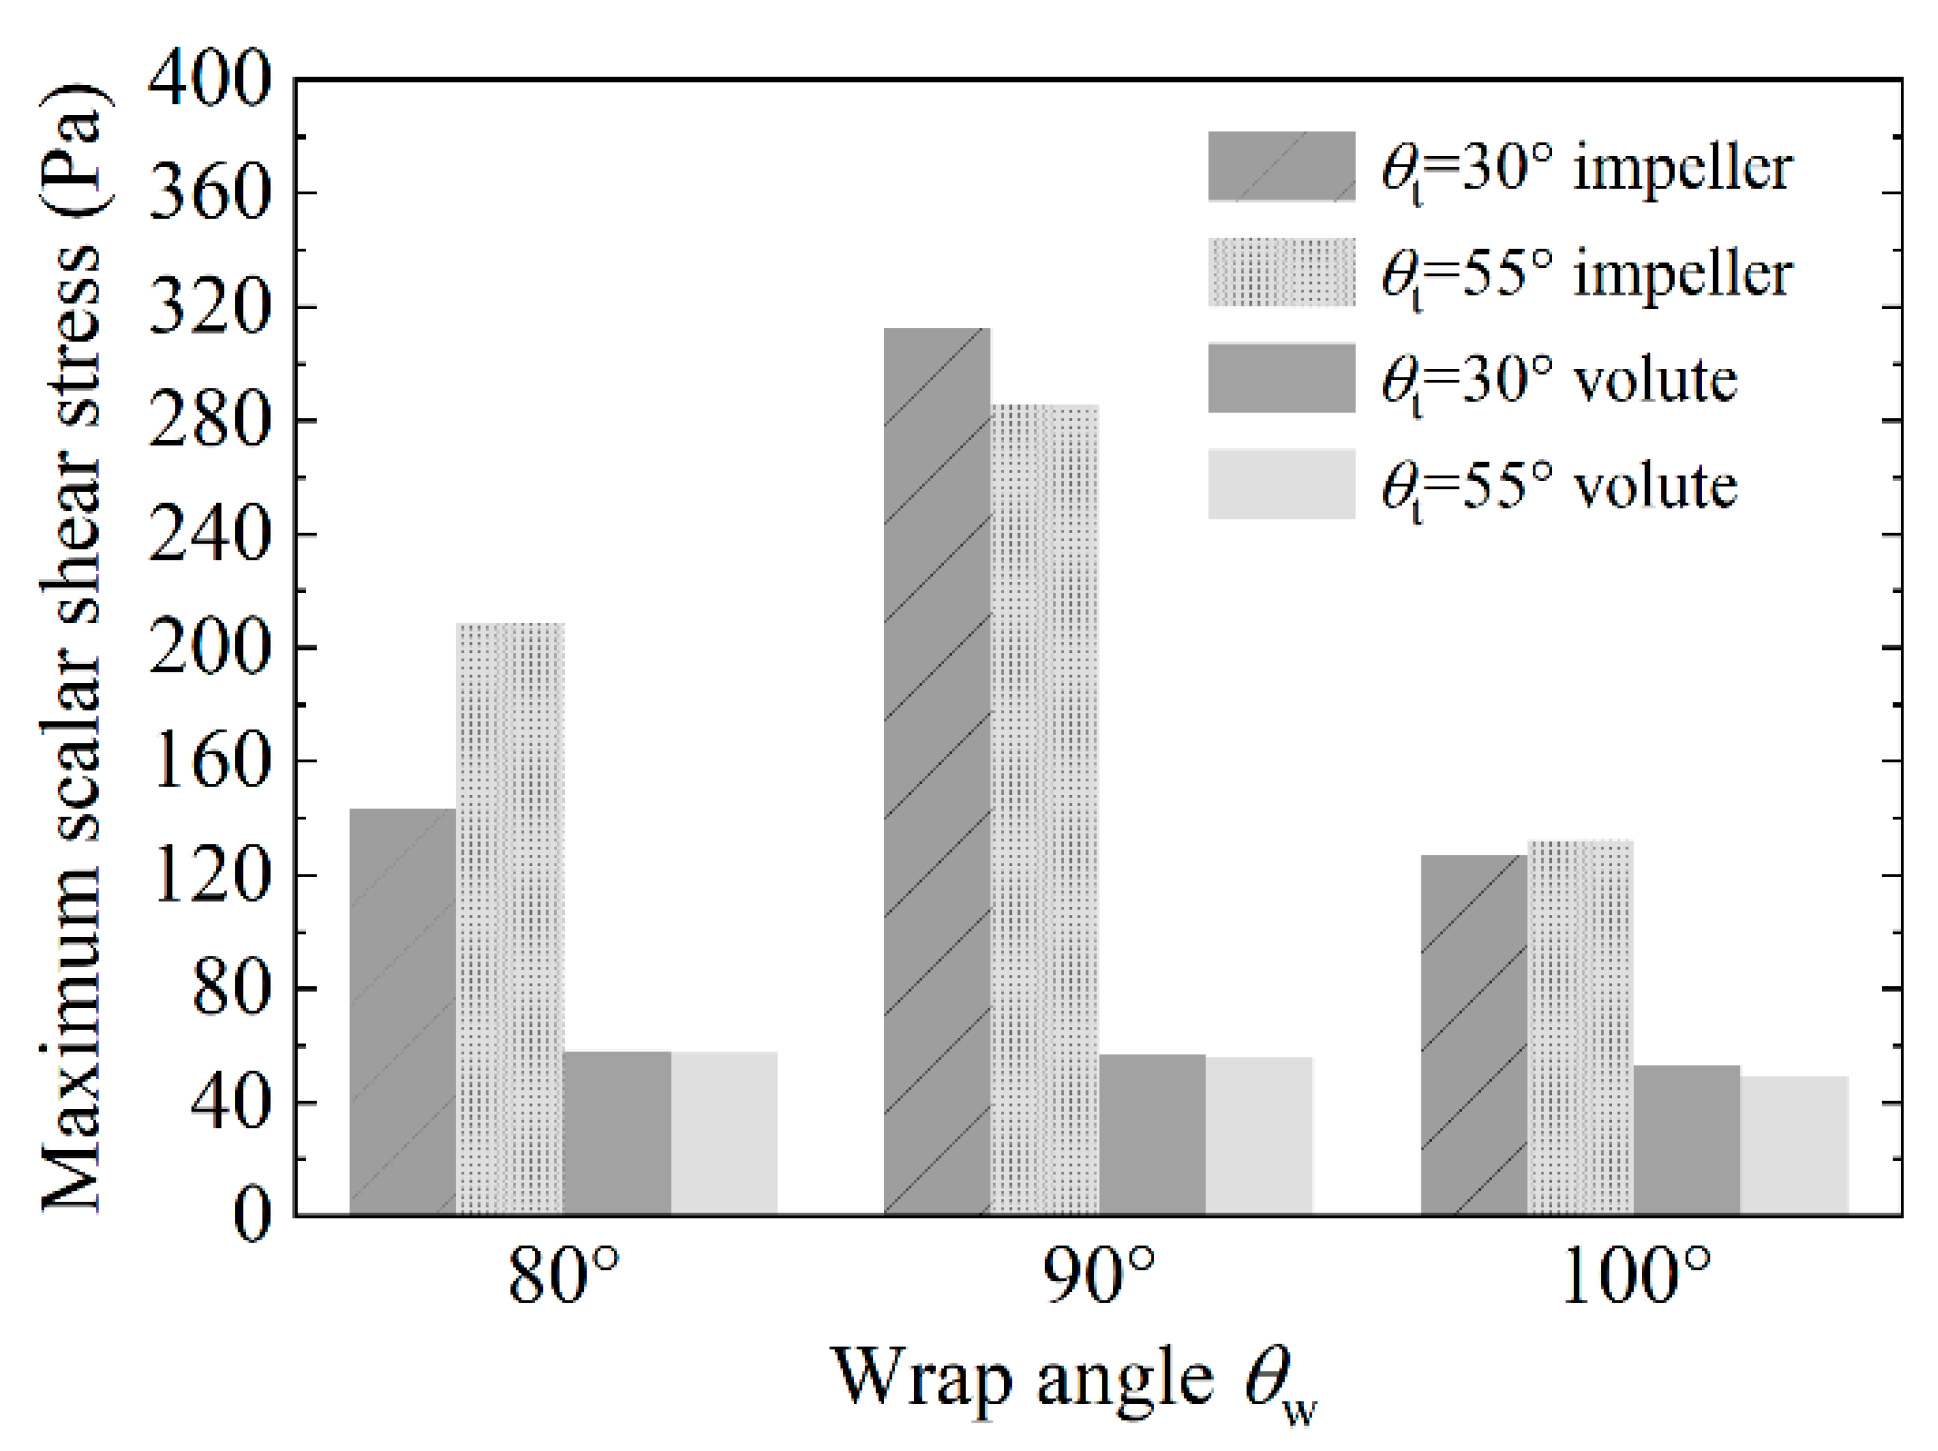
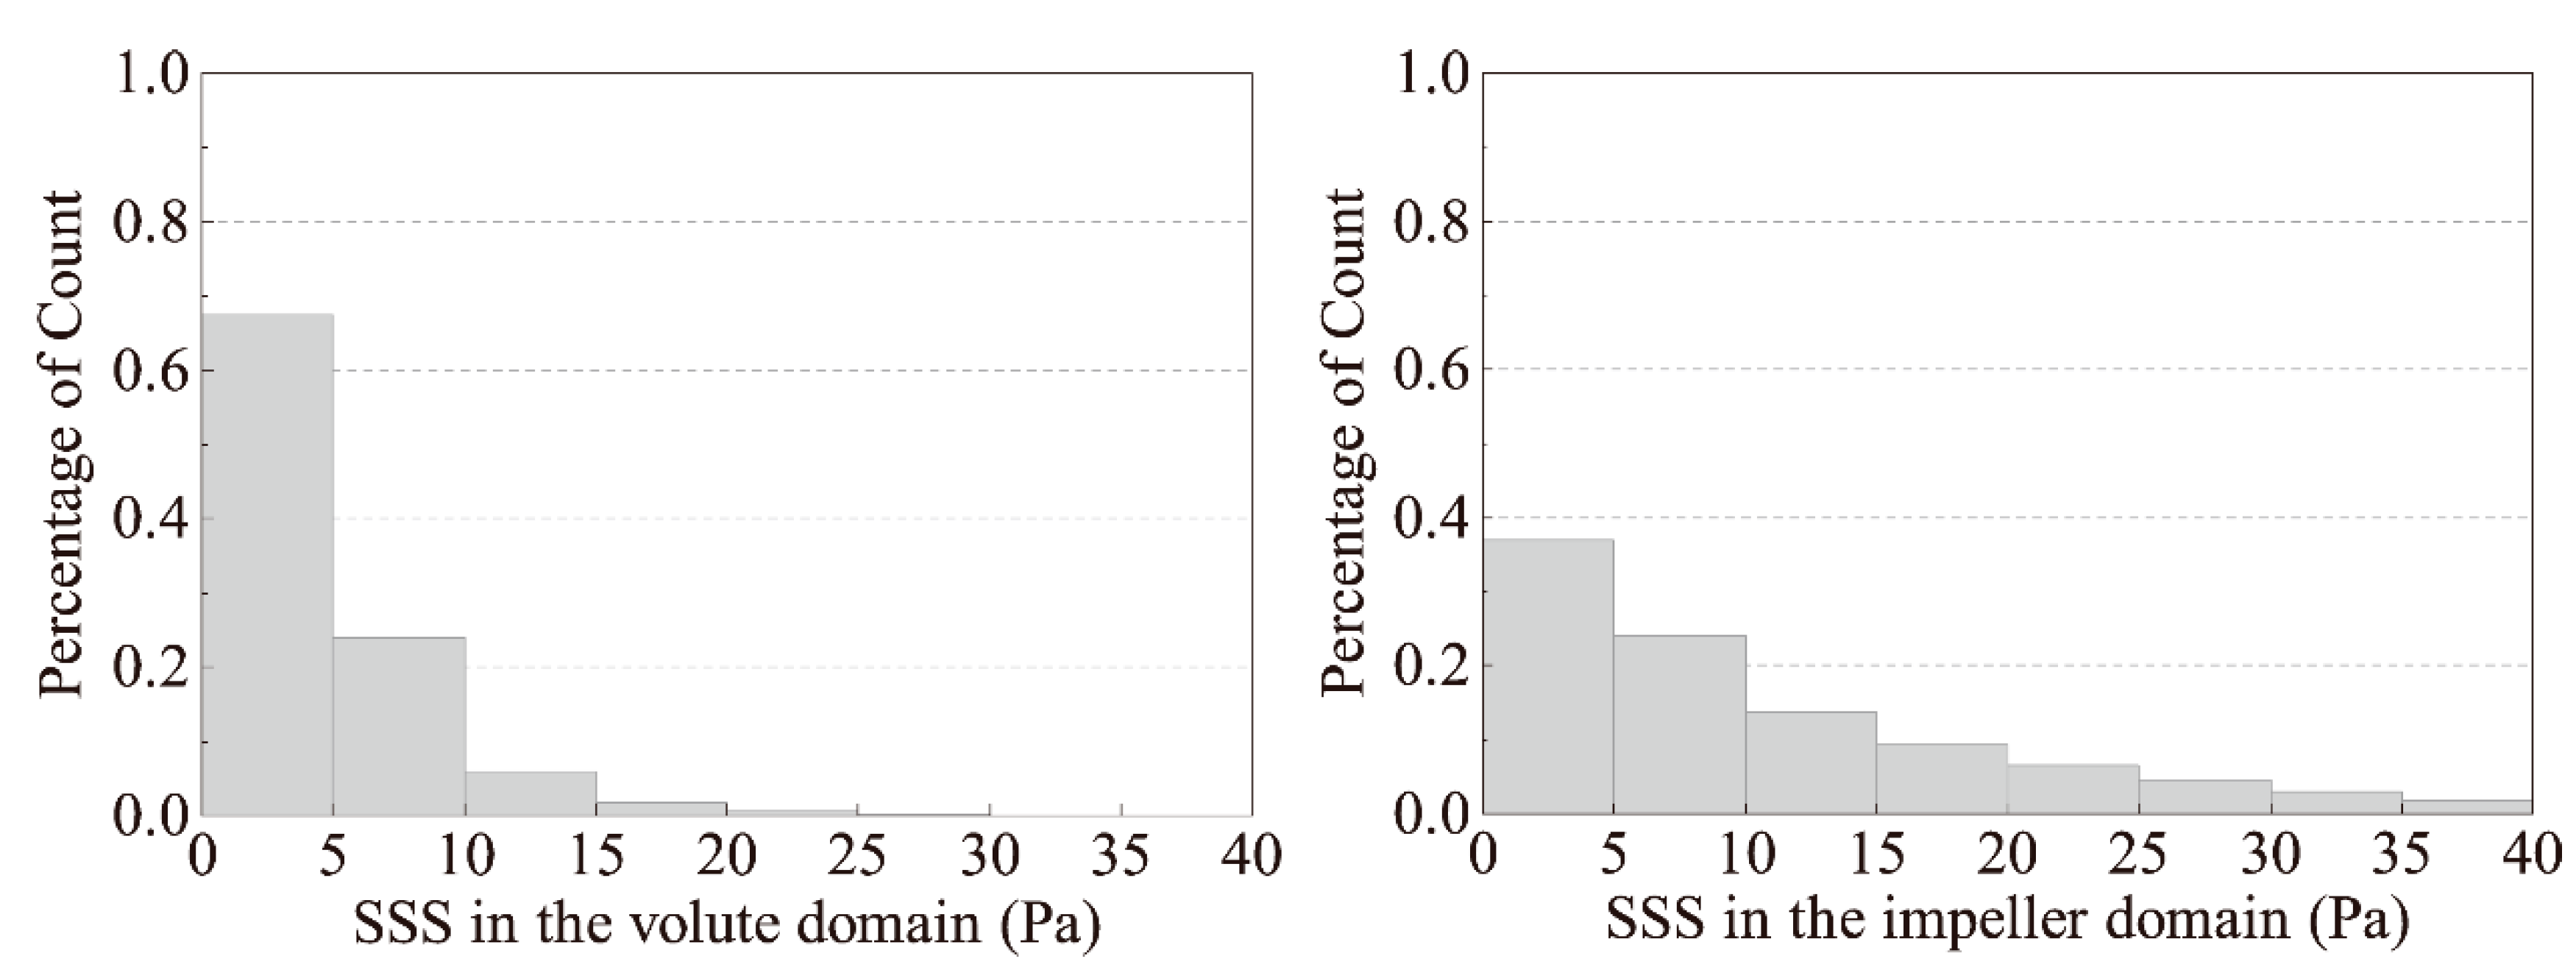
3.3. Stress Distribution

In this sub-section, the scalar shear stress (SSS) value as an essential optimum goal for 10 pumps at the design point is evaluated by CFD simulation, as shown in Table 3 and Figure 8. As shown in Figure 8, the optimization design is located in the large value area of two coordinates H and 1/τ.
The preliminary convergence criteria of optimization are set as follows: When the relative difference between H and τ of the best optimization design and the corresponding value of the previous design is less than 5%, the obtained optimal results are considered to be convergent. More specifically, the relative differences of H and τ between the best optimization design No. 10 and No. 9 are 0.8% and 4.0% in this paper, respectively.
The comparison of the SSS distribution shows little difference in the high-SSS area between 10 pumps. The distribution of the SSS on the mid-height plane of test pump No. 10 is illustrated in Figure 9 as an example. The high value of SSS is usually observed at the tips and radial gap and around the volute tongue. Due to the flow impact and the rotor/stator interference, the SSS in these regions is much higher than in other places, indicating that the blood flow has a strong velocity gradient. Fraser et al. [38] suggested the limiting value of the SSS as 150 Pa to avoid hemolysis complications.
In order to further analyze the factors that influence the maximum SSS, we show the maximum SSS value in the impeller and the volute domain of six test pumps (No. 5–10) in Figure 10. The maximum SSS around the volute domain of all six test pumps are relatively low compared with the impeller domain and the maximum values are all below 60 Pa. Compared with the volute domain, the impeller domain is shown to have a higher potential for stress-induced blood damage. For instance, blood in the impeller of θw = 90° suffers from a high SSS (approximately 313 and 285.7 Pa in models No. 7 and 8, respectively). For θw = 100°, the SSS in the impeller domain is reduced to a much lower value (approximately 127.1 and 132.2 Pa in models No. 9 and 10, respectively). Hence, the desired decrease in SSS value is achieved. Moreover, the results show that the two tongue angles in this optimization have a limited effect on the SSS distribution.
The probability distributions of the SSS in the volute and impeller regions of the test model No. 10 are shown in Figure 11. The maximum SSS in the volute domain is relatively small and 91% is below 10 Pa. On the other hand, only 60% of the SSS is below 10 Pa in the impeller region. In the impeller region, the overall SSS is slightly larger than the volute domain. Since the small SSS does not contribute much to hemolysis, it is reasonable to choose the maximum SSS as the optimization goal, which confirms our hypothesis in Section 2.3.

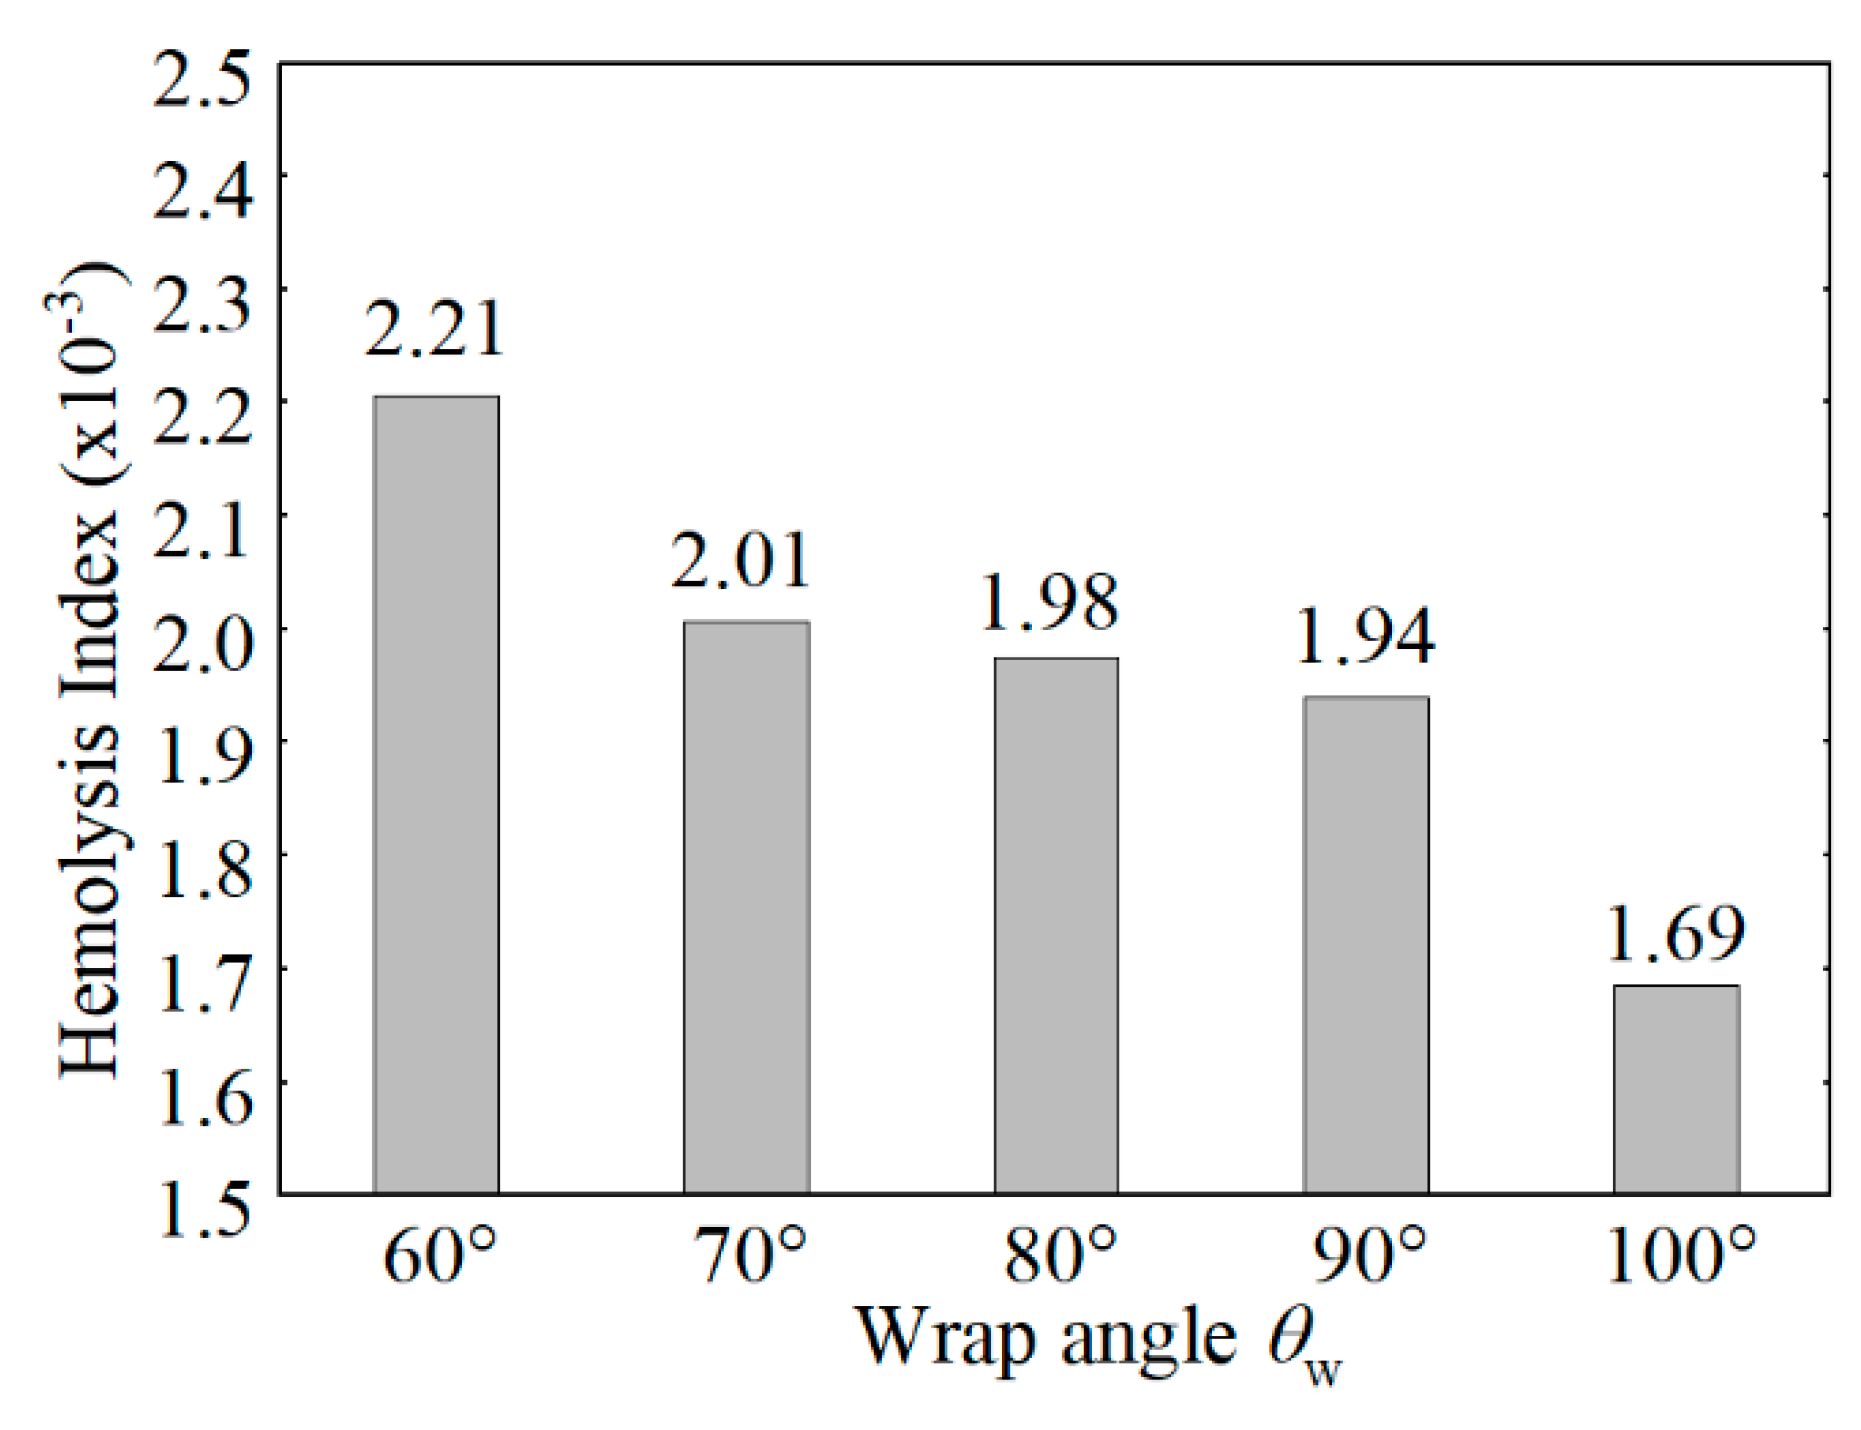
3.4. Hemolysis Analysis

In order to further validate the methodology of the simplified optimization criteria, we also perform the hemolysis index calculation of the 5 test pumps (No. 2, 4, 6, 8, and 10) by using the Lagrangian approach. The hemolytic performances (hemolysis index) of the impellers with the same volute and the different curved blades are shown in Figure 12. The results indicate that the hemolysis index (HI) of the models with large-curved blades is lower than small-curved blades. Specifically, the HI is reduced by 23.5% as the wrap angle increases from 60° to 100°.
It can be observed from Table 3 and Figure 12 that test pump No. 10 with lower maximum SSS (132.2 Pa) also has a lower hemolysis index (1.69 × 10⁻³), while the test pumps No. 6 and No. 8 with higher maximum SSS (208.6 Pa and 313 Pa) have higher hemolysis indices (1.98 × 10⁻³ and 1.94 × 10⁻³). This result verifies the feasibility of choosing the maximum SSS as the optimization goal.
The maximum scalar shear stress method is concise and efficient. A comparison of the hemolysis between the optimized and the original models is recommended for validation. Note that although a larger wrap angle shows a good hydraulic and hemolytic performance, it also brings a larger contact area, which may result in a higher possibility of potential thrombus formation. Further studies on related coagulation complications are needed.

4. Concluding Remarks

In summary, this article presents a multi-objective optimization method of blood pumps based on the near-orthogonal array with a simplified hemolysis criterion. Since the blood cells spend almost the same amount of residence time passing through the pump, it is reasonable to replace the usual criterion of blood hemolysis, i.e., the hemolysis index, with the maximum scalar shear stress. In this manner, the calculation load is greatly reduced. Optimization factors are chosen as the blade wrap angle and the volute tongue angle based on the recommendations from previous research. Further numerical and experimental studies on 10 optimized pump models are carried out to verify its feasibility.
Results show that with the increase in the blade wrap angle, the pressure head increases, and the size of the vortices decreases. A larger and suitable tongue angle can eliminate the impulse blood flow from the volute eighth section to the tongue area. In terms of the maximum scalar shear stress, pump No. 10 with a low value shows the best hemolytic performance, which proves the reliability of this optimization approach.
In conclusion, the optimization method proposed in this paper greatly reduces the calculation load and provides reasonable accuracy. It can serve as a convenient tool for blood pump optimization in the engineering field.

Author Contributions

Investigation, M.G.; data analysis, B.H.; drafting article, B.H.; critical revision of article, Z.Z. and S.L.; visualization, B.H. and S.L.; supervision, Q.W. and B.L. All authors have read and agreed to the published version of the manuscript.

Funding

This research was funded by the National Key R&D Program of China (2018YFB0606101) and the National Natural Science Foundation of China (No.51909132, 52079066).

Institutional Review Board Statement

Not applicable.

Informed Consent Statement

Not applicable.

Data Availability Statement

The data presented in this study are available on request from the corresponding author.

Conflicts of Interest

The authors declare that they have no conflicts of interest.

References

  1. Lorts, A.; Eghtesady, P.; Mehegan, M.; Adachi, I.; Villa, C.; Davies, R.; Gossett, J.G.; Kanter, K.; Alejos, J.; Koehl, D.; et al. Outcomes of Children Supported with Devices Labeled as “Temporary” or Short Term: A Report from the Pediatric Interagency Registry for Mechanical Circulatory Support. J. Hear. Lung Transplant. 2018, 37, 54–60. [Google Scholar] [CrossRef]
  2. Colombo, P.C.; Mehra, M.R.; Goldstein, D.J.; Estep, J.D.; Salerno, C.; Jorde, U.P.; Cowger, J.; ClevelandJr, J.C.; Uriel, N.; Sayer, G.; et al. Comprehensive Analysis of Stroke in the Long-Term Cohort of the MOMENTUM 3 Study. Circulation 2019, 139, 155–168. [Google Scholar] [CrossRef]
  3. Rogers, J.G.; Pagani, F.; Tatooles, A.J.; Bhat, G.; Slaughter, M.S.; Birks, E.J.; Boyce, S.W.; Najjar, S.S.; Jeevanandam, V.; Anderson, A.; et al. Intrapericardial Left Ventricular Assist Device for Advanced Heart Failure. N. Engl. J. Med. 2017, 376, 451–460. [Google Scholar] [CrossRef] [PubMed]
  4. Virani, S.S.; Alonso, A.; Benjamin, E.J.; Bittencourt, M.S.; Callaway, C.W.; Carson, A.P.; Chamberlain, A.M.; Chang, A.R.; Cheng, S.; Delling, F.N.; et al. Heart Disease and Stroke Statistics—2020 Update: A Report From the American Heart Association. Circulation 2020, 141, e139–e596. [Google Scholar] [CrossRef] [PubMed]
  5. van Oeveren, W.; Tielliu, I.F.; de Hart, J. Comparison of Modified Chandler, Roller Pump, and Ball Valve Circulation Models for In Vitro Testing in High Blood Flow Conditions: Application in Thrombogenicity Testing of Different Materials for Vascular Applications. Int. J. Biomater. 2012, 2012, 673163. [Google Scholar] [CrossRef] [PubMed] [Green Version]
  6. Takami, Y.; Nakazawa, T.; Makinouchi, K.; Benkowski, R.; Glueck, J.; Nosé, Y. Material of the Double Pivot Bearing System in the Gyro C1E3 Centrifugal Pump. Artif. Organs 2008, 21, 143–147. [Google Scholar] [CrossRef] [PubMed]
  7. Takami, Y.; Nakazawa, T.; Makinouchi, K.; Glueck, J. Biocompatibility of Alumina Ceramic and Polyethylene as Materials for Pivot Bearings of a Centrifugal Blood Pump. J. Biomed. Mater. Res. 1997, 36, 381–386. [Google Scholar] [CrossRef]
  8. Poder, T.G.; Nonkani, W.G.; Leponkouo, É.T. Blood Warming and Hemolysis: A Systematic Review with Meta-Analysis. Transfus. Med. Rev. 2015, 29, 172–180. [Google Scholar] [CrossRef]
  9. Katz, J.N.; Jensen, B.C.; Chang, P.P.; Myers, S.L.; Pagani, F.; Kirklin, J.K. A Multicenter Analysis of Clinical Hemolysis in Patients Supported with Durable, Long-Term Left Ventricular Assist Device Therapy. J. Hear. Lung Transplant. 2015, 34, 701–709. [Google Scholar] [CrossRef] [PubMed]
  10. Ravichandran, A.; Parker, J.; Novak, E.; Joseph, S.M.; Schilling, J.D.; Ewald, G.A.; Silvestry, S. Hemolysis in Left Ventricular Assist Device: A Retrospective Analysis of Outcomes. J. Hear. Lung Transplant. 2014, 33, 44–50. [Google Scholar] [CrossRef] [PubMed]
  11. Yasuda, T.; Shimokasa, K.; Funakubo, A.; Higami, T.; Kawamura, T.; Fukui, Y. An Investigation of Blood Flow Behavior and Hemolysis in Artificial Organs. ASAIO J. 2000, 46, 527–531. [Google Scholar] [CrossRef] [PubMed]
  12. Ozturk, C.; Aka, I.B.; Lazoglu, I. Effect of Blade Curvature on the Hemolytic and Hydraulic Characteristics of a Centrifugal Blood Pump. Int. J. Artif. Organs 2018, 41, 730–737. [Google Scholar] [CrossRef] [PubMed]
  13. Chan, W.; Wong, Y.; Ding, Y.; Chua, L.; Yu, S. Numerical Investigation of the Effect of Blade Geometry on Blood Trauma in a Centrifugal Blood Pump. Artif. Organs 2002, 26, 785–793. [Google Scholar] [CrossRef]
  14. Li, H.; Chan, W.K. Inverse Design and CFD Investigation of Blood Pump Impeller. Crit. Rev. Biomed. Eng. 2000, 28, 75–80. [Google Scholar] [CrossRef]
  15. Yu, S.; Ng, B.; Chan, W.; Chua, L. The Flow Patterns within the Impeller Passages of a Centrifugal Blood Pump Model. Med. Eng. Phys. 2000, 22, 381–393. [Google Scholar] [CrossRef]
  16. Mozafari, S.; Rezaienia, M.A.; Paul, G.; Rothman, M.T.; Wen, P.; Korakianitis, T. The Effect of Geometry on the Efficiency and Hemolysis of Centrifugal Implantable Blood Pumps. ASAIO J. 2017, 63, 53–59. [Google Scholar] [CrossRef]
  17. Kannojiya, V.; Das, A.K.; Das, P.K. Numerical Simulation of Centrifugal and Hemodynamically Levitated LVAD for Performance Improvement. Artif. Organs 2020, 44, E1–E19. [Google Scholar] [CrossRef]
  18. Wu, J.; Paden, B.E.; Borovetz, H.S.; Antaki, J.F. Computational Fluid Dynamics Analysis of Blade Tip Clearances on Hemodynamic Performance and Blood Damage in a Centrifugal Ventricular Assist Device. Artif. Organs 2009, 34, 402–411. [Google Scholar] [CrossRef] [Green Version]
  19. Kim, N.J.; Diao, C.; Ahn, K.H.; Lee, S.J.; Kameneva, M.V.; Antaki, J.F. Parametric Study of Blade Tip Clearance, Flow Rate, and Impeller Speed on Blood Damage in Rotary Blood Pump. Artif. Organs 2009, 33, 468–474. [Google Scholar] [CrossRef]
  20. Aka, I.B.; Ozturk, C.; Lazoglu, I. Numerical Investigation of Volute Tongue Design on Hemodynamic Characteristics and Hemolysis of the Centrifugal Blood Pump. SN Appl. Sci. 2021, 3, 1–9. [Google Scholar] [CrossRef]
  21. Zhou, B.; Bentham, J.; Di Cesare, M.; Bixby, H.; Danaei, G.; Cowan, M.J.; Paciorek, C.J.; Singh, G.; Hajifathalian, K.; Bennett, J.E.; et al. Worldwide Trends in Blood Pressure from 1975 to 2015: A Pooled Analysis of 1479 Population-Based Measurement Studies with 19·1 Million Participants. Lancet 2017, 389, 37–55. [Google Scholar] [CrossRef] [Green Version]
  22. Brandfonbrener, M.; Landowne, M.; Shock, N.W. Changes in Cardiac Output with Age. Circulation 1955, 12, 557–566. [Google Scholar] [CrossRef] [Green Version]
  23. Zhang, J.; Gellman, B.; Koert, A.; Dasse, K.A.; Gilbert, R.J.; Griffith, B.P.; Wu, Z.J. Computational and Experimental Evaluation of the Fluid Dynamics and Hemocompatibility of the CentriMag Blood Pump. Artif. Organs 2006, 30, 168–177. [Google Scholar] [CrossRef] [PubMed]
  24. Ganushchak, Y.; Lichtenbelt, W.V.M.; Van Der Nagel, T.; De Jong, D. Hydrodynamic Performance and Heat Generation by Centrifugal Pumps. Perfusion 2006, 21, 373–379. [Google Scholar] [CrossRef]
  25. Boës, S.; Thamsen, B.; Haas, M.; Daners, M.S.; Meboldt, M.; Granegger, M. Hydraulic Characterization of Implantable Rotary Blood Pumps. IEEE Trans. BioMed. Eng. 2018, 66, 1618–1627. [Google Scholar] [CrossRef] [PubMed]
  26. Stepanoff, A.J. Centrifugal and Axial Flow Pumps; John Wiley & Sons: New York, NY, USA, 1957. [Google Scholar]
  27. Ni, Y.Y.; Yuan, S.Q.; Yuan, J.P.; Zhang, J.F. Model of Enlarged Flow Design for Low Specific Speed Centrifugal Pump. Drain. Irrig. Mach. 2008, 26, 21–24. [Google Scholar]
  28. Sutera, S.; Mehrjardi, M. Deformation and Fragmentation of Human Red Blood Cells in Turbulent Shear Flow. Biophys. J. 1975, 15, 1–10. [Google Scholar] [CrossRef] [Green Version]
  29. Rooney, J.A. Hemolysis near an Ultrasonically Pulsating Gas Bubble. Science 1970, 169, 869–871. [Google Scholar] [CrossRef]
  30. Giersiepen, M.; Wurzinger, L.; Opitz, R.; Reul, H. Estimation of Shear Stress-Related Blood Damage in Heart Valve Prostheses—In Vitro Comparison of 25 Aortic Valves. Int. J. Artif. Organs 1990, 13, 300–306. [Google Scholar] [CrossRef]
  31. Bludszuweit, C. Model for a General Mechanical Blood Damage Prediction. Artif. Organs 1995, 19, 583–589. [Google Scholar] [CrossRef]
  32. Arvand, A.; Hormes, M.; Reul, H. A Validated Computational Fluid Dynamics Model to Estimate Hemolysis in a Rotary Blood Pump. Artif. Organs 2005, 29, 531–540. [Google Scholar] [CrossRef]
  33. Ge, L.; Dasi, L.P.; Sotiropoulos, F.; Yoganathan, A.P. Characterization of Hemodynamic Forces Induced by Mechanical Heart Valves: Reynolds vs. Viscous Stresses. Ann. Biomed. Eng. 2007, 36, 276–297. [Google Scholar] [CrossRef] [Green Version]
  34. Taskin, M.E.; Fraser, K.H.; Zhang, T.; Wu, C.; Griffith, B.P.; Wu, Z.J. Evaluation of Eulerian and Lagrangian models for hemolysis estimation. Asaio J. 2012, 58, 363–372. [Google Scholar] [CrossRef] [PubMed]
  35. Heuser, G.; Opitz, R. A Couette Viscometer for Short Time Shearing of Blood. Biorheology 1980, 17, 17–24. [Google Scholar] [CrossRef] [PubMed]
  36. Bludszuweit, C. Three-Dimensional Numerical Prediction of Stress Loading of Blood Particles in a Centrifugal Pump. Artif. Organs 1995, 19, 590–596. [Google Scholar] [CrossRef] [PubMed]
  37. Cho, Y.I.; Kensey, K.R. Effects of the Non-Newtonian Viscosity of Blood on Flows in a Diseased Arterial Vessel. Part 1: Steady Flows. Biorheology 1991, 28, 241–262. [Google Scholar] [CrossRef]
  38. Fraser, K.; Zhang, T.; Taskin, M.E.; Griffith, B.P.; Wu, Z.J. A Quantitative Comparison of Mechanical Blood Damage Parameters in Rotary Ventricular Assist Devices: Shear Stress, Exposure Time and Hemolysis Index. J. Biomech. Eng. 2012, 134, 081002–08100211. [Google Scholar] [CrossRef]
  39. Kannojiya, V.; Das, A.K.; Das, P.K. Proposal of Hemodynamically Improved Design of an Axial Flow Blood Pump for LVAD. Med. Biol. Eng. Comput. 2019, 58, 401–418. [Google Scholar] [CrossRef]
  40. Eggels, J.G.M.; Unger, F.; Weiss, M.H.; Westerweel, J.; Adrian, R.J.; Friedrich, R.; Nieuwstadt, F.T.M. Fully Developed Turbulent Pipe Flow: A Comparison between Direct Numerical Simulation and Experiment. J. Fluid Mech. 1994, 268, 175–210. [Google Scholar] [CrossRef]
  41. American Society for Testing and Materials. Standard Practice for Assessment of Hemolysis in Continuous Flow Blood Pumps. In Annual Book of ASTM Standards; ASTM International: West Conshohocken, PA, USA, 1998; Volume 13.01. [Google Scholar]
Figure 1. Schematic of the pump and notations. (A) Hydraulic components, (B) definition of height z in the meridian plane of impeller passage, and (C) definition of blade wrap angle θw and volute tongue angle θt in the mid-height plane of impeller passage (z/b2 = 0.5).
Processes 09 01211 g001
Figure 2. Flow chart of the optimization procedure.
Processes 09 01211 g002
Figure 3. Grid independence test of model No. 4 with average scalar shear stress (SSS) and pressure head at the original design point (Q0 = 5.0 L/min, n = 2500 r/min).
Processes 09 01211 g003
Figure 4. Schematic diagram of pump performance test rig.
Processes 09 01211 g004
Figure 5. Experimental and simulation hydraulic performances of the original pump model No. 4.
Processes 09 01211 g005
Figure 6. Hydraulic performances of 10 test pumps at the original design point by CFD simulation (Q0 = 5.0 L/min, n = 2500 r/min).
Processes 09 01211 g006
Figure 7. Velocity vectors in the mid-height plane of impeller passage (z/b2 = 0.5) of different blade impellers and volutes at the original design point by CFD simulation (Q0 = 5.0 L/min, n = 2500 r/min).
Processes 09 01211 g007
Figure 8. Performances of 10 geometric optimizations based on the near-orthogonal array. The blue solid circles represent the 9 different designs while the red star represents the optimization design.
Processes 09 01211 g008
Figure 9. Simulated distribution of scalar shear stress (SSS) on the mid-height plane of test pump No. 10 at the original design point (Q0 = 5.0 L/min, n = 2500 r/min).
Processes 09 01211 g009
Figure 10. Maximum scalar shear stress (SSS) around the impeller area of six test pumps at the original design point by CFD simulation (Q0 = 5.0 L/min, n = 2500 r/min).
Processes 09 01211 g010
Figure 11. Probability distribution of scalar shear stress (SSS) of the model No. 10 at original design point by CFD simulation (Q0 = 5.0 L/min, n = 2500 r/min).
Processes 09 01211 g011
Figure 12. Hemolysis index of 5 test pumps (θt = 55°) at the original design point by CFD simulation (Q0 = 5.0 L/min, n = 2500 r/min).
Processes 09 01211 g012
Table 1. Main parameters of the original pump.
ParameterValue
Impeller inlet diameter D1 (mm)17
Impeller outlet diameter D2 (mm)50
Blade inlet angle β1 (°)25
Blade outlet angle β2 (°)26
Blade wrap angle θw (°)70
Number of impeller blades N4
Width of the impeller outlet b2 (mm)3
Width of the volute inlet b3 (mm)6
Volute tongue angle θt (°)55
Table 2. Control factors and levels from L10 near-orthogonal array.
No.Volute Tongue Angle θt (°)Blade Wrap Angle θw (°)
13060
25560
33070
45570
53080
65580
73090
85590
930100
1055100
Table 3. Numerical simulation results of the 10 pumps at the original design point.
No.Pressure Rise/mmHgMaximum SSS/Pa
1143.9132.4
2145.7138.1
3143.0104.1
4144.0104.9
5145.6143.0
6150.0208.6
7146. 9313.0
8150.5285.7
9148.5127.1
10149.8132.2
Publisher’s Note: MDPI stays neutral with regard to jurisdictional claims in published maps and institutional affiliations.

