
Analysis and Characterization of Metallic Nodules on Biochar from Single-Stage Downdraft Gasification

1
Department of Mechanical Engineering, University of Iowa, Iowa City, IA 52242, USA
2
Department of Sustainable Living, Maharishi International University, 1000 N 4th St., Fairfield, IA 52557, USA
*
Author to whom correspondence should be addressed.
Processes 2021, 9(3), 533; https://doi.org/10.3390/pr9030533
Submission received: 29 January 2021
/
Revised: 13 March 2021
/
Accepted: 15 March 2021
/
Published: 17 March 2021
(This article belongs to the Section Energy Systems)
Abstract
:Biochar, which is a byproduct of gasification, is used in a wide range of fields such as water filtration, agriculture, and electronics, to name a few. The metals in the biomass were thought to end up either in the ash or distributed throughout the biochar. In this study, the goal was a more thorough characterization of biochar resulting from a single-stage downdraft gasifier. One of the first observations was that some metals actually localize into small (~25 micron diameter) metallic nodules on the biochar surface. Further analysis included ultimate and proximate analysis, Brunauer–Emmert–Teller (BET) analysis, and scanning electron microscopy X-ray spectroscopy (SEM-EDS). Biomass fuel included corn grains, soybeans, and wood pellets, with wood biochar showing the highest fixed carbon content, at 91%, and the highest surface area, at 92.4 m2/g. The SEM analysis showed that certain minerals, including potassium, phosphorus, calcium, iron, nickel, silicon, and copper, formed nodules with over 50% metal mass next to pores in the carbon substrate. Aluminum, chlorine, magnesium, and silicon (in certain cases) were mostly uniformly distributed on the biochar carbon substrate. Corn biochar showed a high concentration in the nodules of 9–21% phosphorus and up to 67% potassium. Soybean biochar showed a similar trend with traces of iron and nickel of 2% and 4.1%, respectively, while wood biochar had a significant amount of potassium, up to 35%, along with 44% calcium, 3% iron, and up to 4.2% nickel concentrations. A morphology analysis was also carried out.
1. Introduction
Today, 85% of the world’s energy is supplied using conventional fossil fuel, which releases 56.6% of anthropogenic greenhouse gas emissions [1]. The development of renewable energy has been the focus of attention for several decades because it promises energy independence and sustainability. Biomass gasification, in addition to other renewable energy technologies, is one of the possible routes through which carbon-neutral energy can be produced. Gasification is a process that converts organic carbonaceous materials at high temperatures into fuel gas, heat, and biochar.
Biochar, according to the International Biochar Initiative, is defined as “a solid material obtained from thermochemical conversion of biomass in an oxygen-limited environment” [2]. There are several processes for producing biochar: slow pyrolysis, fast pyrolysis, and gasification [3]. Gasification is a state-of-the-art method through which energy is produced from biomass [4]. The advantage of this process over others is that it produces syngas composed of H2, CO, CO2, and CH4, which can be used for energy and fuel. The highest biochar conversion rates so far are 35% using slow pyrolysis, 12% using fast pyrolysis, and about 10% through gasification. The lower percentage is due to the presence of a higher presence of oxygen and air [4,5,6,7].
Biochar, a by-product of gasification, can be used in a wide range of contexts, such as soil health, agricultural productivity, and energy-related initiatives related to environmental conservation. In agriculture, for example, it can be used as a soil amendment, applied in water treatment [4], and used as supplementary material in composting and fermentation [8,9,10,11,12,13]. In recent years, there has been a significant decrease in crop yields due to the reduction of arable farmlands and due to the changing climate [14,15,16]. This has also affected organic production systems, where crop yields are about 5–34% lower than in conventional farming [17,18,19]. The use of biochar for soil remediation, especially in degraded regions, has been strongly encouraged [19,20,21], and biochar has been seen as one of the main solutions to reducing the organic yield gap [19,22], while promoting a better ecosystem and carbon storage [19,23,24,25,26]. Biochar can also be used as a filter [27,28,29,30,31] for tar reduction in pyrolysis and gasification processes. Other applications of biochar also include using it in animal farming (as a feed additive, slurry treatment) [32,33], in the building sector (in insulation, air decontamination, humidity regulation), in electronics (in semiconductors and batteries) [34] and in metallurgy (in metal reduction) [32].
Biochar has physical properties that include its specific surface area, pore size, pore volume, and average pore diameter [35]. The surface area is measured in m2/g, and several studies have considered it one of the most important parameters for most applications [36]. Some gasification studies have shown that the surface area of biochar, depending on the parameters and fuel blend, may reach 88 m2/g to 342 m2/g [37,38,39,40,41,42], while most activated char, which requires an extra process, falls between 300 and 1700 m2/g [41,42]. The porosity depends on a wide range of factors such as gasifier design and biomass properties. A study using a lab scale fluidized bad gasifier found an increase in surface area from 1 to 10 m2/g with an increase in equivalence ratio from 0.2 to 0.28 [43]. Depending on the type of biomass used, the carbon content of biochar is in the range of 50–90%, with water content of about 1–15%, volatile substances up to 40%, and mineral substances up to 5% [4].
There are also several mineral contents present in the biomass. During thermal degradation, potassium and chlorine ions have been found to be highly mobile and vaporize at relatively low temperatures. Calcium is mainly located in cell walls as silica or as opal phytoliths. Both calcium and silicon are released during degradation at much higher temperatures than potassium and chlorine. Magnesium is ionically and covalently bonded with organic molecules and only vaporizes at high temperatures. Phosphorus and sulfur are associated with complex organic compounds within the cell and are relatively stable at low degradation temperatures. Other elements, such as iron and manganese (Mn), exist in some organic and inorganic forms in the biomass and are largely retained during biochar formation [44]. However, little work has been carried out to understand the stability and formation of heavy metals in biochar [44]. Biochar, especially that from chicken manure and activated carbon, is known to absorb heavy metals. There are also not many publications on the distribution of minerals within different types of biochar [44]. In some biochar, K and Ca minerals are present in both element and compound forms. Minerals in biochar may include sylvite (KCl), quartz (SiO2), amorphous silica, calcite (CaCO3), hydroxyapatite (Ca10(PO4)6(OH)2), and other minor phases such as calcium phosphates, anhydrite (CaSO4), and various nitrates, oxides, and hydroxides of calcium (Ca), magnesium (Mg), aluminum (Al), titanium (Ti), manganese (Mn), zinc (Zn), or iron (Fe) [44]. The presence of such minerals in biochar is interesting. The United States recently passed an executive order to reduce the reliance on foreign countries that import minerals. The call to action is to advance transformational research and development of minerals. Examples of such minerals include manganese (Mn), potas (K2O), graphite, and magnesium metal, to name a few [45,46]. A theoretical possibility would be to explore the presence of such minerals in biochar and possible uses for them.
This study looked into the characterization of biochar from a pilot single-stage downdraft gasifier. Several tests, such as Brunauer–Emmett–Teller (BET) surface area, ultimate and proximate analysis, and scanning electron and X-ray analysis, were carried out on biochar resulting from uniform fuels such as corn grains, soybeans, and wood pellets as the main feedstock. The goal of the study was to further investigate and characterize the physical and chemical properties resulting from the gasification of biomass in a single-stage gasification system. It also explores the morphology and chemical composition of the resulting biochar. There are not many studies that look into the SEM analysis of biochar from gasification [47], and the authors are not aware of any SEM-EDX that specifically look at resulting biochar from corn grain and soybean resulting biochar. We believe that metal nodule formation in pyrolyzed or gasified biomass examined in this work is completely new and has never before been reported in the literature. We believe that this discovery will open many new avenues of investigation into both the formation process and applications involving metal aggregation and harvesting.
2. Materials and Methods
2.1. Materials: Biomass
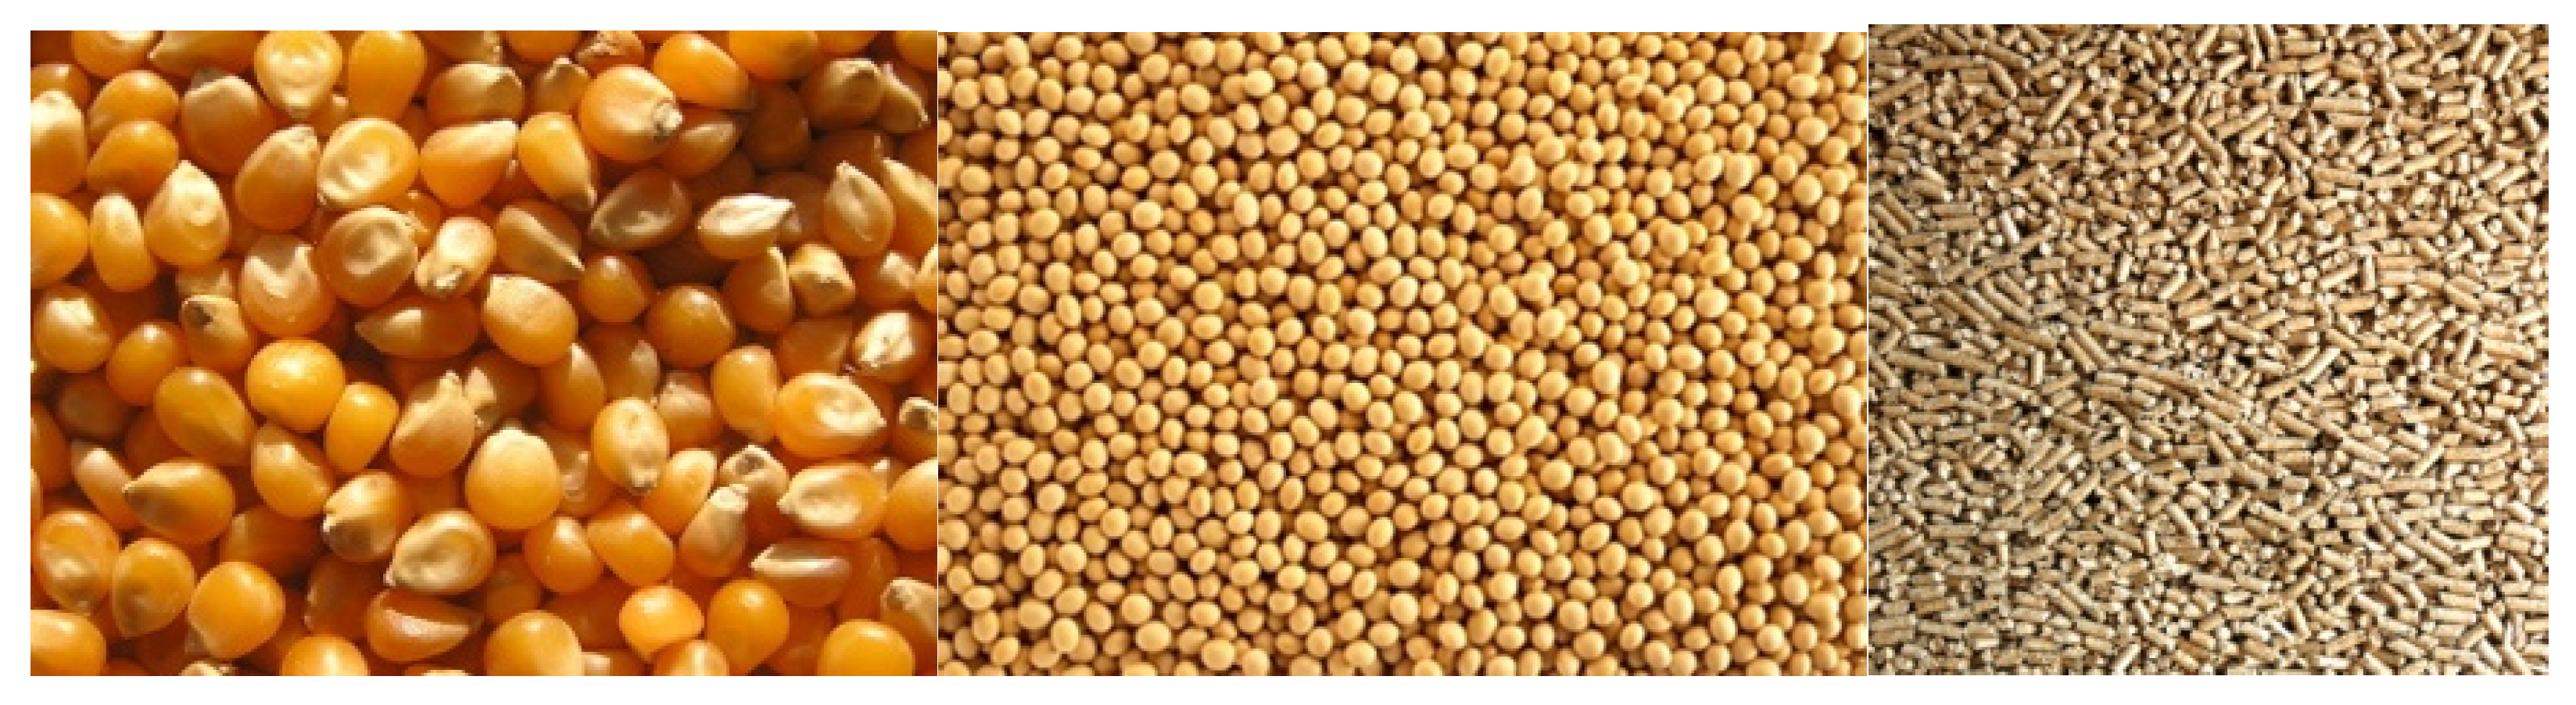
The primary input materials used for the one-stage gasifier were corn grains, soybeans, and wood pellets, as shown in Figure 1. Corn grains and soybeans were used due to their high availability in Iowa, while wood pellets were used because of their uniformity. The corn and soybean grains were considered waste as they were 1–2 years old, with a blend of coated and non-coated seeds, and were considered unusable. About 10% of the seed corn goes unplanted by farmers and is usually disposed using a landfill or incineration. The wood pellets were locally available and were made up of beetle kill wood that had to be chopped down for other purposes. The ultimate and proximate analyses are presented in Table 1 was done through an external lab called Keystone Materials Testing (Kmtlabs) in Newton Iowa. The procedure has been documented in Section 2.2.2. Among the three fuels, wood pellets had the highest heating value, followed by soybeans and corn. Corn grains had the highest amount of fixed carbon, at 17.15%. All three fuels had a small percentage of sulfur present.
2.2. Methods
2.2.1. Single-Stage Downdraft Gasifier
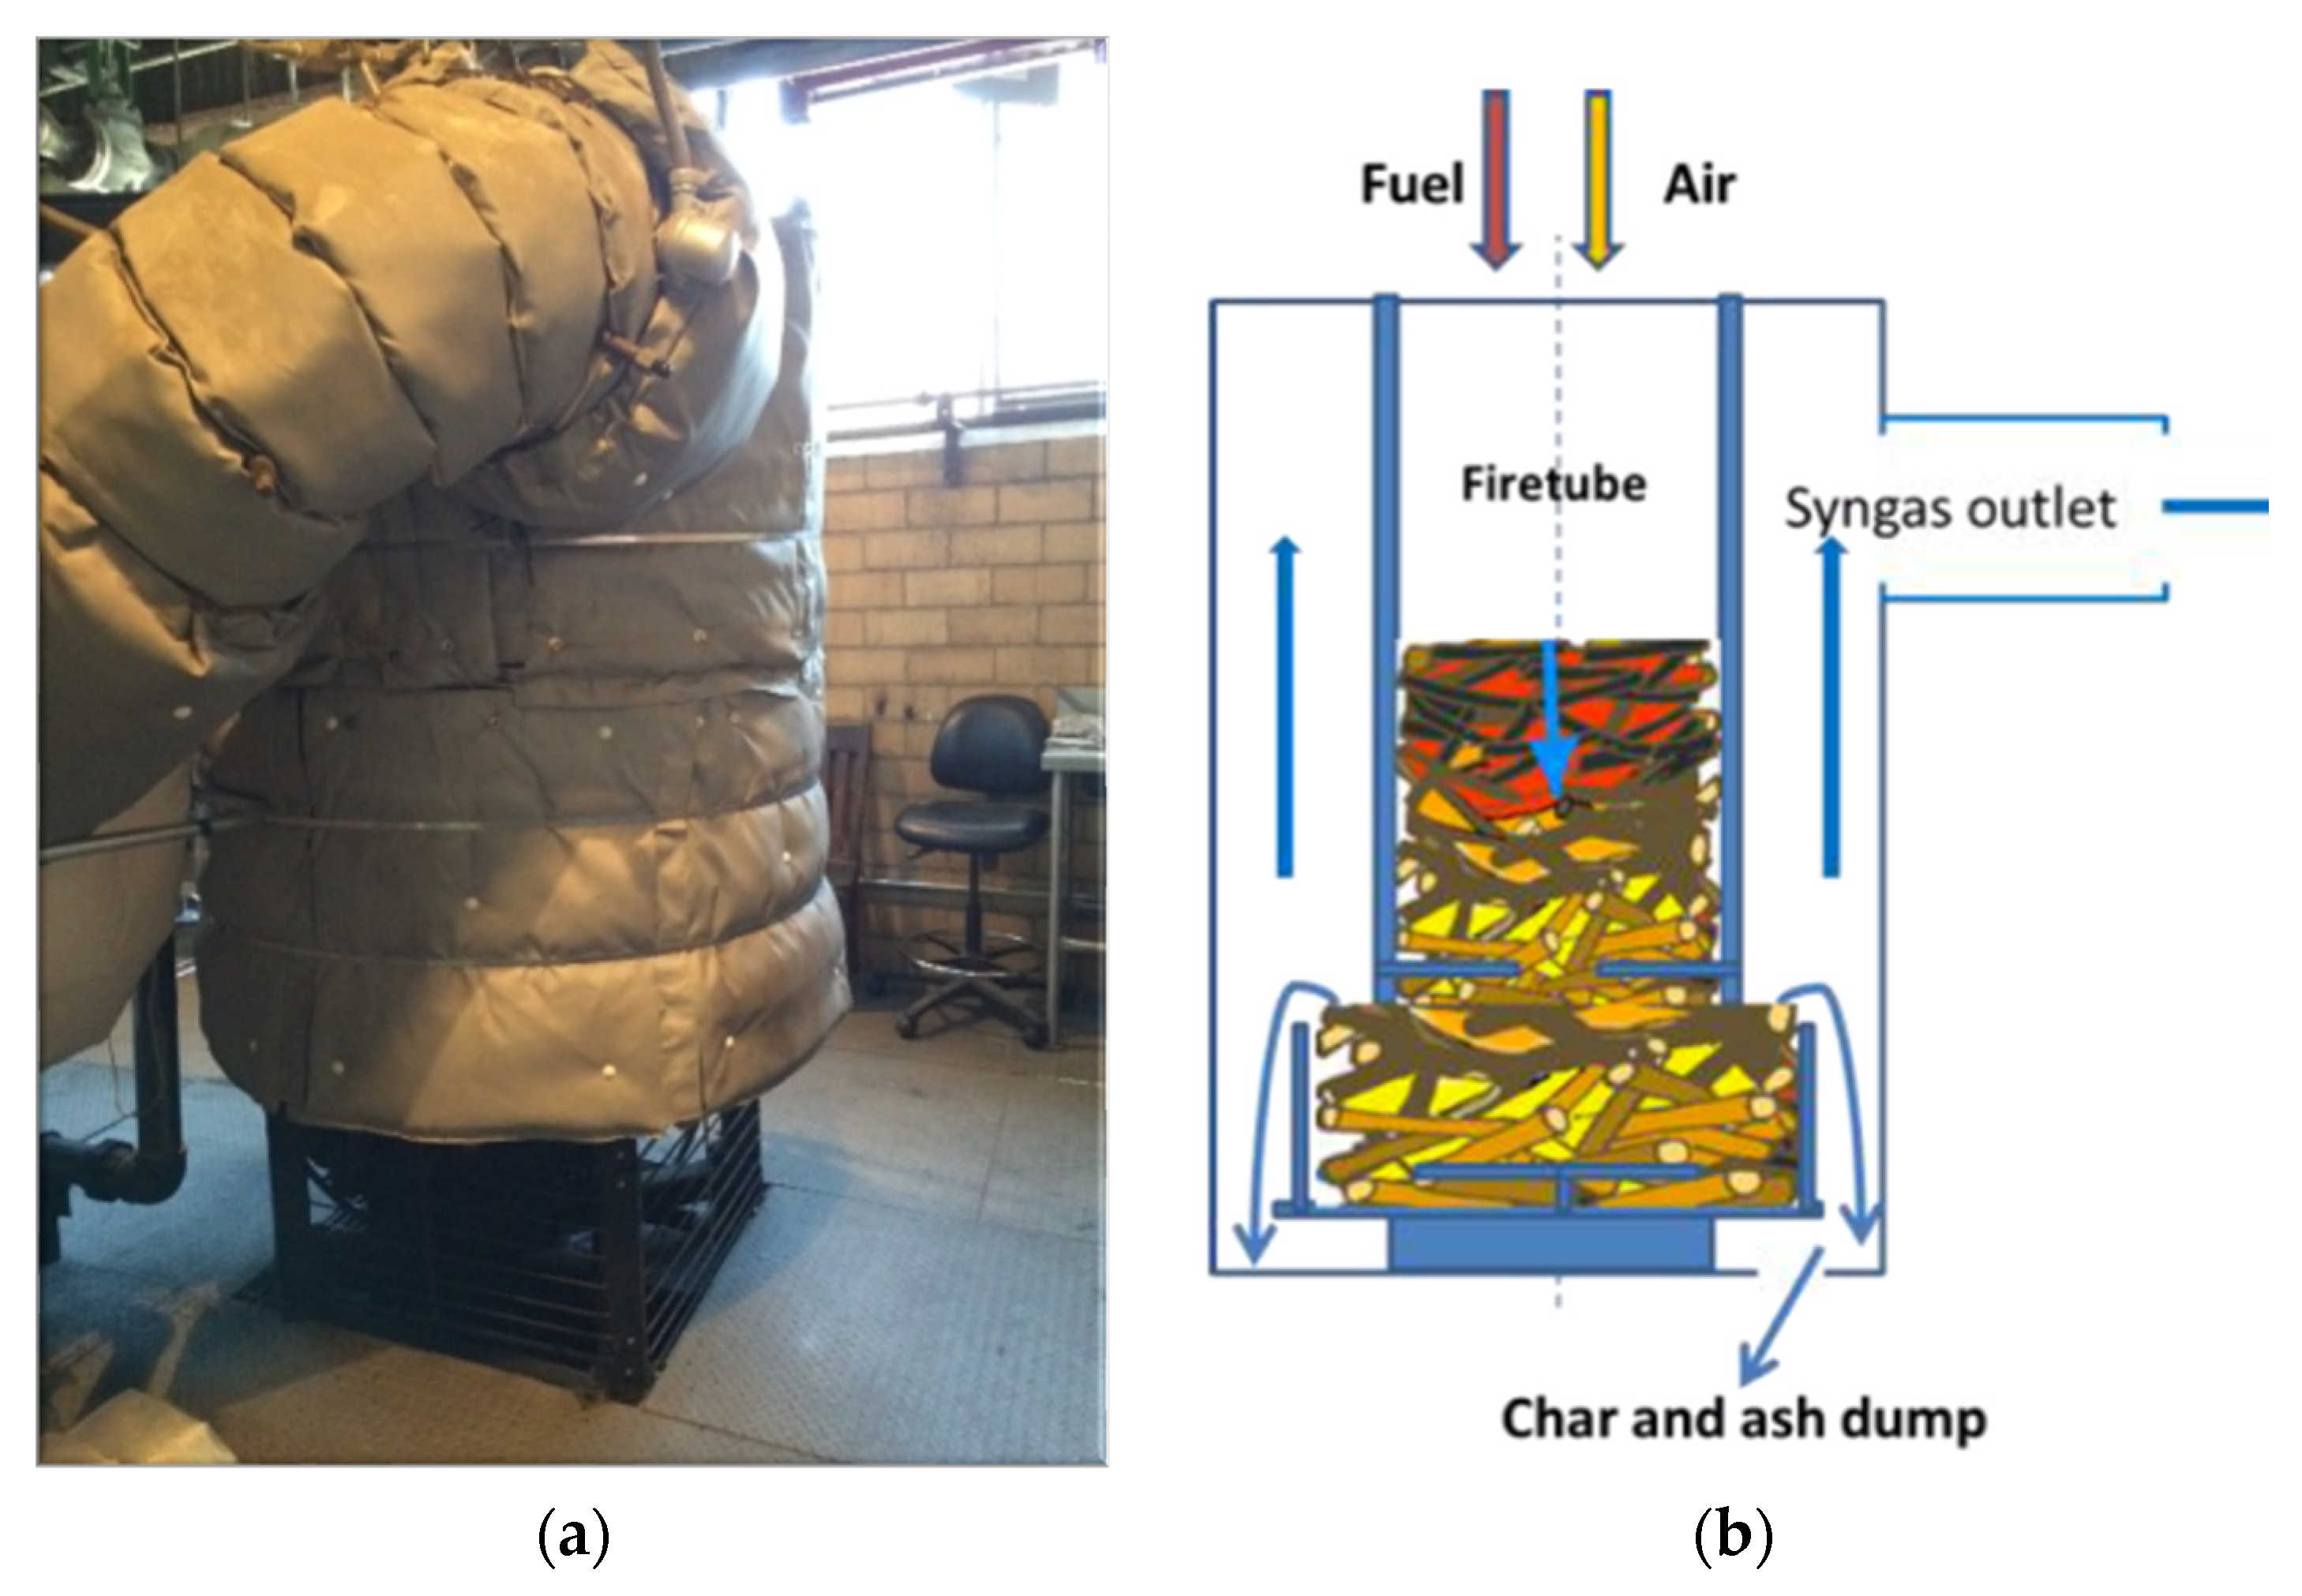
A single-stage downdraft gasifier was used for this experiment, as shown in Figure 2. It is a 410–586 kWh (1.4–2 MM Btu) system and measures 114.3 cm (45.5 in) diameter and is 257.81 cm (101.5 in) tall. Within it are an internal fire tube and a rotating table that allows biochar to be collected from the bottom of the systems [48]. The experimental parameters are presented in Table 2. The average input rate of the fuel was 22.7 kg/h (50 lbs/h). A summary of the experimental configuration is provided in Table 2. For this experiment, the gasifier was operated with the intention of producing biochar. Biochar is a sellable product. The biomass feed rate was controlled and the temperature was monitored to reduce syngas production and to increase the resulting biochar. The conversion rate of biomass to biochar was 20%. Some studies have shown that gasification experiments usually have a 10% conversion rate [4,5,6,7].
2.2.2. Proximate and Ultimate Analyses
The proximate and ultimate analyses of the biochar were done in a lab called Keystone Material Testing in Newton, Iowa. The proximate analyses were performed on a TruSpec Thermogravimetric Analyzer (TGA) manufactured by LECO instruments, manufacturer located in St. Joseph, MI, USA using the ASTM D7582 standard. The moisture content of the sample was calculated by heating the sample to 107 °C until the moisture was removed. The sample was heated to 950 °C using nitrogen and then to 750 °C using oxygen to measure the volatile matter and ash content, respectively. The sulfur analysis was done using a LECO Tru Spec Sulfur analyzer, manufacturer located in St. Joseph, MI, USA using ASTM D4239. The carbon, hydrogen, and nitrogen were analyzed using a LECO TruSpec CHN analyzer, manufacturer located in St. Joseph, MI, USA using ASTM D5291. The samples were heated to 950 °C and the resulting gas was filtered. The gas was carried by helium gas over a hot copper train to remove oxygen, over NaOH to remove CO2, and over magnesium chlorate to remove H2O. Carbon and hydrogen were measured using infrared cells, and nitrogen was measured using a thermal conductivity cell. The calorific value analyses were performed on a Parr 6300 Isoperibol Oxygen Bomb calorimeter, manufacturer located in Moline, IL, USA, using ASTM D240.
2.2.3. BET Surface Analyses
A BET analysis provides a precise, specific surface evaluation of materials by gas multilayer adsorption. A Nova 4200 instrument, manufacturer located in Rehovot, Israel was used to calculate the specific area of the biochar with a nitrogen adsorption method. A degassing temperature of 150 °C and a degassing time of 10 hours were set. The samples were initially heated using heating pads to remove any contaminants from the surface area of the biochar to get an accurate measurement. Liquid nitrogen was used as a coolant to facilitate the absorption process during the analysis.
2.2.4. Scanning Electron Microscope and Electron Dispersive X-ray Analysis
Hitachi S-4800 scanning electron microscopy (SEM) and electron dispersive X-ray analysis (SEM-EDX), manufacturer in Tokyo, Japan were carried on all three resulting biochars. Using the SEM, the pore areas and structures were analyzed, and using X-ray analysis, the mineral content of the biochar was analyzed. The samples were mounted on a carbon disk and were inserted in a vacuum-sealed microscope for analyses. The morphology and mineral formation of the char was examined. Some studies have shown SEM-EDX to be an effective way to study the structural characteristics of biochar [47]. The resulting images where carefully chosen for this paper. We looked at a wide variety of data points across all three resulting chars.
3. Results and Discussion
Ultimate and proximate analyses, a BET surface area study, and a SEM surface area study including X-rays were carried out on the resulting corn, soybean, and wood pellet biochar [48].
3.1. Ultimate and Proximate Analyses
Table 3 shows the ultimate and proximate analyses of all the resulting biochar samples. It shows that biochar from corn, soybean, and wood all had a high fixed carbon content. The highest carbon content observed was in wood, with 91% fixed carbon, followed by corn and soybeans. Some studies have shown that the amount of fixed carbon increases with an increase in temperature and that most biochar fixed carbon content is in the range of 0–77% [49]. High fixed carbon content biochar also leads to higher purity of biochar [50]. The amount of sulfur obtained from the biochar appears to be under 0.15% for all resulting biochar. Soybean char can be seen to have a lower ash content than that corn grain char, despite the opposite in the original biomass. This could possibly be due to the age of the soybeans. The soybean material used were about 1–2 years old and this may have affected the results.
3.2. BET Surface Analyses
Table 4 provides a summary of all the surface areas produced and compares them with other studies. We see that the largest surface area was that of wood biochar, at 92.4 m2/g, which is similar to the range of 32.36–95.10 m2/g [51,52] produced from pyrolysis. The surface areas of corn and soybeans were in a similar range and were found to be much less porous than that of wood biochar. Typical biochar surface areas from gasification systems have ranged from 0 to 342 m2/g [37,40,41], depending on the fuel blend and gasification parameters. For applications such as those in agriculture, the ability to provide microbial habitats, soil aggregating nuclei, and water retention greatly depends on the surface area [53].
3.3. Scanning Electron Microscope and Electron Dispersive X-ray Analysis
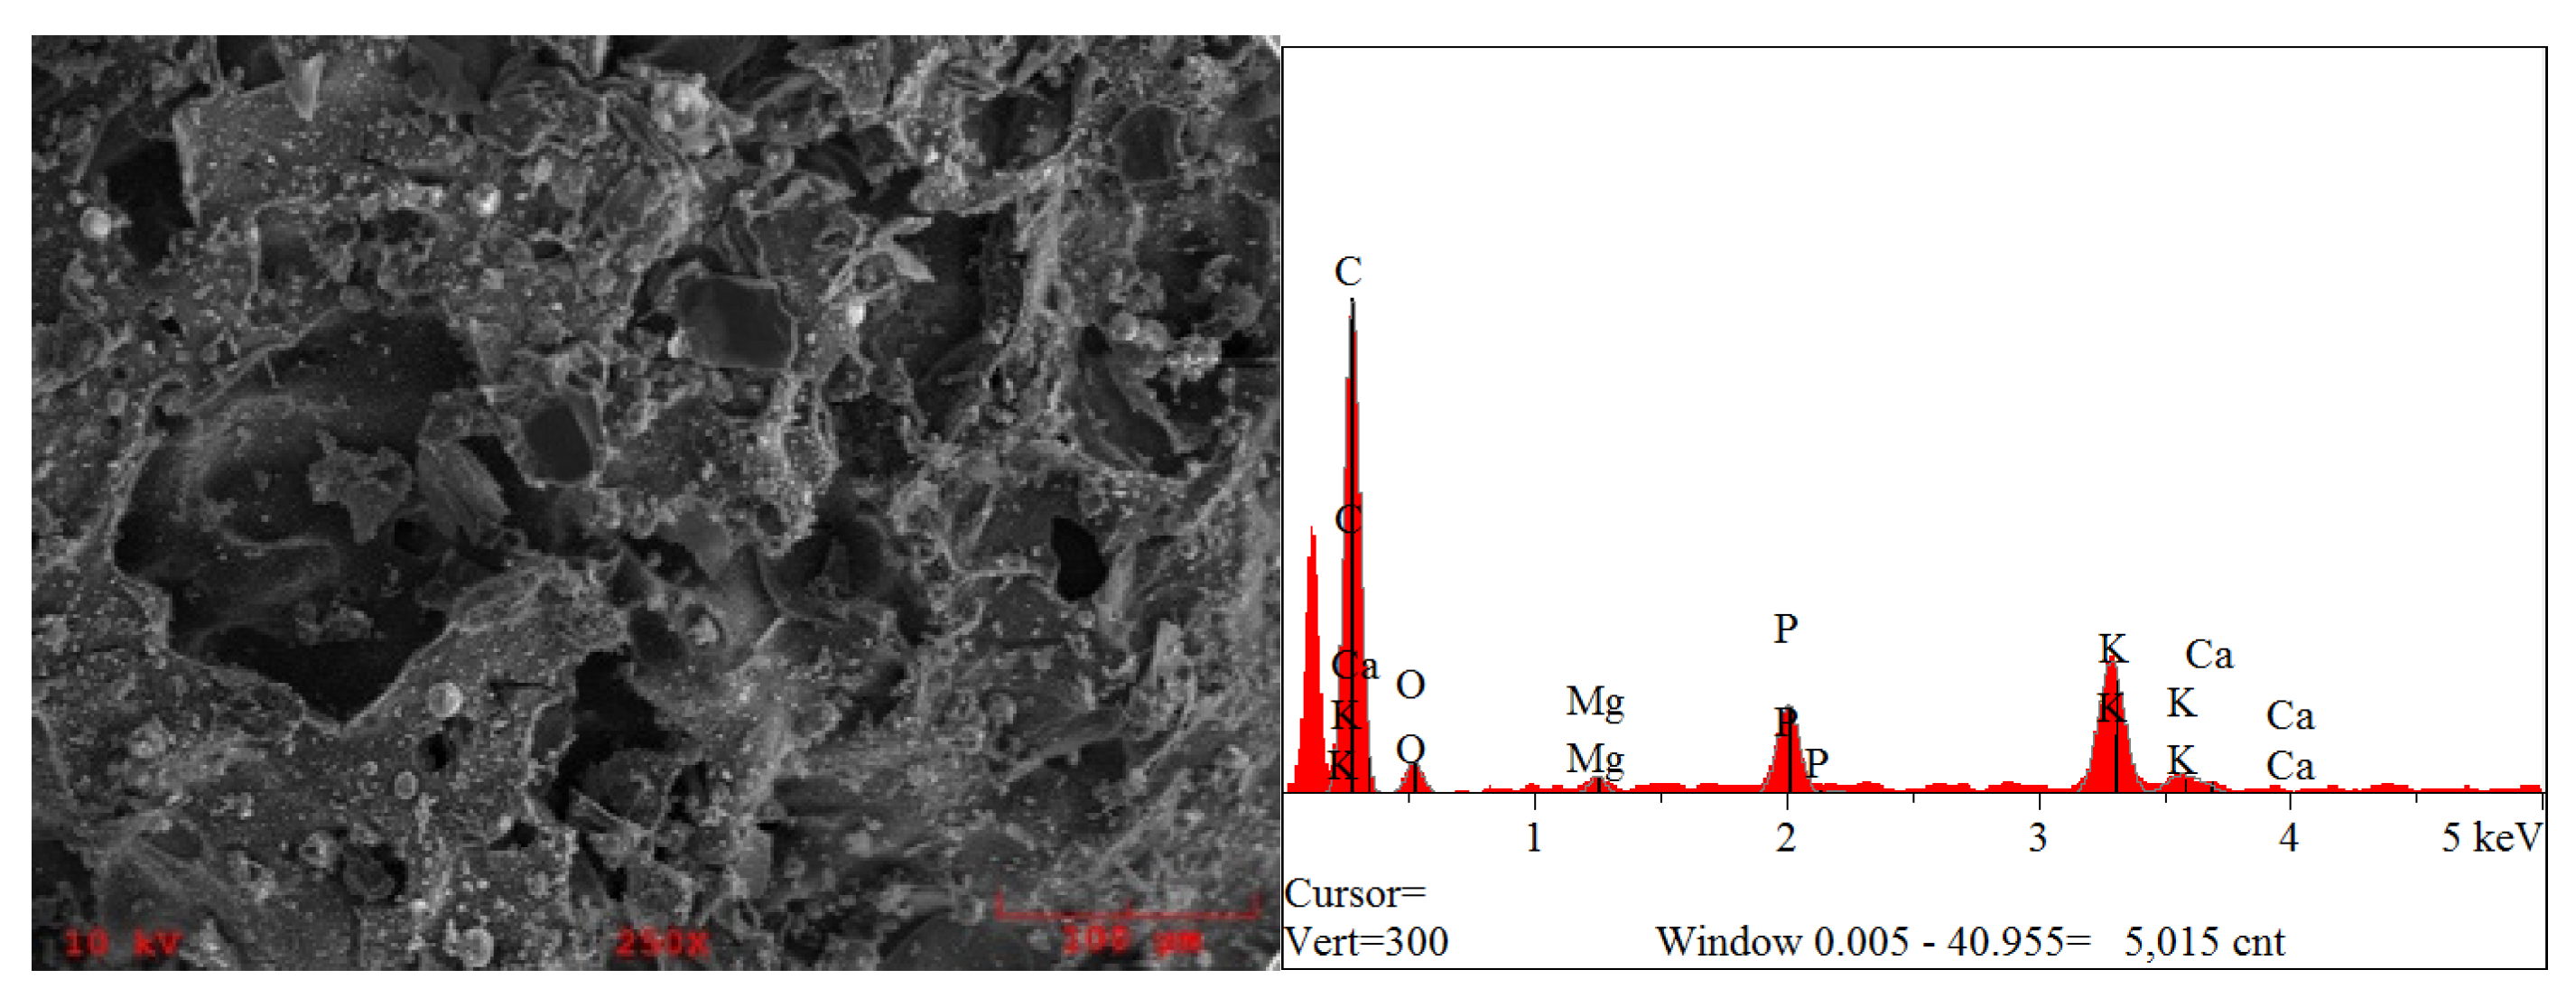
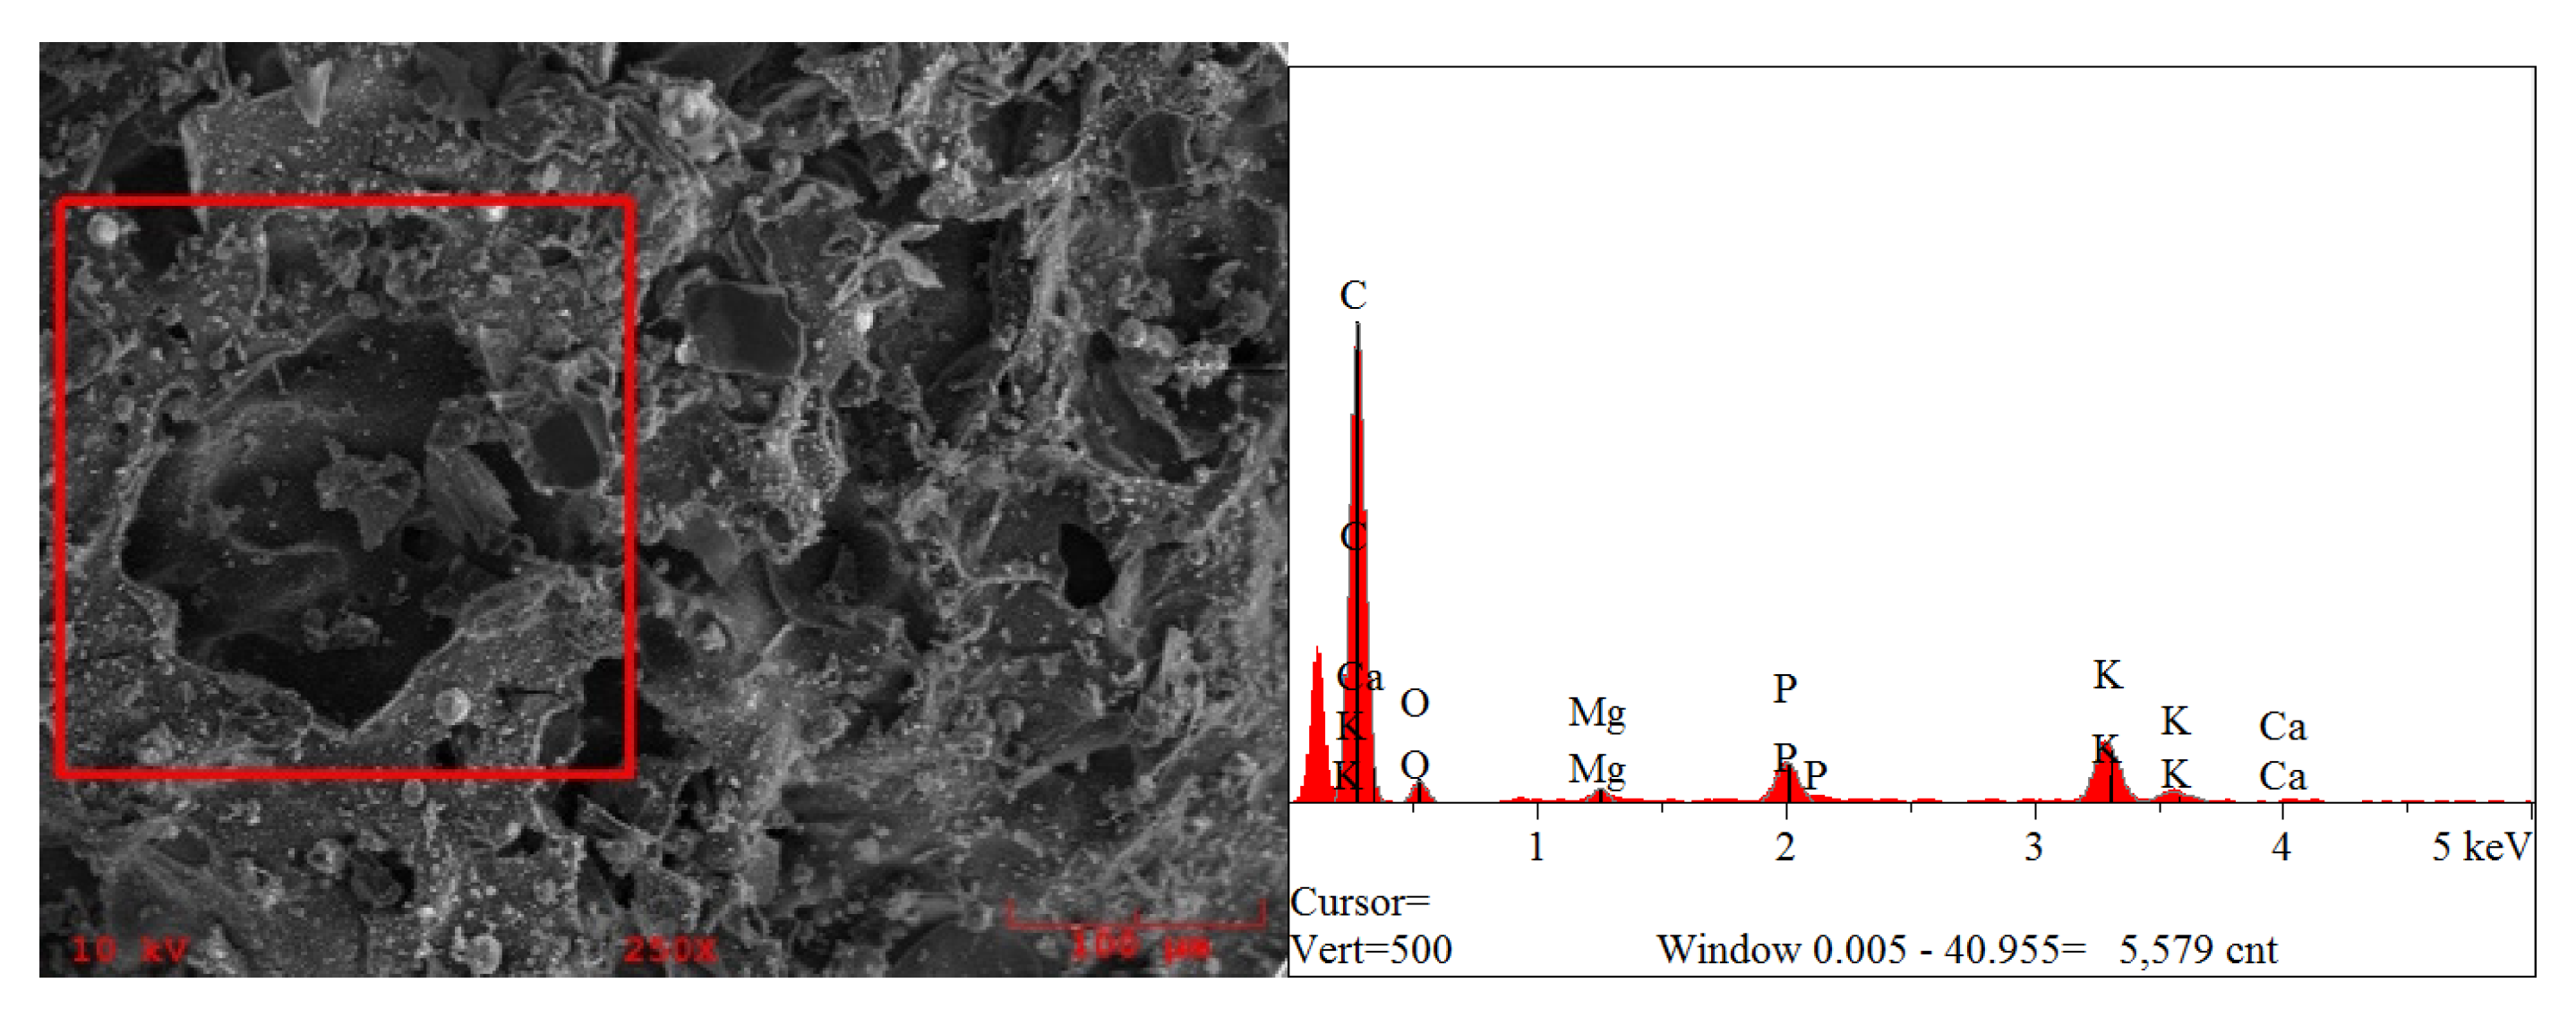
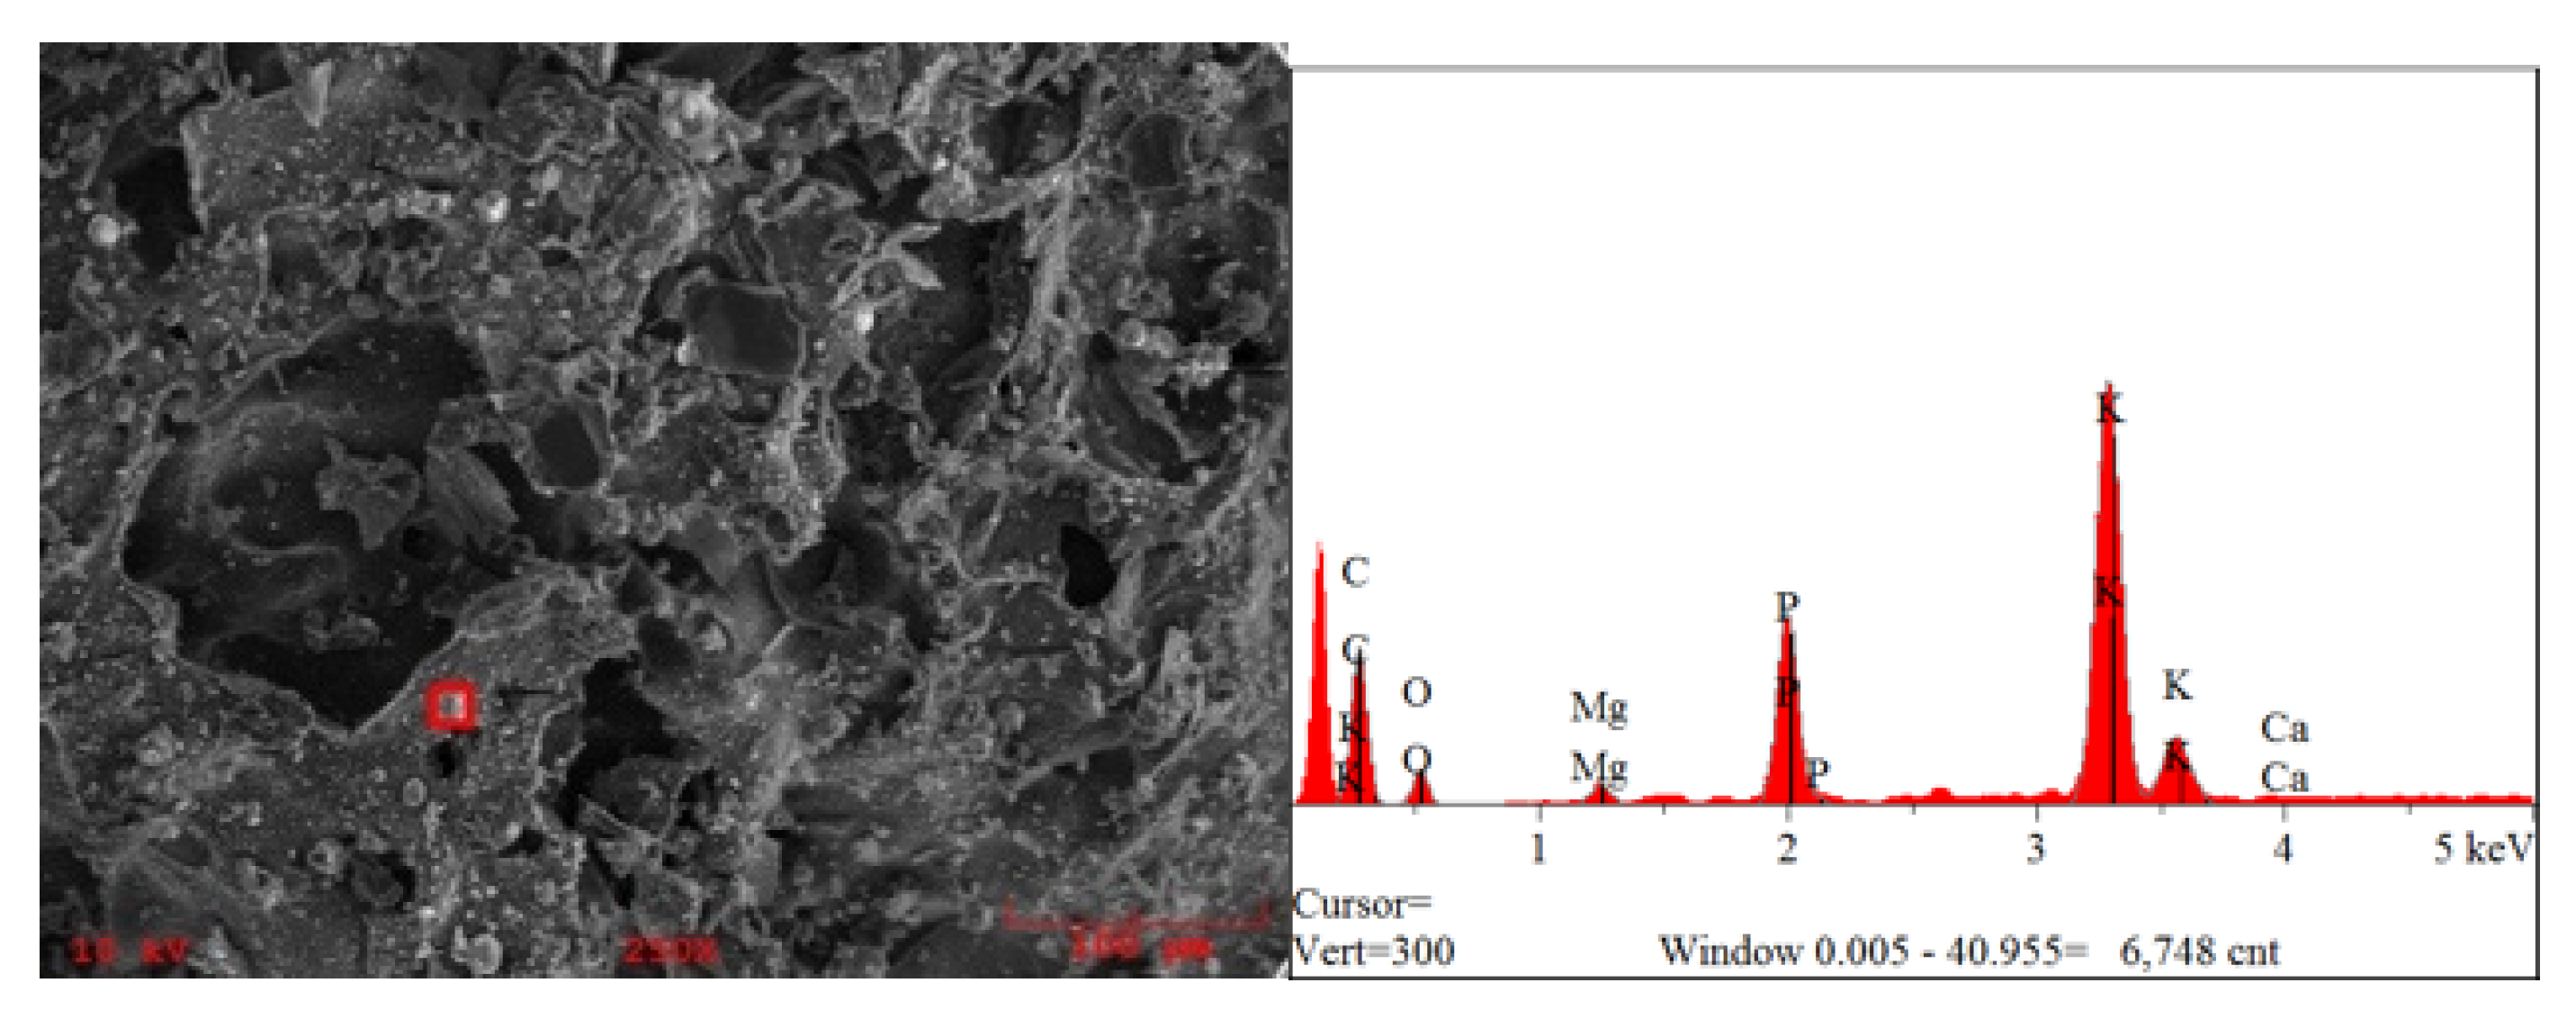
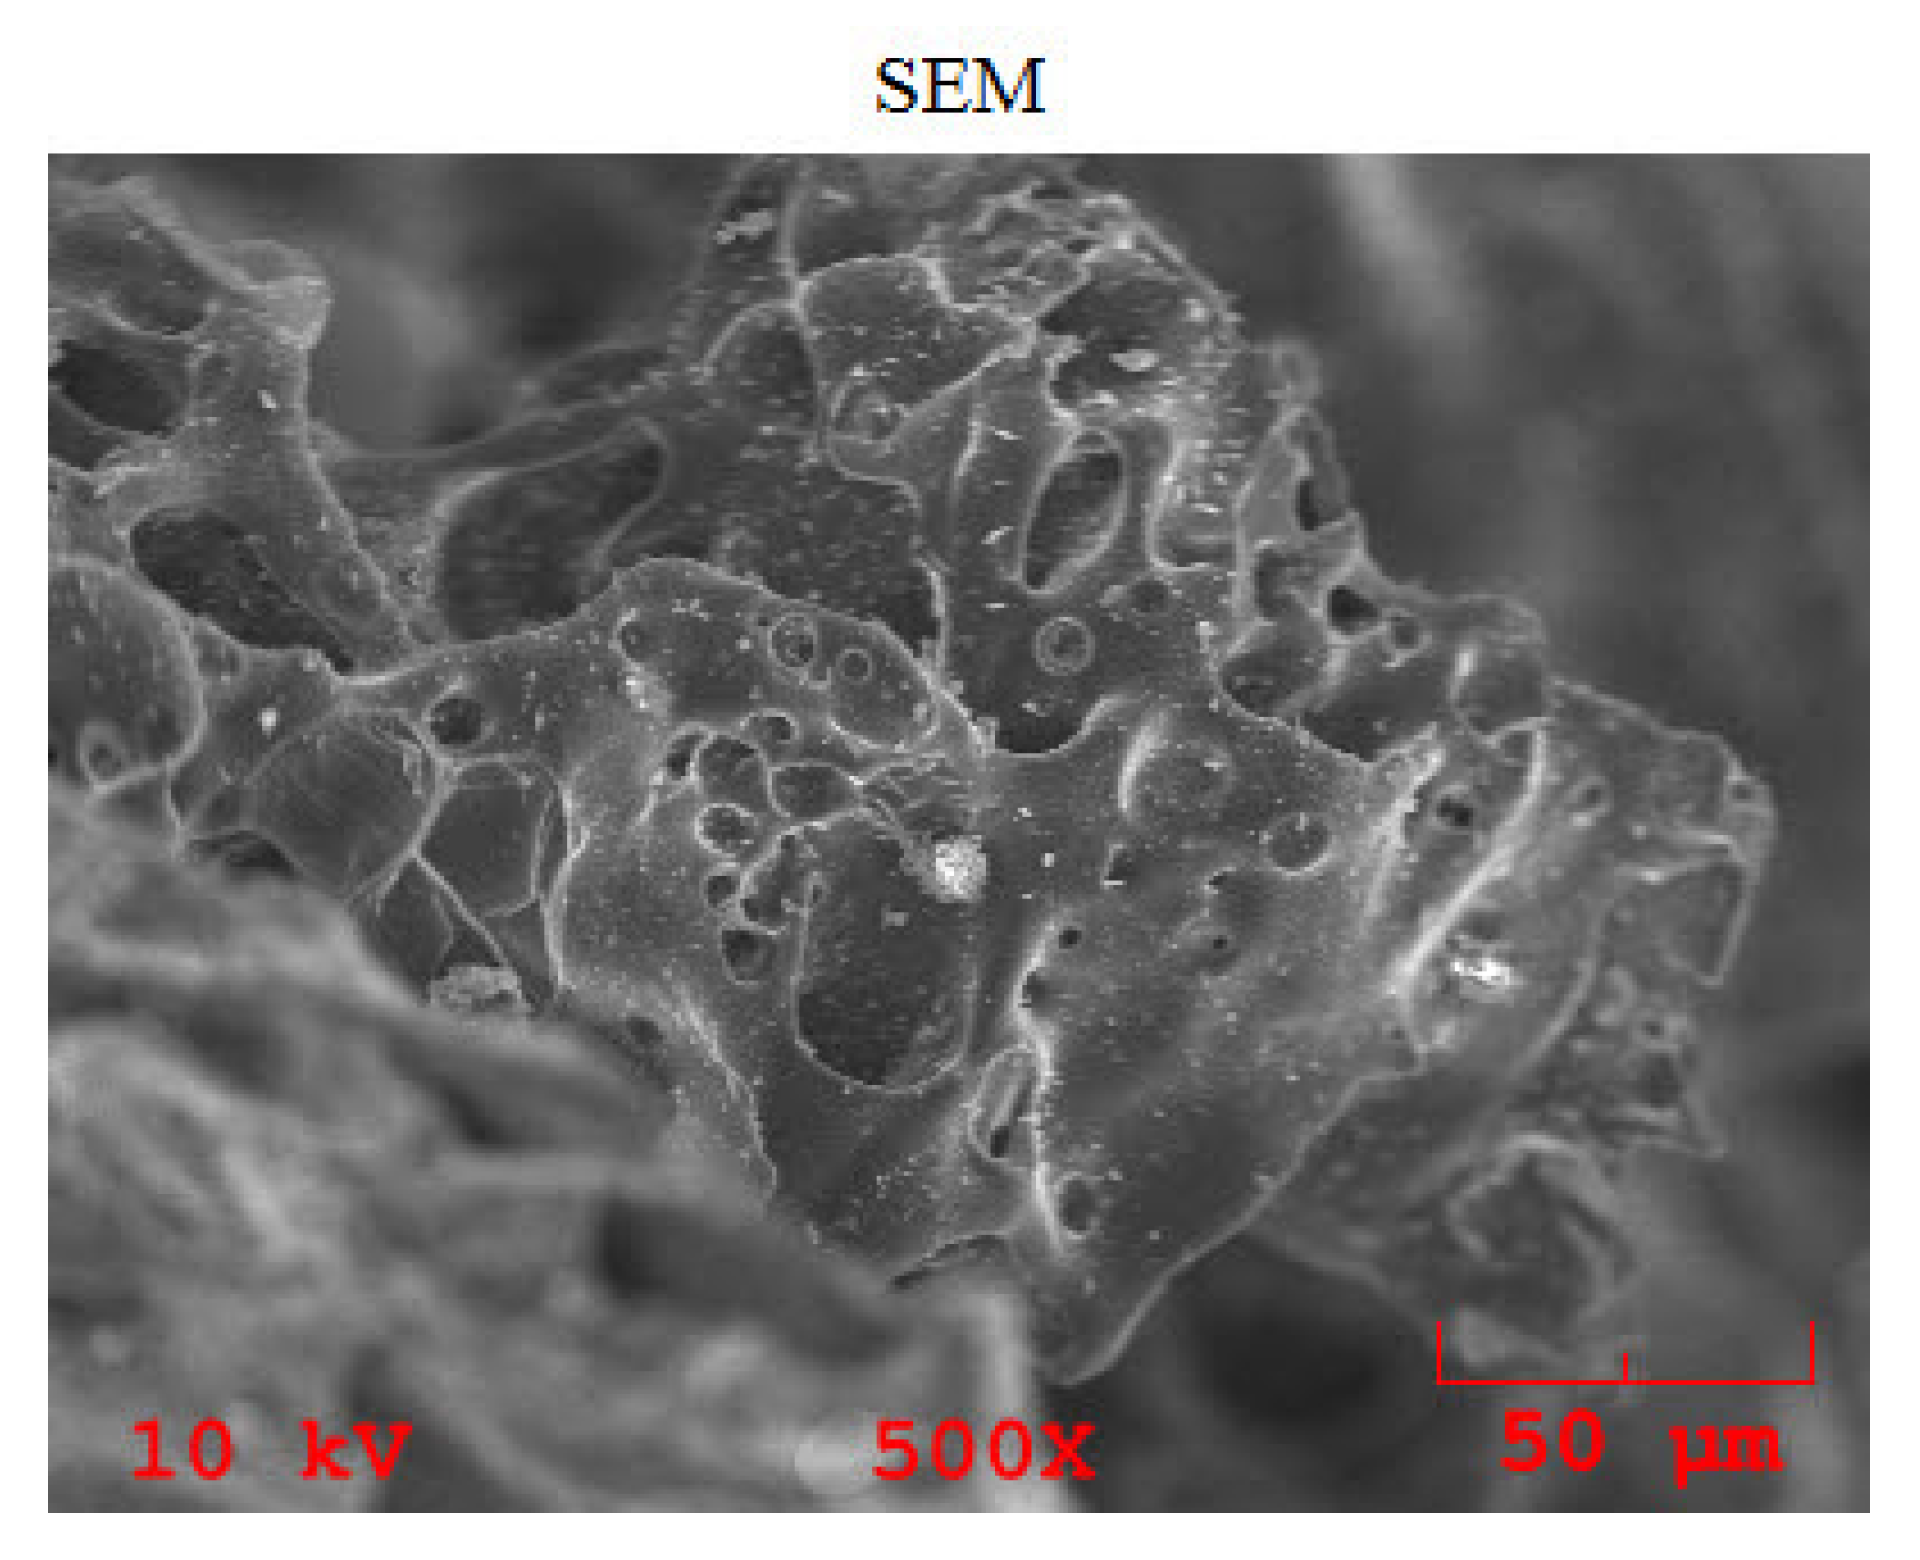
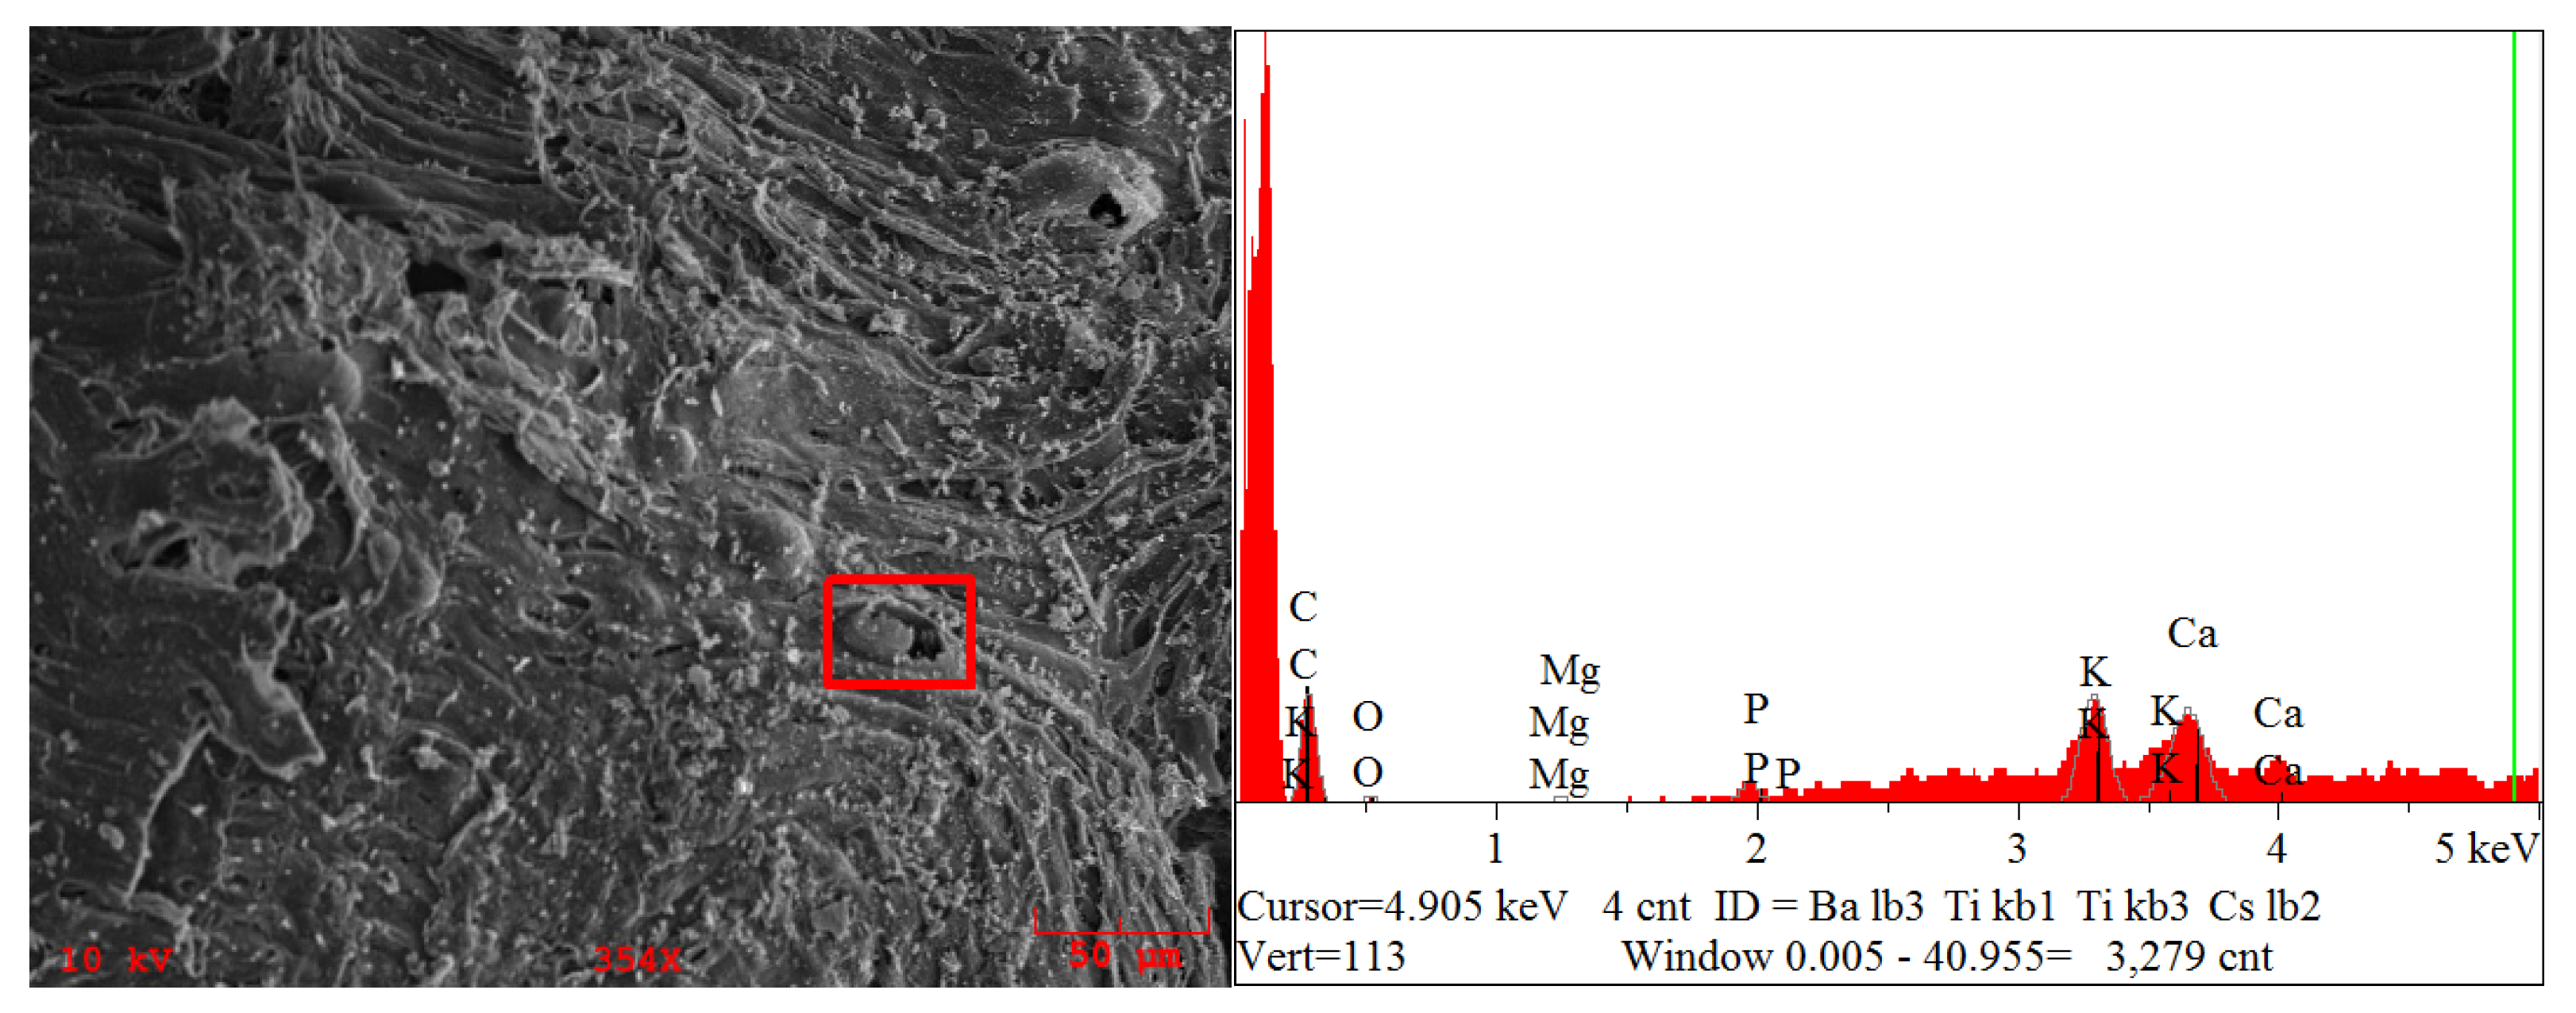
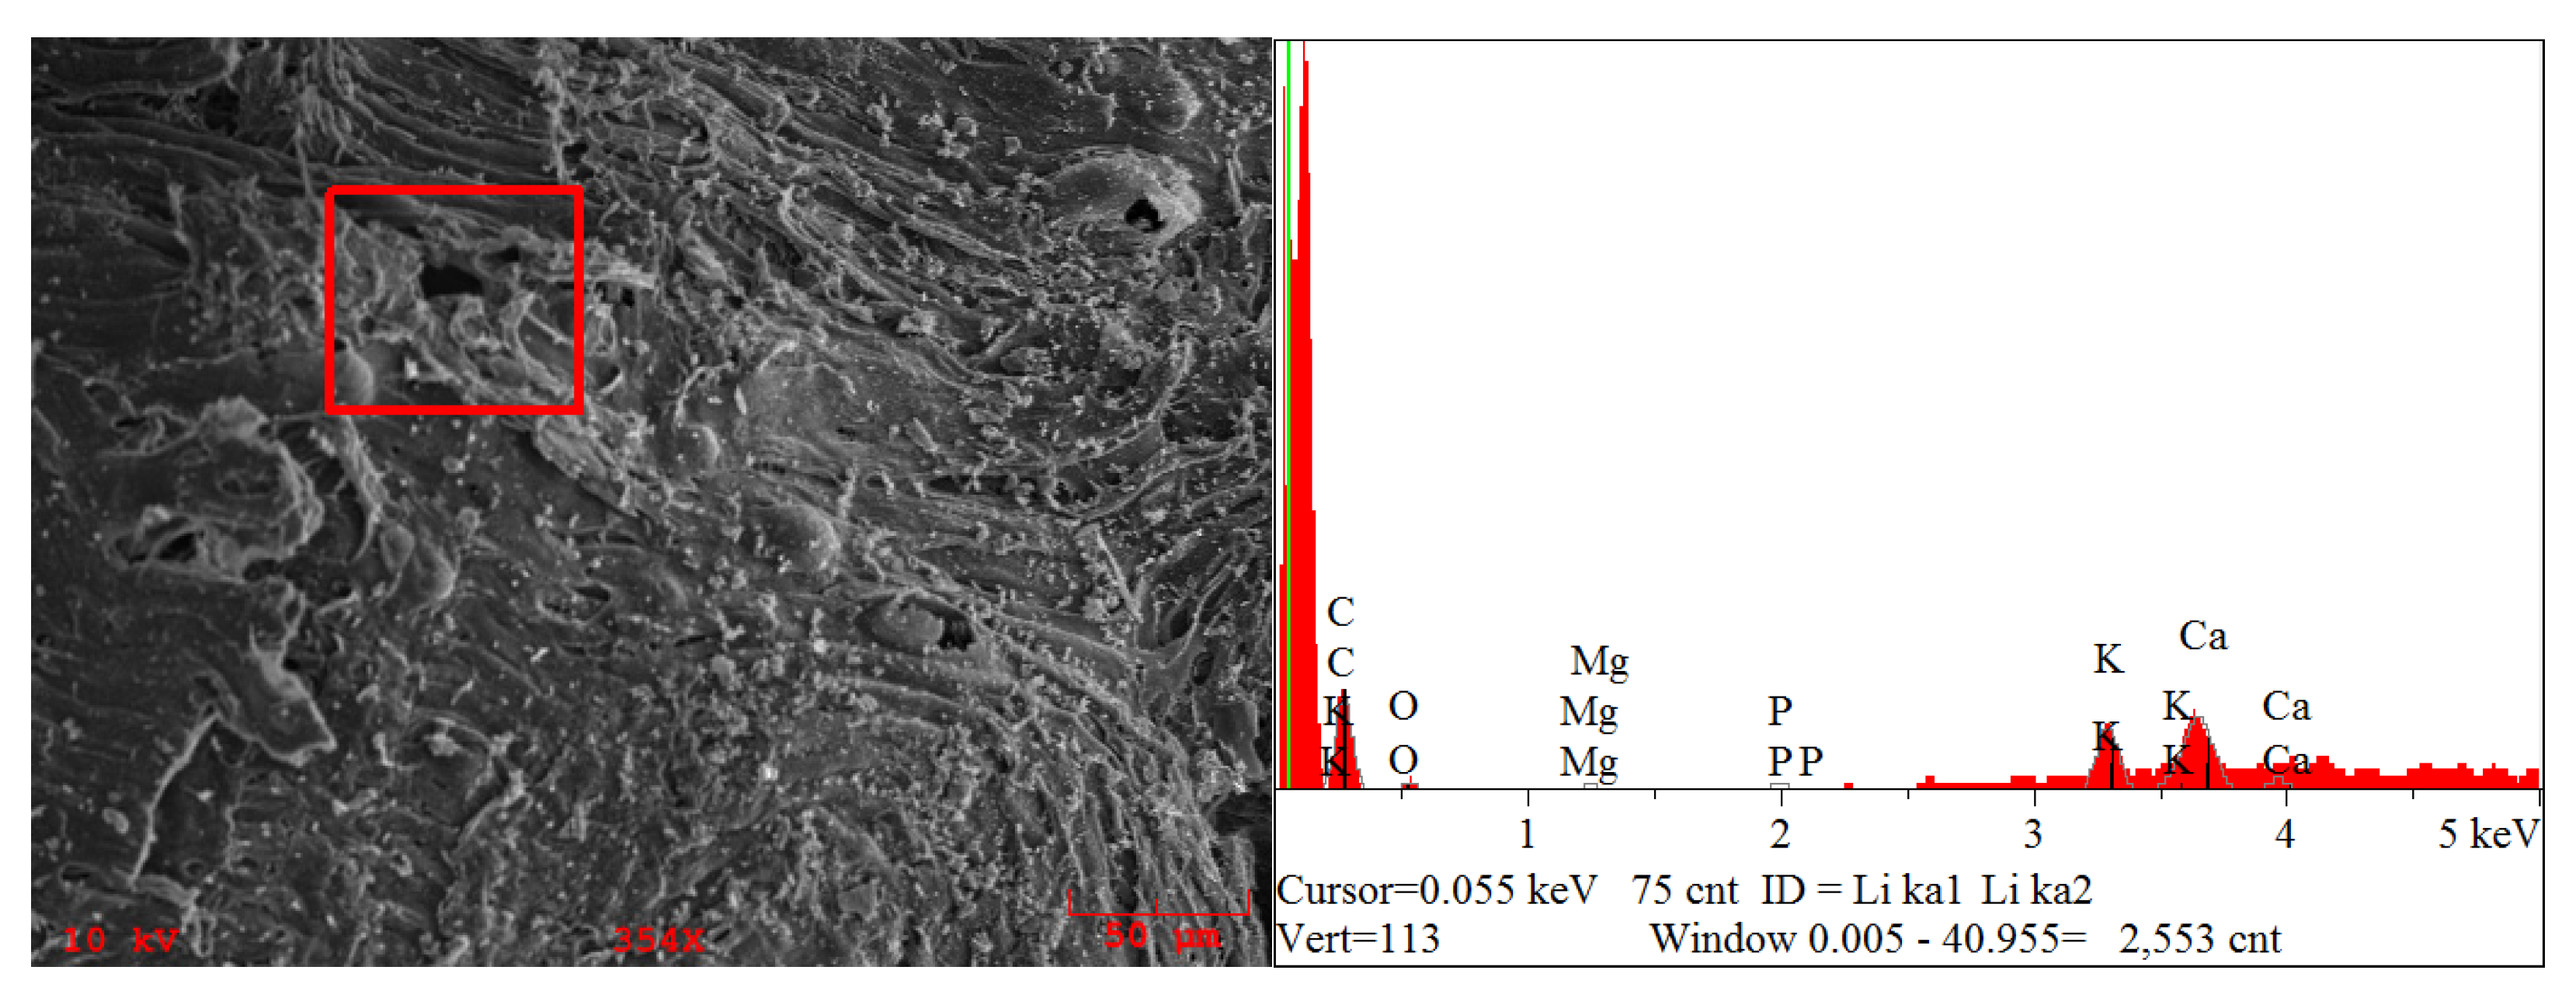
As shown in Figure 3, corn biochar from the downdraft gasifier had a wide range of pore openings, from 20 to 200 microns. The first round of X-ray analysis, presented below, showed traces of elements other than carbon. Potassium (K) and phosphorus (P) minerals were found on the surface area of the char in concentrations of 31.7% and 9.6%, respectively. To understand where these particular minerals were located, different regions were examined. As shown in Figure 3, these minerals were located next to the pores. The minerals are spread out throughout the surface. For example, in Figure 3, Potassium is spread out in the beginning region of the image and also towards the end. The resolution used in the SEM image was 250×. This shows that the mineral appears in concentrations on the surface. Figure 4 and Figure 5 follows a similar trend as that of Figure 3. Figure 4 explores the mineral concentration particularly next to a porous region which is about 150 microns wide. Traces of minerals are also observed in Figure 4. In Figure 5, the mineral appears in nodule concentration of approximately 10 microns. The mineral content deposit next to the pore in Figure 5 has a high concentration of potassium and phosphorus, of 67.4% and 13.4%, respectively. The initial scans of porous areas on the corn surface were captured, and the minerals next to the pores were analyzed.
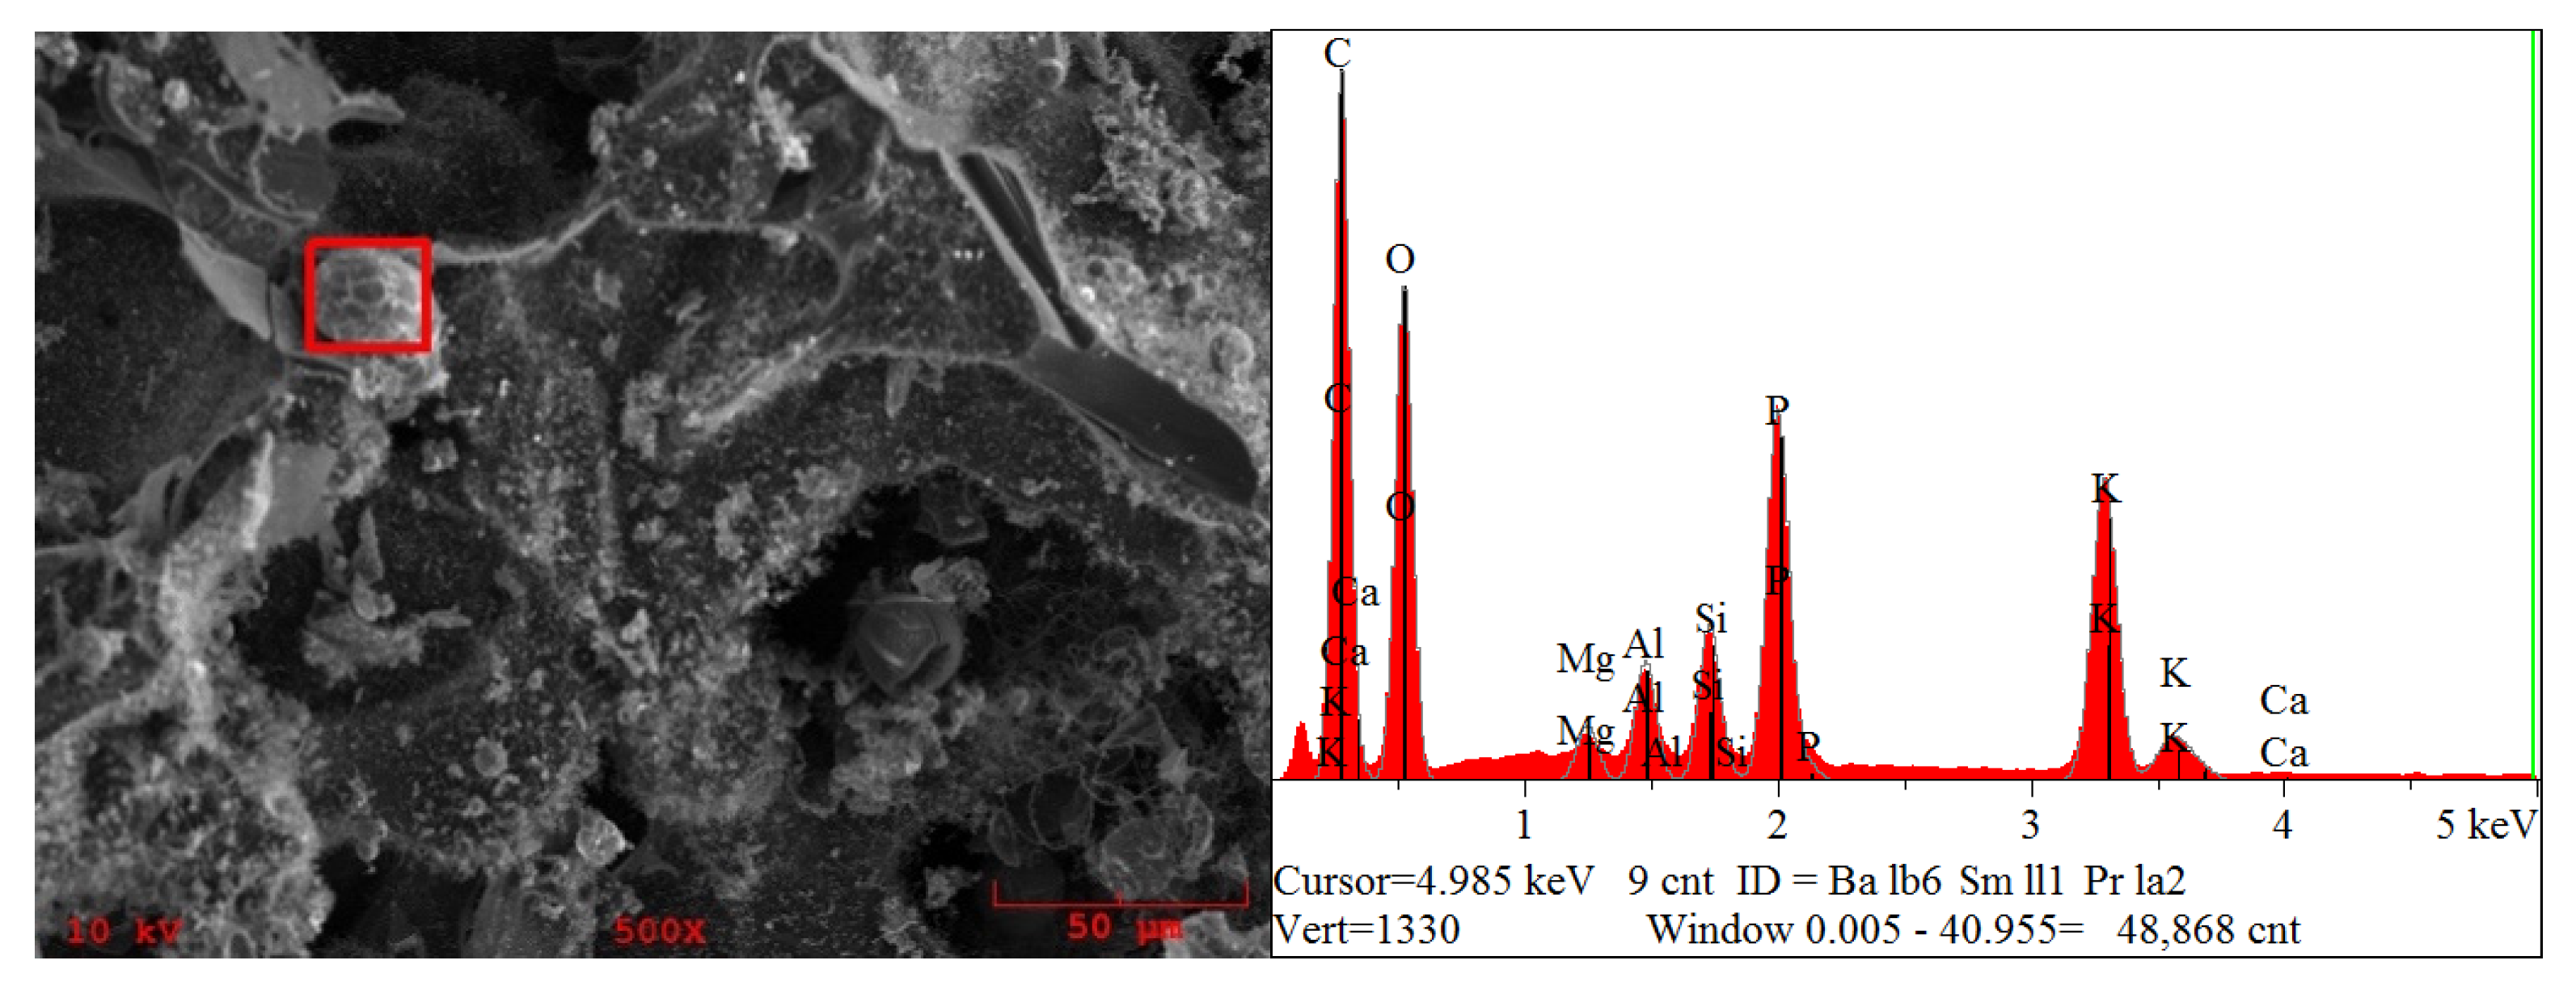
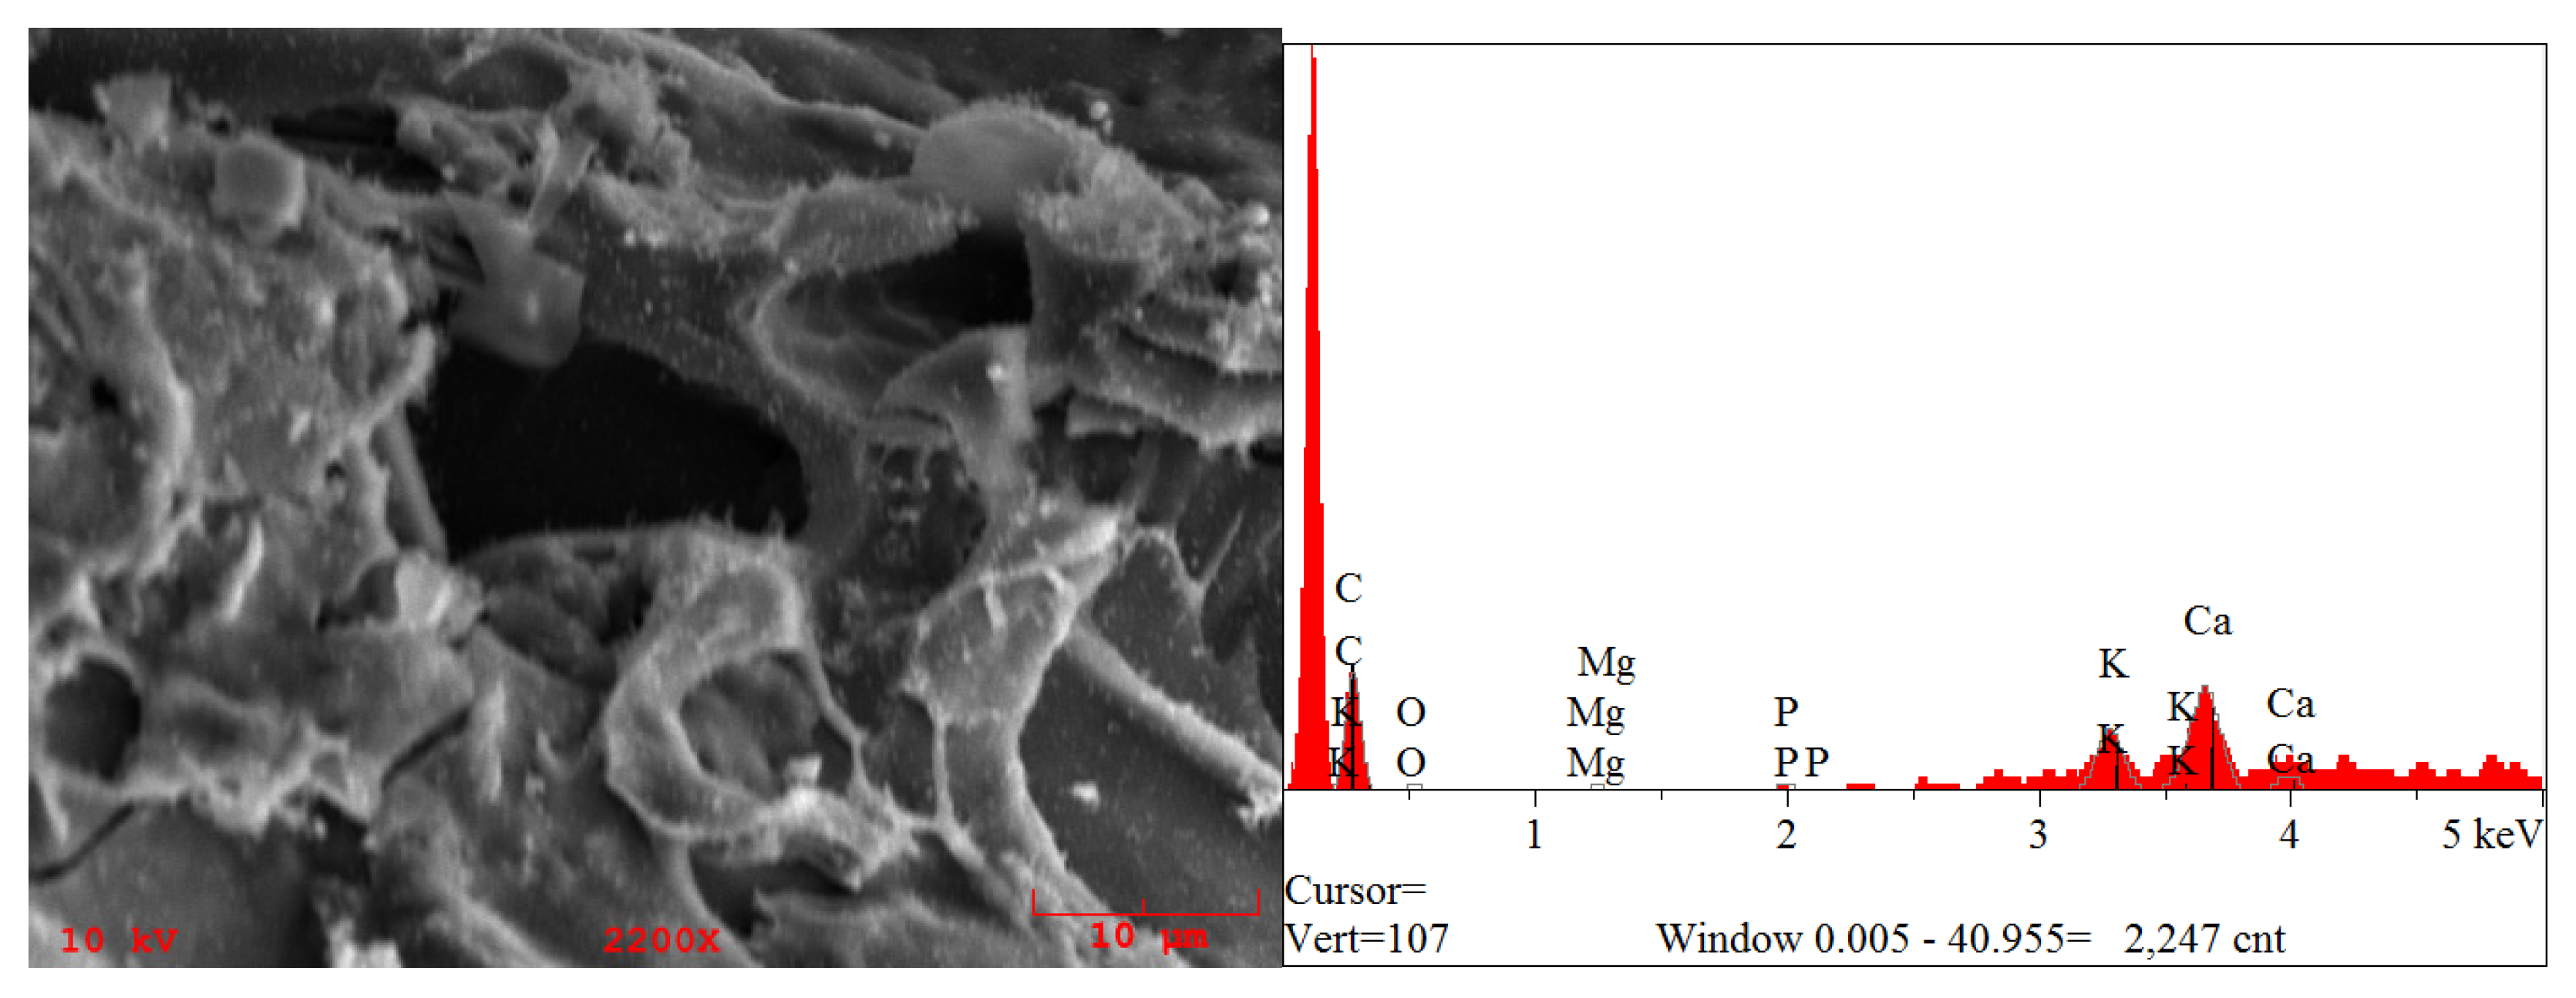
Further corn surface areas were examined, particularly at porous regions, and surfaces next to them. As shown in the Figure 6 below, high contents of potassium and phosphorus were found, 41.2% and 16.95%, respectively. Additional traces of minerals such as magnesium, aluminum, and silicon were found but at relatively lower concentrations. Figure 6 examines the concentration of minerals within a 30-micron surface in about 60-micron porous region on the surface on corn biochar. Traces of magnesium, aluminum, and silicon were found to be under 4%. In Figure 6, even though the peaks of phosphorus appear to be higher than that of potassium, quantitatively potassium is higher than phosphorus. Potassium is spread throughout the surface and has multiple peaks. Each element has a unique atomic structure which allows a unique set of peaks on its electromagnetic spectrum. The detected x-rays are segregated into energy channels based on their interaction with the detector and form spectrum of detected energies. Other regions presented in Figure 7, which looks at a 10-micron surface, also showed a similar trend, with 21.8% potassium and 14% phosphorus. It was observed that the major concentrations of phosphorus and potassium were located next to pore openings. Traces of Magnesium, aluminum and silicon were also found. The minerals from Figure 3, Figure 4, Figure 5, Figure 6 and Figure 7 are quantified in Table 5.
Testing different regions on the corn biochar showed that the concentration of potassium is higher than that of phosphorus in different regions. Mineral deposits such as phosphorus and potassium were found closer to the porous region of the char. Figure 7 examines a specific area on the biochar pore that showed traces of aluminum and silicon but had a high concentration of phosphorus and potassium.
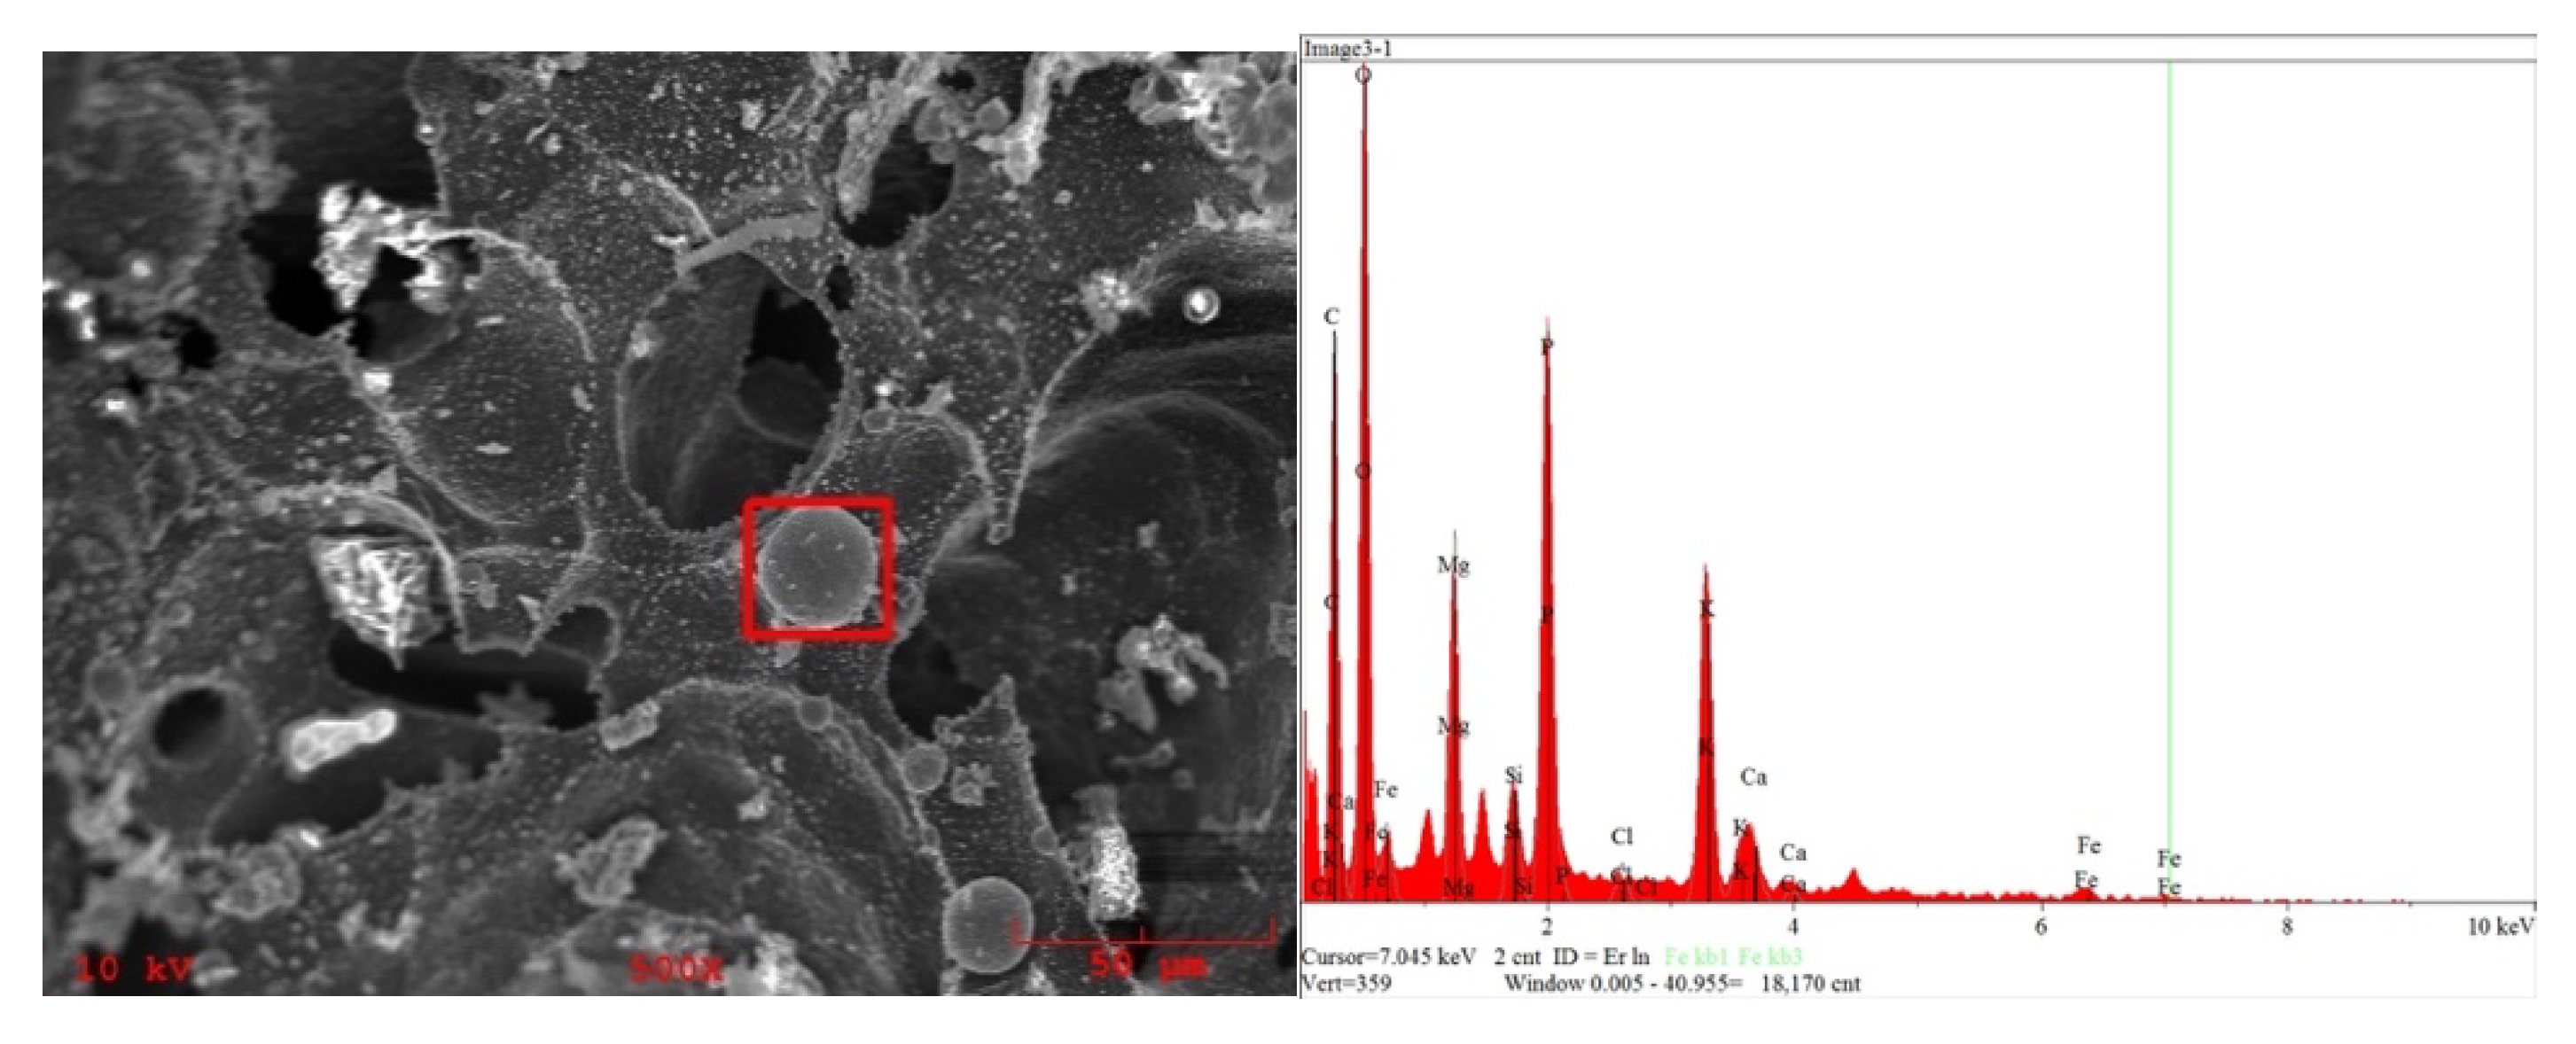
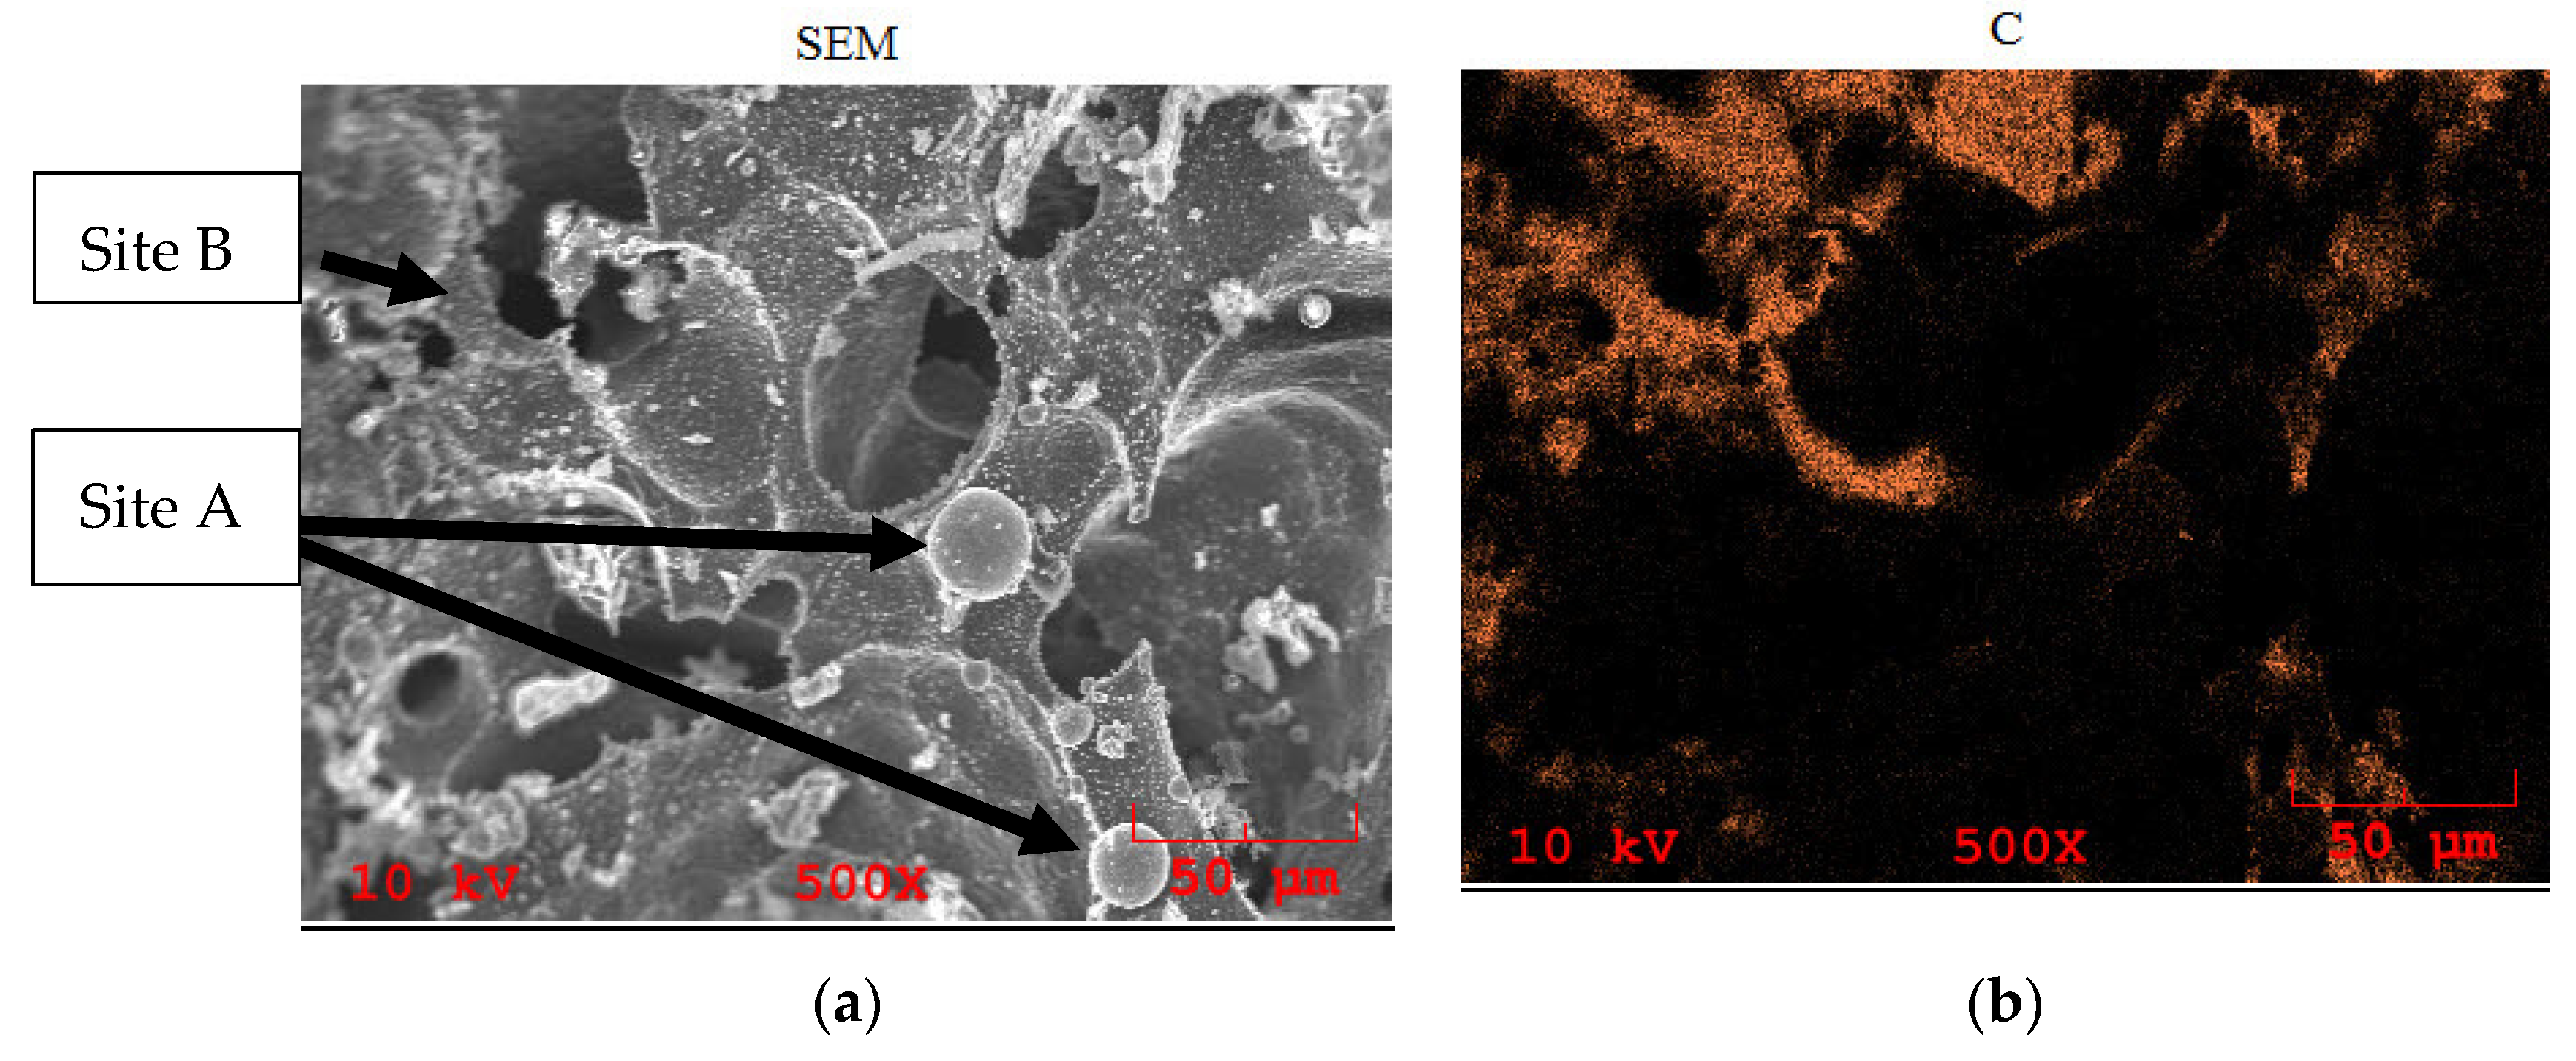
A similar trend was also observed on soybean biochar as shown in Figure 8. The areas next to the pores that contained a higher amount of minerals were examined. The micron surface in Figure 8 showed a wide range of minerals present. However, in contrast to corn biochar, traces of iron were found in soybeans. The concentrations of potassium and phosphorus were found to be 17.1% and 14.48%, respectively, and the concentration of iron was found to be 9.32%. A detailed X-ray analysis of the minerals is presented in Figure 9 and shows where these minerals are located. We see that the phosphorus deposits on the char closely match those of potassium and oxygen, and the different minerals are detailly spread throughout the surface of the char. Figure 9 shows a mineral deposit next to various pores. The minerals are present in nodule form and appear to be aggregately dispersed on the surface. Some minerals are observed to localize into small (~25 micron diameter) nodules on the biochar surface. The deposition of this mineral could result from the precipitation of vapor carried along from the surface, during the gasification process, which leads to an aggregation of these minerals in the form of nodules as shown in Figure 9. This formation in nodules appears to have with over 50% mineral mass next to pores in the carbon substrate. The locations of the minerals, referred to as site A and site B, correspond to the formation of the various minerals present, which could exist in the form of a compound. Both sites appear to be 20–25 micron in size which corresponds to the sizes of mineral formed in Figure 9e–g. Silicon in Figure 9h localized in to small 15 microns diameter nodule. For the SEM analysis, soy biochar was cracked into pieces so as to examine the inner and outer surfaces of the char. Figure 9 and Figure 10 examine the outer surface area of the biochar. The minerals in Figure 9 and Figure 10 have are quantified in Table 6.
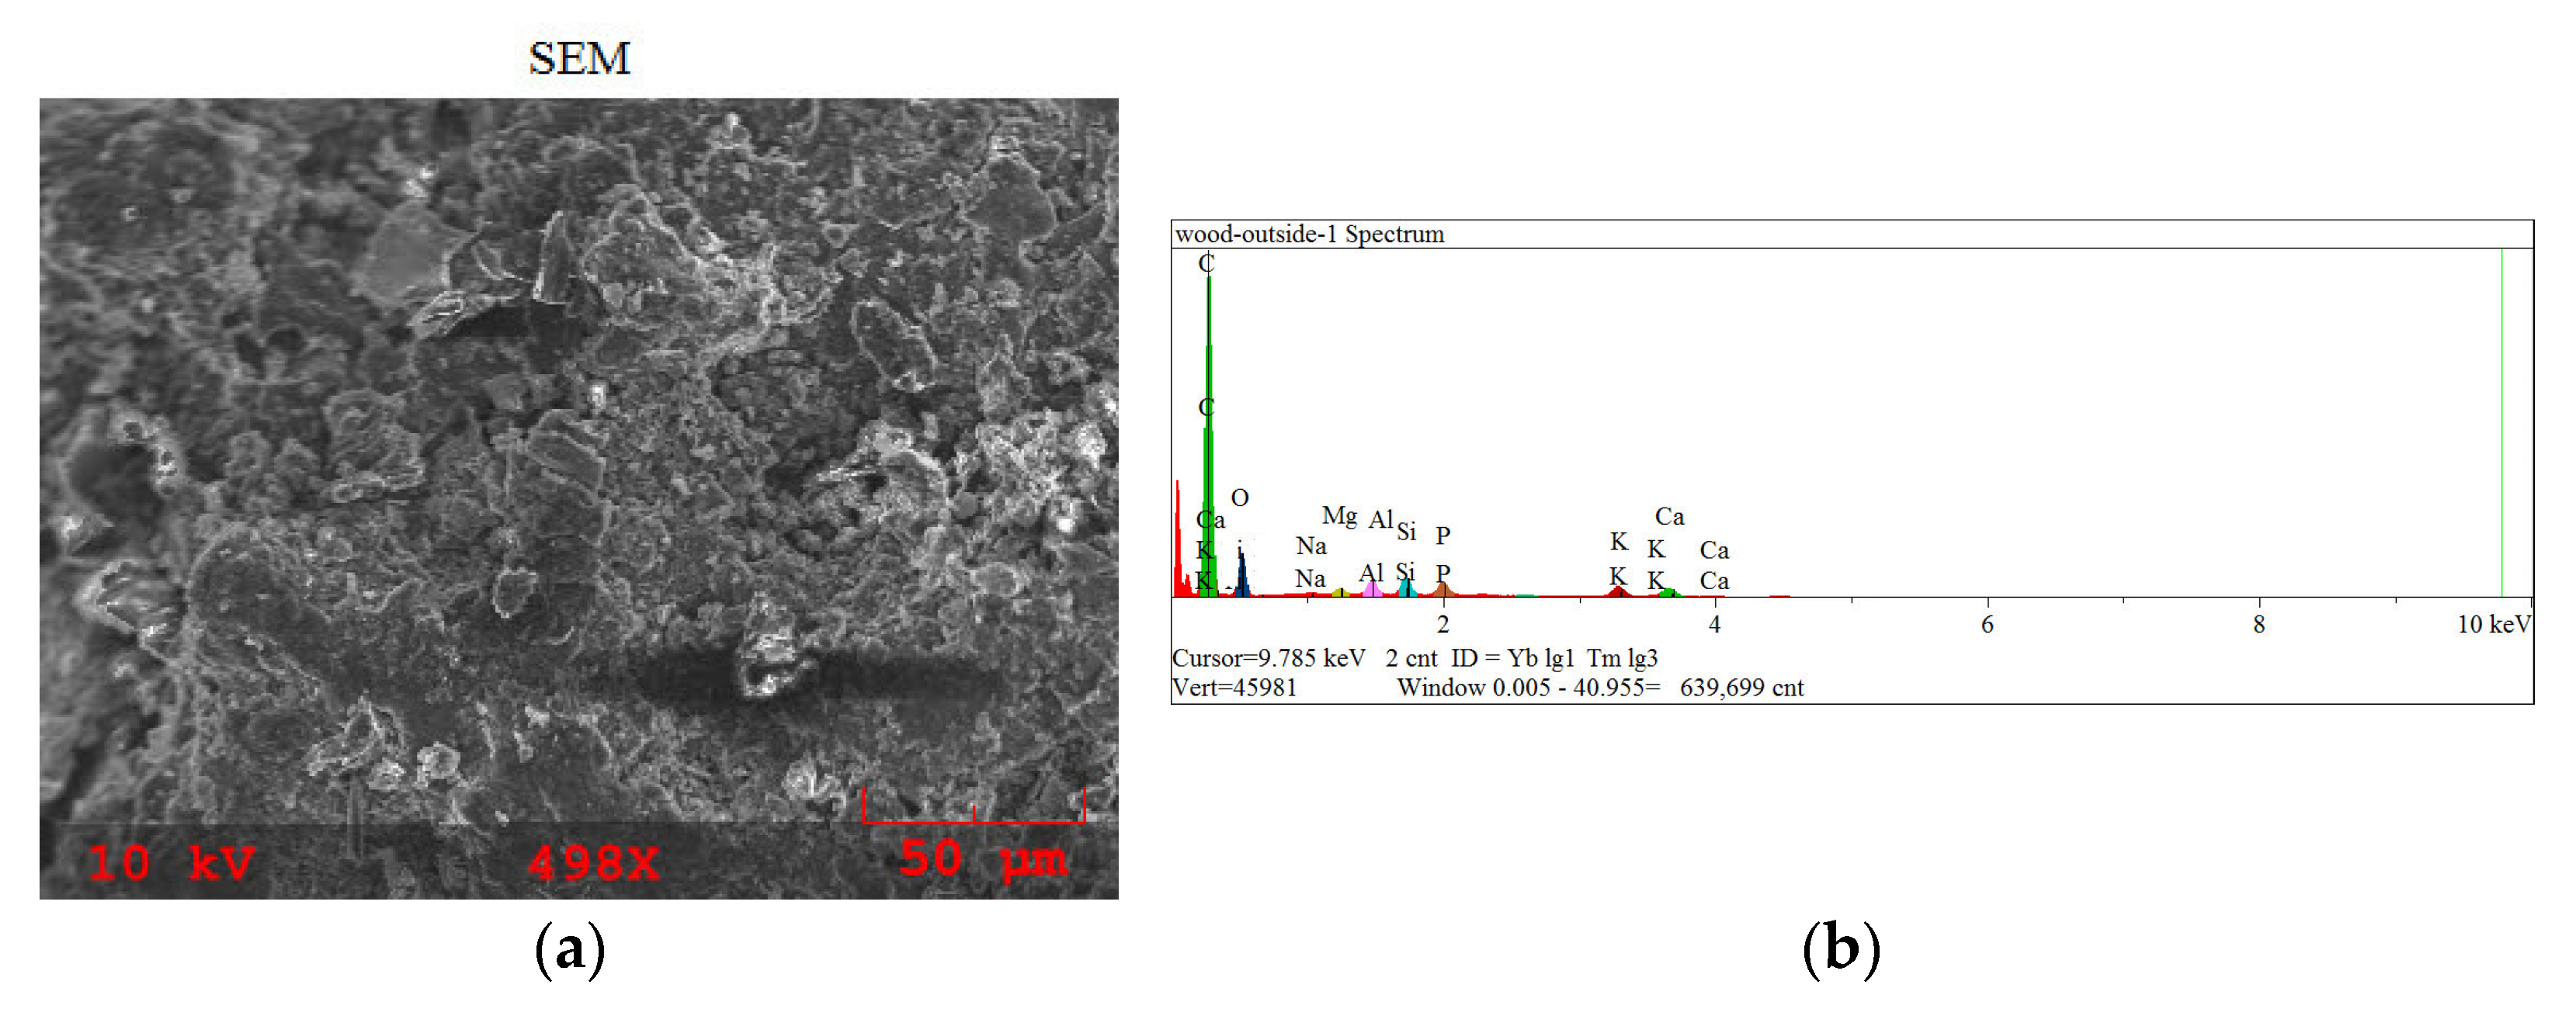
A similar approach was taken for the wood biochar to analyze mineral content. As shown in Figure 11, Figure 12 and Figure 13, small traces and trends between phosphorus, potassium, and oxygen can be observed. The surface examined Figure 11 is about 20 microns in diameter. As shown in Figure 11, Figure 12 and Figure 13, regions next to the pores contain a higher percentage of minerals such as calcium and potassium. As shown in Figure 14, a wide range of elements, including nickel, iron, and silicon traces, was found on the outer region of wood biochar. However, these traces were all under 5%. This dispersion of different minerals can be examined closely through X-ray analysis. The areas next to the pore show a dense concentration of minerals such as calcium and potassium. Areas marked as site A show some similarities as to where the minerals are dispersed.
Table 7 shows the mineral composition of wood biochar next to porous regions of Figure 11, Figure 12 and Figure 13. Table 8 provides a comparison to findings from previous research, highlighted in gray. Most studies found wood biochar to contain Mg, P, K, and Ca. A few studies also found Mn and Fe. Some of the studies [53,54,55] were a result of pyrolysis, while others [56,57,58,59,60,61] were a result of gasification. Some studies [54,57,62] used an SEM spectroscopy analysis to measure the elemental analysis on their resulting biochar, which is similar to the methods used for Figure 14 and Figure 15. There was a significant presence of calcium and potassium throughout all studies. Other studies have found mineral concentrations in compound form. Wood biochar from one study through pyrolysis showed the following concentrations: 23% CaO, 5.67% SiO2, 2.36% Fe2O3, 1.35% K2O, 0.83% MnO2, 0.48% MgO, and 0.2% P2O5 [63]. Other studies have also suggested that the presence of K, Ca, and P from biochar helps plants retain their nutrients in soil and leads to increased organic soil matter [55,64]. During thermal decomposition, large amounts of volatile matter flow from the solid wood in a limited period of time, which leads to shrinking and splitting on the surface of the char [65]. The morphology of char has an irregular surface as a result. The thermal decomposition of the chemical bonds in the char could lead to the formation of larger pores [65]. Some studies have shown that char from pyrolysis tends to be much finer than those produced from gasification [51].
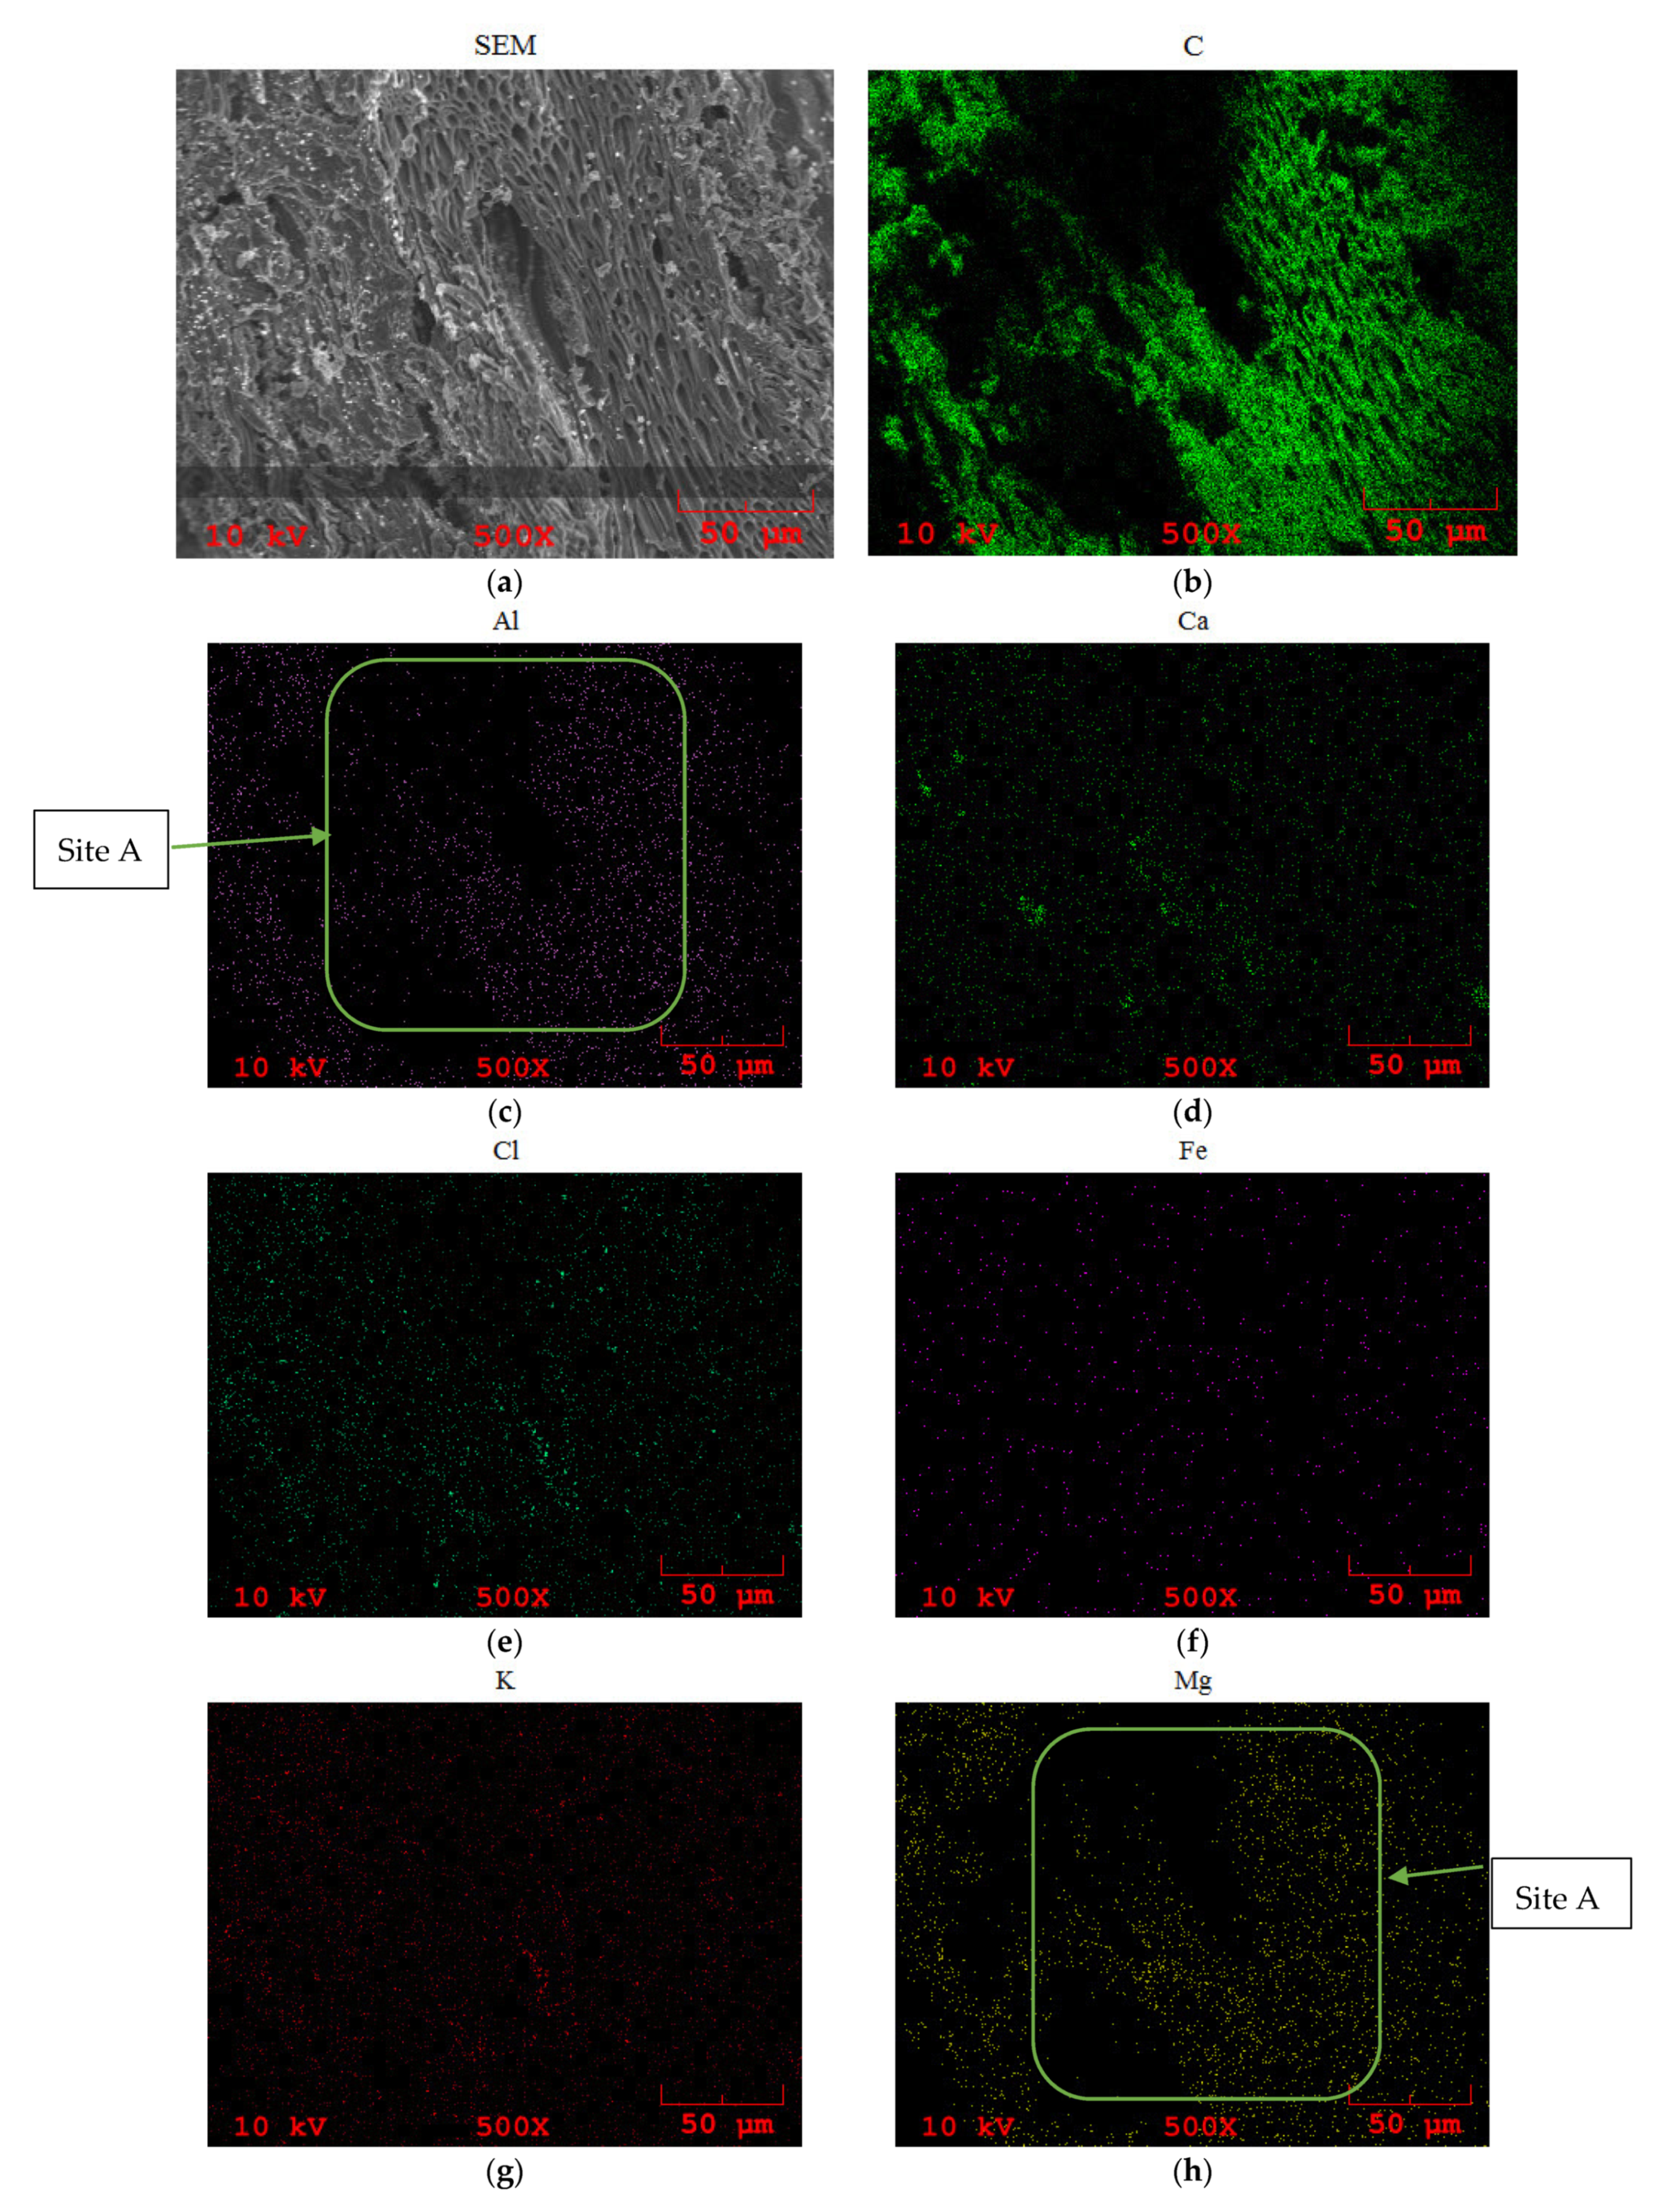
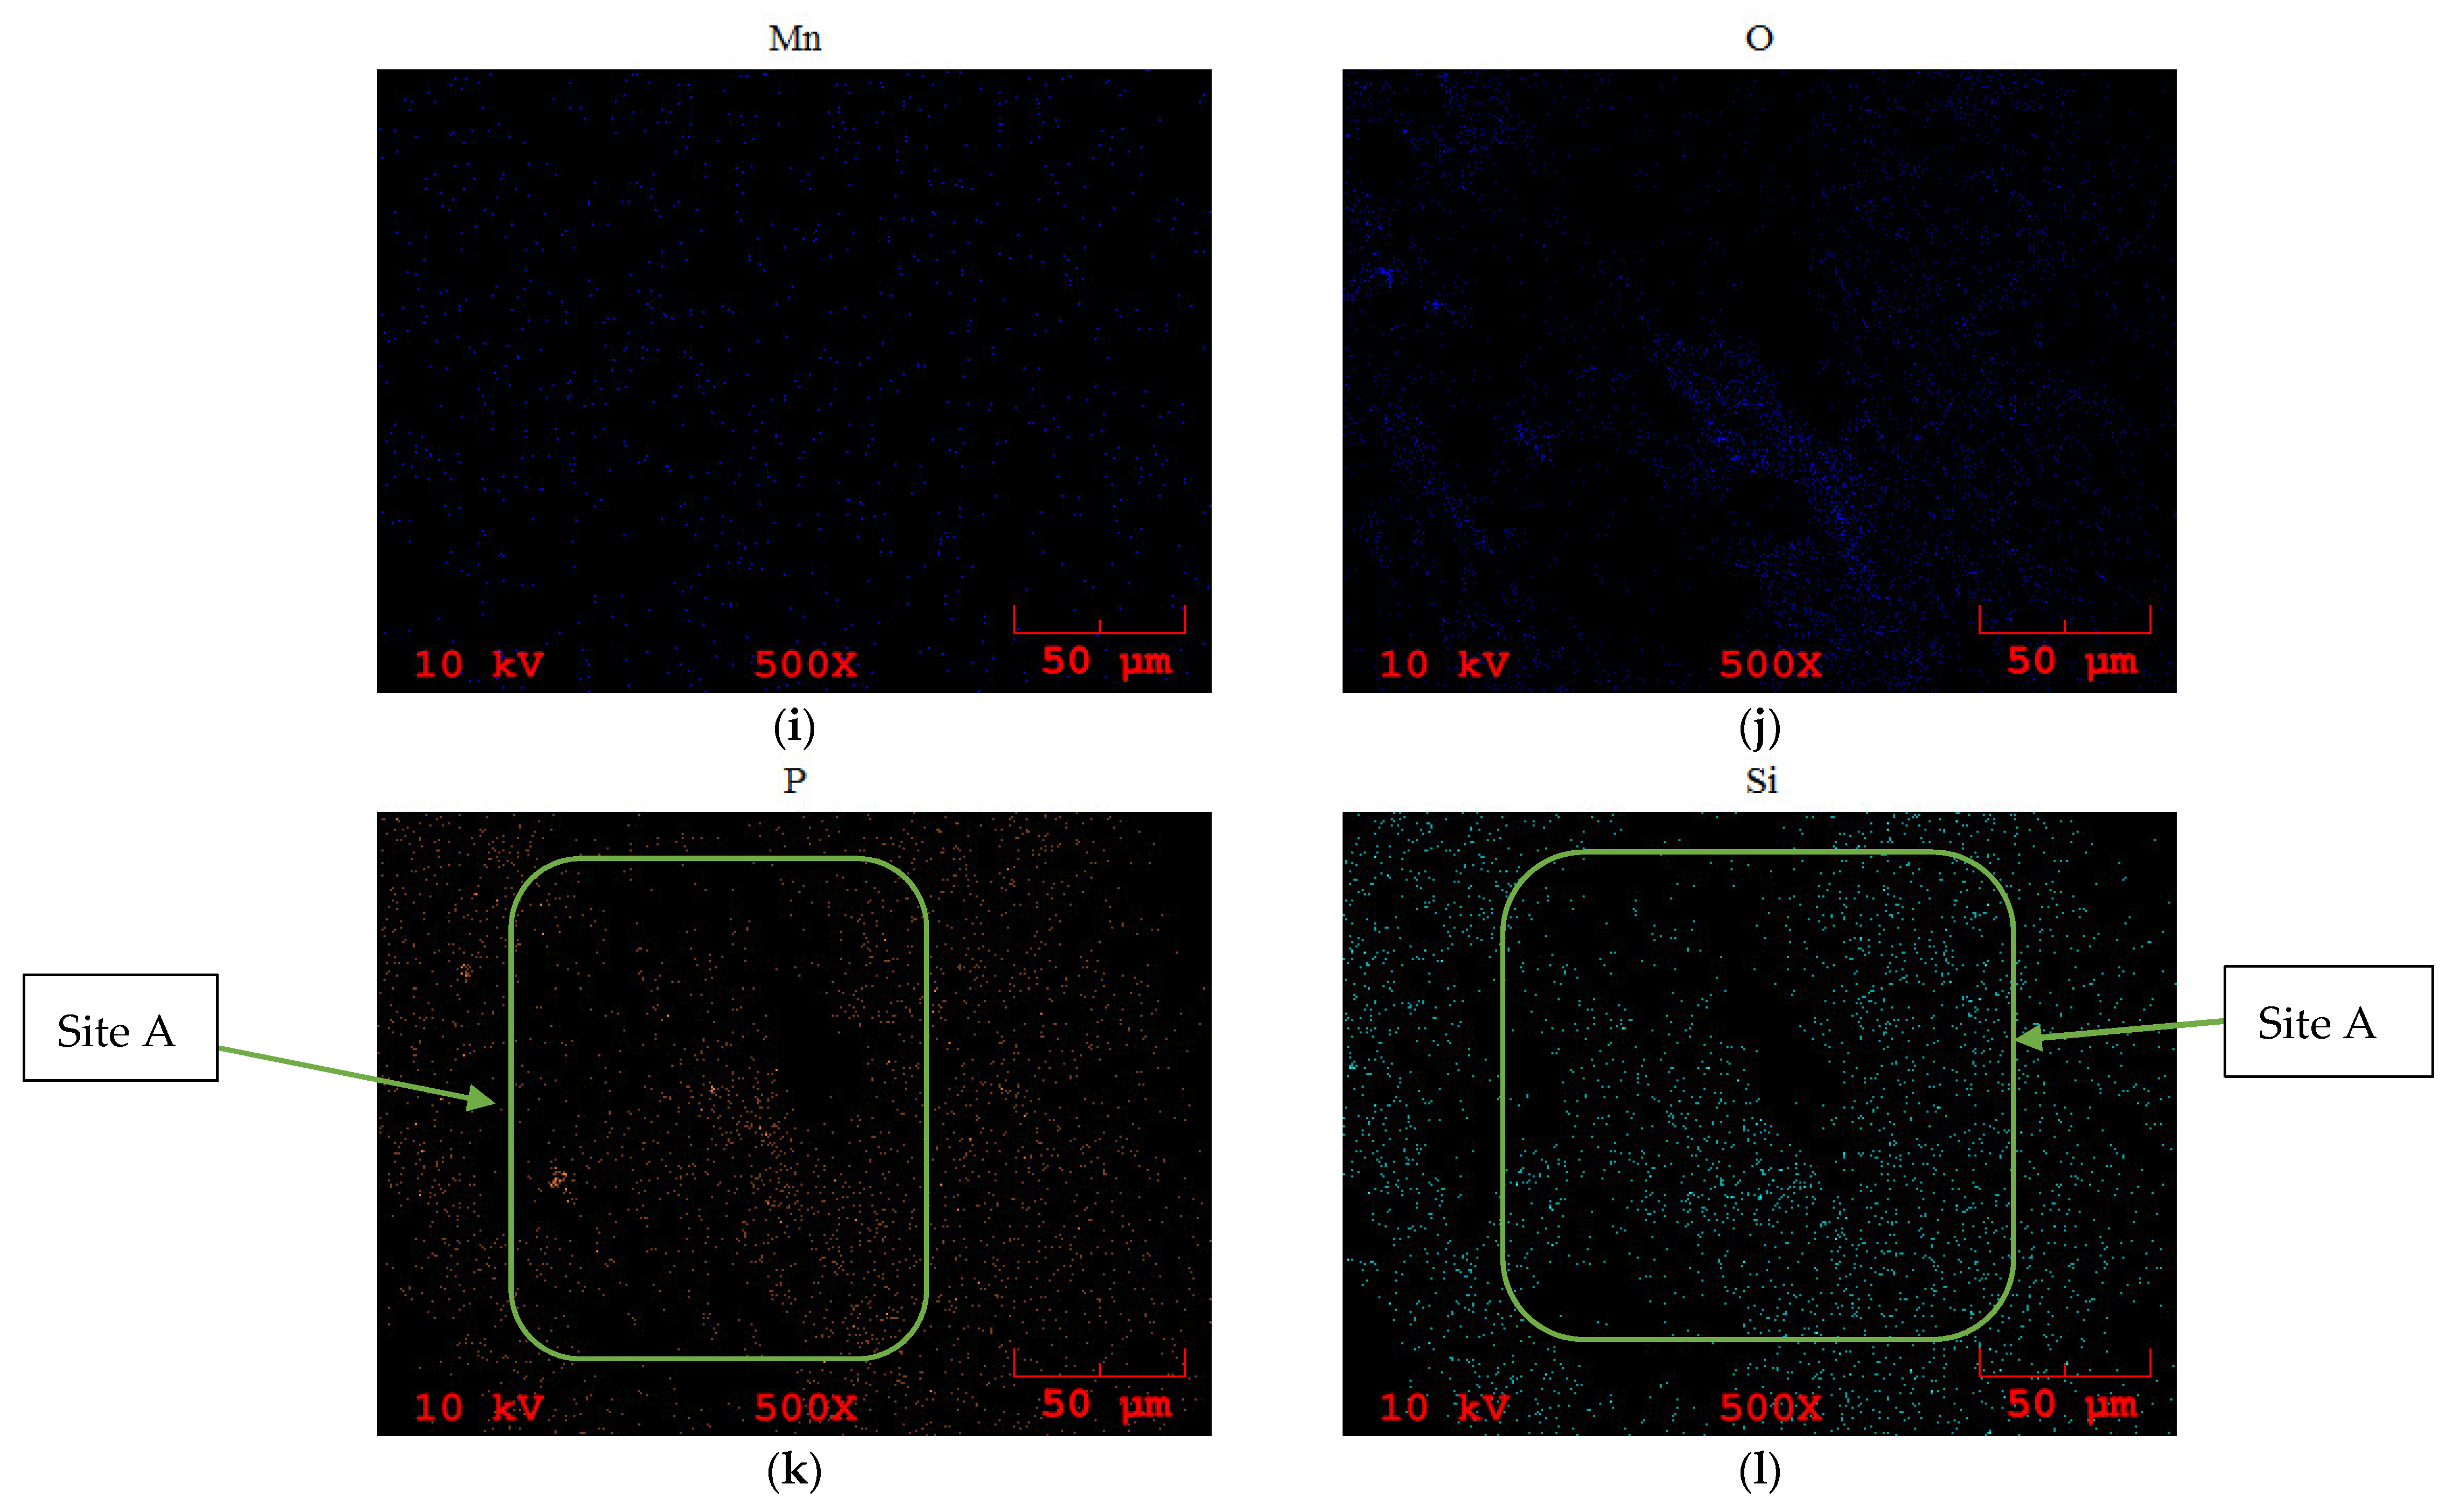
In the SEM analysis of wood as observed in Figure 15, several porous areas are observed. These pores range from 2 to 60 microns. Through the detailed SEM X-ray analysis of the wood biochar is in Figure 15, the mineral dispersion throughout the surface can occur in a pattern. Figure 15c,h,i,k, show a similar pattern among different minerals also seen; potassium, phosphorus, and oxygen have a similar trend in mineral deposits as shown in site A, suggesting that these minerals are possibly present in the form of elements and compounds. Similar to the mineral deposition in soybean char, the deposition of this mineral could be as a result from precipitation of vapor carried along from the surface, during the gasification process, which leads to an aggregation of these minerals in the form of nodules as shown below. The minerals appear to present closer to pores as carbon substrate. Minerals such as nickel and iron appear to be more widely spread out, while minerals such as potassium, phosphorus, and silicon appear to be present in dense regions.
Throughout all three biochar SEM results, we see a significant re-occurrence of potassium and phosphorus in the form of nodules. These minerals have been known to also be present in soil fertilizers. It would be worth further exploring how these mineral nodule formations react in the soil, especially from an agricultural perspective. The presence and formation of these nodules also raises the possibility of mining and extracting minerals such as iron, magnesium, silicon, and nickel from biochar for different purposes, such as semiconductors, as mentioned earlier. The results from this paper also encourage further exploration of how minerals would be formed from other types of biochar pellets, such as those of refuse-derived fuel.
The findings in this paper open further avenues of research involving nodule formations. One direction of further investigation would be to study the effects of tuning the operating conditions of the gasifier to try to increase the size of the mineral nodules formed. A bigger nodule would make it easier to extract the minerals. Another direction is to study the effects of adding specific metals or chemicals to the process to modify the precipitation process that occurs during gasification. It might be possible to modify the precipitation process in this way to increase the purity of the nodules in regard to a preferred metal. There are also a range of unsteady processes that could be examined to enhance the nodule formation process including periodic steam or oxygen injection to modify the temperature and chemical fields.
4. Conclusions
In this study, it was found that that some metals actually localize into small (~25-micron diameter) metallic nodules on the biochar surface. Through SEM analysis, it was found that certain minerals, including potassium, phosphorus, calcium, iron, nickel, silicon, and copper, formed nodules with over 50% metal mass next to pores in the carbon substrate. Aluminum, chlorine, magnesium, and silicon (in certain cases) were mostly uniformly distributed on the biochar carbon substrate. Corn biochar showed a high concentration in the nodules, with 9–21% phosphorus and up to 67% potassium with no metal content. Soybean biochar followed a similar trend but had traces of iron and nickel, which formed metallic nodules. Wood biochar had mixed regions, with some regions showing high potassium and calcium content with no iron or nickel traces and others showing traces of iron and nickel nodules with concentrations of up to 3% and 4.1%, respectively. Other characteristics of wood, such as the carbon content and surface area, were similar to those in previous studies, while the surface area of soybean and corn grain biochar was much lower than that of wood. The morphology of the biochar was affected by the biomass used and the nodule formation. The characterization results give us a glimpse into where the biochar minerals are located. Such characterization becomes more useful when it involves a complex biochar from feedstocks such as refuse-derived fuel, which is made up of different components such as plastics, paper, cardboard, and textiles without a uniform finite structure.
Author Contributions
Conceptualization, T.S. and A.R.; methodology, T.S. and A.R.; formal analysis, T.S.; investigation, T.S.; resources, A.R.; data curation, T.S.; writing—original draft preparation, T.S.; writing—review and editing, T.S. and A.R.; supervision, A.R.; project administration, A.R.; funding acquisition, A.R. All authors have read and agreed to the published version of the manuscript.
Funding
This research was funded thanks to the University of Iowa and the MATC-Nebraska, grant number: 25-1121-0005-140.
Institutional Review Board Statement
Not applicable.
Informed Consent Statement
Not applicable.
Data Availability Statement
Data contained within the article.
Acknowledgments
We would like to thank the University of Iowa Facilities and Power Plant staff for their assistance and support.
Conflicts of Interest
The authors declare no conflict of interest.
References
- Sen, S.; Ganguly, S. Opportunities, barriers and issues with renewable energy development—A discussion. Renew. Sustain. Energy Rev. 2017, 69, 1170–1181. [Google Scholar] [CrossRef]
- Lehmann, J.; Joseph, S. Biochar for environmental management: An introduction. In Biochar for Environmental Management: Science and Technology; Earthscan: London, UK, 2009; Chapter 1; pp. 1–12. [Google Scholar]
- Scholz, S.B.; Sembres, T.; Roberts, K.; Whitman, T.; Wilson, K.; Lehmann, J. Biochar Systems for Smallholders in Developing Countries: Leveraging Current Knowledge and Exploring Future Potential for Climate-Smart Agriculture; The World Bank: Washington, DC, USA, 2014. [Google Scholar]
- Saletnik, B.; Zaguła, G.; Bajcar, M.; Tarapatskyy, M.; Bobula, G.; Puchalski, C. Biochar as a multifunctional component of the environment—A review. Appl. Sci. 2019, 9, 1139. [Google Scholar] [CrossRef] [Green Version]
- Malińska, K. Biochar-a response to current environmental issues. Inżynieria Ochr. Srodowiska 2012, 4, 387–403. [Google Scholar]
- Montoya, J.I.; Chejne-Janna, F.; Garcia-Pérez, M. Fast pyrolysis of biomass: A review of relevant aspects: Part I: Parametric study. Dyna 2015, 82, 239–248. [Google Scholar] [CrossRef]
- Park, J.; Hung, I.; Gan, Z.; Rojas, O.J.; Lim, K.H.; Park, S. Activated carbon from biochar: Influence of its physico-chemical properties on the sorption characteristics of phenanthrene. Bioresour. Technol. 2013, 149, 383–389. [Google Scholar] [CrossRef] [PubMed]
- Tang, J.; Zhu, W.; Kookana, R.; Katayama, A. Characteristics of biochar and its application in remediation of con-taminated soil. J. Biosci. Bioeng. 2013, 116, 653–659. [Google Scholar] [CrossRef]
- Mohan, D.; Sarswat, A.; Ok, Y.S.; Pittman, C.U.J. Organic and inorganic contaminants removal from water with biochar, a renewable, low cost and sustainable adsorbent–A critical review. Bioresour. Technol. 2014, 160, 191–202. [Google Scholar] [CrossRef]
- Steiner, C.; Das, K.; Melear, N.D.; Lakly, D. Reducing Nitrogen Loss during Poultry Litter Composting Using Biochar. J. Environ. Qual. 2010, 39, 1236–1242. [Google Scholar] [CrossRef] [PubMed] [Green Version]
- Steiner, C.; Melear, N.; Harris, K.; Das, K. Biochar as bulking agent for poultry litter composting. Carbon Manag. 2011, 2, 227–230. [Google Scholar] [CrossRef]
- Malińska, K.; Zabochnicka-Świątek, M.; Dach, J. Effects of biochar amendment on ammonia emission during com-posting of sewage sludge. Ecol. Eng. 2014, 71, 474–478. [Google Scholar] [CrossRef]
- Malińska, K.; Dach, J. Biochar as a supplementary material for biogas production. Inżynieria Ekol. 2015, 2015, 117–124. [Google Scholar] [CrossRef]
- Lechenet, M.; Dessaint, F.; Py, G.; Makowski, D.; Munier-Jolain, N. Reducing pesticide use while preserving crop productivity and profitability on arable farms. Nat. Plants 2017, 3, 17008. [Google Scholar] [CrossRef] [PubMed]
- Elijah, O.; Rahman, T.A.; Orikumhi, I.; Leow, C.Y.; Hindia, M.N. An Overview of Internet of Things (IoT) and Data Analytics in Agriculture: Benefits and Challenges. IEEE Internet Things J. 2018, 5, 3758–3773. [Google Scholar] [CrossRef]
- Prost, L.; Berthet, E.T.A.; Cerf, M.; Jeuffroy, M.-H.; Labatut, J.; Meynard, J.-M. Innovative design for agriculture in the move towards sustainability: Scientific challenges. Res. Eng. Des. 2016, 28, 119–129. [Google Scholar] [CrossRef] [Green Version]
- Reganold, J.P.; Wachter, J.M. Organic agriculture in the twenty-first century. Nat. Plants 2016, 2, 15221. [Google Scholar] [CrossRef] [PubMed]
- Kravchenko, A.N.; Snapp, S.S.; Robertson, G.P. Field-scale experiments reveal persistent yield gaps in low-input and organic cropping systems. Proc. Natl. Acad. Sci. USA 2017, 114, 926–931. [Google Scholar] [CrossRef] [PubMed] [Green Version]
- Tenic, E.; Ghogare, R.; Dhingra, A. Biochar—A Panacea for Agriculture or Just Carbon? Horticulturae 2020, 6, 37. [Google Scholar] [CrossRef]
- Zheng, H.; Wang, X.; Chen, L.; Wang, Z.; Xia, Y.; Zhang, Y.; Wang, H.; Luo, X.; Xing, B. Enhanced growth of halophyte plants in biochar-amended coastal soil: Roles of nutrient availability and rhizosphere microbial modulation. Plant Cell Environ. 2017, 41, 517–532. [Google Scholar] [CrossRef]
- Laird, D.; Novak, J.; Collins, H.; Ippolito, J.; Karlen, D.; Lentz, R.; Sistani, K.; Spokas, K.; Van Pelt, R. Multi-year and multilocation soil quality and crop biomass yield responses to hardwood fast pyrolysis biochar. Geoderma 2017, 289, 46–53. [Google Scholar] [CrossRef] [Green Version]
- Knapp, S.; van der Heijden, M.G. A global meta-analysis of yield stability in organic and conservation agriculture. Nat. Commun. 2018, 9, 1–9. [Google Scholar] [CrossRef]
- Jiang, Z.; Lian, F.; Wang, Z.; Xing, B. The role of biochars in sustainable crop production and soil resiliency. J. Exp. Bot. 2019, 71, 520–542. [Google Scholar] [CrossRef] [PubMed]
- Biederman, L.A.; Harpole, W.S. Biochar and its effects on plant productivity and nutrient cycling: A meta-analysis. GCB Bioenergy 2012, 5, 202–214. [Google Scholar] [CrossRef]
- Amoakwah, E.; Arthur, E.; Frimpong, K.A.; Parikh, S.J.; Islam, R. Soil organic carbon storage and quality are impacted by corn cob biochar application on a tropical sandy loam. J. Soils Sediments 2020, 20, 1960–1969. [Google Scholar] [CrossRef]
- Fryda, L.; Visser, R.; Schmidt, J. Biochar Replaces Peat in Horticulture: Environmental Impact Assessment of Combined Biochar & Bioenergy Production. Detritus 2018, 5, 132–149. [Google Scholar] [CrossRef] [Green Version]
- Yao, D.; Hu, Q.; Wang, D.; Yang, H.; Wu, C.; Wang, X.; Chen, H. Hydrogen production from biomass gasification using biochar as a catalyst/support. Bioresour. Technol. 2016, 216, 159–164. [Google Scholar] [CrossRef]
- Lee, J.; Kim, K.-H.; Kwon, E.E. Biochar as a Catalyst. Renew. Sustain. Energy Rev. 2017, 77, 70–79. [Google Scholar] [CrossRef]
- Blanco-Canqui, H. Biochar and Water Quality. J. Environ. Qual. 2019, 48, 2–15. [Google Scholar] [CrossRef]
- Qian, K.; Kumar, A.; Zhang, H.; Bellmer, D.; Huhnke, R. Recent advances in utilization of biochar. Renew. Sustain. Energy Rev. 2015, 42, 1055–1064. [Google Scholar] [CrossRef]
- Perez-Mercado, L.F.; Lalander, C.; Berger, C.; Dalahmeh, S.S. Potential of Biochar Filters for Onsite Wastewater Treatment: Effects of Biochar Type, Physical Properties and Operating Conditions. Water 2018, 10, 1835. [Google Scholar] [CrossRef] [Green Version]
- Schmidt, H.-P.; Wilson, K. 55 uses of biochar. Ithaka J. 2012, 1, 286–289. [Google Scholar]
- Schmidt, H.P.; Wilson, K.; Kammann, C. Using biochar in animal farming to recycle nutrients and reduce greenhouse gas emissions. In Proceedings of the 19th EGU General Assembly, EGU2017, Vienna, Austria, 23–28 April 2017; p. 5719. [Google Scholar]
- Gu, X.; Wang, Y.; Lai, C.; Qiu, J.; Li, S.; Hou, Y.; Martens, W.N.; Mahmood, N.; Zhang, S. Microporous bamboo biochar for lithium-sulfur batteries. Nano Res. 2014, 8, 129–139. [Google Scholar] [CrossRef]
- Lowell, S.; Shields, J.E.; Thomas, M.A.; Thommes, M. Characterization of Porous Solids and Powders: Surface Area, Pore Size and Density; Springer Science & Business Media: Berlin/Heidelberg, Germany, 2004. [Google Scholar] [CrossRef]
- Hung, C.Y.; Tsai, W.T.; Chen, J.W.; Lin, Y.Q.; Chang, Y.M. Characterization of biochar prepared from biogas di-gestate. Waste Manag. 2017, 66, 53–60. [Google Scholar] [CrossRef] [PubMed]
- Ng, W.C.; You, S.; Ling, R.; Gin, K.Y.-H.; Dai, Y.; Wang, C.-H. Co-gasification of woody biomass and chicken manure: Syngas production, biochar reutilization, and cost-benefit analysis. Energy 2017, 139, 732–742. [Google Scholar] [CrossRef] [Green Version]
- Sharma, T.; Yepes Maya, D.M.; Nascimento, F.R.M.; Shi, Y.; Ratner, A.; Silva Lora, E.E.; Mendes Neto, L.J.; Escobar Palacio, J.C.; Vieira Andrade, R. An Experimental and Theoretical Study of the Gasification of Miscanthus Briquettes in a Double-Stage Downdraft Gasifier: Syngas, Tar, and Biochar Characterization. Energies 2018, 11, 3225. [Google Scholar] [CrossRef] [Green Version]
- Cetin, E.; Moghtaderi, B.; Gupta, R.; Wall, T. Influence of pyrolysis conditions on the structure and gasification reactivity of biomass chars. Fuel 2004, 83, 2139–2150. [Google Scholar] [CrossRef]
- Xie, T.; Reddy, K.R.; Wang, C.; Yargicoglu, E.; Spokas, K. Characteristics and Applications of Biochar for Environmental Remediation: A Review. Crit. Rev. Environ. Sci. Technol. 2015, 45, 939–969. [Google Scholar] [CrossRef]
- Benedetti, V.; Patuzzi, F.; Baratieri, M. Characterization of char from biomass gasification and its similarities with activated carbon in adsorption applications. Appl. Energy 2018, 227, 92–99. [Google Scholar] [CrossRef]
- Hernández, J.J.; Lapuerta, M.; Monedero, E. Characterisation of residual char from biomass gasification: Effect of the gasifier operating conditions. J. Clean. Prod. 2016, 138, 83–93. [Google Scholar] [CrossRef]
- Qian, K.; Kumar, A.; Patil, K.N.; Bellmer, D.D.; Wang, D.; Yuan, W.; Huhnke, R.L. Effects of Biomass Feedstocks and Gasification Conditions on the Physiochemical Properties of Char. Energies 2013, 6, 3972–3986. [Google Scholar] [CrossRef]
- Lehmann, J.; Joseph, S. (Eds.) Biochar for Environmental Management: Science, Technology and Implementation; Routledge: New York, NY, USA, 2015. [Google Scholar]
- Whitehouse.gov. Available online: https://www.whitehouse.gov/wpcontent/uploads/2018/02/Assessment-of-Critical-Minerals-Update-2018.pdf (accessed on 8 July 2020).
- Gov.info.gov. Available online: https://www.govinfo.gov/content/pkg/FR-2017-12-26/pdf/2017-27899.pdf (accessed on 8 July 2020).
- Ma, X.; Zhou, B.; Budai, A.; Jeng, A.; Hao, X.; Wei, D.; Zhang, Y.; Rasse, D. Study of Biochar Properties by Scanning Electron Microscope—Energy Dispersive X-Ray Spectroscopy (SEM-EDX). Commun. Soil Sci. Plant Anal. 2016, 47, 593–601. [Google Scholar] [CrossRef]
- Sharma, T. Biochar and Other Properties Resulting from the Gasification and Combustion of Biomass with Different Components. Ph.D. Thesis, University of Iowa, Iowa, IA, USA, 2019. [Google Scholar] [CrossRef]
- Enders, A.; Hanley, K.; Whitman, T.; Joseph, S.; Lehmann, J. Characterization of biochars to evaluate recalcitrance and agronomic performance. Bioresour. Technol. 2012, 114, 644–653. [Google Scholar] [CrossRef]
- Shaaban, A.; Se, S.-M.; Mitan, N.M.M.; Dimin, M. Characterization of Biochar Derived from Rubber Wood Sawdust through Slow Pyrolysis on Surface Porosities and Functional Groups. Procedia Eng. 2013, 68, 365–371. [Google Scholar] [CrossRef] [Green Version]
- Brewer, C.E.; Schmidt-Rohr, K.; Satrio, J.A.; Brown, R.C. Characterization of biochar from fast pyrolysis and gasification systems. Environ. Progress Sustain. Energy 2009, 28, 386–396. [Google Scholar] [CrossRef]
- Li, X.; Guo, X.; Wang, S.; Wang, K.; Luo, Z.; Wang, Q. Characterization and Analysis of Char Produced by Biomass Fast Pyrolysis. In Proceedings of the Asia-Pacific Power and Energy Engineering Conference, Chengdu, China, 28–31 March 2010; pp. 1–4. [Google Scholar] [CrossRef]
- Mukome, F.N.; Parikh, S.J. Chemical, Physical, and Surface Characterization of Biochar; CRC Press: Boca Raton, FL, USA, 2015; pp. 67–98. [Google Scholar]
- Wang, S.; Gao, B.; Zimmerman, A.R.; Li, Y.; Ma, L.; Harris, W.G.; Migliaccio, K.W. Removal of arsenic by magnetic biochar prepared from pinewood and natural hematite. Bioresour. Technol. 2015, 175, 391–395. [Google Scholar] [CrossRef] [PubMed]
- Wang, S.; Gao, B.; Li, Y.; Mosa, A.; Zimmerman, A.R.; Ma, L.Q.; Harris, W.G.; Migliaccio, K.W. Manganese oxide-modified biochars: Preparation, characterization, and sorption of arsenate and lead. Bioresour. Technol. 2015, 181, 13–17. [Google Scholar] [CrossRef]
- Muvhiiwa, R.; Kuvarega, A.; Llana, E.M.; Muleja, A. Study of biochar from pyrolysis and gasification of wood pellets in a nitrogen plasma reactor for design of biomass processes. J. Environ. Chem. Eng. 2019, 7, 103391. [Google Scholar] [CrossRef]
- Marks, E.A.; Mattana, S.; Alcañiz, J.M.; Pérez-Herrero, E.; Domene, X. Gasifier biochar effects on nutrient availability, organic matter mineralization, and soil fauna activity in a multi-year Mediterranean trial. Agric. Ecosyst. Environ. 2016, 215, 30–39. [Google Scholar] [CrossRef]
- Ojeda, G.; Mattana, S.; Àvila, A.; Alcañiz, J.M.; Volkmann, M.; Bachmann, J. Are soil–water functions affected by biochar application? Geoderma 2015, 249–250, 1–11. [Google Scholar] [CrossRef]
- Limwikran, T.; Kheoruenromne, I.; Suddhiprakarn, A.; Prakongkep, N.; Gilkes, R.J. Most Plant Nutrient Elements Are Retained by Biochar in Soil. Soil Syst. 2019, 3, 75. [Google Scholar] [CrossRef] [Green Version]
- Vaughn, S.F.; Kenar, J.A.; Thompson, A.R.; Peterson, S.C. Comparison of biochars derived from wood pellets and pelletized wheat straw as replacements for peat in potting substrates. Ind. Crop. Prod. 2013, 51, 437–443. [Google Scholar] [CrossRef]
- Pelaez-Samaniego, M.R.; Perez, J.F.; Ayiania, M.; Garcia-Perez, T. Chars from wood gasification for removing H2S from biogas. Biomass Bioenergy 2020, 142, 105754. [Google Scholar] [CrossRef]
- You, S.; Ok, Y.S.; Chen, S.S.; Tsang, D.C.; Kwon, E.E.; Lee, J.; Wang, C.-H. A critical review on sustainable biochar system through gasification: Energy and environmental applications. Bioresour. Technol. 2017, 246, 242–253. [Google Scholar] [CrossRef] [PubMed] [Green Version]
- Brewer, C.E. Biochar Characterization and Engineering. Ph.D. Thesis, Iowa State University, Iowa, IA, USA, 2018. [Google Scholar] [CrossRef]
- Bista, P.; Ghimire, R.; Machado, S.; Pritchett, L. Biochar Effects on Soil Properties and Wheat Biomass vary with Fertility Management. Agronomy 2019, 9, 623. [Google Scholar] [CrossRef] [Green Version]
- Suman, S.; Panwar, D.S.; Gautam, S. Surface morphology properties of biochars obtained from different biomass waste. Energy Sources Part A Recovery Util. Environ. Eff. 2017, 37, 1–6. [Google Scholar] [CrossRef]
Figure 1.
Fuel used for testing—corn, soybeans, wood pellets.

Figure 2.
(a) Pilot scale single-stage downdraft gasifier; (b) Interior schematic of the single stage downdraft gasifier.
Figure 2.
(a) Pilot scale single-stage downdraft gasifier; (b) Interior schematic of the single stage downdraft gasifier.

Figure 3.
Surface area analysis from corn biochar (Elements from left to right K, Ca, C, O, Mg, P, K, Ca).
Figure 3.
Surface area analysis from corn biochar (Elements from left to right K, Ca, C, O, Mg, P, K, Ca).

Figure 4.
Surface area analysis from corn biochar - pore region (Elements from left to right K, Ca, C, Mg, P, K, Ca).
Figure 4.
Surface area analysis from corn biochar - pore region (Elements from left to right K, Ca, C, Mg, P, K, Ca).

Figure 5.
Surface area analysis from corn biochar- mineral spot (Elements from left to right K, C, Mg, P, K, Ca).
Figure 5.
Surface area analysis from corn biochar- mineral spot (Elements from left to right K, C, Mg, P, K, Ca).

Figure 6.
Surface area analysis from corn biochar (Elements from left to right K, C, O, Mg, Al, Si, P, K, Ca).
Figure 6.
Surface area analysis from corn biochar (Elements from left to right K, C, O, Mg, Al, Si, P, K, Ca).

Figure 7.
Surface area analysis from corn biochar (Elements from left to right K, Ca, C, O, Mg, Al, Si, P, K, Ca).
Figure 7.
Surface area analysis from corn biochar (Elements from left to right K, Ca, C, O, Mg, Al, Si, P, K, Ca).

Figure 8.
Surface area analysis from outer soybean biochar (Elements from left to right Cl, K, Ca, C, O, Mg, Si. P, Cl, K, Ca, Fe).
Figure 8.
Surface area analysis from outer soybean biochar (Elements from left to right Cl, K, Ca, C, O, Mg, Si. P, Cl, K, Ca, Fe).

Figure 9.
X-ray surface area analysis from outer soybean biochar—SEM Elements include (a) SEM surface image (b) carbon (c) Chlorine (d) Calcium (e) Potassium (f) Oxygen (g) Phosphorus (h) Silicon distribution on the surface.
Figure 9.
X-ray surface area analysis from outer soybean biochar—SEM Elements include (a) SEM surface image (b) carbon (c) Chlorine (d) Calcium (e) Potassium (f) Oxygen (g) Phosphorus (h) Silicon distribution on the surface.


Figure 10.
Surface area analysis from inner soybean biochar.

Figure 11.
Surface area analysis from inner wood biochar (Elements from left to right K, C, O, Mg, P, K, Ca).
Figure 11.
Surface area analysis from inner wood biochar (Elements from left to right K, C, O, Mg, P, K, Ca).

Figure 12.
Surface area analysis from inner wood biochar (Elements from left to right K, C, O, Mg, P, K, Ca).
Figure 12.
Surface area analysis from inner wood biochar (Elements from left to right K, C, O, Mg, P, K, Ca).

Figure 13.
Surface area analysis from inner wood biochar (minerals from left to right C, K, O, Mg, P, K, Ca).
Figure 13.
Surface area analysis from inner wood biochar (minerals from left to right C, K, O, Mg, P, K, Ca).

Figure 14.
SEM of (a) outer wood biochar analysis (b) mineral concentration on outer wood–bottom (mineral from left to right K, Ca, O, Na, Al, Si, P, K, Ca).
Figure 14.
SEM of (a) outer wood biochar analysis (b) mineral concentration on outer wood–bottom (mineral from left to right K, Ca, O, Na, Al, Si, P, K, Ca).

Figure 15.
X-ray surface area analysis from inner wood biochar (a) SEM surface image (b) carbon (c) Aluminum (d) calcium (e) Chlorine (f) Iron (g) Potassium (h)magnesium (i) manganese (j) Oxygen (k) Phosphorus (I) Silicon distribution on the surface.
Figure 15.
X-ray surface area analysis from inner wood biochar (a) SEM surface image (b) carbon (c) Aluminum (d) calcium (e) Chlorine (f) Iron (g) Potassium (h)magnesium (i) manganese (j) Oxygen (k) Phosphorus (I) Silicon distribution on the surface.


Table 1.
Proximate and ultimate analysis of the biomass.
| Corn Grain | Soybeans | Wood Pellets | |
|---|---|---|---|
| Volatile Matter | 66.63 | 82.40 | 74 |
| Fixed Carbon | 17.15 | 13.27 | 16.6 |
| Ash | 1.4 | 4.34 | 0.43 |
| Total wt.% | 100% | 100% | 100% |
| Carbon | 40.07 | 64.77 | 47.52 |
| Hydrogen | 7.1 | 7.79 | 6.5 |
| Nitrogen | 1.4 | 7.64 | 0.05 |
| Sulfur | 0.17 | 0.32 | 0.1 |
| Oxygen | 50.5 | 15.15 | 42.00 |
| Total wt.% | 100% | 100% | 100% |
| HHV | 19.77 MJ/kg (8500 Btu/lb) | 13.63 MJ/kg (10,160 Btu/lb) | 32.33 MJ/kg (13,900 Btu/lb) |
Table 2.
Experimental conditions.
| Single-Stage Downdraft Parameters | |
|---|---|
| Equivalence ratio | 0.25 |
| Mass flow (kg/h) | 22.7 |
| Combustion zone temperature (°C) | 800–1000 |
| Air flow (m3/kg of fuel) | 4.06 |
Table 3.
Proximate and ultimate analysis of biochar.
| Corn Grain | Soybeans | Wood Pellets | |
|---|---|---|---|
| Volatile Matter | 5.37 | 32.41 | 6.00 |
| Fixed Carbon | 73.39 | 49.79 | 91.53 |
| Ash | 21.23 | 17.85 | 2.47 |
| Total | 100% | 100% | 100% |
| Carbon | 71.54 | 65.67 | 89.43 |
| Hydrogen | <0.50 | 5.97 | <0.50 |
| Nitrogen | 2.31 | 4.33 | 0.71 |
| Sulfur | 0.04 | 0.15 | 0.04 |
| Oxygen | 5.17 | 15.87 | 7.49 |
| Total | 100% | 100% | 100% |
| HHV | 24.7 MJ/kg (10,620 Btu/lb) | 26.17 MJ/kg (11,250 Btu/lb) | 32.33 MJ/kg (13,900 Btu/lb) |
Table 4.
Surface area of biochar and comparison to other studies.
| Method Used | Biochar | Surface Area (m2/g) |
|---|---|---|
| down draft gasifier | corn biochar | 22.8 |
| soybean biochar | 22.4 | |
| wood biochar | 92.4 | |
| fluidized bed gasifier | wood biochar | 19.7 [51] |
| fast pyrolysis | bamboo | 110.0 |
| rose wood | 32.36 [52] | |
| pine wood | 95.10 |
Table 5.
Element analysis of corn biochar.
| Element wt.% | Figure 3 | Figure 4 | Figure 5 | Figure 6 | Figure 7 |
|---|---|---|---|---|---|
| C | 46.90 | 60.06 | 12.23 | 12.06 | 29.40 |
| O | 7.05 | 6.83 | 17.65 | 5.12 | 25.65 |
| Mg | 1.16 | 1.52 | 3.60 | 1.24 | 1.37 |
| P | 9.62 | 7.13 | 21.74 | 13.45 | 12.89 |
| K | 31.76 | 21.67 | 41.24 | 67.42 | 21.82 |
| Ca | 3.50 | 2.76 | 1.25 | 0.71 | 1.70 |
| Al | - | - | 1.02 | - | 2.99 |
| Si | - | - | 1.27 | - | 4.18 |
| 100.00 | 100.00 | 100.00 | 100.00 | 100.00 |
Table 6.
Element analysis of soybean biochar.
| Element Concentration wt.% | Figure 9 | Figure 10 |
|---|---|---|
| C | 17.92 | 74.48 |
| O | 26.79 | 5.36 |
| Mg | 5.31 | 0.8 |
| Si | 2.82 | 0.64 |
| P | 14.39 | 1.76 |
| Cl | 1.29 | 0.91 |
| K | 17.18 | 4.63 |
| Ca | 4.98 | 0.86 |
| Na | - | 0.90 |
| Al | - | 0.93 |
| Mn | - | 1.69 |
| Fe | - | 2.17 |
| Ni | - | 4.85 |
| Total | 100% | 100% |
Table 7.
Elemental analysis of wood biochar at specific regions.
| Element | Figure 11 wt.% | Figure 12 wt.% | Figure 13 wt.% |
|---|---|---|---|
| C | 11.9 | 14.38 | 16.43 |
| O | 3.30 | 3.87 | 5.16 |
| Mg | 0.9 | 1.05 | 1.27 |
| P | 3.44 | 1.48 | 1.80 |
| K | 35.95 | 24.50 | 25.80 |
| Ca | 44.52 | 54.72 | 49.53 |
| Total | 100.00 | 100.00 | 100.00 |
Table 8.
Elemental analysis of wood biochar and comparison to other studies.
| Element | Figure 14 wt.% | Figure 15 wt.% | [54,62] wt.% | [56] wt.% | [57,59] mg kg−1 | [58,59] mg kg−1 | [55] mg kg−1 | [60] mg kg−1 | [61] mg kg−1 | [61] mg kg−1 |
|---|---|---|---|---|---|---|---|---|---|---|
| C | 57.26 | 70.92 | 85.7 | 83.9 | - | - | - | - | - | |
| O | 13.22 | 5.10 | 11.4 | - | - | - | - | - | ||
| Mg | 1.49 | 0.69 | 0.12 | - | 2.1 | 0.16 | 944 | 0.21 | 0.96 | 1.20 |
| P | 3.20 | 0.83 | 0.04 | - | 1.337 | 0.8 | 3463 | 5 | - | - |
| K | 4.85 | 8.73 | 0.05 | 2.3 | 9.36 | 8.3 | 5552 | 349 | 4.27 | 6.48 |
| Ca | 4.94 | 1.53 | 0.19 | 2.5 | 20.52 | 92.3 | 14,362 | 187 | 0.041 | 0.48 |
| Al | 2.54 | 0.69 | 0.04 | 0.3 | - | - | - | - | 0.19 | 0.22 |
| Si | 3.22 | 0.76 | - | 0.2 | - | - | - | - | - | - |
| Mn | 1.63 | 1.72 | - | - | - | - | 1273 | 8.2 | - | - |
| Fe | 2.04 | 2.55 | 0.02 | - | - | 0.08 | - | 5.5 | 0.07 | 0.07 |
| Ni | 4.64 | - | - | - | 0.025 | 10 | - | - | - | - |
| Cl | 0.98 | 6.46 | - | - | - | - | - | 12 | - | - |
| 100.00 | 100.00 |
Publisher’s Note: MDPI stays neutral with regard to jurisdictional claims in published maps and institutional affiliations. |
© 2021 by the authors. Licensee MDPI, Basel, Switzerland. This article is an open access article distributed under the terms and conditions of the Creative Commons Attribution (CC BY) license (http://creativecommons.org/licenses/by/4.0/).
Share and Cite
MDPI and ACS Style
Sharma, T.; Ratner, A. Analysis and Characterization of Metallic Nodules on Biochar from Single-Stage Downdraft Gasification. Processes 2021, 9, 533. https://doi.org/10.3390/pr9030533
AMA Style
Sharma T, Ratner A. Analysis and Characterization of Metallic Nodules on Biochar from Single-Stage Downdraft Gasification. Processes. 2021; 9(3):533. https://doi.org/10.3390/pr9030533
Chicago/Turabian StyleSharma, Tejasvi, and Albert Ratner. 2021. "Analysis and Characterization of Metallic Nodules on Biochar from Single-Stage Downdraft Gasification" Processes 9, no. 3: 533. https://doi.org/10.3390/pr9030533
Note that from the first issue of 2016, this journal uses article numbers instead of page numbers. See further details here.