Chemical Characterization Using Different Analytical Techniques to Understand Processes: The Case of the Paraffinic Base Oil Production Line


 ,
,  , and
, and
Abstract
:1. Introduction
2. Materials and Methods
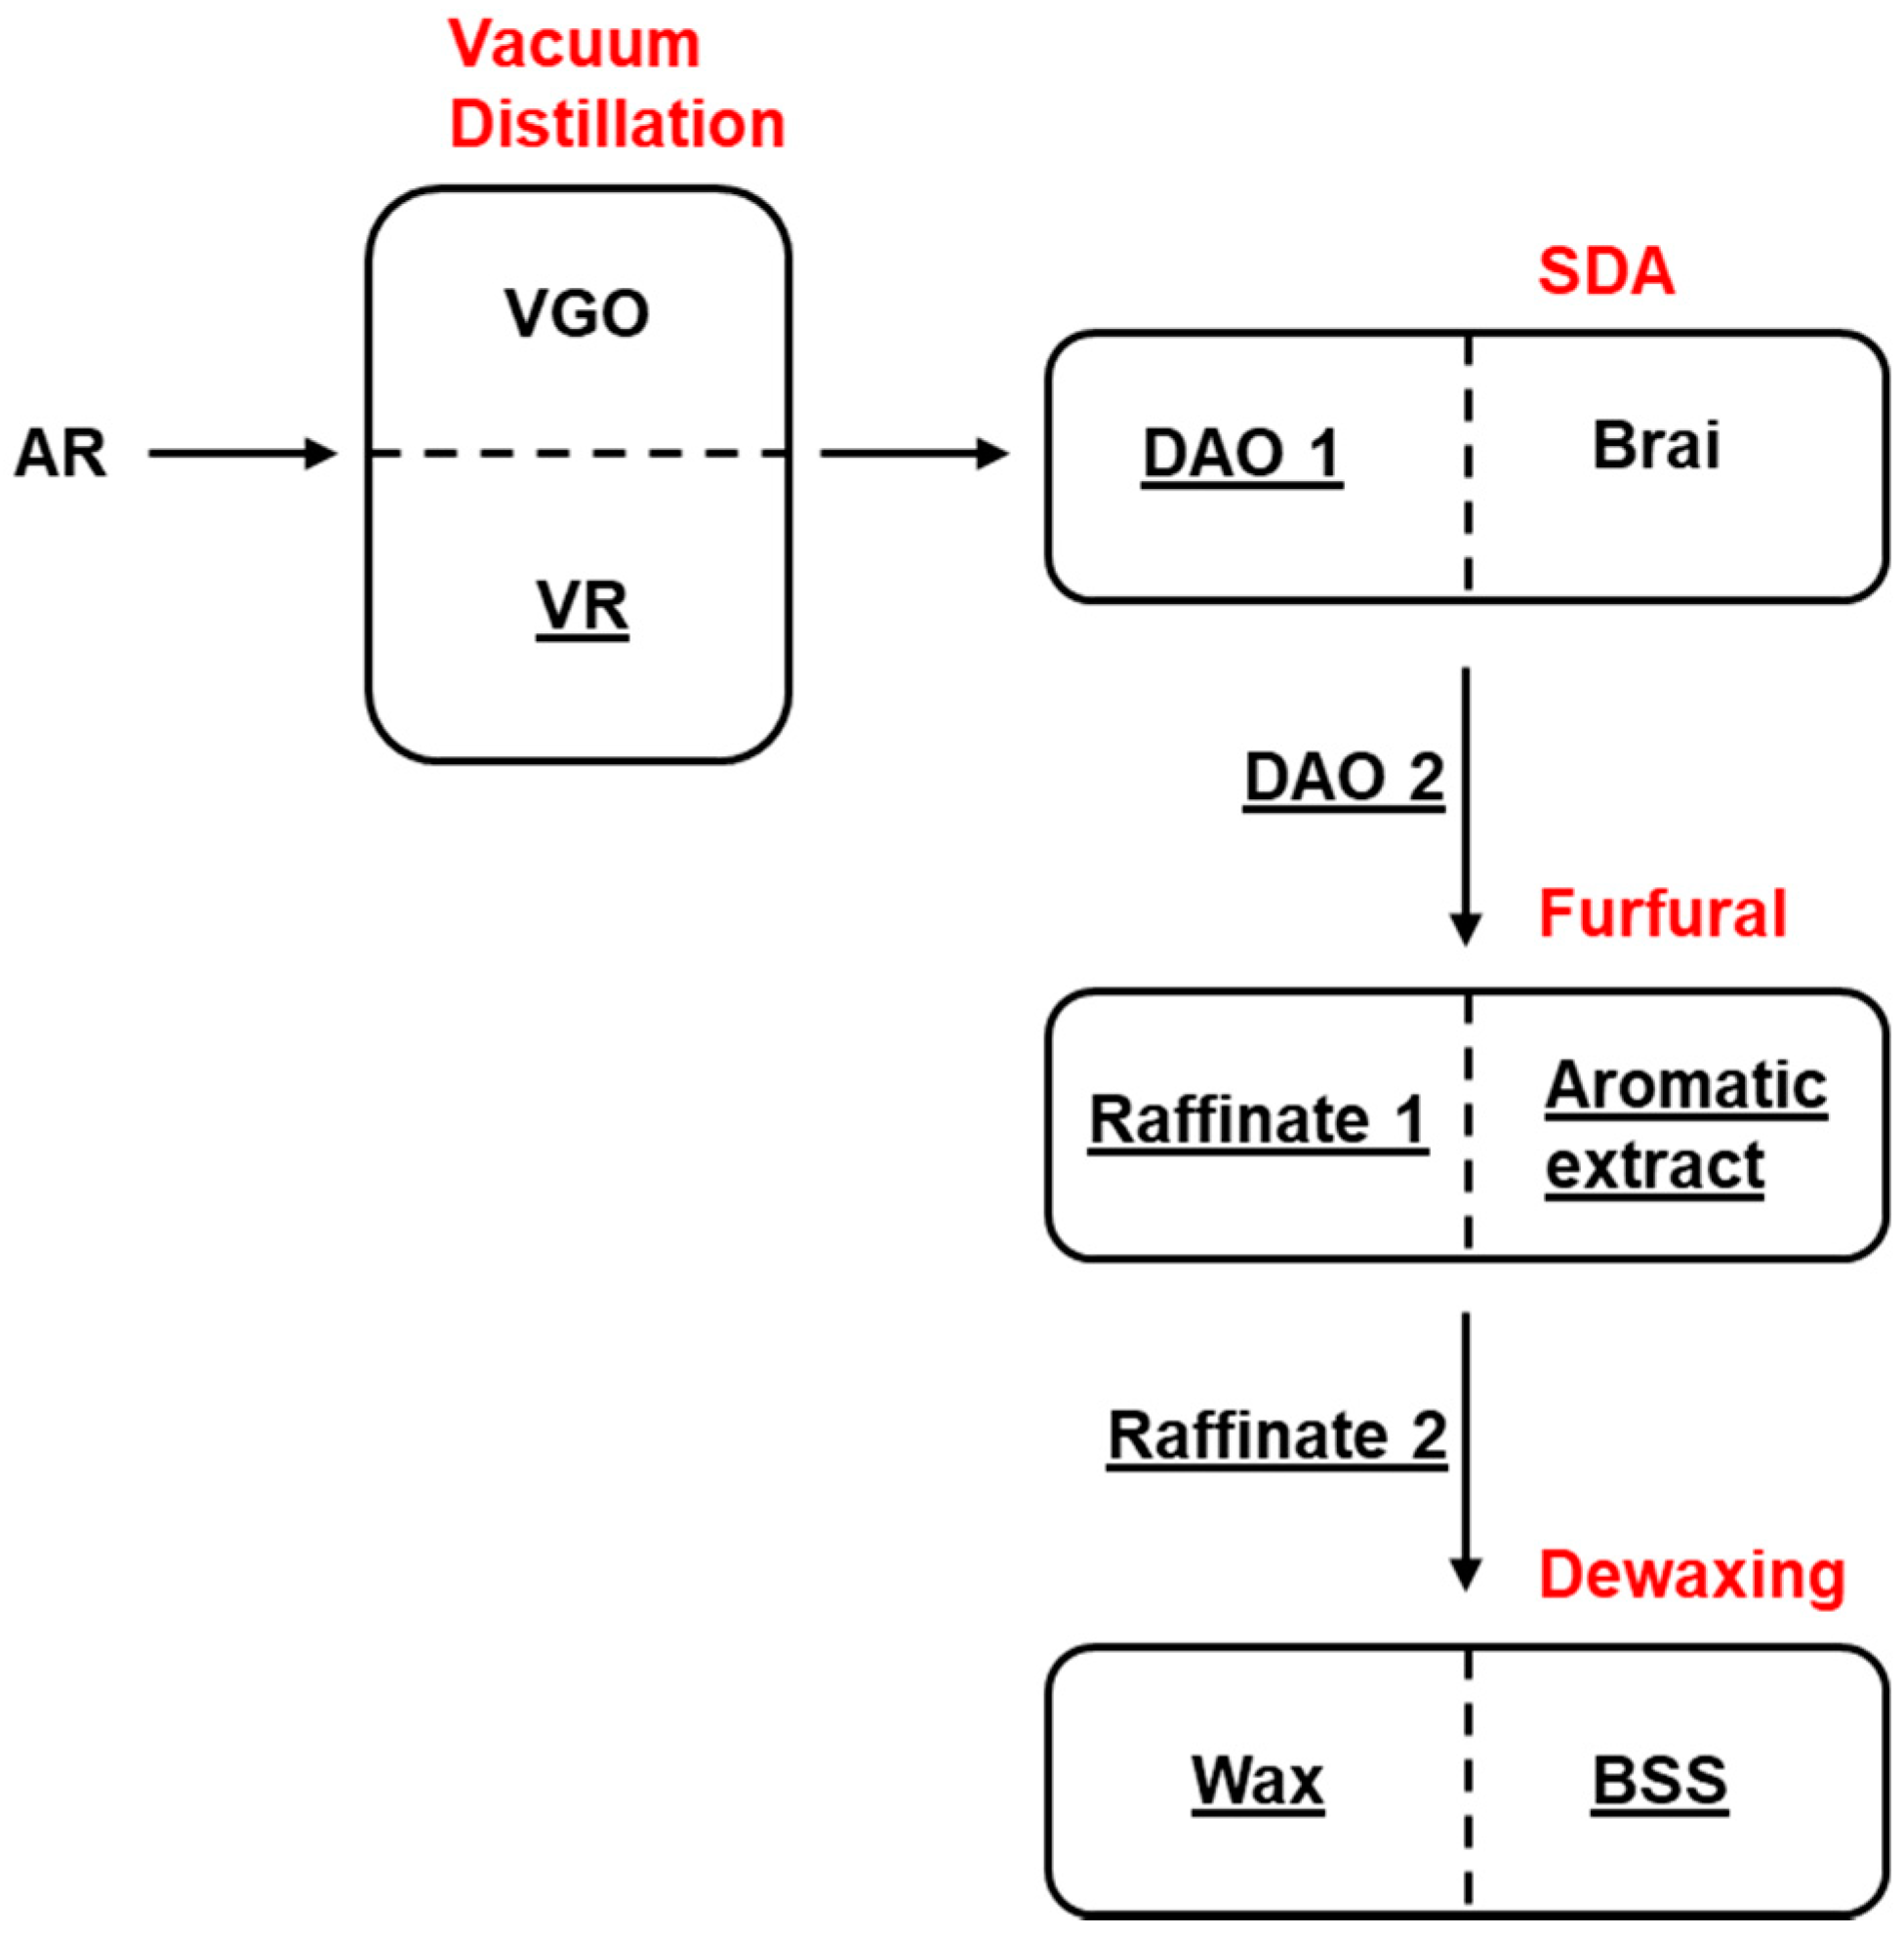
2.1. Samples, Materials, and Reagents
2.2. Analytical Techniques
2.2.1. HPLC3
2.2.2. GPC ICP HR MS
2.2.3. APPI/APCI FTICR-MS
2.2.4. Statistical Treatment Using Partial Least Square (PLS) Regression
3. Results
3.1. HPLC3 Results
3.2. GPC-ICP HR MS Results
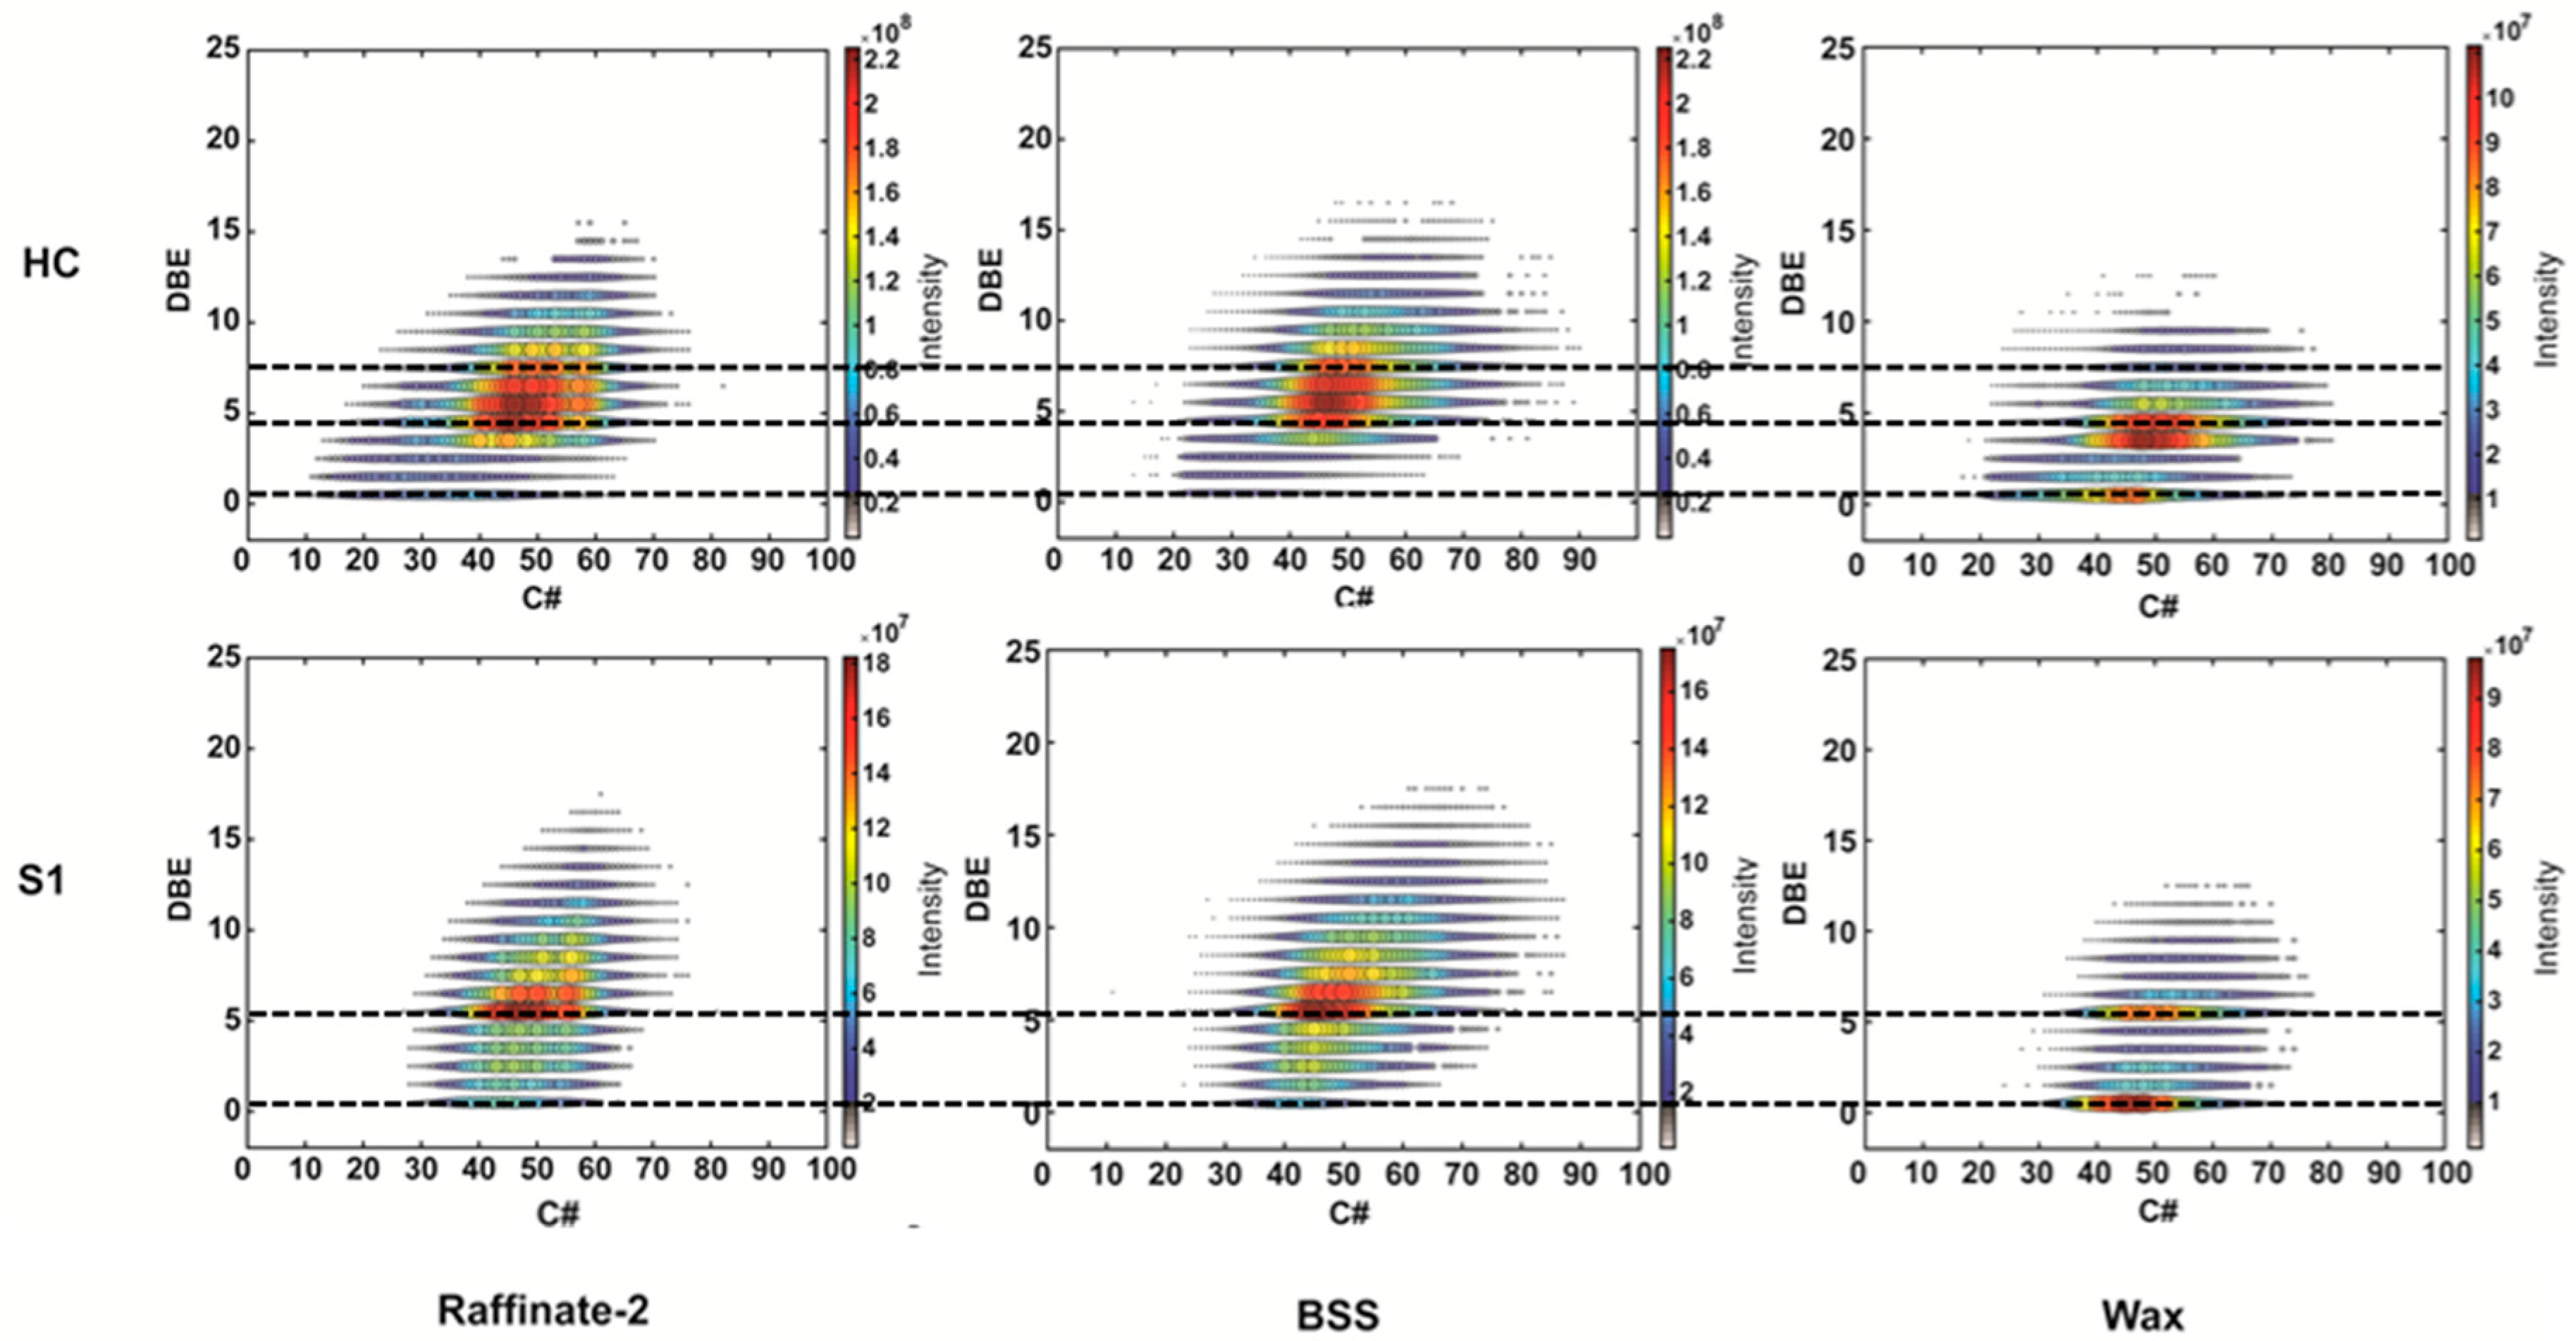
3.3. APPI/APCI FT ICR Results
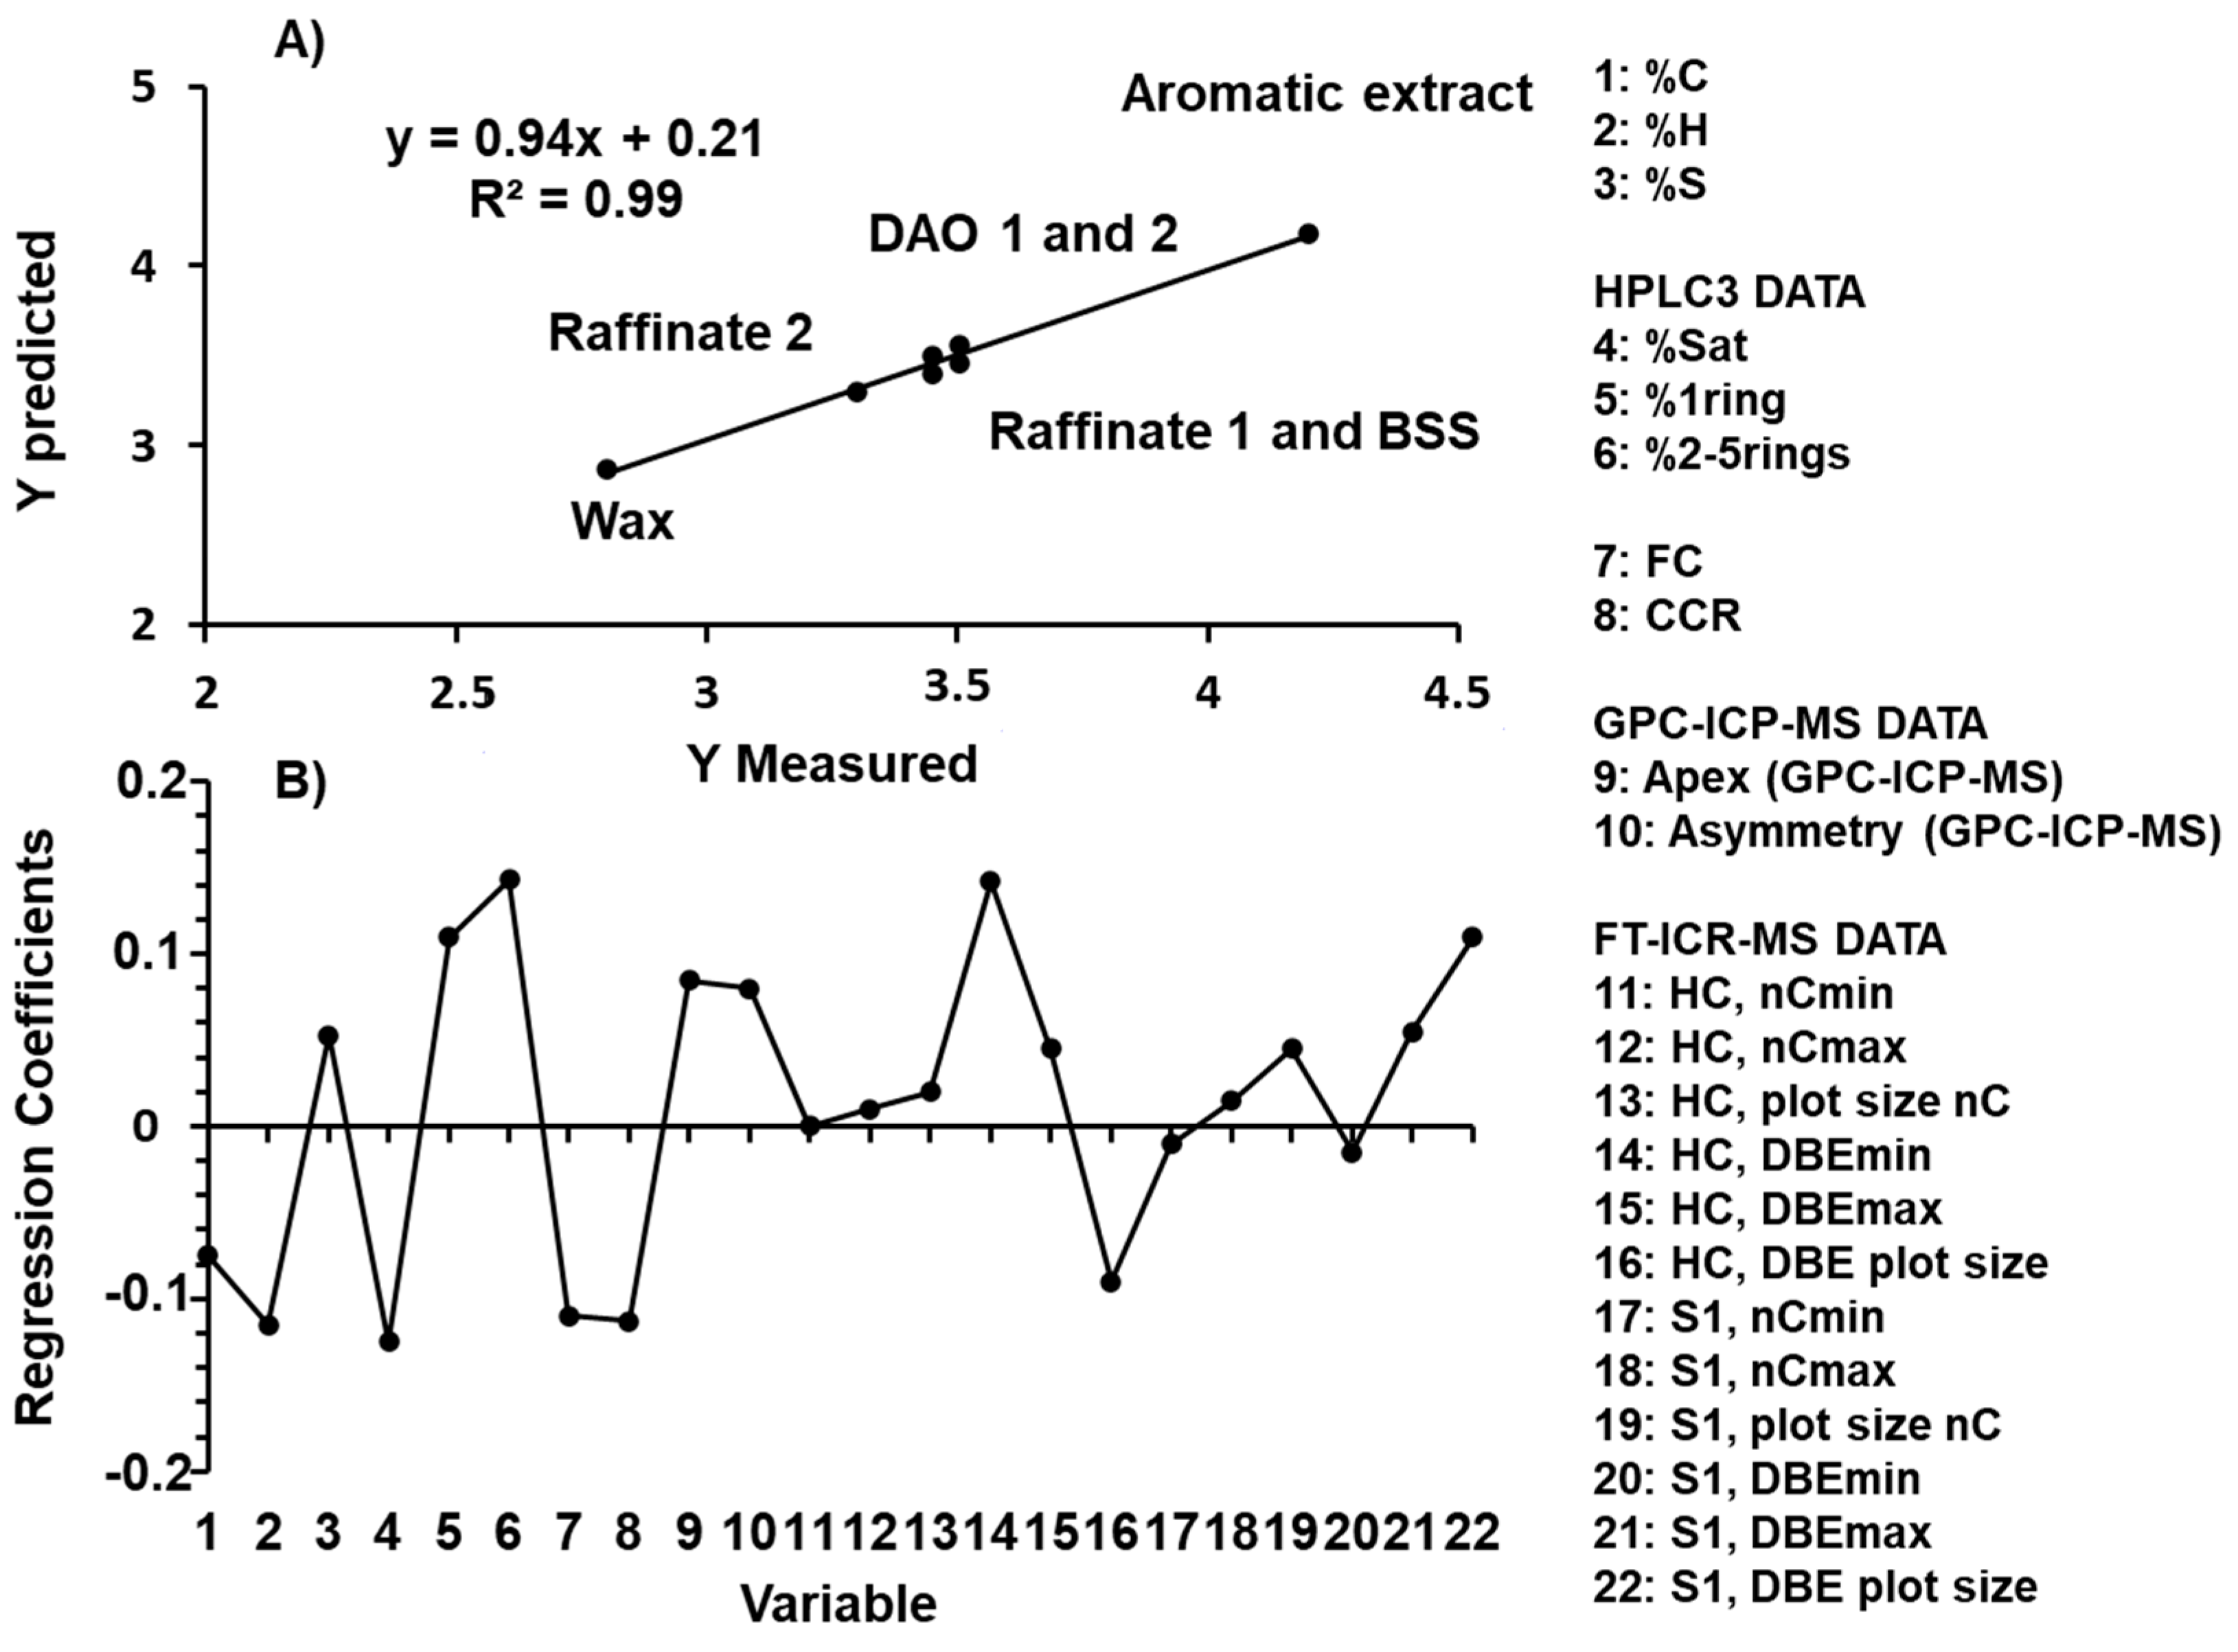
3.4. Statistic Treatment Using PLS Regression
4. Conclusions
Supplementary Materials
Author Contributions
Funding
Conflicts of Interest
References
- Wilson, R.E.; Keith, P.C.; Haylett, R.E. LIQUID PROPANE Use in Dewaxing, Deasphalting, and Refining Heavy Oils. Ind. Eng. Chem. 1936, 28, 1065–1078. [Google Scholar] [CrossRef]
- Mehrkesh, A.H.; Hajimirzaee, S.; Hatamipour, M.S. A Generalized Correlation for Characterization of Lubricating Base-oils from Their Viscosities. Chin. J. Chem. Eng. 2010, 18, 642–647. [Google Scholar] [CrossRef]
- Kemp, L.C., Jr.; Hamilton, G.B.; Gross, H.H. Furfural as a Selective Solvent in Petroleum Refining. Ind. Eng. Chem. 1948, 40, 220–227. [Google Scholar] [CrossRef]
- Varotsis, N.; Pasadakis, N. Rapid Quantitative Determination of Aromatic Groups in Lubricant Oils Using Gel Permeation Chromatography. Ind. Eng. Chem. Res. 1997, 36, 5516–5519. [Google Scholar] [CrossRef]
- Alawani, N.A.; Panda, S.K.; Lajami, A.R.; Al-Qunaysi, T.A.; Muller, H. Characterization of Crude Oils through Alkyl Chain-Based Separation by Gel Permeation Chromatography and Mass Spectrometry. Energy Fuels 2020, 34, 5414–5425. [Google Scholar] [CrossRef]
- Wang, F.C.-Y.; Zhang, L. Chemical Composition of Group II Lubricant Oil Studied by High-Resolution Gas Chromatography and Comprehensive Two-Dimensional Gas Chromatography. Energy Fuels 2007, 21, 3477–3483. [Google Scholar] [CrossRef]
- Manheim, J.; Wehde, K.; Zhang, W.T.J.; Vozka, P.; Romanczyk, M.; Kilaz, G.; Kenttämaa, H.I. Identification and Quantitation of Linear Alkanes in Lubricant Base Oils by Using GC × GC/EI TOF Mass Spectrometry. J. Am. Soc. Mass Spectrom. 2019, 30, 2670–2677. [Google Scholar] [CrossRef]
- Liang, Z.; Chen, L.; Alam, M.S.; Rezaei, S.Z.; Stark, C.; Xu, H.; Harrison, R.M. Comprehensive chemical characterization of lubricating oils used in modern vehicular engines utilizing GC × GC-TOFMS. Fuel 2018, 220, 792–799. [Google Scholar] [CrossRef]
- Desprez, A.; Bouyssiere, B.; Arnaudguilhem, C.; Krier, G.; Vernex-Loset, L.; Giusti, P. Study of the Size Distribution of Sulfur, Vanadium, and Nickel Compounds in Four Crude Oils and Their Distillation Cuts by Gel Permeation Chromatography Inductively Coupled Plasma High-Resolution Mass Spectrometry. Energy Fuels 2014, 28, 3730–3737. [Google Scholar] [CrossRef]
- Panda, S.K.; Alawani, N.A.; Lajami, A.R.; Al-Qunaysi, T.A.; Muller, H. Characterization of aromatic hydrocarbons and sulfur heterocycles in Saudi Arabian heavy crude oil by gel permeation chromatography and ultrahigh resolution mass spectrometry. Fuel 2019, 235, 1420–1426. [Google Scholar] [CrossRef]
- Putman, J.C.; Sama, S.G.; Barrère-Mangote, C.; Rodgers, R.P.; Lobinski, R.; Marshall, A.G.; Bouyssiere, B.; Giusti, P. Analysis of Petroleum Products by Gel Permeation Chromatography Coupled Online with Inductively Coupled Plasma Mass Spectrometry and Offline with Fourier Transform Ion Cyclotron Resonance Mass Spectrometry. Energy Fuels 2018, 32, 12198–12204. [Google Scholar] [CrossRef]
- Duan, P.; Qian, K.; Habicht, S.C.; Pinkston, D.S.; Fu, M.; Kenttämaa, H.I. Analysis of Base Oil Fractions by ClMn(H2O)+ Chemical Ionization Combined with Laser-Induced Acoustic Desorption/Fourier Transform Ion Cyclotron Resonance Mass Spectrometry. Anal. Chem. 2008, 80, 1847–1853. [Google Scholar] [CrossRef] [PubMed]
- Nyadong, L.; Quinn, J.P.; Hsu, C.S.; Hendrickson, C.L.; Rodgers, R.P.; Marshall, A.G. Atmospheric Pressure Laser-Induced Acoustic Desorption Chemical Ionization Mass Spectrometry for Analysis of Saturated Hydrocarbons. Anal. Chem. 2012, 84, 7131–7137. [Google Scholar] [CrossRef]
- Hourani, N.; Muller, H.; Adam, F.M.; Panda, S.K.; Witt, M.; Al-Hajji, A.A.; Sarathy, S.M. Structural Level Characterization of Base Oils Using Advanced Analytical Techniques. Energy Fuels 2015, 29, 2962–2970. [Google Scholar] [CrossRef]
- Putman, J.C.; Rowland, S.M.; Podgorski, D.C.; Robbins, W.K.; Rodgers, R.P. Dual-Column Aromatic Ring Class Separation with Improved Universal Detection across Mobile-Phase Gradients via Eluate Dilution. Energy Fuels 2017, 31, 12064–12071. [Google Scholar] [CrossRef]
- Bae, E.; Na, J.-G.; Chung, S.H.; Kim, H.S.; Kim, S. Identification of about 30,000 Chemical Components in Shale Oils by Electrospray Ionization (ESI) and Atmospheric Pressure Photoionization (APPI) Coupled with 15 T Fourier Transform Ion Cyclotron Resonance Mass Spectrometry (FT-ICR MS) and a Comparison to Conventional Oil. Energy Fuels 2010, 24, 2563–2569. [Google Scholar] [CrossRef]
- Purcell, J.M.; Hendrickson, C.L.; Rodgers, R.P.; Marshall, A.G. Atmospheric Pressure Photoionization Fourier Transform Ion Cyclotron Resonance Mass Spectrometry for Complex Mixture Analysis. Anal. Chem. 2006, 78, 5906–5912. [Google Scholar] [CrossRef]
- Jin, C.; Viidanoja, J.; Li, M.; Zhang, Y.; Ikonen, E.; Root, A.; Romanczyk, M.; Manheim, J.; Dziekonski, E.; Kenttämaa, H.I. Comparison of Atmospheric Pressure Chemical Ionization and Field Ionization Mass Spectrometry for the Analysis of Large Saturated Hydrocarbons. Anal. Chem. 2016, 88, 10592–10598. [Google Scholar] [CrossRef]
- Tose, L.V.; Cardoso, F.M.; Fleming, F.P.; Vicente, M.A.; Silva, S.R.; Aquije, G.M.; Vaz, B.G.; Romão, W. Analyzes of hydrocarbons by atmosphere pressure chemical ionization FT-ICR mass spectrometry using isooctane as ionizing reagent. Fuel 2015, 153, 346–354. [Google Scholar] [CrossRef]
- Mead, W.L. Field ionization mass spectrometry of heavy petroleum fractions. Waxes. Anal. Chem. 1968, 40, 743–747. [Google Scholar] [CrossRef]
- Souza, L.M.; Tose, L.V.; Cardoso, F.M.R.; Fleming, F.P.; Pinto, F.E.; Kuster, R.M.; Filgueiras, P.R.; Vaz, B.G.; Romão, W. Evaluating the effect of ion source gas (N2, He, and synthetic air) on the ionization of hydrocarbon, condensed aromatic standards, and paraffin fractions by APCI(+)FT-ICR MS. Fuel 2018, 225, 632–645. [Google Scholar] [CrossRef]
- Manheim, J.; Zhang, Y.; Viidanoja, J.; Kenttämaa, H.I. An Automated Method for Chemical Composition Analysis of Lubricant Base Oils by Using Atmospheric Pressure Chemical Ionization Mass Spectrometry. J. Am. Soc. Mass Spectrom. 2019, 30, 2014–2021. [Google Scholar] [CrossRef] [PubMed]
- Marshall, A.G.; Hendrickson, C.L.; Jackson, G.S. Fourier transform ion cyclotron resonance mass spectrometry. Mass Spectrom. Rev. 1998, 17, 1–35. [Google Scholar] [CrossRef]
- Boldin, I.A.; Nikolaev, E.N. Fourier transform ion cyclotron resonance cell with dynamic harmonization of the electric field in the whole volume by shaping of the excitation and detection electrode assembly. Rapid Commun. Mass Spectrom. 2011, 25, 122–126. [Google Scholar] [CrossRef]
- Chen, H.; Hou, A.; Corilo, Y.E.; Lin, Q.; Lu, J.; Mendelssohn, I.A.; Zhang, R.; Rodgers, R.P.; McKenna, A.M. 4 Years after the Deepwater Horizon Spill: Molecular Transformation of Macondo Well Oil in Louisiana Salt Marsh Sediments Revealed by FT-ICR Mass Spectrometry. Environ. Sci. Technol. 2016, 50, 9061–9069. [Google Scholar] [CrossRef]
- Marshall, A.G.; Chen, T. 40 years of Fourier transform ion cyclotron resonance mass spectrometry. Int. J. Mass Spectrom. 2015, 377, 410–420. [Google Scholar] [CrossRef]
- Hourani, N.; Andersson, J.T.; Möller, I.; Amad, M.; Witt, M.; Sarathy, S.M. Atmospheric pressure chemical ionization Fourier transform ion cyclotron resonance mass spectrometry for complex thiophenic mixture analysis. Rapid Commun. Mass Spectrom. 2013, 27, 2432–2438. [Google Scholar] [CrossRef]
- Muller, H.; Adam, F.M.; Panda, S.K.; Al-Jawad, H.H.; Al-Hajji, A.A. Evaluation of Quantitative Sulfur Speciation in Gas Oils by Fourier Transform Ion Cyclotron Resonance Mass Spectrometry: Validation by Comprehensive Two-Dimensional Gas Chromatography. J. Am. Soc. Mass Spectrom. 2012, 23, 806–815. [Google Scholar] [CrossRef] [Green Version]
- Loh, G.C.; Lee, H.-C.; Tee, X.Y.; Chow, P.S.; Zheng, J.W. Viscosity Prediction of Lubricants by a General Feed-Forward Neural Network. J. Chem. Inf. Model. 2020, 60, 1224–1234. [Google Scholar] [CrossRef]
- Braga, J.W.B.; Junior, A.A.D.S.; Martins, I.S. Determination of viscosity index in lubricant oils by infrared spectroscopy and PLSR. Fuel 2014, 120, 171–178. [Google Scholar] [CrossRef]
- Sama, S.G.; Desprez, A.; Krier, G.; Lienemann, C.-P.; Barbier, J.; Lobinski, R.; Barrere-Mangote, C.; Giusti, P.; Bouyssiere, B. Study of the Aggregation of Metal Complexes with Asphaltenes Using Gel Permeation Chromatography Inductively Coupled Plasma High-Resolution Mass Spectrometry. Energy Fuels 2016, 30, 6907–6912. [Google Scholar] [CrossRef]
- Caumette, G.; Lienemann, C.-P.; Merdrignac, I.; Bouyssiere, B.; Lobinski, R. Element speciation analysis of petroleum and related materials. J. Anal. At. Spectrom. 2009, 24, 263–276. [Google Scholar] [CrossRef]
- Giusti, P.; Ordóñez, Y.N.; Lienemann, C.-P.; Schaumlöffel, D.; Bouyssiere, B.; Łobiński, R. µFlow-injection–ICP collision cell MS determination of molybdenum, nickel and vanadium in petroleum samples using a modified total consumption micronebulizer. J. Anal. At. Spectrom. 2007, 22, 88–92. [Google Scholar] [CrossRef]
- Zhang, L.; Hou, Z.; Horton, S.R.; Klein, M.T.; Shi, Q.; Zhao, S.; Xu, C. Molecular Representation of Petroleum Vacuum Resid. Energy Fuels 2014, 28, 1736–1749. [Google Scholar] [CrossRef]
- Kim, S.; Kramer, R.W.; Hatcher, P.G. Graphical Method for Analysis of Ultrahigh-Resolution Broadband Mass Spectra of Natural Organic Matter, the Van Krevelen Diagram. Anal. Chem. 2003, 75, 5336–5344. [Google Scholar] [CrossRef] [PubMed]
- Caumette, G.; Lienemann, C.-P.; Merdrignac, I.; Bouyssiere, B.; Lobinski, R. Fractionation and speciation of nickel and vanadium in crude oils by size exclusion chromatography-ICP MS and normal phase HPLC-ICP MS. J. Anal. At. Spectrom. 2010, 25, 1123–1129. [Google Scholar] [CrossRef]
- Ali, M.F.; Abbas, S. A review of methods for the demetallization of residual fuel oils. Fuel Process. Technol. 2006, 87, 573–584. [Google Scholar] [CrossRef]
- Řezanka, T.; Sigler, K. Identification of very long chain fatty acids from sugar cane wax by atmospheric pressure chemical ionization liquid chromatography–mass spectroscopy. Phytochemistry 2006, 67, 916–923. [Google Scholar] [CrossRef]
- Aasen, A.J.; Hofstetter, H.H.; Iyengar, B.T.R.; Holman, R.T. Identification and analysis of wax esters by mass spectrometry. Lipids 1971, 6, 502–507. [Google Scholar] [CrossRef]


| Sulfur Content (%w) | Vanadium Content (ppm) | Carbon Content (%w) | Hydrogen Content (%w) | Viscosity at 100 °C (cSt) | Crystallizable Fraction (FC, %w) | Carbon Conradson (CCR, %w) | ||
|---|---|---|---|---|---|---|---|---|
| SDA | VR | 2.95 | 150 | 85.6 | 10.9 | 353.8 | 5.7 | 15.36 |
| DAO 1 | 1.67 | 1.6 | 85.9 | 12.5 | 33.83 | 12.7 | 1.65 | |
| FF | DAO 2 | 1.70 | 2.2 | 85.3 | 12.5 | 34.52 | 12.2 | 2.01 |
| Raffinate 1 | 0.83 | <0.1 | 85.9 | 13.4 | 26.72 | 19.6 | 0 | |
| Aromatic Extract | 2.80 | 4.8 | 84.5 | 11.1 | 61.39 | 3.2 | 0 | |
| Dewaxing | Raffinate 2 | 0.77 | <0.1 | 85.7 | 13.5 | 29.79 | 21.4 | 0.34 |
| BSS | 0.94 | <0.1 | 86.2 | 13.3 | 31.87 | 6.3 | 0.53 | |
| Wax | 0.38 | <0.1 | 85.2 | 14.2 | 17.31 | 72.7 | 0 |
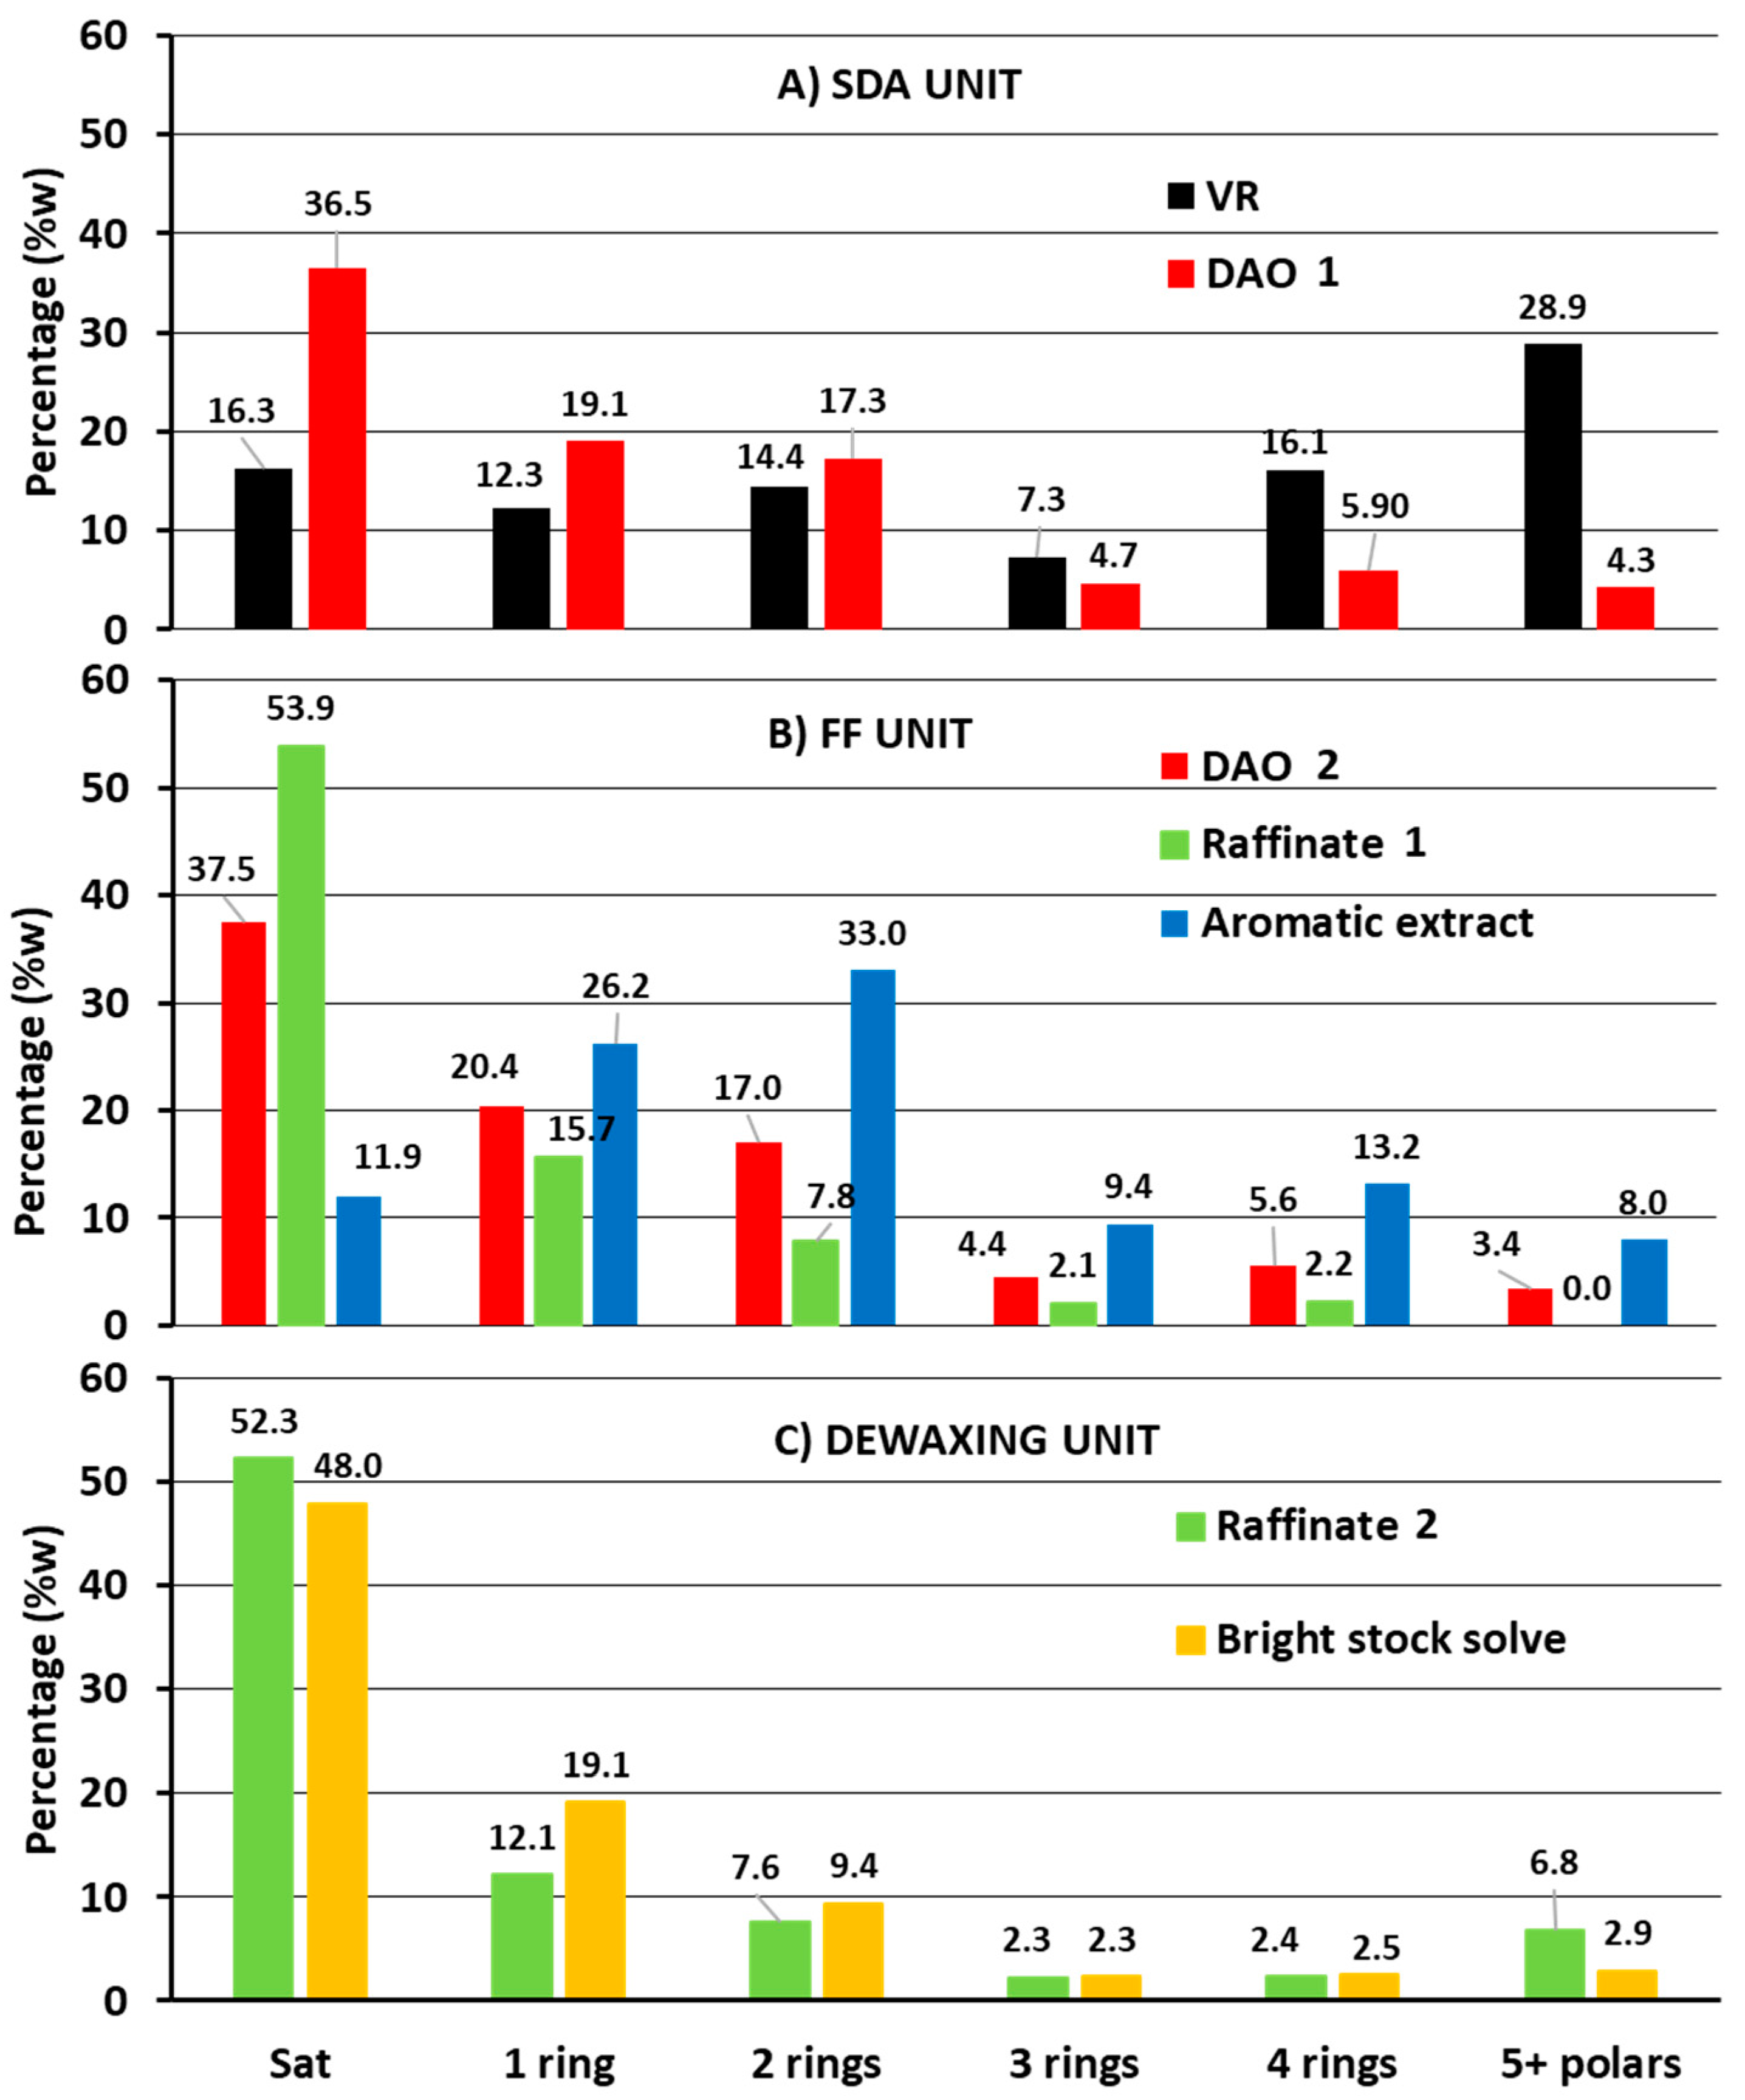
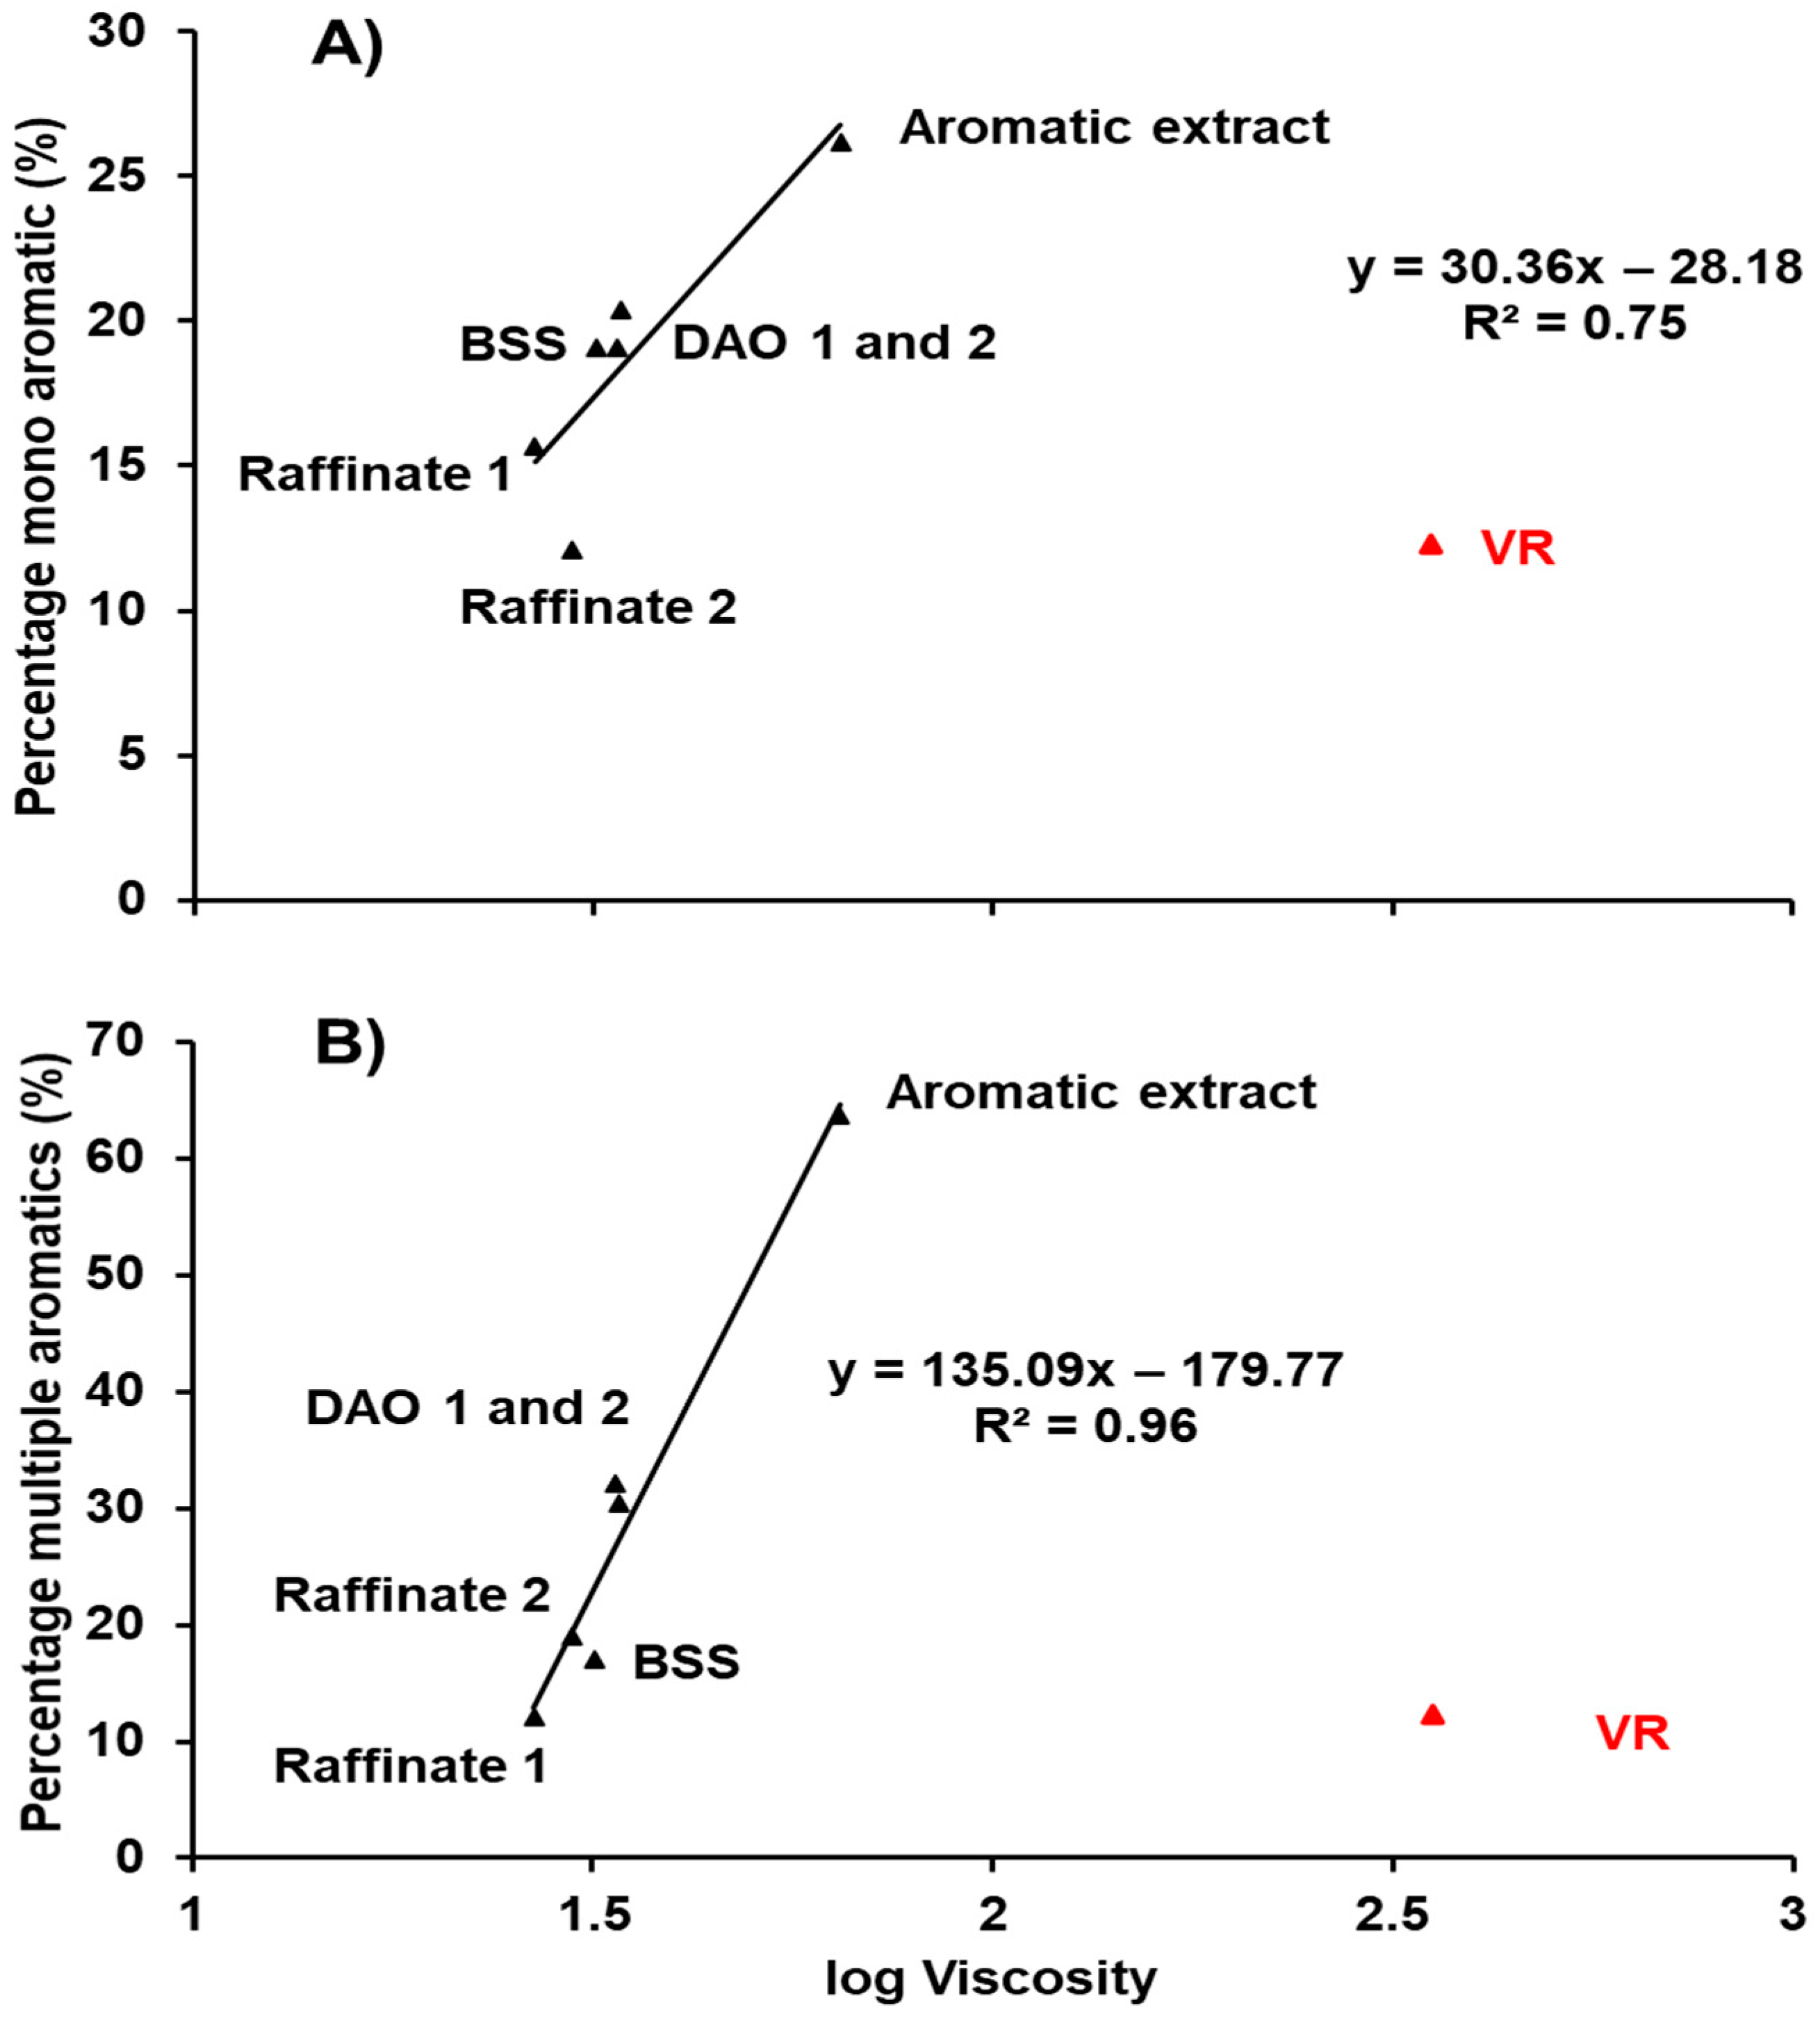
| Samples | Saturates (%w) | Percentage Mono Aromatic (%w) | Percentage Multiple Aromatics 2R-5R (%w) |
|---|---|---|---|
| VR | 16.3 | 12.3 | 66.7 |
| DAO 1 | 36.5 | 19.1 | 32.1 |
| DAO 2 | 37.5 | 20.4 | 30.4 |
| Raffinate 2 | 53.9 | 15.7 | 12.2 |
| Aromatic Extract | 11.9 | 26.2 | 63.6 |
| Raffinate 3 | 52.3 | 12.1 | 15.7 |
| BSS | 48.0 | 19.1 | 17.1 |
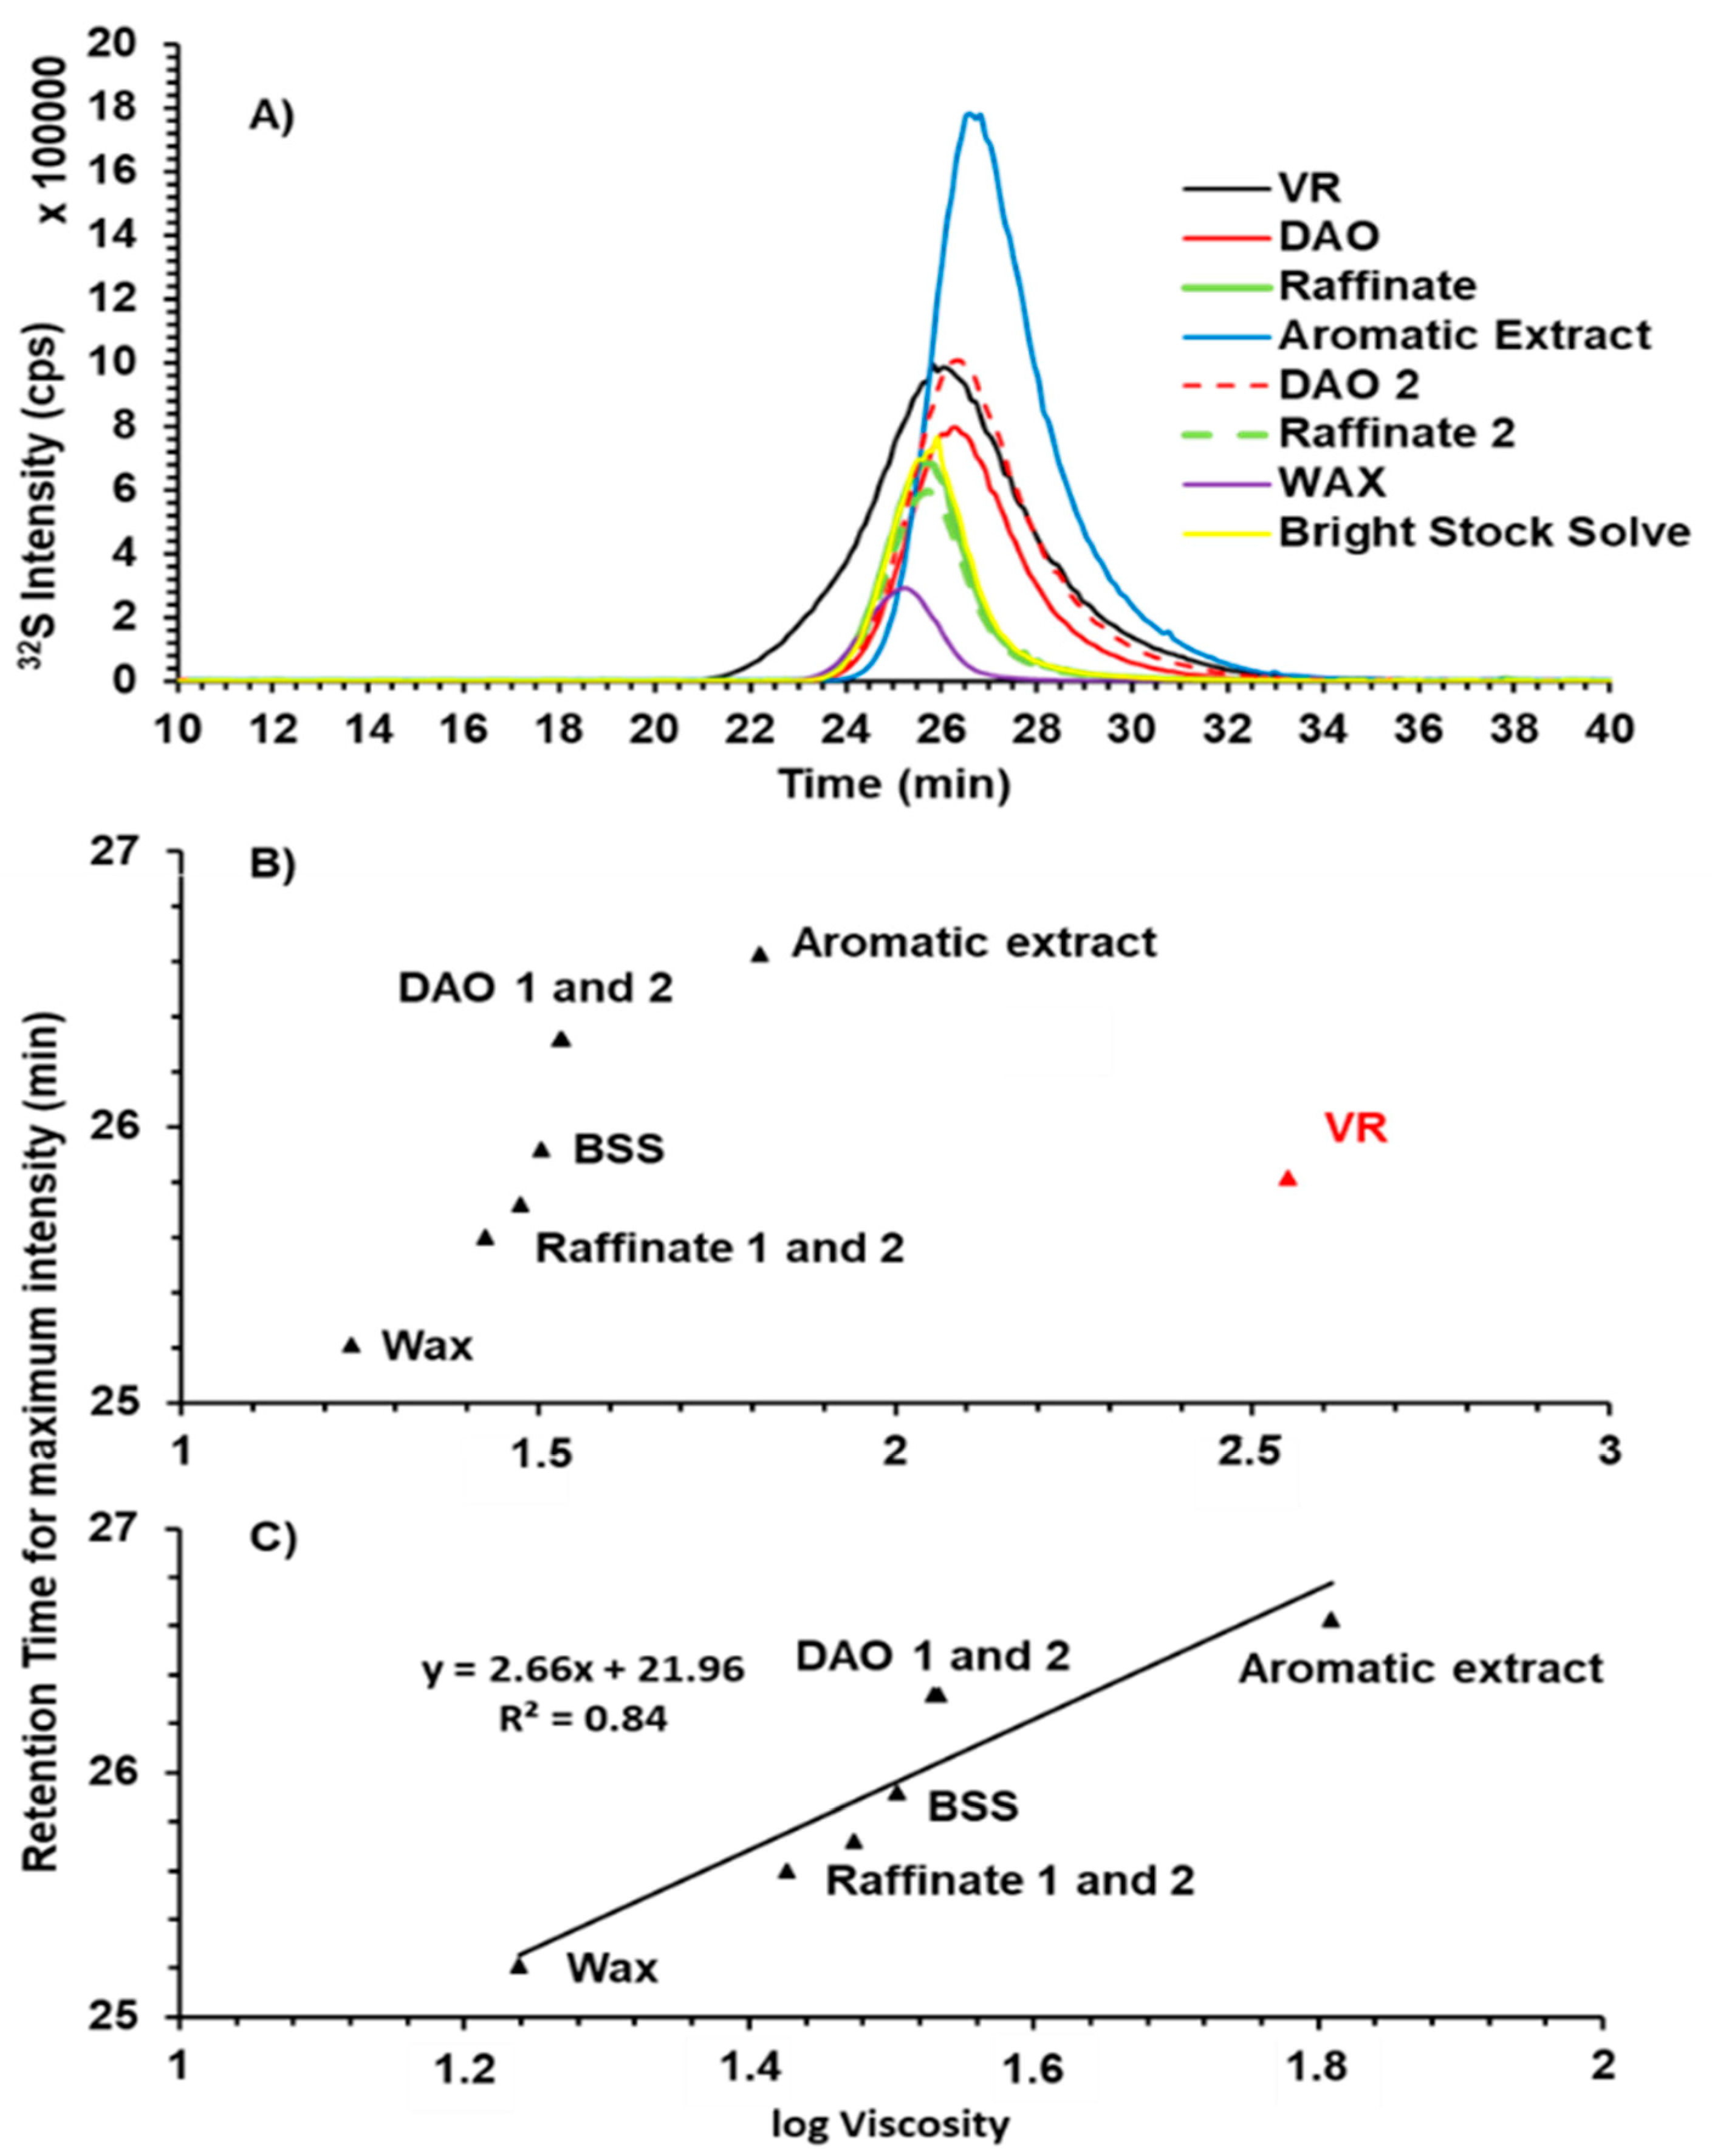
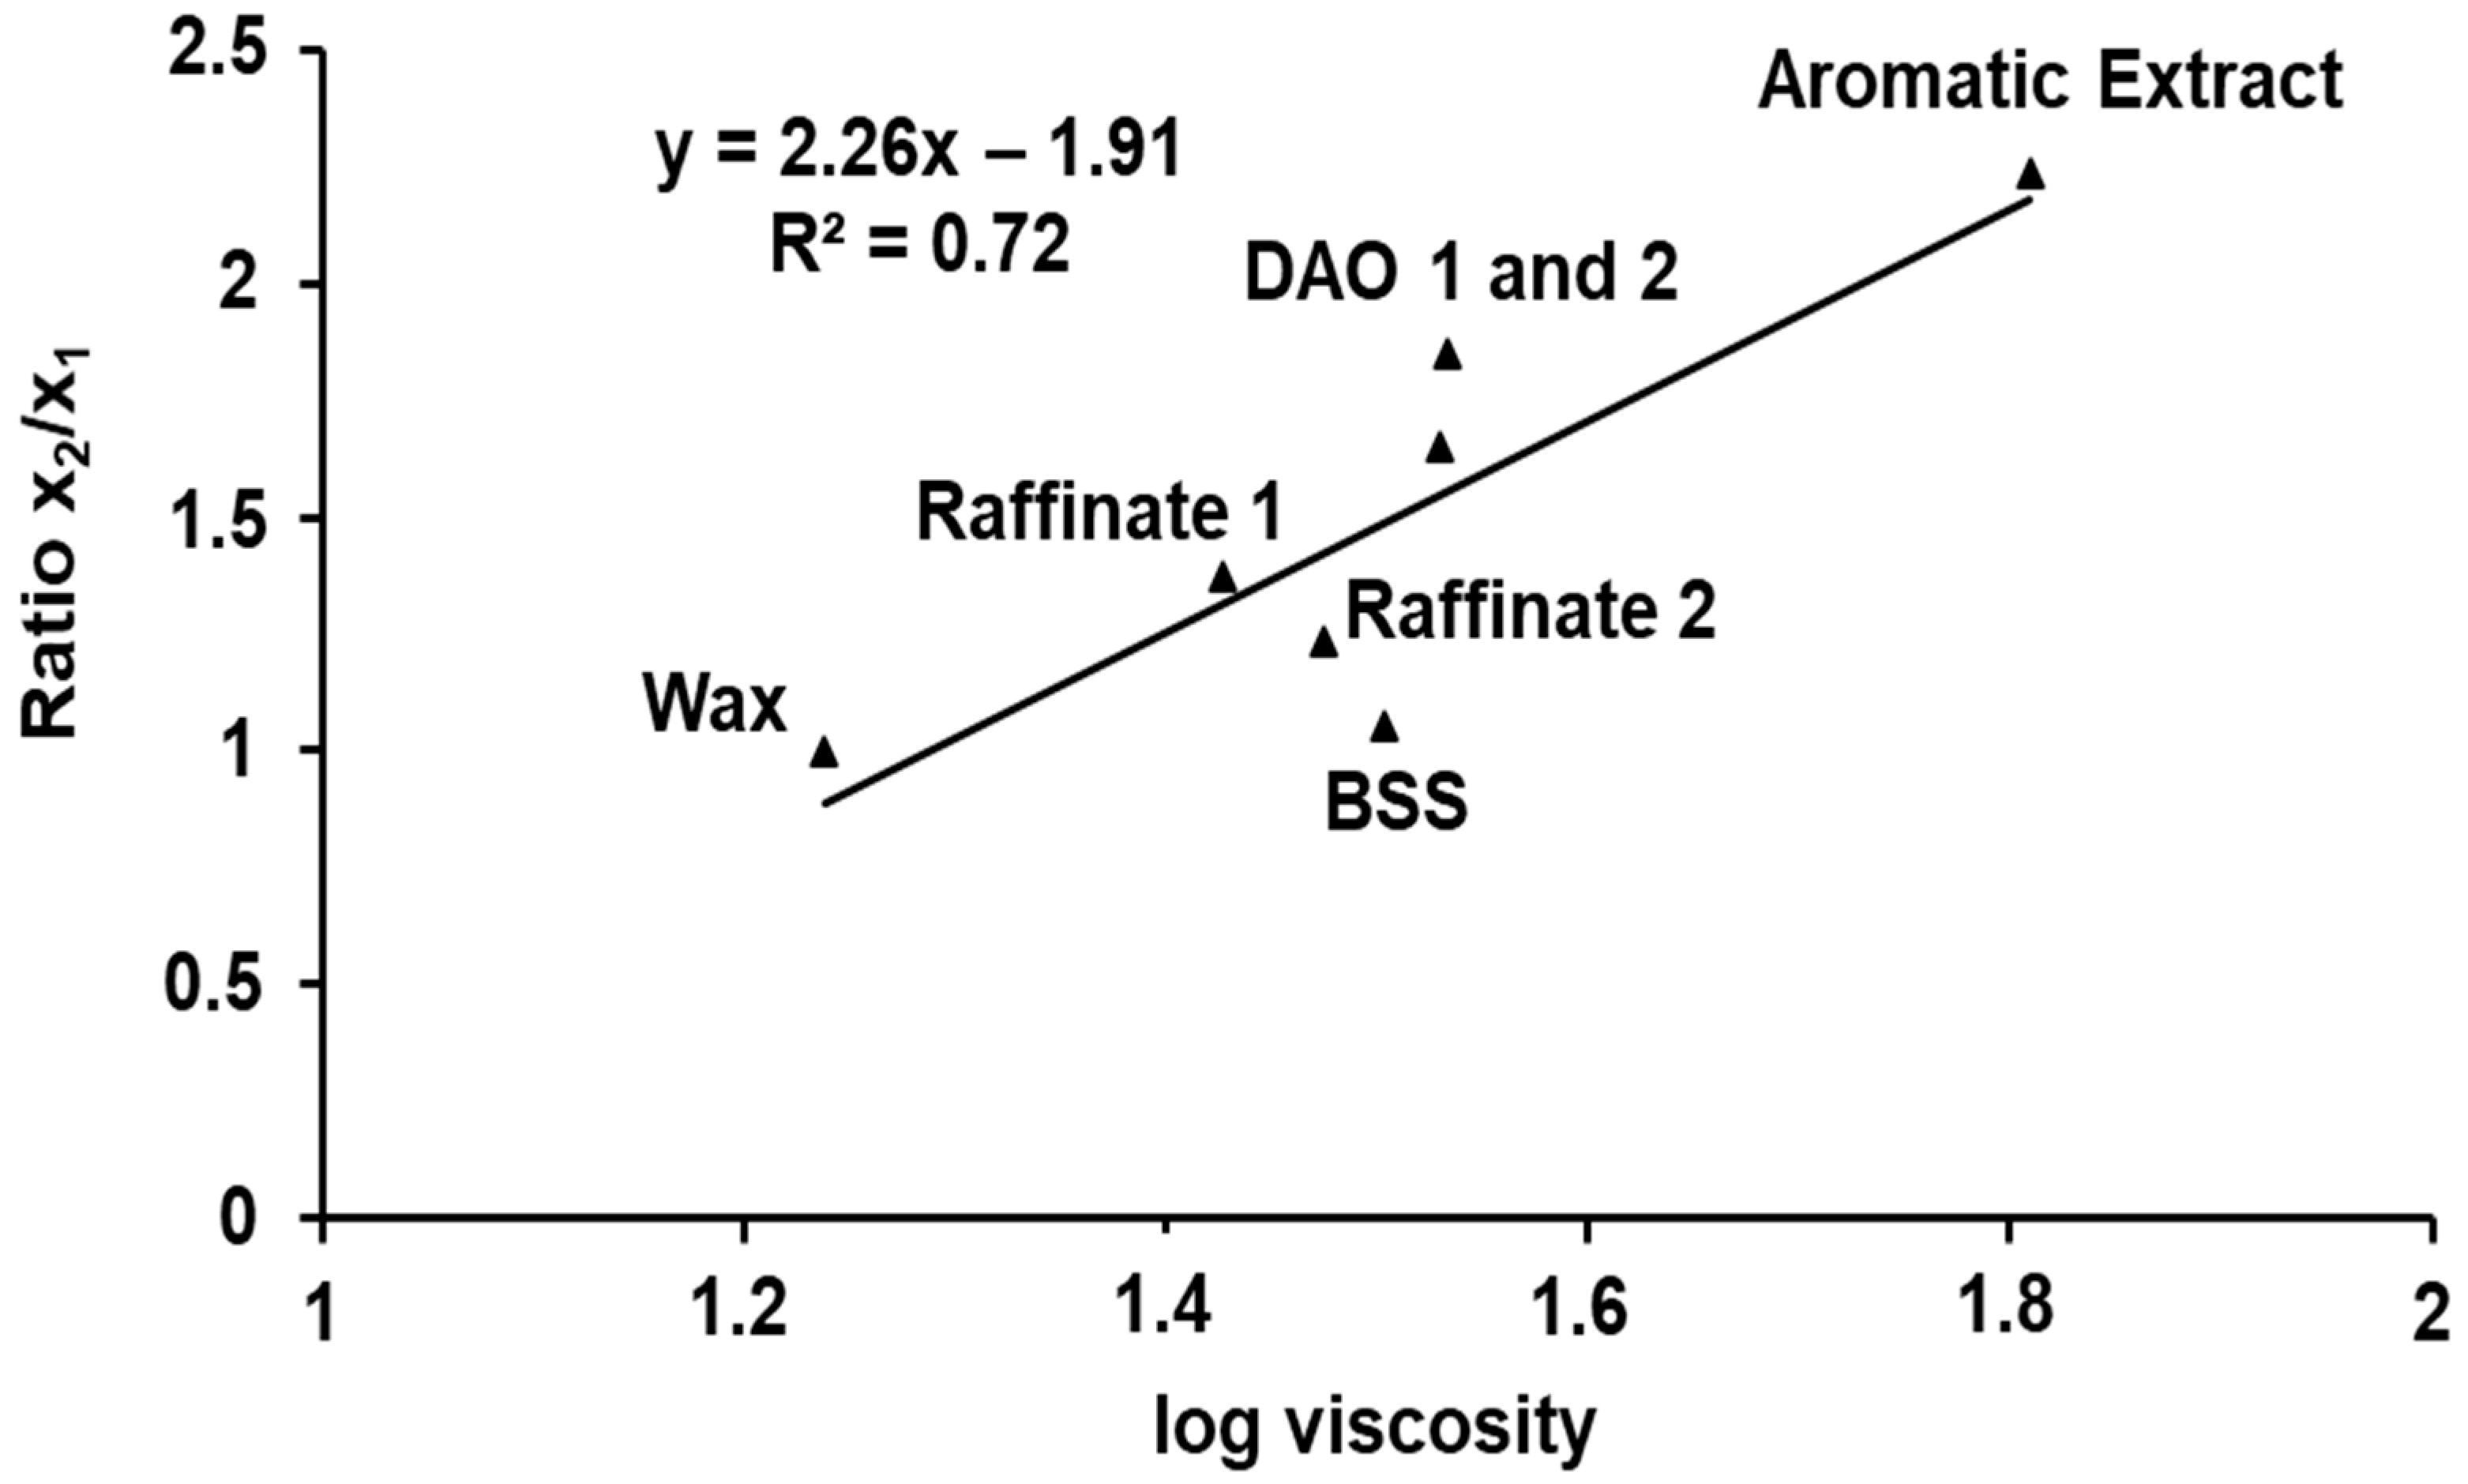
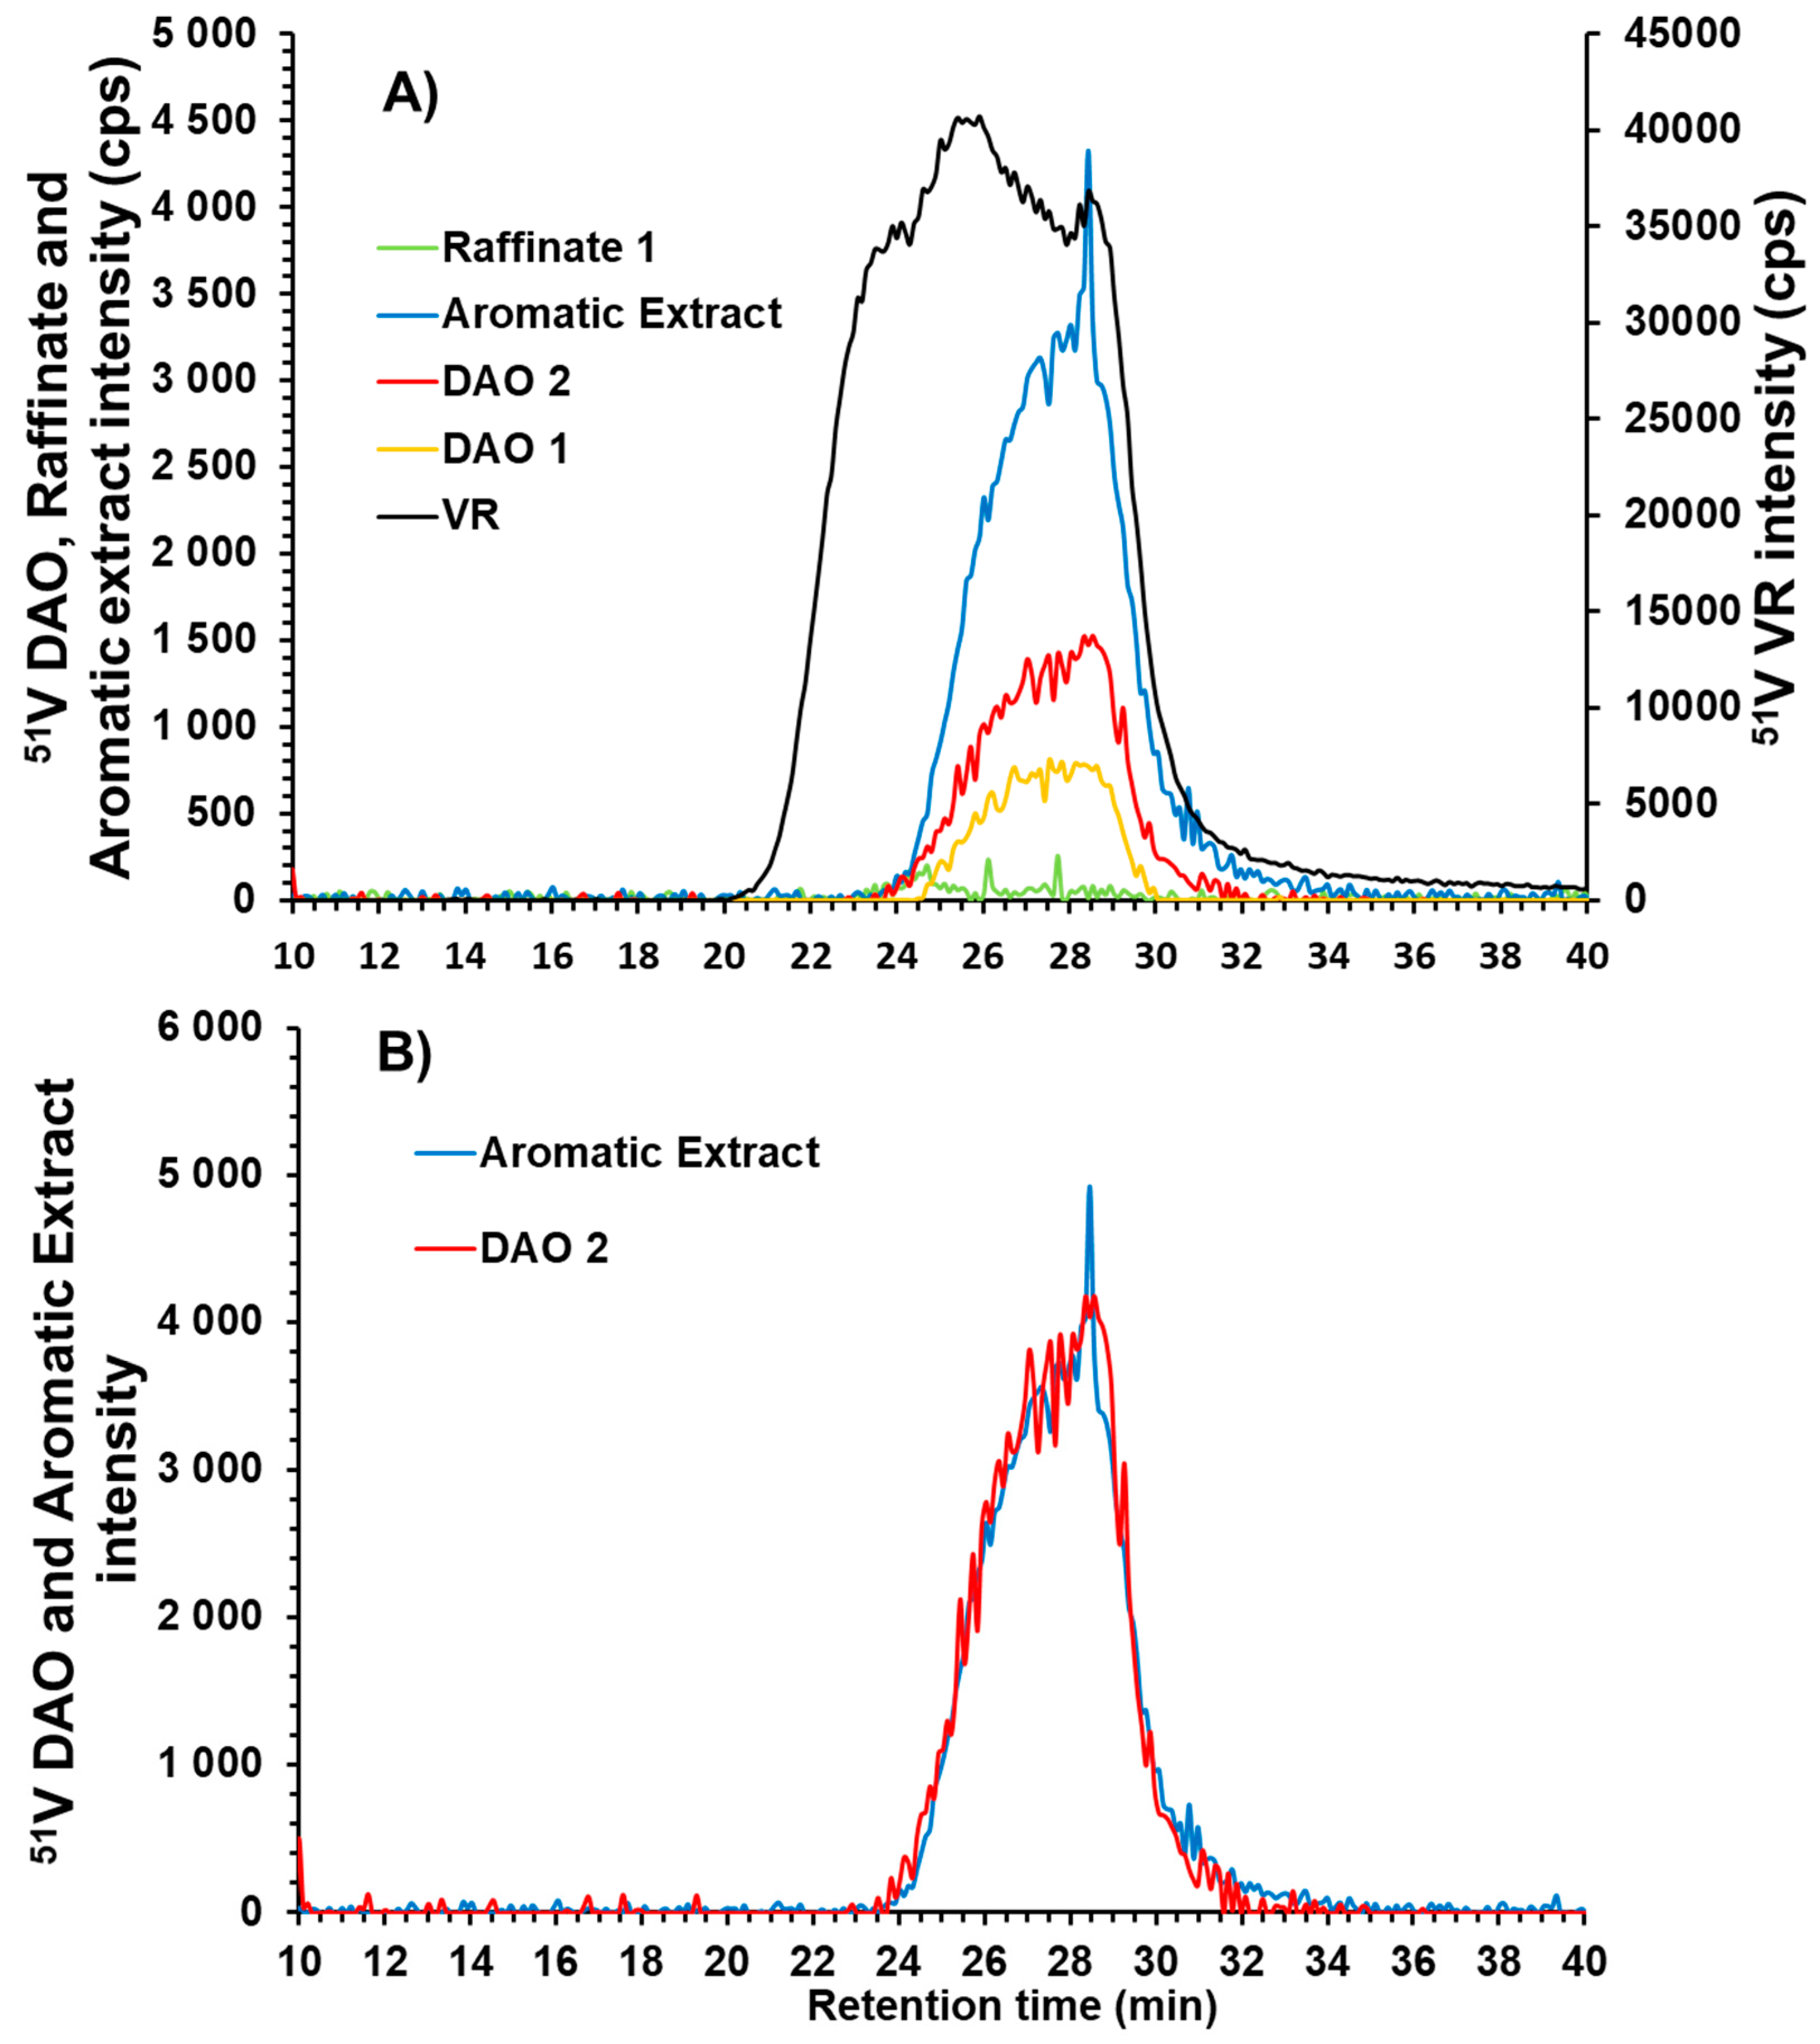
| Sample Name | Area for 32S | Retention Time at Intensity Max (min) | x1 at 10% Intensity Max (min) | x2 at 10% Intensity Max (min) | Ratio x2/x1 |
|---|---|---|---|---|---|
| VR | 4114574 | 25.82 | 22.49 | 30.57 | 1.42 |
| DAO 1 | 2302789 | 26.33 | 24.31 | 29.66 | 1.65 |
| DAO 2 | 3094691 | 26.33 | 24.31 | 30.06 | 1.85 |
| Raffinate 2 | 1477765 | 25.62 | 24.01 | 27.84 | 1.37 |
| Aromatic Extract | 5092305 | 26.63 | 24.92 | 30.46 | 2.24 |
| Raffinate 3 | 1263077 | 25.72 | 24.01 | 27.84 | 1.24 |
| BSS | 1534473 | 25.92 | 24.11 | 27.84 | 1.06 |
| Wax | 550407 | 25.22 | 23.60 | 26.83 | 1.00 |
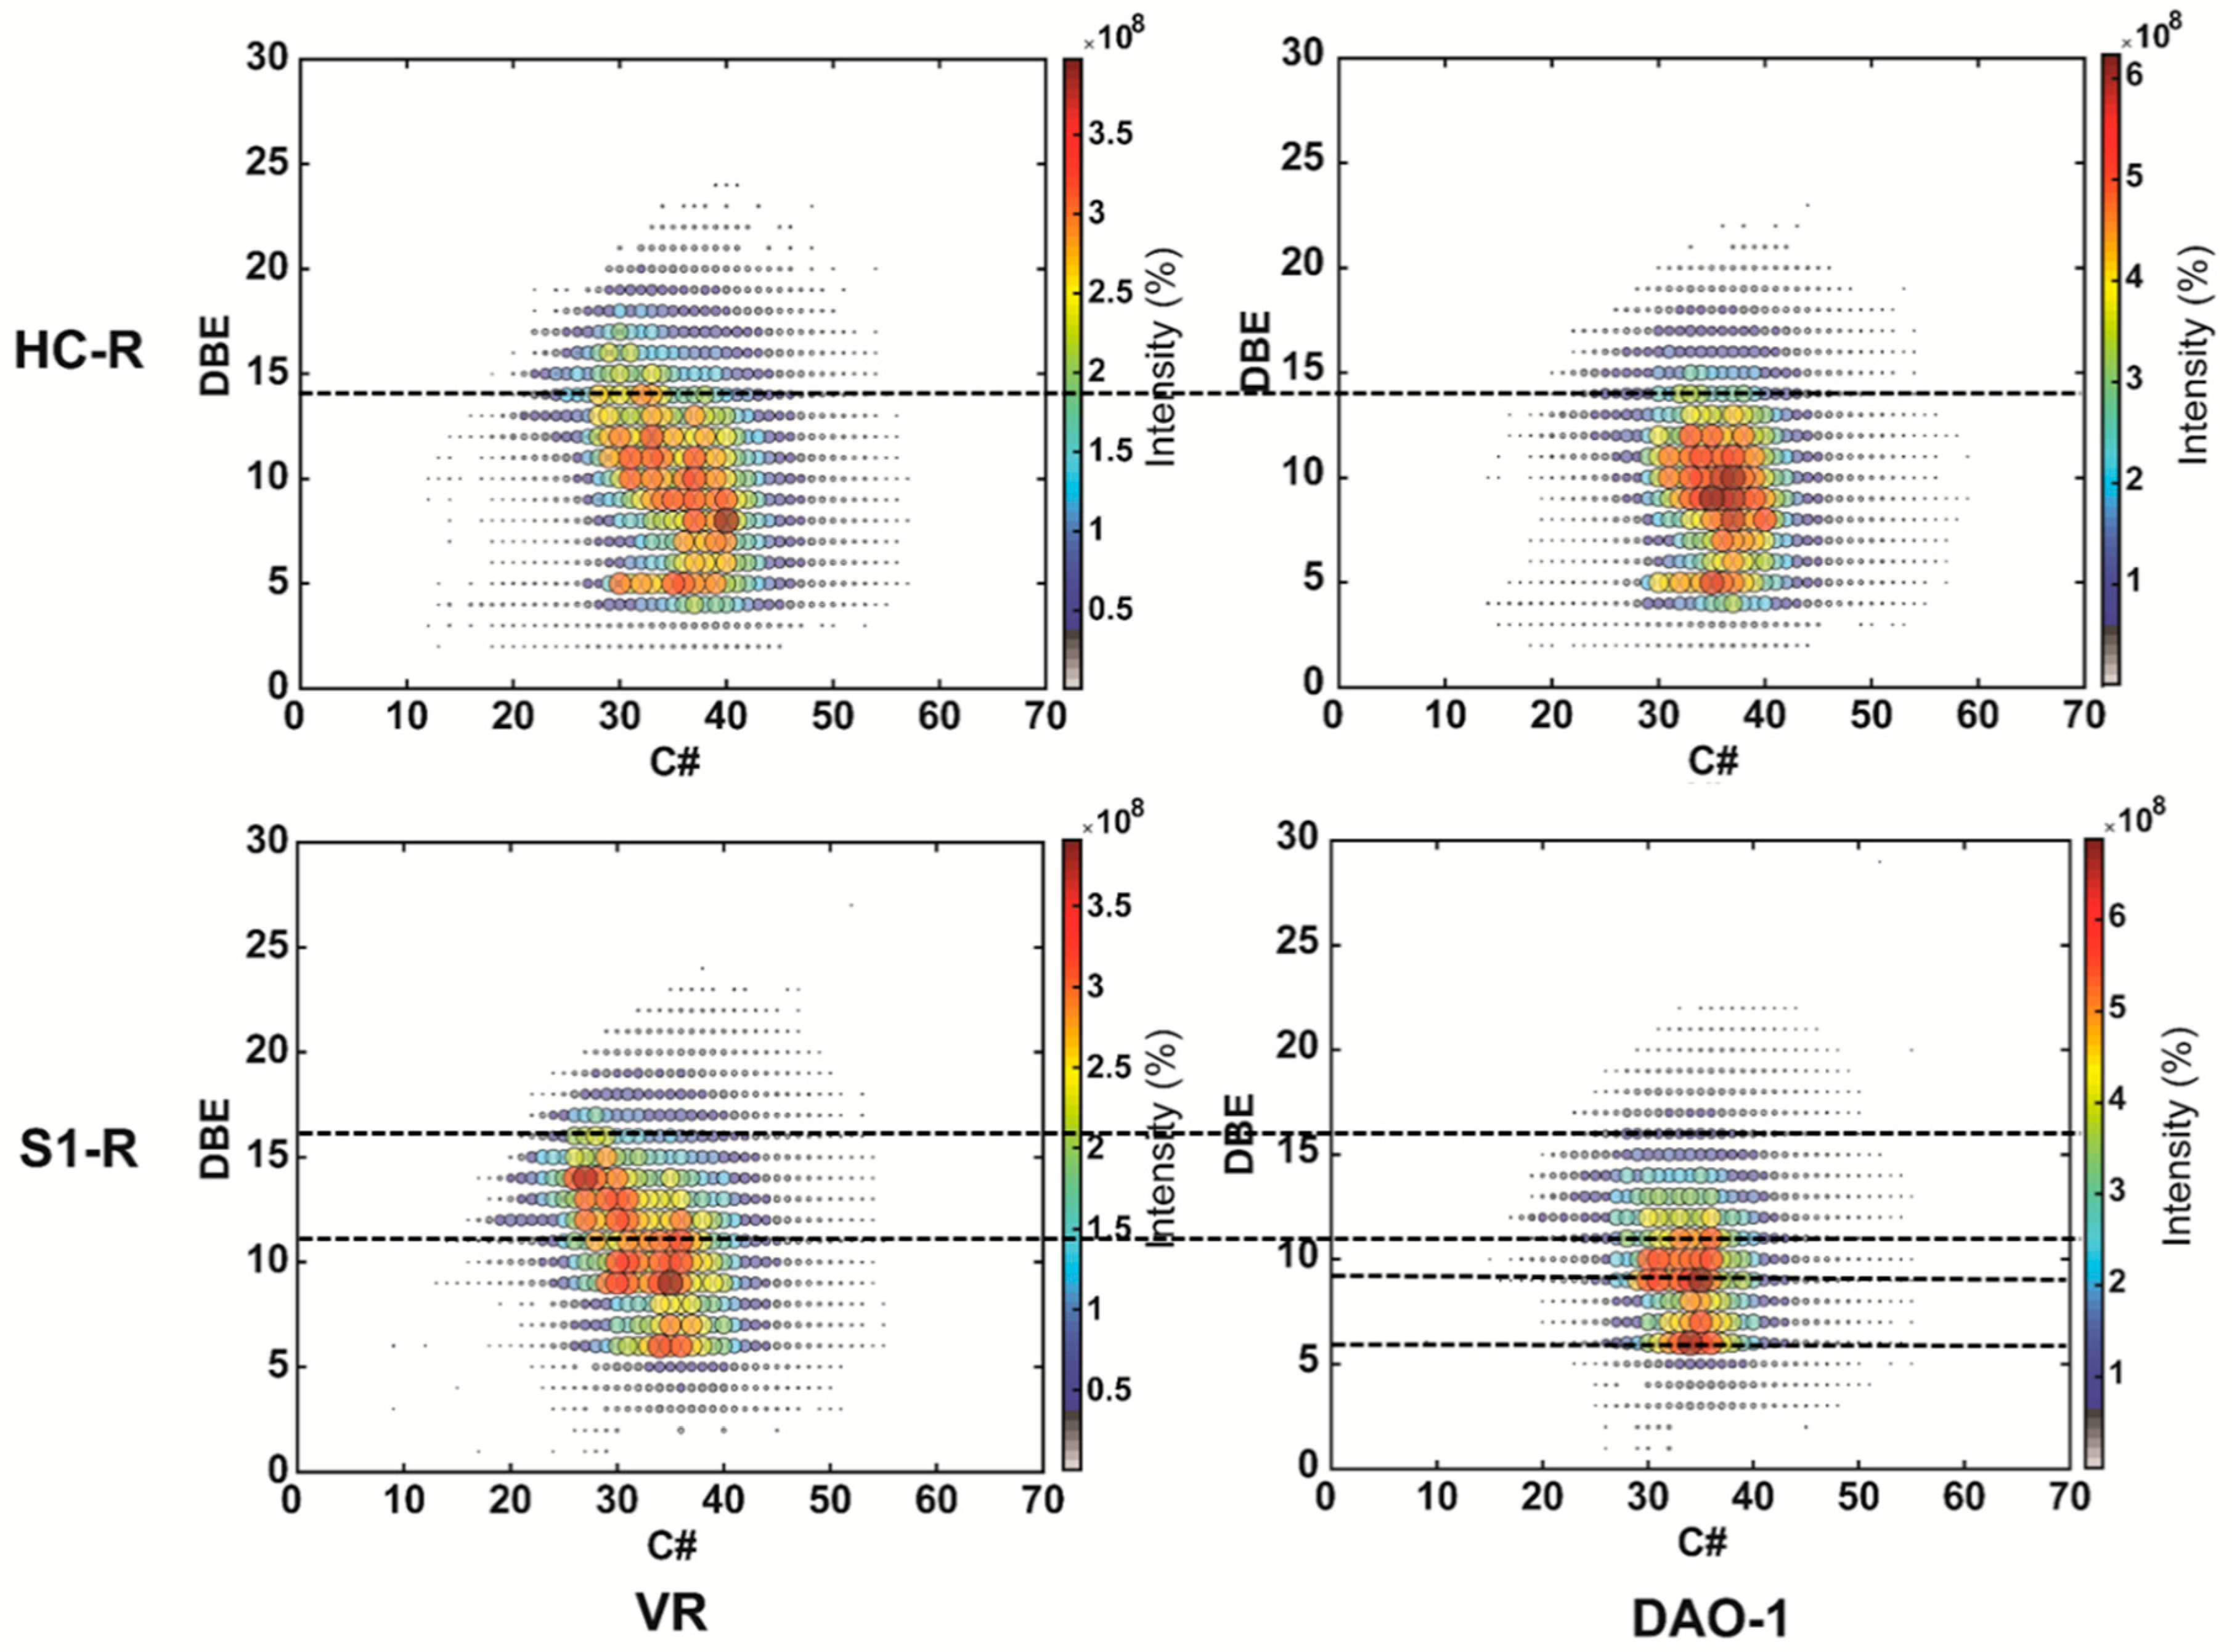
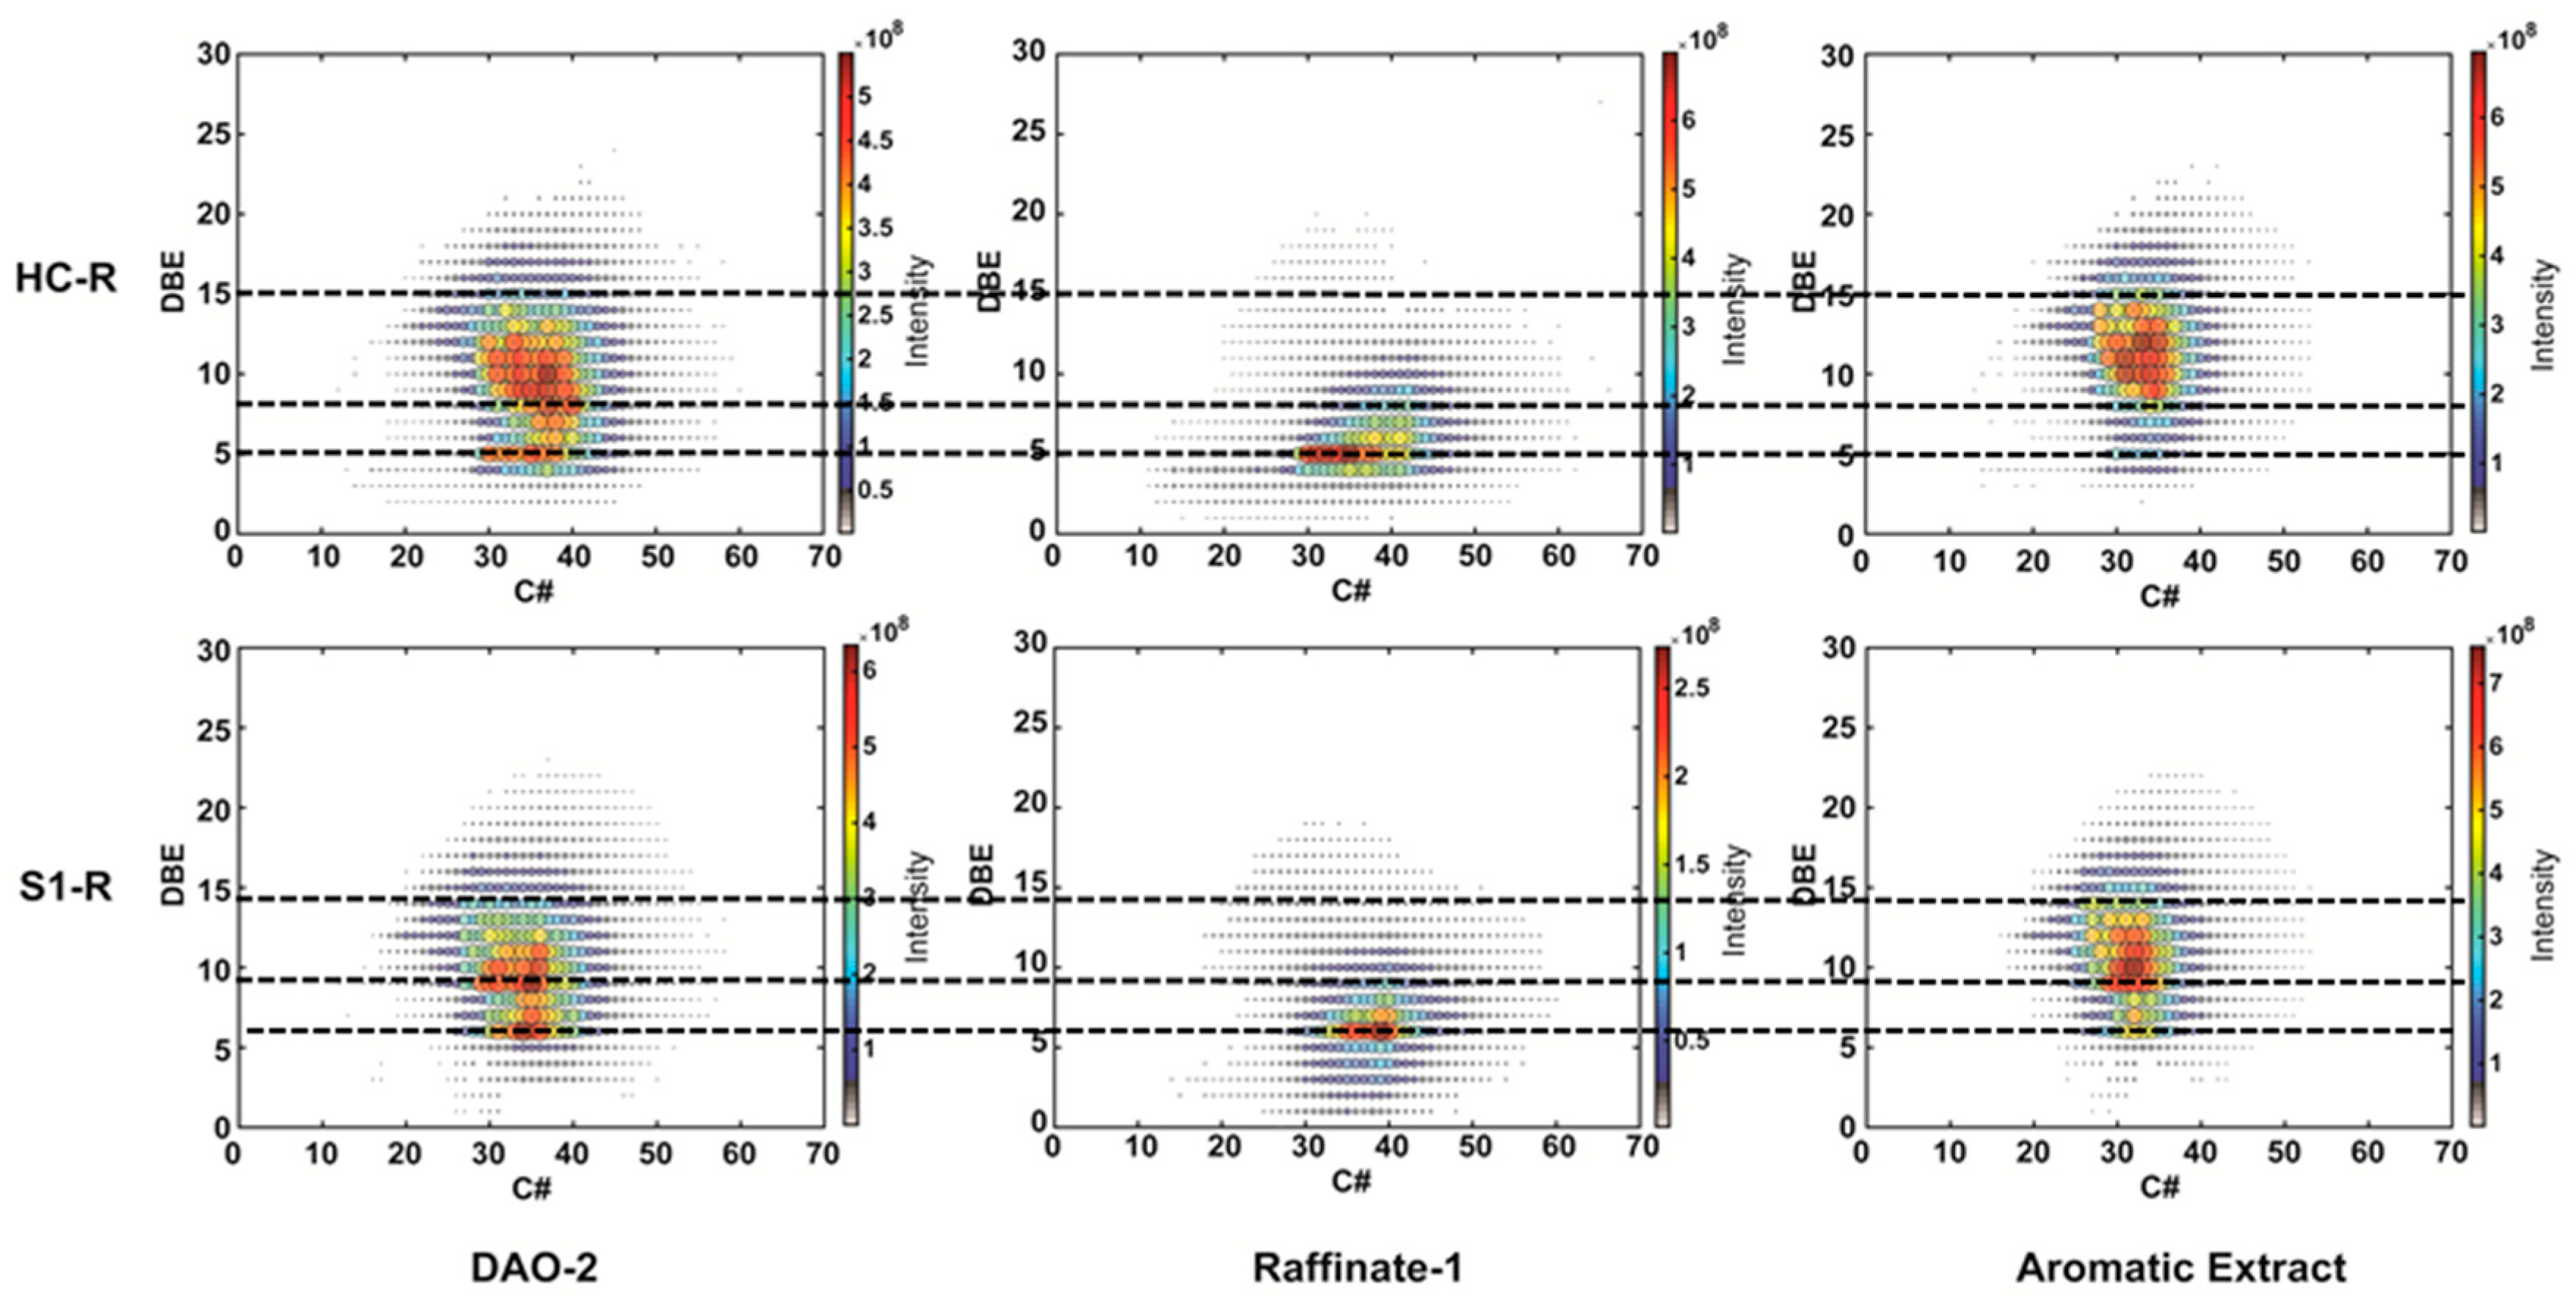
| CH | S1 | ||||||||||||
|---|---|---|---|---|---|---|---|---|---|---|---|---|---|
| nC min | nC max | nC Size Map | DBE min | DBE max | DBE Size Map | C min | C max | nC Size Map | DBE min | DBE max | DBE Size Map | ||
| SDA | VR | 29 | 41 | 12 | 4 | 14 | 10 | 26 | 39 | 13 | 6 | 16 | 10 |
| DAO 1 | 29 | 39 | 10 | 4 | 14 | 10 | 28 | 39 | 11 | 6 | 13 | 7 | |
| FF | DAO 2 | 29 | 39 | 10 | 5 | 14 | 9 | 28 | 39 | 11 | 6 | 14 | 8 |
| Raffinate 1 | 30 | 43 | 13 | 4 | 8 | 4 | 30 | 43 | 13 | 6 | 9 | 3 | |
| Aromatic Extract | 28 | 39 | 11 | 9 | 15 | 6 | 26 | 38 | 12 | 6 | 14 | 8 | |
| Dewaxing | Raffinate 2 | 40 | 60 | 20 | 3 | 8 | 5 | 40 | 58 | 18 | 0 | 9 | 9 |
| BSS | 38 | 58 | 20 | 4 | 8 | 4 | 38 | 60 | 22 | 0 | 9 | 9 | |
| Wax | 40 | 60 | 20 | 0 | 6 | 6 | 40 | 56 | 16 | 0 | 5 | 5 | |
Publisher’s Note: MDPI stays neutral with regard to jurisdictional claims in published maps and institutional affiliations. |
© 2020 by the authors. Licensee MDPI, Basel, Switzerland. This article is an open access article distributed under the terms and conditions of the Creative Commons Attribution (CC BY) license (http://creativecommons.org/licenses/by/4.0/).
Share and Cite
Moulian, R.; Le Maître, J.; Leroy, H.; Rodgers, R.; Bouyssiere, B.; Afonso, C.; Giusti, P.; Barrère-Mangote, C. Chemical Characterization Using Different Analytical Techniques to Understand Processes: The Case of the Paraffinic Base Oil Production Line. Processes 2020, 8, 1472. https://doi.org/10.3390/pr8111472
Moulian R, Le Maître J, Leroy H, Rodgers R, Bouyssiere B, Afonso C, Giusti P, Barrère-Mangote C. Chemical Characterization Using Different Analytical Techniques to Understand Processes: The Case of the Paraffinic Base Oil Production Line. Processes. 2020; 8(11):1472. https://doi.org/10.3390/pr8111472
Chicago/Turabian StyleMoulian, Rémi, Johann Le Maître, Hélène Leroy, Ryan Rodgers, Brice Bouyssiere, Carlos Afonso, Pierre Giusti, and Caroline Barrère-Mangote. 2020. "Chemical Characterization Using Different Analytical Techniques to Understand Processes: The Case of the Paraffinic Base Oil Production Line" Processes 8, no. 11: 1472. https://doi.org/10.3390/pr8111472