Article

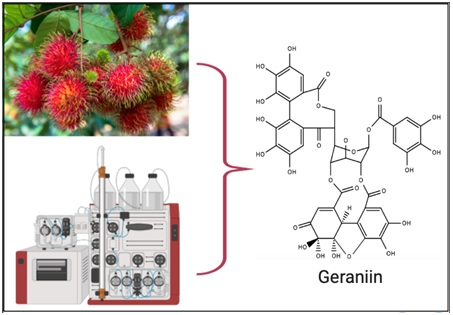
Preliminary Testing of Ultrasound/Microwave-Assisted Extraction (U/M-AE) for the Isolation of Geraniin from Nephelium lappaceum L. (Mexican Variety) Peel

by
Cristian Hernández-Hernández
1,
Cristóbal Noé Aguilar
1,
Adriana Carolina Flores-Gallegos
1,
Leonardo Sepúlveda
1,
Raúl Rodríguez-Herrera
1,
Jesús Morlett-Chávez
2,
Mayela Govea-Salas
3 and
Juan Ascacio-Valdés
1,*
1
Bioprocesses and Bioproducts Research Group, Food Research Department, School of Chemistry, Autonomous University of Coahuila, Saltillo 25280, Mexico
2
Laboratory of Molecular Biology, School of Chemistry, Autonomous University of Coahuila, Saltillo 25280, Mexico
3
Laboratory of Nanobiosciences, School of Chemistry, Autonomous University of Coahuila, Saltillo 25280, Mexico
*
Author to whom correspondence should be addressed.
Processes 2020, 8(5), 572; https://doi.org/10.3390/pr8050572
Submission received: 20 March 2020 / Revised: 29 April 2020 / Accepted: 3 May 2020 / Published: 12 May 2020

Abstract

:
The rambutan peel (RP) is a relevant source of bioactive molecules, which could be used for application in cosmetics, food, and pharmaceutical areas. Total soluble polyphenol content was extracted from Mexican variety rambutan peels using an emergent ultrasound/microwave-assisted extraction (U/M-AE) technology. Five extractions were performed using different mass/volume and ethanol/water ratios; 1:16-0; 1:16-70; 1:8-0; 1:8-70; 1:12-30. Condition 1:16-0 was defined as the best extraction condition with 0% ethanol percentage (only water). The content of total soluble polyphenols was 307.57 mg/g. The total bound polyphenol content was 26.53 mg/g. Besides, two separation processes were made with the soluble fraction; the first one was performed using Amberlite XAD-16 (Sigma-Aldrich, Saint Louis, MO, USA), and seven polyphenolic compounds were obtained. The second one was performed using a preparative HPLC (Varian, Palo Alto, CA, USA) equipment obtained fraction where three compounds were obtained: geraniin (main compound), ellagic acid, and ellagic acid pentoside. The major compound isolated in the two separations was geraniin, according to HPLC/ESI/MS (High Performance Liquid Chromatography/ElectroSpray Ionization/Mass) analysis.

Graphical Abstract

1. Introduction

The rambutan (Nephelium lappaceum L.) is an exotic fruit that is grown in Southeast Asia (Malaysia, Thailand, Indonesia). Currently, its cultivation is spread in several countries in the humid tropics of America, such as Colombia, Ecuador, Honduras, Costa Rica, Trinidad and Tobago, Cuba, and, mainly, Mexico. (In Mexico, the rambutan was introduced in the 1950s.) The rambutan is consumed fresh, and the peel is discarded, generating waste [1]. In recent research, it has been reported that rambutan peel (RP) contains bioactive molecules such as polyphenols (mainly ellagitannins) that have great potential as an ingredient in functional foods due to their biological properties, such as immune-modulatory, cytoprotective, anticancer, antimicrobial and antioxidant (Figure 1). As well as their therapeutic effects, besides our understanding of their biosynthesis and their interest in the body system, polyphenols also have analgesic properties and prevent cardiovascular diseases [2].
Currently, there are several techniques for bioactive compound extraction implementing new extraction technologies, such as microwave-assisted extraction (MAE) and ultrasound-assisted extraction (UAE), among others. These are considered “green” techniques as they reduce the use of organic solvents and obtain higher yields from the extracts, as well as taking care of the environment [3]. The ultrasound can be associated with microwaves, a combination that can act as an emergent hybrid technology: ultrasound/microwave-assisted extraction (U/M-AE) [4]. U/M-AE, compared to conventional methods, has more advantages by reducing extraction time, giving higher yields, and consuming fewer solvents. This technology, supported by HPLC/MS (High Performance Liquid Chromatography/Mass) analysis, has advantages for the identification of bioactive molecules because the use of this extraction technology allows a better interaction between the solvent and the compounds of interest due to the cavitation phenomenon produced by ultrasound. This interaction is also favored by the temperature of the microwave treatment and temperature is an essential factor in promoting the extraction and solubility of the compounds. It is important to mention that this occurs at the same time using U/M-AE, and that all this represents an important advantage for the use of HPLC/MS in the identification of the obtained compounds, since fractions of specific compounds of interest are obtained. [5]. Actually, HPLC is a chromatographic technique used in phytochemistry to identify, quantify, and purify components. The resolution power of HPLC is ideal for the characterization and quantification of secondary metabolites in plant extracts: mainly phenolic compounds, steroids, flavonoids, alkaloids. The combination of HPLC and MS facilitates the identification of chemical compounds in medicinal plants. The HPLC/MS technique has advantages when it provides the molecular structure of the MS and has become a powerful technique for the identification of bioactive compounds due to its operational simplicity [4,5]. Therefore, in this study, the extraction of polyphenols from Mexican variety rambutan peel was performed using U/M-AE technology and testing some selected parameters to obtain the best extraction conditions. Soluble and bound polyphenols were determined, as well as the separation and identification of the main bioactive molecules (geraniin), by liquid chromatography and mass spectrometry (HPLC/ESI/MS).

2. Materials and Methods

2.1. Raw Material

The rambutan peels (RP) were obtained in the Soconusco region of Chiapas state in Mexico. The peel was washed with distilled water and dehydrated in a conventional oven at 50 °C for 48 h (5% moisture after dehydration). Subsequently, the RP was milled using a Thomas-Wiley mill of knives, model 4 Arthur H (particle size 2 mm), Thomas Company (Philadelphia, PA, USA). It was then stored at room temperature in a glass container in the dark for subsequent analysis.

2.2. Experimental Design

The experimental design for the extraction of bioactive molecules from the rambutan peel was carried out by applying a factorial fractioned design with two evaluated factors, the mass/volume ratio (m/v) and the ratio of ethanol/water (e/w), to determine the best extraction condition. All rambutan peel extractions were carried out on the same extraction equipment. The conditions used in the extraction equipment were 20 min at room temperature for ultrasound, 5 min at 70 °C for microwave. The five evaluated extraction conditions are shown in Table 1. Subsequently, the extracts were analyzed to determine the total content of soluble and bound polyphenols.

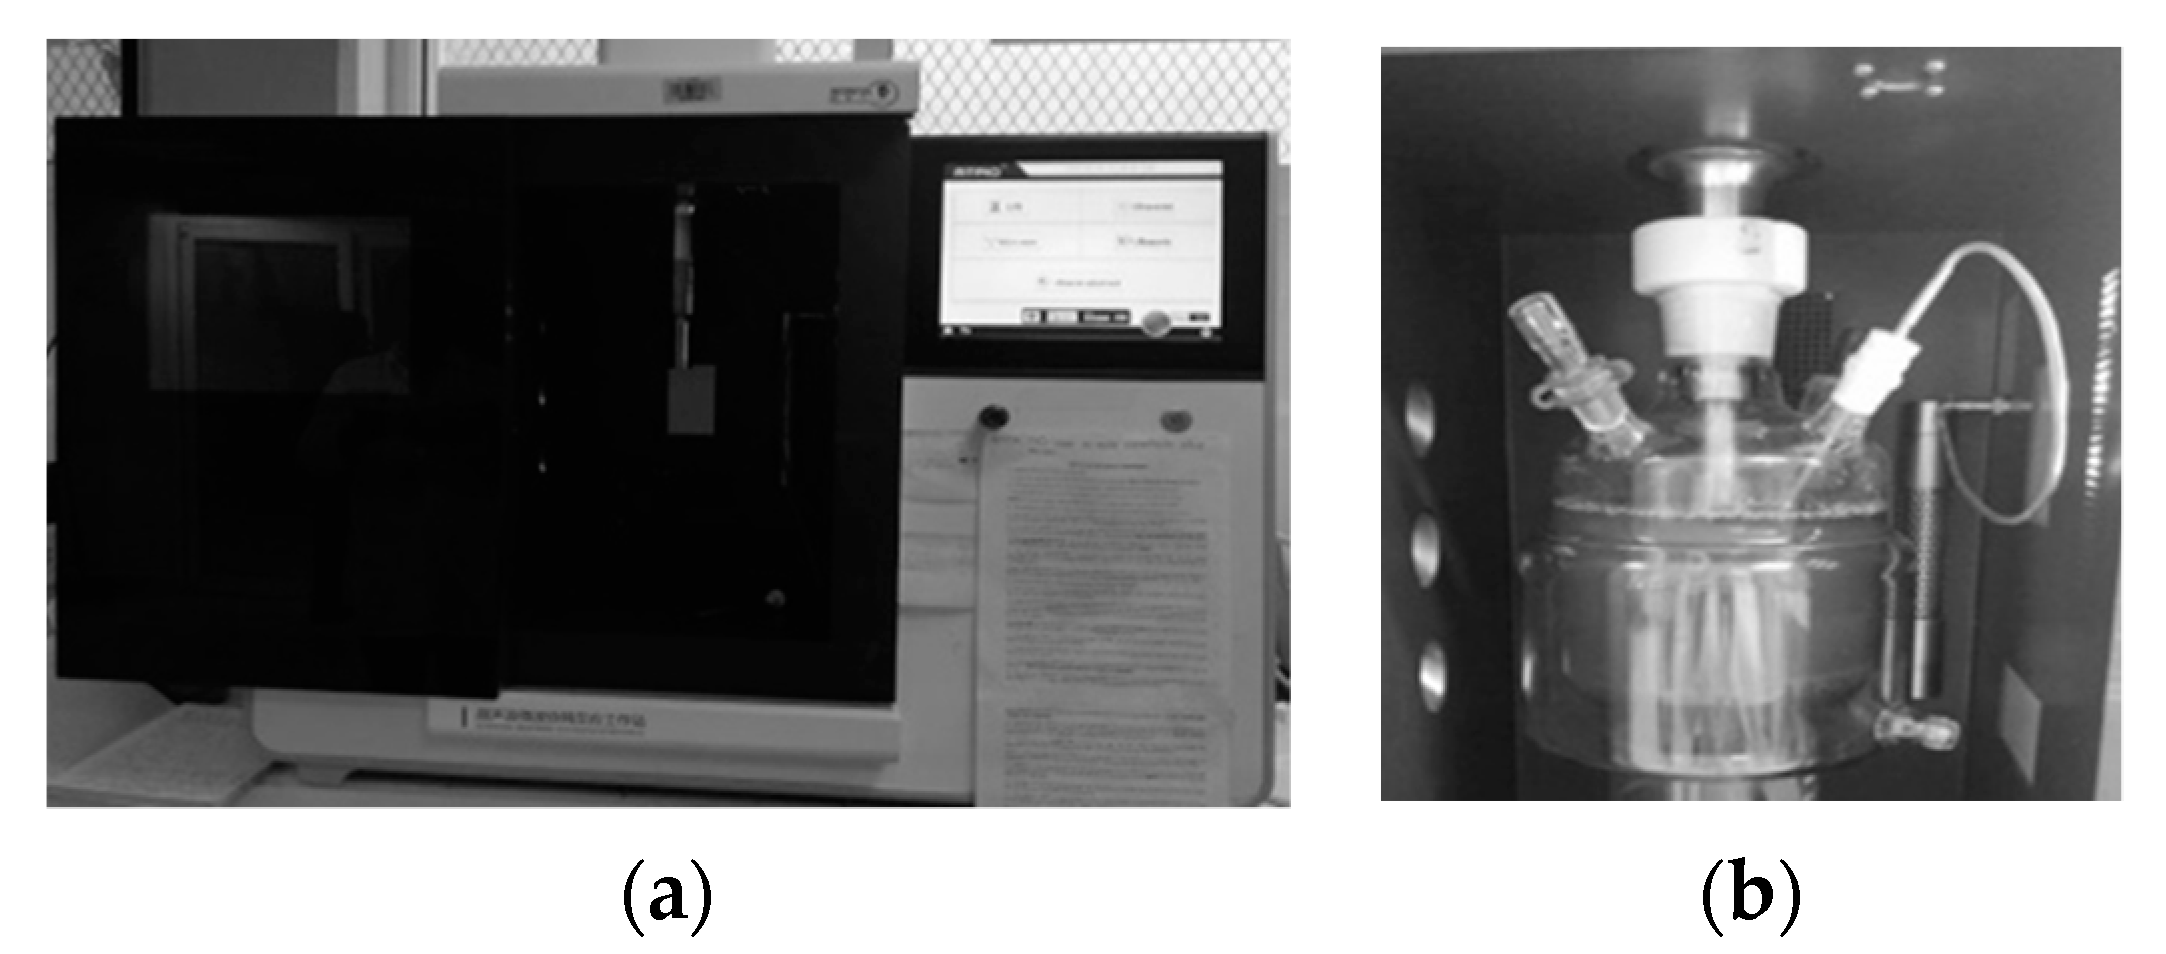
2.3. Ultrasound/Microwave-Assisted Extraction (U/M-AE) of Soluble Polyphenols

For the extraction of soluble polyphenol compounds from RP, a hybrid technology system was used: An Ultrasound/Microwave Cooperative Workstation (Nanjing ATPIO Instruments Manufacture Co., Ltd. company, Nanjing, China) operating at a microwave frequency of 2450 MHz and 25 kHz ultrasound (Figure 2). The ground rambutan peel with a particle size of 2 mm was placed in a reactor of the extraction equipment. Subsequently, a volume of 700 mL was added with the five extraction conditions, as shown in Table 1. The extracts obtained were stored for subsequent analysis of the total polyphenol content.

2.4. Separation of Bound Polyphenol Fractions

The bound polyphenol fractions were obtained from the solid residue after the extraction of soluble polyphenols using the five conditions shown in Table 1, usingthe methods reported by Zhang et al. [6] with slight modifications. For the extraction of the bound phenols, 1 g of the RP residue was used and digested with 50 mL of 2 M sodium hydroxide at room temperature for 4 h. The mixture was acidified with concentrated hydrochloric acid at pH 2.0. The mixture was filtered with Whatman No. 41 (Sigma-Aldrich, Saint Louis, MO, USA) filter paper, and the lipids were removed with 30 mL of hexaneusing a separation funnel. The remaining mixture was extracted three times with 75 mL ethyl acetate by liquid–liquid separation. The ethyl acetate fractions were collected and evaporated to dryness by a rotatory evaporator. The bound phenolic compounds were dissolved in 5 mL using the m/v and e/w ratios performed for soluble polyphenols. The fractions obtained were used as bound phenols in RP.

2.5. Determination of Total Polyphenol Content

The content of hydrolyzable and condensed polyphenols in RP extracts were determined by the Folin–Ciocalteu method [7] and HCl-Butanol described by Nitao et al. [8] for soluble and bound polyphenol samples. The experiment was carried out in triplicate. Gallic acid and catechin were used as reference standards. Total soluble and bound polyphenol content was obtained by summing hydrolyzable and condensed polyphenols. The analysis of soluble and bound polyphenols was carried out in a dark place in the absence of light. For the total soluble polyphenol content, a Tukey test was performed to determine significant differences (p ≤ 0.05). The response variable was the content of total soluble polyphenolic compounds. Additionally, a contour diagram and analysis of the Pareto chart was performed under an exploratory (Box Hunter, and Hunter) design with Statistica program (StartSoft, version 7.0, Dell, Austin, TX, USA).

2.6. Separation and Partial Purification of Soluble Polyphenol Fractions Using Amberlite XAD-16

The separation of phenolic fractions from RP with Amberlite XAD-16 was prepared using the methodology described by Ascacio-Valdés et al. [9]. The phenolic extracts obtained by U/M-AE were filtered through Whatman No.41 filter paper. Afterward, Amberlite XAD-16 resin was used for subsequent packaging in a chromatography column. The phenolic extracts were passed through the chromatography column with Amberlite XAD-16. Distilled water was used as an eluent for discarding undesirable compounds such as carbohydrates, lipids, and other impurities. Later, ethanol was used as eluent to recover the molecules of interest retained in the Amberlite XAD-16 resin and to recover the phenolic fraction. The phenolic fraction was evaporated in an oven at 50 °C and recovered as a fine powder; an 8% yield was obtained, a high yield compared to materials reported as the best sources of ellagitannins, such as pomegranate peels (6%) [9].

2.7. Separation and Isolation of Ellagitannins by Preparative HPLC

The soluble polyphenol fractions of RP were separated by high-resolution preparative scale chromatography for the purification of the extracts using the method described by Aguilar-Zárate et al. [10]. Posteriorly, 300 mg of polyphenols were weighed and prepared in a 2 mL solution with 50% ethanol, then gauged to 10 mL of distilled water and filtered with 0.45 µm membranes. The extracts were separated using liquid chromatography equipment, (Varian ProStar 3300, Varian, Palo Alto, CA, USA) and a Dynamax column, Microsorb300 C18 (250 mm × 21.4 mm, 10 µm). A flow rate of 8 mL/min was used and the conditions were as follows: as mobile phase, (A) CH3COOH (3% v/v in water) and (B) methanol. The method used for the separation of the molecules was isocratic: 5% initial B; 0–45 min, 5–90% B; 45–50 min, 90% B; 50–70 min, 90–5% B; 70–95 min. The elution of the compounds (ellagitannins) was monitored at 280 nm. The column was washed with 90% methanol (45–60 min) and reconditioned to the initial conditions (60–80 min). The fractions were recovered and characterized by HPLC/ESI/MS analysis.

2.8. Identification of Polyphenolic Compounds by HPLC/ESI/MS Analysis

The identification and characterization of the polyphenolic compounds of the RP extract were carried out by the method described by Sepulveda et al. [11] with some slight modifications. The ethanolic fraction of RP was filtered using 0.45 µm nylon membranes and placed in a 2 mL vial. The analyses by reversed-phase high-performance liquid chromatography were performed on a Varian HPLC system, including an auto-sampler (ProStar 410, Varian, Palo Alto, CA, USA), a ternary pump (ProStar 230I, Varian, Palo Alto, California, USA) and a PDA detector (ProStar 330, Varian, Atlanta, GA, USA). A chromatography ion trap mass spectrometer (Varian 500-MS IT Mass Spectrometer, Palo Alto, CA, USA) equipped with an electrospray ion source was also used. Samples (5 µL) were injected onto a Denali C18 column (150 mm × 2.1 mm, 3µm, Grace, Albany, OR, USA) and the oven temperature was maintained at 30 °C. The eluents were formic acid (0.2%, v/v; solvent A) and acetonitrile (solvent B). The following gradient was applied: initial, 3% B; 0–5 min, 9% B linear; 5–15 min, 16% B linear; 15–45 min, 50% B linear. Then, the column was washed and reconditioned; the flow rate was maintained at 0.2 mL/min and elution was monitored at 245, 280, 320 and 550 nm. The whole effluent (0.2 mL/min) was injected into the source of the mass spectrometer without splitting. All MS experiments were carried out in the negative mode [M-H]-nitrogen was used as nebulizing gas and helium as damping gas. The ion source parameters were spray voltage 5.0 kV and capillary voltage and temperature were 90.0 V and 350 °C respectively. Data were collected and processed using MS Workstation software (V 6.9). Samples were firstly analyzed in full scan mode acquired in the m/z range 50–2000. MS/MS analyses were performed on a series of selected precursor ions. Finally, the compounds were compared using a database of bioactive compounds (WorkStation version 2.0 database, VARIAN, Palo Alto, CA, USA).

3. Results and Discussion

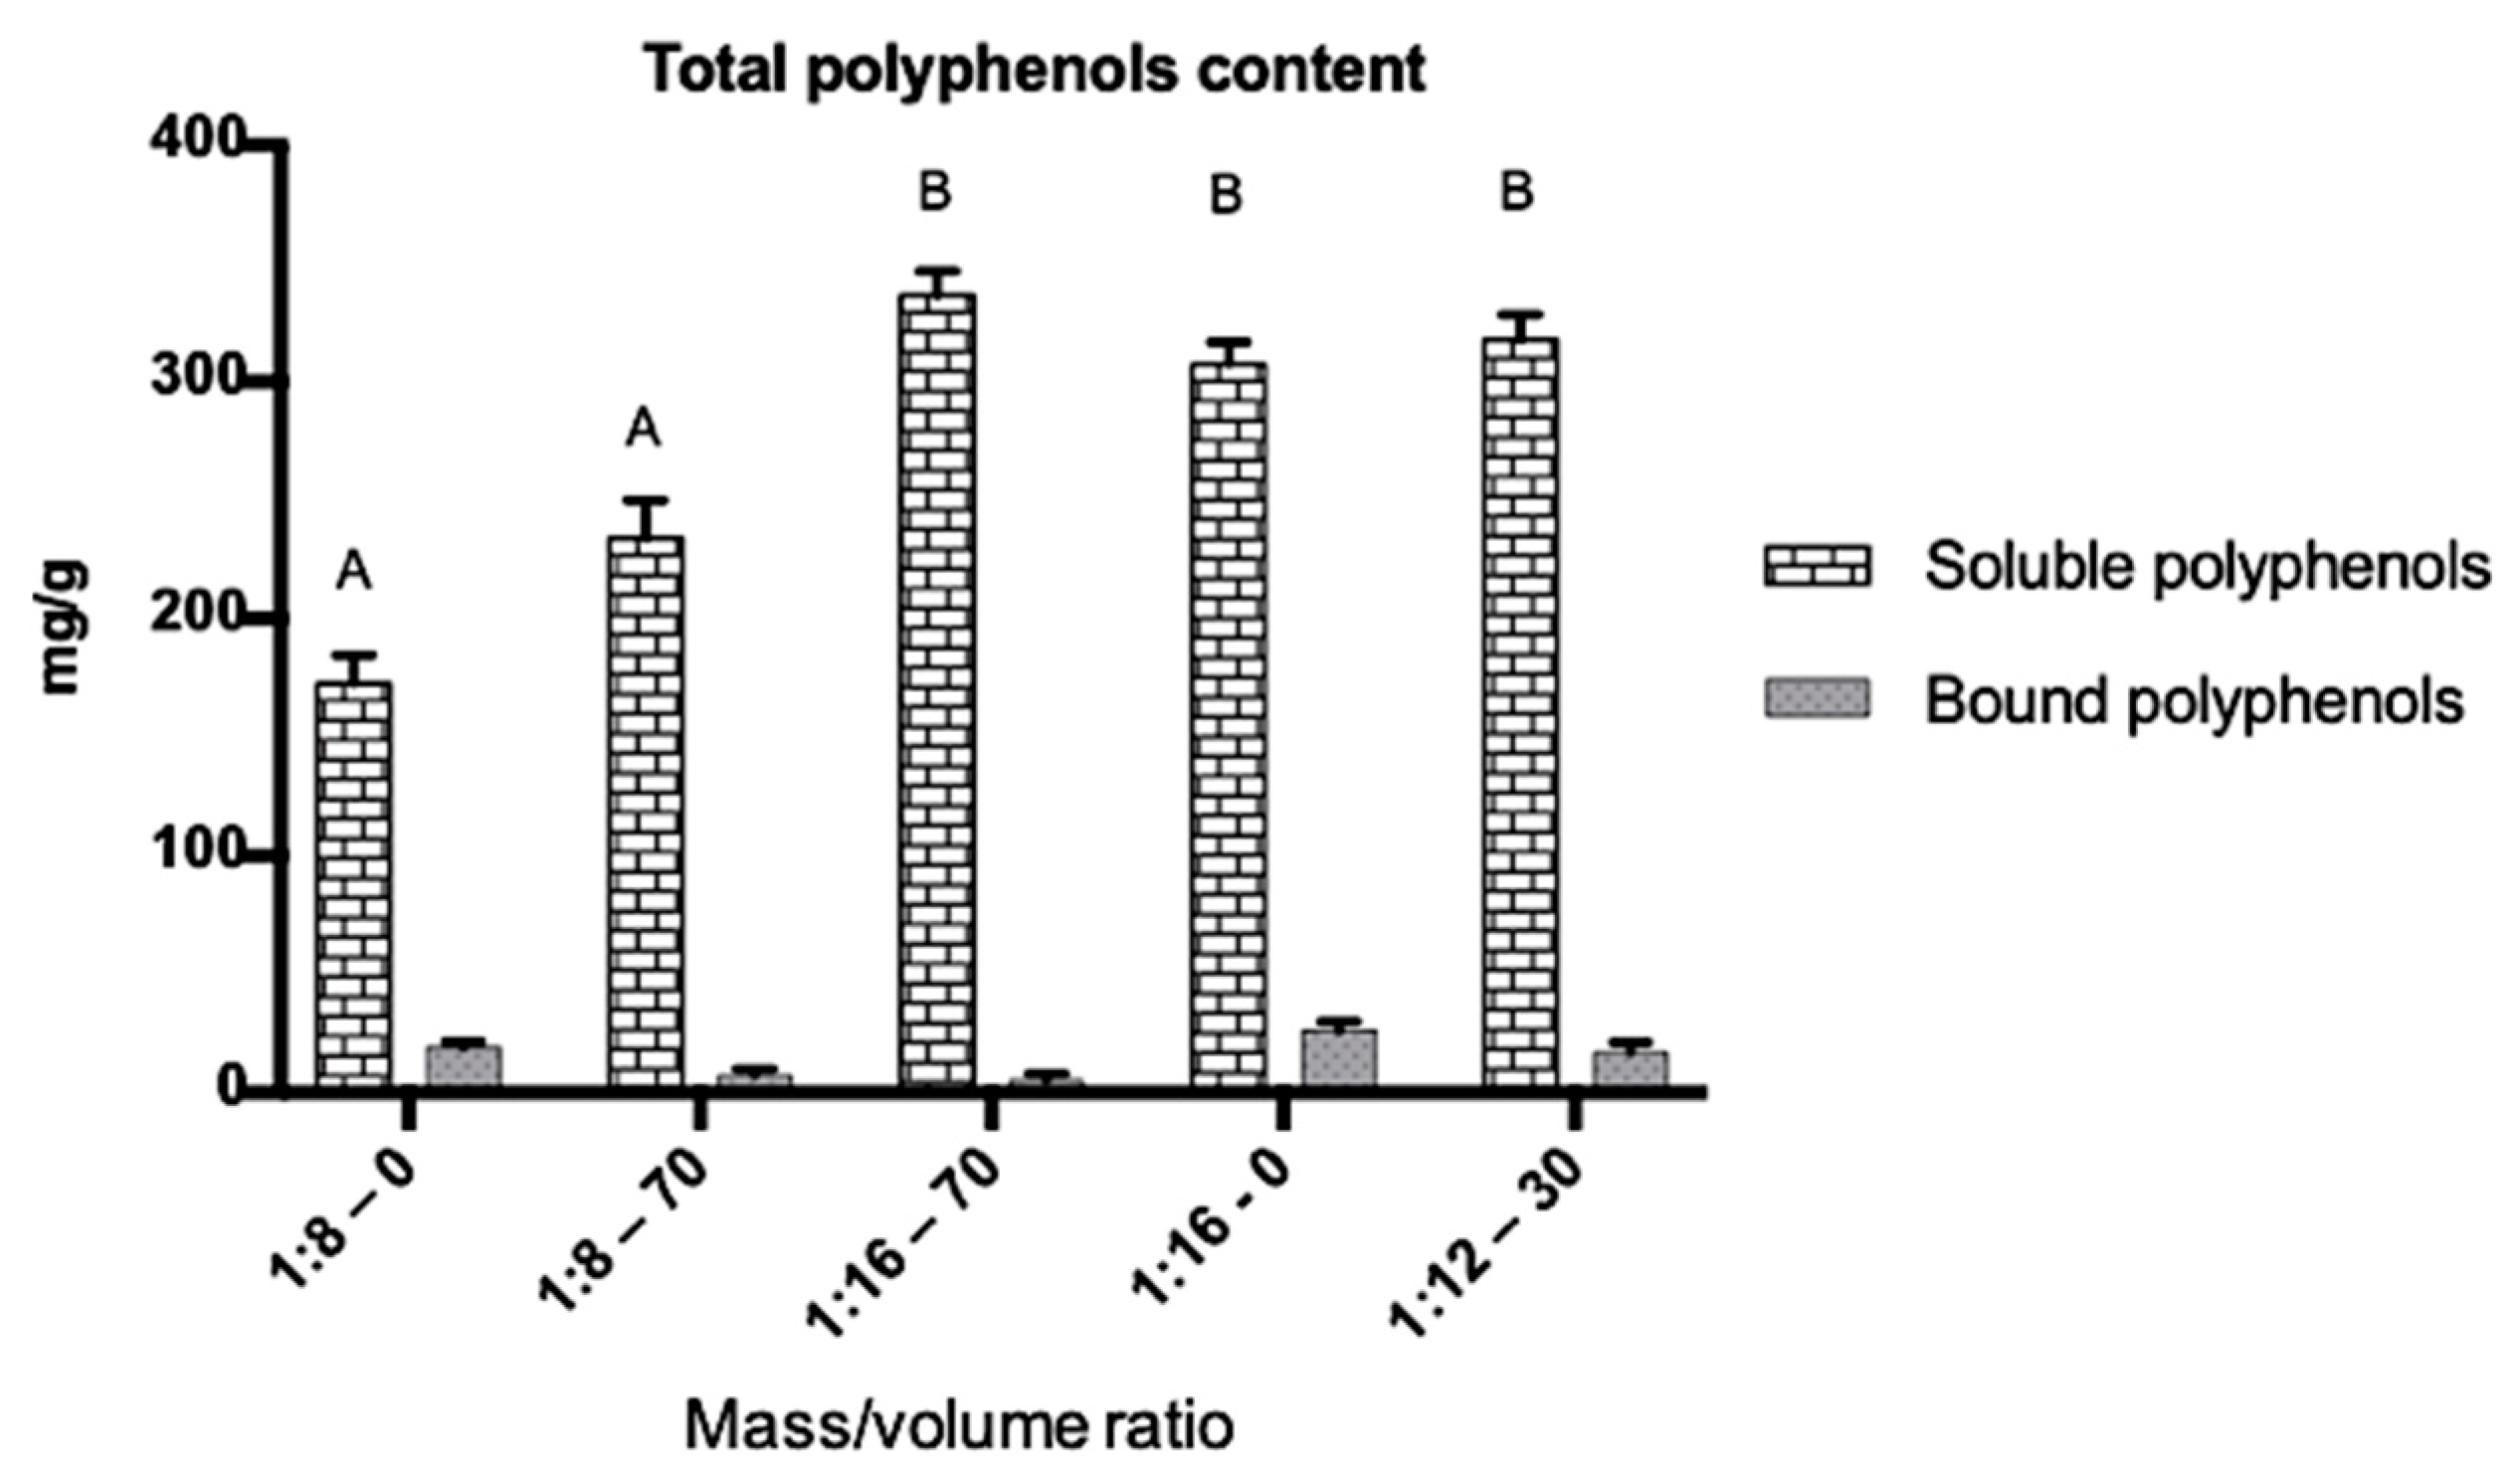
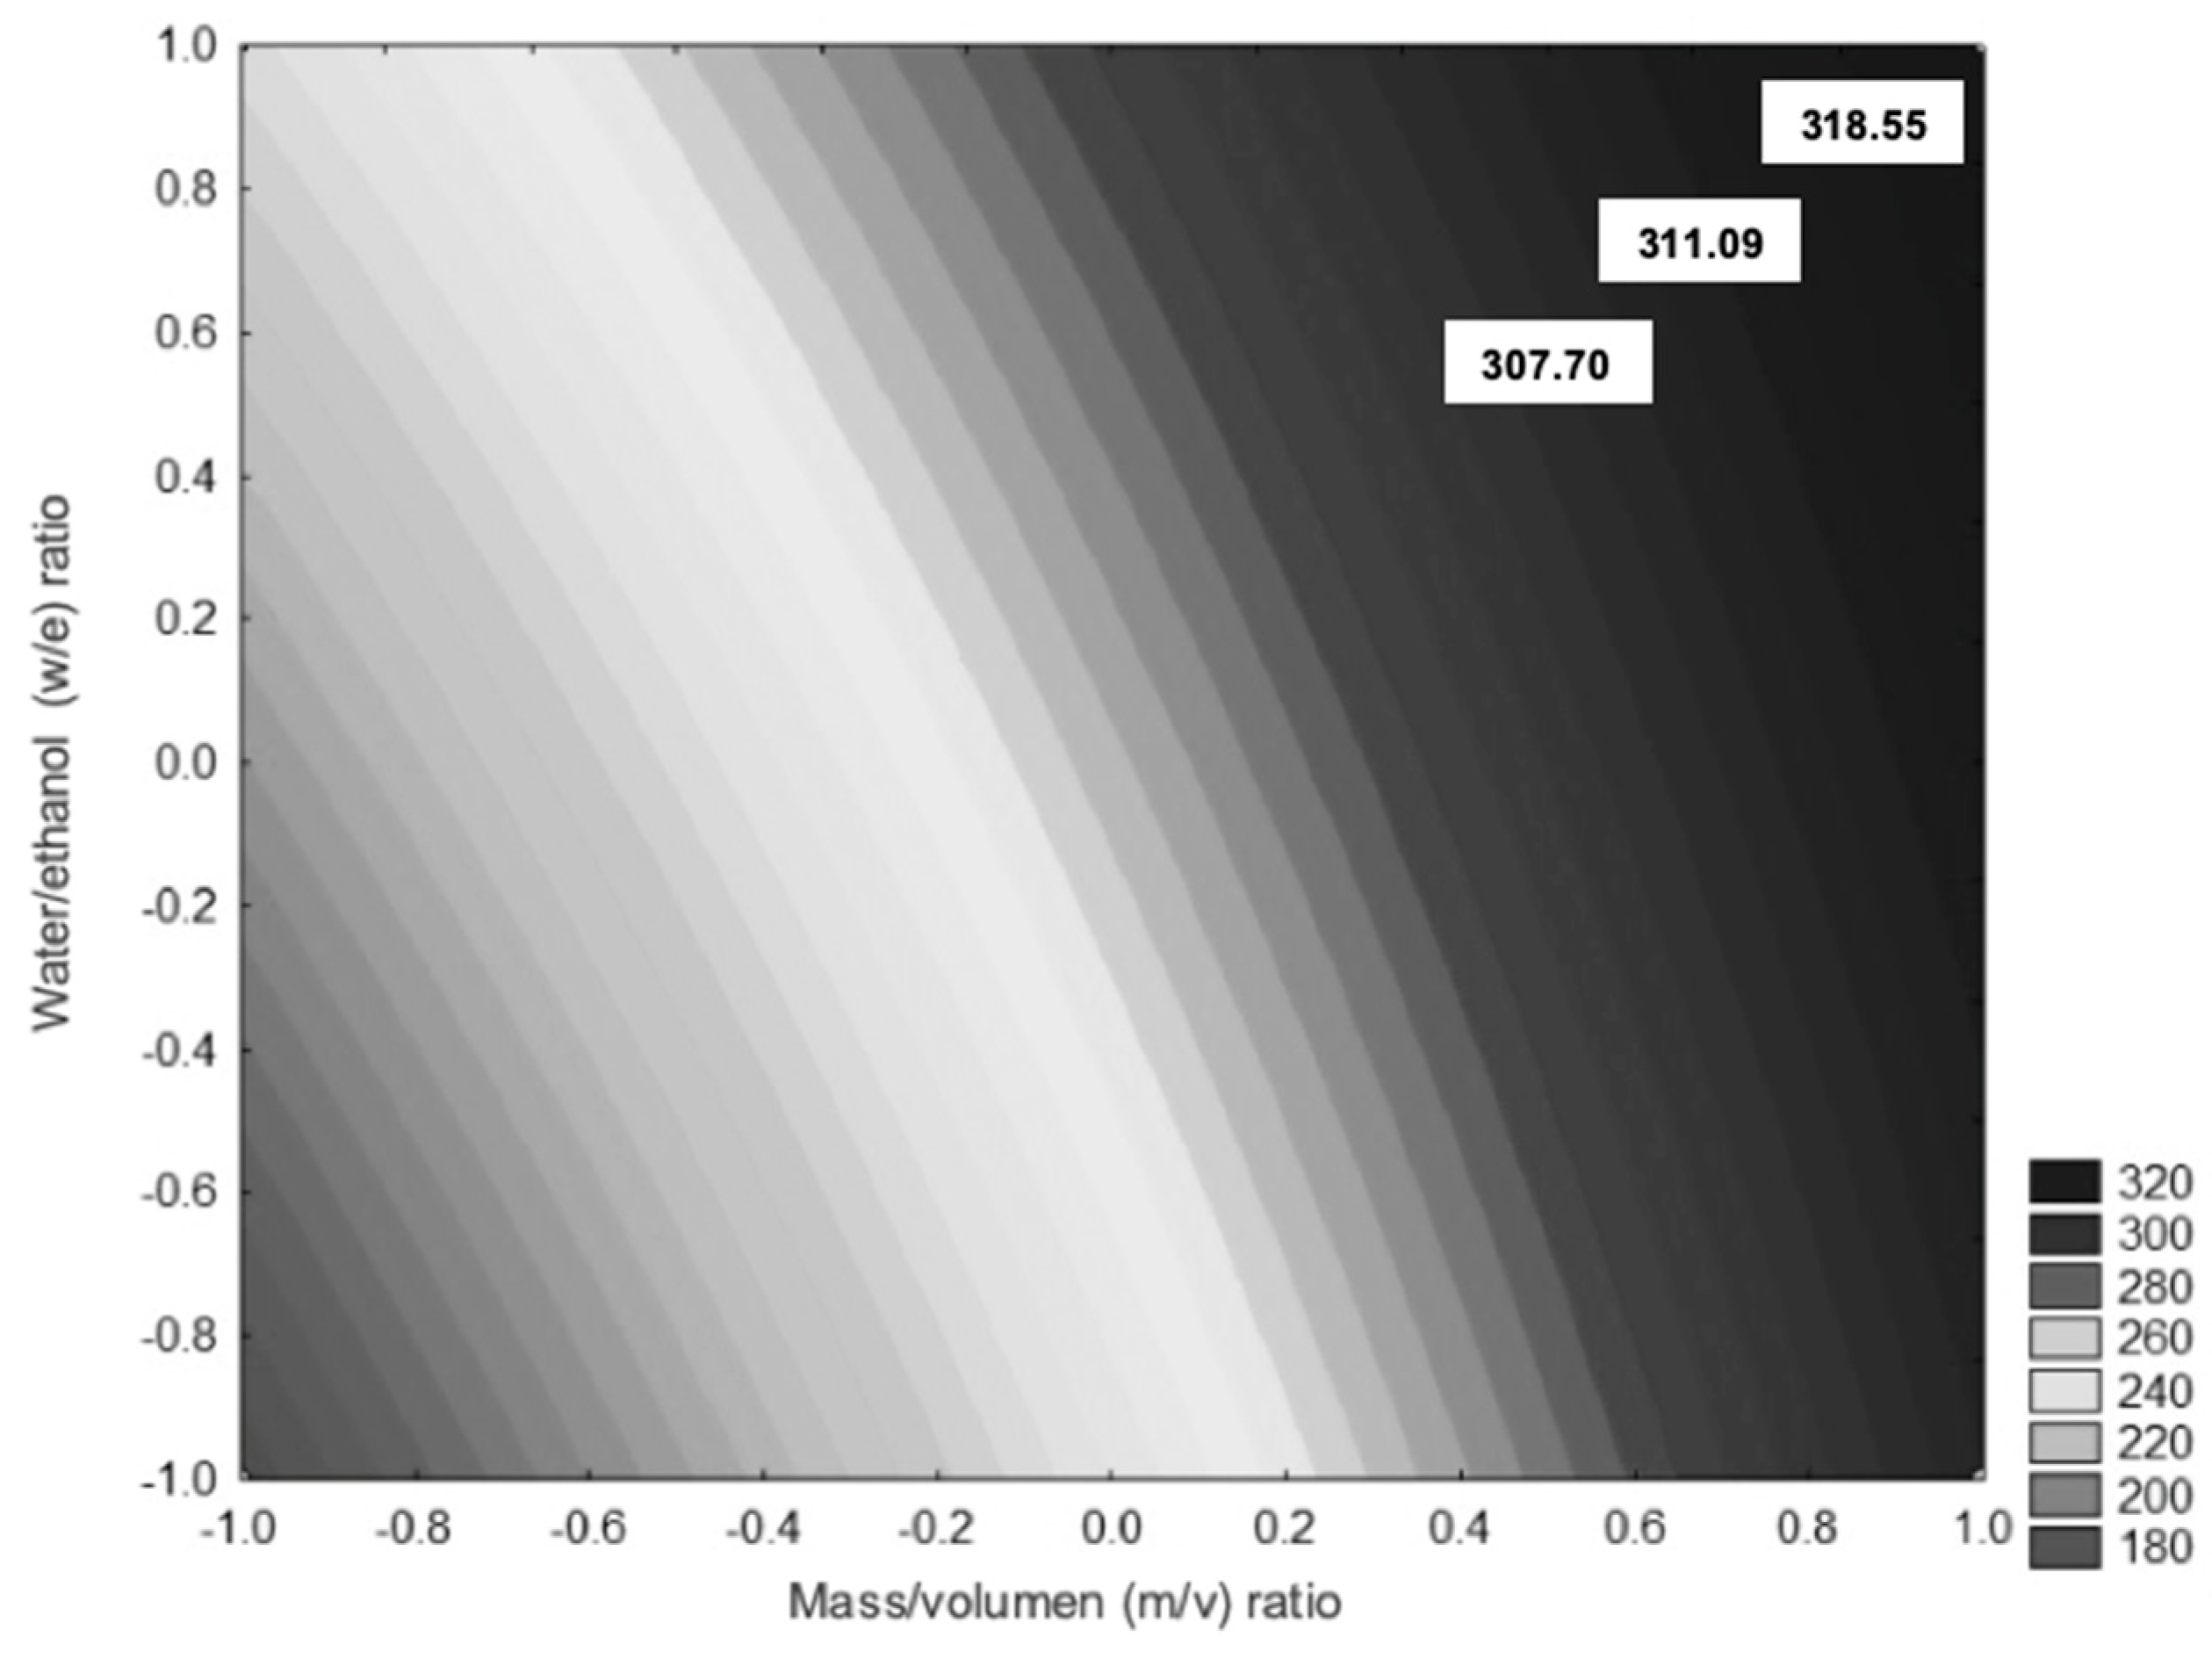
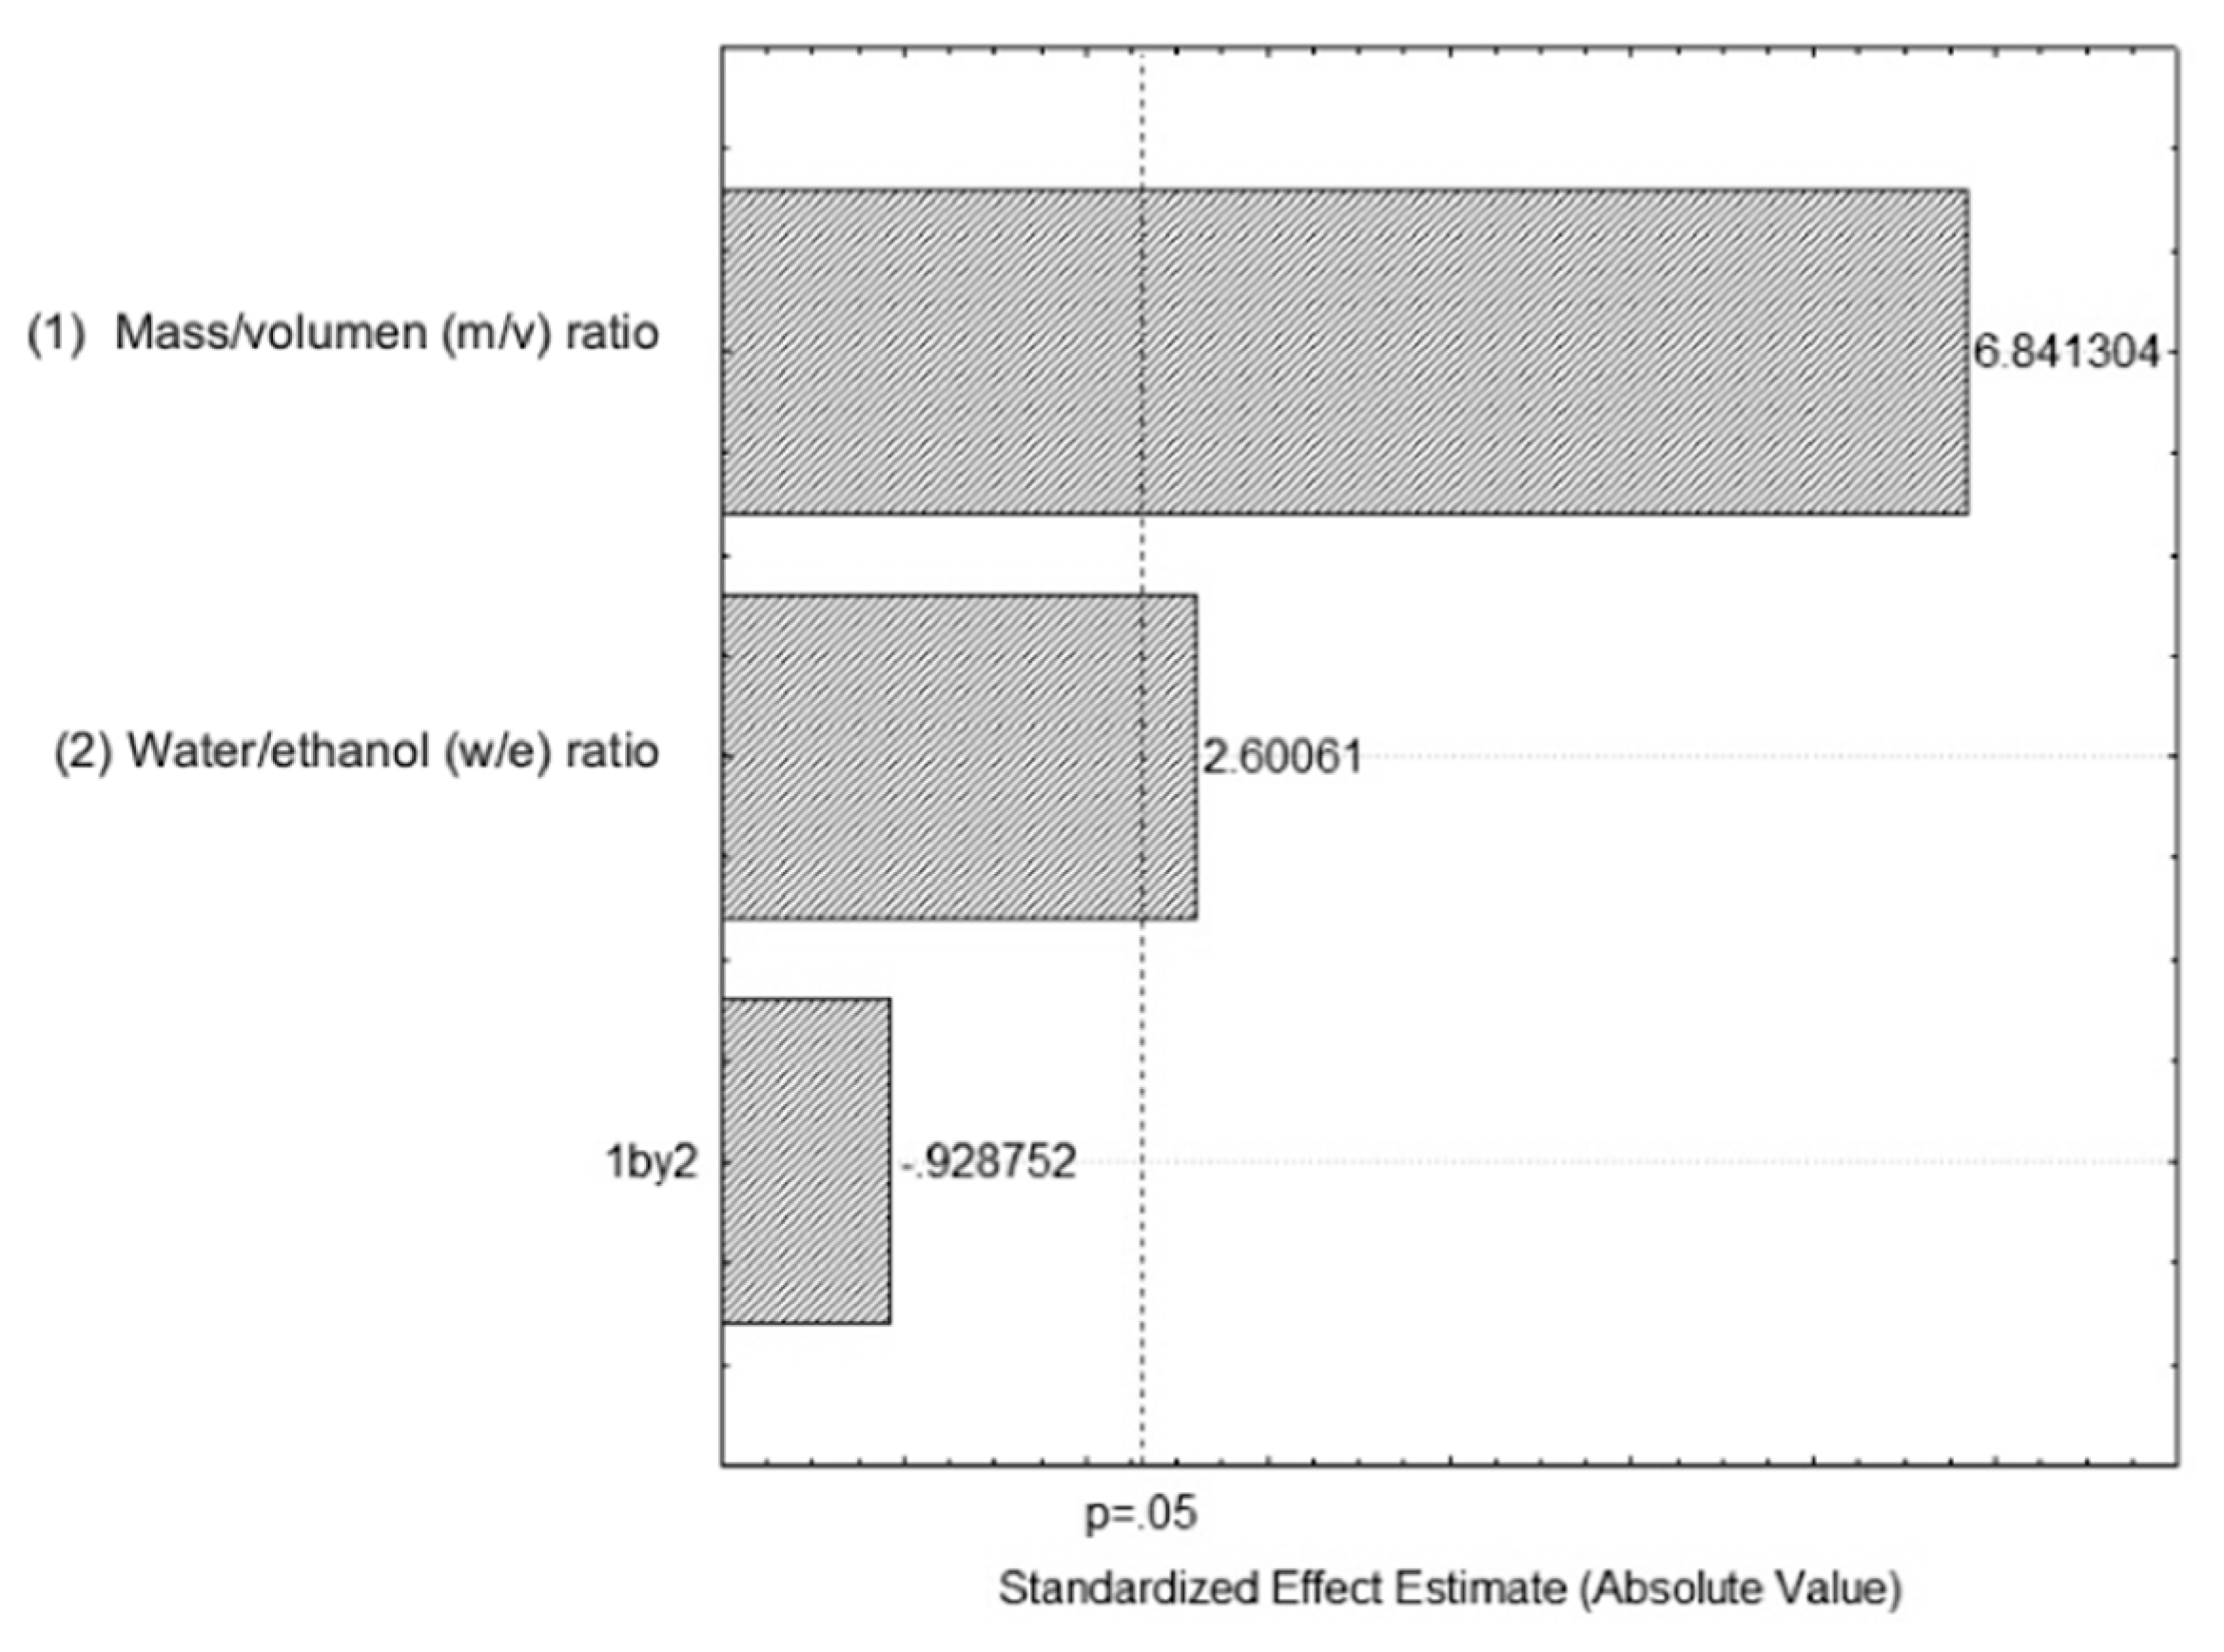
3.1. Soluble Polyphenol Content in RP Extract

The extractions performed with samples 1:16-0, 1:16-70, and 1:12-30 showed a higher content of soluble polyphenols (Figure 3). Generally, the solvent extraction system is selected by the polarity of interest compounds, the amount of solvent used, the safety of the extraction, and the cost [12]. The samples 1:16-0, 1:16-70, and 1:12-30 are not significantly different (p ≤ 0.05) insoluble polyphenol content. Therefore, the sample 1:16-0 was taken as the best extraction condition using water as the solvent, and was neither toxic nor harmful to the environment. Water is an excellent solvent for the extraction of polyphenols such as ellagitannins [13]. For this reason, ratio 1:16-0 was established as the best extraction condition with a content of 307.57 mg/g ± 20.27 mg/g dry matter of total soluble polyphenols. Moreover, the content of bound polyphenols was lower than the soluble polyphenols.
Figure 4 shows the effect of the evaluated factors in this study. The response variable was total soluble polyphenols, the representation of extraction mass/volume (m/v), and water/ethanol percentage (e/w) effects. The m/v factor has a more substantial effect on w/e factor. Therefore, at higher m/v ratios, higher soluble polyphenol content is found, indicating that changes in m/v ratio may increase or decrease the content of polyphenolic compounds. Besides, the (e/w) factor has a low effect on the total soluble polyphenol content. The contour diagram shown in Figure 2 indicates that the best extraction condition of total phenolic compounds is achieved with a 1:16-0 ratio. Using 43.75 g of RP sample and 0% ethanol (water), a total of 307.57 mg/g dry matter of total soluble polyphenols is obtained. Sun et al. [12] obtained optimal conditions to find the maximum extraction efficiency of phenolic content in RP (213.76 mg/g dry matter).
The standardized Pareto chart (Figure 5) is a representation of the effect of both variables, water/ethanol (e/w) and mass/volume (m/v), and their interactions. Each variable that crosses the vertical line is considered significant. However, a positive effect was observed in the m/v ratio, i.e., the increase in this ratio may contribute to a higher content of extracted polyphenols. In contrast the increase in the e/w ratio decreases the total number of extracted polyphenols. The positive effect observed in the m/v ratio could be explained by the types of polyphenols extracted since most are soluble and the solubility of the polyphenols in the solvent exerts high diffusivities of mass transfer at different temperatures. On the other hand, the e/w ratio may only have led more solvents to enter the cells to penetrate with a higher solids/liquids ratio, which seems to be the most plausible for this behavior for the e/w ratio [14].

3.2. Bound Polyphenol Content in RP Extract

The extraction of bound phenolic compounds at room temperature was carried out by alkaline hydrolysis. The content of total bound polyphenols was 26.53 ± 0.13 mg/g, with the best extraction condition 1:16-0. Comparing the results, soluble total polyphenol content was higher than the total polyphenols bound (p ≤ 0.05) (Figure 3). Sun et al. [12] reported soluble and bound polyphenol content of rambutan peel using microwave-assisted extraction at 213.76 and 9.37 mg/g respectively.

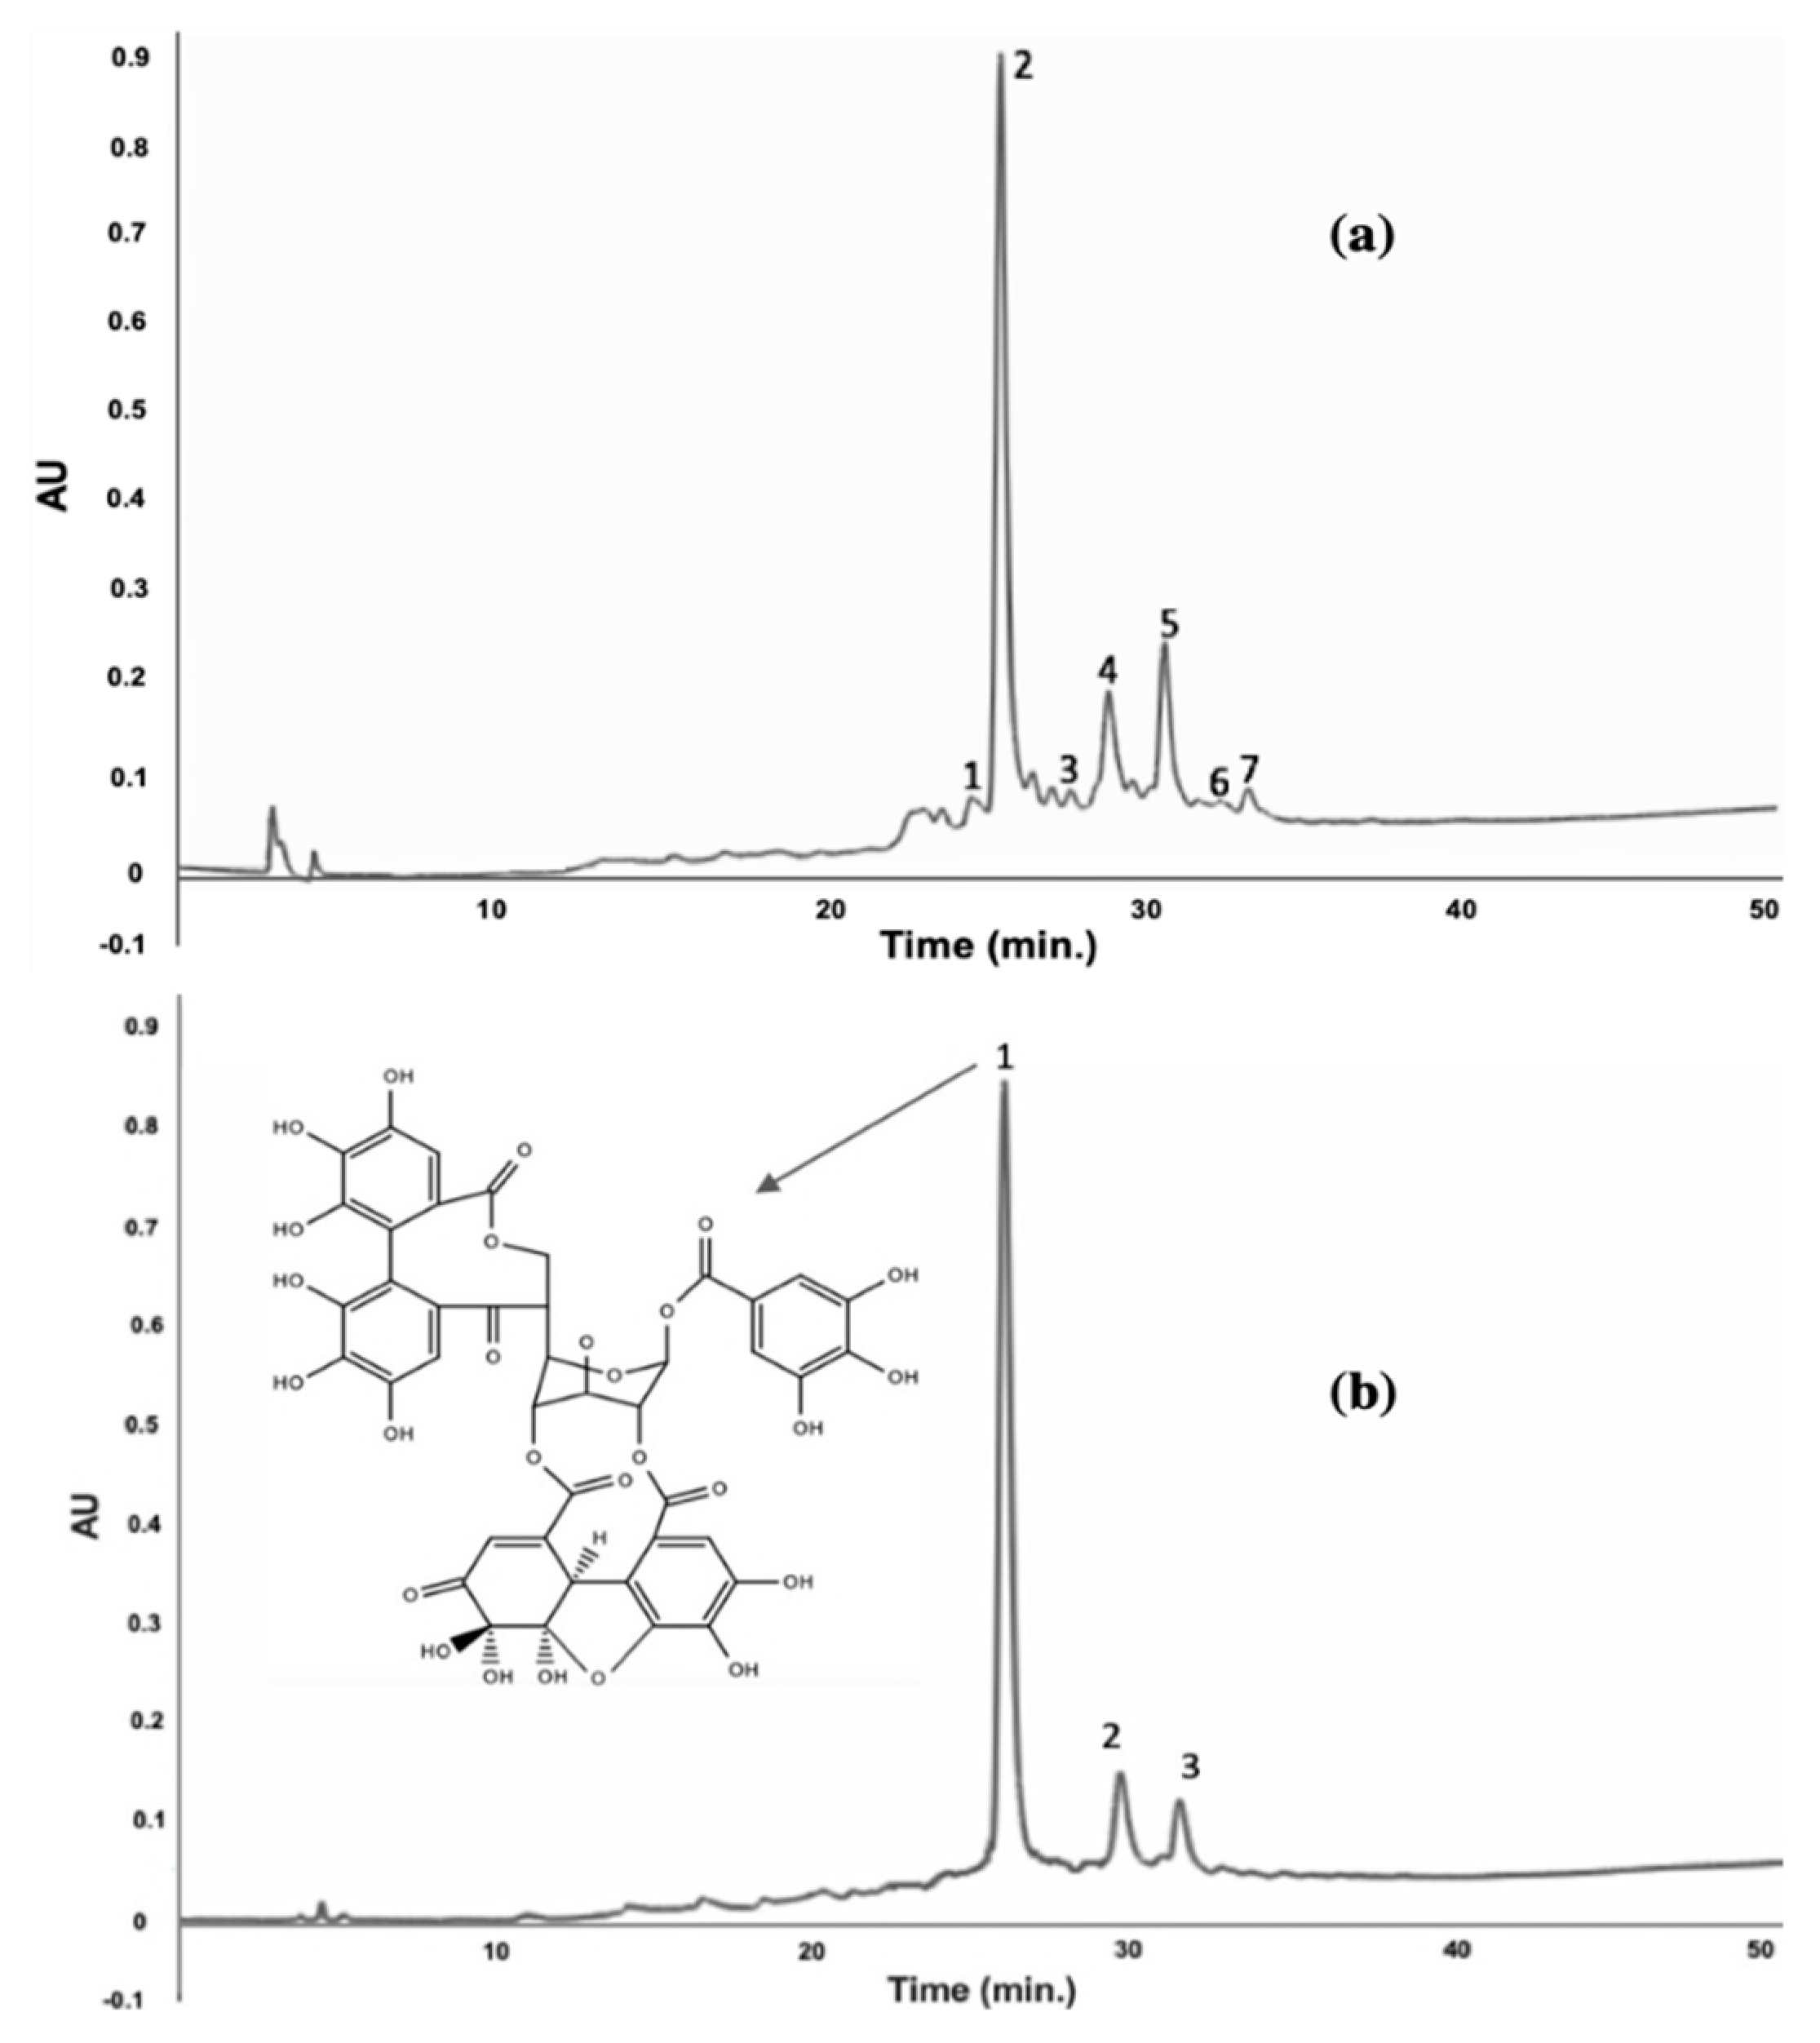
3.3. Isolation of Ellagitannin

After partial purification with Amberlite XAD-16, a second purification with preparative HPLC was performed for ellagitannins isolation.The recovered fraction (41.2 mg) was identified as ellagitannins: Geraniin, ellagic acid, and ellagic acid pentoside according to HPLC/ESI/MS analysis. Finally, geraniin was the main compound present in the sample, with 13.8% of the total of the fraction recovered and 42.5% of abundance in preparative HPLC. Palanisamy et al. [15] recovered less than 3.79% geraniin because geraniin may have degraded to ellagic acid or corilagin.

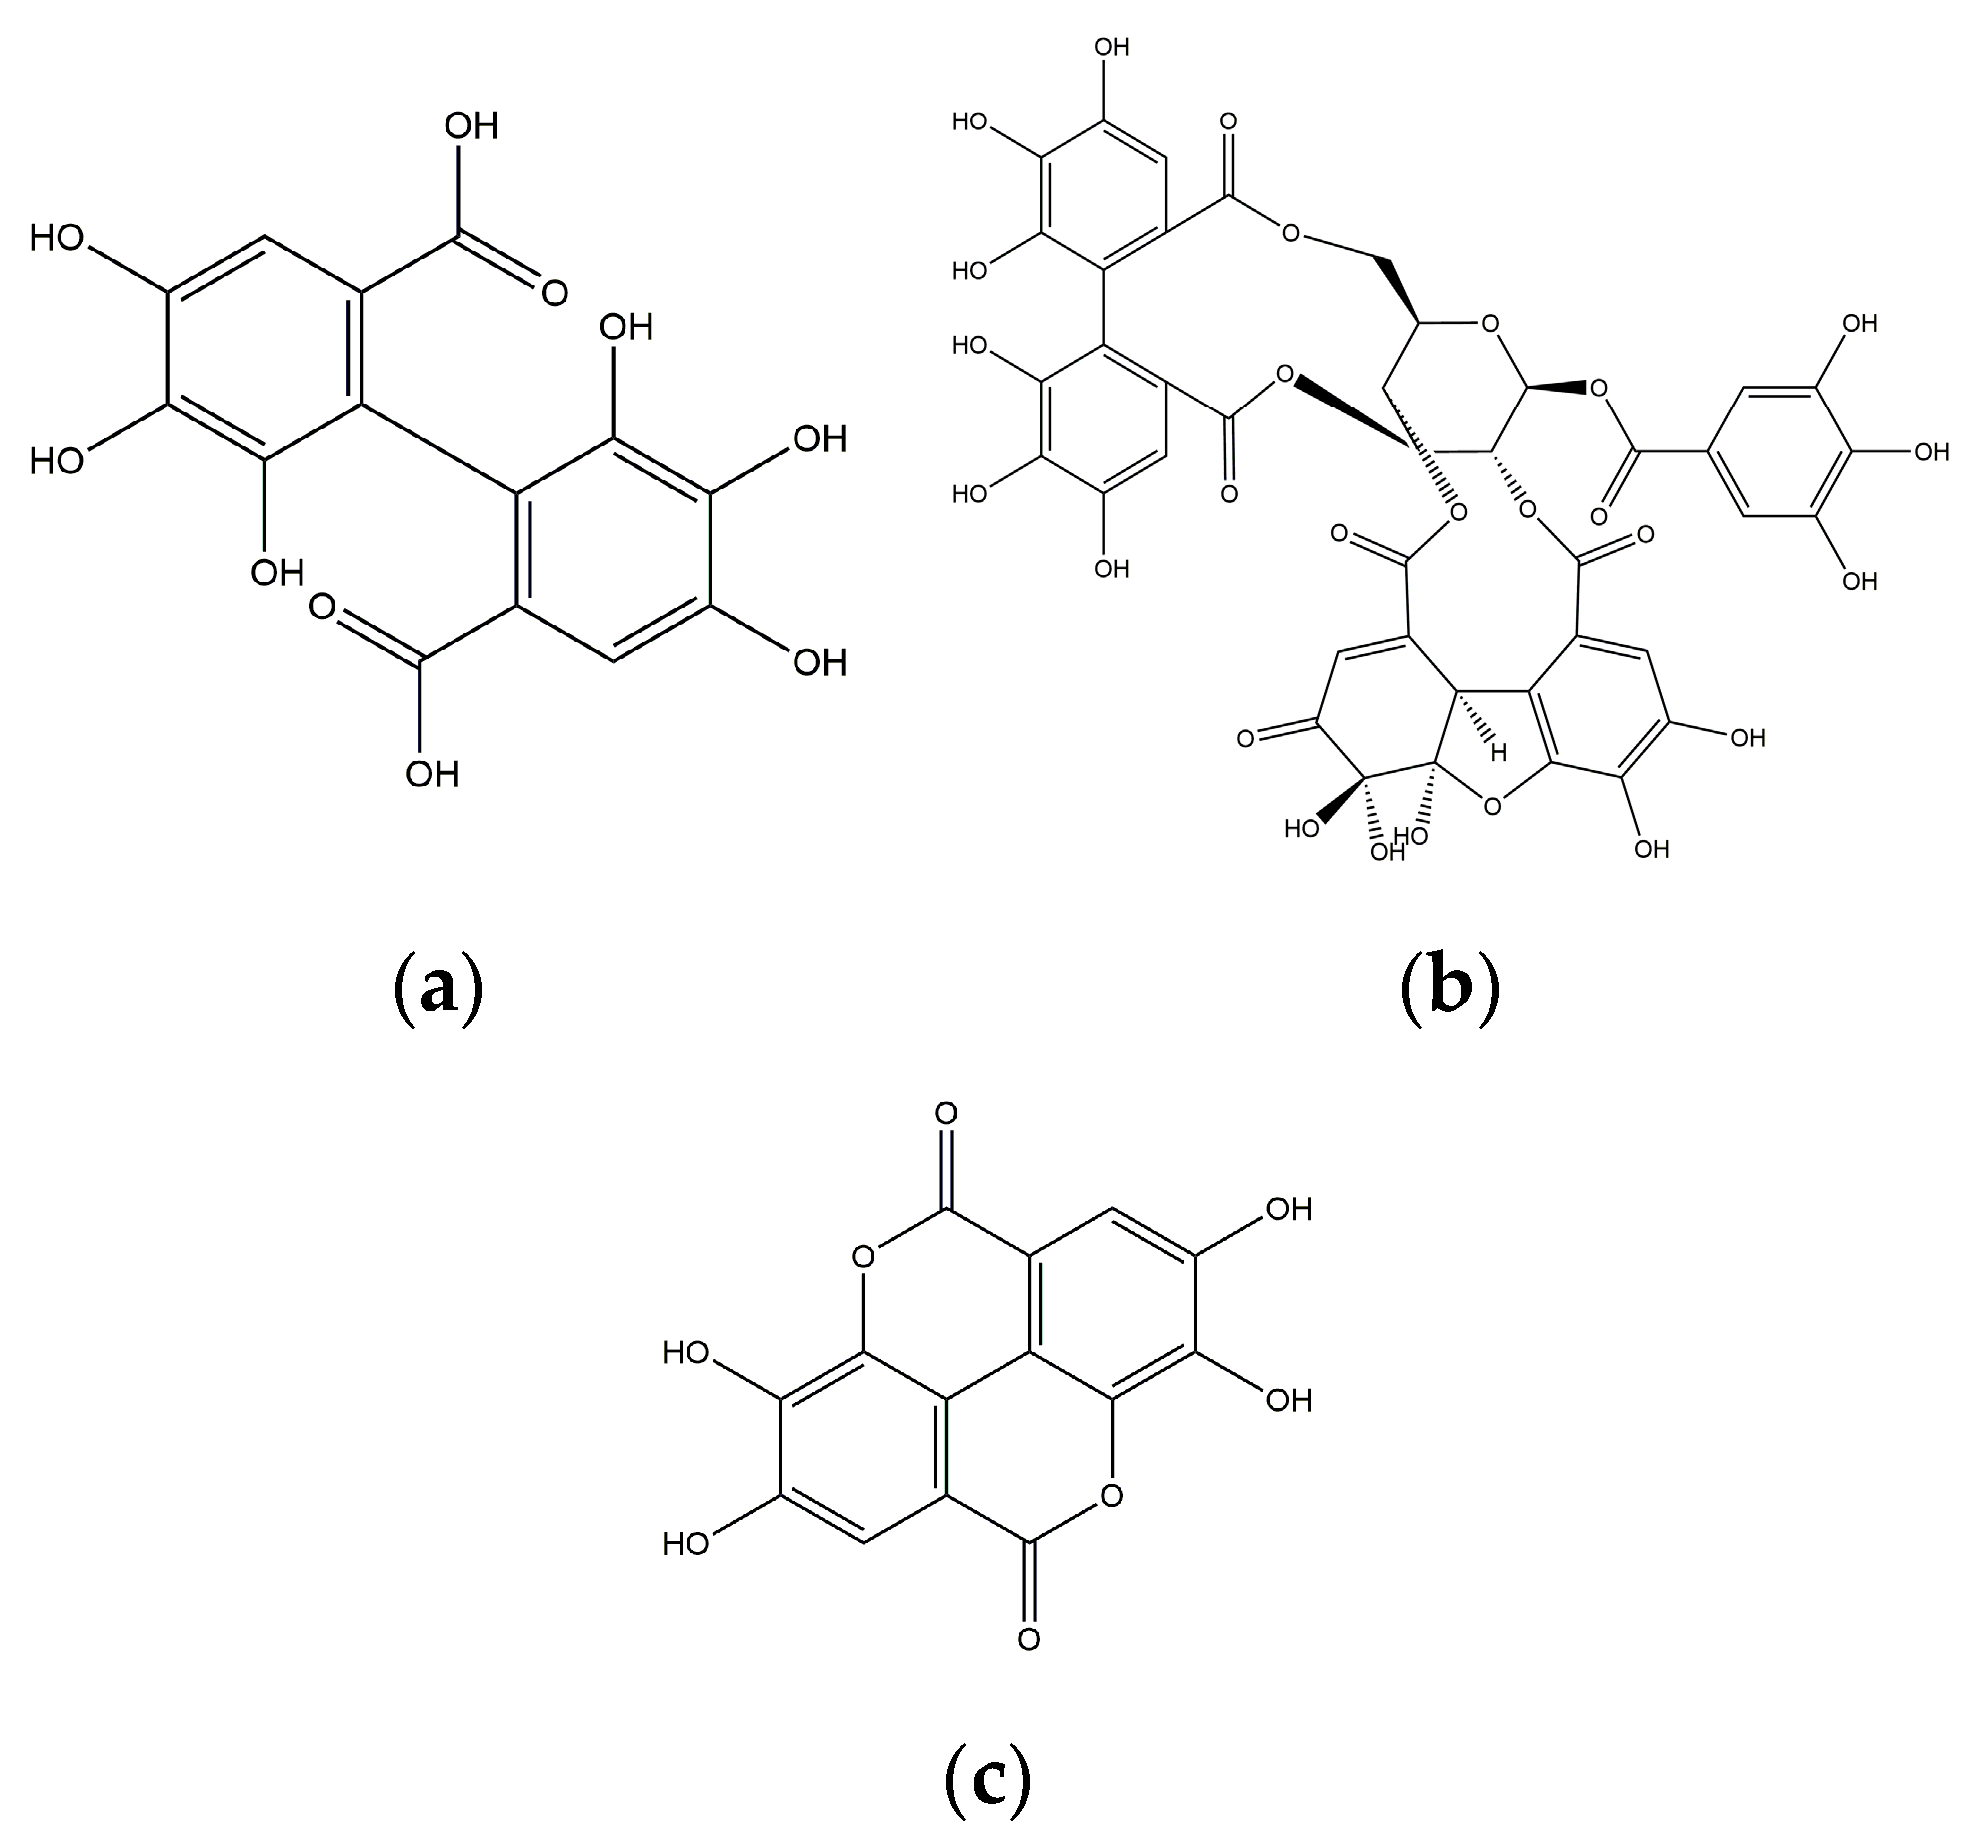
3.4. Identification of Bioactive Compounds Present in RP Extract

HPLC/ESI/MS analysis was used to identify compounds present after the first partial purification with Amberlite XAD-16, and the second purification with preparative HPLC, as shown in Table 2. The identification profile of the main compounds was carried out using negative ionization modes as MS operating conditions, with molecular mass (MS) and their fragments (MS/MS) being obtained.
After the first partial purification with Amberlite XAD-16, a total of seven compounds were identified: six ellagitannins and one hydroxybenzoic acid. Mendez-Flores et al. [16] recovered 12 polyphenolic compounds in RP Mexican variety, also using Amberlite XAD-16. In the second purification with preparative HPLC, three compounds were identified: Geraniin, ellagic acid, and ellagic acid pentoside. Geraniin was the main identified compound (Figure 6). Palanisamy et al. [15] reported that geraniin was also the main compound identified using methanol and ethanol as the extraction solvent in rambutan peel. The relevance of obtaining these compounds is due to their important biological properties applicable in different industrial areas such as cosmetics, pharmaceuticals, and food.

Author Contributions

Conceptualization, J.A.-V. and C.N.A.; methodology, C.H.-H., A.C.F.-G., and M.G.-S.; formal analysis, R.R.-H., L.S., J.M.-C.; investigation, J.A.-V. and C.N.A.; writing—Original draft preparation, C.H.-H.; writing—Review and editing, C.H.-H., J.A.-V., C.N.A.; supervision, J.A.-V., C.N.A. All authors have read and agreed to the published version of the manuscript.

Funding

This research was funded by the Autonomous University of Coahuila, Mexico. Cristian Hernández received a scholarship from CONACyT for his postgraduate studies.

Conflicts of Interest

The authors declare no conflict of interest.

References

  1. Castillo-Vera, A.; López-Guillén, G.; Sandoval-Esquivez, A. La historia del cultivo de rambutan (Nepheliumlapacceum L.) en México. Agroproductividad 2017, 10, 53–57. [Google Scholar]
  2. Hernández-Hernández, C.; Aguilar, C.; Rodríguez-Herrera, R.; Flores-Gallegos, A.; Morlett-Chávez, J.; Govea-Salas, M.; Ascacio-Valdés, J. Rambutan (Nepheliumlappaceum L.): Nutritional and functionalproperties. Trends Food Sci. Technol. 2019, 85, 201–210. [Google Scholar] [CrossRef]
  3. Sagar, N.; Pareek, S.; Sharma, S.; Yahia, E.; Lobo, M. Fruit and Vegetable Waste: Bioactive Compounds, Their Extraction, and Possible Utilization. Compr. Rev. Food Sci. Food Saf. 2018, 17, 512–531. [Google Scholar] [CrossRef] [Green Version]
  4. De Monte, C.; Carradori, S.; Granese, A.; Di Pierro, G.; Leonardo, C.; De Nunzio, C. Modern extraction techniques and their impact on the pharmacological profile of Serenoarepens extracts for the treatment of lower urinary tract symptoms. BMC Urol. 2014, 14, 1–11. [Google Scholar] [CrossRef] [PubMed] [Green Version]
  5. Carniel, N.; Filippi, D.; DellossGullich, L.; Bilibio, D.; Bender, J.; Priamo, W. Recovery of Total Polyphenols from Pomegranate and Butia: A Study of Ultrasound-assisted Extraction and Antioxidant Activity. Indian J. Adv. Chem. Sci. 2017, 5, 112–117. [Google Scholar] [CrossRef]
  6. Zhang, M.; Zhang, R.; Zhang, F.; Liu, R. Phenolic Profiles and Antioxidant Activity of Black Rice Bran of Different Commercially Available Varieties. J. Agric. Food Chem. 2010, 58, 7580–7587. [Google Scholar] [CrossRef] [PubMed]
  7. Sinlgeton, V.; Rossi, J. Colorimetry of total phenolics with phosphomolybdic-phosphotungstic acid reagents. Am. J. Enol. Vitic. 1965, 16, 144–158. [Google Scholar]
  8. Nitao, J.; Birr, B.; Nair, M.; Herms, D.; Mattson, W. Rapid Quantification of Proanthocyanidins (Condensed Tannins) with a Continuous Flow Analyzer. J. Agric. Food Chem. 2001, 49, 2207–2214. [Google Scholar] [CrossRef] [PubMed]
  9. Ascacio-Valdés, J.; Aguilera-Carbó, A.; Buenrostro, J.; Prado-Barragán, A.; Rodríguez-Herrera, R.; Aguilar, C. The complete biodegradation pathway of ellagitanninsby Aspergillusniger in solid-state fermentation. J. Basic Microbiol. 2016, 56, 329–336. [Google Scholar] [CrossRef] [PubMed]
  10. Aguilar-Zárate, P.; Wong-Paz, J.; Michel, M.; Buenrostro-Figueroa, J.; Díaz, H.; Ascacio, J.; Contreras-Esquivel, J.; Gutiérrez-Sánchez, G.; Aguilar, C. Characterization of Pomegranate-Husk Polyphenols and Semi-Preparative Fractionation of Punicalagin. Phytochem. Anal. 2017, 28, 433–438. [Google Scholar] [CrossRef] [PubMed]
  11. Sepúlveda, L.; Wong-Paz, J.; Buenrostro-Figueroa, J.; Ascacio-Valdés, J.; Aguilera-Carbó, A.; Aguilar, C. Solid-state fermentation of pomegranate husk: Recovery of ellagic acid by SEC and identification of ellagitannins by HPLC/ESI/MS. Food Biosci. 2018, 22, 99–104. [Google Scholar] [CrossRef]
  12. Sun, L.; Zhang, H.; Zhuang, Y. Preparation of Free, Soluble Conjugate, and Insoluble-Bound Phenolic Compounds from Peels of Rambutan (Nepheliumlappaceum) and Evaluation of Antioxidant Activitiesin vitro. J. Food Sci. 2012, 77, 198–204. [Google Scholar] [CrossRef] [PubMed]
  13. Soquetta, M.; Terra, L.; Bastos, C. Green technologies for the extraction of bioactive compounds in fruits and vegetables. CyTA-J. Food 2018, 16, 400–412. [Google Scholar] [CrossRef]
  14. Liao, X.; Hu, F.; Chen, Z. Identification and Quantitation of the Bioactive Components in Osmanthusfragrans Fruits by HPLC-ESI-MS/MS. J. Agric. Food Chem. 2018, 66, 359–367. [Google Scholar] [CrossRef] [PubMed]
  15. Palanisamy, U.; Ling, L.; Manaharan, T.; Appleton, D. Rapid isolation of geraniin from Nepheliumlappaceum rind waste and its anti-hyperglycemic activity. Food Chem. 2011, 127, 21–27. [Google Scholar] [CrossRef]
  16. Mendez-Flores, A.; Hernández-Almanza, A.; Sáenz-Galindo, A.; Morlett-Chávez, J.; Aguilar, C.; Ascacio-Valdés, J. Ultrasound-assisted extraction of antioxidant polyphenolic compounds from Nepheliumlappaceum L. (Mexican variety) husk. Asian Pac. J. Trop. Med. 2018, 11, 676–681. [Google Scholar] [CrossRef]
Figure 1. (a) HHDP (Hexahydroxydiphenic acid) group, the particular group of ellagitannins; (b) geraniin, an ellagitannin; (c) ellagic acid, a compound derived from ellagitannins.
Processes 08 00572 g001
Figure 2. (a) Ultrasound/Microwave Cooperative Workstation; (b) Reactor for extractions.
Processes 08 00572 g002
Figure 3. The total content of soluble and boundpolyphenolsin RP. The best extraction conditions were 1:16-0 with 307.57 mg/g ± 20.27 mg/g, then 1:16-70 with 318.55 mg/g ± 18.96 mg/g and 1:12-30 with 311.09 mg/g ± 29.36mg/g. According to Tukey’s test means with the same letter are not significantly different (p ≤ 0.05).
Processes 08 00572 g003
Figure 4. Contour diagram of the total polyphenol content in function of m/v ratio and w/e percentage. Polyphenol extraction ranges are between 180 and 320 mg/g of rambutan peel extract. The highest extraction conditions were 1:16-0 with 307.57 mg/g, 1:12-30 with 311.09 mg/g and 1:16-70 with 318.55 mg/g.
Processes 08 00572 g004
Figure 5. Standardized Pareto chart of the total polyphenol content in function of m/v ratio and e/w percentage.
Processes 08 00572 g005
Figure 6. Chromatogram of the best extraction condition of RP 1:16-0 with the first and the second purification (a) 1 corilagin; 2 geraniin; 3 punigluconin; 4 ellagic acid pentoside; 5 ellagic acid; 6 tetragalloy glucose; 7 pedunculagin. (b) 1 geranin; 2 ellagic acid; 3 ellagic acid pentoside at 280 nm.
Processes 08 00572 g006
Table 1. Extraction condition of polyphenolic compounds in RP.
IDMass/Volume Ratio (g/mL)Water/Ethanol Ratio (%)
11:160
21:1670
31:80
41:870
51:1230
Table 2. Compounds identified by HPLC/ESI/MS.
PurificationIDRetention Time (min)CompoundsMass(m/z)[M-H]MS2Group/Family
Amberlite XAD-16125.66Corilagin634481,301,275Ellagitannin
226.55Geraniin952933,301,169Ellagitannin
328.5Punigluconin802649,347,348Ellagitannin
429.85Ellagicacidpentoside433299,300,287,125Ellagitannin
531.65Ellagicacid302257, 229,185Ellagitannin
633.07Tetragalloyglucose789617,465,635Hydroxybenzoic acid
733.5Pedunculagin785301,481,765Ellagitannin
Preparative HPLC127.45Geraniin952933,301,169Ellagitannin
230.55Ellagicacid302257,229,185Ellagitannin
332.75Ellagicacidpentoside433299,300,287,125Ellagitannin

