Article

Production Process and Optimization of Solid Bioethanol from Empty Fruit Bunches of Palm Oil Using Response Surface Methodology

by
Nurfahmi
1,2,
M. Mofijur
3,*,
Hwai Chyuan Ong
1,3,*,
Badrul Mohamed Jan
1,
Fitranto Kusumo
4,
Abdi Hanra Sebayang
5,
Hazlina Husin
6,
Arridina Susan Silitonga
5,
Teuku Meurah Indra Mahlia
3 and
S. M. Ashrafur Rahman
7
1
Department of Mechanical Engineering, Faculty of Engineering, University of Malaya, Kuala Lumpur 50603, Malaysia
2
SMK SMTI Banda Aceh, Ministry of Industry, Aceh 23123, Indonesia
3
School of Information, Systems and Modelling, Faculty of Engineering and Information Technology, University of Technology Sydney, Sydney, NSW 2007, Australia
4
Institute of Sustainable Energy, Universiti Tenaga Nasional, Kajang 43000, Malaysia
5
Department of Mechanical Engineering, Politeknik Negeri Medan, Medan 20155, Indonesia
6
Department of Petroleum Engineering, Universiti Teknologi PETRONAS, Bandar Seri Iskandar 32610, Malaysia
7
Biofuel Engine Research Facility (BERF), Queensland University of Technology, Brisbane, QLD 4000, Australia
*
Authors to whom correspondence should be addressed.
Processes 2019, 7(10), 715; https://doi.org/10.3390/pr7100715
Submission received: 8 August 2019 / Revised: 1 October 2019 / Accepted: 3 October 2019 / Published: 8 October 2019
(This article belongs to the Special Issue Catalytic Biomass Fractionation)

Abstract

:
This study aimed to observe the potential of solid bioethanol as an alternative fuel with high caloric value. The solid bioethanol was produced from liquid bioethanol, which was obtained from the synthesis of oil palm empty fruit bunches (PEFBs) through the delignification process by using organosolv pretreatment and enzymatic hydrolysis. Enzymatic hydrolysis was conducted using enzyme (60 FPUg−1 of cellulose) at a variety of temperatures (35 °C, 70 °C, and 90 °C) and reaction times (2, 6, 12, 18, and 24 h) in order to obtain a high sugar yield. The highest sugars were yielded at the temperature of 90 °C for 48 h (152.51 mg/L). Furthermore, fermentation was conducted using Saccharomyces cerevisiae. The bioethanol yield after fermentation was 62.29 mg/L. Bioethanol was extracted by distillation process to obtain solid bioethanol. The solid bioethanol was produced by using stearic acid as the additive. In order to get high-quality solid bioethanol, the calorific value was optimized using the response surface methodology (RSM) model. This model provided the factor variables of bioethanol concentration (vol %), stearic acid (g), and bioethanol (mL) with a minus result error. The highest calorific value was obtained with 7 g stearic acid and 5 mL bioethanol (43.17 MJ/kg). Burning time was tested to observe the quality of the solid bioethanol. The highest calorific value resulted in the longest burning time. The solid bioethanol has a potential as solid fuel due to the significantly higher calorific value compared to the liquid bioethanol.

1. Introduction

Greenhouse gas emissions, due to the impact of excessively used fossil fuel [1], have created negative impacts on the environment [2,3]. The primary emission of greenhouse gas is carbon dioxide [4], which is formed as a result of the fossil fuel combustion process [5,6]. These reasons have encouraged scientists and researchers to investigate new sources of energy. One of the renewable sources of energy is renewable energy that comes from wind, solar, hydro, and bioenergy, among others [7,8,9]. However, the problem with most renewable energies is that they are unreliable due to unstable production because of their nature. Solar energy, for example, is only available for a particular period daily and therefore requires an energy storage device to store energy [10]. The most reliable energy storage currently available is the battery, in which the capacity is quite limited. Therefore, some researchers have attempted to discover a new type of material for energy storage [11,12]. However, two sources of renewable energy are widely used in the transport sector as fuel for internal combustion engines. The first is biodiesel, which has been derived from a variety of sources such as palm oil, stone fruit [13], Jatropha curcas, microalgae [14], or Calophyllum inophyllum and some other sources [15,16,17,18,19]. The second is bioethanol as an alternative for gasoline, which, when obtained from renewable sources, has a tremendous and promising potential to fill a gap in world energy production sharing, as fossil fuel shows a consistent reduction in its production rate due to climate change and global warming issues. The world production of bioethanol has increased simultaneously year by year; as reported by the Renewable Energy Association (REA), ethanol reached 25.6 billion liters in 2016 [20]. Apparently, bioethanol production has attracted many researchers due to its favorable usage in the internal combustion engine. It prevents knocking and early ignition, which leads to a high antiknock value. On the other hand, bioethanol is also able to reduce CO2 emissions by 80% compared to a conventional fossil fuel combustion, which is better for issues dealing with greenhouse gases and global warming [21].
However, lower scale fuel, such as cooking fuel, also has good potential because of the increase in the liquefied petroleum gas (LPG) price. This potential has been less attractive due to the problems encountered in citizen use. These problems are twofold: (i) bioethanol is produced and distributed solely as transportation or machine fuel and (ii) the distribution of low-scale liquid bioethanol is problematic because of its volatility. Therefore, solid bioethanol is a potential alternative fuel as one that is easily transported [22]. Some solid ethanol products have been sold online. However, their production is based on melting temperature (−114 °C) or the mixture of ethanol with sugars [23]. Stearic acid seems to be a viable additive to produce solid ethanol. Stearic acid (CH3 (CH2)16COOH) has 18 carbon atoms, whereas bioethanol (C2H5OH) has 2 carbon atoms. Carbon chains of those molecules react with oxygen (O2) with heat/flame. According to this theory, increasing the carbonyl chain number would possibly raise the heating value (calorific value). Bioethanol from biomass feedstock has been developed widely by many researchers recently. It has the potential to be converted into solid bioethanol.
The first-generation biofuel production introduced the solution of using human food sources as the feedstock for biofuel production. Second-generation biofuel replaced it by using non-edible biomass as a feedstock. Moreover, these second-generation technologies also encouraged development due to flexibility, energy efficiency, low-cost production, and better environmental impact [24]. Palm empty fruit bunches are the most promising biomass feedstock for bioethanol production. There is an abundant waste in palm oil industries, because the produced palm oil is only 10% of the total biomass produced in plantations. The wastes consist of vast amounts of lignocellulose biomass. Lignocellulose is the main component of softwoods and hardwoods as the structure of the cell walls. It is composed of lignin, cellulose, and hemicellulose. Lignin chains cellulose and hemicellulose so that it inhibits the hydrolysis of cellulose and hemicellulose [25,26,27]. Therefore, pretreatment is a necessary step to degrade the lignin content of biomass [28]. Many studies about pretreatment have been tried chemically, biologically, and physically. However, advanced methods are still needed to reach a lower cost to be competitive with conventional commodity fuels and chemical products.
Organosolv pretreatment was used in this study because of a previous study resulting in a high degradation of lignin. This pretreatment has the advantage of producing less by-product during delignification and of being an easily recoverable solvent. Table 1 shows the advantages (pros) and disadvantages (cons) of the organosolv pretreatment process compared to other processes. Aqueous ethanol 55% was employed as the organic solvent [29]. Enzymatic hydrolysis was conducted in this study to hydrolyze cellulose and hemicellulose into reducing sugars. This hydrolysis has the advantage of producing more sugar yield compared to acid hydrolysis. However, the cost of the enzymatic hydrolysis is significantly higher than acid hydrolysis [30,31]. Moreover, studies about enzymatic hydrolysis have been successfully done using various forms of treated biomass such as corn stover, rice straw [32], rice hull [33], sugarcane bagasse [34,35,36], and palm empty fruit bunch (PEFB) [37,38,39]. Different researchers have used different pretreatment processes and optimization to produce bioethanol from different feedstocks. For example, Sebayang et al. [40] used Manihot glaziovii starch as a feedstock to produce bioethanol through the optimization of enzymatic hydrolysis. Kim et al. [41] used a sequential pretreatment process with diluted acid and then alkali to treat empty palm fruit bunch fiber biomass for producing bioethanol. However, there is not much research found on the optimization of the organosolv pretreatment process to produce bioethanol from PEFB through enzymatic catalyzation. The novelty of this study is to highlight the EFBs as a less expensive second-generation feedstock for bioethanol production using the organosolv pretreatment process and enzymatic hydrolysis in Malaysia. In this study, the production and optimization of solid bioethanol were carried out using stearic acid as an additive. Liquid bioethanol was produced from palm empty fruit bunches (PEFBs) via organosolv pretreatment and enzymatic hydrolysis. The optimization of solid bioethanol production was determined by response surface methodology (RSM) to get the highest calorific value.

2. Materials and Methods

2.1. Materials

The palm empty fruit bunch (PEFB) biomass, which was supplied from palm plantations in Indonesia, was used as a feedstock for bioethanol production. Aqueous ethanol with a concentration of 55 vol % was proposed as a solvent in order to break lignin content, known as the delignification process; this aqueous ethanol was supplied from Fisher Scientific (Waltham, MA, USA). Enzyme cellulose (cellulose from Trichoderma reesei ATCC 26921) and β-glucosidase (β-glucosidase from Caldocellum saccharolyticum) for the hydrolysis process, and the yeast extract, peptone, and glucose as a medium for the fermentation process, were supplied from Sigma-Aldrich (St. Louis, MO, USA). Furthermore, the bioethanol was solidified with stearic acid (Sigma-Aldrich, St. Louis, MO, USA), which has a melting point of 67–72 °C.

2.2. Preparation of Bioethanol

The palm empty fruit bunch (PEFB) biomass was dried under the sun and crushed to a small size of approximately 1 cm width. Furthermore, it was dried in an oven at a temperature of 105 °C for 24 h in order to evaporate all the water content. The dried biomass was then ground for the further homogenous processing of the material, into the 710–500 µm size range, and then this biomass was stored in a desiccator (NS 24/29 Duran, Darmstadt, Germany). The same procedure of drying and grinding was conducted in the previous study [29].
The pretreatment method, used to synthesize sugars from the dried biomass, was organosolv pretreatment and further enzymatic hydrolysis processes. The organosolv pretreatment method was performed chemically as a delignification process by dissolving dried PEFB with aqueous ethanol at a solid–liquid ratio of 1:10 (10 g in 100 mL) in an Erlenmeyer flask. The condition was settled at 55 vol % ethanol, a temperature of 120 °C, and a reaction time of 60 min [29]. The units of enzymes were found as an adequate amount to obtain a high sugar yield [43]. The temperature and reaction time were varied at 35 °C, 70 °C, and 90 °C for 2, 6, 12, 18, and 24 h, respectively, in a water bath shaker.
The hydrolyzed PEFBs were carried out to measure total sugar yield using the phenol-sulfuric acid dinitrosalicylic (DNS) colorimetric method on the obtained samples of acid pretreatment, as well as on the hydrolyzed PEFBs after and without acid pretreatment. The test was conducted by mixing 1 mL of 0.1% DNS reagent solution with 1 mL diluted solution of treated PEFB. The mixed solutions were then put into a water bath at 90 °C for 5 min and allowed to cool down to room temperature before spectrophotometer reading at 540 nm.
The optimum sugar yield of hydrolysate was selected to be fermented into bioethanol. The fermentation was carried out with media consisting of 1% (w/v) yeast extract and 2% (w/v) peptone and 3% (w/v) glucose. The media was poured into the hydrolysate and was autoclaved in 121 °C for 30 min in order to sterilize it. After the medium was cooled down to room temperature, the yeast culture was added to be inoculated in a shaker for 24 h in order to activate the yeast cultures’ enzymatic activity. After the inoculation, treated PEFB was added into media containing 1% (w/v) yeast extract, 2% (w/v) peptone, and 10% (v/v) yeast cultures at a solid-to-liquid ratio of 2:5 in a 250 mL volume Erlenmeyer flask. The fermentation was performed in a shaker incubator at 35 °C and 150 rpm for 84 h. Ethanol yield was determined every 12 h. Bioethanol was distilled using a control rotary evaporator (230 VAC, IKA, Staufen, Germany) at 79 °C in order to remove the water content. The concentration of bioethanol was determined using a density meter (DMA 35, Anton Paar, Graz, Austria).

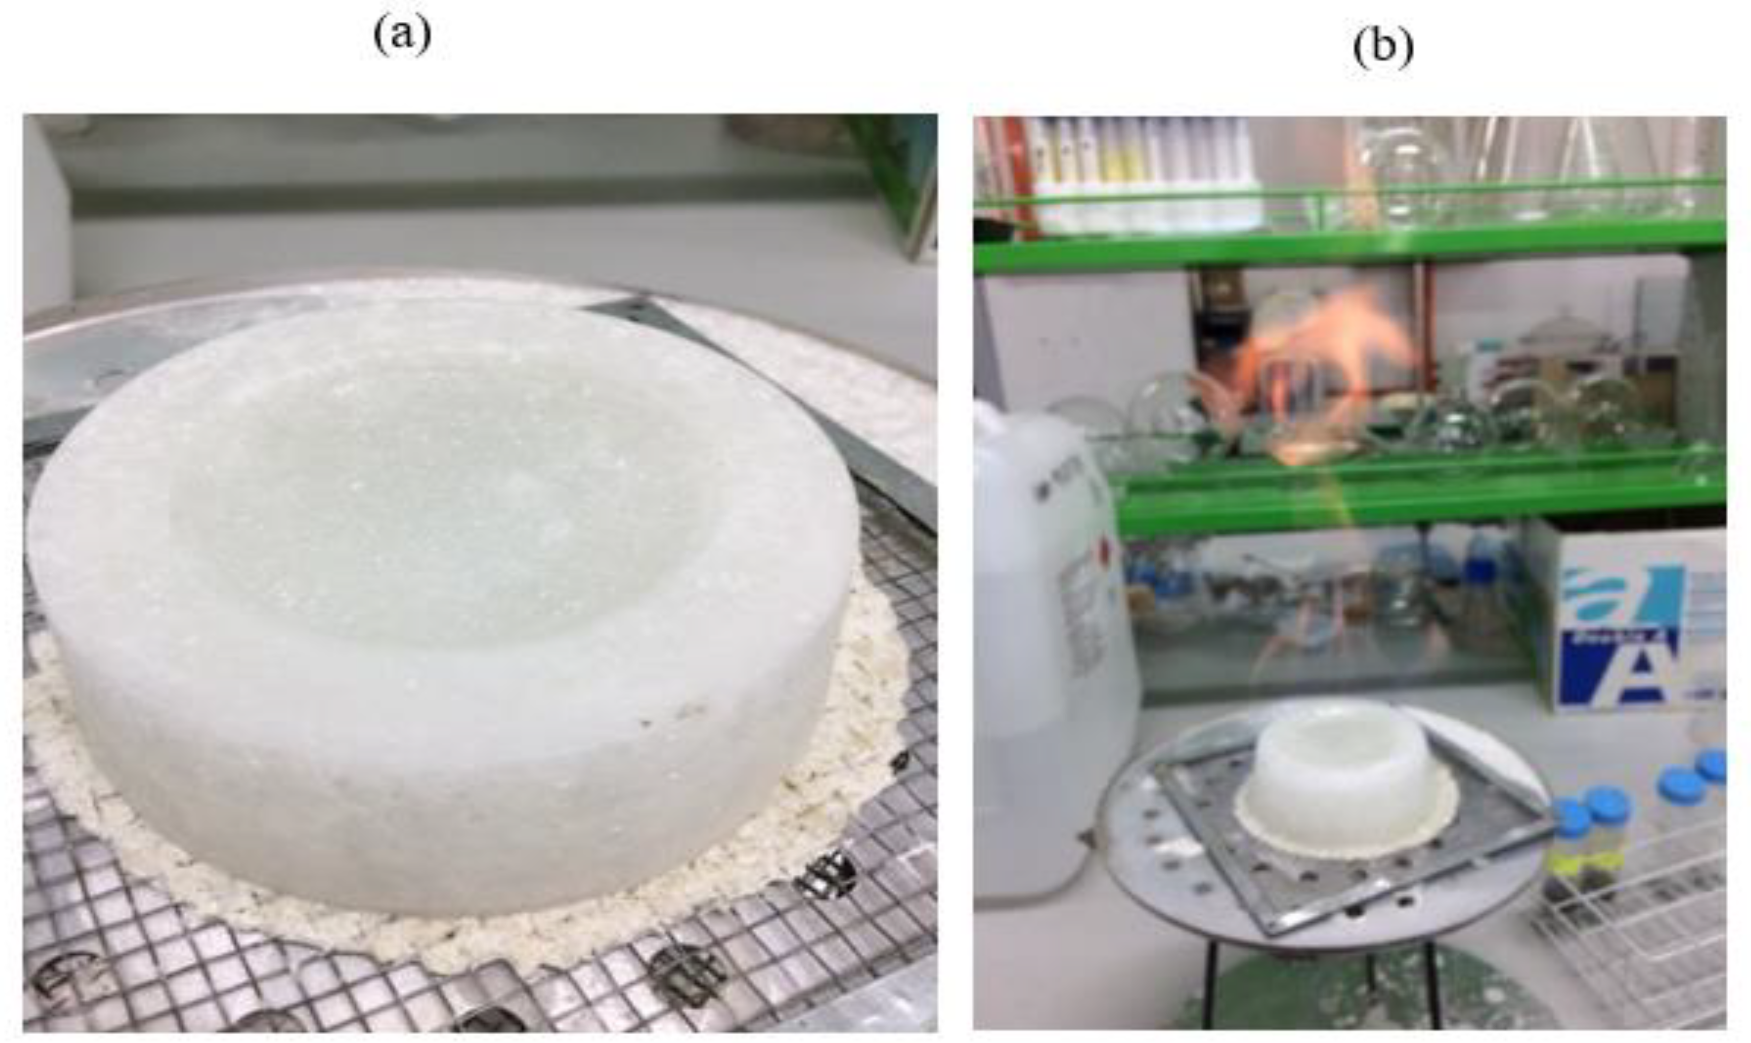
2.3. Solid Ethanol Production and Optimization of Solid Bioethanol Calorific Value

Solid ethanol production was carried out by mixing melted stearic acid with ethanol. Calorific value was determined using a calorimeter (Oxygen Bomb Calorimeter 6200, Paar, MO, USA) for optimization of the solid ethanol quality. The composition of 70%, 80%, and 90% (v/v) ethanol and stearic acid was varied in order to optimize the calorific value of the solid ethanol.
Response surface methodology (RSM) with Box–Behnken experimental design was used to optimize the calorific value of the solid bioethanol [44,45]. The design is available in Design-Expert software 9.0.4.1 (Stat-Ease Inc., Minneapolis, MN, USA). The independent variables chosen were bioethanol concentration (%) represented as A, stearic acid (g) represented as B, and bioethanol (mL) represented as C. The coded levels of independent variables resulting from the Box–Behnken experimental design are presented in Table 2. Furthermore, the combustion test was carried out to observe the burning time of the solid bioethanol (Figure 1). The four highest calorific value samples were selected to be tested. The diameter of each sample to be burned was 3 in with a length of 4 cm.

3. Results and Discussion

3.1. Sugars and Bioethanol Yield of PEFB

The organosolv pretreatment was used as a delignification method in this study. Aqueous ethanol was used as the solvent solution to degrade lignin in the palm empty fruit bunch (PEFB); this method was successfully used in a previous work, which was able to break down the lignin content in the biomass by producing less residue [29], hence this will not be a major problem for further processes of bioethanol production [45,46]. However, the organosolv pretreatment has been commonly used in softwood and hardwood synthesis processes, which are able to obtain 90% of the sugars’ efficiency by incorporating an enzymatic hydrolysis method [47,48,49]. In the present study, enzymatic hydrolysis was performed by using the enzyme 60 FPUg−1 of cellulose to derive the sugar yield from the source biomass with varying temperature conditions of 35, 70, and 90 °C, where the enzyme cellulose 60 FPU was the standard unit of cellulose used for the enzymatic hydrolysis process in bioethanol production [50,51,52,53].
Moreover, several enzymes have been used in hydrolysis processes and are categorized based on their activities’ temperature range, that is, 20–50 °C, 50–80 °C, and above 80 °C, which are known as mesozyme, thermozyme, and hyperthermozyme, respectively [54,55]. Hence, the cellulose enzyme used in this work was thermozyme, which has an activation temperature of about 39–90 °C. For industrial purposes such as pulp and paper processes, the thermozyme type of enzyme is used due to the low possibility of contamination within a short, extended process.
Figure 2 shows the rate of sugar yields obtained from the enzymatic hydrolysis process with the enzyme 60 FPUg−1 of cellulose in different combinations of temperature, namely, 35 °C, 70 °C, and 90 °C. The result shows that the optimum sugar yield at the first 2 h of the hydrolysis process is obtained at a temperature of 90 °C as 72.81 mg·L−1, which is much higher than the sugar yield achieved at temperatures of 35 °C and 70 °C as 7.45 mg·L−1 and 10.92 mg·L−1, respectively. Subsequently, these sugar yields at 35 °C and 70 °C presented a significant increment once 6 h of the fermentation process was reached, and afterwards simultaneously increased as the fermentation times were increased. On the other hand, the sugar yield at 90 °C increased from 2 h of fermentation time onward, which can be attributed to the higher temperature. The increasing sugar yield occurred because of the high temperature that affected the enzyme’s activity. The optimal temperature for enzyme activity is 35–37 °C. However, the higher temperature possibly increased the kinetic energy of the enzyme. At the temperature of 90 °C, the enzyme works better for a certain time before enzyme denaturation. However, overall, and once the 48 h fermentation processes ended, the optimum yield of sugars reaching 152.51 mg·L−1 was obtained at a temperature of 90 °C. This optimum yield was due to the increasing kinetic energy, which increased the interaction between the substrate and enzyme, thereby achieving a better reaction rate for a higher sugar yield [56].
This sugar yield was thus carried out for the further fermentation process using Saccharomyces cerevisiae in order to produce bioethanol over a period of 84 h, and was then analyzed every 12 h to determine the yield of bioethanol that was converted from the sugars. Figure 3 presents the comparison of rate yield ethanol production and sugar decomposition from an analysis carried out every 12 h. These results show that the rate of ethanol yield obtained increased when the fermentation time increased, where a significant increment appears at 24 h and shows a continuous slight increase afterwards, whereas it is vice versa for the sugar decomposition. However, sugars acted as a carbon (C) source to grow the S. cerevisiae cells within the fermentation processes [57].
Meanwhile, as the boiling point of the bioethanol (78.3 °C) was lower than the boiling point of water (100 °C), the remaining water content in the bioethanol solution was not removed completely and formed an azeotropic solution (i.e., a mixture of 95% ethanol and 5% water), which had a boiling point of 78.15 °C [58]. However, the azeotropic percentage between bioethanol and water obtained in this study was 90% ethanol and 10% water.

3.2. Optimization of Solid Bioethanol Production

3.2.1. Quadratic Regression Model for Solid Bioethanol Optimization

Optimization was performed using the response surface methodology (RSM) model. This method is a technique based on the design of experiments (DOE). RSM is used to analyze the changes of the dependent variable and has been widely used to optimize the experiment process due to the advantage that it can predict the maximum result, which is not carried out in the experiment [44,45,59]. The variation of data was estimated by Box–Behnken experimental design (Table 2).
C V = 104.34414 + 3.06036 A 0.53194 B + 1.17400 C + 0.021850 A B 0.012712 A C 0.027625 B C 0.017277 A 2 +   0.046256 B 2   + 0.033194 C 2
The polynomial equation above is used to predict the calorific value, and the results of the prediction are presented in Table 2, where CV represents the calorific value, A represents bioethanol concentration, B represents stearic acid, and C represents bioethanol.
Analysis of variance (ANOVA) was conducted to calculate the statistical significance of the quadratic regression model and the effects of significant individual correlation of the chosen responses. The results are presented in Table 3. The p-value corresponds to the probability of error and is expressed to determine whether each regression coefficient is significant. A p-value less than 0.0001 indicates that the model is significant at the 95% level of confidence. The model F-value of 95.5% implies that the model is significant. There is only a 0.01% chance that an F-value this large can occur due to noise. The value of “Prob>” less than 0.0500 shows the model terms are significant. For this case, A, B, C, and A2 are significant model terms. If the value exceeds 0.1000, it indicates that the model terms are insignificant. In addition, if there are many insignificant model terms (not counting those required to support hierarchy), model reduction by reducing the parameter range may improve the model.
The coefficient of determination (R2) represents the variety of dependent variables (calorific value) and its relationship with the predicted variables. A high R2 indicates the higher viability of the data due to the accordance of model-predicted data and experimental data. The relationship of those variables is presented in Figure 4. It shows that the value of R2 is 0.9919, which indicates that 99.19% of the variability in experimental calorific value is explained by the quadratic regression model.
The signal-to-noise ratio is determined by statistical parameter adequate precision. A preferable adequate precision is higher than 4. The adequate precision in this study was 36.330, as presented in Table 3. It indicates that the signal is adequate, and the quadratic regression model is viable to be used to navigate the design space. The standard deviation of experimental and predicted data is determined as residual. If residuals follow a normal distribution, it means that the experimental errors are random. Therefore, the residuals were normalized with the estimate of standard deviations, which presented as externally studentized residuals. The studentized residuals should be according to the normal distribution function [44]. The standard deviation for the runs is within ±3.00 interval, which shows the approximation of model prediction and experimental results.

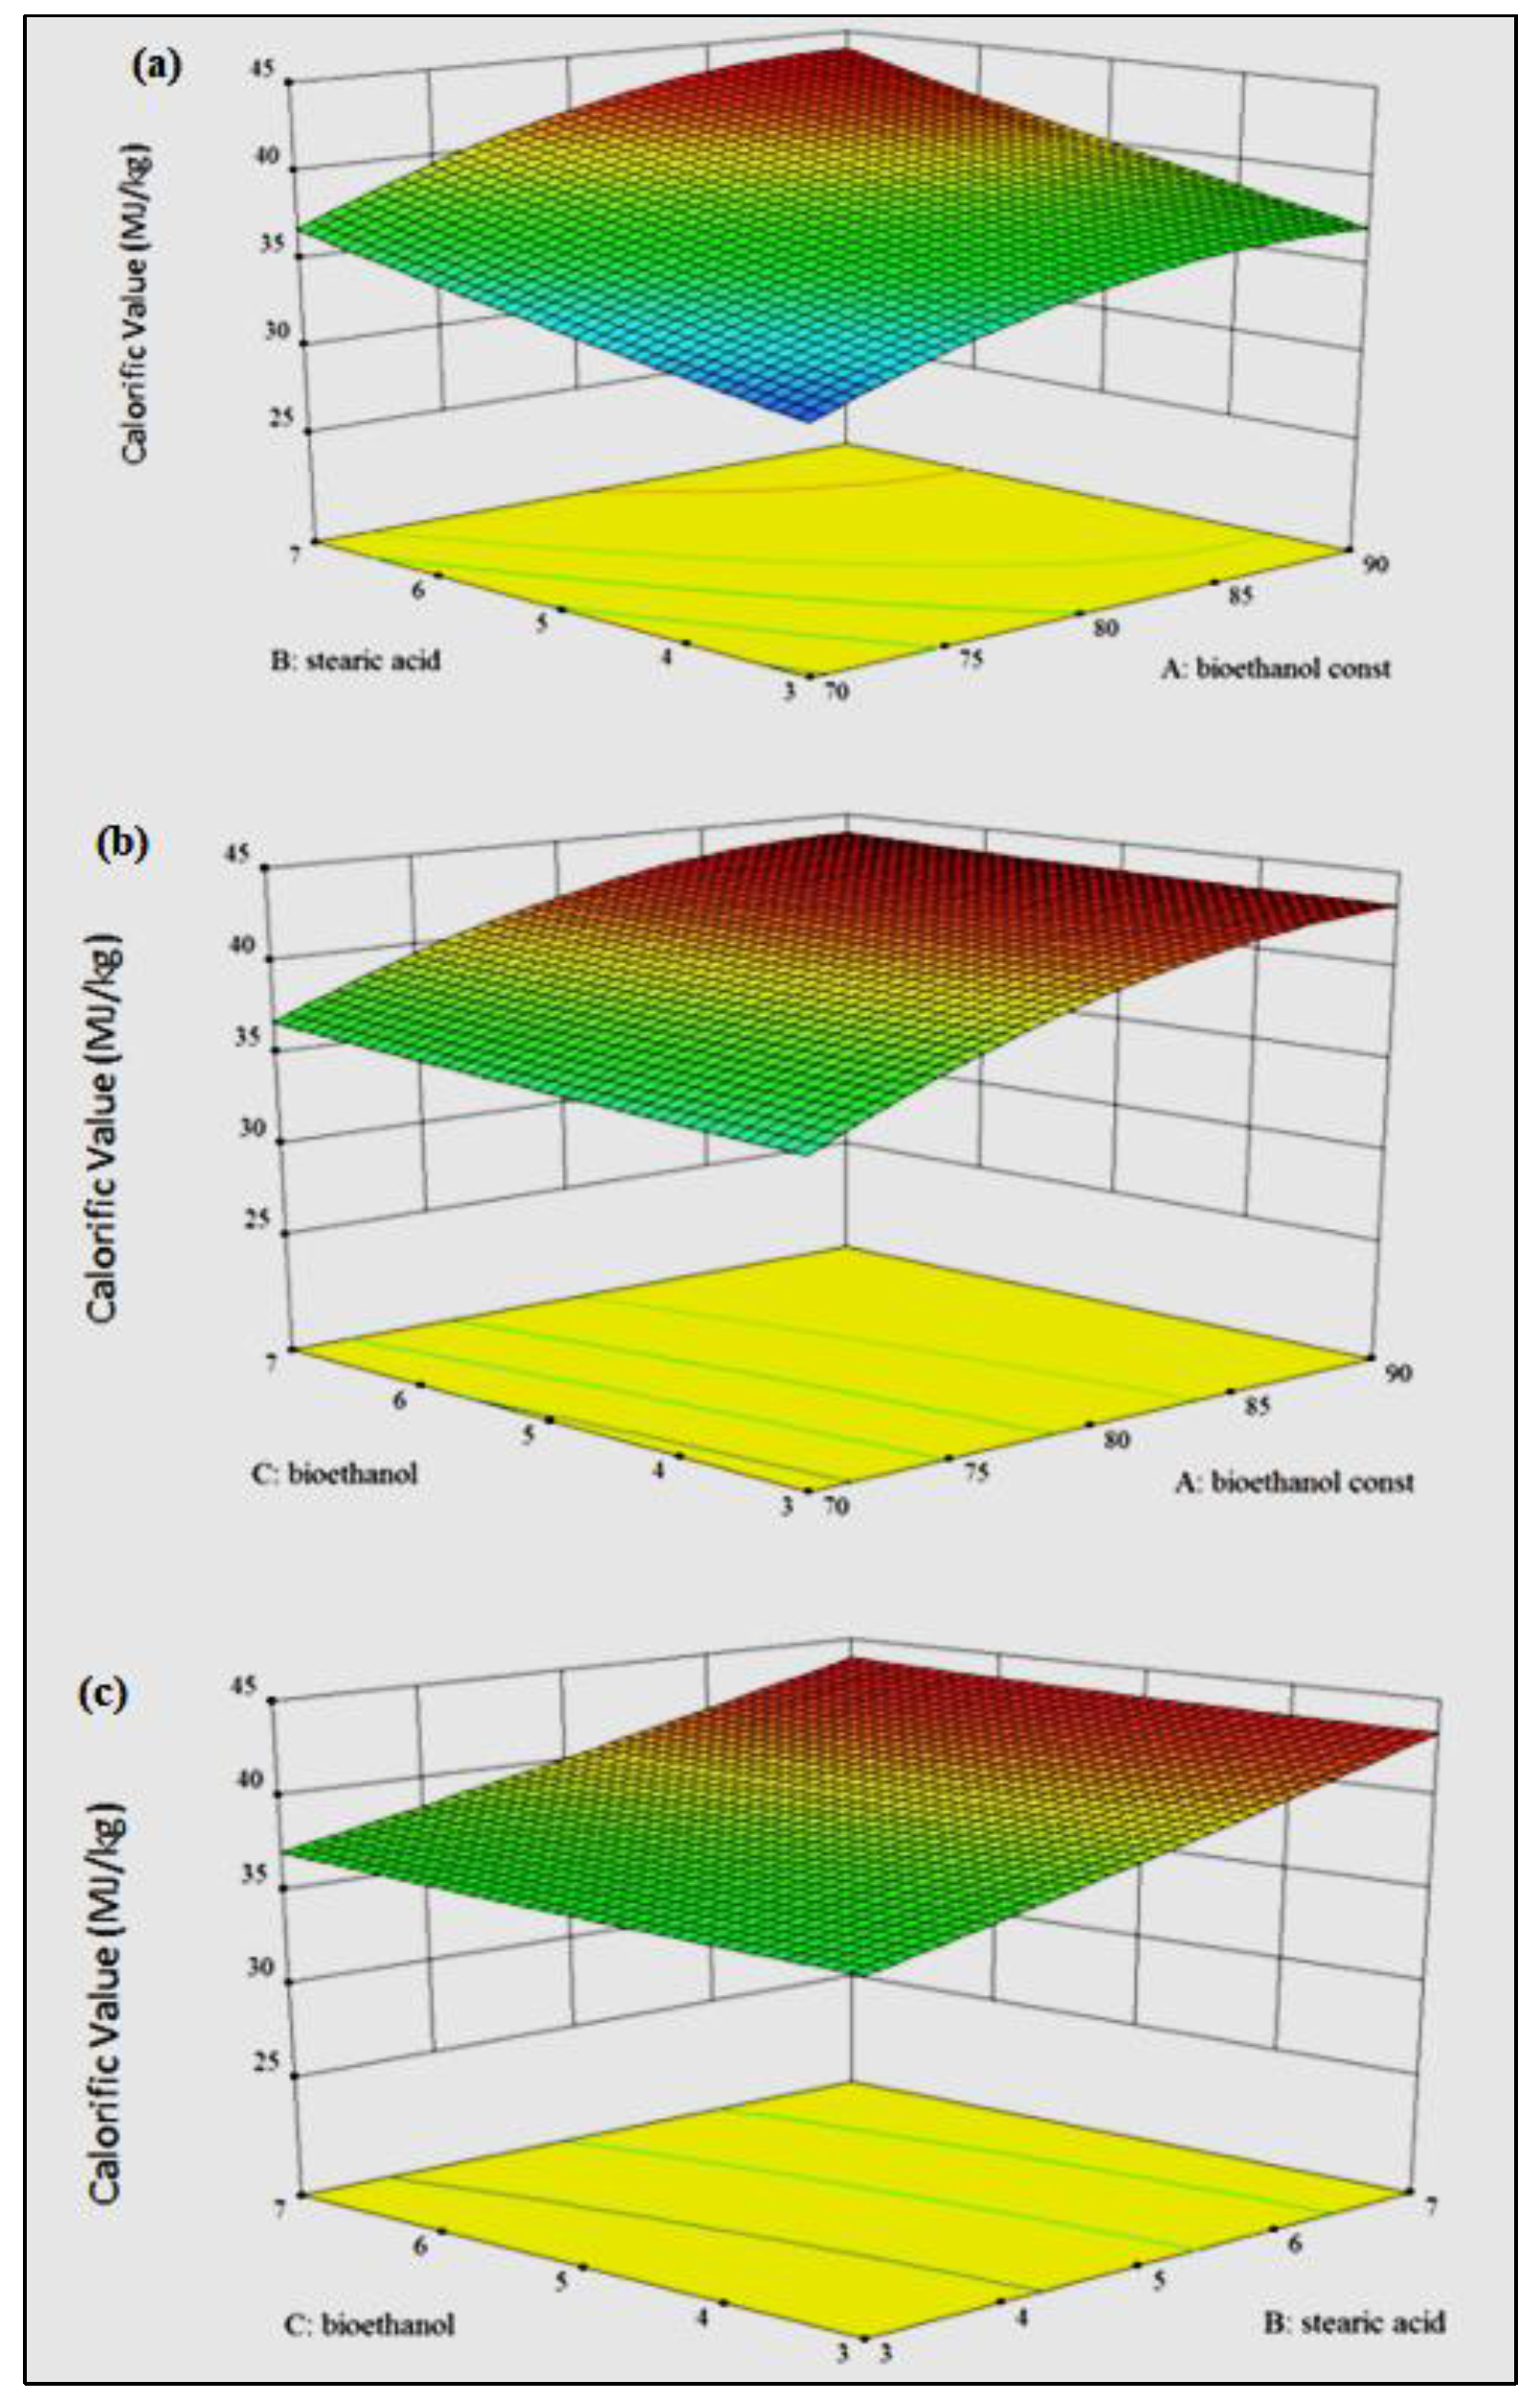
3.2.2. Effects of Independent Variables on Calorific Value

Solid bioethanol is an alternative for easily transported fuel. It was produced by adding stearic acid as the additive. The addition of stearic acid into different concentrations of bioethanol (70 vol %, 80 vol %, 90 vol %) was studied in order to optimize the calorific value of the solid bioethanol. Calorific value is one of the most important properties for fuel. Bioethanol in a liquid state has significantly lower calorific value compared to the solid state. The theoretical calorific value of ethanol is 29.3 MJ/kg. The liquid bioethanol in this study had different calorific values in each concentration. Bioethanol 70 vol %, 80 vol %, and 90 vol % had calorific values of 26.6 MJ/kg, 27.5 MJ/kg, and 28.3 MJ/kg, respectively. After the addition of stearic acid, the calorific value significantly increased above 30 MJ/kg due to the ratio of stearic acid and bioethanol and the concentration of bioethanol. The highest calorific value was 43.17 MJ/kg at a solid–liquid ratio of stearic acid and bioethanol 5:7 for 90% of bioethanol concentration. The increasing calorific value was due to the addition of stearic acid, which has a higher calorific value than liquid bioethanol (40.08 MJ/kg). The calorific value is affected by the number of carbonyl atoms (C) in molecules. Stearic acid (CH3 (CH2)16COOH) has 18 carbon atoms, whereas bioethanol (C2H5OH) has 2 carbon atoms. Hydrocarbon chains of those molecules reacted with oxygen (O2) with heat/flame.
The effects of bioethanol concentration and the ratio of stearic acid–bioethanol are presented in three-dimensional surface plots (see Figure 5a–c). Figure 5a,b illustrates that bioethanol concentration had a more significant influence on the results of calorific value compared with bioethanol volume and stearic acid. Furthermore, for a fixed bioethanol concentration, the increase of either bioethanol volume or stearic acid only increases the calorific value by a slight amount. In both cases, the highest calorific value was achieved for 90% ethanol. The higher bioethanol concentration regularly increased calorific value due to the volatility of bioethanol, which allows it conveniently to be burned. However, the solid–liquid ratio of stearic acid and bioethanol support the effect of bioethanol concentration. Figure 5c illustrates that stearic acid significantly affects the calorific value compared to bioethanol volume. For a fixed stearic acid, a variation of bioethanol volume has an insignificant effect on calorific value. The lack of stearic acid inhibits the formation of solid bioethanol, whereas the high amount inhibits the bioethanol vapor to be burned by heat. In this study, the highest calorific value was obtained at 90 vol % bioethanol concentration with 5 mL bioethanol and 7 g stearic acid.
However, the high calorific value of the solid bioethanol should be supported by shape and solidity for an efficient solid fuel. The solidity was observed before the optimization of the calorific value. The variables for solidity used are the same as the calorific value optimization variables using the Box–Behnken design. According to the study results, the solidity of the solid bioethanol was affected by the bioethanol concentration and the ratio of bioethanol and stearic acid. The best solidity form as well as the highest calorific value were obtained at a concentration of 90% bioethanol and at the solid–liquid ratio of 5:7 of stearic acid and bioethanol. The lowest solidity is shown in number 17, with a concentration of 70% bioethanol. It formed a water layer at the bottom with the ratio of stearic acid higher than bioethanol (3:5). The water layer seems to come from the higher water content bioethanol azeotrope in 70% of the bioethanol concentration.
The solid–liquid ratio of stearic acid and bioethanol also affected the solidity of the solid bioethanol. Sample numbers 1, 2, 3, 8, and 16 were produced using 80% bioethanol concentration in the different solid–liquid ratio of stearic acid and bioethanol, as presented in the experimental design in Table 2. The higher stearic acid content of sample 8 resulted in a too dense form which inhibited the vaporization of bioethanol to be burned out [60]. Sample number 3 containing 7:7 stearic acid and bioethanol produced the calorific value of 42.53 MJ/kg. It is insignificantly different from the highest calorific value (43.171 MJ/kg), which was obtained from sample number 11.
The burning test was performed in order to prove the feasibility of the solid bioethanol as solid fuel. The four highest calorific value samples were selected to be investigated because of the reference that calorific value is the main factor of flame temperature. The samples to be burned had a diameter of 3 in and a length of 4 cm. Table 4 shows that the longest burning time of the solid bioethanol, namely 177 min, was obtained from sample number 11, which had the highest calorific value. This shows that the highest calorific value profoundly influences the burning time of solid bioethanol. However, concentrations of 80% and 90% bioethanol seem to have insignificant burning time with different bioethanol–stearic acid ratios. Nonetheless, the higher concentration of bioethanol has a better effect on the flame as well as the addition of stearic acid.
According to its chemical reaction, one mole of bioethanol produces less CO2 than LPG (that mainly contains propane and butane) in combustion due to the lower carbon content per mole [61]. Those gases produce high carbon dioxide during the combustion. Burning bioethanol produced 2 moles of carbon dioxide in every reaction. Meanwhile, combustion reactions of the propane and butane content in LPG produce significantly higher carbon dioxide [62].
The combustion of solid bioethanol has the same reaction as liquid bioethanol. However, stearic acid increases the calorific value as well as the burning time of bioethanol in the solid state. According to the burning time test results in Table 4, samples 8 and 15, which have slightly different calorific value as compared to samples 4 and 11, generate a significantly lower burning time. It is due to the disproportionate amount of stearic acid content in the sample. As for samples 8 and 15, the stearic acid and bioethanol ratio is 7:3 and 5:7, respectively. A stearic acid content higher than bioethanol provided a better solid shape of the solid bioethanol. This affects the rate of bioethanol vaporization due to the tight polymerization of stearic acid, which inhibits the vaporization of bioethanol. Inversely, the lack of stearic acid leads to a shorter burning time due to the easy vaporization of bioethanol. In addition, adding a proper amount of stearic acid is an essential factor in obtaining a quality solid bioethanol. In this study, sample 11 generated the longest burning time as well as the highest calorific value. The burning of the solid bioethanol is shown in Figure 6.

4. Conclusions

This study was aimed at producing solid bioethanol from liquid bioethanol obtained from palm empty fruit bunches (PEFBs). The production of liquid bioethanol was carried out by organosolv pretreatment, enzymatic hydrolysis, and fermentation. Cellulose was employed to hydrolyze treated PEFBs into sugars. It resulted in 152.51 mg/L of sugar yield. Furthermore, the fermentation process resulted in 62.29 mg/L of bioethanol yield. The bioethanol was distilled by rotary evaporator 4 or 5 times at 70 °C to obtain concentrated bioethanol. The bioethanol was collected to produce solid bioethanol using stearic acid. The solid bioethanol was successfully produced and its calorific value was optimized by RSM. The optimization resulted in the highest calorific value of 43.17 MJ/kg at 5 mL bioethanol and 7 g stearic acid for a bioethanol concentration of 90 vol %. This value is significantly higher than the highest liquid bioethanol calorific value (28.3 MJ/kg). The viability of solid bioethanol was also proven by a burning test. The highest calorific value and the proper shape of the solid bioethanol affect its quality. Therefore, it can be concluded that solid bioethanol using stearic acid has the potential to be solid fuel with a high calorific value. However, further study is needed to determine and optimize the storage time of solid bioethanol.

Author Contributions

Original draft preparation, N.; Supervision, A.S.S., B.M.J. and H.C.O.; Review and Editing, F.K., A.H.S. and H.H.; Revision, M.M., T.M.I.M. and S.M.A.R.

Funding

This research received no external funding.

Acknowledgments

The authors acknowledge the University of Malaya, Malaysia for supporting this research through RU faculty grant (GPF021A-2019) and partnership grant (RK002-2019); School of Information, Systems and Modelling, University of Technology Sydney, Australia; Direktorat Jenderal Penguatan Riset dan Pengembangan Kementerian Riset, Teknologi dan Pendidikan Tinggi Republik Indonesia (Grant No. 147/SP2H/LT/DRPM/2019); and Politeknik Negeri Medan, Medan, Indonesia for supporting this research.

Conflicts of Interest

The authors declare no conflict of interest.

References

  1. Silitonga, A.S.; Masjuki, H.H.; Mahlia, T.M.I.; Ong, H.C.; Chong, W.T. Experimental study on performance and exhaust emissions of a diesel engine fuelled with Ceiba pentandra biodiesel blends. Energy Convers. Manag. 2013, 76, 828–836. [Google Scholar] [CrossRef]
  2. Mofijur, M.; Masjuki, H.H.; Kalam, M.A.; Atabani, A.E. Evaluation of biodiesel blending, engine performance and emissions characteristics of Jatropha curcas methyl ester: Malaysian perspective. Energy 2013, 55, 879–887. [Google Scholar] [CrossRef]
  3. Mofijur, M.; Masjuki, H.H.; Kalam, M.A.; Atabani, A.E.; Fattah, I.M.R.; Mobarak, H.M. Comparative evaluation of performance and emission characteristics of Moringa oleifera and Palm oil based biodiesel in a diesel engine. Ind. Crops Prod. 2014, 53, 78–84. [Google Scholar] [CrossRef]
  4. Chia, S.R.; Ong, H.C.; Chew, K.W.; Show, P.L.; Phang, S.M.; Ling, T.C.; Nagarajan, D.; Lee, D.; Chang, J. Sustainable approaches for algae utilisation in bioenergy production. Renew. Energy 2018, 129, 838–852. [Google Scholar] [CrossRef]
  5. Kusumo, F.; Silitonga, A.S.; Masjuki, H.H.; Ong, H.C.; Siswantoro, J.; Mahlia, T.M.I. Optimization of transesterification process for Ceiba pentandra oil: A comparative study between kernel-based extreme learning machine and artificial neural networks. Energy 2017, 134, 24–34. [Google Scholar] [CrossRef]
  6. Ong, H.C.; Milano, J.; Silitonga, A.S.; Hassan, M.H.; Shamsuddin, A.H.; Wang, C.T.; Mahlia, T.M.I.; Siswantoro, J.; Kusumo, F.; Sutrisno, J. Biodiesel production from Calophyllum inophyllum-Ceiba pentandra oil mixture: Optimization and characterization. J. Clean. Prod. 2019, 219, 183–198. [Google Scholar] [CrossRef]
  7. Pathak, G.; Singh, B.; Panigrahi, B.K. Wind-hydro microgrid and its control for rural energy system. IEEE Trans. Ind. Appl. 2019, 55, 3037–3045. [Google Scholar] [CrossRef]
  8. Ismail, M.S.; Moghavvemi, M.; Mahlia, T.M.I. Techno-economic analysis of an optimized photovoltaic and diesel generator hybrid power system for remote houses in a tropical climate. Energy Convers. Manag. 2013, 69, 163–173. [Google Scholar] [CrossRef]
  9. Uddin, M.N.; Techato, K.; Taweekun, J.; Rahman, M.M.; Rasul, M.G.; Mahlia, T.M.I.; Ashrafur, S.M. An Overview of Recent Developments in Biomass Pyrolysis Technologies. Energies 2018, 11, 3115. [Google Scholar] [CrossRef]
  10. Mofijur, M.; Mahlia, T.M.I.; Silitonga, A.S.; Ong, H.C.; Silakhori, M.; Hasan, M.H.; Putra, N.; Rahman, S.M.A. Phase Change Materials (PCM) for Solar Energy Usages and Storage: An Overview. Energies 2019, 12, 3167. [Google Scholar] [CrossRef]
  11. Amin, M.; Putra, N.; Kosasih, E.A.; Prawiro, E.; Luanto, R.A.; Mahlia, T.M.I. Thermal properties of beeswax/graphene phase change material as energy storage for building applications. Appl. Therm. Eng. 2017, 112, 273–280. [Google Scholar] [CrossRef]
  12. Mehrali, M.; Latibari, S.T.; Mehrali, M.; Mahlia, T.M.I.; Metselaar, H.S.C.; Naghavi, M.S.; Sadeghinezhad, E.; Akhiani, A.R. Preparation and characterization of palmitic acid/graphene nanoplatelets composite with remarkable thermal conductivity as a novel shape-stabilized phase change material. Appl. Therm. Eng. 2013, 61, 633–640. [Google Scholar] [CrossRef]
  13. Anwar, M.; Rasul, M.G.; Ashwath, N.; Rahman, M.M. Optimisation of Second-Generation Biodiesel Production from Australian Native Stone Fruit Oil Using Response Surface Method. Energies 2018, 11, 2566. [Google Scholar] [CrossRef]
  14. Goh, B.H.H.; Ong, H.C.; Cheah, M.Y.; Chen, W.; Yu, K.L.; Mahlia, T.M.I. Sustainability of direct biodiesel synthesis from microalgae biomass: A critical review. Renew. Sustain. Energy Rev. 2019, 107, 59–74. [Google Scholar] [CrossRef]
  15. Silitonga, A.; Shamsuddin, A.; Mahlia, T.; Milano, J.; Kusumo, F.; Siswantoro, J.; Dharma, S.; Sebayang, A.; Masjuki, H.; Ong, H.C. Biodiesel synthesis from Ceiba pentandra oil by microwave irradiation-assisted transesterification: ELM modeling and optimization. Renew. Energ. 2020, 146, 1278–1291. [Google Scholar] [CrossRef]
  16. Kusumo, F.; Silitonga, A.S.; Ong, H.C.; Masjuki, H.H.; Mahlia, T.M.I. A comparative study of ultrasound and infrared transesterification of Sterculia foetida oil for biodiesel production. Energ. Source. Part A 2017, 39, 1339–1346. [Google Scholar] [CrossRef]
  17. Ong, H.C.; Masjuki, H.H.; Mahlia, T.M.I.; Silitonga, A.S.; Chong, W.T.; Yusaf, T. Engine performance and emissions using Jatropha curcas, Ceiba pentandra and Calophyllum inophyllum biodiesel in a CI diesel engine. Energy 2014, 69, 427–445. [Google Scholar] [CrossRef]
  18. Silitonga, A.S.; Mahlia, T.M.I.; Kusumo, F.; Dharma, S.; Sebayang, A.H.; Sembiring, R.W.; Shamsuddin, A.H. Intensification of Reutealis trisperma biodiesel production using infrared radiation: Simulation, optimisation and validation. Renew. Energ. 2019, 133, 520–527. [Google Scholar] [CrossRef]
  19. Silitonga, A.S.; Mahlia, T.M.I.; Ong, H.C.; Riayatsyah, T.M.I.; Kusumo, F.; Ibrahim, H.; Dharma, S.; Gumilang, D. A comparative study of biodiesel production methods for Reutealis trisperma biodiesel. Energ. Source. Part A 2017, 39, 2006–2014. [Google Scholar] [CrossRef]
  20. RFA. World Fuel Ethanol Production Renewable Fuel Association; RFA: Washington, DC, USA, 2016. [Google Scholar]
  21. Lashinky, A.; Schwartz, N. How to beat the high cost of gasoline. Forever 2006. Available online: https://www.energy.gov/sites/prod/files/edg/media/gas_price_fact_sheet.pdf (accessed on 30 May 2019).
  22. Oktavia, H.T. Pemanfaatan Limbah Air Cucian Beras Sebagai Bahan Baku Pembuatan Bioetanol Padat Secara Fermentasi Oleh Saccharomyces cerevisiae; Diponegoro University: Semarang, Indonesia, 2014. [Google Scholar]
  23. TN Scientist. Alcohol in Solid Form? 2015. Available online: https://www.thenakedscientists.com/forum/index.php?topic=39961.0 (accessed on 12 December 2016).
  24. Chou, P.Y.; Fasman, G.D. Conformational parameters for amino acids in helical, β-sheet, and random coil regions calculated from proteins. Biochemistry 1974, 13, 211–222. [Google Scholar] [CrossRef] [PubMed]
  25. Tan, S.X.; Lim, S.; Ong, H.C.; Pang, Y.L. State of the art review on development of ultrasound-assisted catalytic transesterification process for biodiesel production. Fuel 2019, 235, 886–907. [Google Scholar] [CrossRef]
  26. Rahman, S.H.A.; Choudhury, J.P.; Ahmad, A.L.; Kamaruddin, A.H. Optimization studies on acid hydrolysis of oil palm empty fruit bunch fiber for production of xylose. Bioresour. Technol. 2007, 98, 554–559. [Google Scholar] [CrossRef] [PubMed]
  27. Galbe, M.; Zacchi, G. A review of the production of ethanol from softwood. Appl. Microbiol. Biotechnol. 2002, 59, 618–628. [Google Scholar] [CrossRef] [PubMed]
  28. Jørgensen, H.; Kristensen, J.B.; Felby, C. Enzymatic conversion of lignocellulose into fermentable sugars: Challenges and opportunities. Biofuels Bioprod. Biorefin. 2007, 1, 119–134. [Google Scholar] [CrossRef]
  29. Chandra, R.P.; Bura, R.; Mabee, W.E.; Berlin, A.; Pan, X.; Saddler, J.N. Substrate Pretreatment: The Key to Effective Enzymatic Hydrolysis of Lignocellulosics? In Biofuels; Olsson, L., Ed.; Springer: Berlin/Heidelberg, Germany, 2007; pp. 67–93. [Google Scholar]
  30. Nurfahmi; Ong, H.C.; Jan, B.M.; Tong, C.W.; Fauzi, H.; Chen, W. Effects of organosolv pretreatment and acid hydrolysis on palm empty fruit bunch (PEFB) as bioethanol feedstock. Biomass Bioenergy 2016, 95, 78–83. [Google Scholar] [CrossRef]
  31. Chen, H.; Qiu, W. Key technologies for bioethanol production from lignocellulose. Biotechnol. Adv. 2010, 28, 556–562. [Google Scholar] [CrossRef]
  32. Fernandes, M.C.; Ferro, M.D.; Paulino, A.F.C.; Mendes, J.A.S.; Gravitis, J.; Evtuguin, D.V.; Xavier, A.M.R.B. Enzymatic saccharification and bioethanol production from Cynara cardunculus pretreated by steam explosion. Bioresour. Technol. 2015, 186, 309–315. [Google Scholar] [CrossRef]
  33. Binod, P.; Sindhu, R.; Singhania, R.R.; Vikram, S.; Devi, L.; Nagalakshmi, S.; Kurien, N.; Sukumaran, R.K.; Pandey, A. Bioethanol production from rice straw: An overview. Bioresour. Technol. 2010, 101, 4767–4774. [Google Scholar] [CrossRef]
  34. Sharma, A.; Khare, S.K.; Gupta, M.N. Hydrolysis of rice hull by crosslinked Aspergillus niger cellulase. Bioresour. Technol. 2001, 78, 281–284. [Google Scholar] [CrossRef]
  35. Zhao, X.; Wang, L.; Liu, D. Peracetic acid pretreatment of sugarcane bagasse for enzymatic hydrolysis: A continued work. J. Chem. Technol. Biotechnol. 2008, 83, 950–956. [Google Scholar] [CrossRef]
  36. Da Silva, A.S.A.; Inoue, H.; Endo, T.; Yano, S.; Bon, E.P.S. Milling pretreatment of sugarcane bagasse and straw for enzymatic hydrolysis and ethanol fermentation. Bioresour. Technol. 2010, 101, 7402–7409. [Google Scholar] [CrossRef] [PubMed]
  37. Taherzadeh, M.J.; Karimi, K. Acid-based hydrolysis processes for ethanol from lignocellulosic materials: A review. BioResources 2007, 2, 472–499. [Google Scholar]
  38. Hamzah, F.; Idris, A.; Shuan, T.K. Preliminary study on enzymatic hydrolysis of treated oil palm (Elaeis) empty fruit bunches fibre (EFB) by using combination of cellulase and β 1-4 glucosidase. Biomass Bioenergy 2011, 35, 1055–1059. [Google Scholar] [CrossRef]
  39. Kamoldeen, A.A.; Lee, C.K.; Abdullah, W.N.W.; Leh, C.P. Enhanced ethanol production from mild alkali-treated oil-palm empty fruit bunches via co-fermentation of glucose and xylose. Renew. Energy 2017, 107, 113–123. [Google Scholar] [CrossRef]
  40. Fattah, S.S.A.; Mohamed, R.; Jahim, J.M.; Illias, R.M.; Bakar, F.D.A.; Murad, A.M.A. Commercial cellulases and hemicellulase performance towards oil palm empty fruit bunch (OPEFB) hydrolysis. AIP Conf. Proc. 2016, 1784, 020002. [Google Scholar]
  41. Sebayang, A.H.; Hassan, M.H.; Ong, H.C.; Dharma, S.; Silitonga, A.S.; Kusumo, F.; Mahlia, T.M.I.; Bahar, A.H. Optimization of Reducing Sugar Production from Manihot glaziovii Starch Using Response Surface Methodology. Energies 2017, 10, 35. [Google Scholar] [CrossRef]
  42. Kim, S.; Park, J.M.; Seo, J.; Kim, C.H. Sequential acid-/alkali-pretreatment of empty palm fruit bunch fiber. Bioresour. Technol. 2012, 109, 229–233. [Google Scholar] [CrossRef]
  43. Jung, Y.H.; Kim, I.J.; Han, J.; Choi, I.; Kim, K.H. Aqueous ammonia pretreatment of oil palm empty fruit bunches for ethanol production. Bioresour. Technol. 2011, 102, 9806–9809. [Google Scholar] [CrossRef]
  44. Dharma, S.; Masjuki, H.H.; Ong, H.C.; Sebayang, A.H.; Silitonga, A.S.; Kusumo, F.; Mahlia, T.M.I. Optimization of biodiesel production process for mixed Jatropha curcas–Ceiba pentandra biodiesel using response surface methodology. Energy Convers. Manag. 2016, 115, 178–190. [Google Scholar] [CrossRef]
  45. Silitonga, A.S.; Masjuki, H.H.; Ong, H.C.; Sebayang, A.H.; Dharma, S.; Kusumo, F.; Siswantoro, J.; Milano, J.; Daud, K.; Mahlia, T.M.I.; et al. Evaluation of the engine performance and exhaust emissions of biodiesel-bioethanol-diesel blends using kernel-based extreme learning machine. Energy 2018, 159, 1075–1087. [Google Scholar] [CrossRef]
  46. Phwan, C.K.; Chew, K.W.; Sebayang, A.H.; Ong, H.C.; Ling, T.C.; Malek, M.A.; Ho, Y.-C.; Show, P.L. Effects of acids pre-treatment on the microbial fermentation process for bioethanol production from microalgae. Biotechnol. Biofuels 2019, 12, 191. [Google Scholar] [CrossRef] [PubMed]
  47. Pan, X.; Fan, Z.; Chen, W.; Ding, Y.; Luo, H.; Bao, X. Enhanced ethanol production inside carbon-nanotube reactors containing catalytic particles. Nat. Mater. 2007, 6, 507–511. [Google Scholar] [CrossRef]
  48. Pan, X.; Gilkes, N.; Kadla, J.; Pye, K.; Saka, S.; Gregg, D.; Ehara, K.; Xie, D.; Lam, D.; Saddler, J. Bioconversion of hybrid poplar to ethanol and co-products using an organosolv fractionation process: Optimization of process yields. Biotechnol. Bioeng. 2006, 94, 851–861. [Google Scholar] [CrossRef] [PubMed]
  49. Pan, X.; Kadla, J.F.; Ehara, K.; Gilkes, N.; Saddler, J.N. Organosolv Ethanol Lignin from Hybrid Poplar as a Radical Scavenger: Relationship between Lignin Structure, Extraction Conditions, and Antioxidant Activity. J. Agric. Food Chem. 2006, 54, 5806–5813. [Google Scholar] [CrossRef] [PubMed]
  50. Cai, C.; Qiu, X.; Zeng, M.; Lin, M.; Lin, X.; Lou, H.; Zhan, X.; Pang, Y.; Huang, J.; Xie, L. Using polyvinylpyrrolidone to enhance the enzymatic hydrolysis of lignocelluloses by reducing the cellulase non-productive adsorption on lignin. Bioresour. Technol. 2017, 227, 74–81. [Google Scholar] [CrossRef] [PubMed]
  51. Nitsos, C.K.; Choli-Papadopoulou, T.; Matis, K.A.; Triantafyllidis, K.S. Optimization of Hydrothermal Pretreatment of Hardwood and Softwood Lignocellulosic Residues for Selective Hemicellulose Recovery and Improved Cellulose Enzymatic Hydrolysis. ACS Sustain. Chem. Eng. 2016, 4, 4529–4544. [Google Scholar] [CrossRef]
  52. Liu, Z.J.; Lan, T.Q.; Li, H.; Gao, X.; Zhang, H. Effect of bisulfite treatment on composition, structure, enzymatic hydrolysis and cellulase adsorption profiles of sugarcane bagasse. Bioresour. Technol. 2017, 223, 27–33. [Google Scholar] [CrossRef] [PubMed]
  53. Zhao, X.; Cheng, K.; Liu, D. Organosolv pretreatment of lignocellulosic biomass for enzymatic hydrolysis. Appl. Microbiol. Biotechnol. 2009, 82, 815–827. [Google Scholar] [CrossRef]
  54. Meryandini, A.; Widosari, W.; Maranatha, B.; Sunarti, T.C.; Rachmania, N.; Satria, H. Isolasi bakteri selulolitik dan karakterisasi enzimnya. Makara Sains 2009, 13, 33–38. [Google Scholar] [CrossRef]
  55. Volk, W.A.; Wheeler, M.F. Basic Microbiology; Benjamin Cummings: San Francisco, CA, USA, 1997. [Google Scholar]
  56. Connors, K.A. Chemical Kinetics; VCH Publishers Inc.: New York, NY, USA, 1990. [Google Scholar]
  57. Pacheco, A.M.; Gondim, D.R.; Gonçalves, L.R.B. Ethanol Production by Fermentation Using Immobilized Cells of Saccharomyces cerevisiae in Cashew Apple Bagasse. Appl. Biochem. Biotechnol. 2010, 161, 209–217. [Google Scholar] [CrossRef]
  58. Dias, M.O.S.; Modesto, M.; Ensinas, A.V.; Nebra, S.A.; Filho, R.M.; Rossell, C.E.V. Improving bioethanol production from sugarcane: Evaluation of distillation, thermal integration and cogeneration systems. Energy 2011, 36, 3691–3703. [Google Scholar] [CrossRef]
  59. Mohadesi, M.; Aghel, B.; Khademi, M.H.; Sahraei, S. Optimization of biodiesel production process in a continuous microchannel using response surface methodology. Korean J. Chem. Eng. 2017, 34, 1013–1020. [Google Scholar] [CrossRef]
  60. Yablonovitch, E. Inhibited Spontaneous Emission in Solid-State Physics and Electronics. Phys. Rev. Lett. 1987, 58, 2059–2062. [Google Scholar] [CrossRef] [PubMed] [Green Version]
  61. Grimm, H.P.; Helm, P.; Grassi, G.; Lutter, E.; Fjaellstroem, T.; Dong, W. Fostering EU-China cooperation in the development of the biomass fuelled heating and cooking stove market in China. In Proceedings of the 12th European Conference on Biomass Energy Industry and Climate Protection, Amsterdam, The Netherlands, 17–21 June 2002. [Google Scholar]
  62. Gardoner, J.W.C. Gas Phase Combustion Chemistry; Springer: New York, NY, USA, 2000. [Google Scholar]
Figure 1. Solid bioethanol production by mixing bioethanol and stearic acid.
Processes 07 00715 g001
Figure 2. Effect of temperature on sugar yield during the enzymatic hydrolysis process using 60 FPU/g cellulose (organosolv pretreatment at conditions of 55% volume ethanol, temperature of 120 °C, and reaction time of 60 min).
Processes 07 00715 g002
Figure 3. Ethanol yield and sugar yield residue of enzymatic hydrolyzed PEFBs at every 12 h of fermentation.
Processes 07 00715 g003
Figure 4. Plot of experimental and predicted calorific value.
Processes 07 00715 g004
Figure 5. Three-dimensional surface plot for the effects of (a) bioethanol concentration and stearic acid; (b) volume bioethanol and bioethanol concentration; (c) volume bioethanol and stearic acid.
Processes 07 00715 g005
Figure 6. (a) Solid bioethanol after shaping. (b) Solid bioethanol burning.
Processes 07 00715 g006
Table 1. Pros and cons of organosolv pretreatment process compared to other processes [42].
Pretreatment MethodProsCons
Milling- Reduces cellulose crystallinity
- Reduces polymerization degree
- Reduces particle size
- Increases specific surface area and pore size
- Significantly increases power and energy consumption
Steam explosion- Improves lignin transformation and hemicellulose solubilization
- Reduces cost
- Increases glucose and hemicellulose yield in a two-step method
- Increases toxic compound generation
- Degrades hemicellulose partially
Liquid hot waterThe following are not required:
- Biomass size reduction
- Chemicals
- Corrosion-resistant materials
- Increases energy and water consumption
- Increases toxic compound generation
Ammonia fiber expansion (AFEX)- Increases available surface area
- Reduces inhibitor formation
- Reduces use of small biomass particle size
- Not suitable with high lignin content biomass
- Increases ammonia cost
CO2 explosion- Increases available surface area
- Available at low cost
- No inhibitory compound formation
- Non-flammability
- Ease of recovery after extraction and environmental acceptability
- Requires significantly high pressure
Wet oxidation- Increases hemicellulose and lignin solubilization degree
- Reduces degradation compound formation
- Increases oxygen and alkaline catalyst cost
Concentrated acid- Increases glucose yield
- Ambient temperatures
- Increases acid cost which needs to be recovered
- Requires corrosion-resistant equipment
- Toxic and hazardous concentrated acid formation
Diluted acid- Increases sugar yield at the end of the process
- Reduces toxic product formation
- Low reducing sugar concentration
- Formulation of degradation products
Alkali- Decreases polymerization degree and crystallinity of cellulose
- Disruption of lignin structure
- Increases cost significantly
- Not suitable for large-scale plant
Ozonolysis- Removes lignin content
- Reduces production of toxic residues
- Reaction takes place at room temperature and pressure
- Cost significantly increases due to large ozone amount
Organosolv- Causes lignin and hemicellulose hydrolysis- Requires draining and recycling of solvents
- Cost significantly increases
Biological- Reduces energy consumption
- Delignification
- Reduces cellulose polymerization degree
- Partial hydrolysis of hemicelluloses
- Requires no chemical
- Requires moderate environmental conditions
- Reduces process rate
- Significantly lowers treatment rate
- Not suitable for commercial application
Table 2. Experimental design for optimization of solid bioethanol calorific value by Box–Behnken design.
RunA (Bioethanol Concentrations (%))B (Stearic Acid (mg))C (Bioethanol (mL))Experimental Results of Calorific Value (MJ/kg)Calorific Value Prediction (MJ/kg)
1805538.10138.07
2803334.02734.50
3807742.5342.06
4805538.50338.07
5707535.7235.76
6805538.08638.07
7903536.46336.43
8807340.73840.88
9705733.58234.02
10805537.57738.07
11907543.17143.47
12805538.08938.07
13905339.87939.45
14705332.2832.10
15905740.16440.34
16803736.26136.12
17703530.7630.47
Table 3. Analysis of variance by ANOVA.
SourceSum of SquareDegree of FreedomMean SquareF-Valuep-Value (Prob > F)Remarks
Model186.97920.7795.50<0.0001Significant
A-bioethanol concentration93.40193.40429.37<0.0001
B-stearic acid 75.94175.94349.10<0.0001
C-bioethanol3.9413.9418.100.0038
AB0.7610.763.510.1031
AC0.2610.261.190.3117
BC0.04910.0490.220.65
A212.57112.5757.780.0001
B20.1410.140.660.4424
C20.07410.0740.340.5775
Residual1.5270.22
Lack of fit1.0930.363.370.1358Not significant
Pure error0.4340.11
Cor total188.4916
R-squared0.9919 Adjusted R20.9815
Mean37.41 Predicted R20.9038
Coefficient of variation %1.25 Adequate precision36.330
Table 4. Burning time test results for the solid bioethanol with the highest calorific value.
SamplesBioethanol Concentration (%)Stearic Acid (mg)Volume Bioethanol (mL)Calorific Value (MJ/kg)Burning Time (min)
4805542.53143
8807340.73825
11907543.171177
15905740.16434

