

Can Celecoxib Assay in Preclinical Studies Be Improved?


1
Faculty of Pharmacy, University of Coimbra, 3000-548 Coimbra, Portugal
2
Coimbra Chemistry Centre, Institute of Molecular Sciences—IMS, Faculty of Sciences and Technology, University of Coimbra, 3004-535 Coimbra, Portugal
*
Author to whom correspondence should be addressed.
Processes 2023, 11(2), 431; https://doi.org/10.3390/pr11020431
Submission received: 30 December 2022
/
Revised: 16 January 2023
/
Accepted: 24 January 2023
/
Published: 1 February 2023
(This article belongs to the Section Pharmaceutical Processes)
Abstract
:Celecoxib, a cyclooxygenase-2 inhibitor (COX-2), is attracting considerable interest owing to its potential anticancer activity. The repurposing strategy of this drug, however, requires preclinical assessment involving the use of increasingly improved analytical methods. In this work, a rapid, accurate, precise, and sensitive reversed-phase high-performance liquid chromatography (RP-HPLC) method was developed for the quantification of celecoxib in five mouse matrices (plasma, brain, spleen, liver, and kidney). Chromatographic separation was achieved within 8 min on a reversed-phase C18 column at 35 °C using a mixture of acetonitrile and 2% (v/v) acetic acid (50:50) as mobile phase, at a flow rate of 0.6 mL/min. Celecoxib and curcumin, as the internal standard, were analyzed at 425 nm and 250 nm, respectively. Linearity was observed (r2 ≥ 0.996) in the concentration ranges selected for celecoxib. Overall precision was below 14.9%, and accuracy was between −14.9% and 13.2%. The acceptance criteria specified in FDA and EMA guidelines were met. Celecoxib was reproducibly recovered (≥84%) and showed stability in all biological matrices at room temperature for 24 h. The method was then effectively applied for the quantification of celecoxib to understand in vivo biodistribution following its intraperitoneal administration in mice.
1. Introduction
Celecoxib is a selective COX-2 inhibitor broadly used in clinical settings as a non-steroidal anti-inflammatory drug (NSAID) [1] and has been demonstrated to be effective in the treatment of inflammatory diseases, such as rheumatoid arthritis and osteoarthritis, acute pain, ankylosing spondylitis, and primary dysmenorrhea. However, the quest for new therapeutic uses for celecoxib, also known as a drug repositioning strategy, has highlighted its application in the treatment of cancer [2,3]. This approach provides a more rapid path to drug development and market approval, with lower costs and fewer associated risks.
Celecoxib is a class II drug of the biopharmaceutical classification system (BCS), meaning that it presents low solubility and high permeability through the membranes, and consequently its therapeutic efficiency may be compromised by the physicochemical characteristics. The latter include aqueous solubility (4.3 mg/mL) and octanol/water partition coefficient (Log P = 3.53) [4,5]. Considering its physicochemical properties, the incorporation of celecoxib into nanoparticles has been investigated to overcome the structural limitations and improve its pharmacokinetic and pharmacodynamic parameters, safety, and in vivo stability (high protein-bound or extensive hepatic metabolism) [6,7,8]. Prior to the assessment of the impact of drug encapsulation, the in vivo biodistribution behavior of drug in solution must be explored.
This work aimed to streamline the sample preparation step resorting to protein precipitation while shortening the chromatographic run time using a selective high-performance liquid chromatography (HPLC) method. Different bioanalytical HPLC methods have been established to quantify CXB in human plasma and animal matrices [9,10,11,12,13]. However, the methods reported in the literature used more complex mobile phases, requiring buffer solutions (e.g., sodium acetate buffer at pH 4.5), high flow rates, and more extended retention times [9,14,15]. The present method showed good sensitivity, precision, and accuracy in mouse matrices (plasma, brain, spleen, liver, and kidney). A suitable internal standard was used to increase the precision and accuracy of the method. These improvements enabled the development of a less time-consuming, cost-effective, and sensitive HPLC method for the determination of celecoxib in five mice matrices that complies with the US Food and Drug Administration (FDA) and European Medicines Agency (EMA) guidelines [16,17]. The method was effectively applied to a pharmacokinetic study.
2. Materials and Methods
2.1. Materials
Celecoxib (98.0~102.0% purity) was obtained from Shandong Zhishang Chem Co., Ltd. (Zhangqiu, China). Curcumin (97% purity), the internal standard considered in this study, was acquired from Jinham Pharm-Drugs Technology Co. Limited (Hangzhou, China). Atorvastatin calcium (ATO) was supplied by the Tecnimede Group (Sintra, Portugal). Acetic acid glacial was purchased from Carlo Erba Reagents (Milan, Italy). The HPLC gradient-grade acetonitrile and methanol were acquired from Fisher Scientific (Leicestershire, UK). The remaining solvents and reagents were of analytical or HPLC grade. Ultrapure water (HPLC grade, >18 M Ω cm at 25 °C) was obtained using a Sartorius Arium® Pro Ultrapure Water System from Sartorius (Göttingen, Germany).
2.2. Blank Mouse Plasma and Tissue
Healthy adult male (n = 10) and female (n = 10) Swiss Nu/Nu mice (10–14 weeks old) were acquired from Charles River Laboratories (Lyon, France) and used to obtain the biological tissues and blank plasma required for the proposed validation studies. Animals were upheld with 12 h light/dark cycles, at a temperature of 20 ± 2 °C and relative humidity of 50 ± 5% and fed with a standard laboratory diet and water ad libitum. Animal experiments were steered in accordance with the European Council Directives (European Directive 2010/63/EU regarding the protection of laboratory animals used for scientific purposes) and with the Portuguese law on animal welfare (Decreto-Lei 113/2013) and approved by the Portuguese National Authority for Animal Health, Phytosanitation and Food Safety (DGAV—Direção-Geral de Alimentação e Veterinária, Lisbon, Portugal, project reference 0421/000/000/2016).
Mice were subjected to a high concentration of isoflurane anesthesia. The whole blood was collected by cardiac puncture and harvested into lithium heparin tubes, and the tissues (brain, liver, spleen, and kidney) were removed. Then, the blood samples were submitted to a centrifugation cycle at 2880× g for 10 min at 4 °C, and the supernatants were separated to obtain plasma samples, which were stowed at −20 °C until use. The brain, liver, and kidney tissues were weighed and homogenized with a water–acetonitrile (1:1, v/v) solution (4 mL per g of tissue) using a Thomas® (Swedesboro, NJ, USA) Teflon pestle tissue homogenizer. The tissue homogenates were centrifuged at 4150× g for 15 min at 4 °C. In the specific case of the spleen, regardless of weight, it was homogenized with 1 mL of the same aqueous acetonitrile solution and centrifuged (4150× g for 15 min at 4 °C). The resulting supernatants of the tissue homogenates were also harvested and stored at −20 °C until use.
2.3. Stock Solutions and Standards
The stock solution of CXB was prepared at a concentration of 1 mg/mL and dissolved in the appropriate volume of acetonitrile. Working solutions were diluted daily in pure acetonitrile at the concentrations of 0.1 mg/mL and 0.01 mg/mL, to further yield several working solutions that were used to prepare the calibration curves. The final concentrations of the six calibration standards for CXB in each mouse matrices are presented in Table 1. Four levels of quality controls (QCs) were independently prepared: lower limit of quantification (QCLLOQ), low QC (QC1), medium QC (QC2), and high QC (QC3). QC1 should be approximately twice the QCLLOQ, while QC2 should be between 30% and 50% of the calibration curve range, and QC3 concentration should be at least 75% of the upper limit of quantification. The stock solution (1 mg/mL) of the internal standard (IS) was also prepared in pure ACN and correctly diluted to obtain three working solutions with the final concentrations of 25 μg/mL (brain homogenate supernatant), 50 μg/mL (plasma and spleen homogenate supernatant), and 100 μg/mL (liver and kidney homogenate supernatants). The stock solutions were stored at −20 °C. They are stable for 15 days under these storage conditions [18].
2.4. HPLC Instrumentations and Chromatographic Conditions
The chromatographic analysis of celecoxib and IS was performed on a Shimadzu LC-2010C HT apparatus (Shimadzu Co., Kyoto, Japan) equipped with an SPD-M20A photodiode array detector, a quaternary pump, and a CTO-10AS oven. The separation of CXB and IS was carried out using a reversed-phase LiChroCART® Purospher Star column with 3-μm particle size, 4-mm internal diameter, and 55-mm length (Merck KGaA, Darmstadt, Germany). The analysis was conducted in isocratic mode with a mobile phase consisting of a mixture of acetonitrile (ACN):2% (v/v) acetic acid (50:50, v/v) at a flow rate of 0.6 mL/min. The detection of celecoxib and IS (curcumin) was carried out at 250 and 425 nm, respectively.
2.5. Sample Preparation and Extraction Procedure
Optimal conditions for sample preparation and drug extraction were carried out as described in what follows. Each aliquot of plasma or tissue homogenate was prepared according to the Table 2. Plasma and tissue homogenate were spiked with IS working solution and ACN was added to precipitate the proteins. For the plasma and spleen samples, the mixture was vortex-mixed for 2.5 min, centrifuged at 12,045× g for 5 min, and filtered through a 0.22-μm polytetrafluoroethylene (PTFE) membrane before injection into the chromatographic system. For the brain, kidney, and liver, the mixture was vortex-mixed for 2.5 min, centrifuged at 12,045× g for 5 min, and filtered through a 0.22-μm PTFE membrane. Hence, 500 or 1000 μL of the brain and liver/kidney supernatants, respectively, were evaporated to dryness under a nitrogen stream at 55 °C. To reconstitute the residues, 100 μL of ACN were used, and aliquots were injected into the HPLC system.
2.6. Method Validation
The bioanalytical method developed was fully validated with respect to the EMA and FDA bioanalytical method validation guidelines [16,17]. The validated parameters include selectivity, calibration curve and range, carryover effect, specificity, accuracy, precision, linearity, limits of quantification and detection, recovery, and stability.
2.6.1. Selectivity
Selectivity stands for the ability of the method to discriminate and measure the analyte in the presence of interferents in the blank biological matrix. This parameter was evaluated by comparing blank samples (matrix samples processed without the addition of an analyte or IS) and samples handled through the proposed preparation protocol and examining for the existence of endogenous interfering peaks at the exact retention times of the analytes (CXB and IS). Supernatants of blank matrices (plasma, brain, kidneys, liver, and spleen) were collected from six different mice.
2.6.2. Calibration Curves and Lower Limits of Quantification
Six calibration standards containing CXB and spiked with IS were prepared for plotting the calibration curves, within the concentration ranges defined in Table 1, for each mouse matrix studied and analyzed on five different days. The curves were built by representing the analyte/IS peak area ratio versus nominal concentrations. The linearity for each of the mouse matrices was evaluated by linear regression analysis using the least square methodology, with 1/x2 as the weighting factor.
LLOQ is described as the lowest concentration of the calibration curve that can be consistently quantified, with acceptable intra- and inter-day precision and accuracy, not exceeding 20% [16,17]. Precision is stated as the percentage of the coefficient of variation (CV), and the accuracy as the percentage of the deviation from the nominal concentration (bias). For all mouse matrices, the LLOQ was assessed considering five replicates analyzed on a single day and on three consecutive days for all matrices.
2.6.3. Recovery and Carryover Effect
The recoveries of celecoxib obtained from all mouse matrices under study were calculated dividing, for the same nominal concentrations, the peak area ratio (analyte/IS) of extracted samples by the corresponding one retrieved from the non-extracted working solutions. Such procedure was repeated five times (n = 5) for the three concentration levels (QC1, QC2, and QC3). The recovery of IS was also determined following the same procedure, but comparing the peak areas retrieved at the concentration employed in sample analysis. A recovery closer to 100% is highly desired [16,17].
The carryover effect was assessed through the injection of blank samples after the calibration standards corresponding to the upper limit of concentration of the calibration curves. Acceptability criteria were set forth in consistency with the guidelines, which indicates that the carryover in the blank sample following the high concentration standard should be below 20% of the LLOQ and 5% of the IS [16,17].
2.7. Stability
The stability of the CXB was evaluated in all the mouse matrices and with two concentration levels (QC1 and QC3) in four replicates. It was assessed by comparing assay values in freshly prepared and extracted QC samples under different temperature and time conditions. The stability acceptance criteria define that the stability/reference ratio at each level should be within ±15%. For the short-term stability, the QCs samples were tested after storage at room temperature for 24 h, simulating the HPLC autosampler conditions.
2.8. Method Application
The pharmacokinetic study of CXB was carried out in Swiss Nu/Nu mice (healthy adult male, n = 9 and female, n = 9) 10 weeks old and weighted 25–30 g. The HPLC method proposed was applied to a pharmacokinetic study to quantify CXB in plasma and brain, liver, and spleen tissues, in a single dose (20 mg/Kg). CXB was solubilized in PEG 400:saline (2:1, v/v) for intraperitoneal administration. The animals were euthanized at predetermined post-dosing time points (0.5, 1, 3, 6, 24, and 30 h, three animals per time point), whole blood was harvested using cardiac puncture, and biological samples were immediately processed, as aforementioned.
The pharmacokinetic parameters encompassing the maximum peak concentration (Cmax), the corresponding time to reach Cmax (tmax), half-life time (t1/2), the area under the concentration time-curve from time zero to infinite (AUC0-inf), the area under the concentration time-curve from time zero to the previous measurable drug concentration (AUC0-last), and the mean residence time (MRT) were extracted from the experimental data obtained. The non-compartmental model and the mean concentration values were considered for each time point. PKSolver, a freely available, menu-driven add-in program for Microsoft Excel, was employed for the estimation of the remaining pharmacokinetic parameters [19].
The drug selectivity index (DSI), which relates to the organ-to-plasma partitioning ratio of the drug administered by intraperitoneal injection to mice, was determined according to
where AUCorgan and AUCplasma stand for the areas under the drug concentration–time curves for a determined organ and plasma, respectively.
3. Results and Discussion
3.1. Method Validation
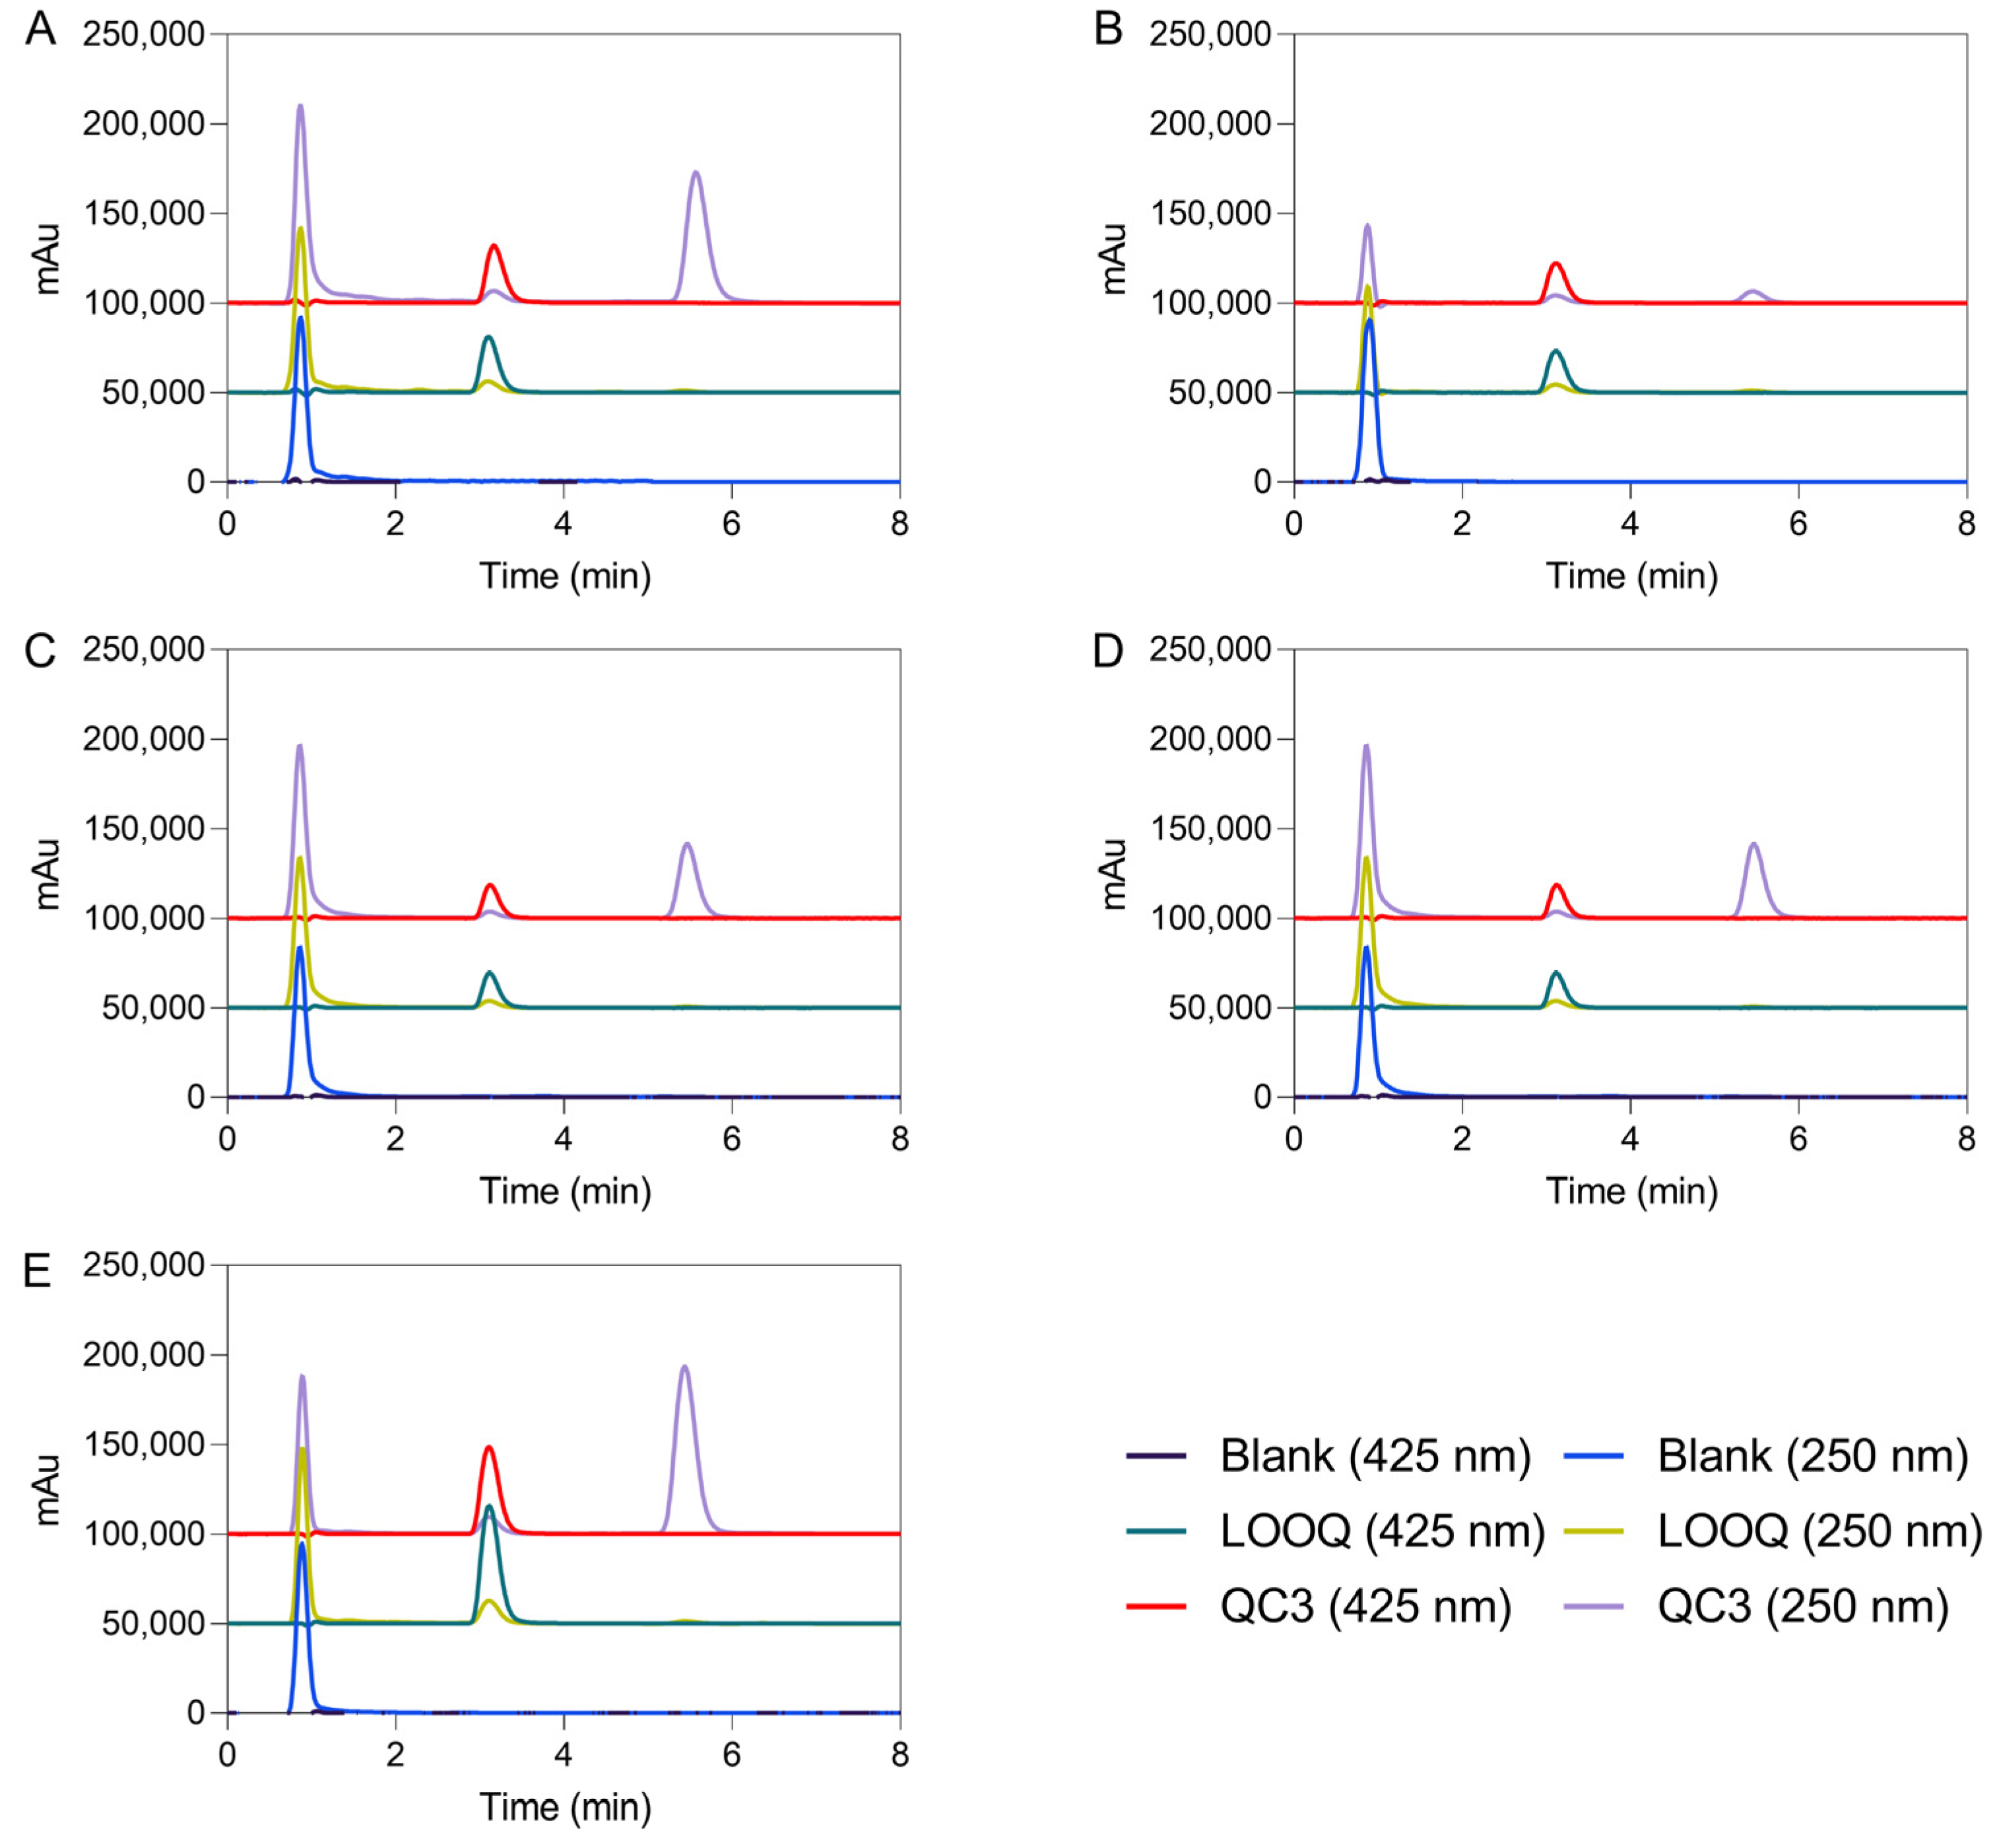
Based on the previous analytical method validation using atorvastatin, curcumin, and celecoxib, a combination of ACN, methanol (MeOH), and 2% (v/v) acetic acid (37.5:2.5:60) was firstly selected, as it can be confirmed elsewhere [13,18]. The internal standard was chosen to resemble the behavior of the sample compound in extraction steps. Two compounds, such as atorvastatin and curcumin, with similar lipophilicity, were tested to achieve a suitable internal standard. A flow rate of 0.6 mL/min and an ACN-2% (v/v) acetic acid proportion of 50:50 were used to obtain clean chromatograms with biological matrices. Methanol was removed, and the ratio between ACN and acetic acid was equaled to improve the resolution peak of celecoxib. In turn, atorvastatin did not exhibit a good peak resolution in this method condition. So, curcumin was considered an appropriate internal standard, and the samples were handled with the required precautions, including light protection and acidic pH values. The analysis time was 8 min. The selectivity and sensitivity were inspected at 425 and 250 nm for curcumin and celecoxib, respectively, which refers to the maximum absorbance wavelength of each drug. Under these conditions, the chromatographic elution times of curcumin and celecoxib in biological matrices were 3.12 and 5.55 min, respectively.
Blank biological matrices were examined by HPLC considering the same conditions, and there were no endogenous peaks at the retention positions of the analyte and IS to interfere with the analysis of samples (see Figure 1). The selectivity of the method was inspected by separate analysis of interfering samples. Solutions containing internal standard, blank, and samples from five different matrices were investigated.
The subsections that follow provide the description and thorough interpretation of the validation parameters.
3.1.1. Linearity
Calibration curves for celecoxib were plotted in different mice matrices as described before, and its linearity was evaluated with six calibration curves for each matrix. Linear calibration curves were constructed over the concentration ranges and are shown in Table 3 for each mice matrix. The extraction procedure, protein precipitation method, and HPLC analysis described above were performed on the calibration samples. The calibration curves were built by plotting the peak area ratios (celecoxib/IS) as a function of the corresponding nominal concentrations. The weighted (1/x2) linear regression was employed to perform the calibration curves, giving a mean linear regression equation. Table 3 shows that the calibration curve parameters (mean slope ± SD and mean intercept ± SD) and the correlation coefficients (R2) for all calibration curves were over 0.996, which represents good linearity in the investigated concentrations for celecoxib in all matrices.
3.1.2. Limit of Quantification, Precision, and Accuracy
The LLOQs of celecoxib were determined by visual inspection, and intra-day and inter-day precision and accuracy are presented in Table 4, given by CV and bias, respectively. The LLOQ was described as the lowest concentration of a sample that can still be quantified, and the results conform to the acceptance criteria required by FDA and EMA (%CV < 20% for precision and% bias ± 20% for accuracy). The highest CV value for the LLOQ samples was identified in plasma (18.72%), and the wider bias values were −14.0 (in spleen homogenate supernatant), –7.70% (in liver homogenate supernatant), 1.56% (in brain homogenate supernatant), 3.90% (in kidney homogenate supernatant), and 10.6% (in plasma).
Moreover, the quality of the calibration curve is defined by its linearity and by the experimental concentrations of quality control (QC1, QC2, and QC3) samples, where QCs did not make derivatives more than ±15% from nominal concentrations. The precision of QCs varied from 3.23 to 11.3; 4.81 to 12.1; 2.50 to 14.9; 5.04 to 12.3; and 2.36 to 12.7, in plasma, brain, spleen, liver, and kidneys, respectively. The corresponding accuracy varied from −14.9 to 8.10; −0.44 to 13.2; −14.7 to 1.67; −5.10 to 8.90; and −5.52 to 6.44, in plasma, brain, spleen, liver, and kidneys, respectively.
The acceptance criteria defined by FDA and EMA guidance were satisfied for celecoxib at the four quality control levels (LLOQ, QC1, QC2, and QC3).
3.1.3. Recovery and Carryover Effect
The complete recovery of celecoxib from the five studied matrices was estimated at the concentration levels (QC1, QC2, and QC3), and the information is summarized in Table 5. The complete recovery for celecoxib was estimated through the calculation of the ratios of the raw peak areas of the pre-extraction spiked samples to those of the samples spiked after extraction and the extraction of the IS. The mean absolute recoveries for celecoxib were between 84% in plasma and 103% in brain homogenate supernatant, exhibiting a CV value of 3.80% and 8.51%, respectively. The recovery for the IS was also assessed and the mean values were 93.71 ± 8.58 (CV % = 9.15), 102.4 ± 6.61 (CV % = 6.45), 85.93 ± 4.24 (CV % = 4.93), 96.45 ± 12.05 (CV % = 12.51), and 99.5 ± 7.48 (CV % = 7.61) for plasma, brain, spleen, liver, and kidneys, respectively. The CV values below 15% and the high recovery values obtained suggest that the proposed sample preparation and extraction method provides a precise, consistent, and reproducible recovery over concentration ranges. Additionally, no carryover effect was identified during method development. The chromatograms of blank mouse matrices injected after the upper limit of quantification did not show any peak contamination of the celecoxib.
3.1.4. Stability
The stability of celecoxib in the six mouse matrices was assessed considering only one experimental condition (24 h at room temperature) after being processed. The results are displayed in Table 6. The stability of celecoxib is ensured in plasma and tissue homogenate supernatant in the tested condition since the stability acceptance criteria (±15%) have been fulfilled at medium and high concentration levels.
3.2. Method Application
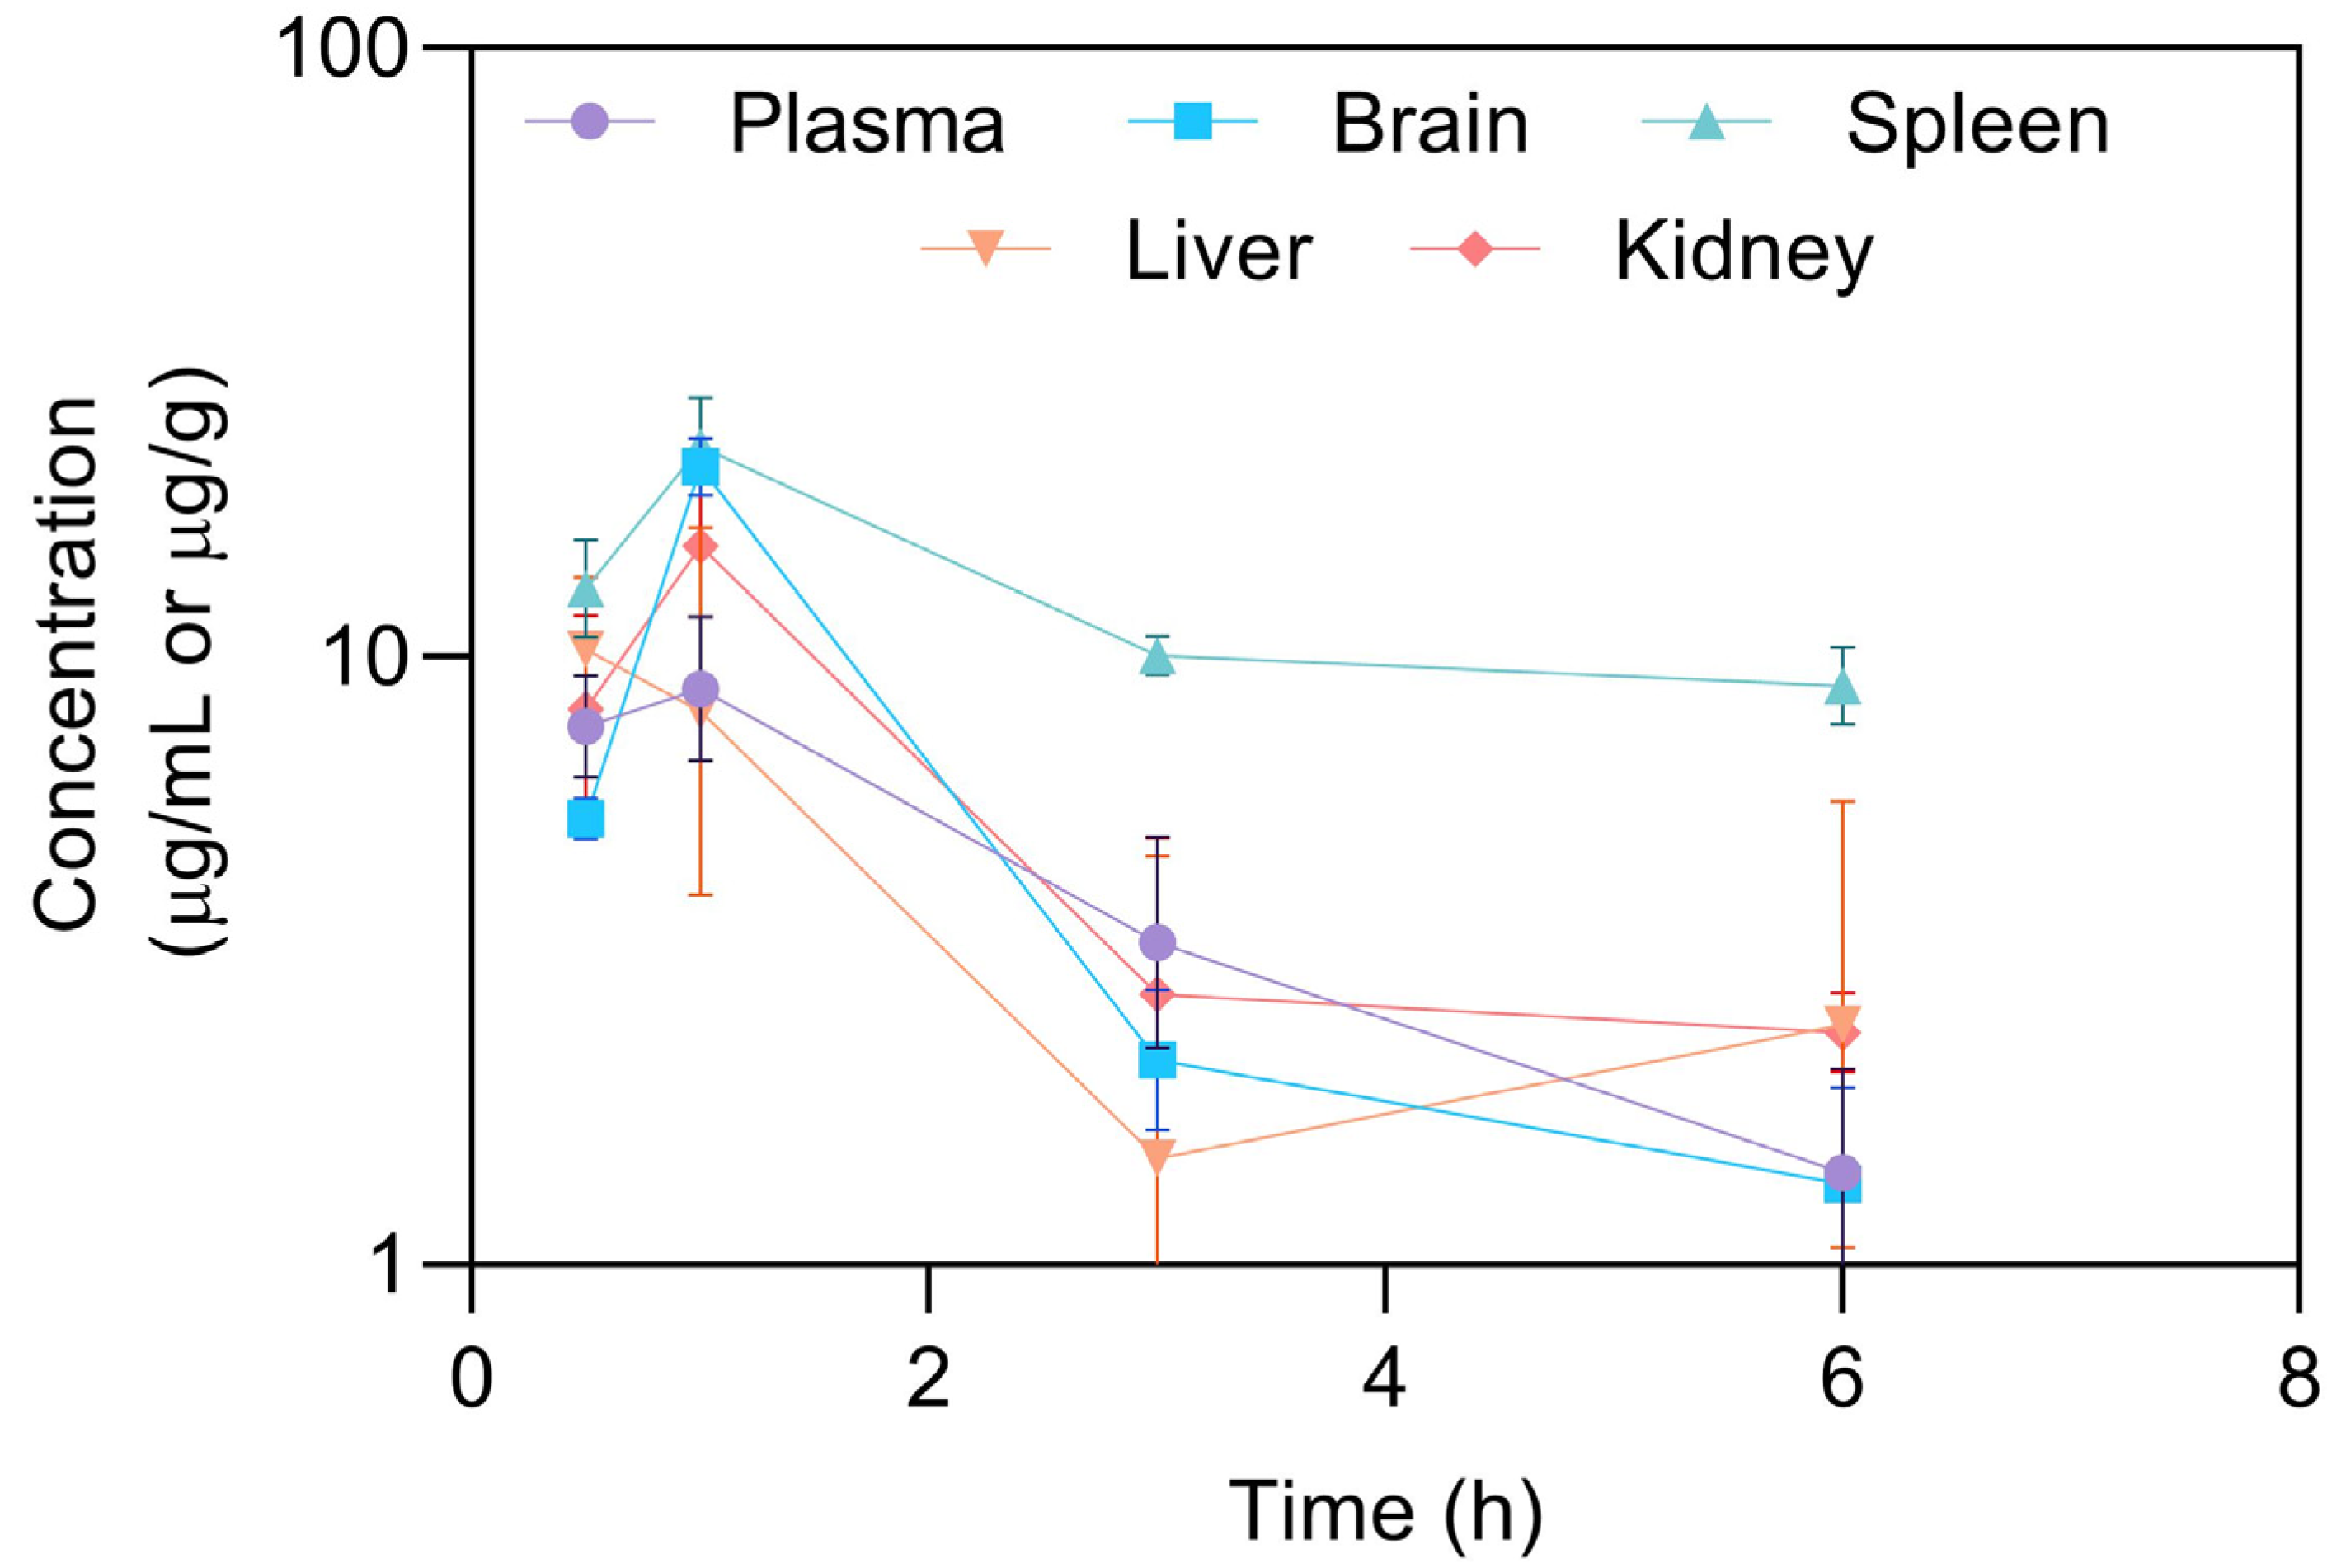
The HPLC method described was primarily established to support nonclinical pharmacokinetic studies in mice. A pharmacokinetic study was performed to highlight the applicability of the method for the analysis of CXB in solution (20 mg/kg), both in mouse plasma and tissues (brain, liver, and spleen). After the intraperitoneal administration of CXB, mice were sacrificed at different time points during a period of 30 h to retrieve the pharmacokinetic profiles and parameters displayed in Figure 2 and Table 7 [19], respectively.
The Cmax of intraperitoneal administered celecoxib in solution was 9.09 μg/mL after 1 h (tmax value). The extent of celecoxib absorption, expressed by AUC0-last, was higher in brain (36.7 min × μg/mL) in comparison to plasma (28.1 min × μg/mL, respectively). These favorable results can be explained by the small size and lipophilic nature of the CXB, which together may improve their membrane permeability. Note, however, that t1/2 and MRT (mean residence time) are higher in spleen. Moreover, CXB were not quantified in liver at longer times (LLOQ = 0.1 μg/mL).
To evaluate the biodistribution of celecoxib in solution, the drug selectivity index (DSI) was assessed. A DSI higher than 1 indicates a preferential drug selectivity to the determined matrix. Table 7 showed that there is a preferential selectivity by spleen, followed by brain~kidney, and lastly liver (DSI < 1). The results evidenced high elimination by spleen tissue. The use of the CXB is pointed out as an appealing repurposing approach to glioblastoma treatment, also bypassing the significant liver-first pass associated to oral administrations.
4. Conclusions
The present work describes an HPLC method using UV detection for the analysis of celecoxib in different mice matrices for in vivo pharmacokinetic studies. The method was validated and met the requirements of selectivity, linearity, recovery, accuracy, and precision. This HPLC method entails noteworthy advantages over other techniques, because it is a simple isocratic method, uses an inexpensive sample preparation, has low solvent consumption, and requires a low volume of each matrix, which reduces the assay time and chances for random errors. The validated method enables the determination of celecoxib in the 0.1–50 µg/mL range. The LLOQ of the present assay for celecoxib in vivo studies is adequate for the pharmacokinetic characterization of tested drugs in small animals from whom limited volumes of plasma could be taken at each time point. Finally, the method validation was carried out following the guidelines for bioanalytical assays and effectively used for pharmacokinetic studies in various biological fluids.
Author Contributions
Conceptualization, M.M. and C.V.; methodology, M.M. and C.V.; software, M.M.; validation, M.M., C.V. and A.P.; formal analysis, M.M., C.V. and A.P.; investigation, M.M.; resources, C.V. and A.P.; data curation, M.M.; writing—original draft preparation, M.M.; writing—review and editing, M.M., C.V., J.S. and A.P.; visualization, M.M.; supervision, C.V., J.S. and A.P.; project administration, C.V. and A.P.; funding acquisition, C.V. and A.P. All authors have read and agreed to the published version of the manuscript.
Funding
Fundação para a Ciência e a Tecnologia (FCT) supports the Coimbra Chemistry Centre through the Project UID/QUI/00313/2020. Maria Mendes acknowledges the PhD research Grants SFRH/BD/133996/2017 and COVID/BD/152172/2021, assigned by FCT.
Data Availability Statement
Data sharing not applicable. No new data were created or analyzed in this study. Data sharing is not applicable to this article.
Acknowledgments
The authors would like to thank Miguel Castelo Branco and José Sereno for their support in the experiments involving laboratory animals at the ‘Instituto de Ciências Nucleares Aplicadas à Saúde (ICNAS)’ of the University of Coimbra.
Conflicts of Interest
The authors declare no conflict of interest.
References
- Gong, L.; Thorn, C.F.; Bertagnolli, M.M.; Grosser, T.; Altman, R.B.; Klein, T.E. Celecoxib pathways: Pharmacokinetics and pharmacodynamics. Pharmacogenet. Genom. 2012, 22, 310–318. [Google Scholar] [CrossRef] [PubMed]
- Basso, J.; Mendes, M.; Fortuna, A.; Vitorino, R.; Sousa, J.; Pais, A.; Vitorino, C. Nanotechnological approaches in cancer: The role of celecoxib and disulfiram. In Drug Repurposing in Cancer Therapy; Elsevier: Amsterdam, The Netherlands, 2020; pp. 353–393. [Google Scholar] [CrossRef]
- Basso, J.; Miranda, A.; Sousa, J.; Pais, A.; Vitorino, C. Repurposing drugs for glioblastoma: From bench to bedside. Cancer Lett. 2018, 428, 173–183. [Google Scholar] [CrossRef] [PubMed]
- PubChem. Celecoxib. 2018. Available online: https://pubchem.ncbi.nlm.nih.gov/compound/2662 (accessed on 3 April 2018).
- PharmgKB. Celecoxib. Available online: https://www.pharmgkb.org/pathway/PA152241951 (accessed on 11 November 2021).
- Alajami, H.N.; Fouad, E.A.; Ashour, A.E.; Kumar, A.; Yassin, A.E.B. Celecoxib-Loaded Solid Lipid Nanoparticles for Colon Delivery: Formulation Optimization and In Vitro Assessment of Anti-Cancer Activity. Pharmaceutics 2022, 14, 131. [Google Scholar] [CrossRef] [PubMed]
- Margulis, K.; Neofytou, E.A.; Beygui, R.E.; Zare, R.N. Celecoxib Nanoparticles for Therapeutic Angiogenesis. ACS Nano 2015, 9, 9416–9426. [Google Scholar] [CrossRef] [PubMed]
- Li, Y.; Li, M.; Rantanen, J.; Yang, M.; Bohr, A. Transformation of nanoparticles into compacts: A study on PLGA and celecoxib nanoparticles. Int. J. Pharm. 2021, 611, 121278. [Google Scholar] [CrossRef] [PubMed]
- Ziaei, E.; Emami, J.; Kazemi, M.; Rezazadeh, M. Simultaneous Determination of Docetaxel and Celecoxib in Porous Microparticles and Rat Plasma by Liquid-Liquid Extraction and HPLC with UV Detection: In vitro and in vivo Validation and Application. J. Pharm. Pharm. Sci. 2020, 23, 289–303. [Google Scholar] [CrossRef] [PubMed]
- Ptáček, P.; Klíma, J.; Macek, J. Determination of celecoxib in human plasma by liquid chromatography–tandem mass spectrometry. J. Chromatogr. B 2012, 899, 163–166. [Google Scholar] [CrossRef] [PubMed]
- Rose, M.J.; Woolf, E.J.; Matuszewski, B.K. Determination of celecoxib in human plasma by normal-phase high-performance liquid chromatography with column switching and ultraviolet absorbance detection. J. Chromatogr. B Biomed. Sci. Appl. 2000, 738, 377–385. [Google Scholar] [CrossRef] [PubMed]
- Hamama, A.K.; Ray, J.; Day, R.O.; Brien, J.E. Simultaneous determination of rofecoxib and celecoxib in human plasma by high-performance liquid chromatography. J. Chromatogr. Sci. 2005, 43, 351–354. [Google Scholar] [CrossRef] [PubMed] [Green Version]
- Silva, J.; Basso, J.; Sousa, J.; Fortuna, A.; Vitorino, C. Development and full validation of an HPLC methodology to quantify atorvastatin and curcumin after their intranasal co-delivery to mice. Biomed. Chromatogr. 2019, 33, e4621. [Google Scholar] [CrossRef] [PubMed]
- Saha, R.N.; Sajeev, C.; Jadhav, P.R.; Patil, S.P.; Srinivasan, N. Determination of celecoxib in pharmaceutical formulations using UV spectrophotometry and liquid chromatography. J. Pharm. Biomed. Anal. 2002, 28, 741–751. [Google Scholar] [CrossRef] [PubMed]
- Ma, Y.; Gao, S.; Hu, M. Quantitation of celecoxib and four of its metabolites in rat blood by UPLC-MS/MS clarifies their blood distribution patterns and provides more accurate pharmacokinetics profiles. J. Chromatogr. B Analyt. Technol. Biomed. Life Sci. 2015, 1001, 202–211. [Google Scholar] [CrossRef] [PubMed]
- EMA—European Medicines Agency. Guideline on Bioanalytical Method Validation; EMEA/CHMP/EWP/192217/2009; EMA: Amsterdam, The Netherlands , 2011. Available online: https://www.ema.europa.eu/en/documents/scientific-guideline/ich-guideline-m10-bioanalytical-method-validation-step-5_en.pdf (accessed on 30 January 2023).
- Meesters, R.; Voswinkel, S. Bioanalytical Method Development and Validation: From the US FDA 2001 to the US FDA 2018 Guidance for Industry. J. Appl. Bioanal. 2018, 4, 67–73. [Google Scholar] [CrossRef]
- Basso, J.; Mendes, M.; Cova, T.F.G.G.; Sousa, J.J.; Pais, A.A.C.C.; Vitorino, C. Analytical Quality by Design (AQbD) as a multiaddressable platform for co-encapsulating drug assays. Anal. Methods 2018, 10, 5659–5671. [Google Scholar] [CrossRef]
- Zhang, Y.; Huo, M.; Zhou, J.; Xie, S. PKSolver: An add-in program for pharmacokinetic and pharmacodynamic data analysis in Microsoft Excel. Comput. Methods Programs Biomed. 2010, 99, 306–314. [Google Scholar] [CrossRef] [PubMed]
Figure 1.
Representative HPLC chromatograms of IS (425 nm) and celecoxib (250 nm), in plasma (A), brain (B), spleen (C), liver (D), and kidney (E) homogenate supernatants, respectively, with LLOQ standing for the lower limit of quantification and QC3, the high-quality control of the corresponding calibration curves. Chromatograms of blank samples at 425 and 250 nm are also illustrated. IS and celecoxib were eluted at ~3.12 and 5.55 min, respectively.

Figure 2.
Exploratory pharmacokinetic profiles of celecoxib in solution following an intraperitoneal administration in plasma, brain, spleen, liver, and kidney [19]. Results are presented as average per organ; error bars represent calculated standard deviation (n = 3 per time point, mean ± SD).
Figure 2.
Exploratory pharmacokinetic profiles of celecoxib in solution following an intraperitoneal administration in plasma, brain, spleen, liver, and kidney [19]. Results are presented as average per organ; error bars represent calculated standard deviation (n = 3 per time point, mean ± SD).


Table 1.
Final concentrations of the calibration standards and quality controls.
| Mouse Matrices | Calibration Curve (µg/mL) | Quality Controls (µg/mL) |
|---|---|---|
| Plasma | 0.6, 1, 5, 10, 25, 50 | QCLLOQ = 0.6 |
| QC1 = 1.2 | ||
| QC2 = 7.5 | ||
| QC3 = 45 | ||
| Brain | 0.1, 0.2, 0.5, 1, 3, 5 | QCLLOQ = 0.1 |
| QC1 = 0.25 | ||
| QC2 = 0.75 | ||
| QC3 = 4.5 | ||
| Spleen | 0.6, 1, 5, 10, 25, 50 | QCLLOQ = 0.6 |
| QC1 = 1.2 | ||
| QC2 = 7.5 | ||
| QC3 = 45 | ||
| Liver | 0.1, 0.5, 1, 5, 10, 15 | QCLLOQ = 0.1 |
| QC1 = 0.2 | ||
| QC2 = 2.5 | ||
| QC3 = 13.5 | ||
| Kidney | 0.1, 0.5, 1, 5, 10, 15 | QCLLOQ = 0.1 |
| QC1 = 0.2 | ||
| QC2 = 2.5 | ||
| QC3 = 13.5 |
Table 2.
Sample preparation conditions.
| Animal Matrices | Homogenate Volume | [IS] μg/mL | IS (μL) | ACN (μL) | HPLC Injection Volume (μL) |
|---|---|---|---|---|---|
| Plasma | 100 | 50 | 10 | 190 | 10 |
| Brain | 250 | 25 | 10 | 490 | 20 |
| Spleen | 100 | 50 | 10 | 190 | 10 |
| Kidney | 500 | 100 | 10 | 990 | 10 |
| Liver | 500 | 100 | 10 | 990 | 10 |
Table 3.
Mean calibration curve parameters obtained from weighted linear regression analysis (1/x2) for celecoxib in studied mouse matrices (n = 6, mean ± SD). Key—SD, Standard deviation; r2, determination coefficient.
Table 3.
Mean calibration curve parameters obtained from weighted linear regression analysis (1/x2) for celecoxib in studied mouse matrices (n = 6, mean ± SD). Key—SD, Standard deviation; r2, determination coefficient.
| Matrix | Calibration Standards (μg/mL) | Mean Slope ± SD | Mean Intercept ± SD | Mean r2 |
|---|---|---|---|---|
| Plasma | 0.6, 1.2, 5, 10, 25, 50 | 0.0613 ± 0.0025 | 0.0062 ± 0.0065 | 0.996 |
| Brain | 0.01, 0.2, 0.5, 1, 3, 5 | 0.3387 ± 0.0630 | 0.0103 ± 0.0065 | 0.996 |
| Spleen | 0.6, 1.2, 5, 10, 25, 50 | 0.0648 ± 0.0011 | 0.0092 ± 0.0169 | 0.996 |
| Kidney | 0.1, 0.5, 1, 5, 10, 15 | 0.1700 ± 0.0078 | 0.0028 ± 0.0055 | 0.999 |
| Liver | 0.1, 0.5, 1, 5, 10, 15 | 0.1756 ± 0.0201 | 0.0117 ± 0.0047 | 0.999 |
Table 4.
Intra- and inter-day precision and accuracy results obtained for celecoxib in mouse matrices at the concentrations of the lower limit of quantification (LLOQ), at the low (QC1), middle (QC2), and high (QC3) concentrations of the calibration range.
Table 4.
Intra- and inter-day precision and accuracy results obtained for celecoxib in mouse matrices at the concentrations of the lower limit of quantification (LLOQ), at the low (QC1), middle (QC2), and high (QC3) concentrations of the calibration range.
| Intra-Day (n = 6) | Inter-Day (n = 15) | ||||||
|---|---|---|---|---|---|---|---|
| Matrix | Concentration (μg/mL) | Mean Experimental Concentration ± SD (μg/mL) | Precision (CV, %) | Accuracy (Bias, %) | Mean Experimental Concentration ± SD (μg/mL) | Precision (CV, %) | Accuracy (Bias, %) |
| Plasma | 0.6 | 0.625 ± 0.117 | 18.72 | 10.6 | 0.622 ± 0.105 | 16.82 | 3.73 |
| 1.2 | 1.021 ± 0.050 | 4.88 | −14.9 | 1.114 ± 0.126 | 11.33 | −7.14 | |
| 7.5 | 7.152 ± 0.715 | 9.52 | −2.24 | 7.363 ± 0.238 | 3.23 | −1,82 | |
| 45 | 48.64 ± 4.204 | 8.64 | 8.10 | 45.44 ± 2.019 | 4.44 | 0.99 | |
| Brain | 0.1 | 0.102 ± 0.06 | 5.42 | 1.56 | 0.109 ± 0.019 | 17.4 | 8.68 |
| 0.25 | 0.283 ± 0.030 | 10.4 | 13.2 | 0.250 ± 0.030 | 12.1 | −0.39 | |
| 0.75 | 0.747 ± 0.042 | 5.60 | −0.44 | 0.762 ± 0.060 | 7.78 | 2.68 | |
| 4.5 | 5.180 ± 0.249 | 4.81 | 13.1 | 4.737 ± 0.281 | 5.94 | 4.59 | |
| Spleen | 0.6 | 0.516 ± 0.065 | 9.82 | −14.0 | 0.615 ± 0.110 | 17.9 | 2.51 |
| 1.2 | 1.024 ± 0.075 | 6.47 | −14.7 | 1.220 ± 0.181 | 14.9 | 1.67 | |
| 7.5 | 7.097 ± 0.296 | 4.09 | −5.37 | 7.358 ± 0.499 | 6.82 | −1.90 | |
| 45 | 44.41 ± 1.112 | 2.50 | −1.31 | 43.05 ± 2.954 | 6.93 | −4.32 | |
| Liver | 0.1 | 0.092 ± 0.005 | 5.80 | −7.70 | 0.092 ± 0.014 | 13.8 | −8.04 |
| 0.2 | 0.190 ± 0.012 | 6.60 | −5.10 | 0.192 ± 0.026 | 12.3 | −4.12 | |
| 2.5 | 2.722 ± 0.188 | 6.90 | 8.90 | 2.530 ± 0.127 | 6.01 | 1.21 | |
| 13.5 | 14.03 ± 1.673 | 11.9 | 3.90 | 13.53 ± 0.748 | 5.04 | 0.20 | |
| Kidney | 0.1 | 0.100 ± 0.010 | 6.10 | 0.24 | 0.095 ± 0.020 | 12.6 | −5,13 |
| 0.2 | 0.213 ± 0.011 | 3.85 | 6.44 | 0.211 ± 0.028 | 10.0 | −5.52 | |
| 2.5 | 2.452 ± 0.119 | 4.09 | −1.90 | 2.607 ± 0.305 | 11.4 | 4.28 | |
| 13.5 | 13.36 ± 0.231 | 2.36 | −1,01 | 14.01 ± 1.790 | 12.7 | 3.79 | |
Table 5.
Absolute recovery (values in mean percentage) of celecoxib from mouse matrices determined at low (QC1), middle (QC2), and high (QC3) concentration levels of the calibration range.
Table 5.
Absolute recovery (values in mean percentage) of celecoxib from mouse matrices determined at low (QC1), middle (QC2), and high (QC3) concentration levels of the calibration range.
| Recovery (n = 5) | |||
|---|---|---|---|
| Matrix | Concentration (μg/mL) | Mean ± SD (%) | Precision (CV, %) |
| Plasma | 1.2 | 96 ± 3 | 3.28 |
| 7.5 | 85 ± 3 | 3.68 | |
| 45 | 84 ± 3 | 3.80 | |
| Brain | 0.25 | 103 ± 8 | 8.15 |
| 0.75 | 100 ± 7 | 7.36 | |
| 4.5 | 102 ± 5 | 5.17 | |
| Spleen | 1.2 | 98 ± 17 | 14.1 |
| 7.5 | 99 ± 7 | 6.83 | |
| 45 | 88 ± 6 | 6.70 | |
| Liver | 1.2 | 103 ± 6 | 6.03 |
| 7.5 | 105 ± 8 | 6.86 | |
| 45 | 109 ± 13 | 11.9 | |
| Kidney | 1.2 | 101 ± 6 | 5.61 |
| 7.5 | 111 ± 4 | 3.81 | |
| 45 | 106 ± 3 | 2.36 | |
Table 6.
Stability of celecoxib at medium and high concentrations of the calibration range in processed mouse matrices under room temperature for 24 h (n = 4).
Table 6.
Stability of celecoxib at medium and high concentrations of the calibration range in processed mouse matrices under room temperature for 24 h (n = 4).
| Matrix | Nominal Concentration (μg/mL) | Mean ± SD (%) | Precision (CV, %) |
|---|---|---|---|
| Plasma | 1.2 | 97.3 ± 8.40 | 8.66 |
| 45 | 87.9 ± 6.50 | 7.45 | |
| Brain | 0.25 | 94.1 ± 7.40 | 8.84 |
| 4.5 | 105.9 ± 13.6 | 11.17 | |
| Spleen | 1.2 | 104.7 ± 9.30 | 8.87 |
| 45 | 93.8 ± 11.1 | 11.22 | |
| Liver | 0.2 | 114.6 ± 5.60 | 10.47 |
| 13.5 | 110.3 ± 2.82 | 2.56 | |
| Kidney | 0.2 | 87.5 ± 6.61 | 7.55 |
| 13.5 | 88.1 ± 5.35 | 6.08 |
Table 7.
Pharmacokinetic parameters obtained for celecoxib in usNLCs and HNPsTf, compared to free drug in solution, in plasma, brain, liver, spleen, and kidney [19]. Key—P, plasma; B, brain; L, liver; S, spleen; K, kidney; tmax—time to reach maximum concentration; Cmax—maximum concentration; AUC0-inf—area under the concentration time-curve from time zero to infinite; AUC0-last—area under the concentration time-curve from time zero to the previous measurable drug concentration; MRT—mean residence time.
| Organ | Plasma | Brain | Liver | Spleen | Kidney |
|---|---|---|---|---|---|
| t1/2 (h) | 1.9 | 1.4 | 2.8 | 4.07 | 2.0 |
| tmax (h) | 1 | 1 | 0.5 | 1 | 2.0 |
| Cmax (μg/mL or μg/g) | 9.1 | 20.6 | 10.6 | 22.4 | 15.6 |
| AUC0-last (h × μg/mL or h × μg/g) | 28.1 | 36.7 | 27.7 | 73.2 | 35.3 |
| AUCinf (h × μg/mL or h × μg/g) | 32.3 | 39.5 | 39.8 | 126.2 | 42.2 |
| MRT (h) | 2.9 | 2.0 | 4.6 | 6.47 | 3.05 |
| DSI | - | 1.30 | 0.99 | 2.60 | 1.26 |
Disclaimer/Publisher’s Note: The statements, opinions and data contained in all publications are solely those of the individual author(s) and contributor(s) and not of MDPI and/or the editor(s). MDPI and/or the editor(s) disclaim responsibility for any injury to people or property resulting from any ideas, methods, instructions or products referred to in the content. |
© 2023 by the authors. Licensee MDPI, Basel, Switzerland. This article is an open access article distributed under the terms and conditions of the Creative Commons Attribution (CC BY) license (https://creativecommons.org/licenses/by/4.0/).
Share and Cite
MDPI and ACS Style
Mendes, M.; Sousa, J.; Pais, A.; Vitorino, C. Can Celecoxib Assay in Preclinical Studies Be Improved? Processes 2023, 11, 431. https://doi.org/10.3390/pr11020431
AMA Style
Mendes M, Sousa J, Pais A, Vitorino C. Can Celecoxib Assay in Preclinical Studies Be Improved? Processes. 2023; 11(2):431. https://doi.org/10.3390/pr11020431
Chicago/Turabian StyleMendes, Maria, João Sousa, Alberto Pais, and Carla Vitorino. 2023. "Can Celecoxib Assay in Preclinical Studies Be Improved?" Processes 11, no. 2: 431. https://doi.org/10.3390/pr11020431
Note that from the first issue of 2016, this journal uses article numbers instead of page numbers. See further details here.