
A Combined Experimental and Numerical Thermo-Hydrodynamic Investigation of High-Temperature Fluidized-Bed Thermal Energy Storage


1
Energy Systems Engineering, Atilim University, Ankara 06830, Turkey
2
Mechanical Engineering Department, Middle East Technical University, Ankara 06800, Turkey
3
ODTU-GUNAM Center for Solar Energy Research and Applications, Ankara 06800, Turkey
*
Author to whom correspondence should be addressed.
Processes 2022, 10(6), 1097; https://doi.org/10.3390/pr10061097
Submission received: 30 April 2022
/
Revised: 14 May 2022
/
Accepted: 25 May 2022
/
Published: 1 June 2022
(This article belongs to the Special Issue Processes and Technologies for Thermal and Thermochemical Energy Storage)
Abstract
:The present research describes the design, analysis, and modeling of an air-granular particle fluidized-bed system with dimensions of 0.08 m × 0.4 m × 0.08 m. The hydrodynamic and thermal experiments are designed to verify the numerical model previously created for this purpose. The gas-solid two-phase flow is described using a three-dimensional, two-fluid model based on the Eulerian–Eulerian method. The experiment is conducted, and the numerical model is updated for the new geometry while maintaining the solution parameters. Silica sand and sintered bauxite particles are employed in both experimental and numerical investigations to examine the behaviors of these particles. The hydrodynamic validity of the numerical model is established by the use of experimental findings for pressure drop and bed expansion ratio. The thermal tests are conducted with 585 K hot sand, and the temperature distribution in the bed is measured using K-type thermocouples and compared with the simulation data. Both the hydrodynamical and thermal experimental data appear to agree with the conclusions of the computational analyses. The validated model is then used to mimic the performance of the bed at elevated temperatures. The performance indicators are discussed and calculated for 973 K, demonstrating that as the temperature rises, the system efficiency increases.
1. Introduction
In recent years, there has been a lot of interest in concentrated solar power (CSP) due to its environmental sustainability and its potential as an economical energy supply. The intermittent nature of solar energy, on the other hand, needs integration with effective thermal energy storage (TES) systems [1]. The primary benefit of CSP systems is that heat can be stored in a variety of media readily and inexpensively. For efficacy, these materials should possess certain characteristics, including high thermal conductivity, high specific heat, high chemical stability, minimal volume change, low cost, non-toxicity, and ease of availability. These materials can be classified into three broad categories: sensible, latent, and thermochemical. Sensible heat storage materials store heat energy within the range of their specific heat capacity, whereas latent heat storage materials do so due to the phase-change process. Finally, chemical heat storage systems use chemical reactions to store heat. The temperatures are particularly high in central tower CSP plants, and their operation relies heavily on the heat transfer medium that they use to store and transport their thermal energy. Thermal oils and molten salts, which are liquid heat transfer media, have limits when functioning at extremely high temperatures. As a result, sensible heat storage in thermally stable solid particles such as sand, which eliminates certain drawbacks in this respect, is even more under the spotlight for research [2].
However, in particle TES systems, the primary concern is how the working fluid of the power cycle recovers the heat of the particles efficiently [3]. In the literature, many strategies have been utilized to this end. Warerkar et al. [4] presented a high-temperature particle storage system based on an air-to-sand heat exchanger. Across a porous wall, the bulk of the particles move down and contact the air. In their experiments, a heat exchanger effectiveness of 0.9 was reached. However, cracks started to appear in the walls after only a short time of use, most likely because of too much pressure. Baumann et al. [5] presented a cross-flow design for a moving-bed heat exchanger. The air moves through a bundle of tubes, while, in a dense regime, the particles fall over the outer surface of the tubes. The wall-to-bed heat transfer coefficient was estimated to be 400–500 W/m2K. However, heated particles at high temperatures may damage the tube surface in this system, thus increasing maintenance expenses. Heat cannot be transferred from the solid particles to the working fluid effectively when they are not in direct contact with the working fluid. Apart from this, indirect heat exchangers have poor heat transmission to the working fluid running through steel pipes embedded in the fixed bed. As a better alternative, the heat transfer rate can be increased by utilizing bubbling fluidized-bed (FB) heat exchangers. FBs are often more complicated to design, build, and operate than other types of reactors, such as packed beds. However, they provide three key advantages over other process technologies: enhanced heat transfer, the ability to transport solids as easily as fluids, and the flexibility to accommodate a wide variety of particle sizes. The fluidization process ensures that the solid and liquid phases are well mixed, resulting in significant heat transfer contact surfaces. Furthermore, since FBs can operate continuously without any major change in the material properties, they are suitable for large-scale operations [6].
The ability of FBs to operate as TES has been widely acknowledged and discussed in the recent literature [7]. There are several types of research on FBs in the literature; the majority are numerical [8,9,10,11,12,13,14], with only a few experimental investigations [15,16,17,18,19]. Most experimental applications are restricted to laboratory-scale and pilot-scale implementations, which are increasingly being challenged by the need to scale up to demonstration size as a requirement for future deployment. Changing the shape and operating parameters of commercial-scale FBs during testing is not viable, if not impossible, in the context of parametric investigations. Furthermore, many of the experimental approaches used thus far have difficulty observing the flow structure of the bed due to the severe conditions and opaque nature of the gas–solid flow structure of FBs. There has recently been an increase in research towards understanding the fundamental physical principles behind complex gas–solid system behavior using computational fluid dynamics (CFD). Numerical models offer more flexibility and cost savings, particularly when undertaking parametric analyses on various bed geometries and operating conditions. Additionally, they offer detailed information on bubble properties across the full cross-section of the bed, independent of the shape or operating conditions of the bed.
The discrete particle model (DPM) and the two-fluid model (TFM) are the most often utilized CFD models for gas–solid multiphase flow simulations. The DPM model, which uses a Eulerian–Lagrangian approach, treats the gas phase as a continuous phase described on a computational cell scale by locally averaged Navier–Stokes equations, whereas particle motion is modeled as a discrete phase described on an individual particle scale by Newton’s laws of motion [20,21]. The TFM model, which uses a Eulerian–Eulerian approach [22], treats both the gas and the solid phases as continuous. They are characterized using mass and momentum conservation equations that incorporate interaction terms between the phases as a source term to link the two phases. Due to the high processing demands of DPM, it is not feasible to simulate engineering-scale FBs using this technique. Instead, TFM is a preferable choice for industrial applications because of its low processing needs and ability to deliver appropriate instantaneous and time-averaged results.
To improve this technology, however, model development and validation with respect to experimental results are still required. These verified CFD models are thought to aid in the effective understanding of performance, as well as in the design and optimization of these systems. The majority of numerical simulations of fluidized-bed units are performed in 2D computational domains. Compared to 3D simulations and actual experimental data, 2D simulations are known to overestimate the bubble rise velocity, resulting in inaccurate results. Thus far, no study has used a three-dimensional TFM model to examine an FB and confirm its hydrodynamic and thermal performance predictions against experimental data. The FB is investigated both experimentally and computationally in this work, not merely from a hydrodynamic aspect—as is commonly done in the literature—but also from a thermal standpoint, which has not been studied in depth before. Using a simple FB as a test case, this paper analyzes the efficacy of the TFM for simulating gas flows through a bed containing sand and bauxite (CARBOHSP) particles. The model is the extended version of the pseudo-2D model proposed by Hicdurmaz and Tari [12]. The simulations are carried out here with a focus on the influence of three-dimensionality. The experimental and simulation results are compared to validate the model. The performance metrics for the FB-TES system are described, and these metrics are calculated and reported for our proposed system at different operating temperatures.
2. Experimental Study
The purpose of the experiment is to examine the hydrodynamic and thermodynamic characteristics of an FB in a variety of conditions, primarily varying inlet air velocities and temperatures. Accordingly, the experiments are performed in two forms, hydrodynamic (cold) and thermal (hot). In cold testing, the particles are used at room temperature; in contrast, in the hot tests, they are heated to higher temperatures. In what follows, we will detail each set of experiments separately.
Some parameters should be tuned to improve the fluidization quality. Firstly, the particle size distribution and sphericity require careful selection based on the intended usage. In the present study, silica sand and CARBOHSP are used, both belonging to group B in the Geldart classification [23]. They possess many advantages: they are mainly thermally stable at high temperatures (+900 °C), widely available at low cost, non-flammable, and non-toxic; finally, they can serve as both a heat supply and storage medium. The second critical parameter is the bed density ratio. While liquid–solid mixtures are often homogeneous, the ratio is critical for full fluidization in solid–gas mixtures. The ratio of interaction between the two phases determines the effectiveness of an FB system.
2.1. Hydrodynamics Experiments
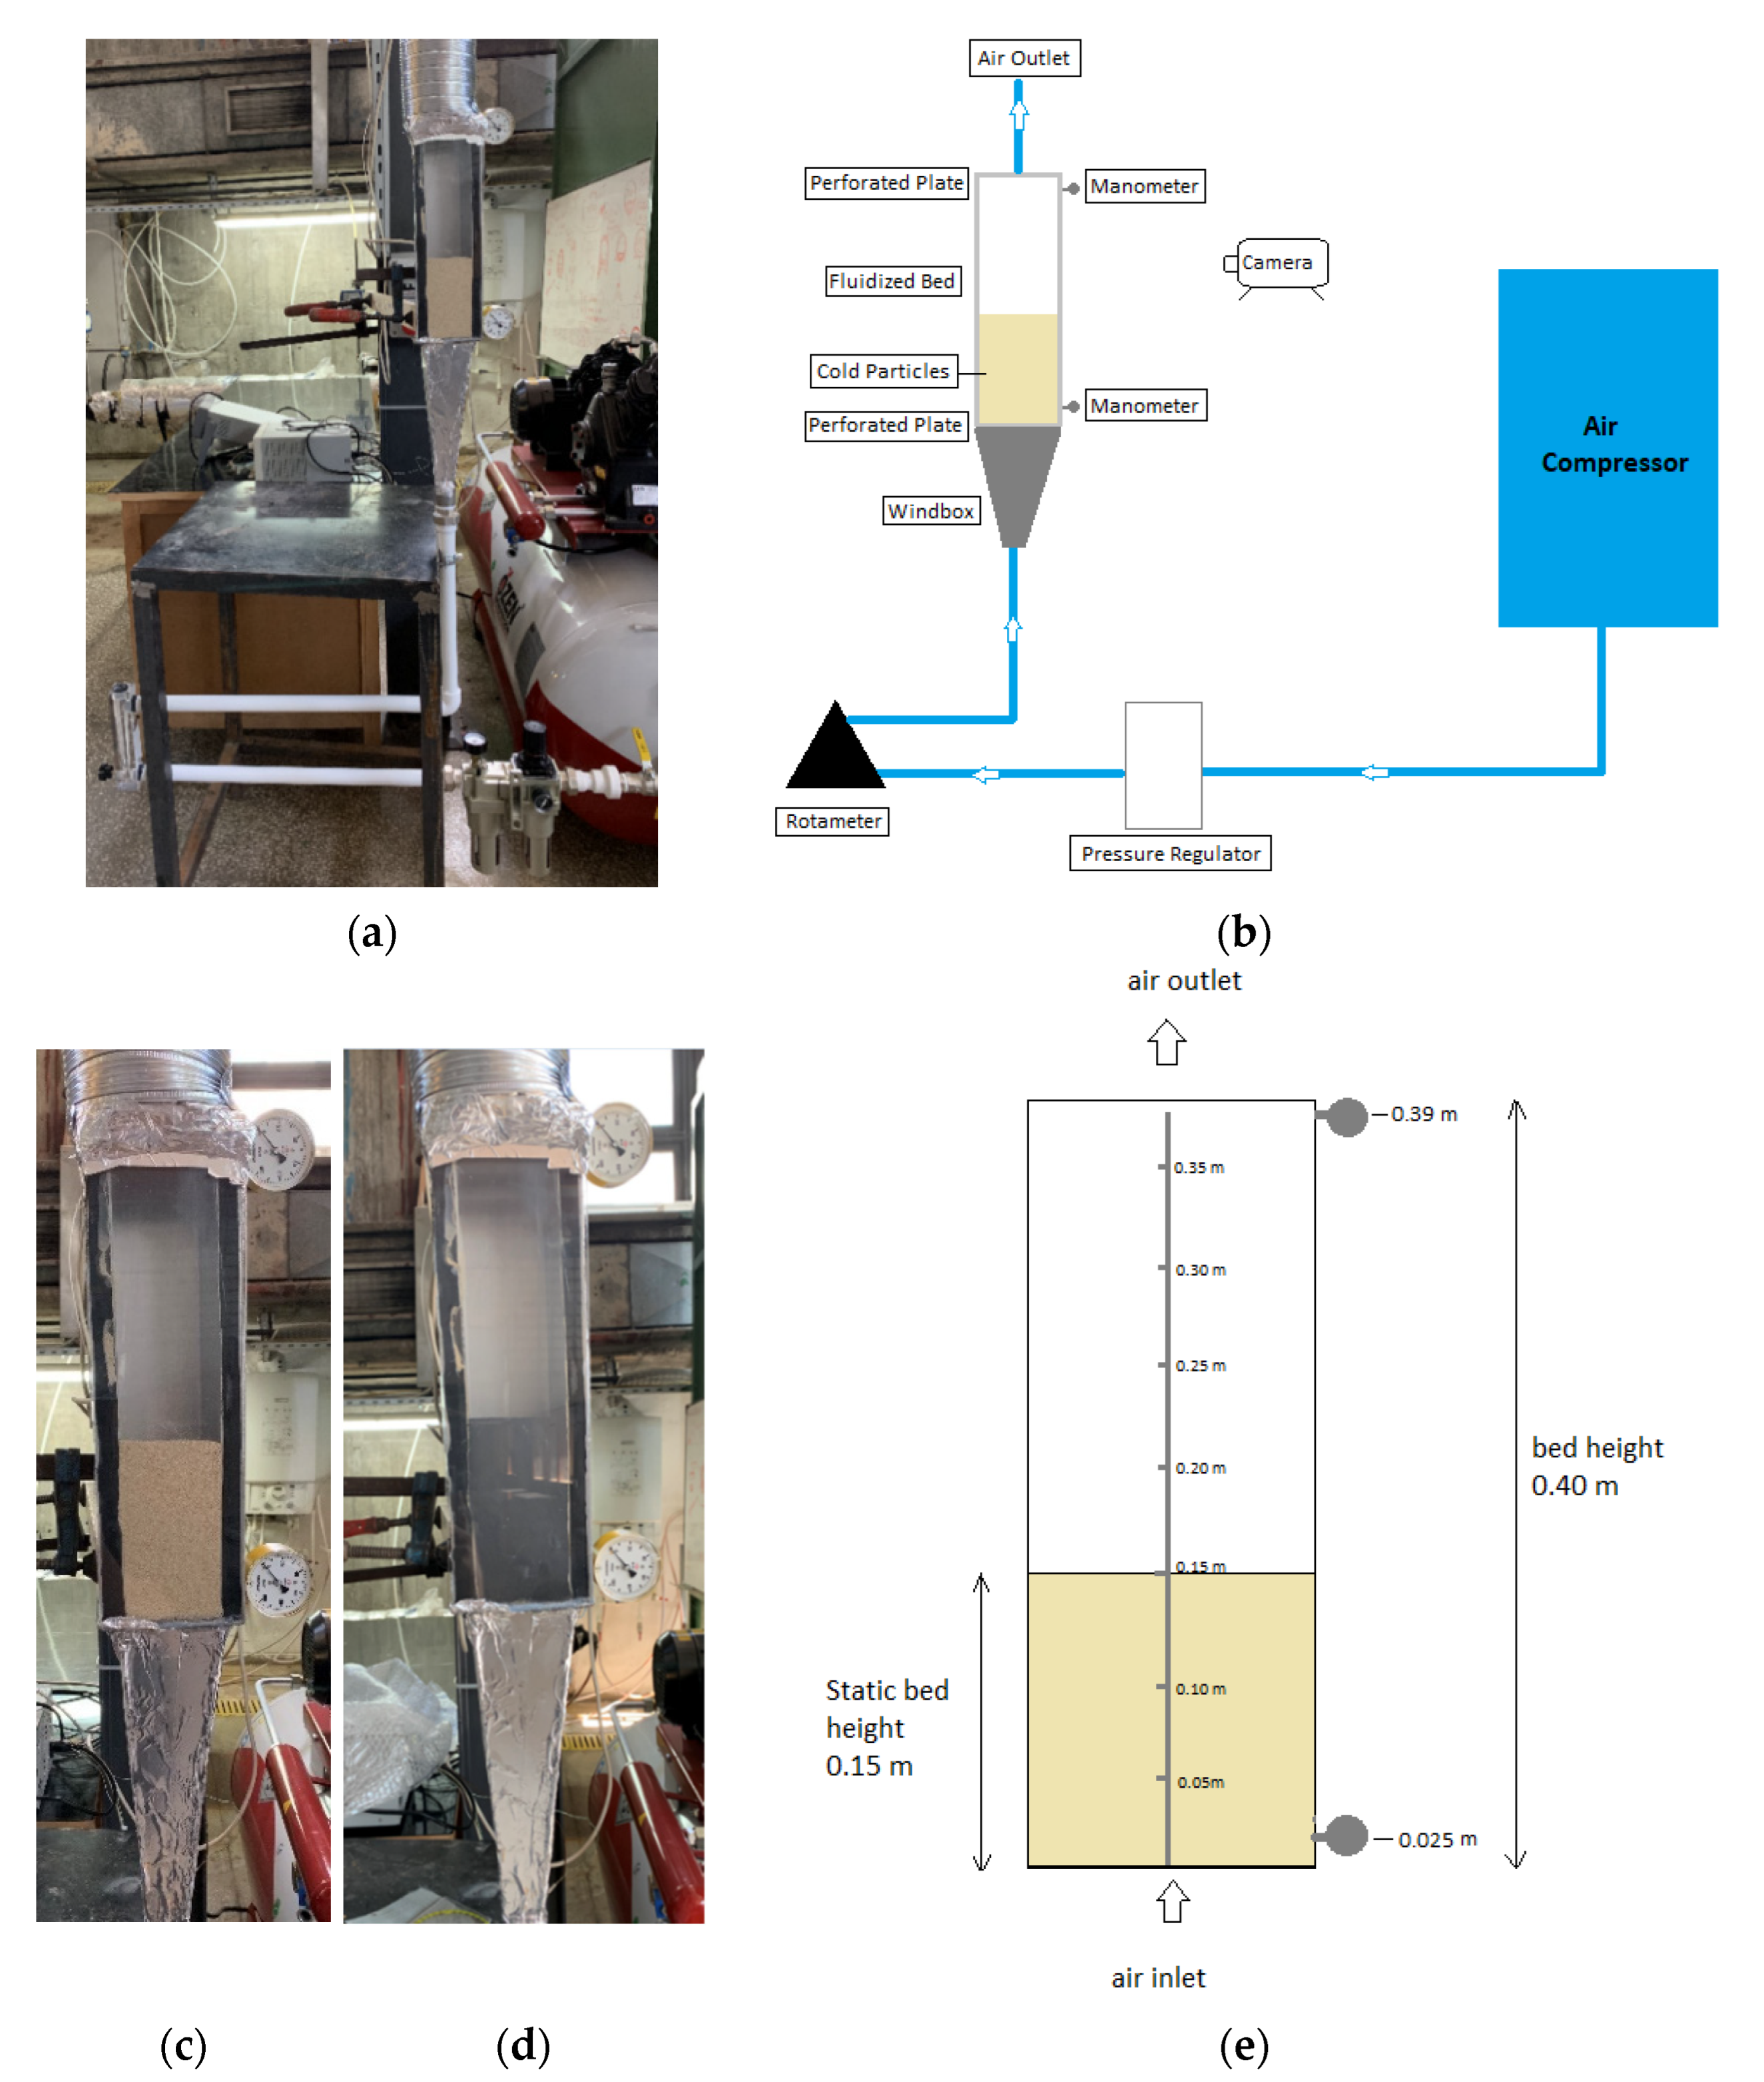
The experimental setup for hydrodynamics, along with its schematic drawing, is shown in Figure 1. The setup consists of an air compressor, a bed, a wind box, and pipe connections. A pressure regulator, a rotameter, two manometers, and granular particles are all included within the bed. All experiments are carried out in a 0.08 m × 0.4 m × 0.08 m FB. Cold experiments use stainless-steel walls for the side and rear walls and plexiglass for the front wall so that the motion of the granular particles can be observed. A conical wind box is placed between the FB and the air pipe to mitigate the consequences of imbalanced air entrance. Figure 1c,d show the bed filled with two different kinds of solid particles, namely sand and CARBOHSP. The static bed height for both cases is 0.15 m. The measurements aimed to observe the behavior of these particles under different operating parameters.
For the experiments related to the hydrodynamic analyses, two manometers are placed on the sidewall, one at 0.025 m and the other at 0.39 m in height. During the cold tests, the hydrodynamic characteristics such as pressure drop and bed expansion are monitored for various superficial velocities. Wire meshes are placed at the bottom and top of the bed to retain the particles inside the system. The meshes are made of stainless-steel with Cr and Ni, with approximately 56,000 holes within the bed cross-section and a hole diameter of 197 microns. Furthermore, to aid in the consistent flow of air, a honeycomb plate is attached to the bottom of the bed. A piston compressor supplies air to the bed at a maximum capacity of 700 L/min and a system pressure of 8 bars. A rotameter and a pressure regulator are mounted on the pipe between the compressor and the bed to stabilize the air properties. The experiments began by running the compressor to its maximum system pressure. The pressure values were measured once the oscillations subsided. By multiplying the desired inflow velocity by the cross-sectional area of the bed, the required flow rate was obtained. Throughout all of the studies, a flowmeter was employed to ensure a smooth and steady supply of air from the compressor into the bed. Every two minutes, the pressure readings and sand particle movements were recorded. These values were processed using the captured videos to obtain an average for each superficial velocity.
During the experiments, a number of factors affecting the accuracy were observed. A major one was the fluctuations in the flowmeter and the manometers. The flowmeter oscillated, causing the superficial velocity to vary. Manometers were also constantly oscillated during the pressure drop measurements, and the average pressure was calculated using video data and the eyeball approach. The same approach was used to determine the bed expansion level, causing certain deviations in the results. The other causes for the fluctuations were the bubbles that formed inside the bed and the compressor-induced vibration.
2.2. Thermal Experiments
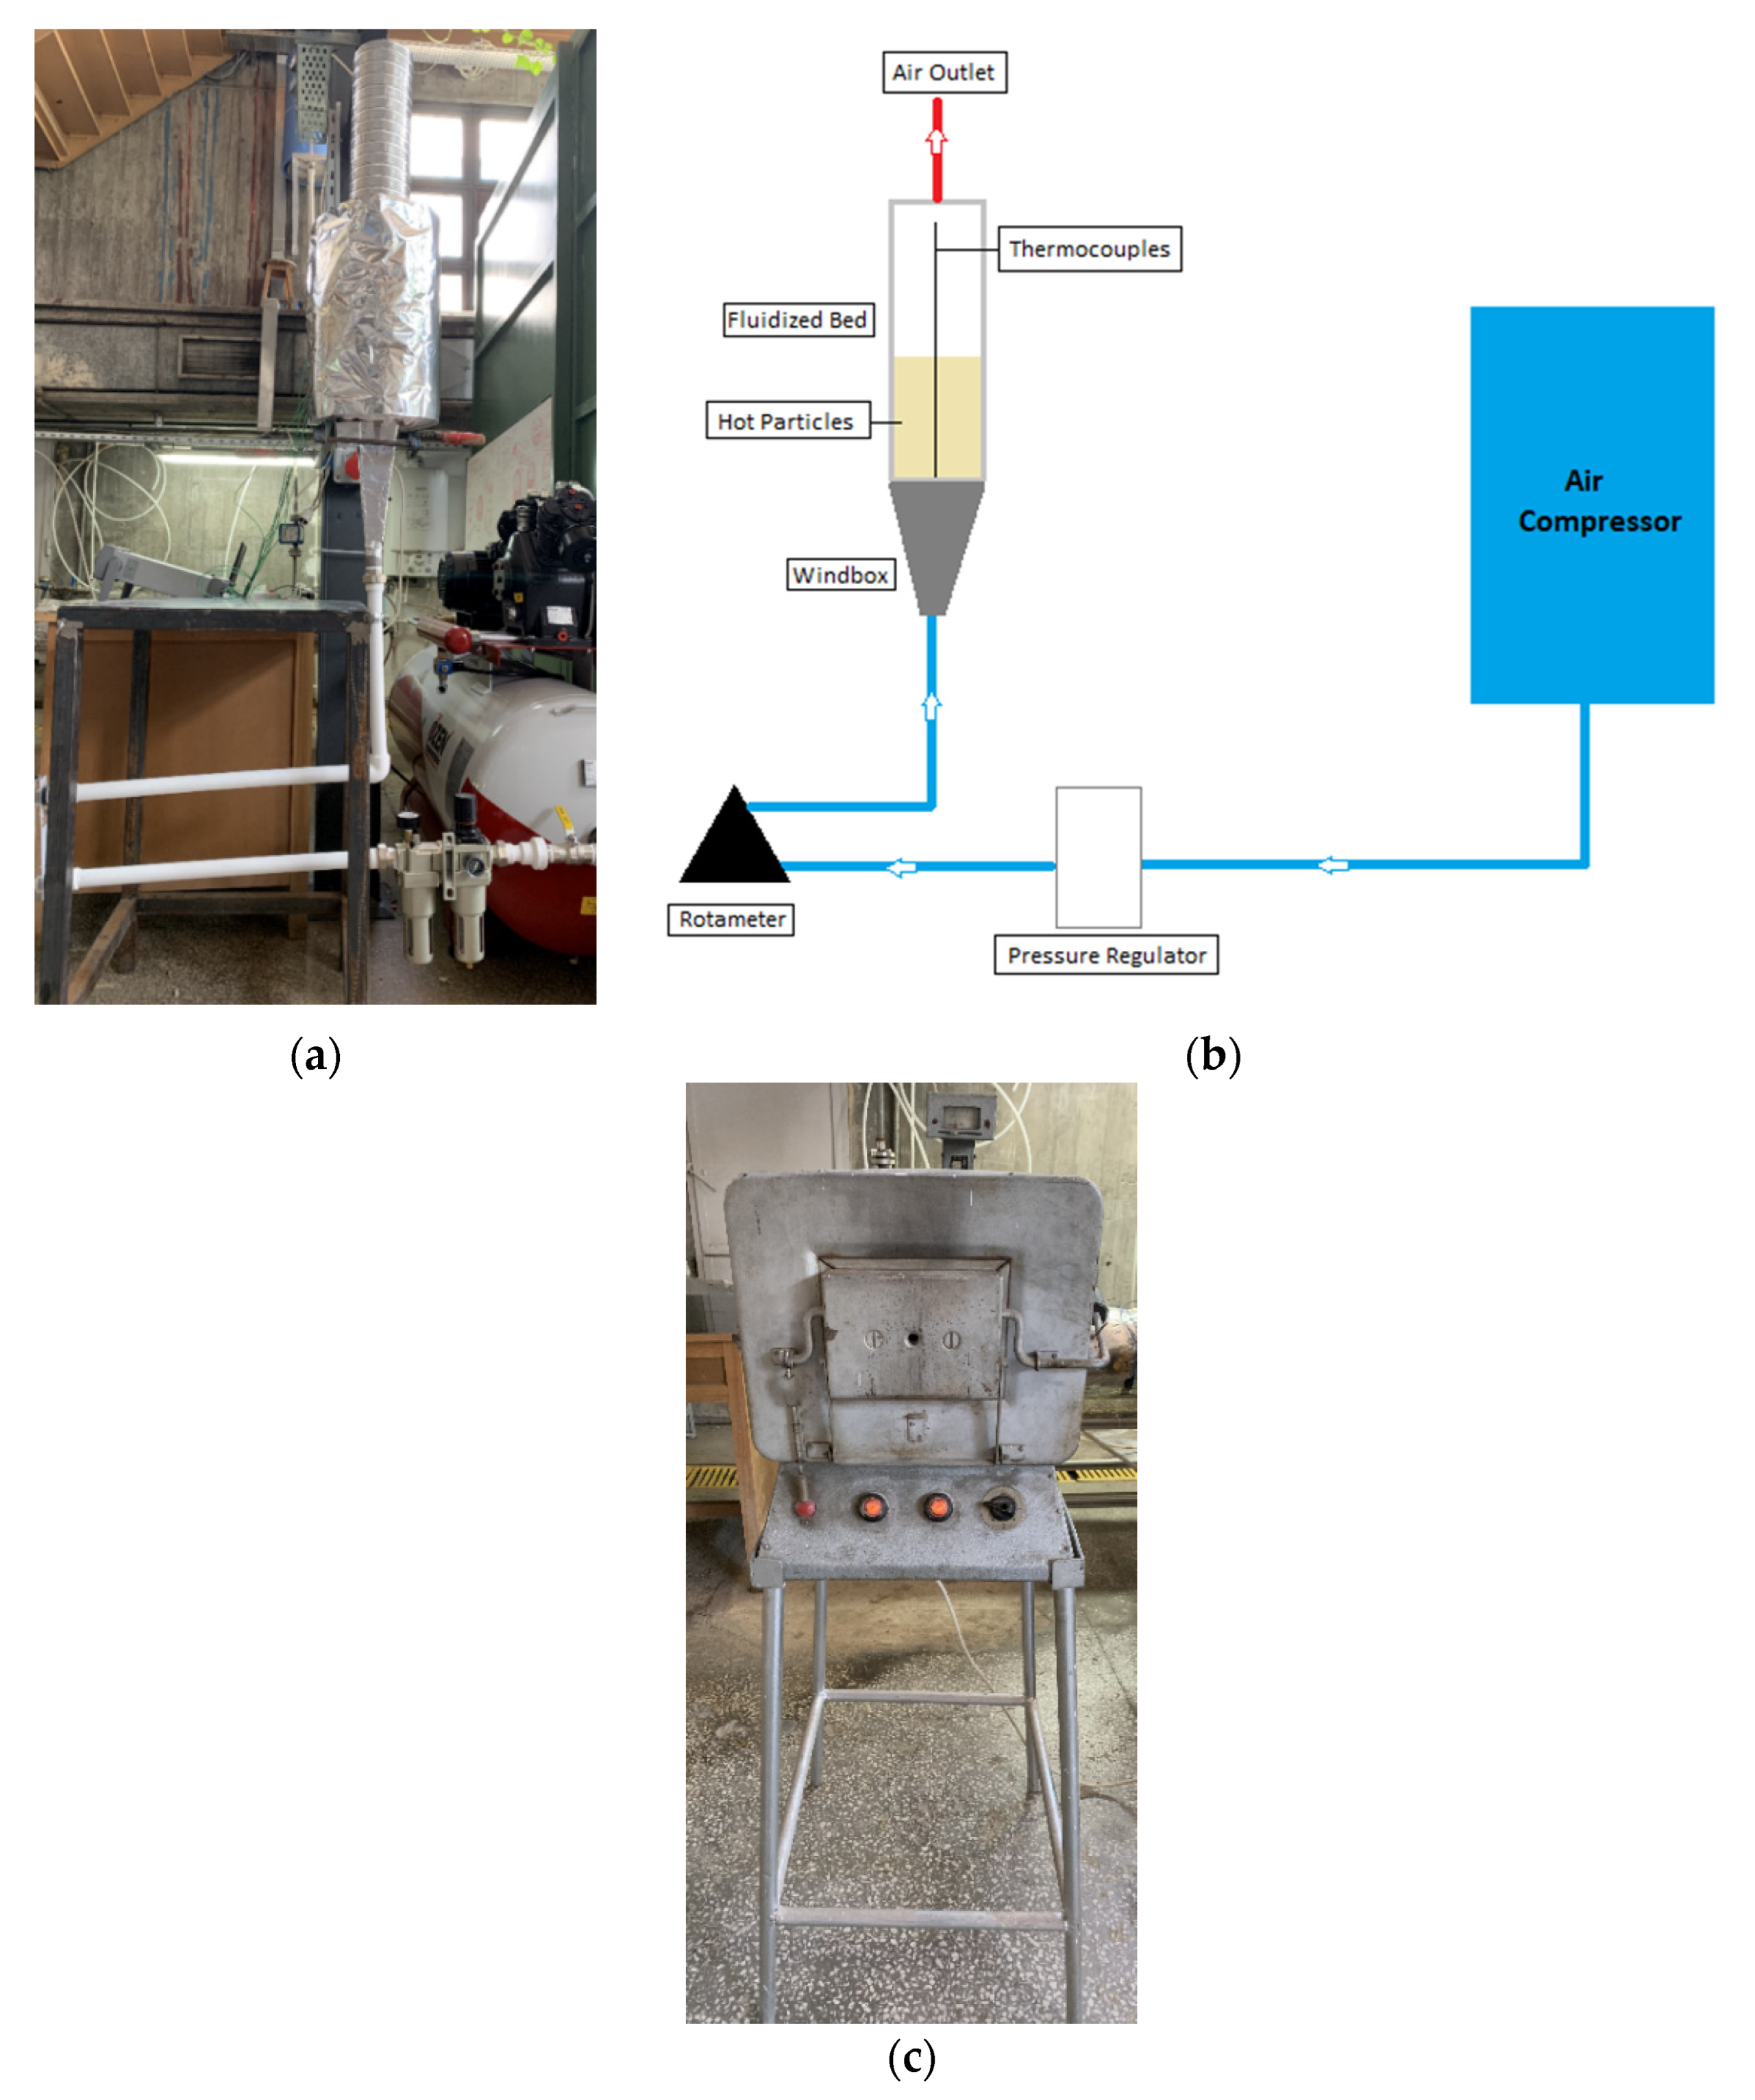
The second part of this investigation involves the thermal (hot) experiments. The setup, as well as a description of its operation processes, is depicted in Figure 2. Due to the incompatibility of plexiglass with high-temperature applications, all walls in the hot tests are made of stainless steel with a 2 mm thickness.
Before commencing the thermal tests, the sand and CARBOHSP particles were heated up to 585 K in the furnace, depicted in Figure 2c. Even though the test was set up for high temperatures, experiments with ultra-high temperatures could not be performed due to furnace limitations. To monitor the temperature of the particles and the air, seven K-type thermocouples were planted vertically in the center of the bed at varying altitudes, and the readings were recorded with the Keysight-34972A data logger (Santa Rosa, CA, USA). A tube was used to hold the thermocouples in position. In addition, a ceramic blanket insulation of 10 cm in thickness was placed on the outside of the bed, having a specific heat capacity of 1000 J/kgK and thermal conductivity of 0.1 W/mK. The same superficial velocities as those used in the cold experiments were applied to the bed in the hot experiment.
3. Numerical Study
Due to measurement inaccuracies in particle and gas temperatures, the experimental estimation of the particle-to-gas heat transfer coefficient has proven problematic in the field and in general. Additionally, because FBs have a complicated flow pattern, the particle-to-gas heat transfer coefficients reported in the literature vary significantly depending on the flow regime [12].
Since the rate of heat exchange between the two phases in FBs is unknown and difficult to predict, computational fluid dynamics (CFD) can shed light on the heat transfer mechanism in the system. Therefore, the bubbling FB-TES system is numerically modeled to assess the degree of heat recovery from heated particles during discharge. The bed geometry, solid particles, and fluidizing gas are the main physical components of the system. The dimensions of the bed are the same as the ones utilized in the experimental setup. The physical properties and important operating parameters, as well as the initial and boundary conditions, are listed in Table 1. Moreover, the properties and parameters utilized for each particle in the model are given in Table 2. The particles are polydisperse particles and the average diameter is considered for computations.
The FB is made up of two phases: gas and solid. Therefore, the required numerical model was built in commercial software ANSYS Fluent based on a multiphase flow, TFM, with the Eulerian–Eulerian approach. This method considers the gas and solid phases to be interpenetrating continua. For each phase, mass, momentum, and energy balance equations are derived individually, and the interphase momentum and the heat exchange terms in the equations connect two phases. All the models and the sub-models utilized in the numerical representation are presented in Table 3. The interphase momentum exchange was closed using the Syamlal O’Brien [24,25] method. Particle–particle interactions were modeled using the theory of granular flows (KTGF) [26]. This theory states that the motion of the solid particles is similar to the fluctuating kinetic energy of the molecules in dense gas, and so the granular temperature (Θs) is used to describe the fluctuating component of the particle velocity. The shear viscosity, which has three components [27], kinetic, collision, and friction, was taken into consideration in the model. The solid pressure was calculated using the correlation suggested by Lun et al. [28], which reflects typical solid-phase pressures due to particle–particle interactions. The radial distribution function, which characterizes the likelihood of particle collisions, was modeled using the distribution function proposed by Syamlal O’Brien [27]. The Gunn correlation [29], which is suggested for granular flows, was used to calculate the interphase heat exchange between the two phases. All these models and methods are implemented in ANSYS Fluent using user-defined functions (UDFs).
Due to temperature fluctuations over time, the thermal characteristics of air and sand are not constant. As a result, a piecewise linear approach was used to make them temperature-dependent. In general, the thermal characteristics of the particles vary linearly with temperature. Specific heat capacity and the thermal conductivity values for sand and CARBOHSP are assigned as a function of temperature according to the experimental data given in the literature [30,31]. The thermal conductivity of the stainless steel and insulating materials, as well as their thickness, are critical to the thermal performance of the bed. Therefore, the shell approach was used to consider the heat loss from the walls. The convection heat transfer coefficient at the outer surface is computed by the correlation given in [32].
All simulations were conducted in transient mode using a pressure-based solver. The flow in the bed is considered laminar. For all simulations, the initial condition of minimum fluidization is employed. At the bottom of the bed, a uniform inlet velocity and a uniform inlet temperature are considered for the gas phase only, since the computational domain does not include any solid entrance. At the top exit section of the bed, a pressure outlet boundary condition is applied. The no-slip wall boundary condition is assigned for air, while the partial-slip wall boundary condition of Johnson and Jackson [33] with a specularity coefficient of 0.1, as recommended in [12], has been applied for the particle phase.
For momentum, granular temperature, and energy, the second-order spatial discretization was employed; the second-order implicit method was used for the transient formulation, and the QUICK method [27] was used for the volume fraction. Furthermore, the semi-implicit method for pressure-linked equations (SIMPLE) algorithm [27] was utilized to calculate the pressure–velocity coupling. With the exception of the energy equations, which were adjusted to 10−6, all values were subjected to the default convergence tolerance of 10−3.

Table 3.
Models and sub-models.
| Model | Equation |
|---|---|
| Conservation of mass [13] | |
| Conservation of momentum [13] | |
| Conservation of energy [13] | |
| Volume fraction [13,24] | |
| Interphase momentum [24,25] | |
| Drag [24,25] | |
| Phase stress tensor [27] | |
| Transport equation for granular temperature [11] | |
| Solid pressure [27] | |
| Granular temperature [34] | |
| Collisional energy dissipation [28] | |
| Radial distribution function [27] | |
| Solid shear viscosity [27] | |
| Kinetic viscosity [27] | |
| Collisional viscosity [27] | |
| Frictional viscosity [33] | |
| Frictional pressure [26] | |
| Solid bulk viscosity [28] | |
| Gas bulk viscosity [28] | |
| Interphase heat transfer [27,29] |
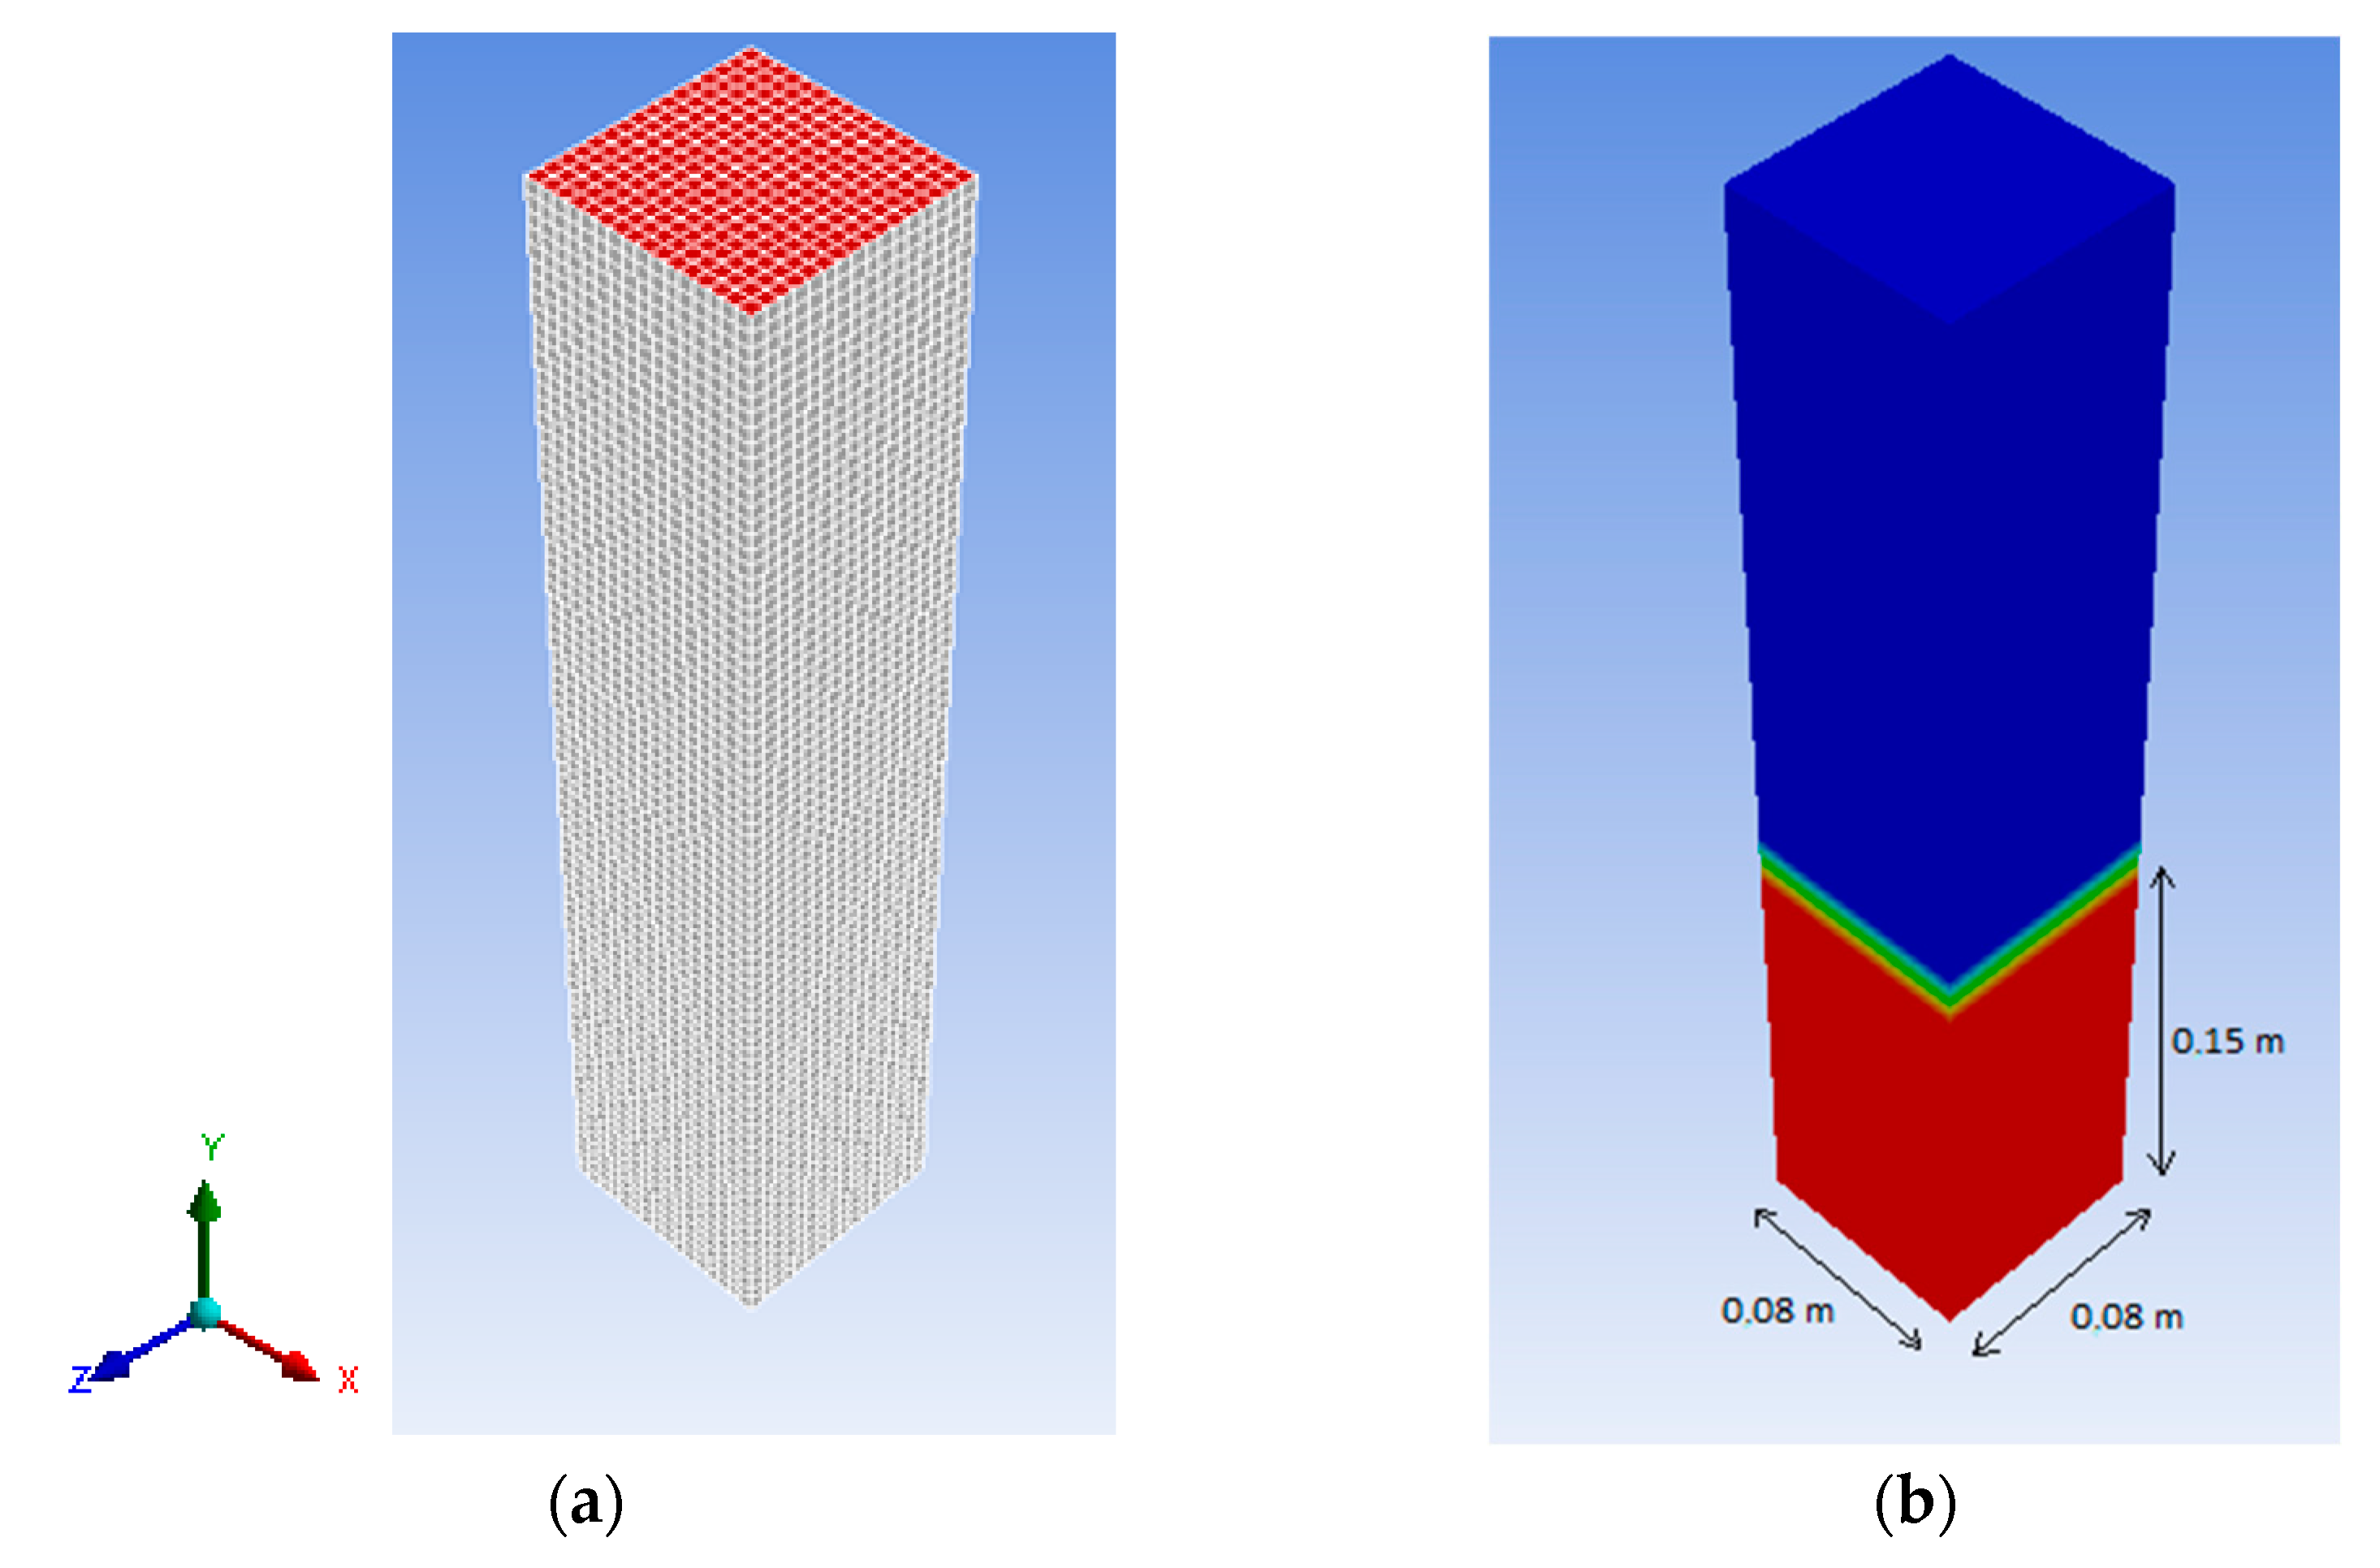
Meshes of hexahedral shapes were generated using the ANSYS meshing tool. The related tests were already carried out in [12] for grid independency and the selection of time steps to be used in the current transient study. Ultimately, 5 mm × 5 mm × 5 mm mesh sizes and a time step size of 0.001 s were selected as suitable ones, respectively. The meshed domain is illustrated in Figure 3a. The initial static bed height, according to the experiment, is specified as 0.15 m, as shown in Figure 3b.
4. Results and Discussion
The main goal of this study is to validate our numerical model from the hydrodynamics and thermal perspectives utilizing data from experimental assessments. Next, the verified model will be used to evaluate the performance of the bed at extremely high temperatures. As a consequence, in this section, the results from both experiments and simulations are presented and, in certain cases, are compared with each other to validate the numerical model and verify the simulation results.
4.1. Hydrodynamics Results
Significant metrics in hydrodynamic result verification include pressure drop, voidage profiles, bed height variation, granular particle velocity distribution, and the shape of the bubbles. Pressure drops and expansion ratios are dealt with in this work based on their appropriate computational properties [12]. The change in pressure drop in a particular portion of the FB is a typical measure in the hydrodynamic domain. In principle, as velocity increases, the pressure drop increases linearly until it reaches a minimum fluidization condition, beyond which it remains constant at greater velocities.
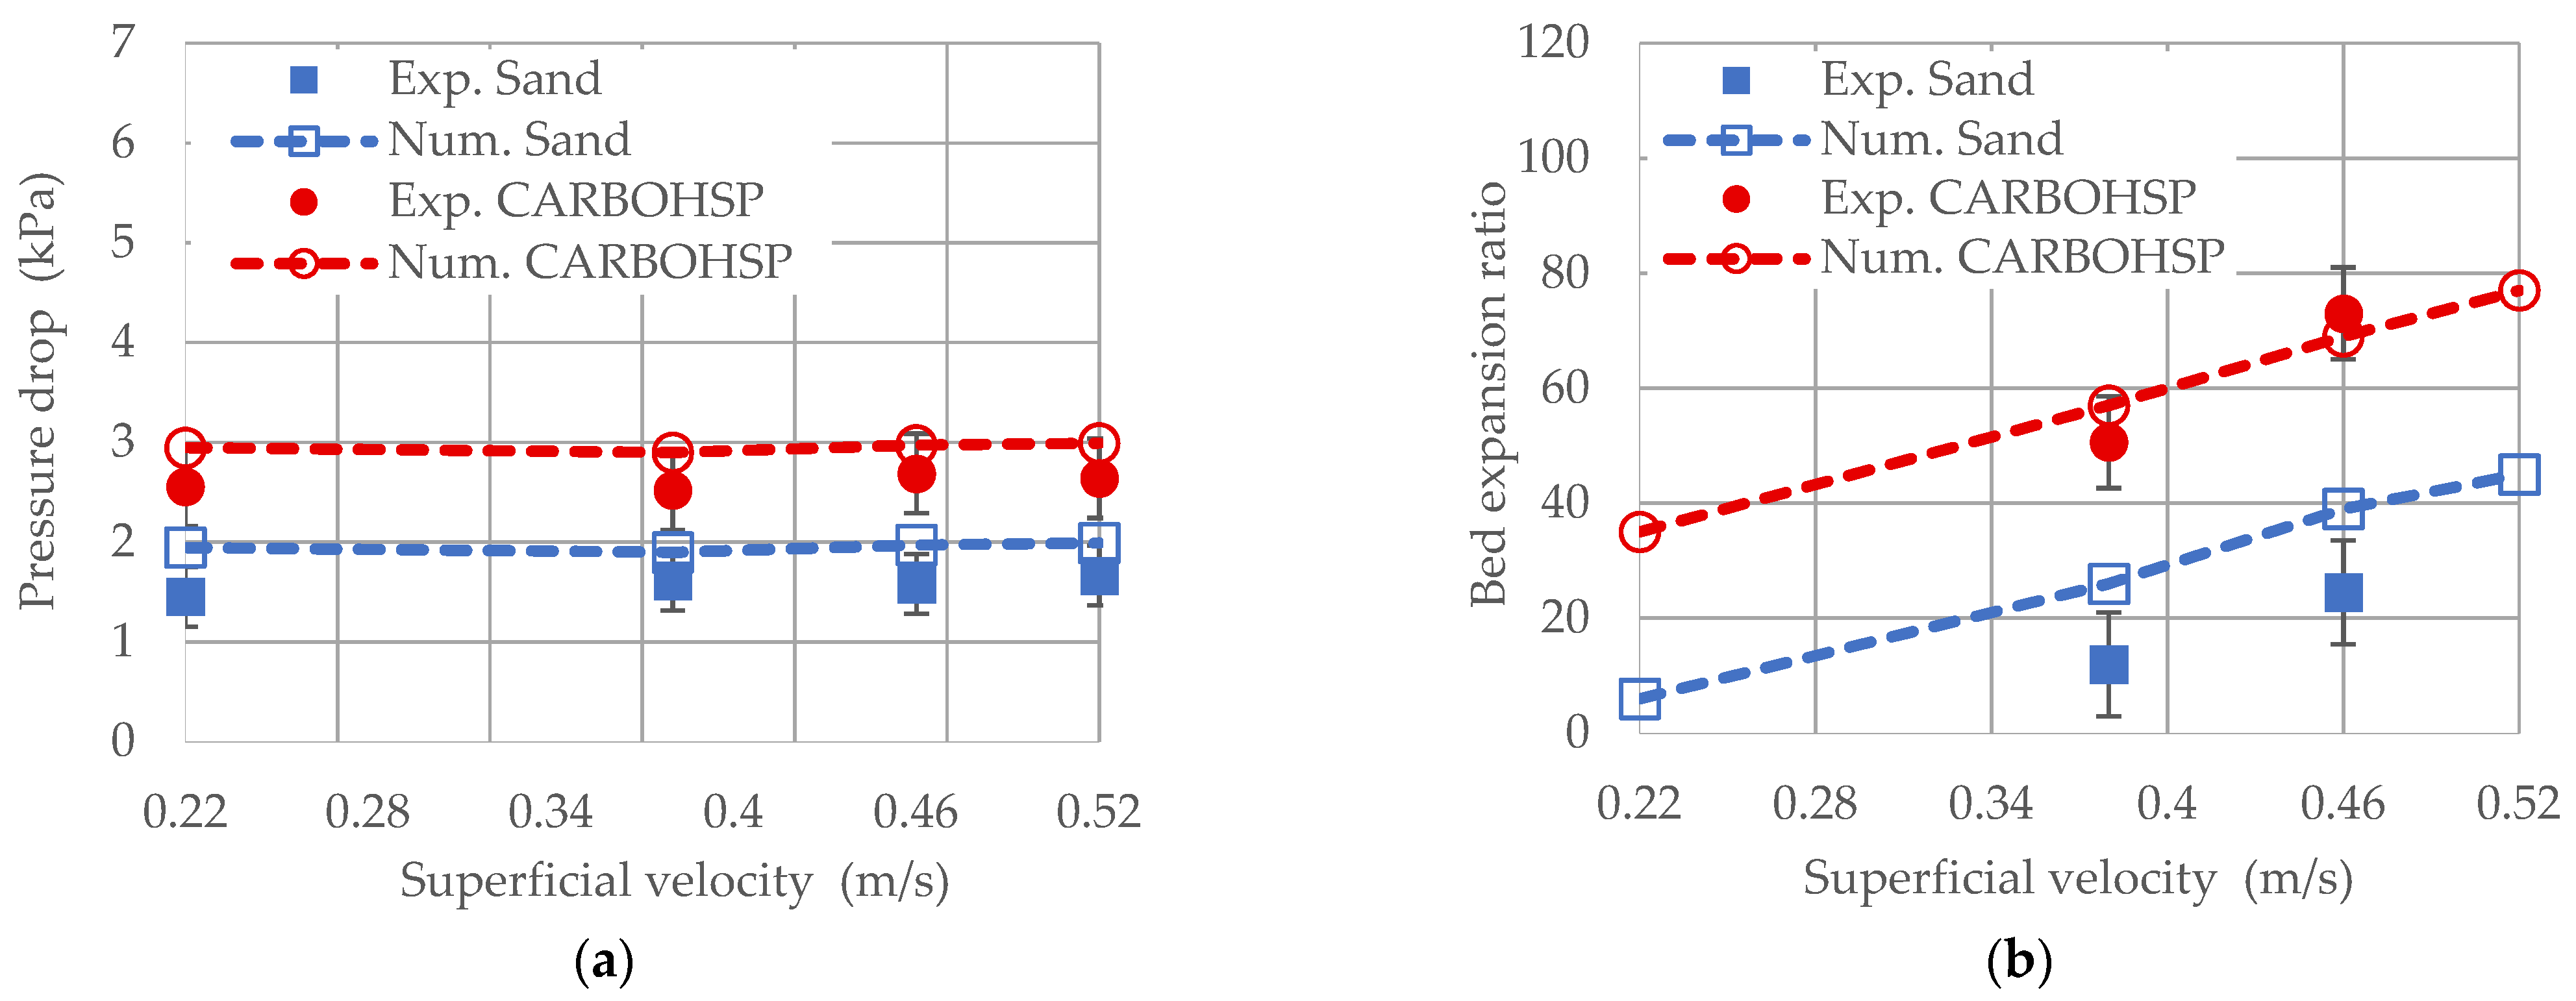
Surface velocities of 0.22, 0.38, 0.46, and 0.52 m/s were used in the pressure drop studies. The simulation results were validated with experiments to consolidate their accuracy and repeatability. The experimental and numerical results of the pressure drop across the bed are shown in Figure 4a, which tend to be almost constant, as expected. The pressure drop across the bed with CARBOHSP particles is greater than with sand. The explanation for this has to do with how pressure is defined in the first place. The weight of the CARBOHSP particles is greater than the weight of the sand particles in the same volume. Since the bed cross-sectional area is the same in both cases, the pressure drop in the fluidized bed containing CARBOHSP particles is higher.
The bed expansion ratio is another common measure for comparing the hydrodynamic behaviors of particles. The degree of expansion of the dense phase and the bubbles influence bed expansion in two-phase FB systems. Increasing the superficial velocity beyond the minimum fluidization point produces bubbles, causing bed expansion due to the volume filled by the gas bubbles. The bed expansion ratio is calculated by dividing the bed expansion by the original bed height:
In Figure 4b, approximate time averaging of fluctuations is used to compare the changes in experimental and numerical results for the bed expansion ratio. As the superficial velocity increases, the bed expansion ratio increases as well. At the same surface velocities, the CARBOHSP particles have a greater bed expansion ratio than sand particles. The difference is due to the smaller diameter and higher sphericity of the CARBOHSP particles.
The disparity between the experimental and simulation results is due to the inability of Syamlal O’Brien’s drag model to account for fluidization at low speeds [12]. The filters fitted under the lower manometer and above the upper manometer may also be the source of the few modest variations in the results obtained in the hydrodynamic experimental investigations. However, these filters are necessary to keep particles from exiting the bed, where they also cause an additional pressure reduction.
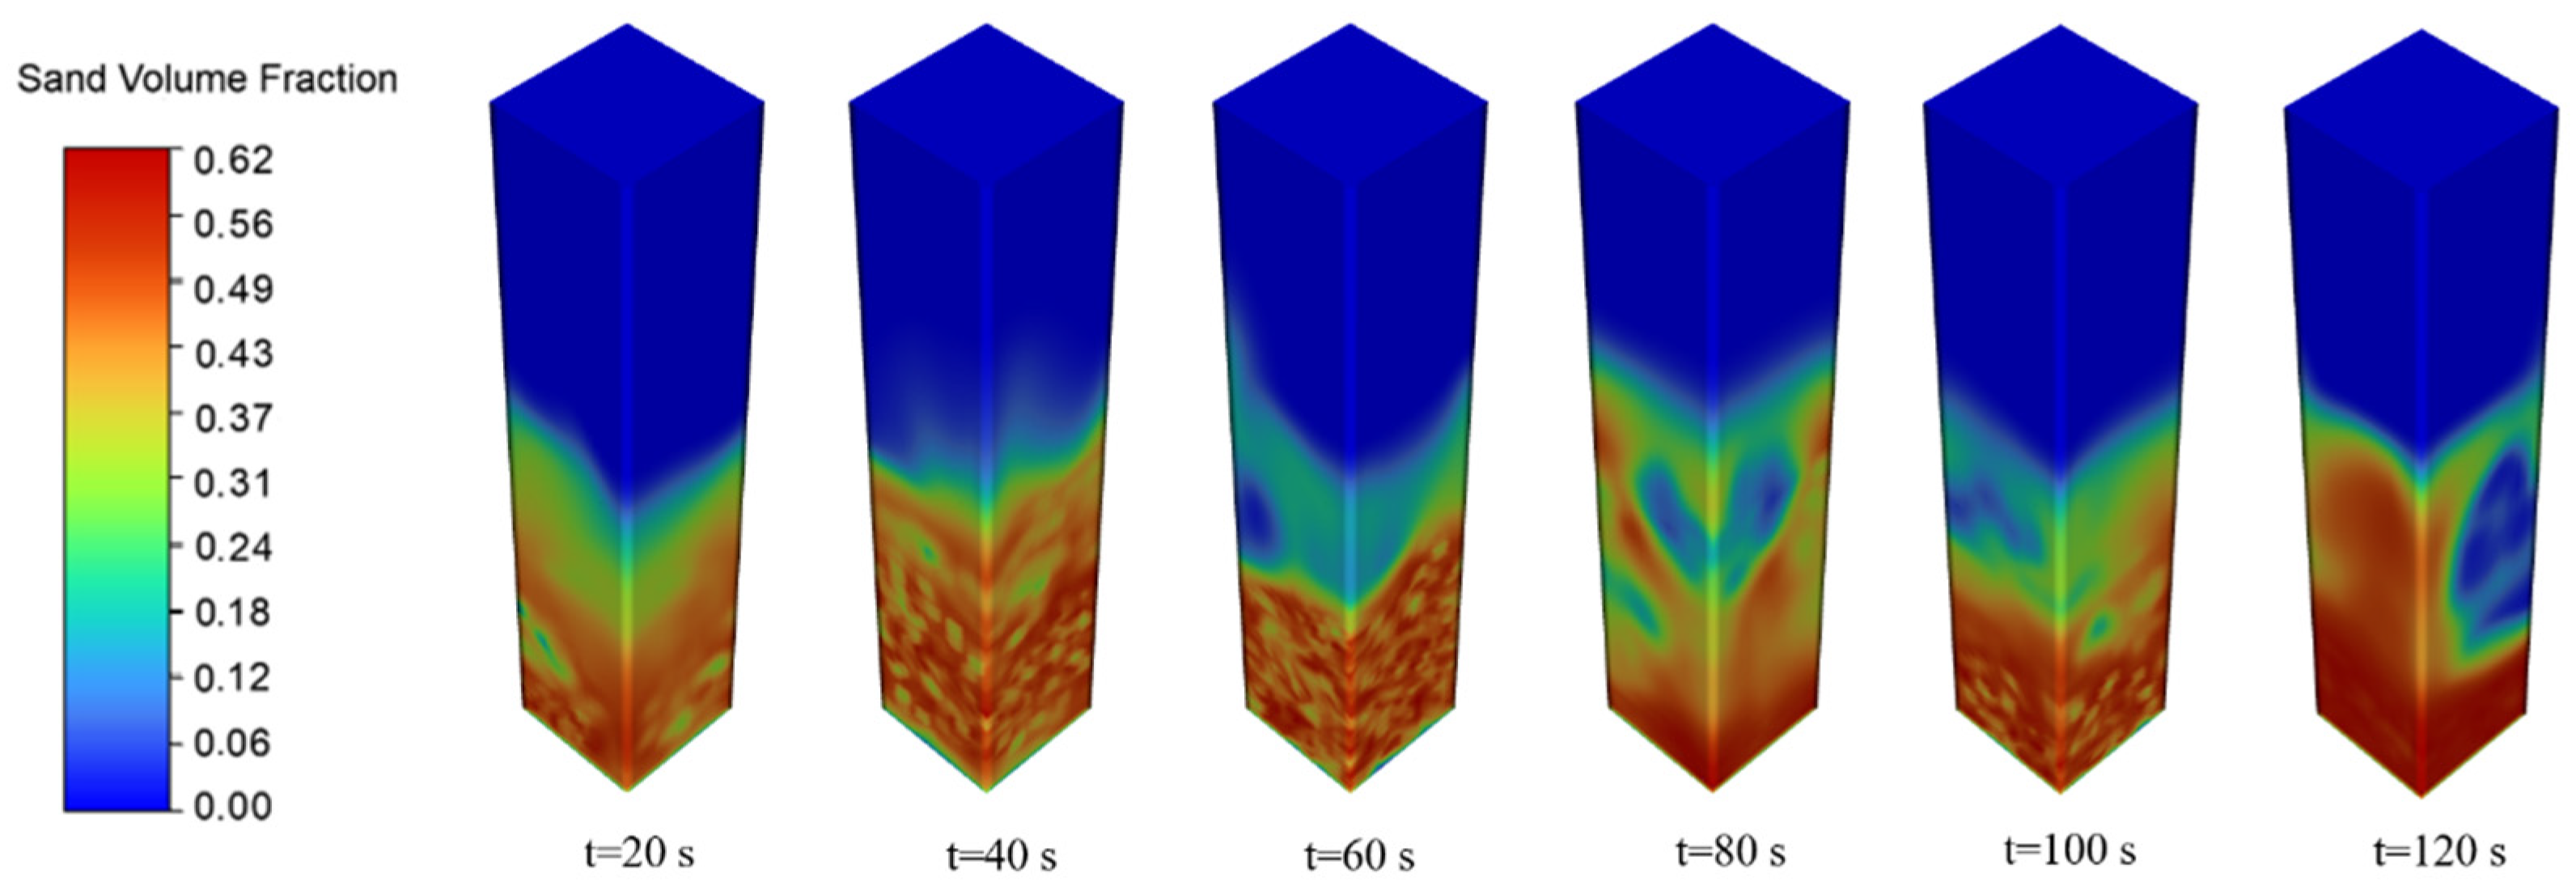
Figure 5 illustrates FB behavior by displaying snapshots of the 3D contour plot of the solid volume fraction obtained at various time intervals. The largest solid volume fraction is represented in red, while the minimum value of zero is represented in blue. As seen in the figure, bubbles formed at the bottom move up to the bed surface as their sizes increase. When solid particles reach the bed surface, large bubbles burst, forcing them towards the wall. The particles subsequently descend to the ground as a result of gravity.
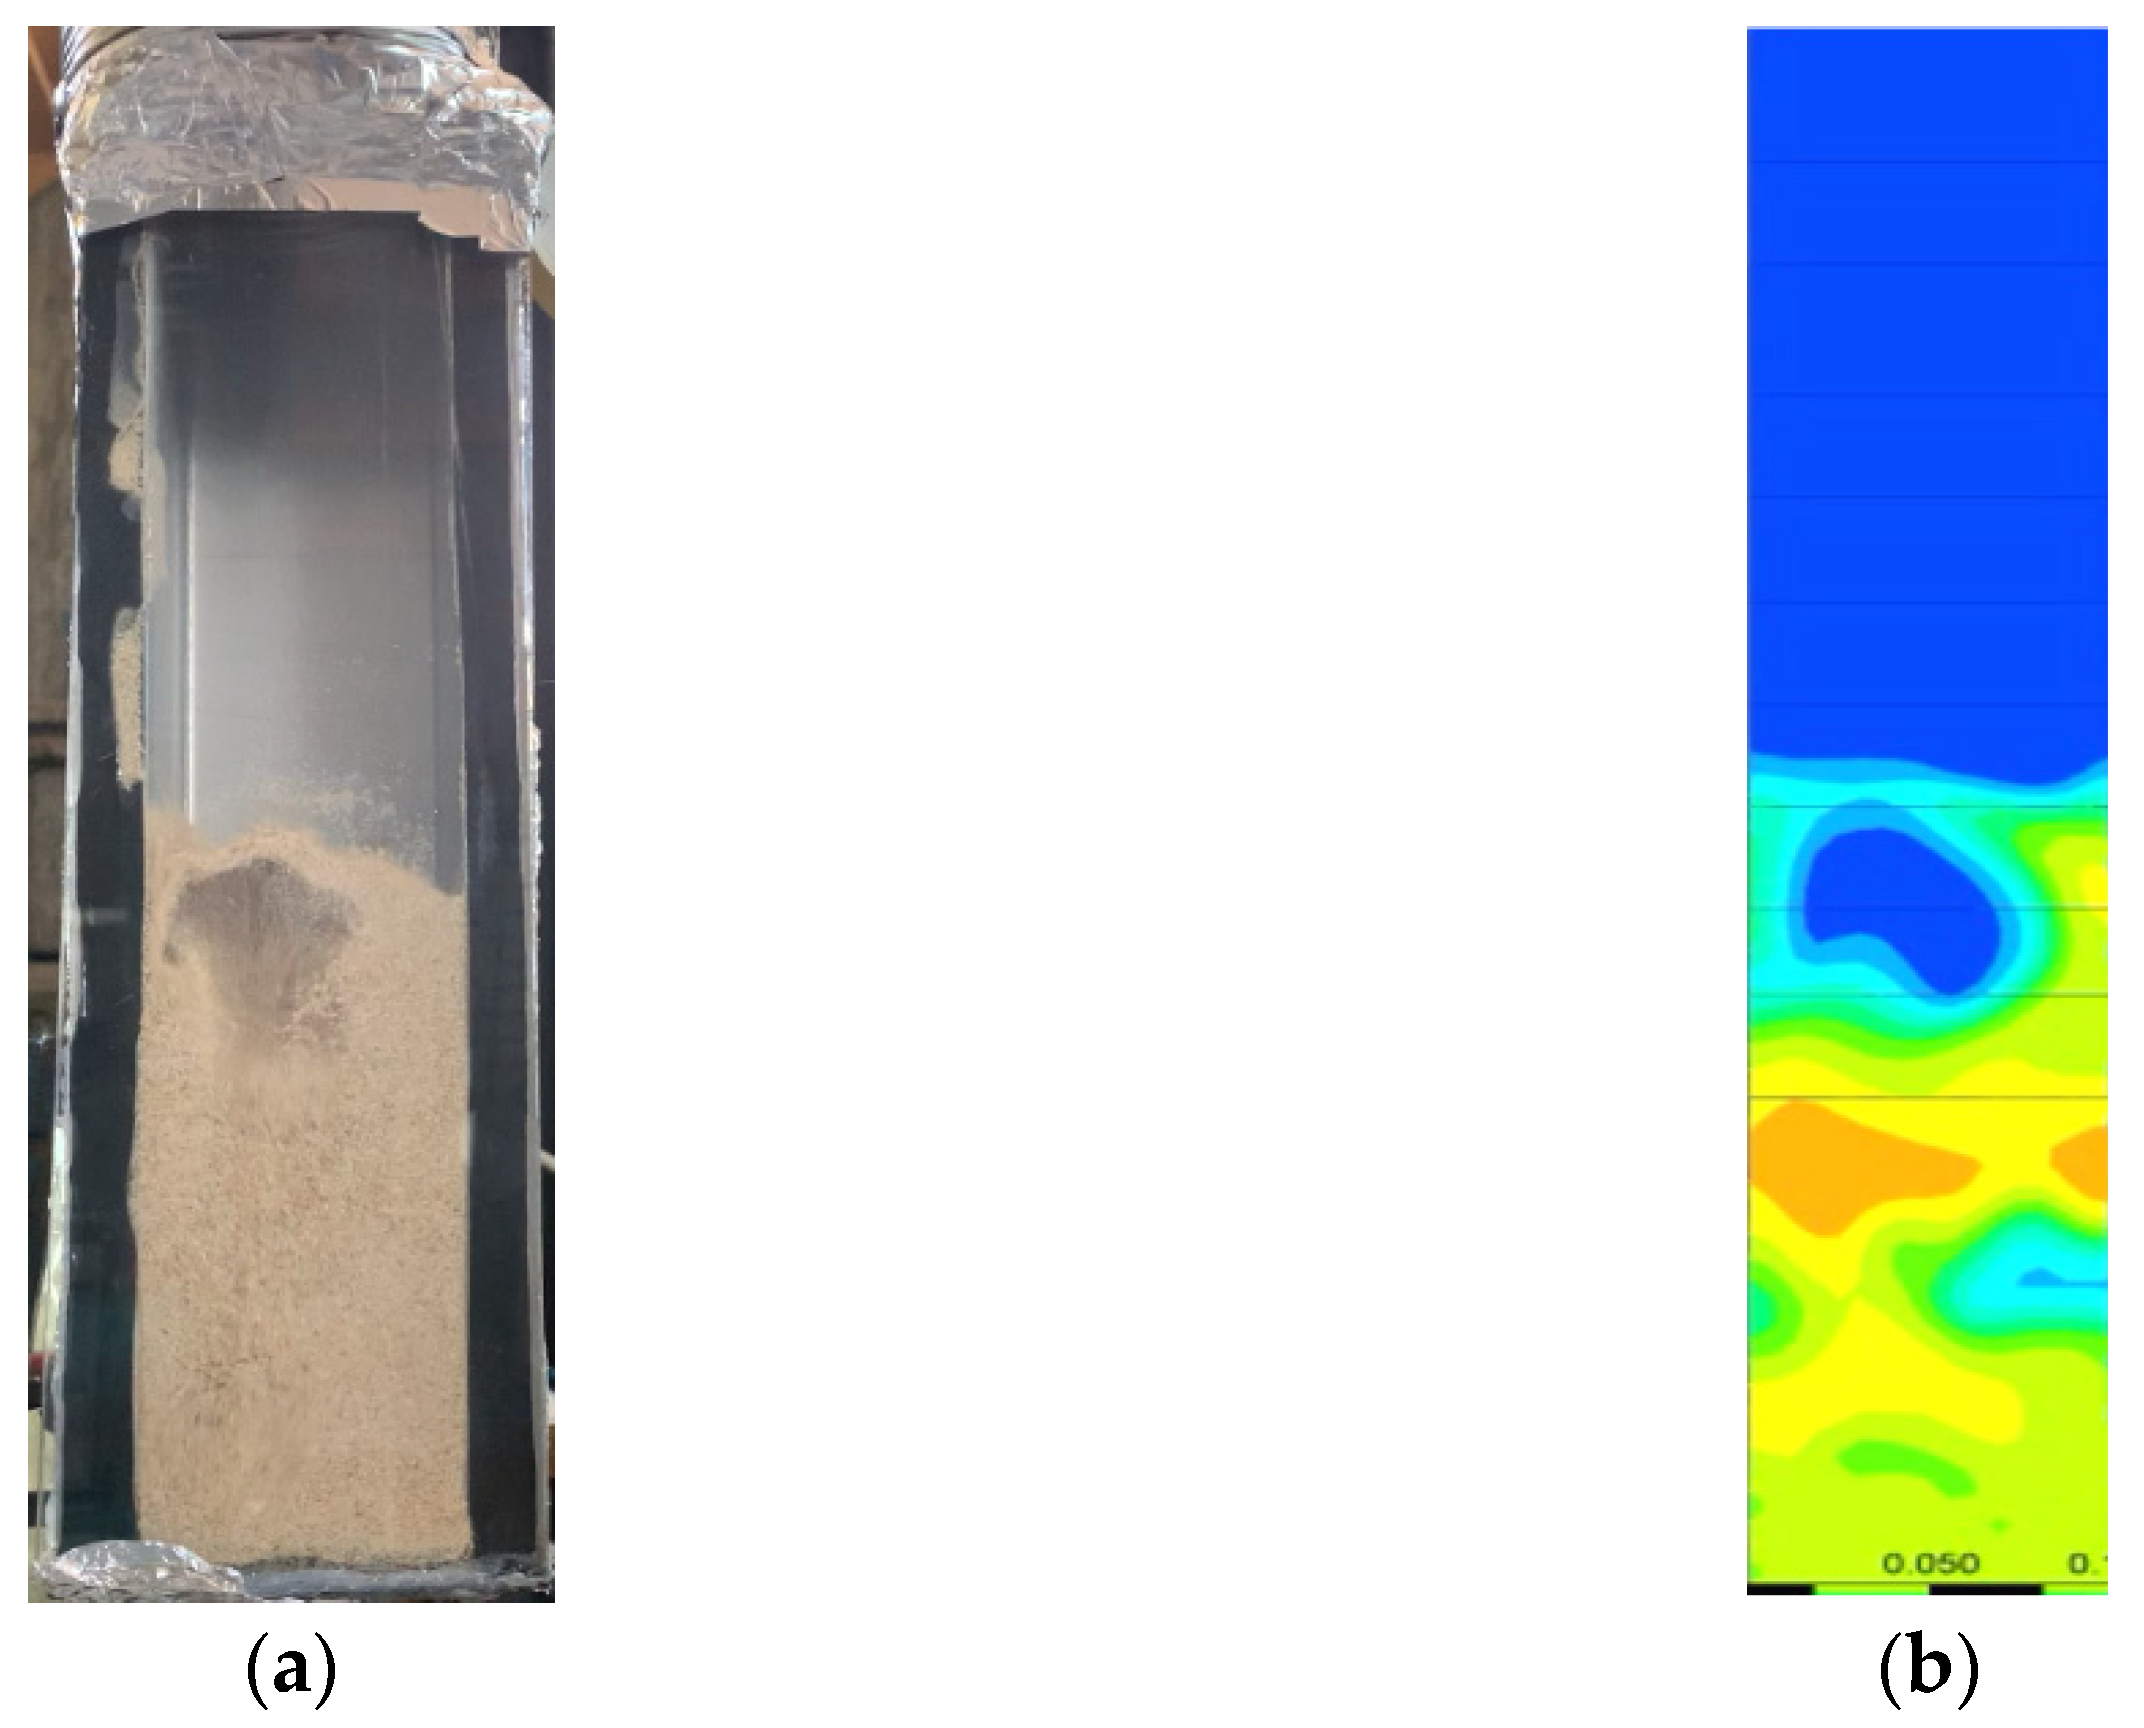
Furthermore, a comparison between the experimental and numerical results in capturing the typical behavior of particles is shown in Figure 6 for the case in which the inlet velocity is u = 0.38 m/s. The snapshot is taken for the solid volume fraction in the mid-plane of the computational domain. Similar bubble morphologies can be easily recognized from this figure, obtained from both experimental and numerical analyses.
4.2. Thermal Results
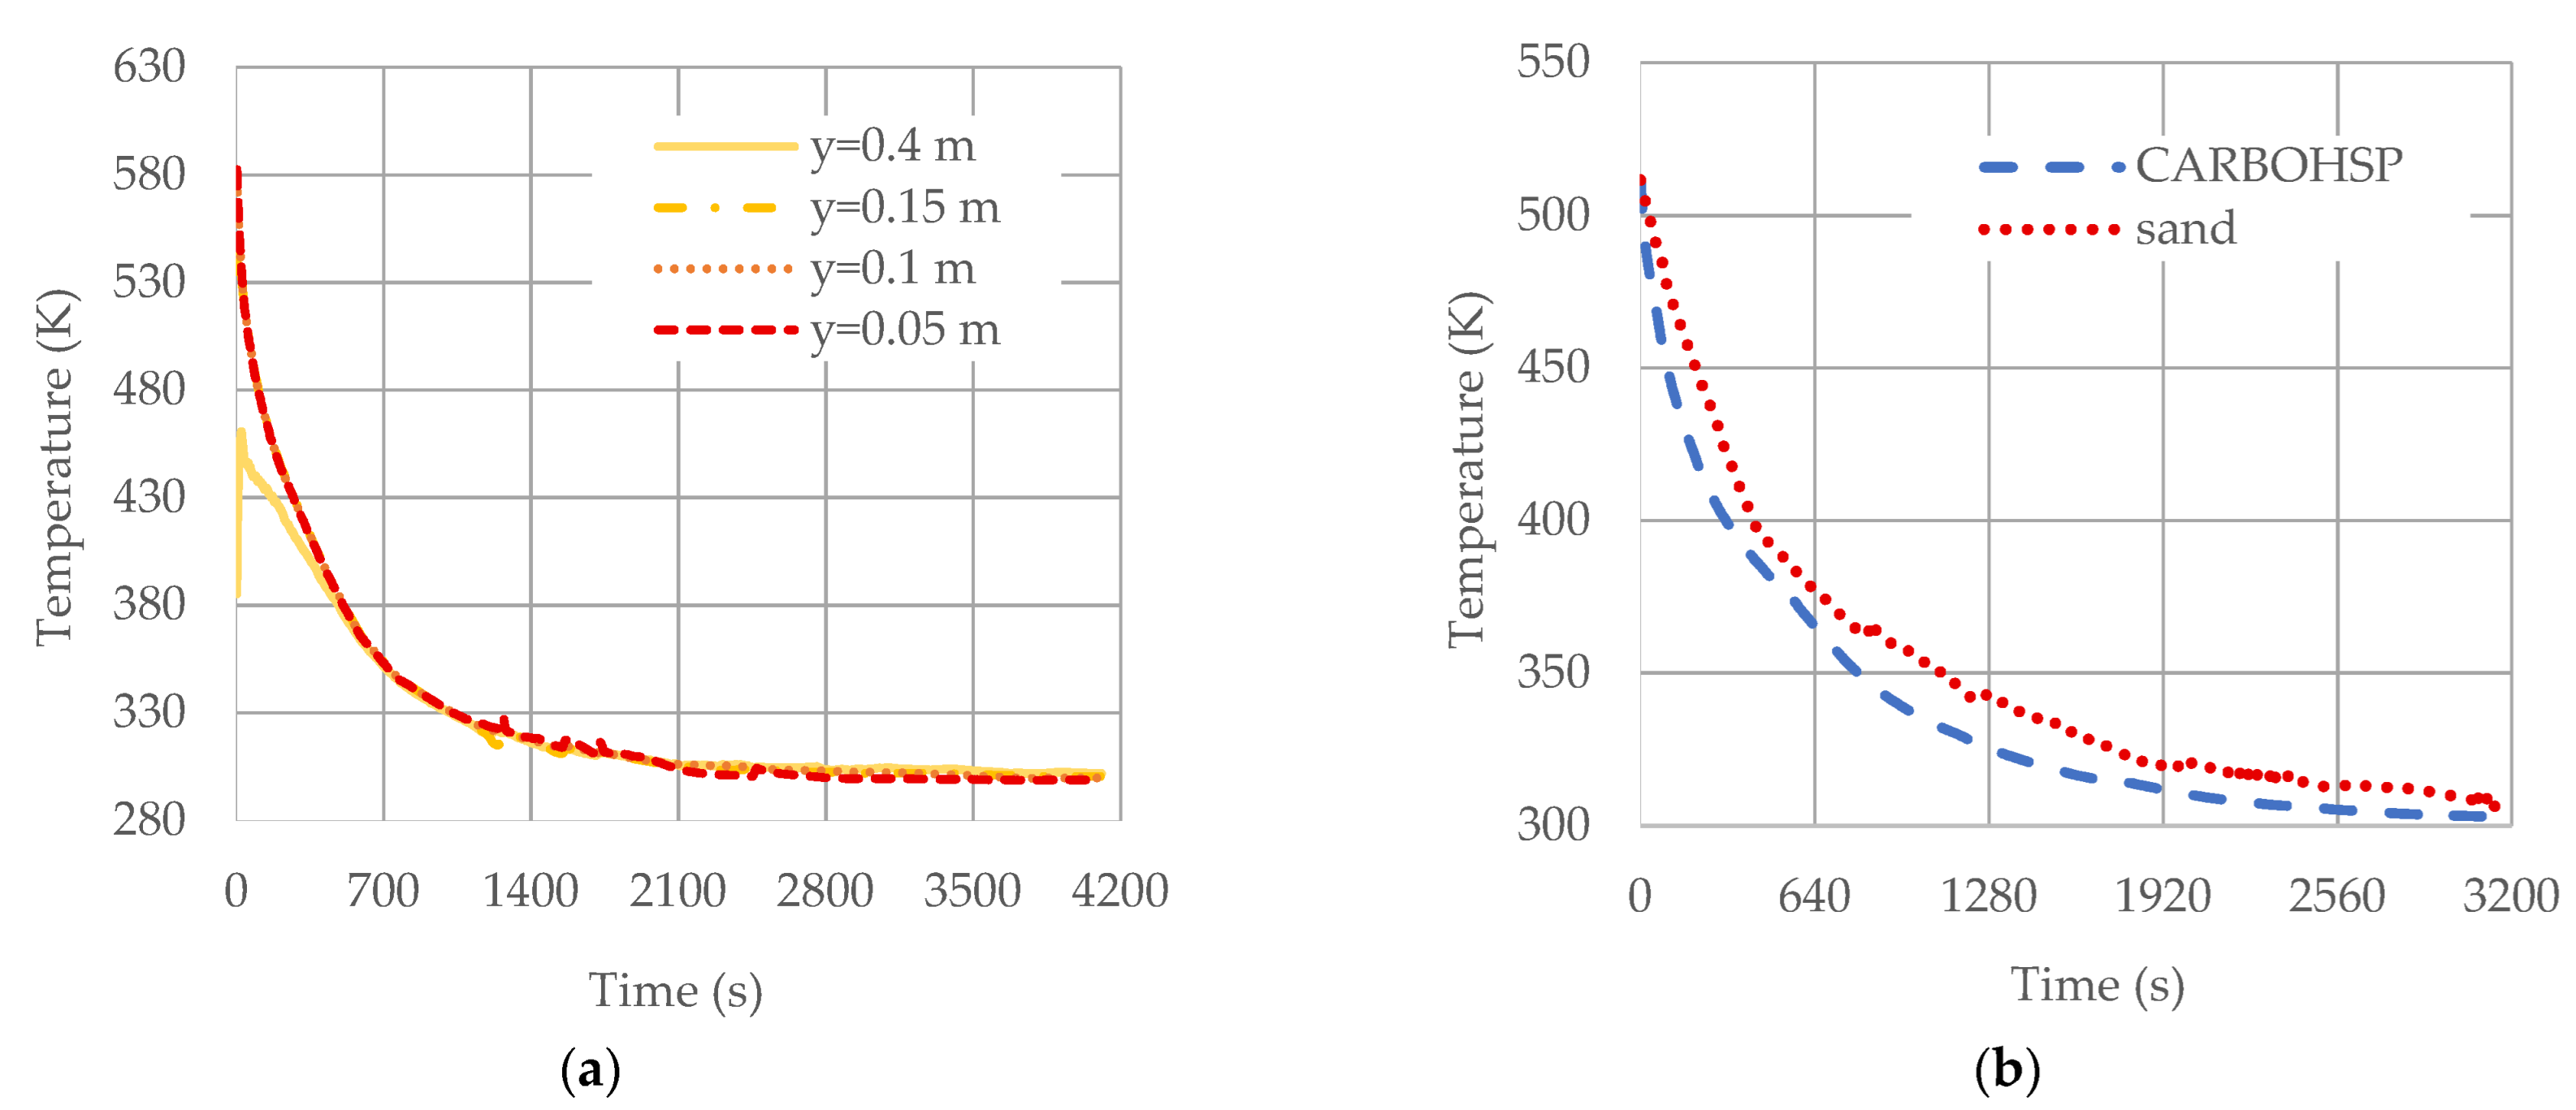
The capacity to store heat and obtain hot air from heated particles is the main advantage of the FB-TES systems. In this section, the temperature and the interphase heat transfer coefficient between the phases are used to determine the thermal behavior of the bed. The temperature is monitored at several spots throughout the bed during the experiments. For a more precise comparison, surface-averaged values are collected at y = 0.05, 0.1, 0.15, and 0.4 m from the bottom and along the bed height. The pattern of temperature changes at various heights when u = 0.46 m/s is depicted in Figure 7a. The initial temperature of a measuring point drops as the height rises. The major cause of this issue is that the sand was manually fed into the bed, resulting in a time delay. Despite this, due to the bulk action of the sand particles, all spots display almost the same temperature gradient within a short period. Furthermore, due to the bubbling regime in the bed, certain peaks in the temperature gradient begin to develop. Based on this graph, it can be deduced that during the discharge process, both phases have almost the same temperature. The temperature of the bed falls exponentially to 300 K after roughly 4200 s. The bed energy depletes more slowly when the superficial velocity is reduced. When u = 0.38 m/s, the bed temperature approaches ambient temperature after 5000 s. This indicates that after the start of discharging, the TES system will provide approximately 70 to 83 min of hot air (depending on the inlet velocity). Achieving high efficiency necessitates elevating the air exit temperature over 300 K, rather than collecting thermal energy from particles until this dead-state temperature. Then, for a single bed, a lifespan is defined as the time it takes for it to reach a specified cold silo temperature, which is a design criterion. It is also worth noting that the hydrodynamics constraints should not be overlooked since raising the inlet velocity to achieve higher airflow rates leads to a fluidization regime shift.
The thermal experiment was repeated using CARBOHSP particles to see the difference, if any, between them and sand particles. As seen in Figure 7b, when CARBOHSP particles are used instead of sand, the air temperature becomes somewhat cooler at the same surface velocity. However, in general, the cooling trends for sand and the CARBOHSP particles are identical.
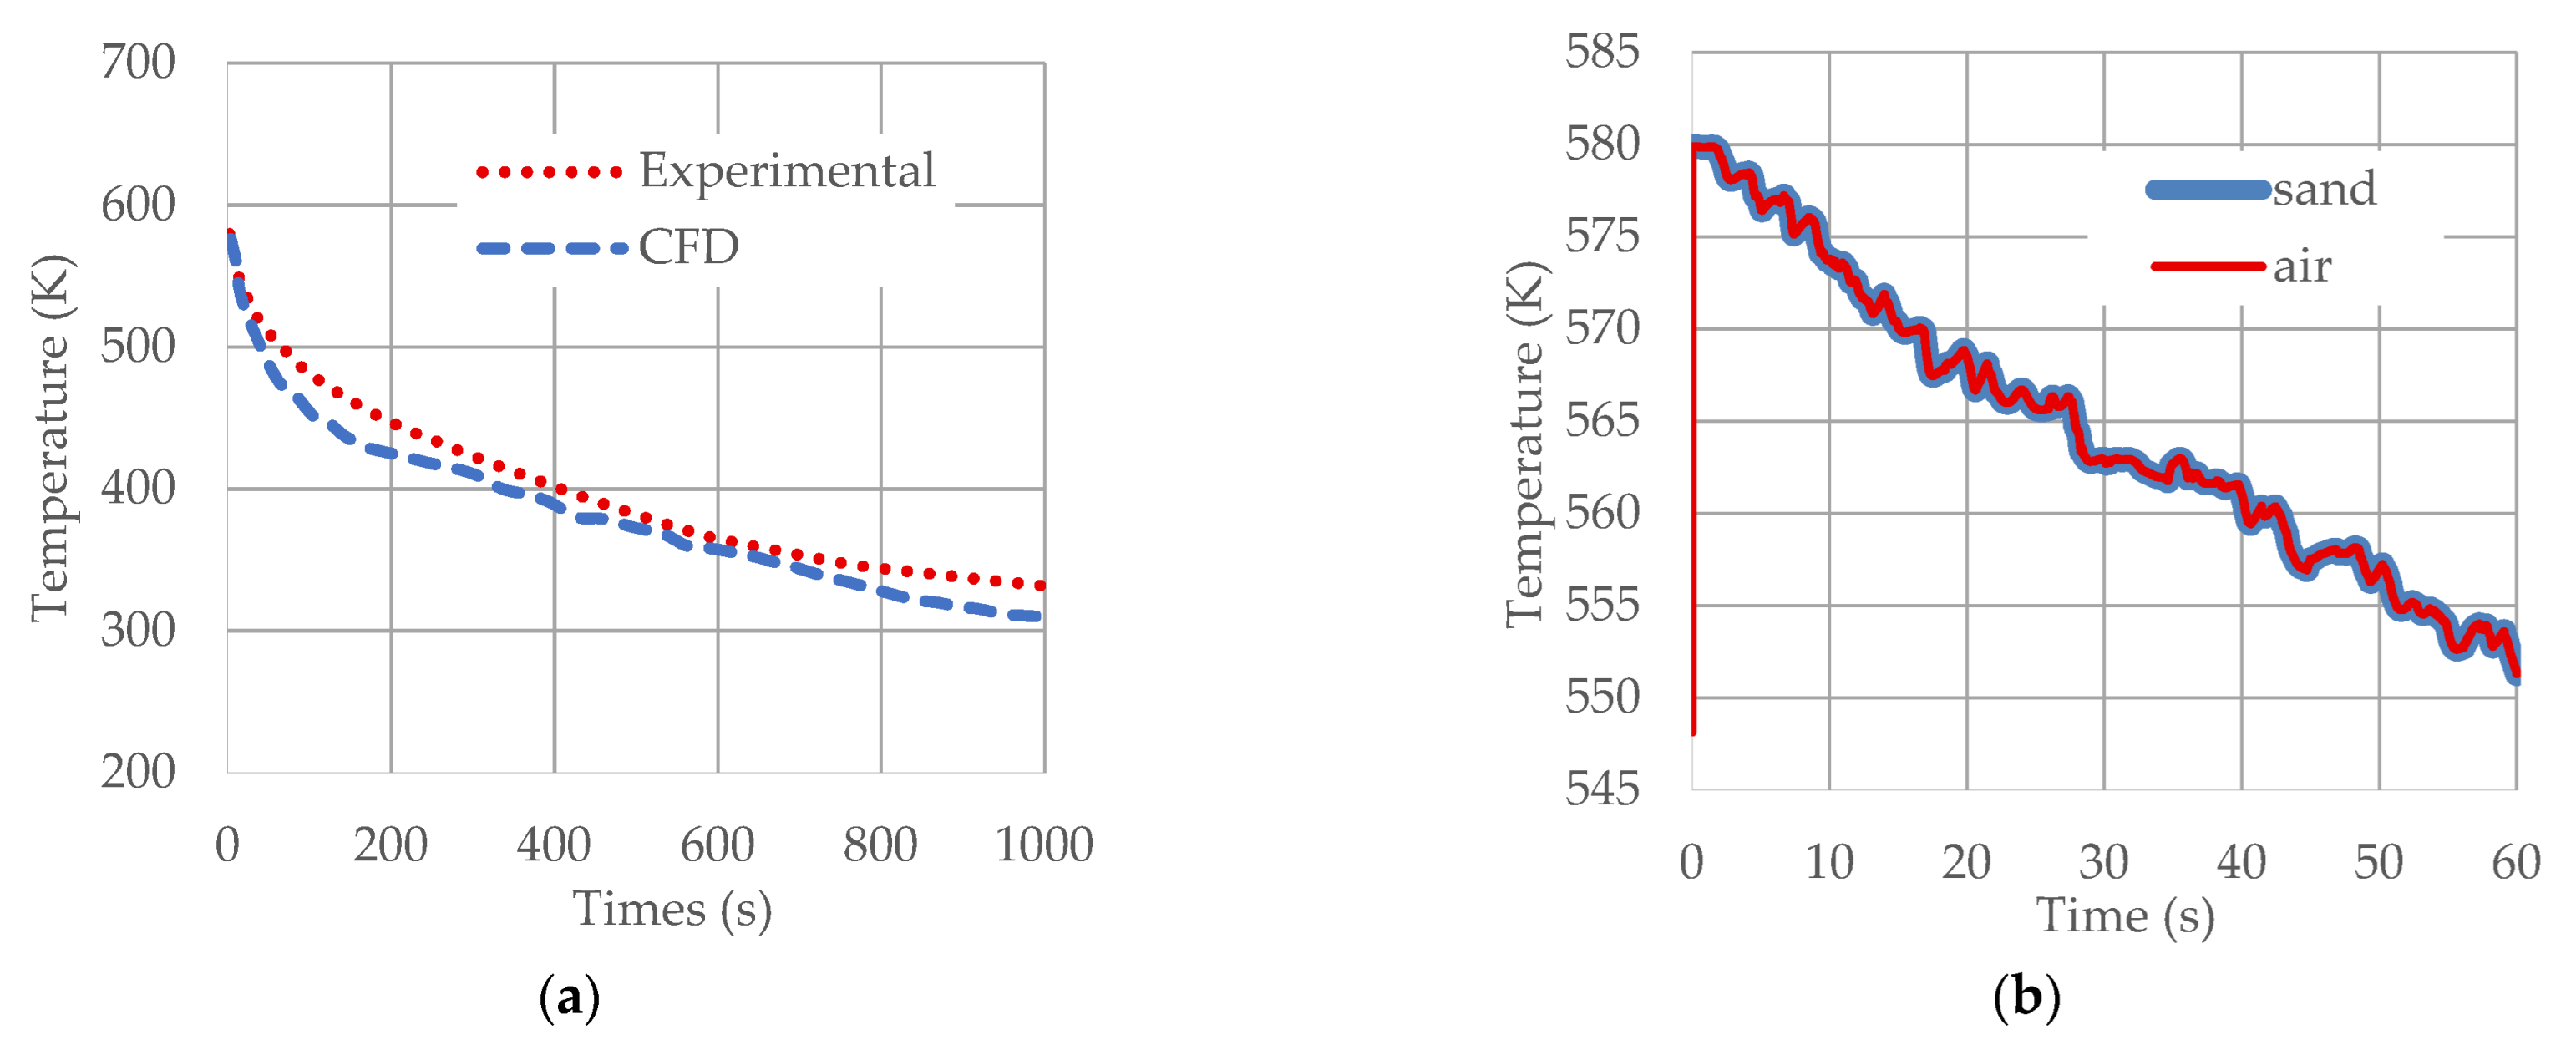
The air temperature changes with time in the experiment and the simulation under the same operating conditions are shown in Figure 8a. The temperature variations correspond to y = 0.1 m, and the surface velocity of 0.46 m/s is presented only for the first 1000 s. The selected location is both the center of the initial bed height and the extreme edge of high fluctuation levels. The observed discrepancies in the thermal data might be due to the heat losses from the insulation and not considering the thermal contact resistance.
Temperature changes in sand and air over time are shown in Figure 8b. Inside the bed, the temperature of the air rises to that of the sand in 0.03 s. This short duration suggests that during the convective heat transfer, air–particle thermal resistance is very low. The bubbling regime in the fluidized bed is the cause of the fluctuating temporal change. The same pattern shows that both phases have approximately the same temperature during the process.
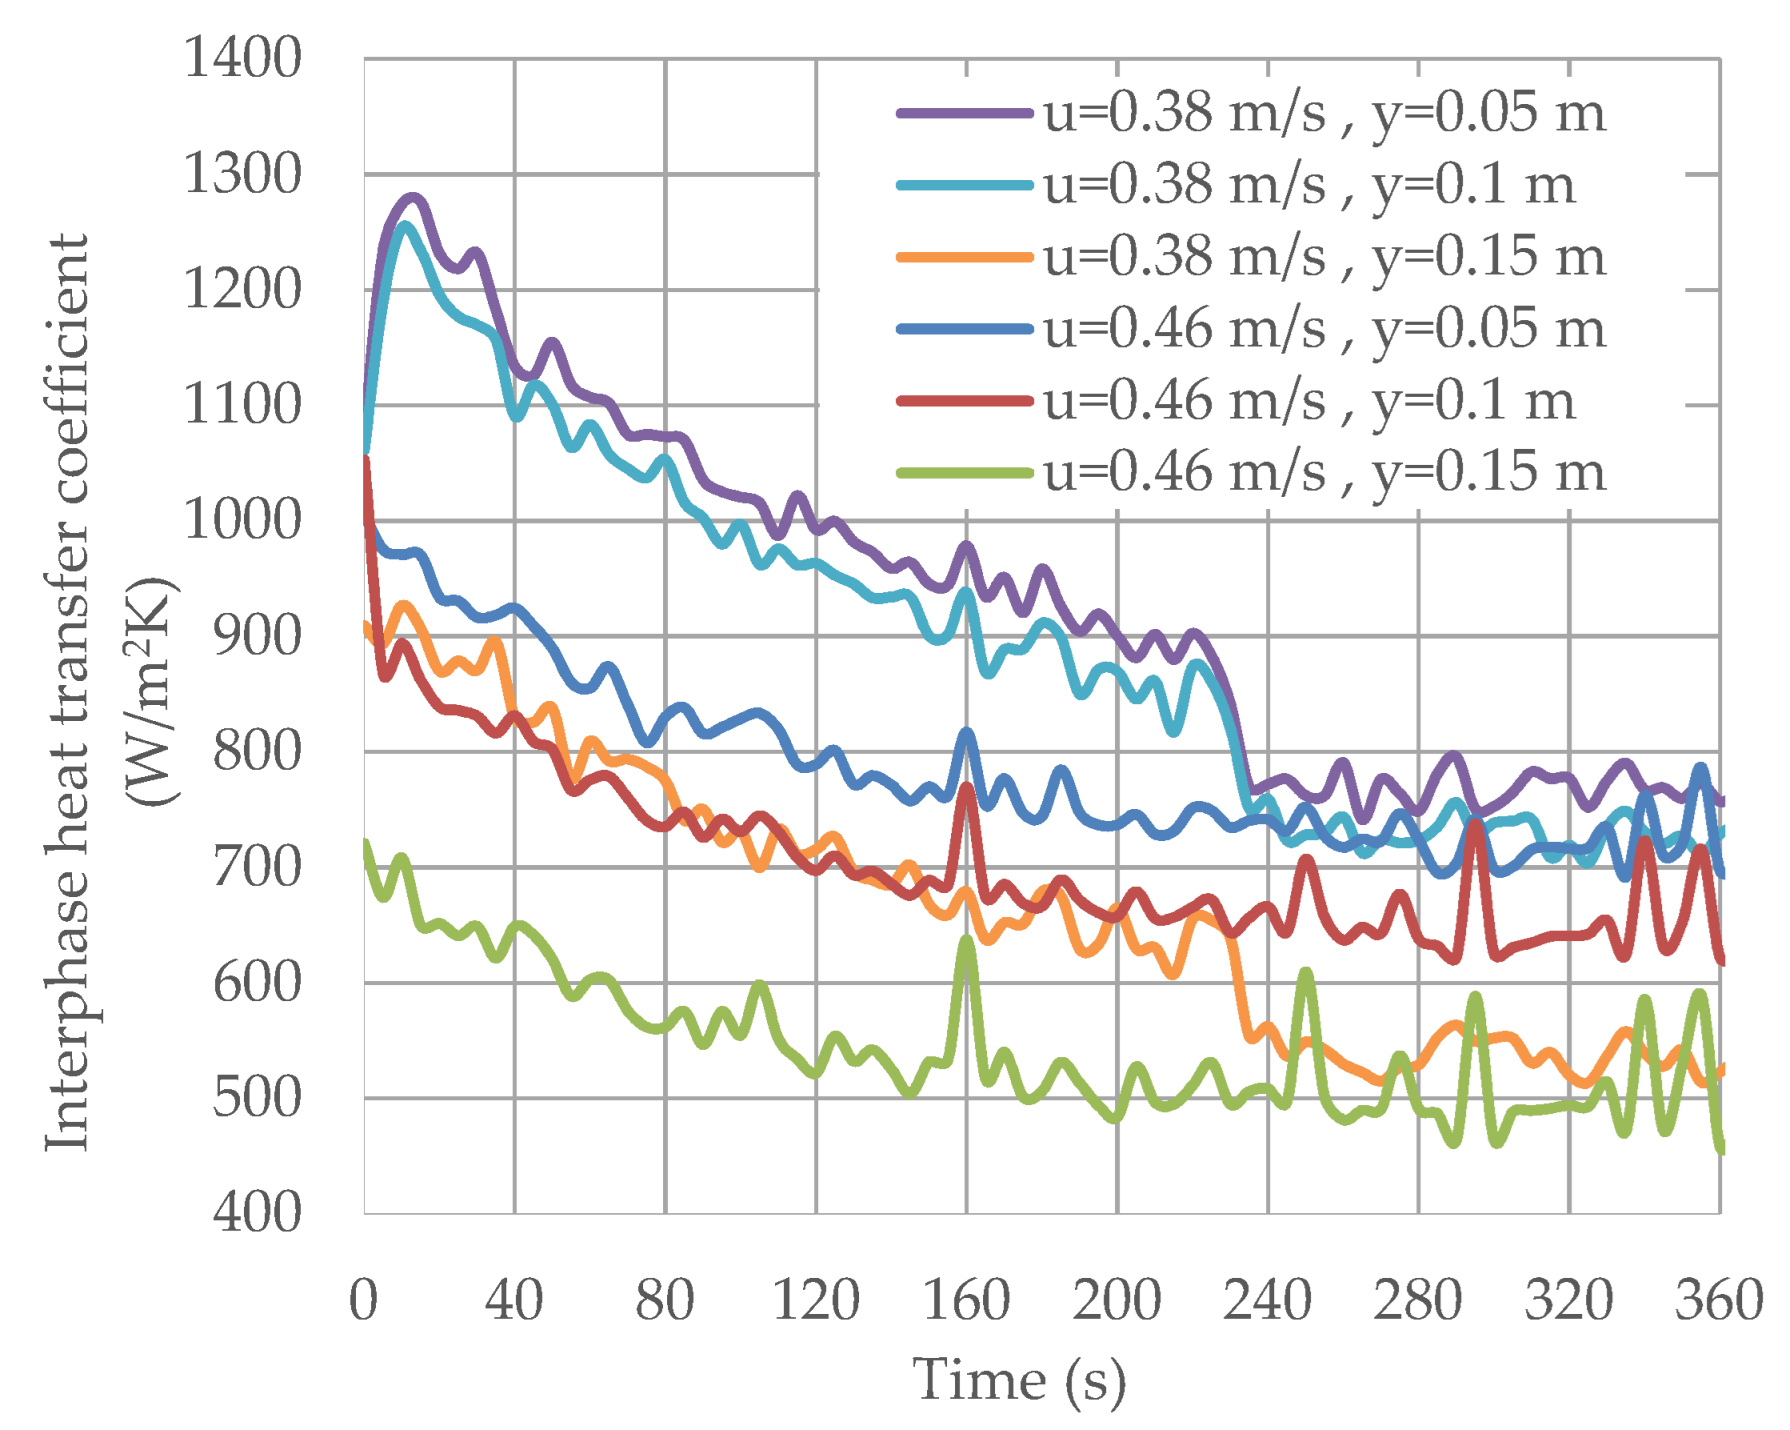
The Nusselt number and air thermal conductivity both affect the interphase heat transfer coefficient (hint). The heat transfer coefficient is also affected by Pr and the sand volume fraction, according to Gunn’s Nusselt number correlation. The temperature has a negligible effect on the Res and Pr numbers. It implies that air thermal conductivity, which rises with temperature, is the most important factor in the heat transfer coefficient. This is why the heat transfer coefficient reduces when the temperature of the bed drops.
The hint was estimated at various heights and velocities utilizing the simulation data. These values for superficial velocities of 0.38 and 0.46 m/s at various heights are presented in Figure 9. The oscillations that can be noticed in the graph are caused by bubbles. The solid volume fraction has a direct effect on the hint, and the bubbling regime constantly varies this ratio, making it impossible to see any linear variation. This coefficient decreases as the elevation rises, as shown in the graph. As the gas volume fraction increases, so does the velocity of the interstitial gas, leading Res to decrease. As the height increases, both the elevated εg and low Res result in a drop in Nu.
4.3. Key Performance Indicators
Finally, a heat transfer study is required to estimate the system efficiency. To this end, four primary heat transfer mechanisms are applicable in FB systems: conduction among particles, particle-to-fluid convection, and radiation. Therefore, the general energy balance for an FB can be expressed as
Solid–solid conduction, solid–fluid convection, solid–wall conduction, and radiation are denoted by , , , and, , respectively. Since the temperature gradient of the sand particles at various heights is almost the same, in this study, the solid phase can be considered as lumped rather than inter-particle. Due to the low emissivity of gas, it is also possible to ignore gas radiation [35]. Therefore, other than heat loss from the walls of the bed, the heat transfer from the hot solid particles to the air is the main mechanism for the discharging process.
4.3.1. Storage Capacity
The charging process for the storage medium should start from a discharged state and finish at a defined maximum charge state as:
The mass and the specific heat capacity of the sand particles are represented with ms and cp, respectively. Sand does not experience a large deviation in the enthalpy values with respect to the temperature change; thus, we can use the average cp assumption:
Therefore, Equation (3) can be rewritten for the maximum storage capacity as:
where ms represents the total mass of the particles. Tin and Tinitial, respectively, represent the inlet temperature of the air and the initial temperature of the particles.
4.3.2. Discharge Capacity
Discharge capacity can only be determined during the discharging of heat from the particle-based TES system. The discharge capacity is estimated using the inlet and outlet states of the air. The discharge energy is a function of the minimum discharge inlet-specific enthalpy and the maximum discharge outlet-specific enthalpy of the air. The amount of thermal energy that the TES system can supply by a full discharge under well-defined initial and final conditions can be calculated as:
Given that , and based on the mass balance equation in which , Equation (6) can be rewritten as:
The mass flow rate of the air is represented by . The average temperatures of the air at the inlet and outlet are termed Tin and Tout, respectively. The average specific heat of the air at the inlet and outlet is denoted as cp,in and cp,out, respectively. The time interval for data recording (10 s) is expressed by Δt, and n indicates the number of data collecting points. Using the discharge capacity of FB, the discharge rate can be defined as:
This rate is changing with respect to time during the discharge process. Since the bed temperature drops over time, the discharge capacity, as well as the discharge rate, should both reduce. This rate is limited by the heat transfer rate between the air and the storage material.
4.3.3. Discharge Efficiency
The discharge efficiency is the ratio of the total energy acquired by the heat transfer fluid from the storage medium during discharge to the energy stored in the same medium [36]. Therefore, the thermal discharge efficiency of this process can be defined as:
This is a method that uses the First Law of Thermodynamics, and the decrease in energy quality (exergy), which is based on the Second Law of Thermodynamics, is not considered.
4.4. Performance of the TES System
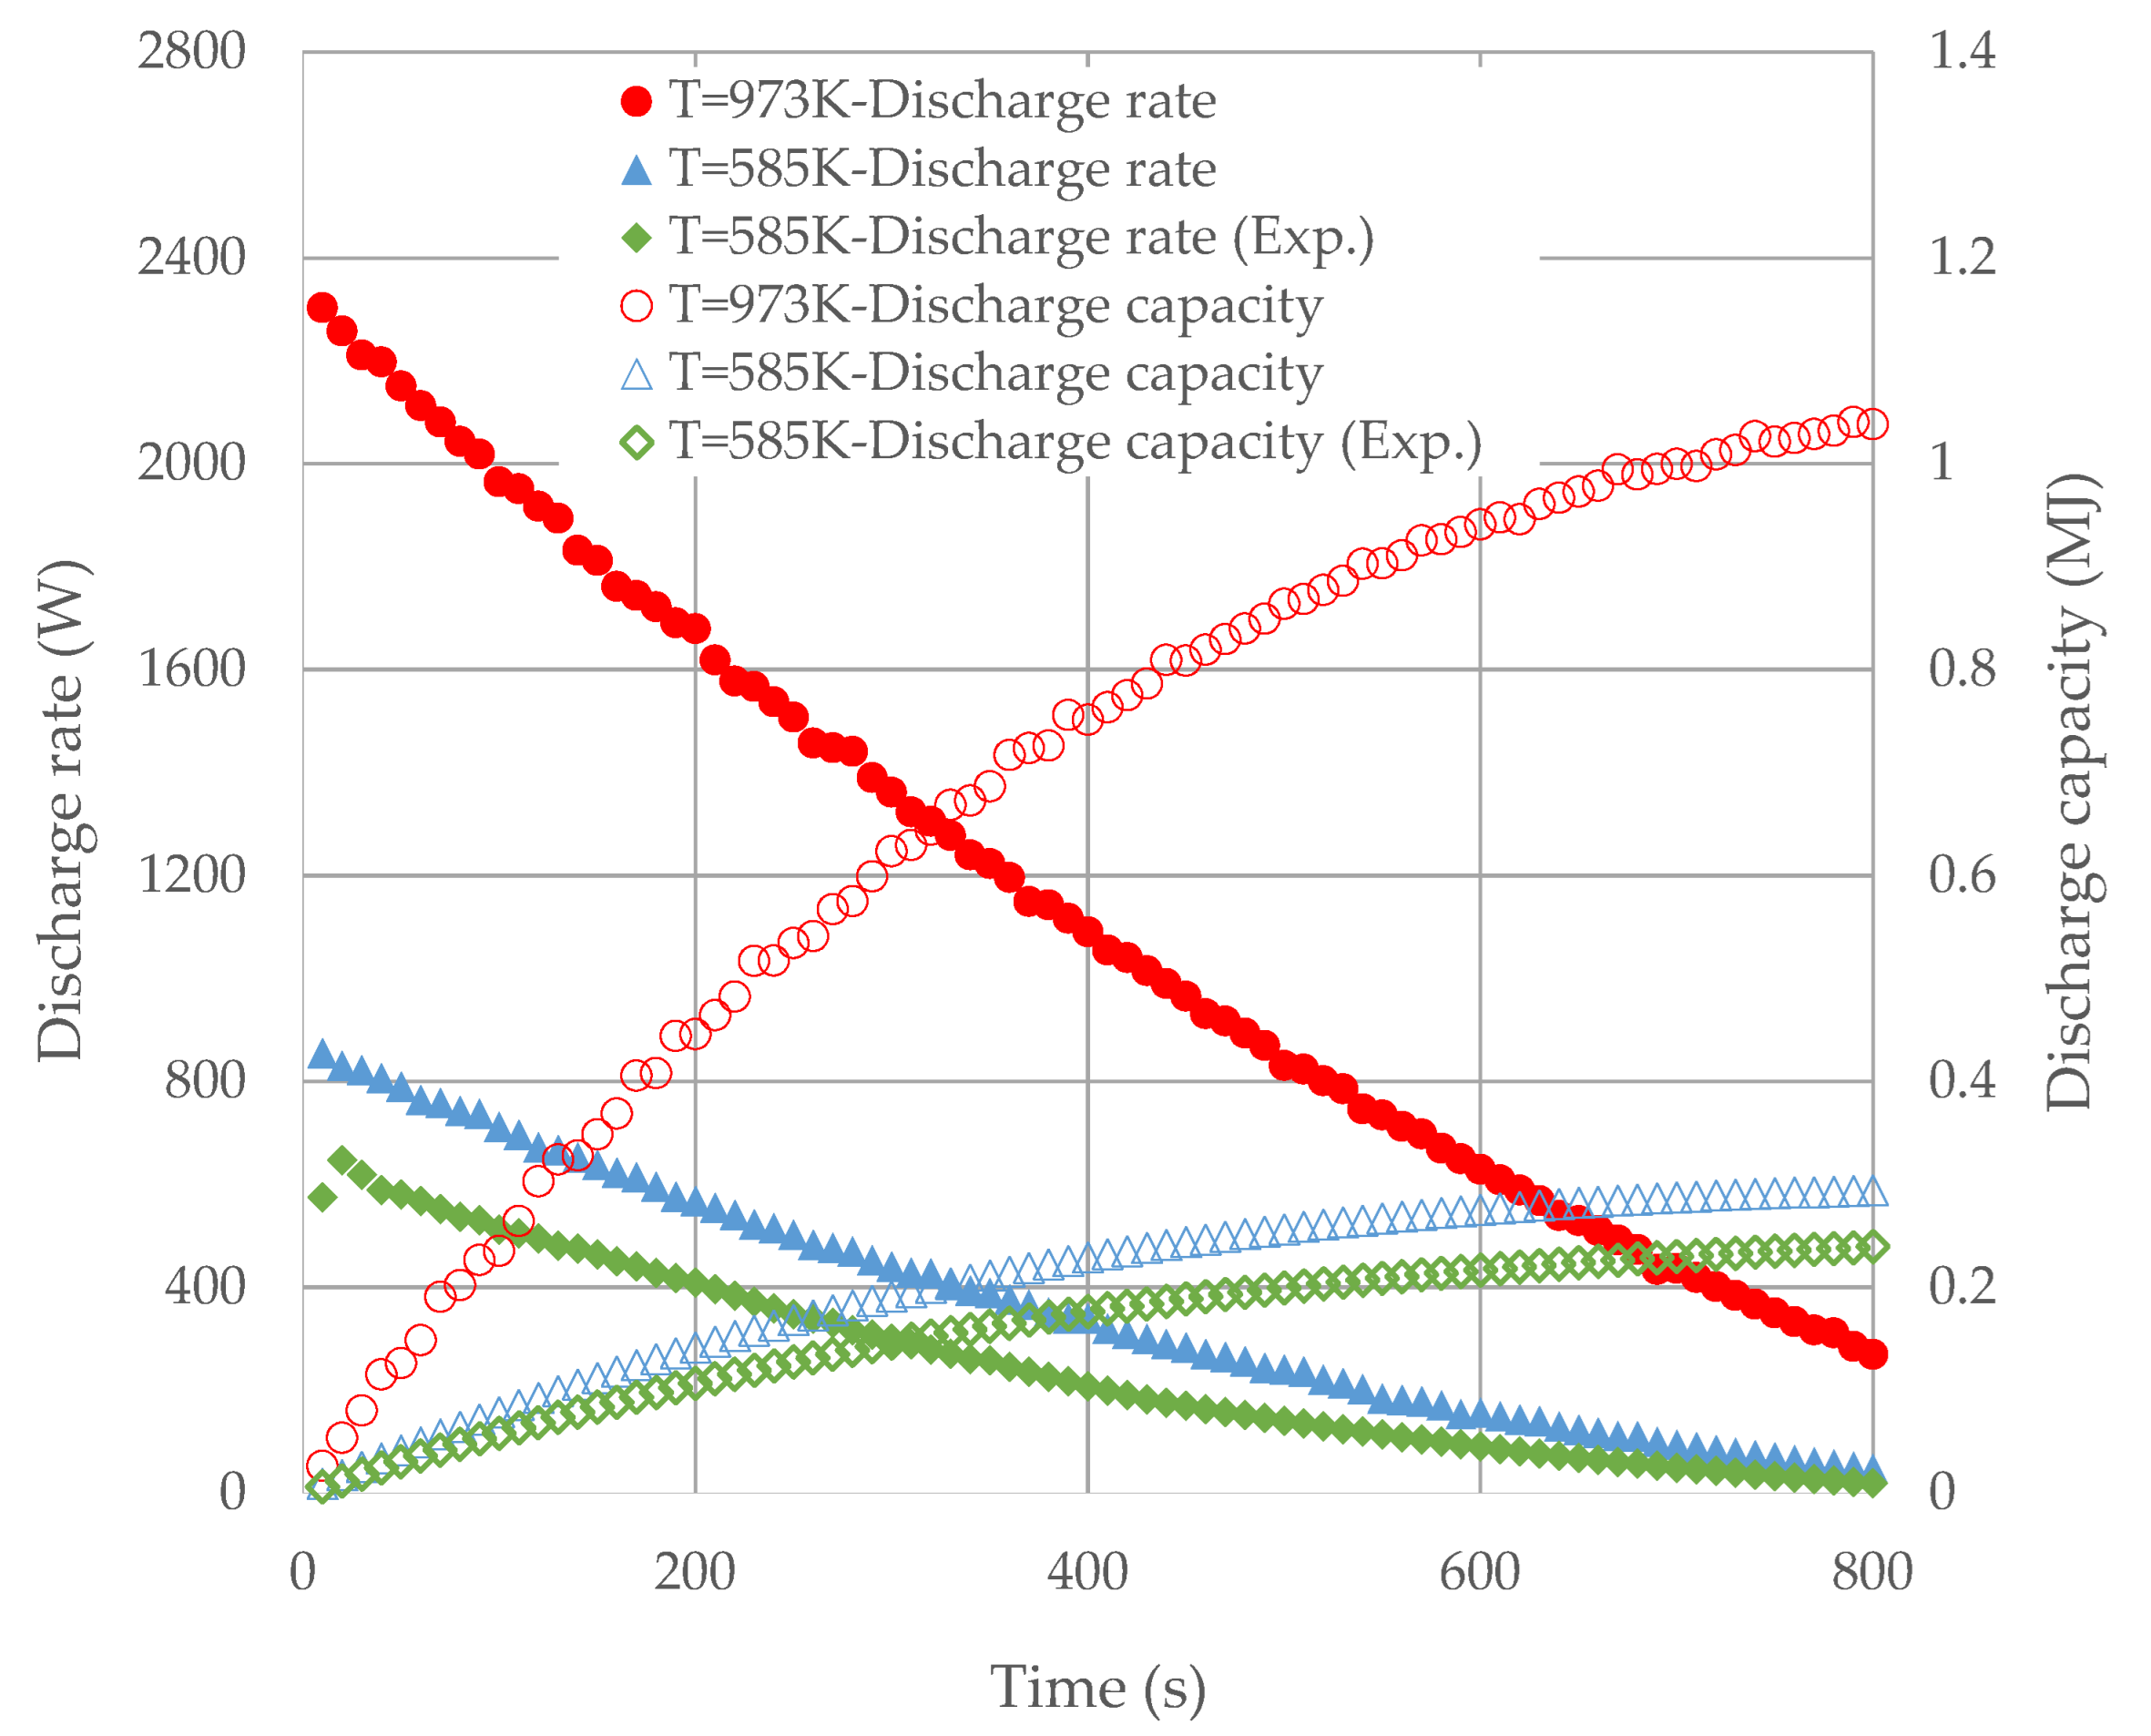
The average discharge rate, discharge capacity, and efficiency of a TES system are important indications of its performance. Therefore, the performance of the particle-based TES system is determined using the key performance indicators defined above at two different initial temperatures: 585 K in the experiments and 973 K in the targeted ultra-high value. Using Equation (5), the maximum storage capacities for these two cases are determined to be around 0.61 MJ and 1.69 MJ, respectively.
The instantaneous variations in discharge rate and discharge capacity in both the numerical and experimental tests for T = 585 K are shown in Figure 10. As can be seen, there is good agreement between the results obtained in both studies. Based on Equation (9), the efficiency can be calculated as 39.5% and 48% for the experimental and numerical study, respectively, at the specified period.
Our ultimate objective is to ascertain the amount of heat that can be extracted from stored heat at elevated temperature ranges. For this aim, the initial and final temperatures for the discharging process are set to 973 and 300 K, respectively, in the simulation. As can be observed in Figure 10, the discharge rate is steeper at higher temperatures due to the larger heat loss to the ambient environment. Increasing the temperature has increased the efficiency from 48% up to approximately 62%. The efficiency ratios are lower than predicted even for high operating temperatures, and they may be maximized by increasing the inlet air temperature and improving the FB insulation.
5. Conclusions
The primary goal of this research is to lay the groundwork for the development of FB-TES systems for CSP applications. There are some studies available in the literature that include hydrodynamical setups and numerical approaches. Nevertheless, the present work has the advantage of including an additional set of thermal experiments. The hydrodynamic and thermal behaviors of the system were experimentally and numerically investigated. This experiment was carried out using granular Geldart B-type particles having a diameter of 600 µm. The model is based on a first-order temporal discretization and the Eulerian–Eulerian technique, employing the Gunn thermal model and the Syamlal O’Brien drag model. Instantaneous and time-averaged results obtained from experiments were compared to calculations provided by the TFM model. The pressure drop across the bed and the bed expansion ratio were used to validate the hydrodynamic behavior of the bed. The temperatures of the air at different heights of the bed were also used to validate the thermal behavior of the bed. The bed expansion ratio rises as the superficial velocity increases, but the pressure drop across the bed stays constant. Experiments using CARBOHSP particles found that while they have similar thermal characteristics to sand particles, they have better fluidization potential.
The performance indicators are introduced for the FB-TES. The discharge rate and the discharge efficiency are the essential measures used to demonstrate the system’s performance. The system performance in terms of these two indicators was illustrated at two different temperatures. The efficiency of the storage media was found to improve when the temperature of the medium was raised. It is believed that by using superior insulation material, the efficiency would improve.
While the numerical results reported here are encouraging in terms of employing bubbling beds as a direct contact heat exchanger, the actual application presents significant difficulties. The first is that particles may fly off the bed in real-world applications owing to their attrition tendency, which results in decreased particle sizes over time. A smaller particle size makes it easier to carry over. To avoid damaging the turbine blades, however, tiny particles must be filtered, resulting in a pressure reduction. This is another drawback because, to maximize power supply efficiency, the FB should be kept at high pressure. Additionally, the bed has to be properly sealed for both daily and seasonal storage. Thus, all of these practical challenges should be addressed in order to enable the use of direct contact heat exchangers in CSP power plants.
It is worth mentioning that the majority of FBs lack extensive study on two-phase gas–solid flow, heat transfer, and the dynamic performance of the energy transfer process, and further research will be required in the future. As a result, it is still important to conduct an in-depth and systematic study on these systems, including their flow and heat transfer mechanisms, multi-scale space–time transport performance, and analysis methodologies, as well as their structural process optimization and performance management strategies.
In the future, experiments will be undertaken at greater temperatures with adequate equipment to increase the technical readiness of the proposed TES system. The module will be put to the test by connecting it to a solar receiver capable of supplying hot particles. Different granular particles will be tested to see whether they can deliver improved efficiency and, hence, offset increasing particle costs.
Author Contributions
Conceptualization, I.T., M.M.; methodology, M.M., E.P.K.; software, M.M.; validation, M.M., E.P.K.; formal analysis, M.M., E.P.K.; investigation, M.M., E.P.K.; resources, I.T.; data curation, E.P.K.; writing—original draft preparation, M.M.; writing—review and editing, M.M., I.T., E.P.K.; visualization, M.M., E.P.K.; supervision, I.T.; project administration, I.T.; funding acquisition, I.T. All authors have read and agreed to the published version of the manuscript.
Funding
This work was supported in part with funding from the European Union’s Horizon 2020 research and innovation program under grant agreement No. 823802 and by in-kind contributions from Middle East Technical University.
Data Availability Statement
Not applicable.
Conflicts of Interest
The authors declare no conflict of interest.
Nomenclature
| A | Surface area, m2 |
| Aint | Interfacial area concentration, 1/m |
| cp | Specific heat capacity, J/kgK |
| CD | Drag coefficient |
| d | Particle diameter, m |
| e | Restitution coefficient |
| g | Gravitational acceleration, m/s2 |
| g0 | Radial distribution function |
| h | Heat transfer coefficient, W/m2K |
| h | Enthalpy, J/kg |
| H | Bed height, m |
| k | Thermal conductivity, W/mK |
| M | Molar mass, kg/mol |
| n | Number of data collecting points |
| Nu | Nusselt number |
| Pr | Prandtl number |
| P | Pressure, Pa |
| Q | Rate of heat transfer, W |
| Qint | Volumetric rate of heat transfer, W/m3 |
| Re | Reynolds number |
| T | Temperature, K |
| U | Velocity, m/s |
| t | Time, s |
| u | Superficial velocity, m/s |
| V | Volume, m3 |
| Velocity, m/s | |
| Fluctuating velocity, m/s | |
| y | Specified elevation, m |
| Greek Letters | |
| Volume fraction | |
| Momentum exchange coefficient | |
| µ | Dynamic viscosity, Pas |
| Density, kg/m3 | |
| Bulk viscosity, Pas | |
| Energy dissipation, kg/ms2 | |
| Phase stress–strain tensor, Pa | |
| ϕ | Sphericity |
| Angle of friction | |
| Granular temperature, m2/s2 | |
| Subscripts | |
| 0 | Initial |
| avg | Average |
| g | Gas phase |
| in | Inlet |
| int | Interphase |
| m | Mixture |
| min | Minimum |
| max | Maximum |
| out | Outlet |
| p | Particle |
| rad | Radiation |
| s | Solid phase |
| Superscripts | |
| max | Maximum |
References
- Calderón, A.; Palacios, A.; Barreneche, C.; Segarra, M.; Prieto, C.; Rodriguez-Sanchez, A.; Fernández, A.I. High Temperature Systems Using Solid Particles as TES and HTF Material: A Review. Appl. Energy 2018, 213, 100–111. [Google Scholar] [CrossRef] [Green Version]
- Calderón, A.; Barreneche, C.; Palacios, A.; Segarra, M.; Prieto, C.; Rodriguez-Sanchez, A.; Fernández, A.I. Review of Solid Particle Materials for Heat Transfer Fluid and Thermal Energy Storage in Solar Thermal Power Plants. Energy Storage 2019, 1, e63. [Google Scholar] [CrossRef] [Green Version]
- Alva, G.; Lin, Y.; Fang, G. An Overview of Thermal Energy Storage Systems. Energy 2018, 144, 341–378. [Google Scholar] [CrossRef]
- Warerkar, S.; Schmitz, S.; Goettsche, J.; Hoffschmidt, B.; Reißel, M.; Tamme, R. Air-Sand Heat Exchanger for High-Temperature Storage. J. Sol. Energy Eng. Trans. ASME 2011, 133, 133. [Google Scholar] [CrossRef]
- Baumann, T.; Zunft, S.; Tamme, R. Moving Bed Heat Exchangers for Use with Heat Storage in Concentrating Solar Plants: A Multiphase Model. Heat Transf. Eng. 2014, 35, 224–231. [Google Scholar] [CrossRef]
- Tregambi, C.; Troiano, M.; Montagnaro, F.; Solimene, R.; Salatino, P. Fluidized Beds for Concentrated Solar Thermal Technologies—A Review. Front. Energy Res. 2021, 9, 13. [Google Scholar] [CrossRef]
- Almendros-Ibáñez, J.A.; Fernández-Torrijos, M.; Díaz-Heras, M.; Belmonte, J.F.; Sobrino, C. A Review of Solar Thermal Energy Storage in Beds of Particles: Packed and Fluidized Beds. Sol. Energy 2019, 192, 193–237. [Google Scholar] [CrossRef]
- Shi, H.; Komrakova, A.; Nikrityuk, P. Fluidized Beds Modeling: Validation of 2D and 3D Simulations against Experiments. Powder Technol. 2019, 343, 479–494. [Google Scholar] [CrossRef]
- Hashim, M.Y.; Abdelmotalib, H.M.; Kim, J.S.; Ko, D.G.; Im, I.T. A Numerical Study on Gas-to-Particle and Particle-to-Particle Heat Transfer in a Conical Fluidized Bed Reactor. J. Mech. Sci. Technol. 2020, 34, 2391–2402. [Google Scholar] [CrossRef]
- Venier, C.M.; Marquez Damian, S.; Nigro, N.M. Assessment of Gas-Particle Flow Models for Pseudo-2D Fluidized Bed Applications. Chem. Eng. Commun. 2018, 205, 456–478. [Google Scholar] [CrossRef]
- Van Wachem, B.G.M.; Schouten, J.C.; Krishna, R.; van den Bleek, C.M. Eulerian Simulations of Bubbling Behaviour in Gas-Solid Fluidised Beds. Comput. Chem. Eng. 1998, 22, S299–S306. [Google Scholar] [CrossRef]
- Hicdurmaz, S.; Tari, I. Numerical Investigation of Bubbling Fluidized Bed to Be Used as Thermal Energy Storage Integrated to High-Temperature Concentrated Solar Power. Multiph. Sci. Technol. 2018, 30, 99–120. [Google Scholar] [CrossRef] [Green Version]
- Lungu, M.; Sun, J.; Wang, J.; Zhu, Z.; Yang, Y. Computational Fluid Dynamics Simulations of Interphase Heat Transfer in a Bubbling Fluidized Bed. Korean J. Chem. Eng. 2014, 31, 1148–1161. [Google Scholar] [CrossRef]
- Vejahati, F.; Mahinpey, N.; Ellis, N.; Nikoo, M.B. CFD Simulation of Gas-Solid Bubbling Fluidized Bed: A New Method for Adjusting Drag Law. Can. J. Chem. Eng. 2009, 87, 19–30. [Google Scholar] [CrossRef]
- Elsayed, M.M.; Megahed, I.E.; El-Refaee, M.M. Experimental testing of fluidized bed thermal storage. Sol. Wind. Technol. 1988, 5, 15–25. [Google Scholar] [CrossRef]
- Taghipour, F.; Ellis, N.; Wong, C. Experimental and Computational Study of Gas-Solid Fluidized Bed Hydrodynamics. Chem. Eng. Sci. 2005, 60, 6857–6867. [Google Scholar] [CrossRef]
- Acosta-Iborra, A.; Sobrino, C.; Hernández-Jiménez, F.; de Vega, M. Experimental and Computational Study on the Bubble Behavior in a 3-D Fluidized Bed. Chem. Eng. Sci. 2011, 66, 3499–3512. [Google Scholar] [CrossRef] [Green Version]
- Hamzehei, M.; Rahimzadeh, H. Experimental and Numerical Study of Hydrodynamics with Heat Transfer in a Gas-Solid Fluidized-Bed Reactor at Different Particle Sizes. Ind. Eng. Chem. Res. 2009, 48, 3177–3186. [Google Scholar] [CrossRef]
- Izquierdo-Barrientos, M.A.; Sobrino, C.; Almendros-Ibáñez, J.A. Thermal Energy Storage in a Fluidized Bed of PCM. Chem. Eng. J. 2013, 230, 573–583. [Google Scholar] [CrossRef] [Green Version]
- Deen, N.G.; van Sint Annaland, M.; van der Hoef, M.A.; Kuipers, J.A.M. Review of Discrete Particle Modeling of Fluidized Beds. Chem. Eng. Sci. 2007, 62, 28–44. [Google Scholar] [CrossRef]
- Chiesa, M.; Mathiesen, V.; Melheim, J.A.; Halvorsen, B. Numerical Simulation of Particulate Flow by the Eulerian-Lagrangian and the Eulerian-Eulerian Approach with Application to a Fluidized Bed. Comput. Chem. Eng. 2005, 29, 291–304. [Google Scholar] [CrossRef]
- Anderson, T.B.; Jackson, R. Fluid Mechanical Description of Fluidized Beds: Equations of Motion. Ind. Eng. Chem. Fundam. 1967, 6, 527–539. [Google Scholar] [CrossRef]
- Geldart, D. Types of Gas Fluidization. Powder Technol. 1973, 7, 285–292. [Google Scholar] [CrossRef]
- Syamlal, M.; O’Brien, T.J. Fluid Dynamic Simulation of O3 Decomposition in a Bubbling Fluidized Bed. AIChE J. 2003, 49, 2793–2801. [Google Scholar] [CrossRef]
- Syamlal, M.; O’Brien, T.J. The Derivation of a Drag Coefficient Formula from Velocity-Voidage Correlations; US Department of Energy, Office of Fossil Energy: Morgantown, WV, USA, 1987; pp. 1–20.
- Ding, J.; Gidaspow, D. A Bubbling Fluidization Model Using Kinetic Theory of Granular Flow. AIChE J. 1990, 36, 523–538. [Google Scholar] [CrossRef]
- ANSYS Fluent. User’s Guide ANSYS Fluent Theory Guide; ANSYS Inc.: Canonsburg, PA, USA, 2013; Volume 15317, pp. 724–746. [Google Scholar]
- Lun, C.K.K.; Savage, S.B.; Jeffrey, D.J.; Chepurniy, N. Kinetic Theories for Granular Flow: Inelastic Particles in Couette Flow and Slightly Inelastic Particles in a General Flowfield. J. Fluid Mech. 1984, 140, 223–256. [Google Scholar] [CrossRef]
- Gunn, D.J. Transfer of Heat or Mass to Particles in Fixed and Fluidised Beds. Int. J. Heat Mass Transf. 1978, 21, 467–476. [Google Scholar] [CrossRef]
- Diago, M.; Iniesta, A.C.; Delclos, T.; Soum-Glaude, A.; Shamim, T.; Calvet, N. Characterization of Desert Sand as a Sensible Thermal Energy Storage Medium. AIP Conf. Proc. 2016, 1734, 050011. [Google Scholar] [CrossRef] [Green Version]
- Siegel, N.P.; Gross, M.D.; Coury, R. The Development of Direct Absorption and Storage Media for Falling Particle Solar Central Receivers. J. Sol. Energy Eng. Trans. ASME 2015, 137, 137. [Google Scholar] [CrossRef]
- Churchill, S.W.; Chu, H.H.S. Correlating Equations for Laminar and Turbulent Free Convection from a Vertical Plate. Int. J. Heat Mass Transf. 1975, 18, 1323–1329. [Google Scholar] [CrossRef]
- Johnson, P.C.; Jackson, R. Frictional-Collisional Constitutive Relations for Granular Materials, with Application to Plane Shearing. J. Fluid Mech. 1987, 176, 67–93. [Google Scholar] [CrossRef]
- Gidaspow, D. Multiphase Flow and Fluidization: Continuum and Kinetic Theory Descriptions; Academic Press: Cambridge, MA, USA, 1994; p. 467. [Google Scholar]
- Zhou, Z.; Hou, Q.; Yu, A. Particle Scale Simulation of Heat Transfer in Fluid Bed Reactors. In Heat Transfer–Mathematical Modelling, Numerical Methods and Information Technology; Intechopen: London, UK, 2011. [Google Scholar] [CrossRef] [Green Version]
- Ma, Z.; Glatzmaier, G.; Mehos, M. Fluidized Bed Technology for Concentrating Solar Power with Thermal Energy Storage. J. Sol. Energy Eng. Trans. ASME 2014, 136, 031014. [Google Scholar] [CrossRef]
Figure 1.
(a) Snapshot of the hydrodynamics experimental setup; (b) diagram of the operation in the hydrodynamic experimental setup; (c) snapshot of the sand-filled bed; (d) snapshot of the CARBOHSP-filled bed; (e) schematic drawing of the bed.
Figure 1.
(a) Snapshot of the hydrodynamics experimental setup; (b) diagram of the operation in the hydrodynamic experimental setup; (c) snapshot of the sand-filled bed; (d) snapshot of the CARBOHSP-filled bed; (e) schematic drawing of the bed.

Figure 2.
(a) Snapshot of the thermal experimental setup; (b) diagram of the operation in the thermal experimental setup; (c) the furnace used in the experiment.
Figure 2.
(a) Snapshot of the thermal experimental setup; (b) diagram of the operation in the thermal experimental setup; (c) the furnace used in the experiment.

Figure 3.
(a) Mesh setting for the computational domain; (b) representation of static bed. The original solid volume percentage of 0.6 is shown in red, while the freeboard is represented in blue.
Figure 3.
(a) Mesh setting for the computational domain; (b) representation of static bed. The original solid volume percentage of 0.6 is shown in red, while the freeboard is represented in blue.

Figure 4.
(a) Experimental and numerical results for pressure drop variation (Py = 0.025 m − Py = 0.39 m) of the experiment with sand and CARBOHSP particles at different velocities; (b) the bed expansion ratio of the experiment with sand and CARBOHSP particles at different velocities, measured from both experimental and numerical studies. Error bars are provided to indicate the uncertainty in the estimations.

Figure 5.
Contours of sand volume fraction at different times.

Figure 6.
Typical bubble formation in (a) experimental and (b) numerical studies.

Figure 7.
(a) Variation of the air temperature in the experimental study at different elevations with u = 0.46 m/s; (b) variations in the air temperature of an FB containing sand and CARBOHSP particles at y = 0.10 m with u = 0.38 m/s.
Figure 7.
(a) Variation of the air temperature in the experimental study at different elevations with u = 0.46 m/s; (b) variations in the air temperature of an FB containing sand and CARBOHSP particles at y = 0.10 m with u = 0.38 m/s.

Figure 8.
(a) The variations in air temperature in experimental and numerical studies at y = 0.10 m with u = 0.46 m/s; (b) the temperature variations of two phases at the first 60 s in CFD result in y = 0.10 m with u = 0.38 m/s.
Figure 8.
(a) The variations in air temperature in experimental and numerical studies at y = 0.10 m with u = 0.46 m/s; (b) the temperature variations of two phases at the first 60 s in CFD result in y = 0.10 m with u = 0.38 m/s.

Figure 9.
Interphase heat transfer coefficient variation with time at different heights and inlet velocities.
Figure 9.
Interphase heat transfer coefficient variation with time at different heights and inlet velocities.

Figure 10.
The variations in discharge rate and discharge capacity over time.

Table 1.
Physical properties and operating parameters utilized in the model.
| Property | Value | Unit |
|---|---|---|
| Bed width | 0.08 | m |
| Bed depth | 0.08 | m |
| Bed height | 0.4 | m |
| Static bed height | 0.15 | m |
| Gas density | 1.225 | kg/m3 |
| Superficial gas velocity | 0.38, 0.46 | m/s |
| Air inlet temperature | 300 | K |
| Initial solid particle temperature | 585, 973 | K |
| Specularity coefficient | 0.1 | - |
| Initial solid packing | 0.6 | - |
| Restitution coefficient ) | 0.99 | - |
Table 2.
Properties of the particles utilized in the numerical study.
| Property | Sand | CARBOHSP | Unit |
|---|---|---|---|
| Average diameter | 600 | 350 | micron |
| Density | 2300 | 2500 | kg/m3 |
| Minimum fluidization velocity | 0.252 | 0.165 | m/s |
| Terminal velocity | 2.611 | 1.988 | m/s |
Publisher’s Note: MDPI stays neutral with regard to jurisdictional claims in published maps and institutional affiliations. |
© 2022 by the authors. Licensee MDPI, Basel, Switzerland. This article is an open access article distributed under the terms and conditions of the Creative Commons Attribution (CC BY) license (https://creativecommons.org/licenses/by/4.0/).
Share and Cite
MDPI and ACS Style
Mehrtash, M.; Polat Karadiken, E.; Tari, I. A Combined Experimental and Numerical Thermo-Hydrodynamic Investigation of High-Temperature Fluidized-Bed Thermal Energy Storage. Processes 2022, 10, 1097. https://doi.org/10.3390/pr10061097
AMA Style
Mehrtash M, Polat Karadiken E, Tari I. A Combined Experimental and Numerical Thermo-Hydrodynamic Investigation of High-Temperature Fluidized-Bed Thermal Energy Storage. Processes. 2022; 10(6):1097. https://doi.org/10.3390/pr10061097
Chicago/Turabian StyleMehrtash, Mehdi, Esra Polat Karadiken, and Ilker Tari. 2022. "A Combined Experimental and Numerical Thermo-Hydrodynamic Investigation of High-Temperature Fluidized-Bed Thermal Energy Storage" Processes 10, no. 6: 1097. https://doi.org/10.3390/pr10061097
Note that from the first issue of 2016, this journal uses article numbers instead of page numbers. See further details here.