
Chemistry of Hydroxypropyl Cellulose Oxidized by Two Selective Oxidants
by
 , , , and
Raluca Ioana Baron
*,
Gabriela Biliuta
,
Ana-Maria Macsim
,
Maria Valentina Dinu
and
Sergiu Coseri
* “Petru Poni” Institute of Macromolecular Chemistry of Romanian Academy, 41 A Gr. Ghica Voda Alley, 700487 Iasi, Romania
*
Authors to whom correspondence should be addressed.
Polymers 2023, 15(19), 3930; https://doi.org/10.3390/polym15193930
Submission received: 30 August 2023
/
Revised: 25 September 2023
/
Accepted: 27 September 2023
/
Published: 28 September 2023
(This article belongs to the Collection Biopolymers: Synthesis and Properties)
Abstract
:Along with the increased usage of cellulose in the manufacture of novel materials, those of its derivatives that have good solubility in water or organic solvents have become increasingly important. In this study, hydroxypropyl cellulose (HPC), a cellulosic derivative with distinct features, was utilized to investigate how two of the most-selective oxidation methods currently available in the literature act on the constituent OH groups of both the side chain and the anhydroglycosidic unit in HPC. The oxidation reactions were carried out first using TEMPO, sodium hypochlorite, and sodium bromide, then sodium periodate (NaIO4), for 5 h. A combination of these two protocols was applied. The amount of aldehyde and number of carboxylic groups introduced after oxidation was determined, while the changes in the morphological features of oxidized HPC were, additionally, assessed. Furthermore, utilizing Fourier-transform infrared spectra, X-ray diffraction, and thermogravimetric studies, the chemical structure, crystallinity, and thermal stability of the oxidized HPC samples were examined and compared.
1. Introduction
Polysaccharides are nowadays valuable resources for various scientific, industrial, and technological applications, and they are gaining increased attention due to their many advantages over synthetic polymers. The shift towards using polysaccharides in scientific research and industrial applications, while gradually replacing synthetic polymers, can be attributed to their unique and intrinsic features such as biocompatibility, biodegradability, bioactivity and availability. Last but not least, the growing pressure from society to eradicate the problems related to environmental pollution and degradation have contributed essentially to this transition [1,2,3,4]. Among polysaccharides, cellulose is renewable, cheap, and, most importantly, biodegradable, making it the most plentiful polysaccharide on Earth [5]. Due to strong intramolecular and intermolecular bonds, cellulose is not soluble in water or most organic solvents [6]. To address this critical issue, water-soluble cellulose derivatives are frequently selected, particularly in medical or technical applications. One of the best examples is hydroxypropyl cellulose (HPC), a cellulose derivative with good solubility in water and organic solvents and good chemical stability and processability [7,8]. HPC is obtained through the partial etherification of cellulose with hydroxypropyl groups [9], having β-D-glucose units in which the free hydroxyl groups are partially or completely substituted by hydroxypropyl groups. HPC exhibits liquid crystallinity in aqueous solution and is stable and safe enough to be utilized as an excipient in pharmaceutical tablets. As a result, it can be used to build functional materials [10,11,12]. In order to use HPC in a wide range of applications, it is important to introduce reactive groups that allow covalent cross-linking. To this purpose, we have focused on the introduction of reactive carbonyl and/or carboxyl groups through the oxidation of HPC using selective oxidizing agents. Thus, fundamental research into HPC is a worthwhile endeavor. The oxidation reaction, in particular, adds value to polysaccharides by introducing new functionalities into their structure, such as ketone, aldehyde, or carboxyl, or even a combination of these, with significant benefits for subsequent functionalization and the modification of physicochemical properties. Several approaches for HPC oxidation agents have been reported lately. Edgar et al. reported the oxidation of HPC on the 2-hydroxypropyl side chain to acetonyl moieties in the presence of sodium hypochlorite to produce hydrogels with self-healing properties [10]. Recently, Seelinger et al. used a TEMPO-mediated oxidation protocol to oxidize secondary hydroxyl groups of HPC to carbonyl groups under mild conditions, with a controlled degree of oxidation [13].
In our work, we presumed that a comprehensive examination of the oxidation of HPC in the presence of the most selective reagents reported in the literature, i.e., TEMPO radical and NaIO4, could provide fresh insights into the behavior of HPC in such reactions. This approach becomes even more appealing since, to the best of our knowledge, no research has been carried out on HPC oxidation with NaIO4, let alone in a mixed system with TEMPO and NaIO4.
TEMPO is a stable nitroxyl radical, water soluble, and widely used in the presence of NaClO and NaBr for the selective oxidation of its primary –OH groups to –COOH groups, forming intermediate aldehyde groups [14,15,16,17,18,19,20,21,22,23]. On the other hand, NaIO4 is an efficient reagent used for the selective oxidation of secondary hydroxyl groups in polysaccharides to aldehyde groups, with the simultaneous cleavage of the C2–C3 linkage [24]. These two selective oxidation methods can be combined in a one-pot reaction to obtain highly carboxylated polysaccharides simultaneously, at the C6 but also at C2 and C3 positions.
2. Materials and Methods
2.1. Materials
Hydroxypropyl cellulose (HPC, average Mw~80,000, average Mn~10,000), 2,2,6,6-tetramethyl-1-piperidine-1-oxyl radical (TEMPO), sodium bromide (NaBr), sodium periodate (NaIO4), 15% sodium hypochlorite (NaClO) and other chemicals and solvents were of pure grade (Sigma Aldrich, St. Louis, MO, USA), and were used without further purification.
2.2. Preparation of Oxidized HPC
(i) TEMPO-mediated oxidation of HPC (HPC_T): HPC (2.5 g) was dissolved in 70 mL of distilled water under vigorous stirring. TEMPO (0.2 mmol/g HPC) and NaBr (2 mmol/g HPC) were then introduced into the reaction mixture. Subsequently, a NaClO solution (ca. 15% active chlorine, 20 mmol/g HPC) was added to the reaction mixture while stirring continuously. The pH of the solution was carefully maintained at about pH 10 by adding 2 M NaOH solution. The reaction was carried out for 5 h at room temperature (RT), after which it was quenched by adding a few drops of ethanol.
(ii) NaIO4 oxidation of HPC (HPC_P): HPC (2.5 g) was dissolved in 70 mL of distilled water with vigorous stirring, and then NaIO4 (4 mmol/g of HPC) was added to the HPC solution. The reaction was carried out at RT in the dark for 5 h. Throughout the reaction, the pH of the suspension was approximately 4. After 5 h, the excess of periodate was decomposed with ethylene glycol.
(iii) Combined TEMPO–periodate oxidation of HPC (HPC_TP): this oxidation protocol was developed in our group previously, to prepare tricarboxicellulose [25]. HPC (2.5 g) was dissolved in 70 mL of distilled water under vigorous stirring. TEMPO (0.2 mmol/g HPC), NaIO4 (4 mmol/g HPC), NaBr (2 mmol/g HPC), and NaClO solution (20 mmol/g HPC) were then added. The flask was covered with aluminum foil to prevent the decomposition of periodate under the action of light. After five hours, the reaction was stopped, and the pH was raised to 7.
All reaction products were dialyzed (molecular-weight cut-off (MWCO)—3500 Da) against distilled water for five days, and then dried using lyophilization.
2.3. Characterization of Oxidized HPC
2.3.1. The Fourier-Transform Infrared (FTIR) Measurements
Fourier-transform infrared (FTIR) spectra were acquired using an IRAffinity-1S spectrometer (manufactured by Shimadzu Corp., Kyoto, Japan) in conjunction with customized infrared (IR) software (LabSolution IR Version 2.27) developed by LabSolutions (Shimadzu Corp., Kyoto, Japan). Scanning was performed with a resolution of 4 cm−1 and the range covered was from 4000 cm−1 to 500 cm−1. The spectra of all samples were collected using transmission-mode scanning. A pellet containing 200 mg potassium bromide and 1 mg sample was prepared by pressing the sample into the pellet.
2.3.2. Nuclear Magnetic Resonance Spectroscopy (NMR)
Proton and carbon NMR experiments were recorded with a Bruker Avance Neo 400 MHz instrument (Bruker BioSpin, Rheinstetten, Germany) operating at 400.1 MHz for 1H and 100.6 MHz for 13C. The samples were solubilized in D2O at RT, transferred to 5 mm Wilmad 507 NMR tubes and recorded with a 5 mm direct detection probe with four nuclei (H, C, Si, F). Chemical shifts are given in δ units (ppm). All spectra were processed using the program TopSpin 2.1 from BRUKER.
The 1H-NMR technique was used to determine the molar substitution (MS) of hydroxypropyl cellulose samples. The MS was calculated using Equation (1) [26]:
where A represents the integral of methyl protons (0.47–1.5 ppm), and B represents the integral of the cellulose backbone together with CH2 and CH protons from hydroxypropyl (2.6–4.6 ppm).
The degree of substitution (DS) of the hydroxypropyl group in hydroxypropyl cellulose (HPC) samples can be determined from the 1H-NMR and 13C-NMR spectra. Knowing the ratio R = number of inside CH3(I2)/number of terminal CH3(I1), from the 13C NMR spectrum, and the MS value from the 1H-NMR spectrum, we calculated the value of DS using Equation (2) [26]:
where R = I2/I1.
The relationship between the molar substitution (MS) and the content of the hydroxypropyl group (HC) is given by Equation (3):
where the molar weight of hydroxypropyl is 58, and the value of 162 represents the molar weight of the anhydroglucose (AGU) unit [27].
2.3.3. Environmental Scanning Electron Microscopy (SEM)
For preparing the samples for SEM, as films, solutions of each sample were dried at 40 °C in a PFA Petri dish. Then, samples were frozen in liquid nitrogen, fractured and analyzed in cross-sections. The morphology of unmodified and oxidized HPC was investigated using a Verios G4 UC scanning electron microscope (SEM) from Thermo Scientific, Brno, Czech Republic. SEM studies were performed in a high-vacuum mode using a secondary electron detector (Everhart–Thornley detector, ETD, FEI Company, Hillsboro, OR, USA) at an accelerating voltage of 5 kV.
2.3.4. Crystallinity Determination using X-ray Diffraction (XRD)
Using a Rigaku Miniflex 600 diffractometer, an X-ray diffraction investigation was carried out utilizing CuK-emission in the angular range 2–50° (2) with a scanning step of 0.01° and a recording rate of 2°/min. Applying the peak height technique [28] and Equation (4), the crystallinity index (Cr.I.) was calculated.
2.3.5. Zeta Potential
The ζ-potential was measured at 25 °C using laser Doppler electrophoresis equipment (Malvern Nano-Zetasized ZS, Malvern, UK). The samples were diluted to include 0.1 weight percent solids. Each measurement was repeated three times. For kα >> 1 (k—Debye–Hűckel parameter and α—particle radius), the Smoluchowski relationship was applied, as shown in Equation (5):
where η is the viscosity, µ is the electrophoretic mobility and ε is the dielectric constant.
ζ = ηµ/ε
2.3.6. Determination of Mass Yield
The mass yield of HPC samples was calculated according to the method reported by Chen et al. [29]. The determination of the weight ratio between modified HPC and pristine HPC was carried out using Equation (6).
where m1 is the amount of HPC used (mg), and m2 is the amount of modified HPC obtained (mg). Determinations were made in triplicate.
2.3.7. Conductometric and Potentiometric Titration
Determination of Carboxyl-Group Content in HPC_T and HPC_TP
Conductometric titration was used to determine the number of carboxyl groups present in the oxidized HPC samples [30,31]. A weight of 0.05 g of oxidized HPC was dispersed in 30 mL of deionized water. Then, 1.5 mL NaCl solution (0.01 M) was added to the HPC suspension. The pH of the solution was adjusted to 2.5–3.0 by adding 0.1 M HCl. The conductometric titration was performed using a TitroLine® 5000 (Radiometer, Copenhagen, Denmark) from SI Analytics and a Metrohm 914 pH/conductometer from Switzerland, with 0.1 M NaOH as the titration solution. Using Equation (7), we could calculate the number of carboxyl groups:
where V2 and V1 represent the titration curve’s inflexion points and represent the quantity of NaOH consumed, ml; C was the NaOH concentration, mol/L; and m was the weight of dried HPC, g.
Determination of Aldehyde-Group Content in HPC_P
The alkali consumption method was applied to determine the aldehyde-group concentration of HPC_P. (More details are included in Supplementary Information). The Canizzaro reaction of HPC_P proceeded rapidly with a stoichiometric consumption of hydroxyl ions per dialdehyde group. After precisely adding HPC_P (0.10 g) and NaOH solution (5.00 mL, 0.1 M) into an Erlenmeyer flask with a volume of 100 mL, the flask was then stirred with a magnetic stirrer for a period of thirty minutes in order to dissolve the sample. Following that, a precise amount of HCl solution (7.50 mL) with a concentration of 0.1 M was added, and then 15.00 mL of distilled water was added. The titration to the end point was conducted with a solution of 0.1 M NaOH after 5 drops of phenolphthalein indicator were added. The dialdehyde concentration in the sample was calculated from Equation (8):
where C1 (mol/L) represents the concentration of the NaOH solution, V1 (mL) represents the volume of the NaOH solution, C2 (mol/L) represents the concentration of the HCl solution, V2 (mL) represents the volume of the HCl solution, m (g) represents the mass of the dried HPC_P, and 162 represents the molecular weight of one repeated unit of anhydroglucose.
2.3.8. Thermogravimetric Measurements
Thermogravimetric measurements were taken with a STA 449F1 JUPITER instrument, manufactured by Netzsch GmbH in Selb, Germany. Calibrations of temperature and sensitivity were conducted with indium over a temperature range of 30–700 °C. After the weighing of the solid samples, which ranged from around 5.0 to 11 mg, the samples were placed in alumina pans to be subjected to TG measurements. The temperature range employed was between 30 and 700 °C, and the heating rate was 10 °C/min. This was performed in an environment of dry nitrogen with a flow rate of 50 mL/min. The NETZSCH PROTEUS 4.2 software (Netzsch, GmbH, Selb, Germany) was used to perform the analysis of the data.
3. Results and Discussion
3.1. Mechanism of Reaction
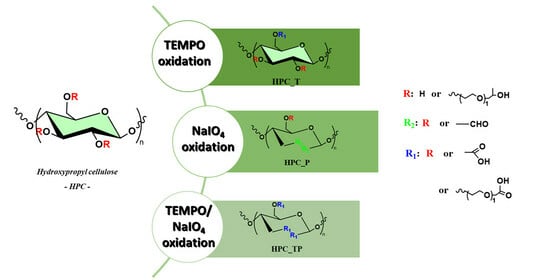
In recent years, several in-depth studies have been reported on the role of polysaccharide-specific oxidizing agents in general and of cellulose [32,33] in particular, due to the proliferation of natural polymer-based hydrogels, in which cellulose oxidation products play the key role. The stable TEMPO radical and its derivatives, N-hydroxyphtahlimide (NHPI) and the non-persistent phthalimide-N-oxy radical (PINO) [34,35], as well as NaIO4, have been extensively used for the selective oxidation of polysaccharides. These oxidation protocols are among the most selective in this type of reaction. Another useful oxidation method capable of producing 2,3,6-tricarboxy compounds in a single step is the one that combines the TEMPO radical with NaIO4. Figure 1 illustrates how the oxidation of HPC could proceed in the presence of all three proposed protocols.
According to Figure 1, the TEMPO/NaBr/NaClO oxidation system enables the selective conversion of primary hydroxyl/propyl groups to carboxyl groups. In this system, sodium hypochlorite plays a predominant role as the primary oxidant, oxidizing the TEMPO radical to the N-oxoammonium ion TEMPO+, which converts the primary hydroxyl groups to carboxyl groups. On the other hand, NaIO4 oxidizes the secondary hydroxyl groups to introduce dialdehyde groups into the structure of HPC, leaving the primary groups unaffected. Oxidation in the presence of periodate is a highly selective reaction, the hydroxyl groups from C2 and C3 position being converted to aldehyde by cleaving C2-C3 bonds [36]. When combining the two above oxidation protocols, from a theoretical perspective, it becomes plausible that both the OH groups from the side chain and the OH groups from the anhydroglycosidic unit (the unsubstituted ones) could be oxidized. The sample oxidized in the presence of TEMPO radical gave the best yield (η = 95%). When oxidation is carried out in the presence of NaIO4, more side reactions and degradation take place and the yield obtained is lower (η = 88%), the smallest being in the case of the reaction with TEMPO and NaIO4 (η = 70%).
Furthermore, when analyzing the results obtained from the oxidation process and quantifying the nature of the functional groups obtained, we observed that during the oxidation process with the TEMPO radical, the ketone groups could also be obtained, which were formed when oxidation took place at the hydroxyl groups in the side chain of the HPC (see the 13C-NMR results). Similar results have been reported in previous works [37,38,39]. Summarizing, we can observe that depending on the nature of the substituents in the C2, C3, and C6 positions (hydroxyl or propyl), the carboxyl, aldehyde, and ketone groups can all be obtained as follows:
(i) When the oxidation takes place in the presence of the TEMPO radical, both carboxylic and ketone groups are obtained at the C6 atom;
(ii) When the oxidation takes place in the presence of NaIO4, both aldehyde and ketone groups are obtained;
(iii) when the oxidation takes place in the presence of the TEMPO/NaIO4 system, carboxylic, aldehyde, and ketone groups are obtained.
3.2. FTIR
To confirm the oxidation reactions of HPC, the FTIR spectra of the samples in the 4000 to 500 cm−1 wavenumber regions were registered (Figure 2). The FTIR spectrum of HPC showed two significant bands at 3445 cm−1 and 1085 cm−1, and shoulders at 2972 cm−1 and 2880 cm−1; thus, the absorption band range from 3700 cm−1 to 3200 cm−1 was correlated with the extension vibration of the hydroxyl group (OH-side-chain stretching and OH-ring stretching). The band from 3000 cm−1 to 2800 cm−1 was associated with the symmetric and asymmetric extension vibrations of the –CH3 and –CH2 groups (2972 (CH3) asymmetric stretching, 2935 (CH2) asymmetric stretching, 2900 (CH2) symmetric stretching, 2879 (CH3) symmetric stretching, and (CH) ring stretching). The OH bending of adsorbed water (hydrophilic hydroxyl group in HPC) was assigned to the characteristic band at about 1643 cm−1. In the fingerprint region, which includes wave numbers between 1500 and 900 cm−1, there were many bands and shoulders; thus, 1458 cm−1 was assigned to O-H, C-H bending, and –CH2 deformation; 1377 and 1327 cm−1 were due to –CH2 wagging and C-H and O-H bending vibration modes, and 1278 cm−1 was assigned to O-H bending and C-H wagging. The bands at 1128, 1053, and 1085 cm−1 were assigned to C-O stretching vibration [40,41]. The peak at 943 cm−1 represents the in-phase vibrations from propyl linkages and appeared as a weaker band attached to the band at 1053 cm−1. The FTIR absorption band appearing at 841 cm−1 was due to C-O deformation and –CH2 rocking, and it is defined as an “amorphous” absorption band.
Comparing the spectra for HPC and oxidized HPC_P, it was observed that in the FTIR spectra of HPC_P, a novel strong C=O stretching vibration at 1720 cm−1 appeared. It is noted that this vibration was absent from the spectrum of the HPC [36]. Also, the center of gravity of the (OH) band had a very small blue shift, from 3444 to 3464 cm−1, this shift being caused by the (OH) groups from HPC_P and less by changes in the strength of the hydrogen bonds between molecules. No other significant changes were observed in comparison to the original HPC sample. In the FTIR spectra of HPC_T and HPC_TP, a new band at 1606 cm−1 for HPC_TP and 1622 cm−1 for HPC_T appeared [42], this band being assigned to the carboxyl groups in anionic form (νCOO-), indicating oxidation of the starting product, in positions C-2,3,6 (HPC_TP) and C6 (HPC_T). Another aspect to highlight is the fact that the intensity of the symmetrical stretching of the methyl and hydroxypropyl groups from 2972 cm−1 and 2935 cm−1 was less intense and slightly shifted towards lower frequencies, indicating that the C-H groups (in C6, C2 and C3) present in HPC were destroyed by oxidation. In addition, the absorption band at 1458 cm−1,associated with the size of the crystalline structure of the cellulose, became less prominent in samples HPC_T and HPC_TP, which means that a decrease in its intensity implies a decrease in the degree of crystallinity of the samples. In addition, the intensity of this band was reduced along with the conversion of OH into COO− groups.
FTIR spectroscopy can also be used to determine the crystallinity of a wide variety of materials [43]. In order to perform this, a metric known as the “total crystalline index” (TCI) was developed. This metric is calculated by taking the ratio of the intensities of the peaks occurring at 1377 cm−1 and 2879 cm−1 [44,45]. This parameter is closely related to the “lateral order index” (LOI), which is determined by considering the ratio of peak intensities from 1413 cm−1. The peak at 1413 cm−1 is often assigned to the crystalline cellulose I, while the peak at 943 cm−1 is characteristic of the amorphous component of cellulose [46]. As a result, the LOI provides insight into the overall crystallinity of the sample, with the LOI value increasing as the crystallinity decreases [47]. The intensity of hydrogen bonding, or in the other words, the degree of intermolecular regularity of the cellulose network, is defined by another parameter, known as the “hydrogen bond index” (HBI). The degree to which crystalline and amorphous structures coexist in cellulose derivatives is an important factor in determining both the supramolecular structure of the derivatives and the quality of the cellulose fibers they produce [48]. The hydrogen bonding intensity (HBI) may be determined from the FTIR spectra by comparing the heights of the bands at 3444 cm−1 and 1321 cm−1 and using the ratio of the two values [49]. High HBI values are often caused by the fibers having a greater cellulose crystallinity, according to Poletto et al. [50]. By using FTIR spectroscopy, one is able to easily and reliably determine the crystallinity indices (LOI and TCI) as well as the HBI. Their values are presented in Table 1. Considering the LOI values for the oxidized hydroxypropyl cellulose samples, there was a significant decrease in the degree of crystallinity for the HPC_T and HPC_TP samples. This finding suggests that after oxidation, crystalline domains are unevenly distributed throughout the cellulose samples. A laterally organized cellulose structure is associated with a high LOI value, which was observed for the samples HPC_T and HPC_TP. The highest values of the TCI index and, at the same time, low LOI values for pure HPC and HPC_P samples, shows that these samples have a higher cellulose crystallinity and can present more amorphous domains in the cellulose structure [50].
3.3. NMR
The 1H-NMR spectra for the HPC samples showed a characteristic peak at 4.44 ppm for anomeric protons H1 and in the region of 3.15–3.89 ppm for the rest of the H2–H6 protons for the glucose unit. The peaks for the methylene and methyl groups of the 2-hydroxypropyl substituent overlapped with those of the glucose moiety in the region of 3.15–3.89 ppm. The methyl protons of the 2-hydroxypropyl substituent exhibited resonance signals at 1.09 ppm (Figure 3a). After oxidation with NaIO4, a new signal was observed to have developed in the 1H-NMR spectrum of the HPC_P sample. This signal is thought to be associated with aldehyde CHO groups, which can be seen as proof that the reaction proceeded as expected.
The 13C-NMR spectra exhibited the signals of carbon atoms characteristic of the cellulose backbone. Thus, the C1 atom appeared at 102 ppm, while the signals in the region of 83–65 ppm were attributed to the carbon atoms CH2-CH of the hydroxypropyl group and C2–C6 carbon atoms of the cellulose backbone. According to the literature [51], CH3 carbon from internal hydroxypropyl groups resonates at 16 ppm, whereas CH3 carbon from external hydroxypropyl groups resonates at 18 ppm. In Figure 3b, where the 13C-NMR spectra of HPC and oxidized samples are presented, we can observe two new peaks, at 177.9 ppm and at 211 ppm, for the new products obtained. So, the peak from 177.9 ppm can be assigned to the carbonyl carbons presented in the oxidized samples. The other one, at 211 ppm, is attributed to ketonic groups present, probably because of the NaClO solution assisting in the reaction.
The values of the molar substitution were 2.25 and 2.34 for the HPC_TP and HPC_T samples, respectively (Table 2), indicating a stronger oxidation of these samples compared to the HPC_P, where the MS was 4.49. The percentage of the hydroxypropyl group (HC) content was the lowest value for the HPC_T and HPC_TP samples, which were oxidized at carbon atoms C6 and C2, 3 and 6. The DS value decreased with the number of the hydroxypropyl-group equivalents. Also, after oxidation, we observed a drastic decrease in the hydroxypropyl content in the HPC matrix, with the value of DS decreasing from 2.94 in HPC to 0.97 in the HPC_PT sample.
3.4. SEM
The morphology of the unmodified HPC and oxidized HPC, obtained in the form of films using the solvent-casting method, was examined using SEM (Figure 4).
In the unmodified HPC samples, an advanced structuring appeared, with a cauliflower-like appearance (Figure 4) [52]. As the macromolecular chains are less mobile in the crystalline structure, they might have a tendency to aggregate or form specific patterns during the formation process or while the material is solidifying [53]. This aggregation could give rise to the cauliflower-like morphology observed for the unmodified HPC films. It can be seen that after oxidation, the samples no longer show their initial morphology, thus losing the fibrous structure of the HPC itself. In contrast, in the oxidized samples, these well-defined domains can be partially interrupted by the formation of a significant amount of amorphous regions due to the oxidation process.
3.5. XRD
For comparison, the X-ray diffractograms of the original HPC and those after various oxidation reactions are shown in Figure 5. XRD patterns show that the crystallinity of the HPC was reduced as a result of the progressive breaking of the pyranose rings naturally present in the molecule, except for the HPC_P sample.
XRD patterns reveal that the crystallinity of oxidized HPC undergoes a dramatic reduction as a result of the progressive breakage of the pyranose rings that are naturally present in the molecule [54]. The distinctive two signals of HPC could be seen in each X-ray diffractogram of the samples. These signals were centered at 2θ = 8.60° for the crystalline component, and the ordered amorphous fraction of HPC was centered at 2θ = 20.45° [55,56]. In the case of the oxidized samples with carboxylate groups (HPC_T and HPC_PT), the lowering of the crystallinity index (Cr.I.) value was, without doubt, the result of the oxidation process. This finding suggests that the newly formed carboxylate groups are present not only on the surfaces of the oxidized samples but also, most likely, in some of the internal crystallites [57]. In the case of the sample oxidized with periodate HPC_P, an increase in crystallinity was observed. This increase is attributed to the increased reactivity of periodate; during the oxidation process the hydroxyl groups present in the amorphous region are oxidized to aldehyde groups, groups that lead to the depolymerization of HPC. Similar results were reported by Mendoza et al., who showed that although the periodate concentration had a significant effect on crystallinity, it did not affect the cellulose crystal size [23].
3.6. The Zeta Potential and the Quantity of the Carboxyl Content
The zeta potential is a measure of the electrokinetic features that occurred at the interface between the solid and the liquid, as well as the interactions that rose between them. High levels of chemical and electrochemical interactions may be seen at the interface between a solid and a liquid; these interactions are fundamentally distinct from those that are present in the solid phase. Because of these two characteristics, it is possible to ascertain whether or not there is a net charge present at the boundary between the two phases of the system: (i) the processes of the dissociation of the surface-charged groups, and (ii) the adsorption of potential by the ions from a solution [58]. The zeta potentials of the samples were determined in deionized water at a concentration of 1.0 mg⋅mL−1, and the results are shown in Table 3. From the table, it can be seen that the zeta potential values of HPC were negative, which means that the stability of HPC in aqueous solutions is high. The zeta potential values of the oxidized HPC were also more negative than those of the HPC, ranging from −14.5 mV for the HPC_P to −26.3 mV for the HPC_TP. The HPC_T sample had a ζ potential value of −24.4 mV, indicating that the significant repulsive force developed between the groups of carboxylated molecules, introduced after oxidation with TEMPO, had the highest zeta potential value, and provides a stable, improved solution. In the case of the HPC_TP sample, the value of the ζ potential was only −26.3 mV, despite the fact that it contained a larger total number of carboxyl groups. This discrepancy can be explained by the fact that the cellulose chains were broken apart.
Table 3 shows the content of the carboxylate obtained after oxidation. The oxidation of HPC in a typical TEMPO-mediated oxidation formed a highly carboxylated fraction (1.525 mmol COO−/g). The introduction of sodium periodate into this system increased the carboxylate content to 1.640 mmol COO−/g. Since sodium periodate adds additional sites (i.e., aldehyde groups) for carboxylated synthesis, this increase in carboxylate concentration was anticipated. In hydroxypropyl cellulose, the periodate oxidation process did not considerably introduce carboxylate groups (0.05 mmol COO−/g), which was to be expected.
3.7. Thermal Stability
Thermogravimetric analysis, more often known as TGA, is one of the most prevalent procedures for characterizing materials using thermal techniques. This provides quantifiable information on the change in weight loss of a sample in response to temperature changes. To evaluate the differences between thermograms, the technique of differential thermal analysis is used. Figure 6 depicts the usual thermogravimetric (TG) curve and its associated derivative thermogravimetric (DTG) curve of HPC, as well as the oxidized samples (HPC_T, HPC_P, and HPC_TP). As can be seen in the figure, the thermal disintegration of HPC took place through a single-step process, with the highest level of degradation occurring at 356 °C. As is evident from the information shown in Table 4, the initial decomposition temperatures of oxidized hydroxypropyl cellulose were lower than those of the hydroxypropyl cellulose. Specifically, these temperatures were 340 °C for HPC_TP, 312 °C for HPC_T, and 344 °C for HPC_P, and corresponded to the degradation of HPC anhydro-glucuronate units. It was noticed that the temperature at which the substance decomposed had a strong correlation with the amount of crystallinity present.
After heating HPC to 600 °C, a residue of about 6% by weight remained. The thermal stability of HPC was greatly reduced when it underwent oxidation to create HPC_T and HPC_TP, and the process no longer operated in a single step. It is important to point out that the temperatures at which the oxidized compounds HPC_T and HPC_PT were entirely destroyed were noticeably lower than they were in the case of the sample that had not been changed. On the other hand, the temperature of the HPC_P sample was much closer to that of the unmodified HPC (Table 4, Tonset and Tendset). The amount of new groups introduced into the structure of the HPC determined drastic changes in the thermal stability of the sample, both by the number of aldehyde and/or carboxylic groups introduced, and by their position in the structure of the macromolecular chain [59]. The residual weights of the oxidized samples was noticeably larger than that of regular HPC, which can be explained by the existence of residual metal oxide, which was the consequence of the thermal disintegration of COONa groups [60].
4. Conclusions
Three possible pathways for the oxidation of HPC were studied in this study, utilizing the most popular oxidation protocols: TEMPO as a mediator (in the presence of NaClO and NaBr) and NaIO4. In addition, a hybrid procedure involving a “one pot” oxidation process in the presence of both the TEMPO radical and NaIO4 was developed. The oxidized product yield was dependent on the oxidation system, as was the carboxylic-group content of the structural unit. Even though the morphology of the oxidation products appears to be unaffected by the oxidative environment, as seen in the SEM images, significant differences between the oxidized samples were observed in terms of their crystallinities and thermal behaviors, involving extensive structural changes that depend on the oxidation system used. Based on these first promising results, our future work will focus more on the development of applications involving oxidized HPC: controlled drug delivery systems, food packaging materials, and sorbents for wastewater remediation.
Supplementary Materials
Author Contributions
Conceptualization, R.I.B., G.B., M.V.D. and S.C.; Methodology, R.I.B., G.B. and S.C.; Validation, G.B.; Formal analysis, R.I.B. and A.-M.M.; Investigation, R.I.B. and M.V.D.; Resources, R.I.B.; Writing—original draft, R.I.B., G.B., M.V.D. and S.C.; Supervision, M.V.D. and S.C.; Project administration, R.I.B.; Funding acquisition, R.I.B. All authors have read and agreed to the published version of the manuscript.
Funding
This work was funded by a grant of the Ministry of Research, Innovation and Digitization, CNCS/CCCDI—UEFISCDI, project number PN-III-P1-1.1-PD-2021-0462, within PNCDI III.
Data Availability Statement
The data presented in this study are available on request from the corresponding authors.
Acknowledgments
This work was supported by a grant of the Ministry of Research, Innovation and Digitization, CNCS/CCCDI–UEFISCDI, project number PN-III-P1-1.1-PD-2021-0462, within PNCDI III.
Conflicts of Interest
The authors declare no conflict of interest.
References
- Cooke, C.L.; An, H.J.; Kim, J.; Solnick, J.V.; Lebrilla, C.B. Method for Profiling Mucin Oligosaccharides from Gastric Biopsies of Rhesus Monkeys with and without Helicobacter Pylori Infection. Anal. Chem. 2007, 79, 8090–8097. [Google Scholar] [CrossRef] [PubMed]
- Dube, D.H.; Bertozzi, C.R. Glycans in Cancer and Inflammation—Potential for Therapeutics and Diagnostics. Nat. Rev. Drug Discov. 2005, 4, 477–488. [Google Scholar] [CrossRef] [PubMed]
- Liu, Y.; Ahmed, S.; Sameen, D.E.; Wang, Y.; Lu, R.; Dai, J.; Li, S.; Qin, W. A review of cellulose and its derivatives in biopolymer-based for food packaging application. Trends Food Sci. Technol. 2021, 112, 532–546. [Google Scholar] [CrossRef]
- Das, A.; Ringu, T.; Ghosh, S.; Pramanik, N. A Comprehensive Review on Recent Advances in Preparation, Physicochemical Characterization, and Bioengineering Applications of Biopolymers. Polym. Bull. 2023, 80, 7247–7312. [Google Scholar] [CrossRef]
- Seddiqi, H.; Oliaei, E.; Honarkar, H.; Jin, J.; Geonzon, L.C.; Bacabac, R.G.; Klein-Nulend, J. Cellulose and Its Derivatives: Towards Biomedical Applications. Cellulose 2021, 28, 1893–1931. [Google Scholar] [CrossRef]
- Joseph, B.; Sagarika, V.K.; Sabu, C.; Kalarikkal, N.; Thomas, S. Cellulose Nanocomposites: Fabrication and Biomedical Applications. J. Bioresour. Bioprod. 2020, 5, 223–237. [Google Scholar] [CrossRef]
- Cremer, G.; Danthine, S.; Van Hoed, V.; Dombree, A.; Laveaux, A.-S.; Damblon, C.; Karoui, R.; Blecker, C. Variability in the Substitution Pattern of Hydroxypropyl Cellulose Affects Its Physico-Chemical Properties. Heliyon 2023, 9, e13604. [Google Scholar] [CrossRef]
- Espinha, A.; Dore, C.; Matricardi, C.; Alonso, M.I.; Goñi, A.R.; Mihi, A. Hydroxypropyl Cellulose Photonic Architectures by Soft Nanoimprinting Lithography. Nat. Photonics 2018, 12, 343–348. [Google Scholar] [CrossRef]
- Arca, H.C.; Mosquera-Giraldo, L.I.; Bi, V.; Xu, D.; Taylor, L.S.; Edgar, K.J. Pharmaceutical Applications of Cellulose Ethers and Cellulose Ether Esters. Biomacromolecules 2018, 19, 2351–2376. [Google Scholar] [CrossRef]
- Nichols, B.L.B.; Chen, J.; Mischnick, P.; Edgar, K.J. Selective Oxidation of 2-Hydroxypropyl Ethers of Cellulose and Dextran: Simple and Efficient Introduction of Versatile Ketone Groups to Polysaccharides. Biomacromolecules 2020, 21, 4835–4849. [Google Scholar] [CrossRef]
- Basta, A.H.; Lotfy, V.F.; Micky, J.A.; Salem, A.M. Hydroxypropylcellulose-Based Liquid Crystal Materials. Carbohydr. Polym. Technol. Appl. 2021, 2, 100103. [Google Scholar] [CrossRef]
- Godinho, M.H.; Gray, D.G.; Pieranski, P. Revisiting (Hydroxypropyl) Cellulose (HPC)/Water Liquid Crystalline System. Liq. Cryst. 2017, 44, 2108–2120. [Google Scholar] [CrossRef]
- Seelinger, D.; Trosien, S.; Nau, M.; Biesalski, M. Tailored Oxidation of Hydroxypropyl Cellulose under Mild Conditions for the Generation of Wet Strength Agents for Paper. Carbohydr. Polym. 2021, 254, 117458. [Google Scholar] [CrossRef] [PubMed]
- Dragan, E.S.; Ghiorghita, C.A.; Dinu, M.V.; Duceac, I.A.; Coseri, S. Fabrication of Self-Antibacterial Chitosan/Oxidized Starch Polyelectrolyte Complex Sponges for Controlled Delivery of Curcumin. Food Hydrocoll. 2023, 135, 108147. [Google Scholar] [CrossRef]
- Baron, R.I.; Coseri, S. Preparation of Water-Soluble Cellulose Derivatives Using TEMPO Radical-Mediated Oxidation at Extended Reaction Time. React. Funct. Polym. 2020, 157, 104768. [Google Scholar] [CrossRef]
- Saito, T.; Kimura, S.; Nishiyama, Y.; Isogai, A. Cellulose Nanofibers Prepared by TEMPO-Mediated Oxidation of Native Cellulose. Biomacromolecules 2007, 8, 2485–2491. [Google Scholar] [CrossRef]
- Coseri, S. Cellulose: To Depolymerize…or Not to? Biotechnol. Adv. 2017, 35, 251–266. [Google Scholar] [CrossRef]
- Biliuta, G.; Sacarescu, L.; Socoliuc, V.; Iacob, M.; Gheorghe, L.; Negru, D.; Coseri, S. Carboxylated Polysaccharides Decorated with Ultrasmall Magnetic Nanoparticles with Antibacterial and MRI Properties. Macromol. Chem. Phys. 2017, 218, 1700062. [Google Scholar] [CrossRef]
- Isogai, A.; Kato, Y. Preparation of Polyuronic Acid from Cellulose by TEMPO-Mediated Oxidation. Cellulose 1998, 4, 153–164. [Google Scholar] [CrossRef]
- Isogai, A.; Saito, T.; Fukuzumi, H. TEMPO-Oxidized Cellulose Nanofibers. Nanoscale 2011, 3, 71–85. [Google Scholar] [CrossRef]
- Shibata, I.; Isogai, A. Depolymerization of Cellouronic Acid during TEMPO-Mediated Oxidation. Cellulose 2003, 10, 151–158. [Google Scholar] [CrossRef]
- Okita, Y.; Saito, T.; Isogai, A. Entire Surface Oxidation of Various Cellulose Microfibrils by TEMPO-Mediated Oxidation. Biomacromolecules 2010, 11, 1696–1700. [Google Scholar] [CrossRef] [PubMed]
- Mendoza, D.J.; Browne, C.; Raghuwanshi, V.S.; Simon, G.P.; Garnier, G. One-Shot TEMPO-Periodate Oxidation of Native Cellulose. Carbohydr. Polym. 2019, 226, 115292. [Google Scholar] [CrossRef] [PubMed]
- Culica, M.E.; Rotaru, R.; Bejan, D.; Coroaba, A.; Mohan, T.; Coseri, S. Cellulose Surface Modification for Improved Attachment of Carbon Nanotubes. Cellulose 2022, 29, 6057–6076. [Google Scholar] [CrossRef]
- Baron, R.I.; Bercea, M.; Avadanei, M.; Lisa, G.; Biliuta, G.; Coseri, S. Green Route for the Fabrication of Self-Healable Hydrogels Based on Tricarboxy Cellulose and Poly(Vinyl Alcohol). Int. J. Biol. Macromol. 2019, 123, 744–751. [Google Scholar] [CrossRef]
- Ho, F.F.L.; Kohler, R.R.; Ward, G.A. Determination of Molar Substitution and Degree of Substitution of Hydroxypropyl Cellulose by Nuclear Magnetic Resonance Spectrometry. Anal. Chem. 1972, 44, 178–181. [Google Scholar] [CrossRef]
- Yang, X.J.; Zhi, Z.I.; Lu, L.D.; Wang, X. Determination of the Molar Substitution of Hydroxypropyl Celluloses by an NMR Method. Spectrosc. Lett. 2006, 31, 1279–1285. [Google Scholar] [CrossRef]
- Segal, L.; Creely, J.J.; Martin, A.E.; Conrad, C.M. An Empirical Method for Estimating the Degree of Crystallinity of Native Cellulose Using the X-Ray Diffractometer. Text. Res. J. 1959, 29, 786–794. [Google Scholar] [CrossRef]
- Chen, Y.; Xie, M.Y.; Nie, S.P.; Li, C.; Wang, Y.X. Purification, Composition Analysis and Antioxidant Activity of a Polysaccharide from the Fruiting Bodies of Ganoderma Atrum. Food Chem. 2008, 107, 231–241. [Google Scholar] [CrossRef]
- Zai, Z.; Yan, M.; Shi, C.; Zhang, L.; Lu, H.; Xiong, Z.; Ma, J. Cellulose Nanofibrils (CNFs) in Uniform Diameter: Capturing the Impact of Carboxyl Group on Dispersion and Re-Dispersion of CNFs Suspensions. Int. J. Biol. Macromol. 2022, 207, 23–30. [Google Scholar] [CrossRef]
- Lai, C.; Zhang, S.; Sheng, L.; Liao, S.; Xi, T.; Zhang, Z. TEMPO-Mediated Oxidation of Bacterial Cellulose in a Bromide-Free System. Colloid. Polym. Sci. 2013, 291, 2985–2992. [Google Scholar] [CrossRef]
- Chen, J.; Edgar, K.J.; Frazier, C.E. Photo-curable, double-crosslinked, in situ-forming hydrogels based on oxidized hydroxypropyl cellulose. Cellulose 2021, 28, 3903–3915. [Google Scholar] [CrossRef]
- Chang, C.; Zhang, L. Cellulose-based hydrogels: Present status and application prospects. Carbohydr. Polym. 2011, 84, 40–53. [Google Scholar] [CrossRef]
- Coseri, S. A New and Efficient Heterogeneous System for the PhthalimideN-Oxyl (PINO) Radical Generation. Eur. J. Org. Chem. 2007, 2007, 1725–1729. [Google Scholar] [CrossRef]
- Biliuta, G.; Fras, L.; Harabagiu, V.; Coseri, S. Mild Oxidation of Cellulose Fibers Using Dioxygen as Ultimate Oxidizing Agent. Dig. J. Nanomater. Biostruct. 2011, 6, 293–299. [Google Scholar]
- Calvini, P.; Gorassini, A.; Luciano, G.; Franceschi, E. FTIR and WAXS Analysis of Periodate Oxycellulose: Evidence for a Cluster Mechanism of Oxidation. Vib. Spectrosc. 2006, 40, 177–183. [Google Scholar] [CrossRef]
- de Nooy, A.E.J.; Besemer, A.C.; van Bekkum, H.; van Dijk, J.A.P.P.; Smit, J.A.M. TEMPO-Mediated Oxidation of Pullulan and Influence of Ionic Strength and Linear Charge Density on the Dimensions of the Obtained Polyelectrolyte Chains. Macromolecules 1996, 29, 6541–6547. [Google Scholar] [CrossRef]
- Okada, T.; Asawa, T.; Sugiyama, Y.; Kirihara, M.; Iwai, T.; Kimura, Y. Sodium Hypochlorite Pentahydrate (NaOCl·5H2O) Crystals as an Extra ordinary Oxidant for Primary and Secondary Alcohols. Synlett 2014, 25, 596–598. [Google Scholar] [CrossRef]
- Yixue, S.; Bin, C.; Yuan, G.; Chaoxi, W.; Lingmin, Z.; Peng, C.; Xiaoying, W.; Shunqing, T. Modification of Agarose with Carboxylation and Grafting Dopamine for Promotion of Its Cell-Adhesiveness. Carbohydr. Polym. 2013, 92, 2245–2251. [Google Scholar] [CrossRef]
- Sharma, R.; Varshney, V.K.; Chauhan, G.S.; Naithani, S.; Soni, P.L. Hydroxypropylation of Cellulose Isolated from Bamboo (Dendrocalamus Strictus) with Respect to Hydroxypropoxyl Content and Rheological Behavior of the Hydroxypropyl Cellulose. J. Appl. Polym. Sci. 2009, 113, 2450–2455. [Google Scholar] [CrossRef]
- Abdel-Halim, E.S.; Alanazi, H.H.; Al-Deyab, S.S. Utilization of Olive Tree Branch Cellulose in Synthesis of Hydroxypropyl Carboxymethyl Cellulose. Carbohydr. Polym. 2015, 127, 124–134. [Google Scholar] [CrossRef] [PubMed]
- Kaldéus, T.; Larsson, P.T.; Boujemaoui, A.; Malmström, E. One-Pot Preparation of Bi-Functional Cellulose Nanofibrils. Cellulose 2018, 25, 7031–7042. [Google Scholar] [CrossRef]
- Zaltariov, M.F.; Filip, D.; Macocinschi, D.; Spiridon, I. Hydrohypropyl cellulose/polyurethane blends. The behavior after accelerated ageing. A ftir study. Cellul. Chem. Technol. 2020, 54, 903–914. [Google Scholar] [CrossRef]
- Rafidison, B.H.; Ramasawmy, H.; Chummun, J.; Florens, F.B.V. Using Infrared Spectrum Analyses to Predict Tensile Strength of Fibres in a Group of Closely Related Plant Species: Case of Mascarenes Pandanus spp. SN Appl. Sci. 2020, 2, 1922. [Google Scholar] [CrossRef]
- Oh, S.Y.; Yoo, D.I.; Shin, Y.; Seo, G. FTIR Analysis of Cellulose Treated with Sodium Hydroxide and Carbon Dioxide. Carbohydr. Res. 2005, 340, 417–428. [Google Scholar] [CrossRef]
- Åkerholm, M.; Hinterstoisser, B.; Salmén, L. Characterization of the Crystalline Structure of Cellulose Using Static and Dynamic FT-IR Spectroscopy. Carbohydr. Res. 2004, 339, 569–578. [Google Scholar] [CrossRef]
- Smith, H.M.; Walker, L.P. Enzymatic Transformations of Cellulose Assessed by Quantitative High-Throughput Fourier Transform Infrared Spectroscopy (QHT-FTIR). Biotechnol. Bioeng. 2011, 108, 1509–1520. [Google Scholar] [CrossRef]
- Zhang, L.; Li, X.; Zhang, S.; Gao, Q.; Lu, Q.; Peng, R.; Xu, P.; Shang, H.; Yuan, Y.; Zou, H. Micro-FTIR Combined with Curve Fitting Method to Study Cellulose Crystallinity of Developing Cotton Fibers. Anal. Bioanal. Chem. 2021, 413, 1313–1320. [Google Scholar] [CrossRef]
- Cichosz, S.; Masek, A. IR Study on Cellulose with the Varied Moisture Contents: Insight into the Supramolecular Structure. Materials 2020, 13, 4573. [Google Scholar] [CrossRef]
- Poletto, M.; Ornaghi Júnior, H.L.; Zattera, A.J.; Properties, T. Native Cellulose: Structure, Characterization and Thermal Properties. Materials 2014, 7, 6105–6119. [Google Scholar] [CrossRef]
- Kimura, K.; Shigemura, T.; Kubo, M.; Maru, Y. 13C NMR Study of O-(2-Hydroxypropyl)Cellulose. Die Makromol. Chem. 1985, 186, 61–70. [Google Scholar] [CrossRef]
- Ma, Y.; Wang, C.; Qin, Z.; Chen, G.; Xia, L.; Zhong, B. Preparation of Cauliflower Shaped Hp-Co/GNs Composite Microwave Absorbing Materials. Mater. Charact. 2022, 189, 111907. [Google Scholar] [CrossRef]
- Chan, C.L.C.; Bay, M.M.; Jacucci, G.; Vadrucci, R.; Williams, C.A.; van de Kerkhof, G.T.; Parker, R.M.; Vynck, K.; Frka-Petesic, B.; Vignolini, S. Visual Appearance of Chiral Nematic Cellulose-Based Photonic Films: Angular and Polarization Independent Color Response with a Twist. Adv. Mater. 2019, 31, 1905151. [Google Scholar] [CrossRef] [PubMed]
- Plappert, S.F.; Quraishi, S.; Pircher, N.; Mikkonen, K.S.; Veigel, S.; Klinger, K.M.; Potthast, A.; Rosenau, T.; Liebner, F.W. Transparent, Flexible, and Strong 2,3-Dialdehyde Cellulose Films with High Oxygen Barrier Properties. Biomacromolecules 2018, 19, 2969–2978. [Google Scholar] [CrossRef] [PubMed]
- Barzic, A.I.; Soroceanu, M.; Rotaru, R.; Doroftei, F.; Asandulesa, M.; Tugui, C.; Dascalu, I.A.; Harabagiu, V. Cellulose derivative/barium titanate composites with high refractive index, conductivity and energy density. Cellulose 2022, 29, 863–878. [Google Scholar] [CrossRef]
- Echeverria, C.; Almeida, P.L.; Feio, G.; Figueirinhas, J.L.; Godinho, M.H. A Cellulosic Liquid Crystal Pool for Cellulose Nanocrystals: Structure and Molecular Dynamics at High Shear Rates. Eur. Polym. J. 2015, 72, 72–81. [Google Scholar] [CrossRef]
- Cheng, F.; Liu, C.; Wei, X.; Yan, T.; Li, H.; He, J.; Huang, Y. Preparation and Characterization of 2,2,6,6-Tetramethylpiperidine-1-Oxyl (TEMPO)-Oxidized Cellulose Nanocrystal/Alginate Biodegradable Composite Dressing for Hemostasis Applications. ACS Sustain. Chem. Eng. 2017, 5, 3819–3828. [Google Scholar] [CrossRef]
- Reischl, M.; Stana-Kleinschek, K.; Ribitsch, V. Electrokinetic Investigations of Oriented Cellulose Polymers. Macromol. Symp. 2006, 244, 31–47. [Google Scholar] [CrossRef]
- Sharma, P.R.; Varma, A.J. Functionalized Celluloses and Their Nanoparticles: Morphology, Thermal Properties, and Solubility Studies. Carbohydr. Polym. 2014, 104, 135–142. [Google Scholar] [CrossRef]
- do Nascimento, E.S.; Pereira, A.L.S.; Barros, M.d.O.; Barroso, M.K.d.A.; Lima, H.L.S.; Borges, M.d.F.; Feitosa, J.P.d.A.; de Azeredo, H.M.C.; Rosa, M.d.F. TEMPO Oxidation and High-Speed Blending as a Combined Approach to Disassemble Bacterial Cellulose. Cellulose 2019, 26, 2291–2302. [Google Scholar] [CrossRef]
- Sirvio, J.; Hyvakko, U.; Liimatainen, H.; Niinimaki, J.; Hormi, O. Periodate oxidation of cellulose at elevated temperatures using metal salts as cellulose activators. Carbohydr. Polym. 2011, 83, 1293–1297. [Google Scholar]
- Larsson, P.A.; Gimåker, M.; Wågberg, L. The influence of periodate oxidation on the moisture sorptivity and dimensional stability of paper. Cellulose 2008, 15, 837–847. [Google Scholar] [CrossRef]
- Wang, X.; Fang, G.; Hu, C.; Du, T. Application of Ultrasonic Waves in Activation of Microcrystalline Cellulose. J. Appl. Polym. Sci. 2008, 109, 2762–2767. [Google Scholar] [CrossRef]
- Pommerening, K.; Rein, H.; Bertram, D.; Muller, R. Estimation of dialdehyde groups in 2,3-dialdehyde bead-cellulose. Carbohydr. Polym. 1992, 233, 219–223. [Google Scholar] [CrossRef]
- Hofreiter, B.T.; Alexander, B.H.; Wolff, J.A. Rapid estimation of dialdehyde content of periodate oxystarch through quantitative alkali consumption. Anal. Chem. 1955, 27, 1930–1931. [Google Scholar] [CrossRef]
Figure 1.
Schematic representation of HPC oxidation of in the presence of different oxidizing agents.
Figure 1.
Schematic representation of HPC oxidation of in the presence of different oxidizing agents.

Figure 2.
The FTIR spectrum of HPC and the oxidized samples.

Figure 3.
(a) 1H-NMR spectra of pristine HPC and oxidized samples (HPC_T, HPC_P and HPC_TP), and (b) 13C-NMR spectra of HPC and oxidized samples (HPC_T, HPC_P and HPC_TP), in D2O.
Figure 3.
(a) 1H-NMR spectra of pristine HPC and oxidized samples (HPC_T, HPC_P and HPC_TP), and (b) 13C-NMR spectra of HPC and oxidized samples (HPC_T, HPC_P and HPC_TP), in D2O.

Figure 4.
SEM images of HPC and oxidized HPC in the presence of the TEMPO/NaClO/NaBr system (HPC_T); in the presence of NaIO4 (HPC_P); and in the presence of the TEMPO/NaClO/NaBr/NaIO4 system (HPC_TP).
Figure 4.
SEM images of HPC and oxidized HPC in the presence of the TEMPO/NaClO/NaBr system (HPC_T); in the presence of NaIO4 (HPC_P); and in the presence of the TEMPO/NaClO/NaBr/NaIO4 system (HPC_TP).

Figure 5.
The XRD diffractograms of the analyzed samples and their crystallinity indices.

Figure 6.
Thermogravimetric (TG) and the corresponding derivative thermogravimetric (DTG) curves of pristine hydroxypropyl cellulose (HPC) and the oxidized samples (HPC_T, HPC_P and HPC_TP).
Figure 6.
Thermogravimetric (TG) and the corresponding derivative thermogravimetric (DTG) curves of pristine hydroxypropyl cellulose (HPC) and the oxidized samples (HPC_T, HPC_P and HPC_TP).


Table 1.
Crystallinity indices of HPC and the oxidized samples.
| Sample | TCI (A1377/A2879) | LOI (A1413/A943) | HBI (A3444/A1328) (%) |
|---|---|---|---|
| HPC | 1.32 | 0.39 | 9.2 |
| HPC_T | 1.45 | 1.15 | 6.6 |
| HPC_P | 1.30 | 0.39 | 9.3 |
| HPC_TP | 1.16 | 1.18 | 7.0 |
Table 2.
The molar substitution (MS), the degree of substitution (DS) and the content of hydroxypropyl group (HC) of the analyzed samples.
Table 2.
The molar substitution (MS), the degree of substitution (DS) and the content of hydroxypropyl group (HC) of the analyzed samples.
| Sample | a MS | b DS | c HC % |
|---|---|---|---|
| HPC | 4.93 | 2.49 | 63.8 |
| HPC_T | 2.40 | 1.55 | 45.59 |
| HPC_P | 4.49 | 1.75 | 46.18 |
| HPC_TP | 2.25 | 0.84 | 44.61 |
a, b, c are calculated according to Equations (1)–(3).
Table 3.
Carboxylate content (mmol/g HPC), aldehyde content (%), mass yield (%) and zeta potential value (mV) of the samples.
Table 3.
Carboxylate content (mmol/g HPC), aldehyde content (%), mass yield (%) and zeta potential value (mV) of the samples.
| Sample | a COO− Content (mmol/g HPC) | b Aldehyde Content (%) | c Mass Yield (%) | d Zeta Potential (ζ, mV) |
|---|---|---|---|---|
| HPC | - | - | - | −8.26 |
| HPC_T | 1.525 | - | 95 | −24.4 |
| HPC_P | 0.05 | 13.375 | 88 | −14.5 |
| HPC_PT | 1.640 | - | 70 | −26.3 |
a—determined with Equation (7); b—determined with Equation (8); c—determined with Equation (6); d—determined with Equation (5).
Table 4.
Thermogravimetric data, T onset peak (onset degradation temperature) and T endset peak (final degradation temperature), weight loss (%) and residue values for the analyzed samples (weight remaining at 700 °C).
Table 4.
Thermogravimetric data, T onset peak (onset degradation temperature) and T endset peak (final degradation temperature), weight loss (%) and residue values for the analyzed samples (weight remaining at 700 °C).
| Sample | Samples Mass (mg) | W% | Total Weight Loss at 700 °C (Residue, %) | T Onset (°C) | T Endset (°C) | T Peak (DTG/°C) |
|---|---|---|---|---|---|---|
| HPC | 15.42 | 75.11 | 6.15 | 356.8 | 389.2 | 375 |
| HPC_P | 8.23 | 68.82 | 29.24 | 344.6 | 382.8 | 298 |
| HPC_T | 8.36 | 44.25 | 10.52 | 272.3 | 315.7 | 367 |
| HPC_TP | 8.11 | 45.31 | 31.85 | 255.2 | 311.5 | 285 |
Disclaimer/Publisher’s Note: The statements, opinions and data contained in all publications are solely those of the individual author(s) and contributor(s) and not of MDPI and/or the editor(s). MDPI and/or the editor(s) disclaim responsibility for any injury to people or property resulting from any ideas, methods, instructions or products referred to in the content. |
© 2023 by the authors. Licensee MDPI, Basel, Switzerland. This article is an open access article distributed under the terms and conditions of the Creative Commons Attribution (CC BY) license (https://creativecommons.org/licenses/by/4.0/).
Share and Cite
MDPI and ACS Style
Baron, R.I.; Biliuta, G.; Macsim, A.-M.; Dinu, M.V.; Coseri, S. Chemistry of Hydroxypropyl Cellulose Oxidized by Two Selective Oxidants. Polymers 2023, 15, 3930. https://doi.org/10.3390/polym15193930
AMA Style
Baron RI, Biliuta G, Macsim A-M, Dinu MV, Coseri S. Chemistry of Hydroxypropyl Cellulose Oxidized by Two Selective Oxidants. Polymers. 2023; 15(19):3930. https://doi.org/10.3390/polym15193930
Chicago/Turabian StyleBaron, Raluca Ioana, Gabriela Biliuta, Ana-Maria Macsim, Maria Valentina Dinu, and Sergiu Coseri. 2023. "Chemistry of Hydroxypropyl Cellulose Oxidized by Two Selective Oxidants" Polymers 15, no. 19: 3930. https://doi.org/10.3390/polym15193930
Note that from the first issue of 2016, this journal uses article numbers instead of page numbers. See further details here.