
Research on Compressive and Flexural Properties of Coal Gangue-Slag Geopolymer under Wetting-Drying Cycles and Analysis of Micro-Mechanism


Abstract
: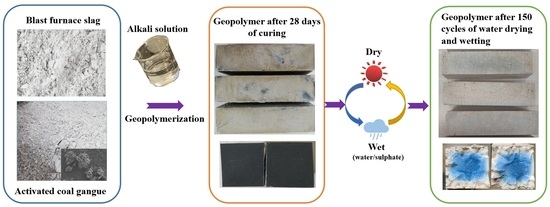
1. Introduction
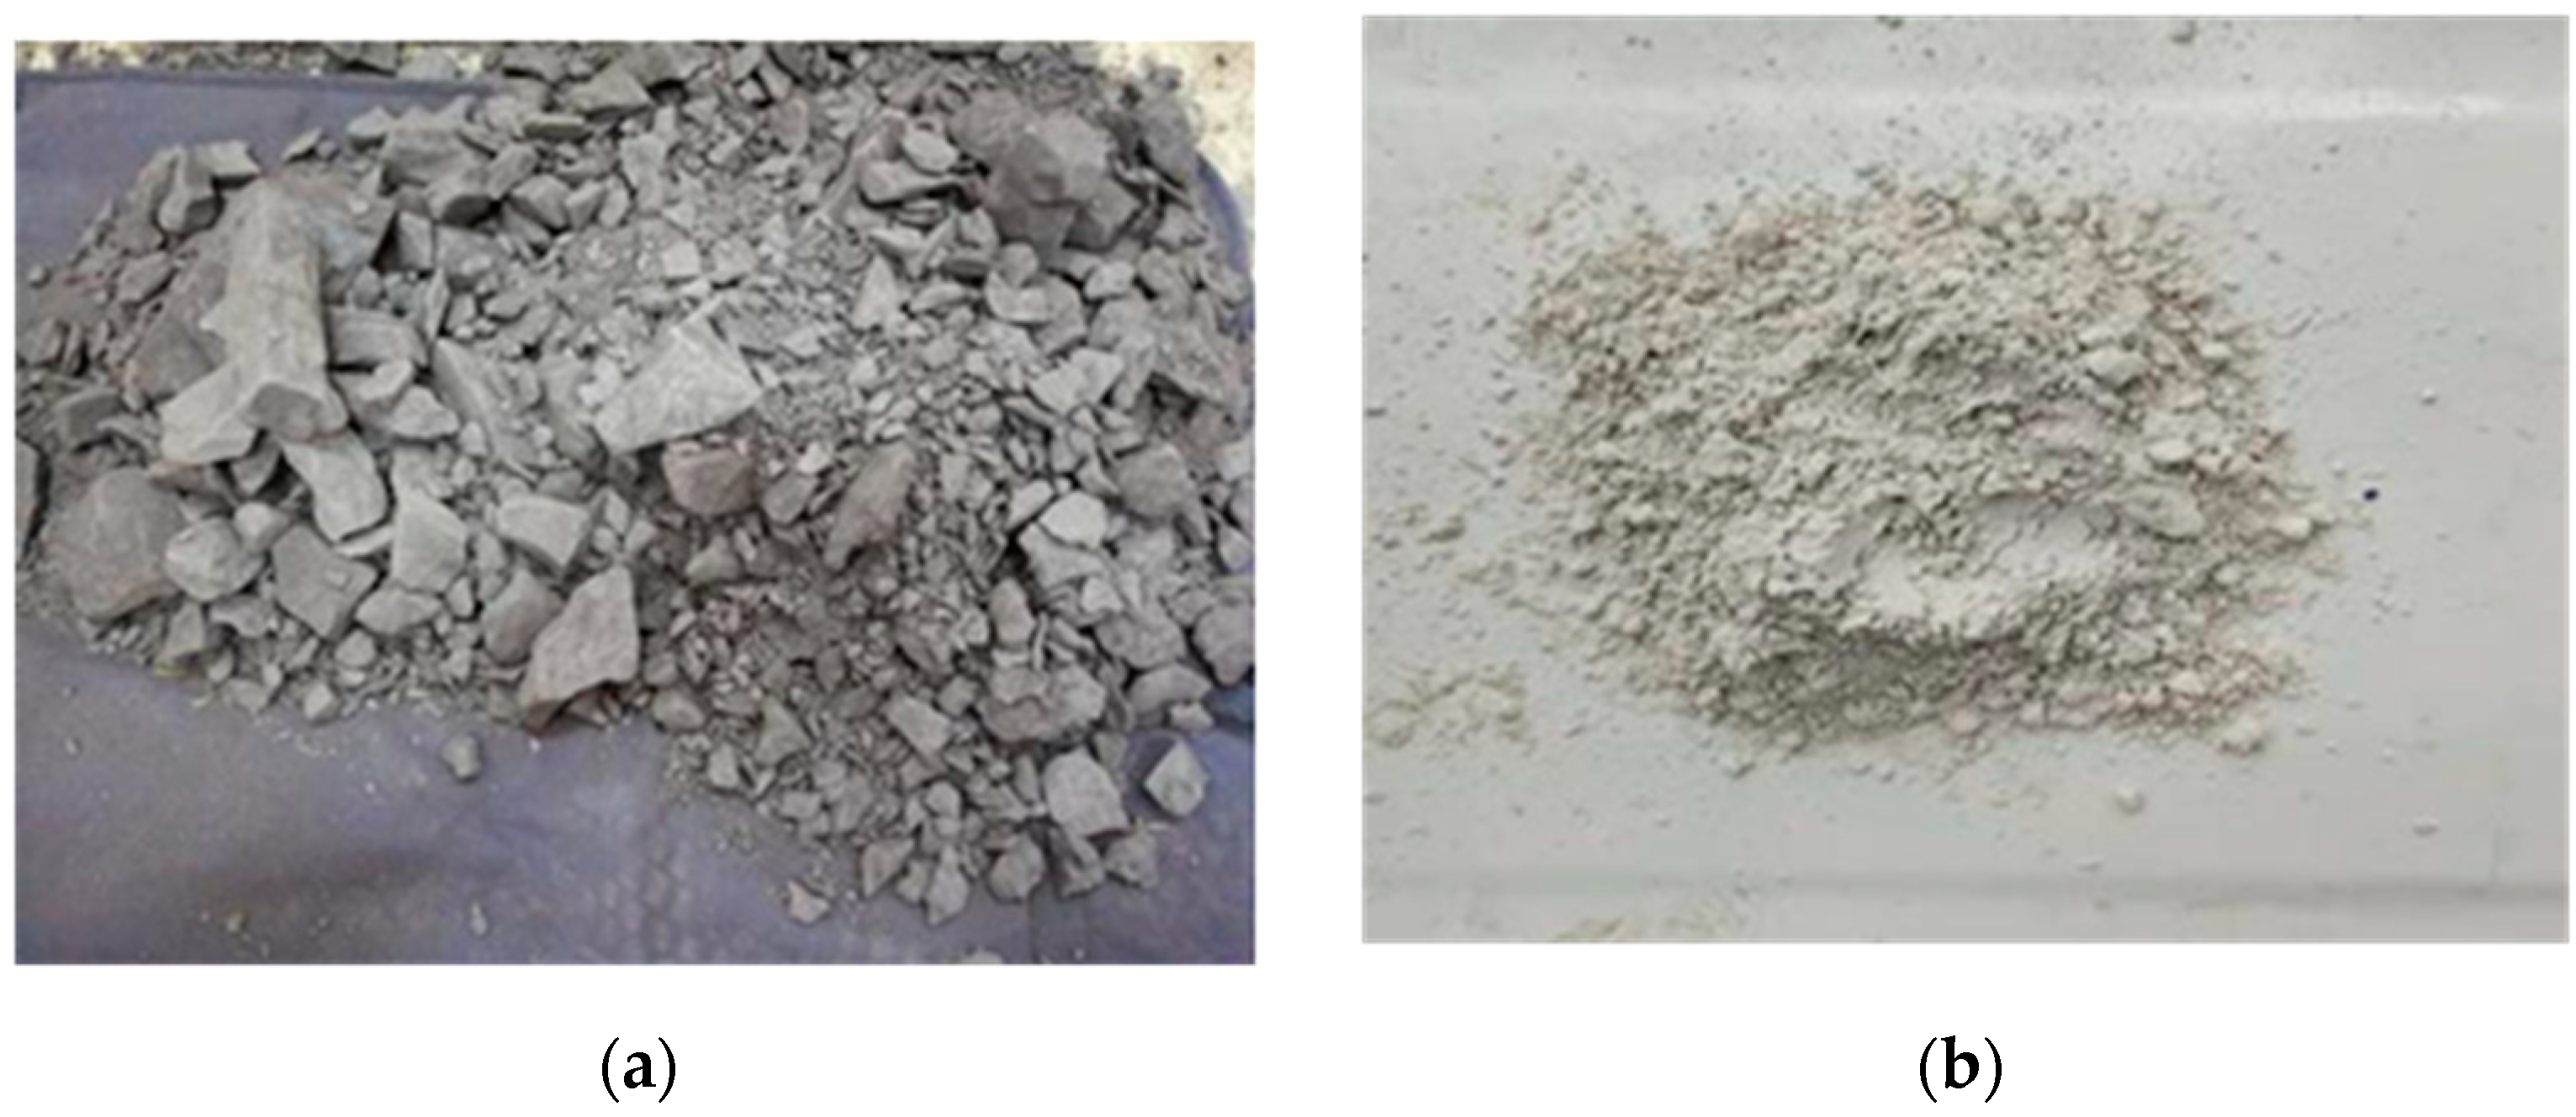
2. Raw Materials and Methods
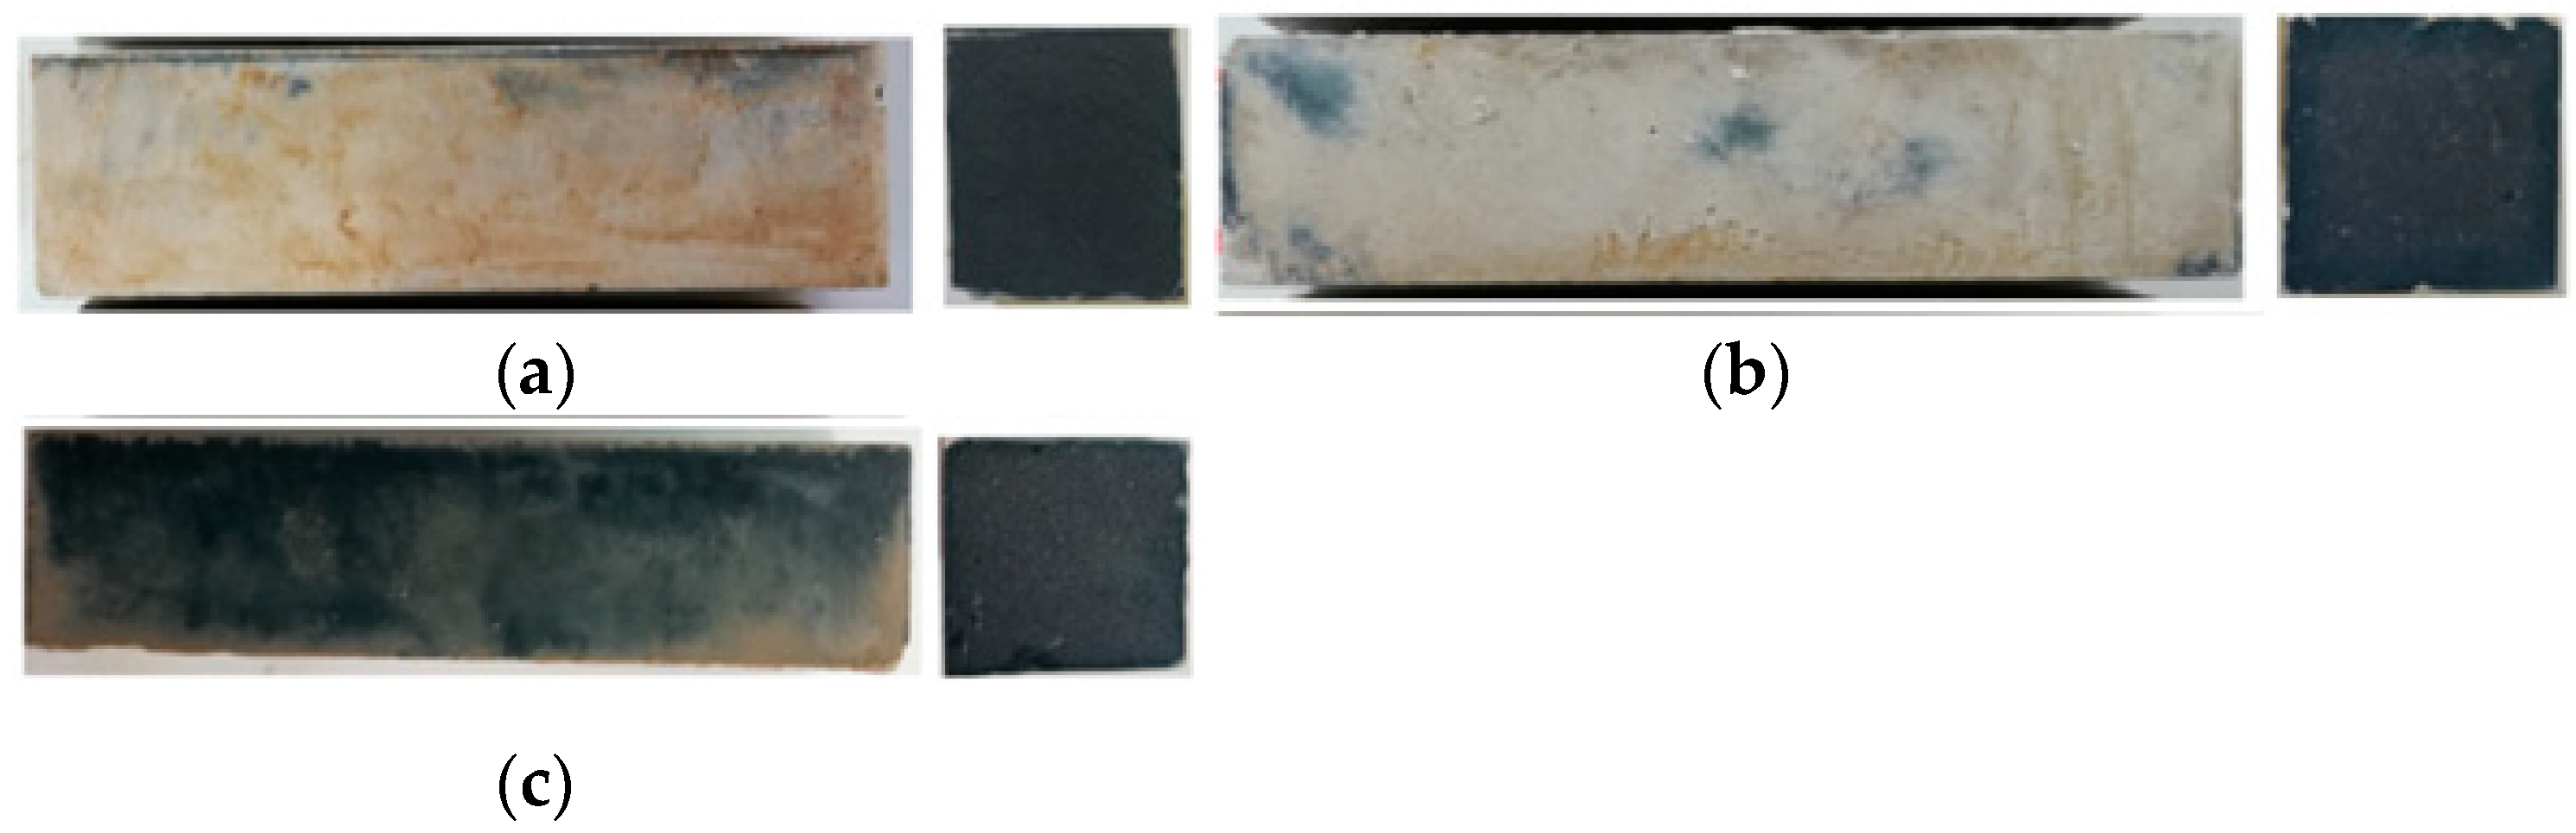
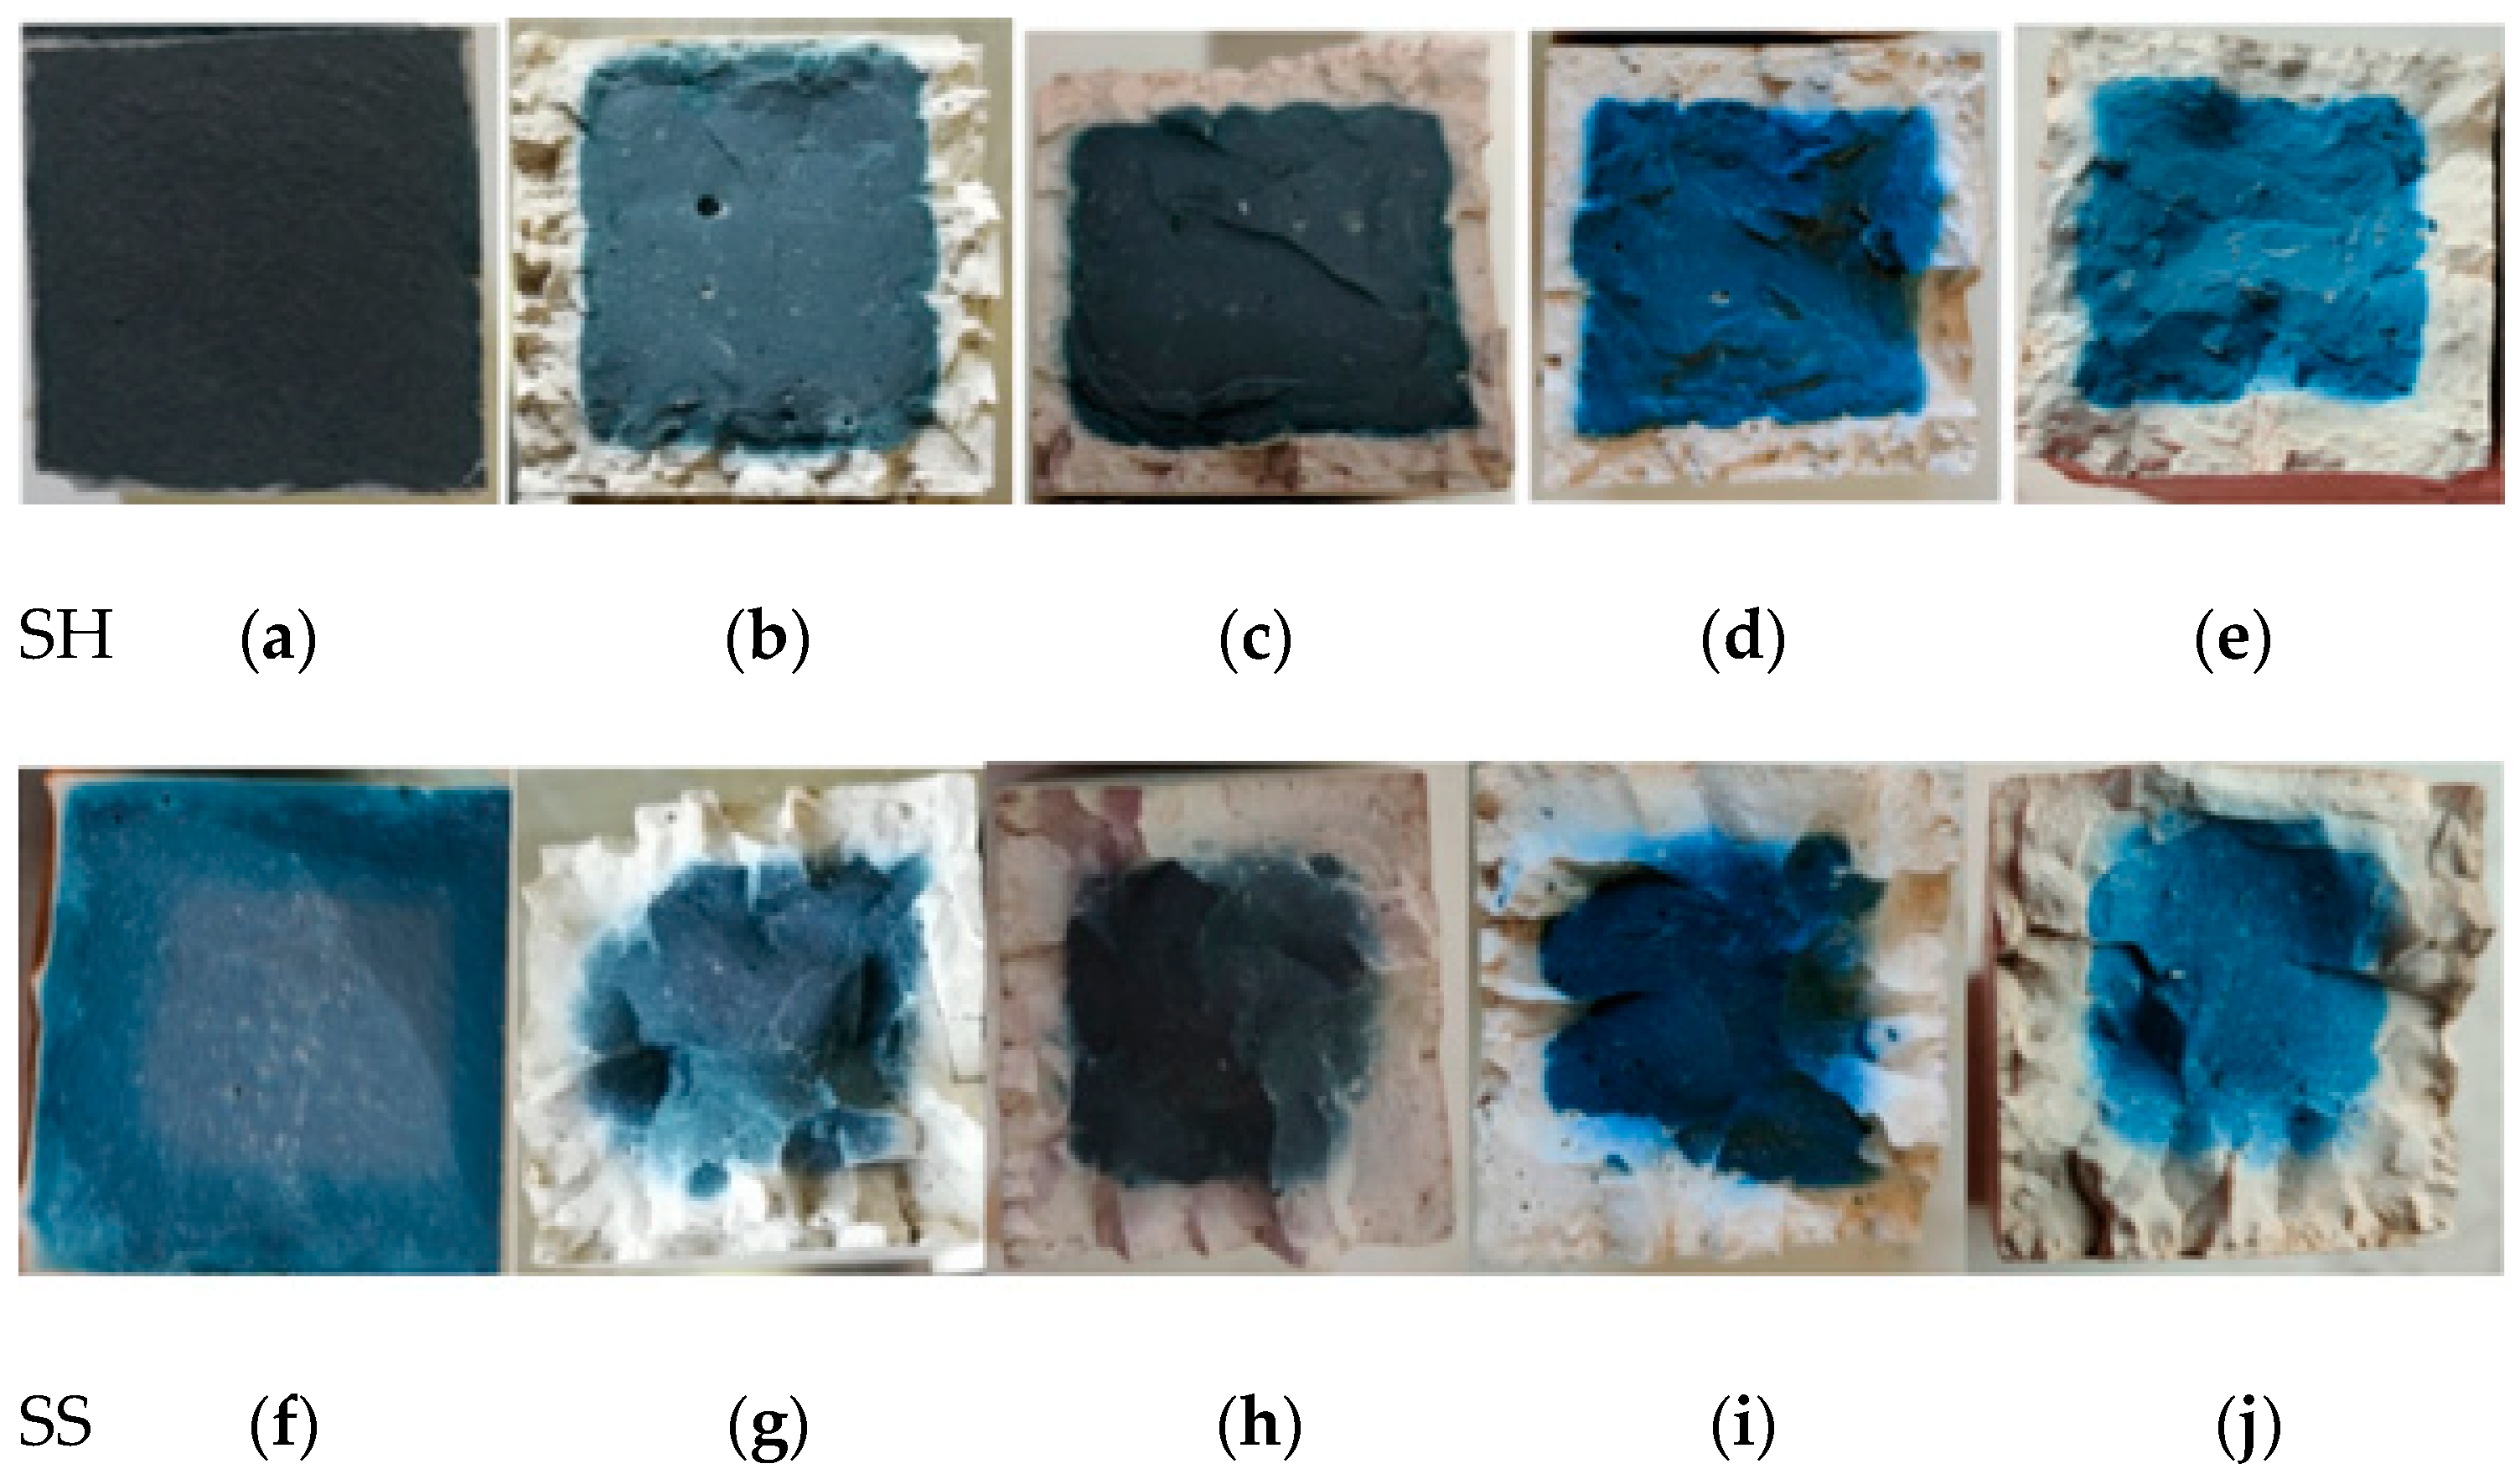
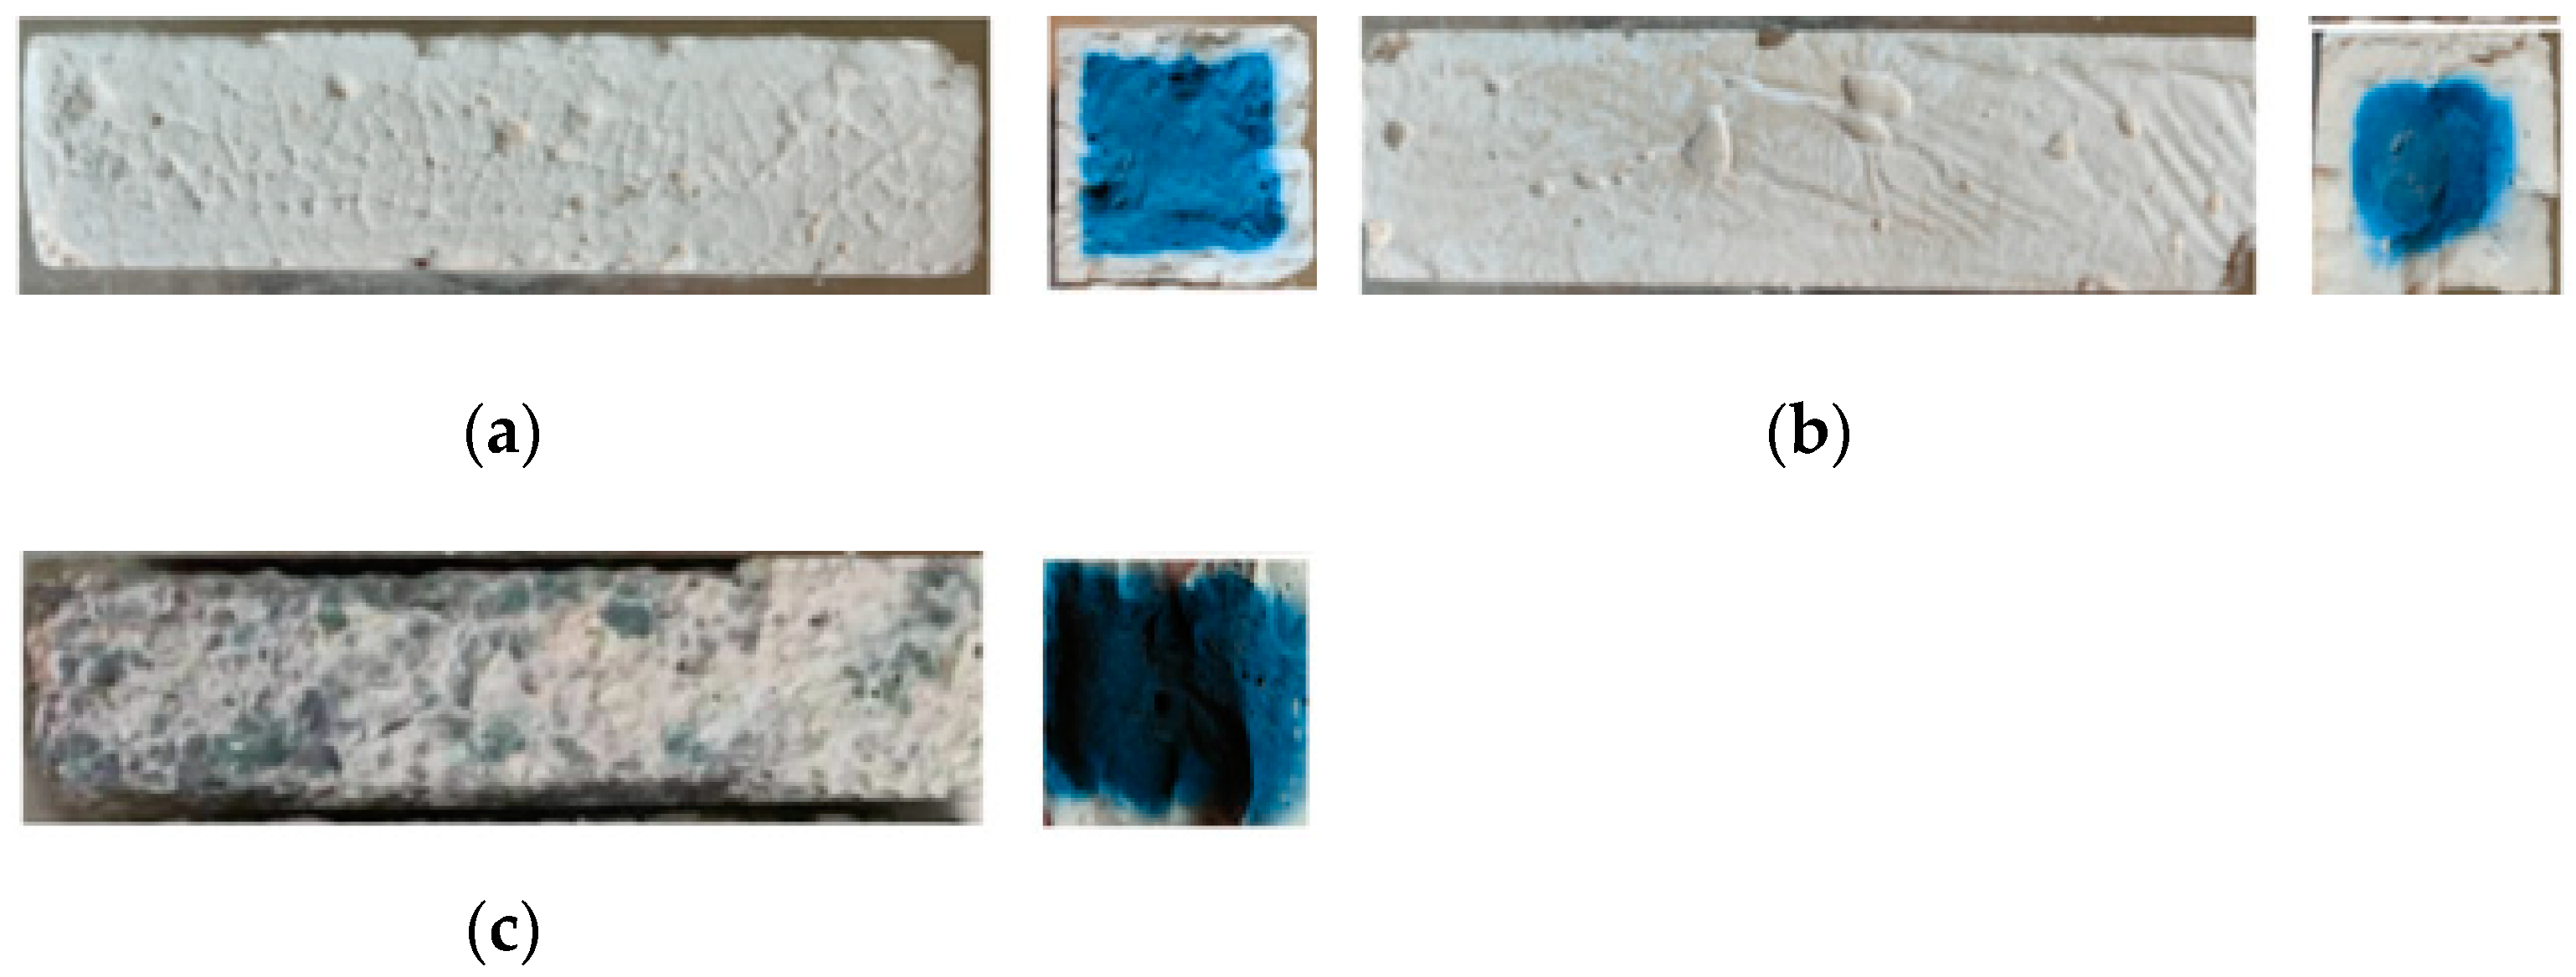
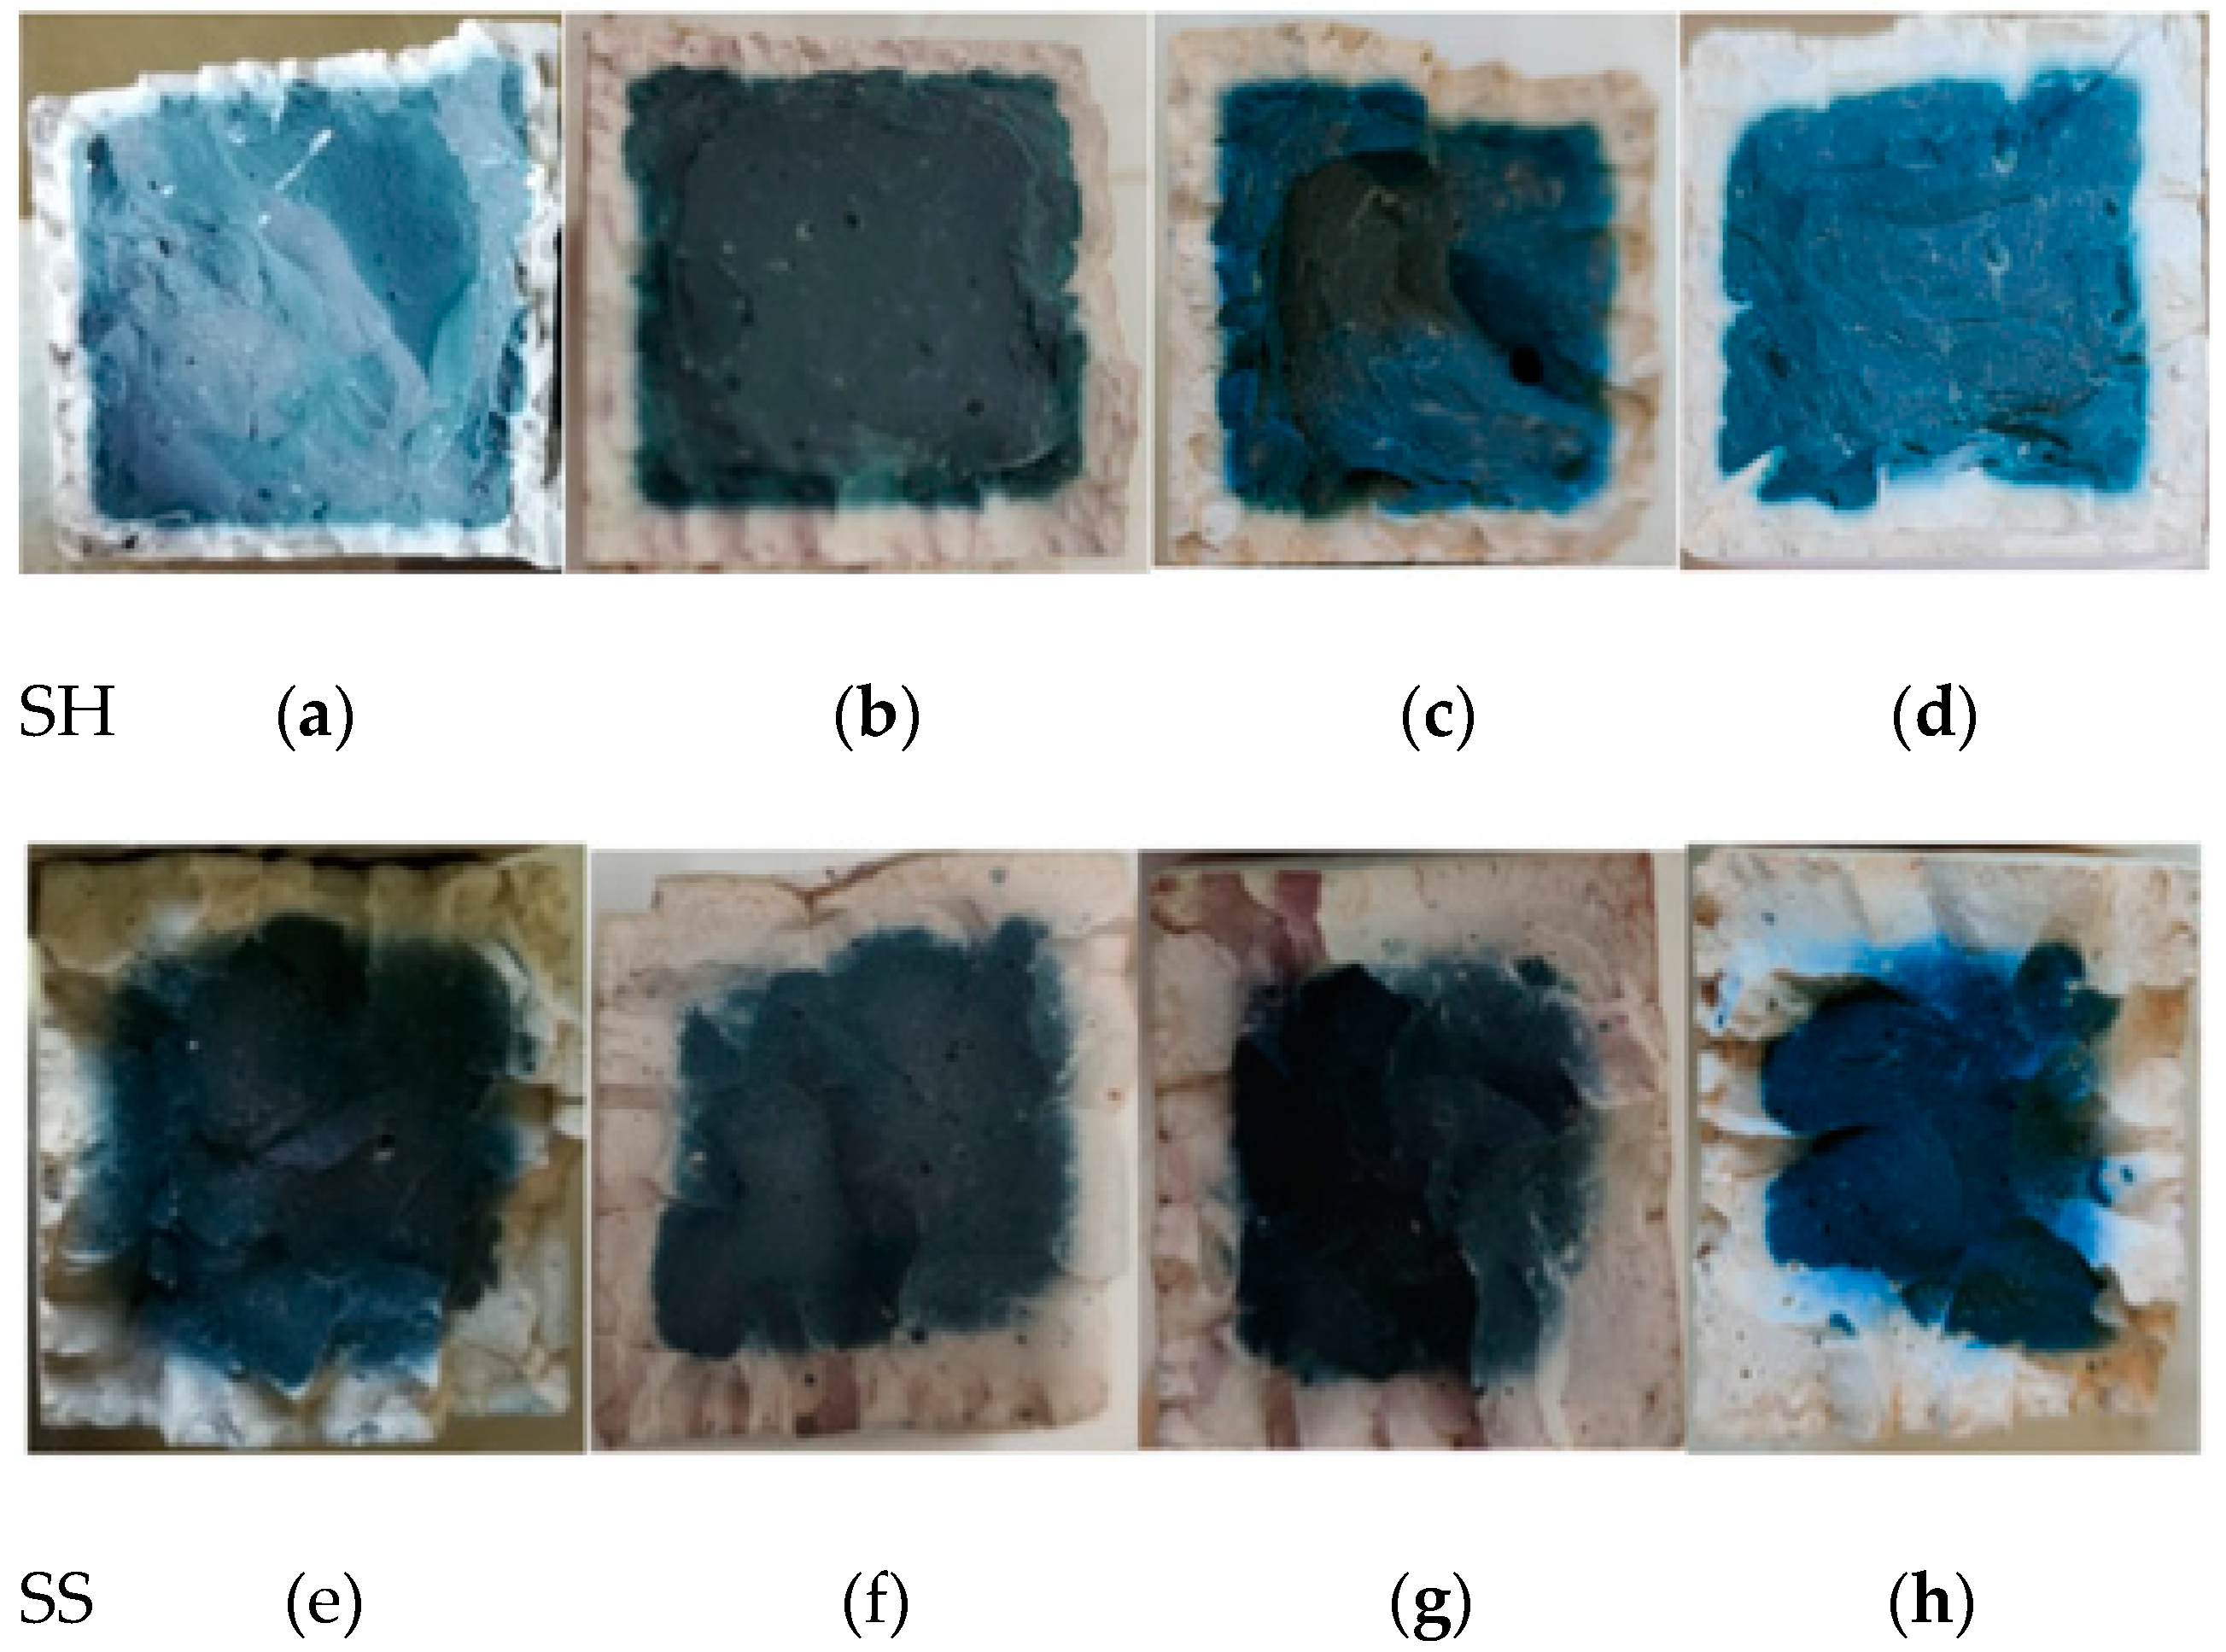
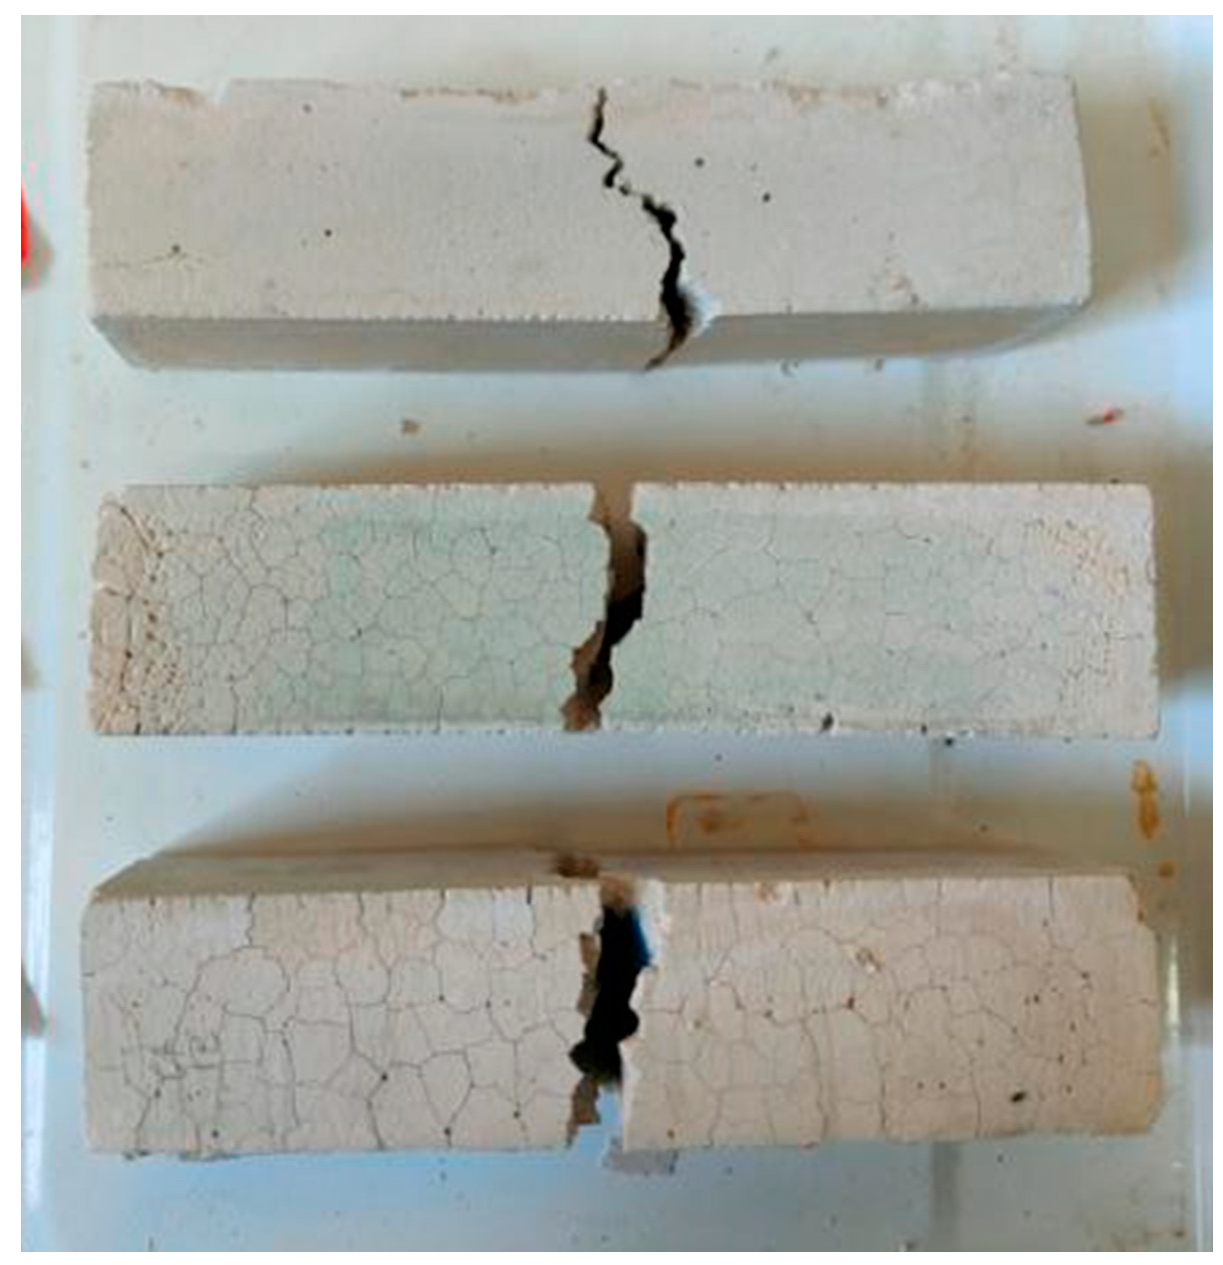
3. The Appearance of the Specimen
3.1. W-D Cycles of Water
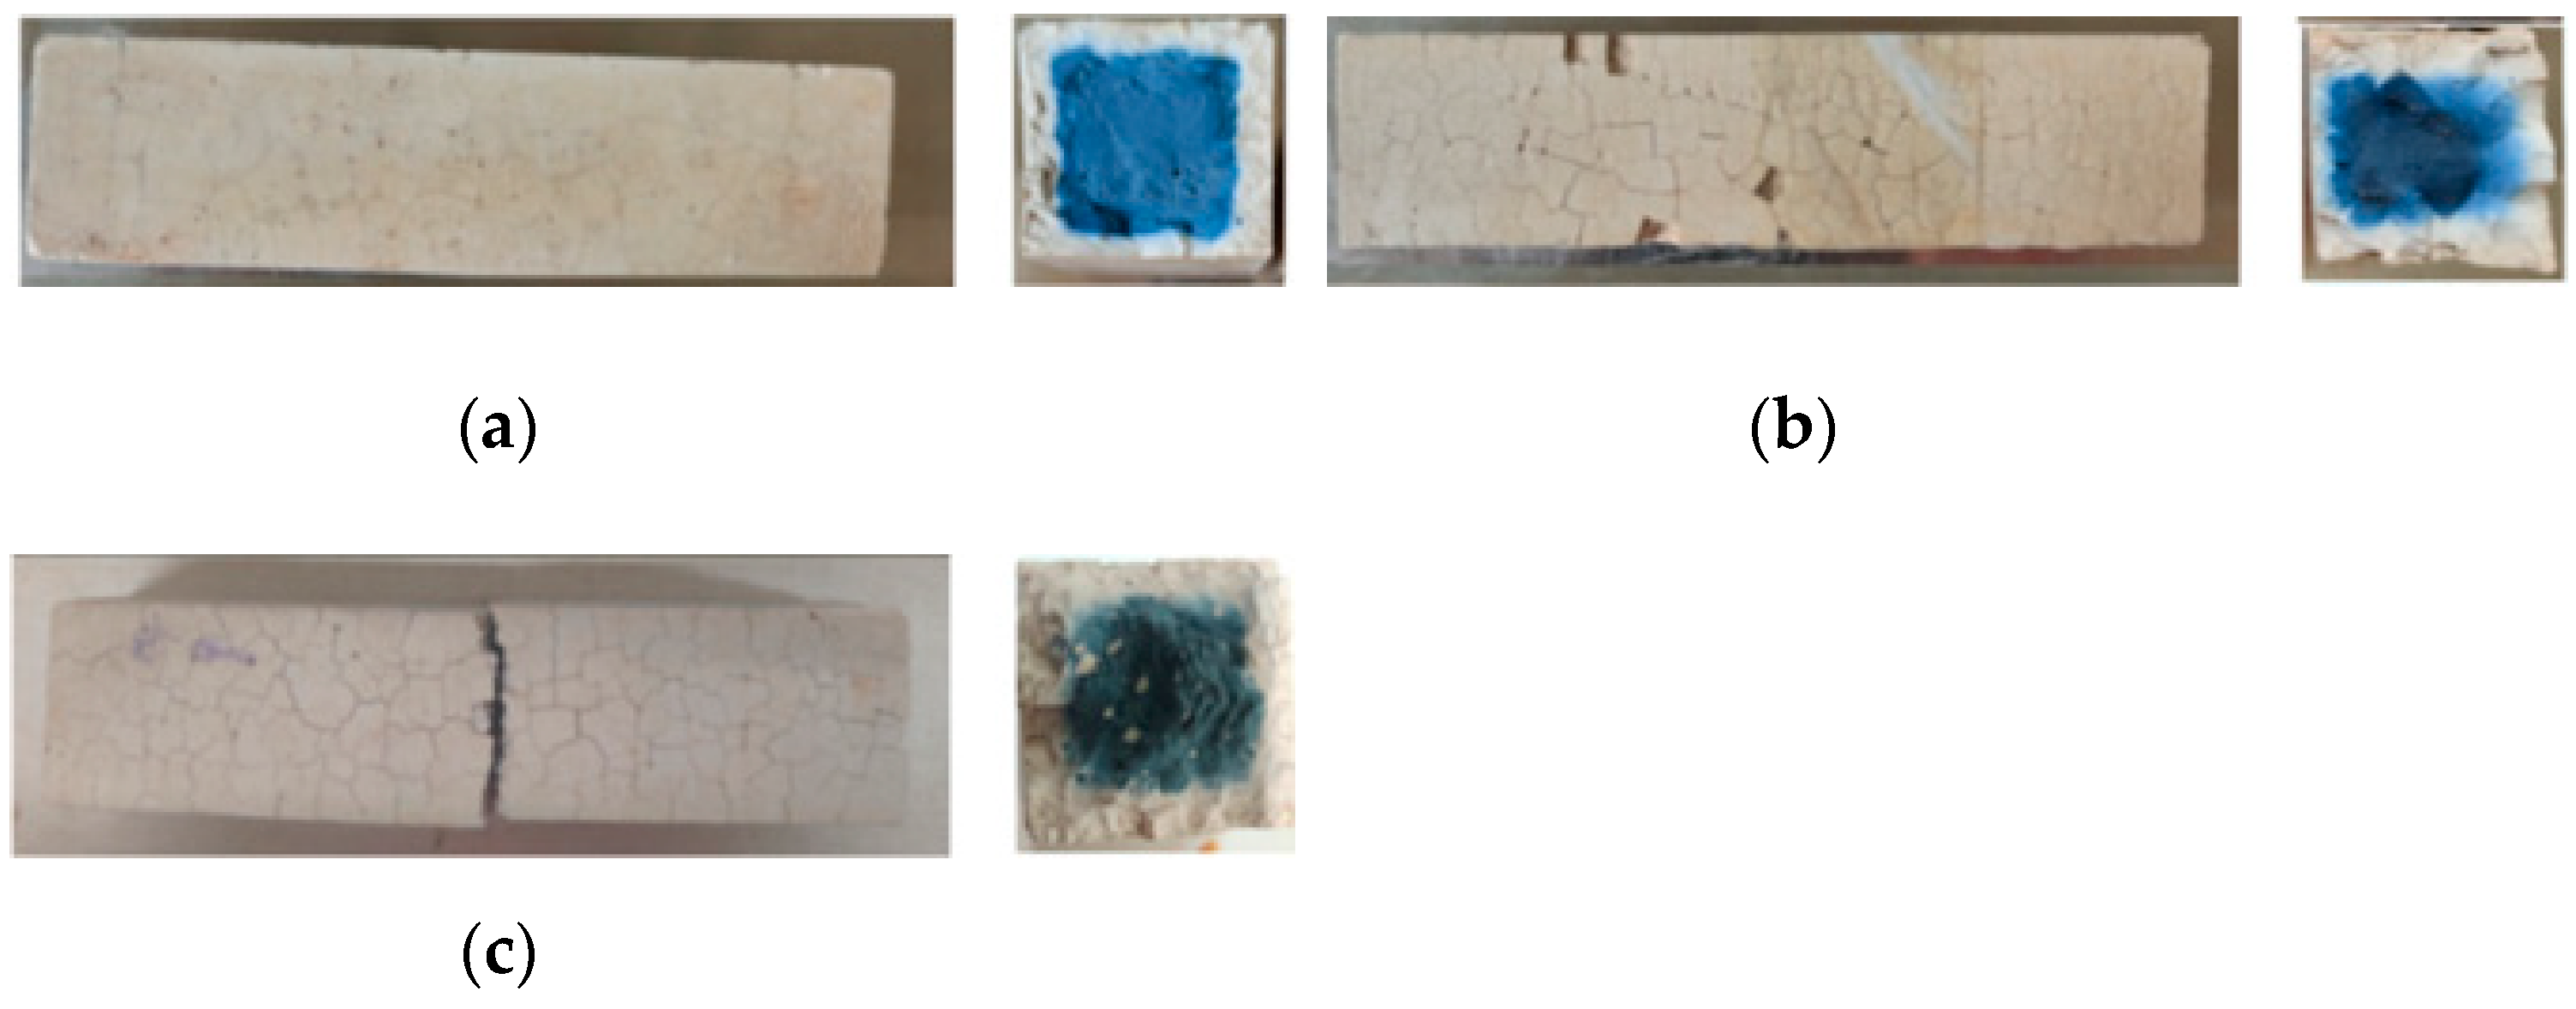
3.2. W-D Cycles of Sulphate
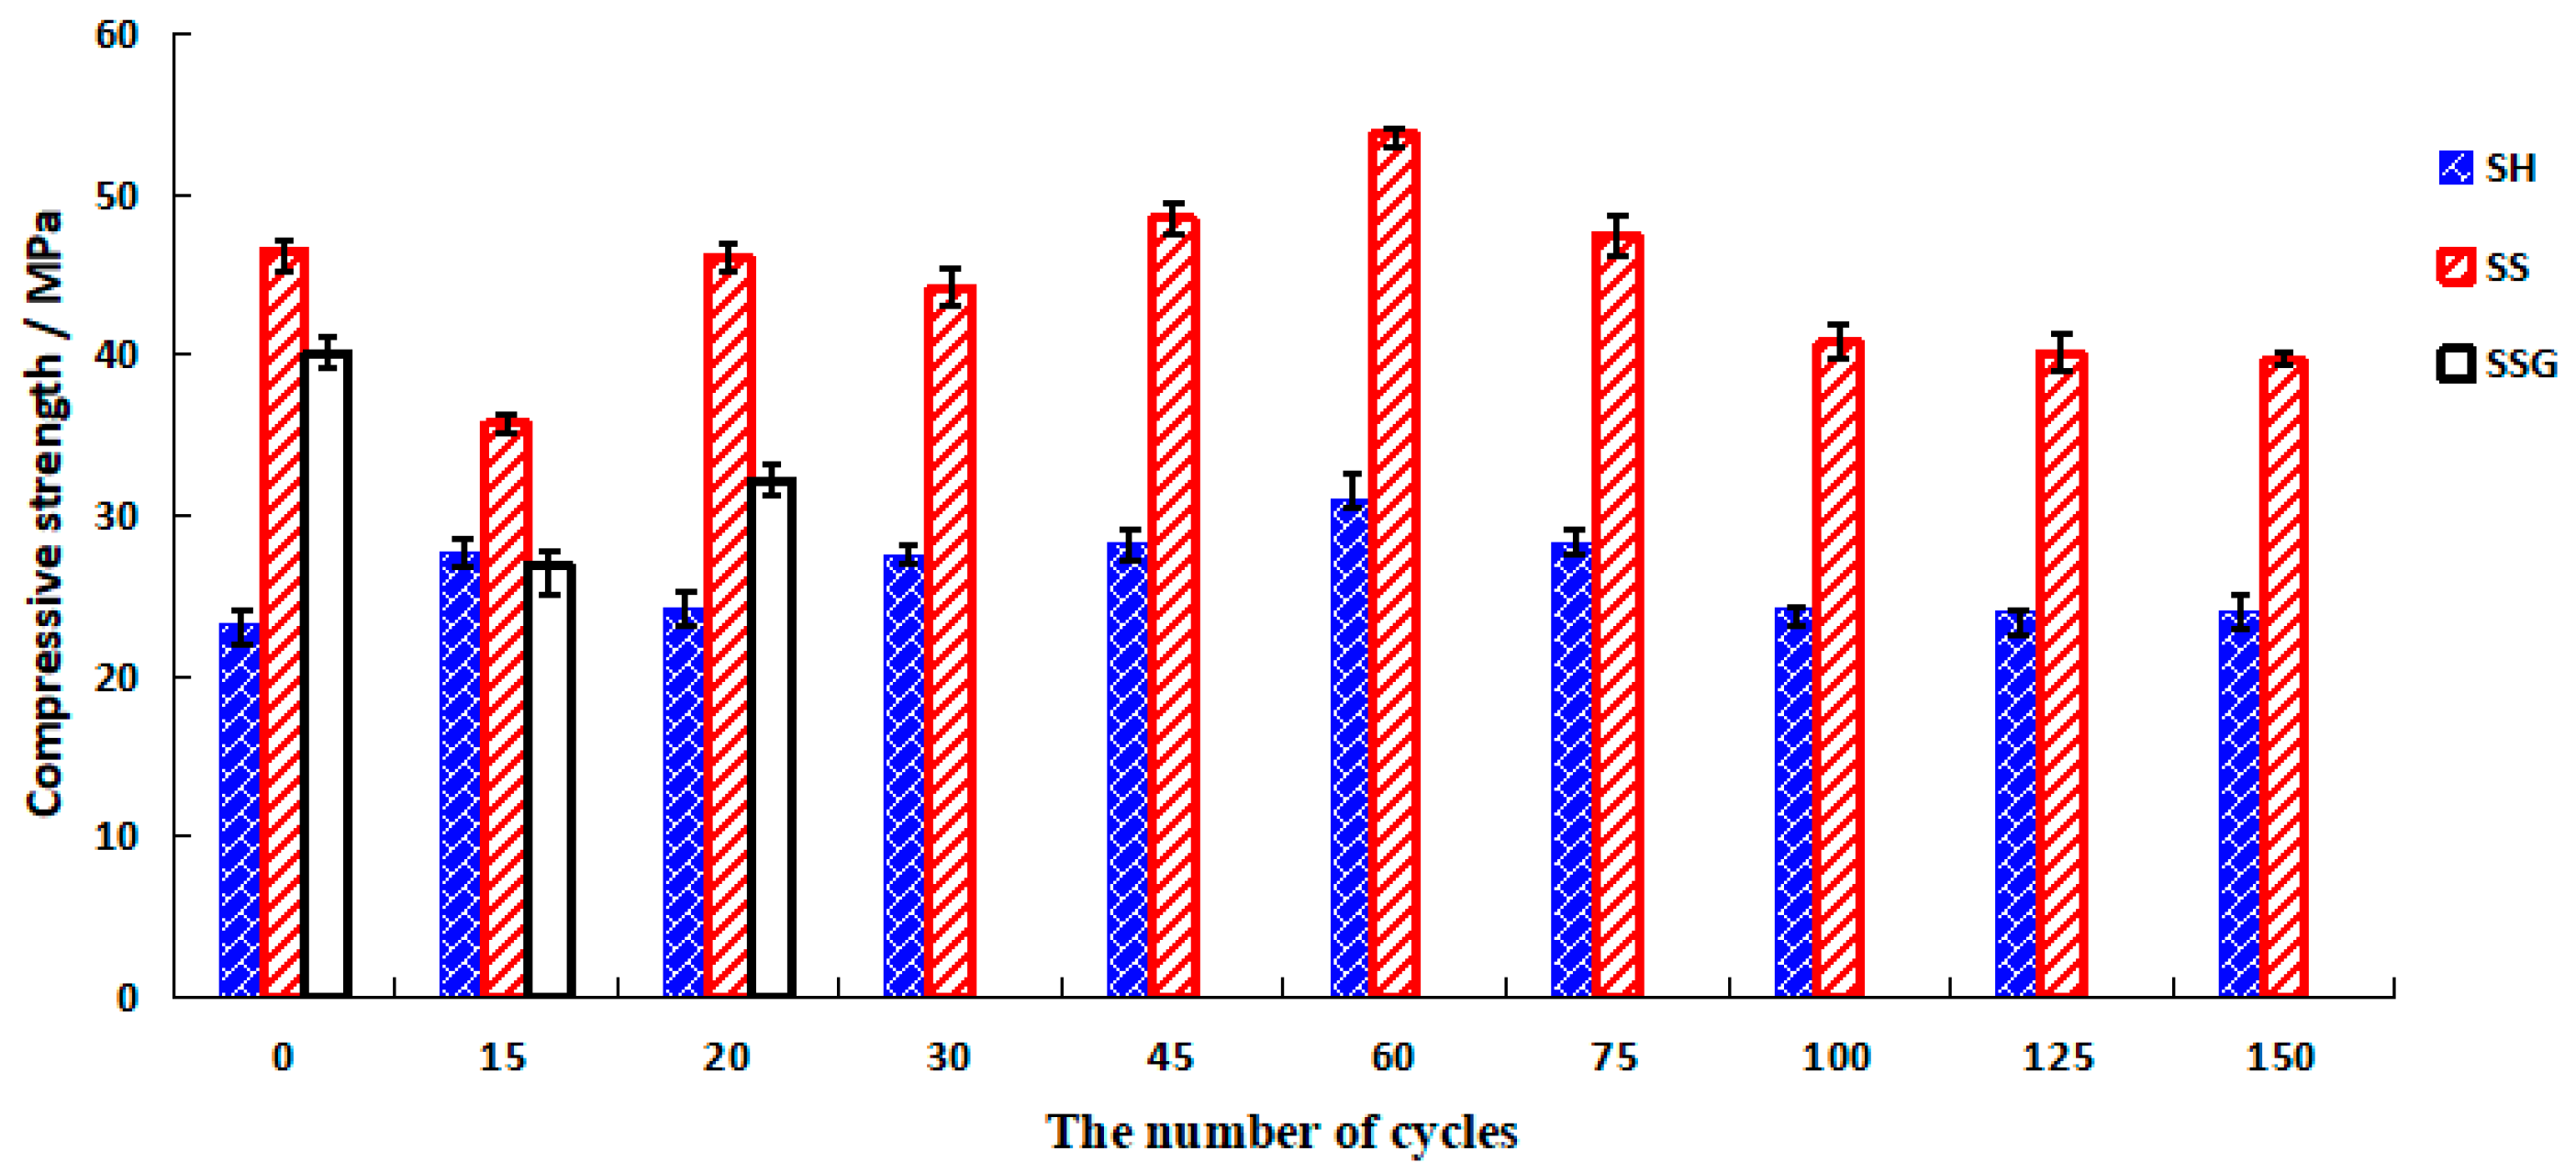
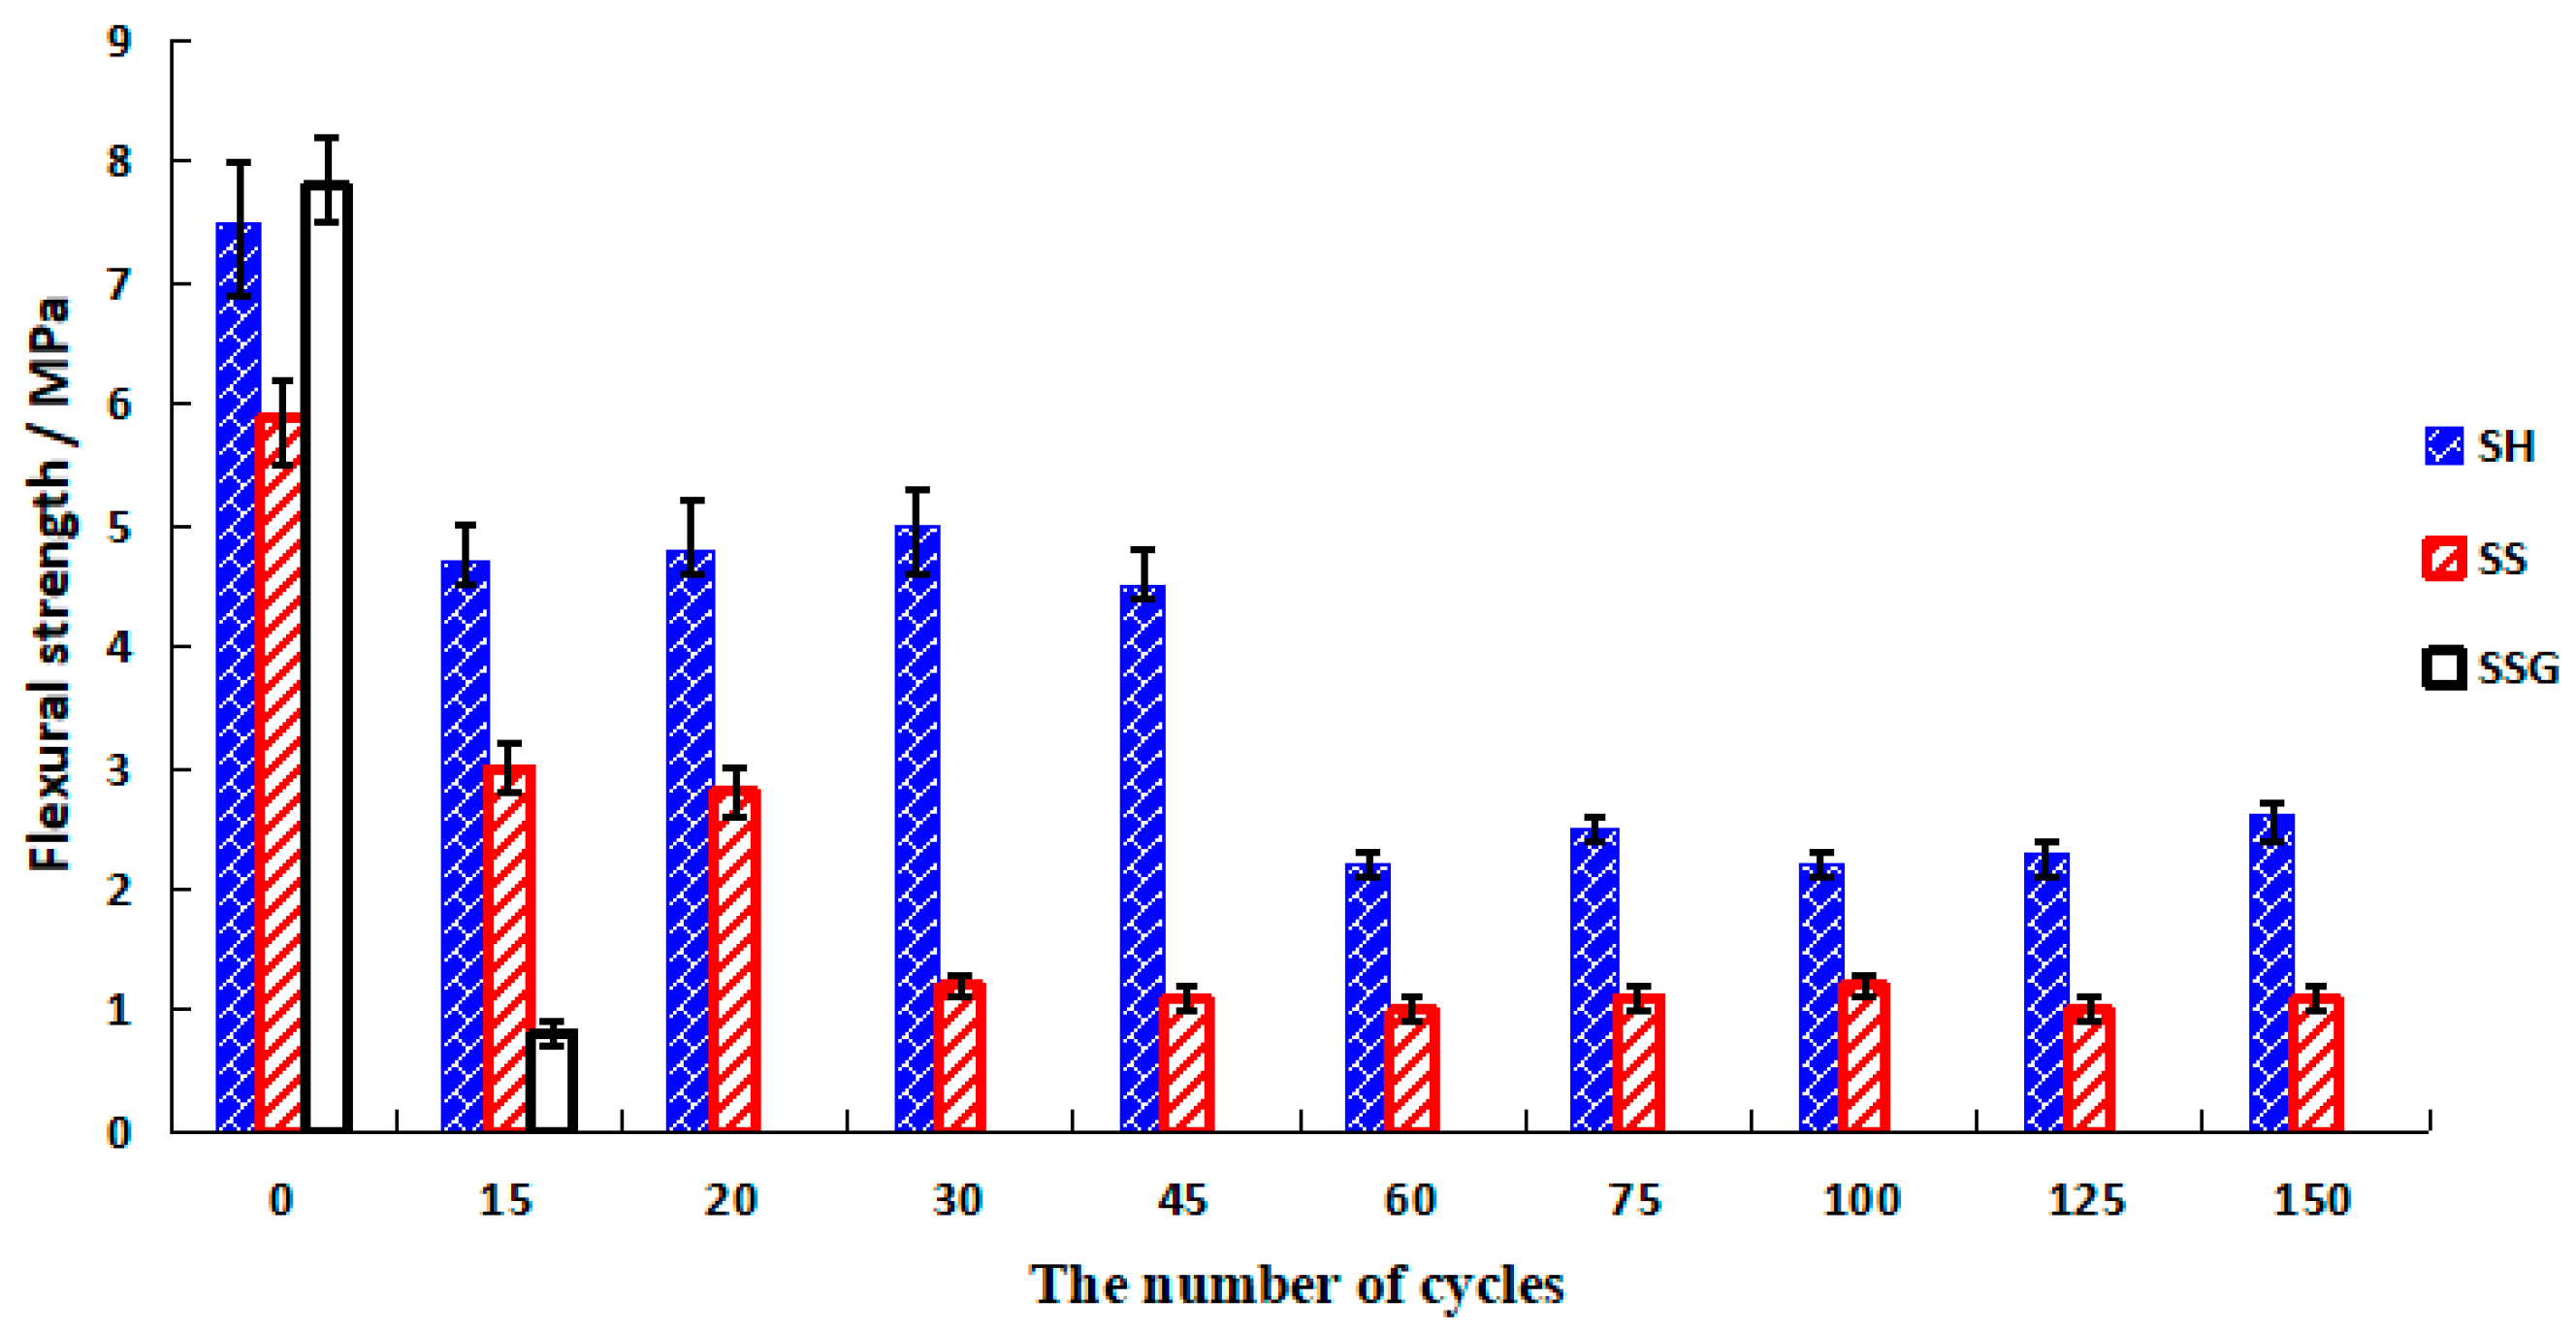
4. Compressive and Flexural Strength Test Results
4.1. W-D Cycles of Water
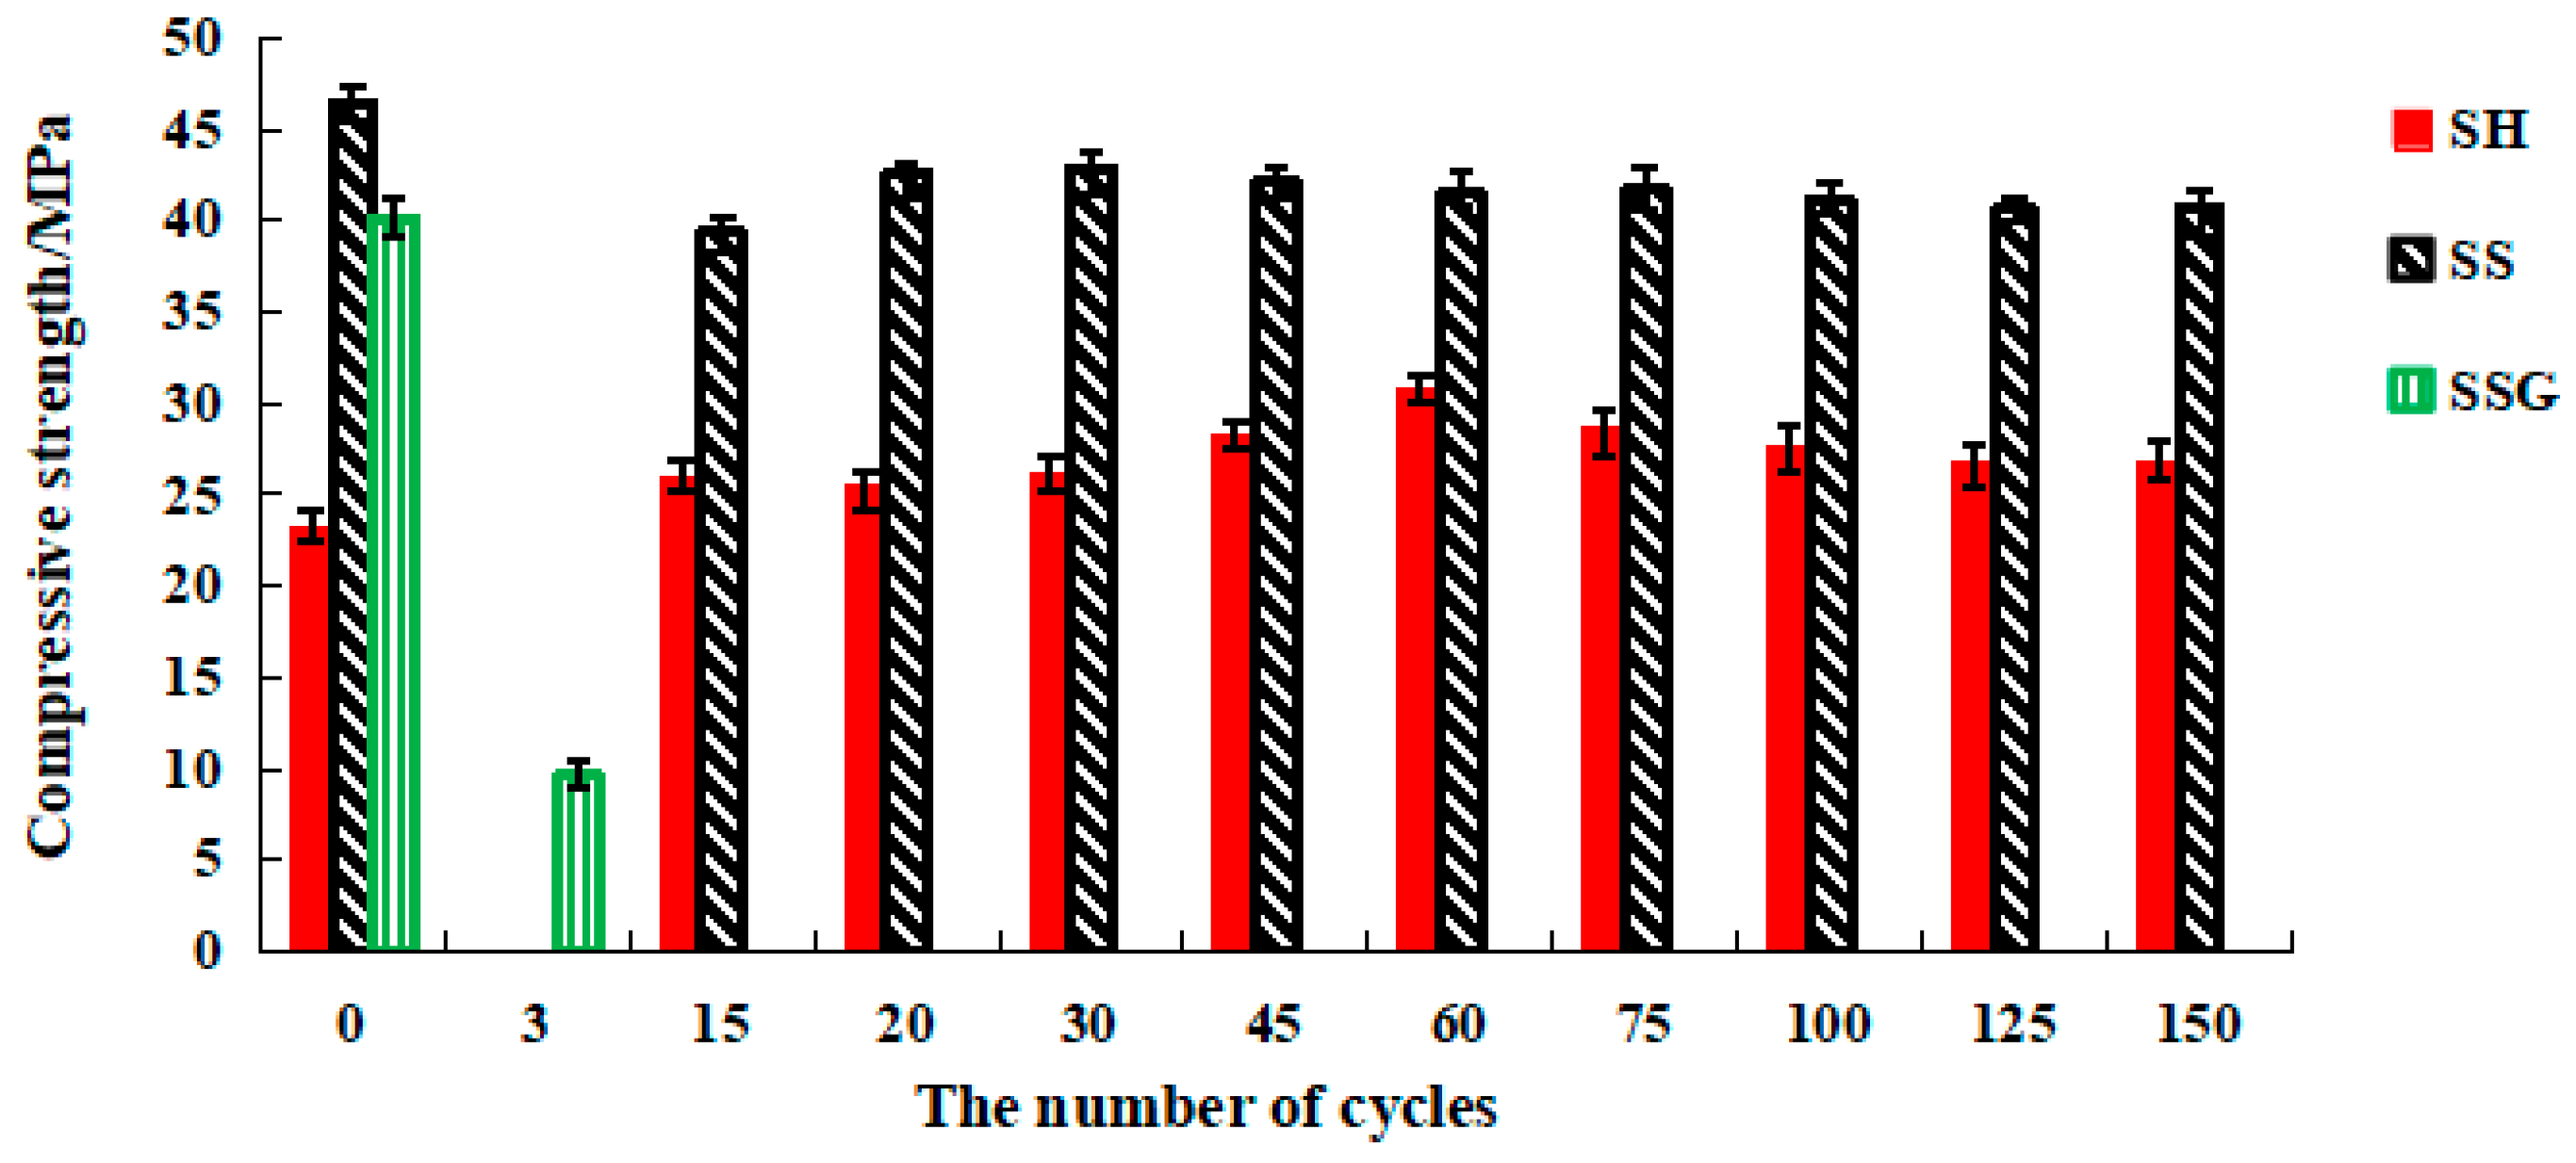
4.2. W-D Cycles of Sulphate
4.3. Comparative Analysis of the W-D Cycles of Water and Sulphate Solution
5. Micro Mechanism Analysis
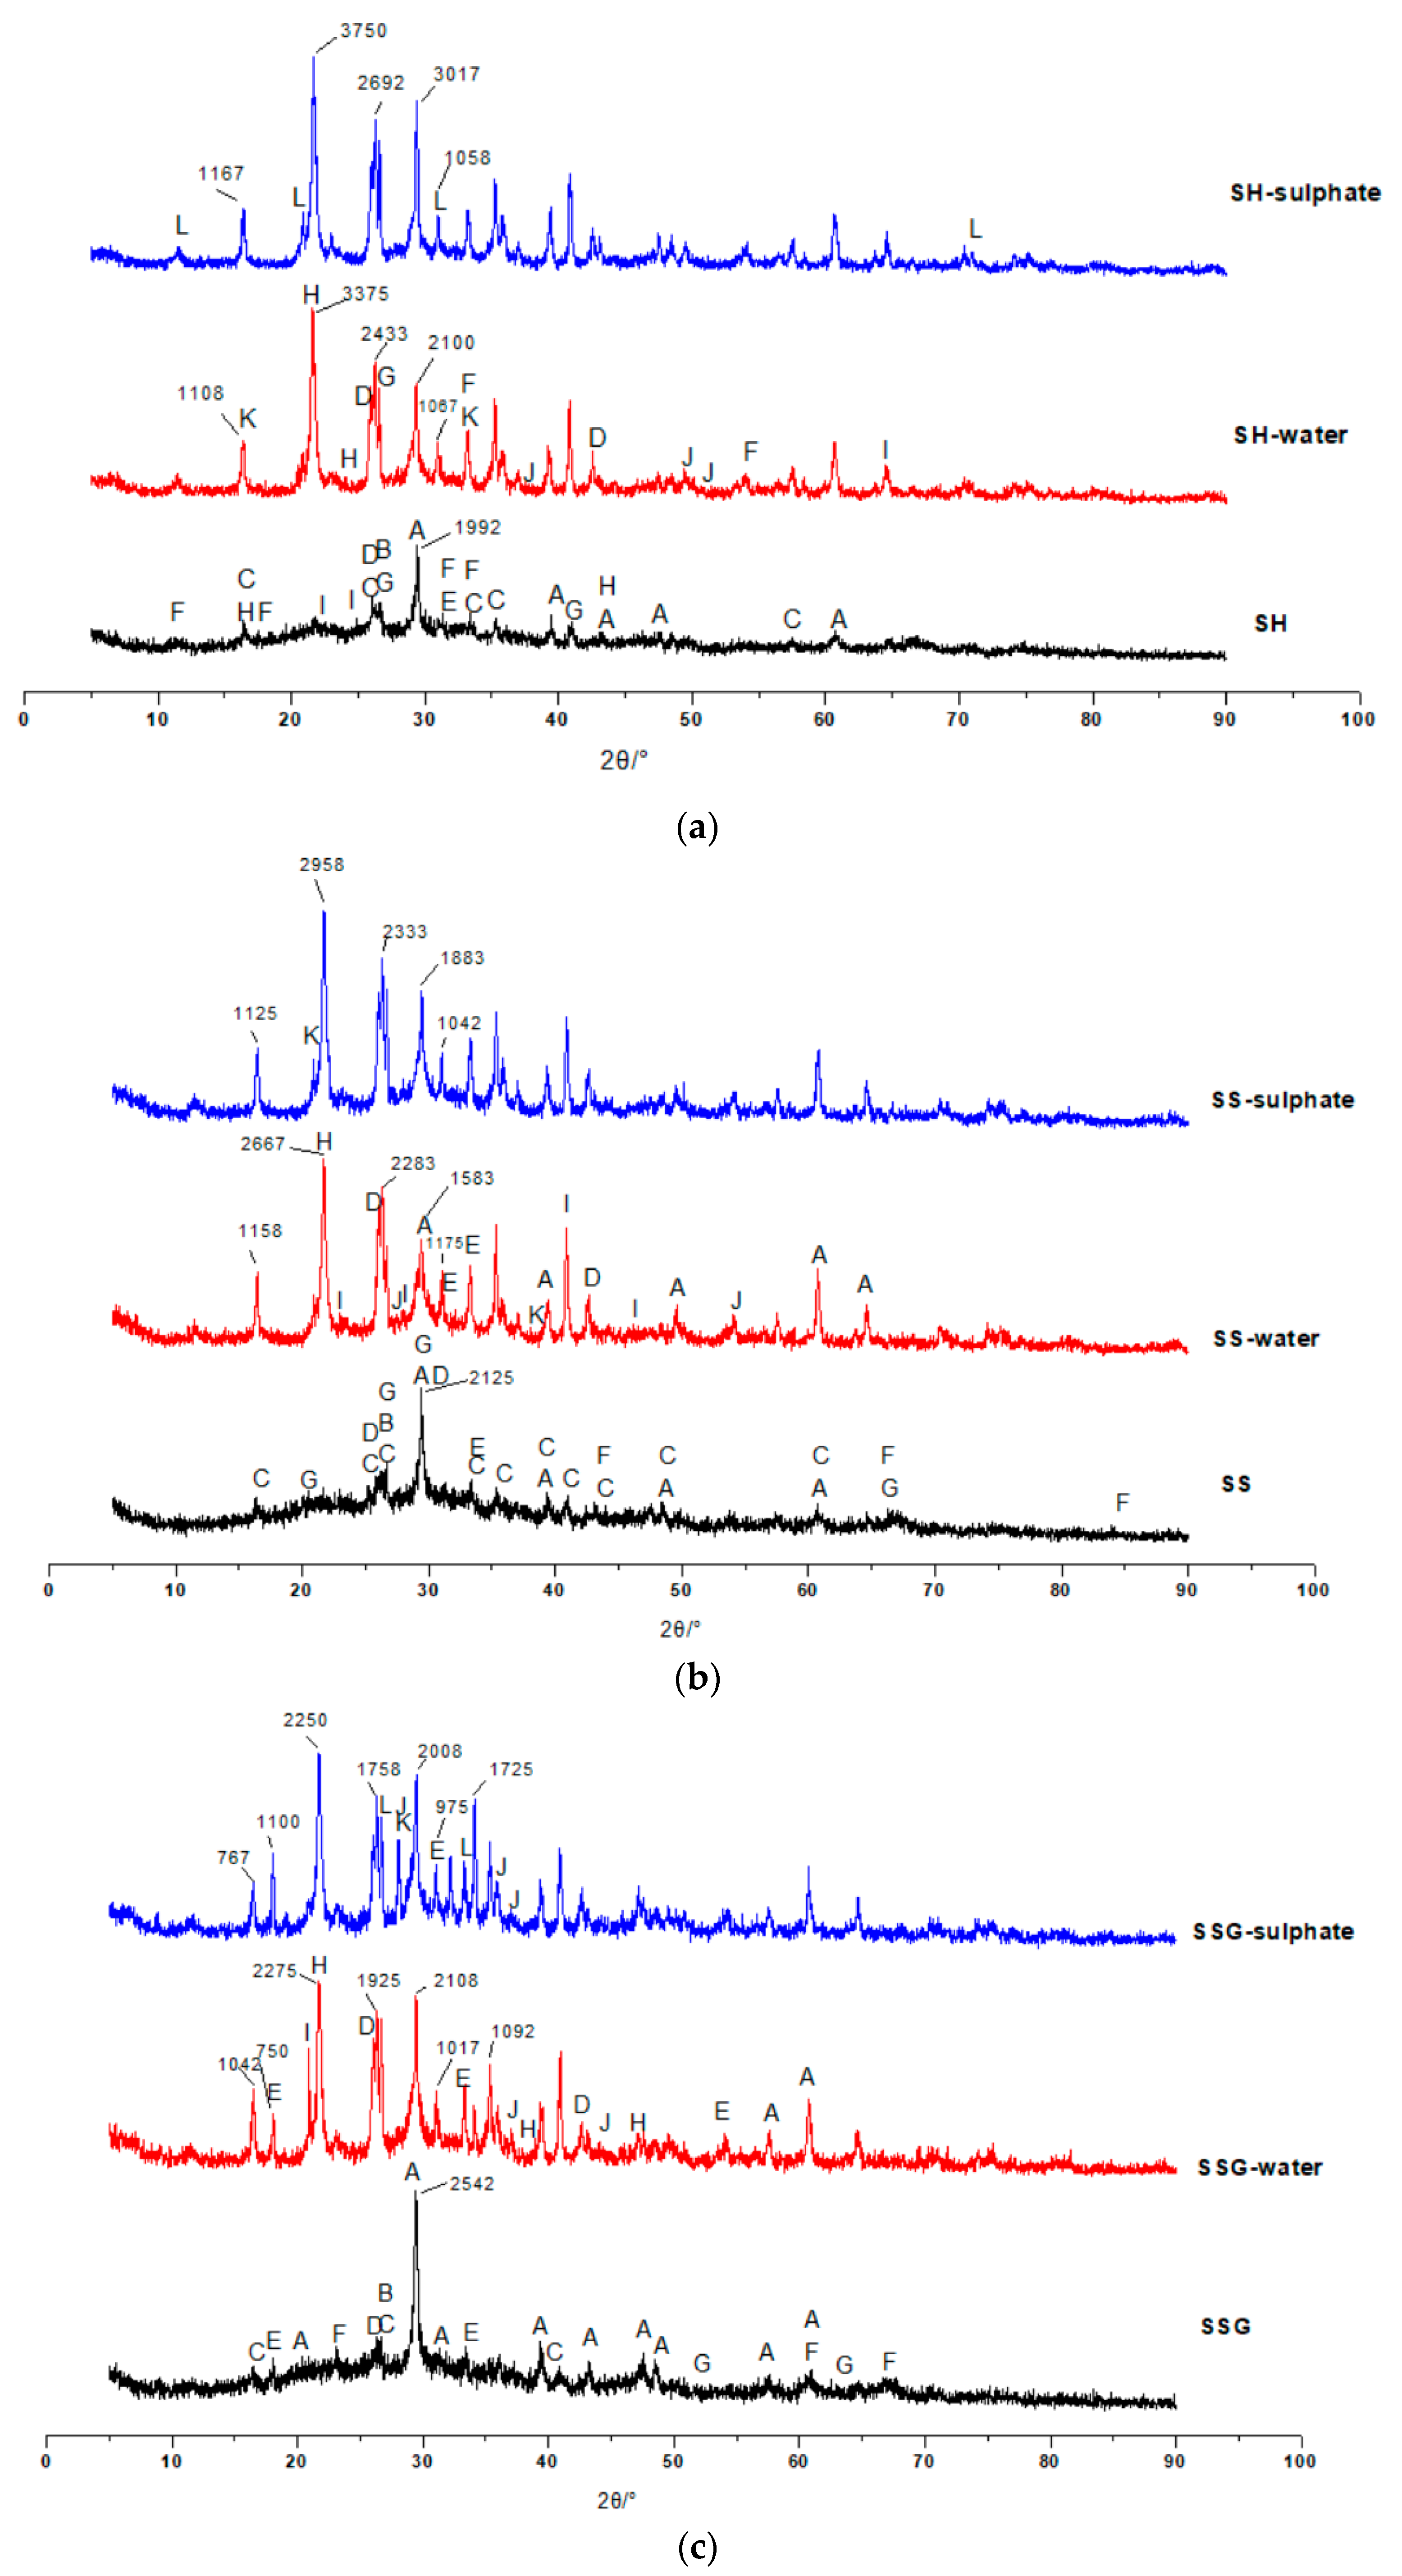
5.1. XRD
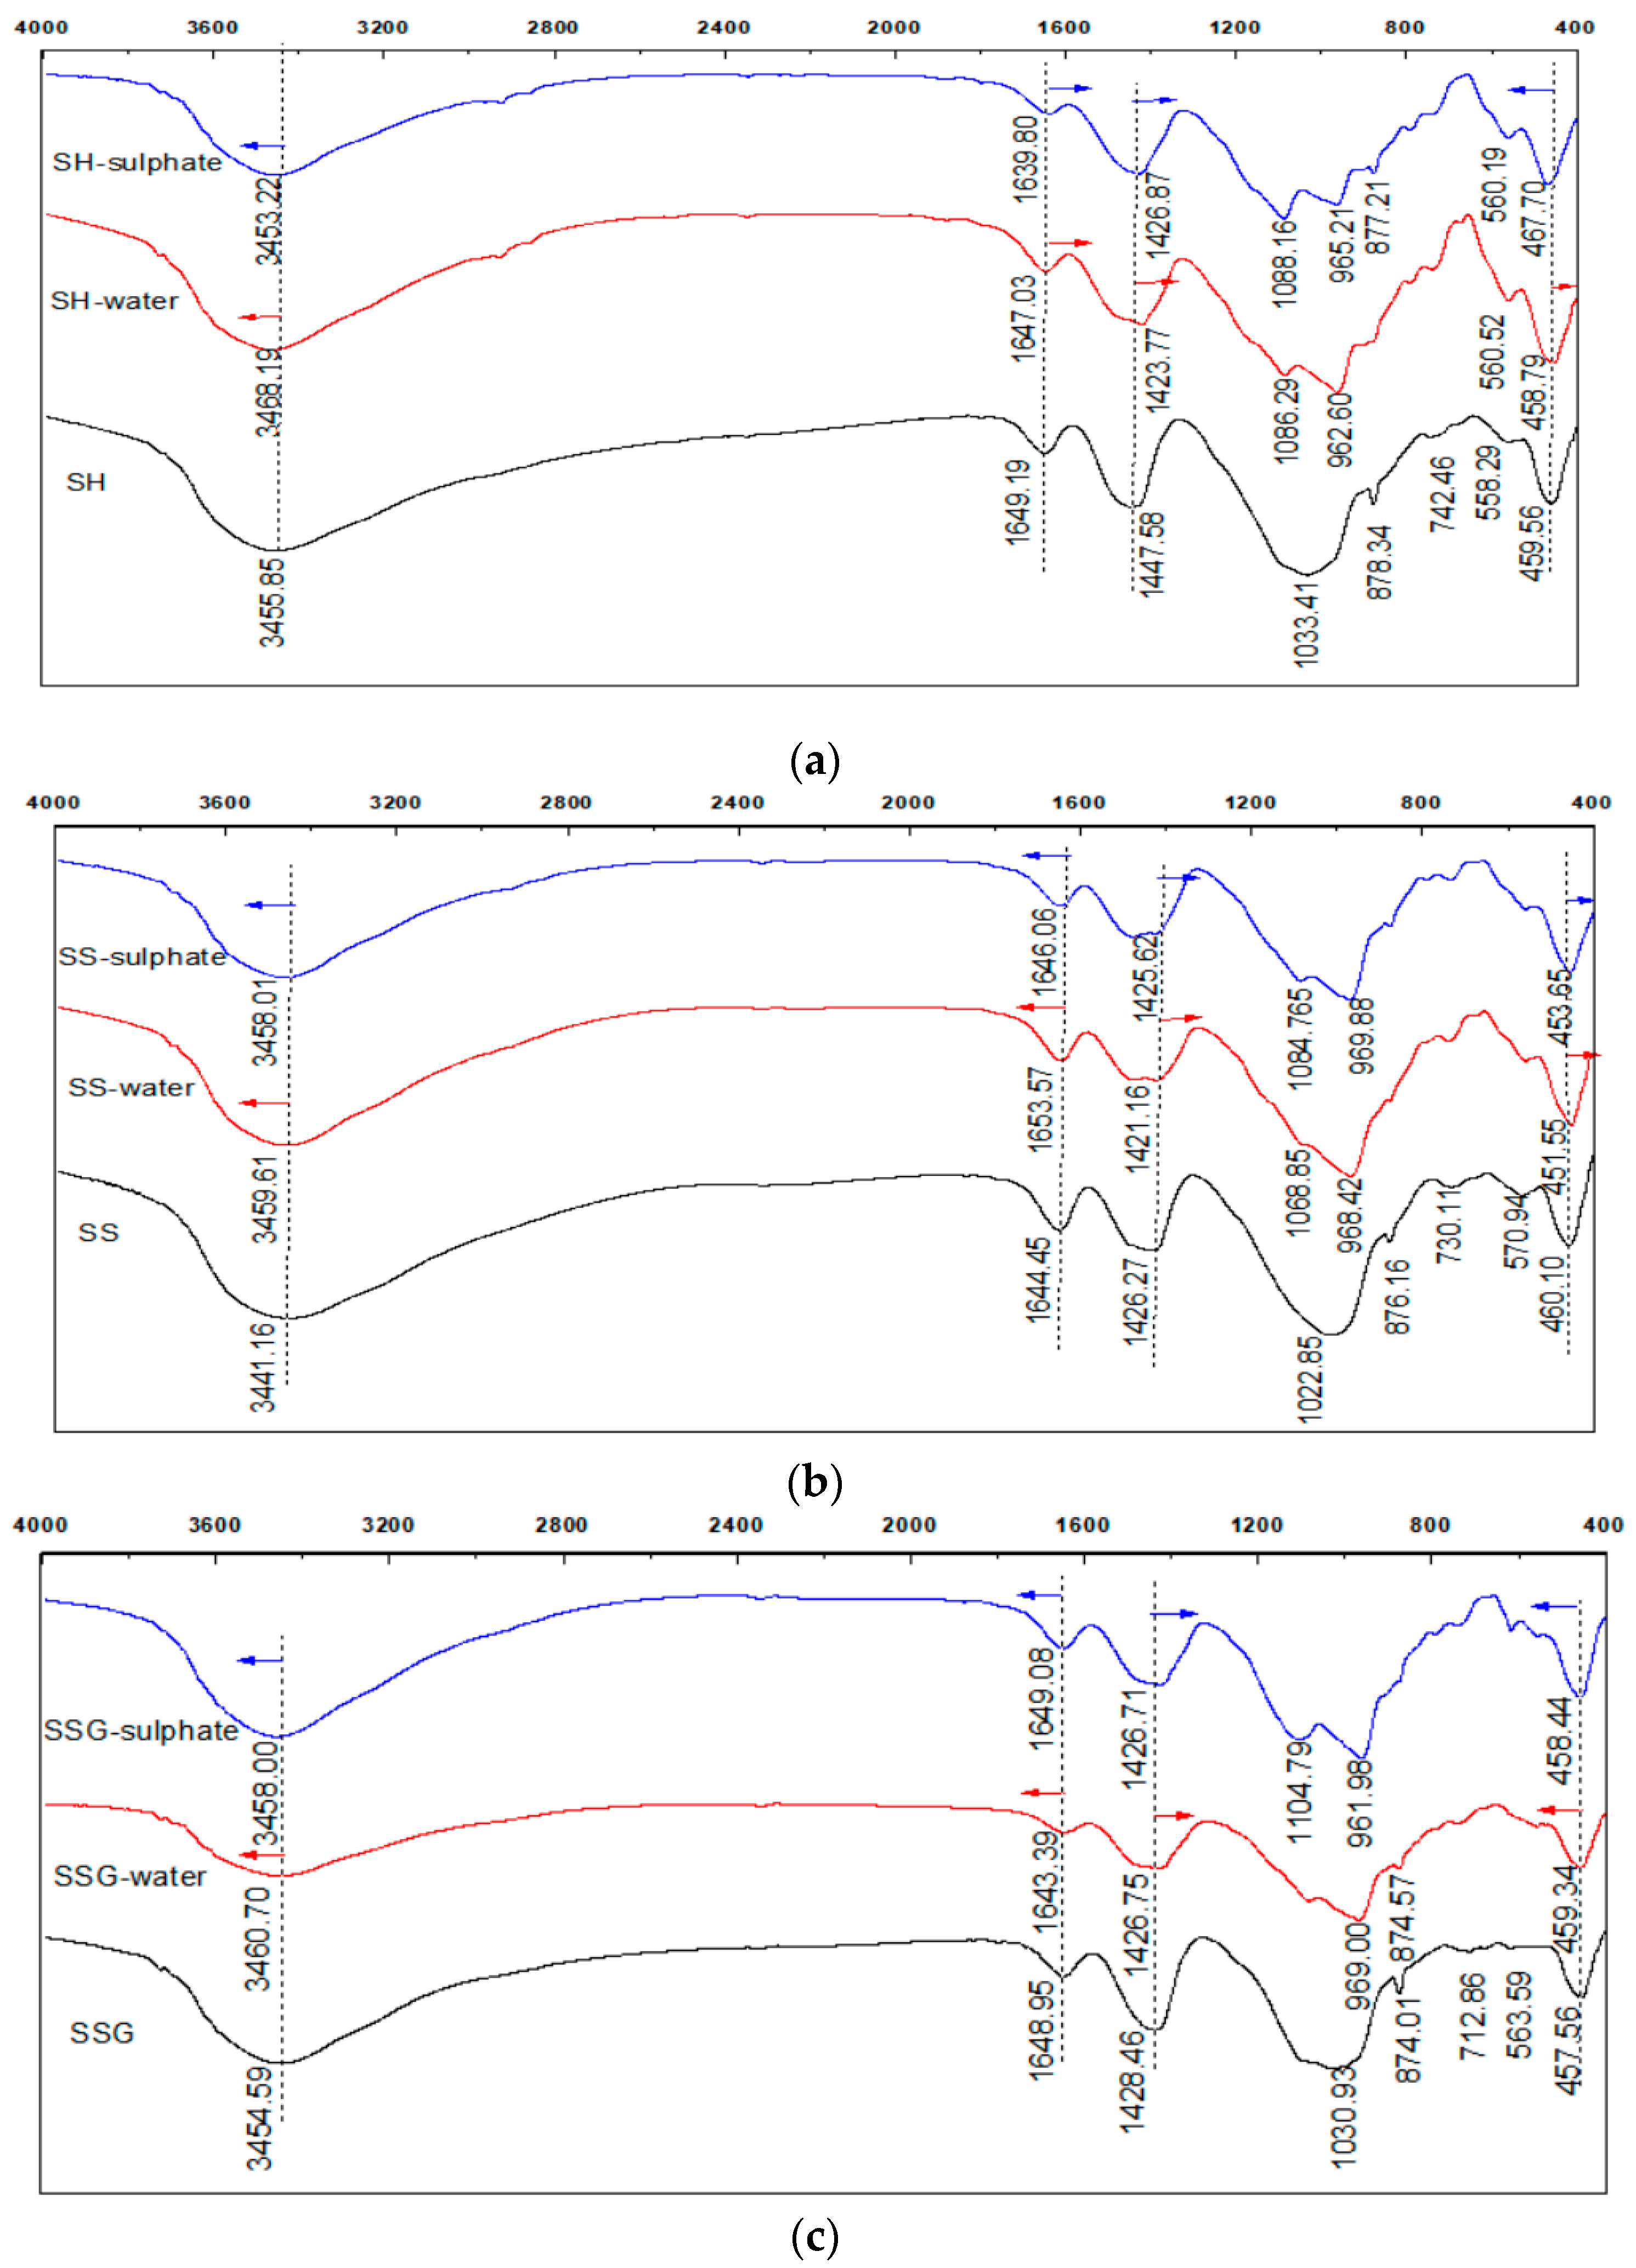
5.2. FTIR
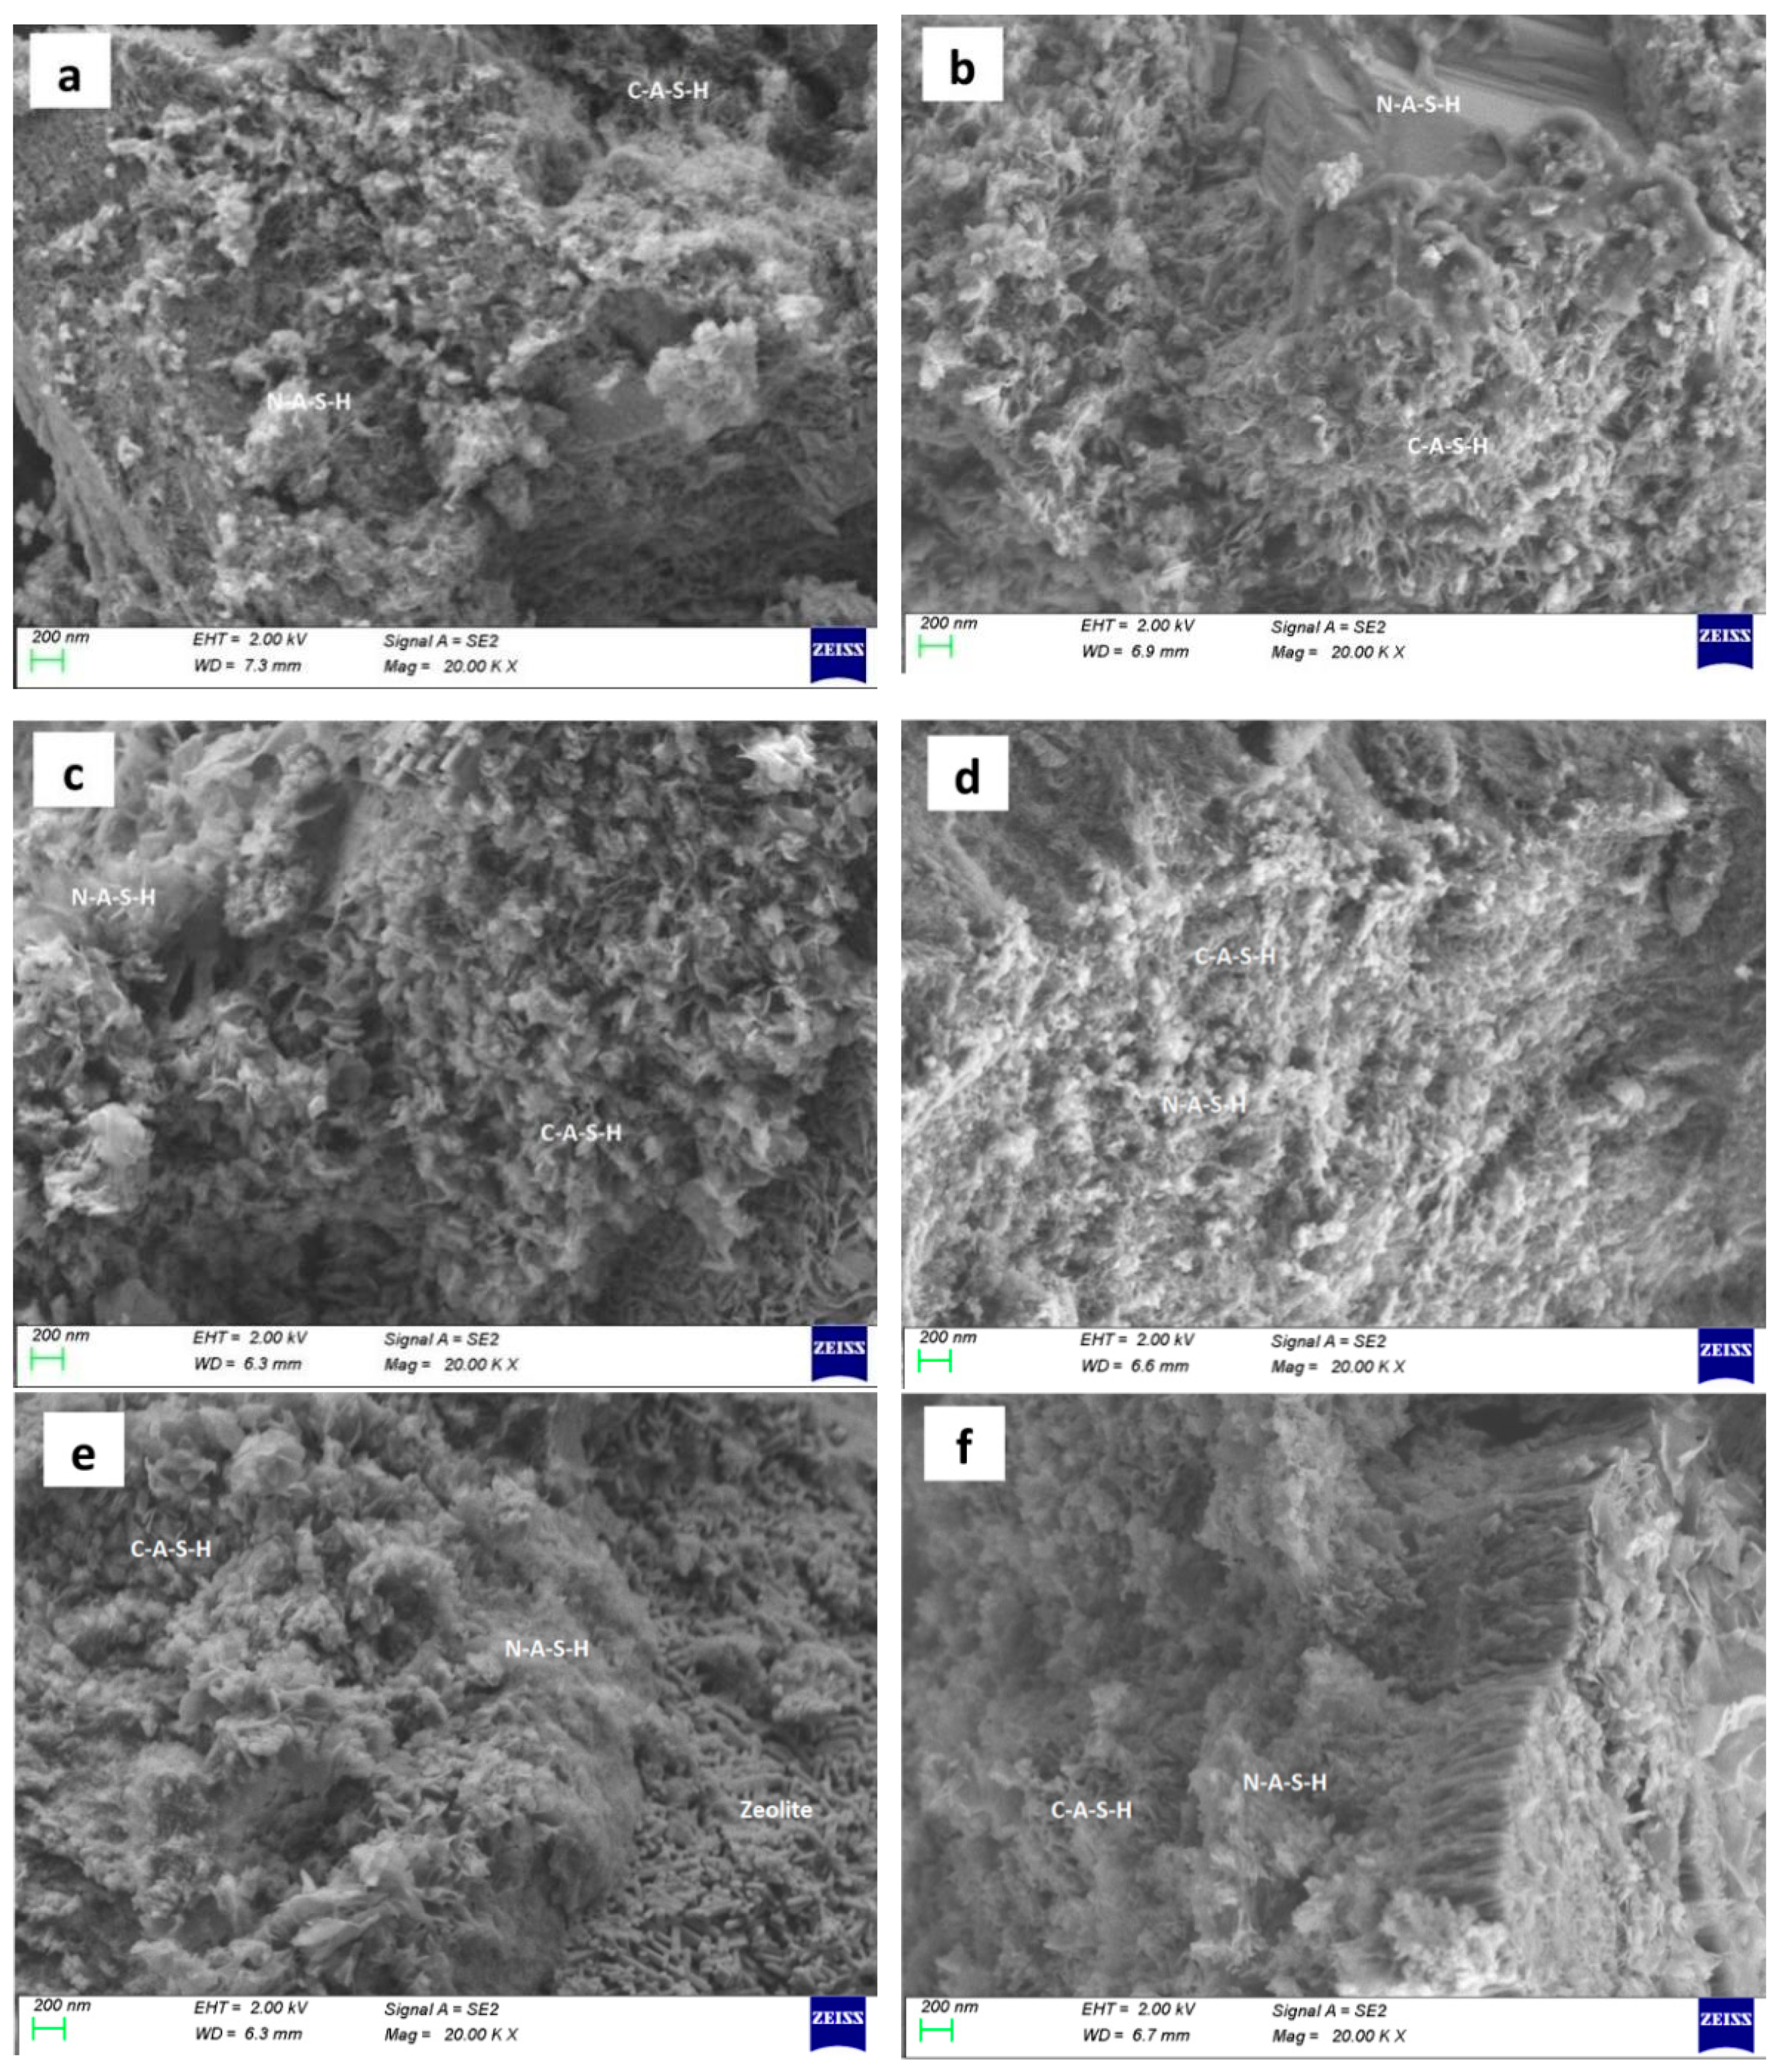
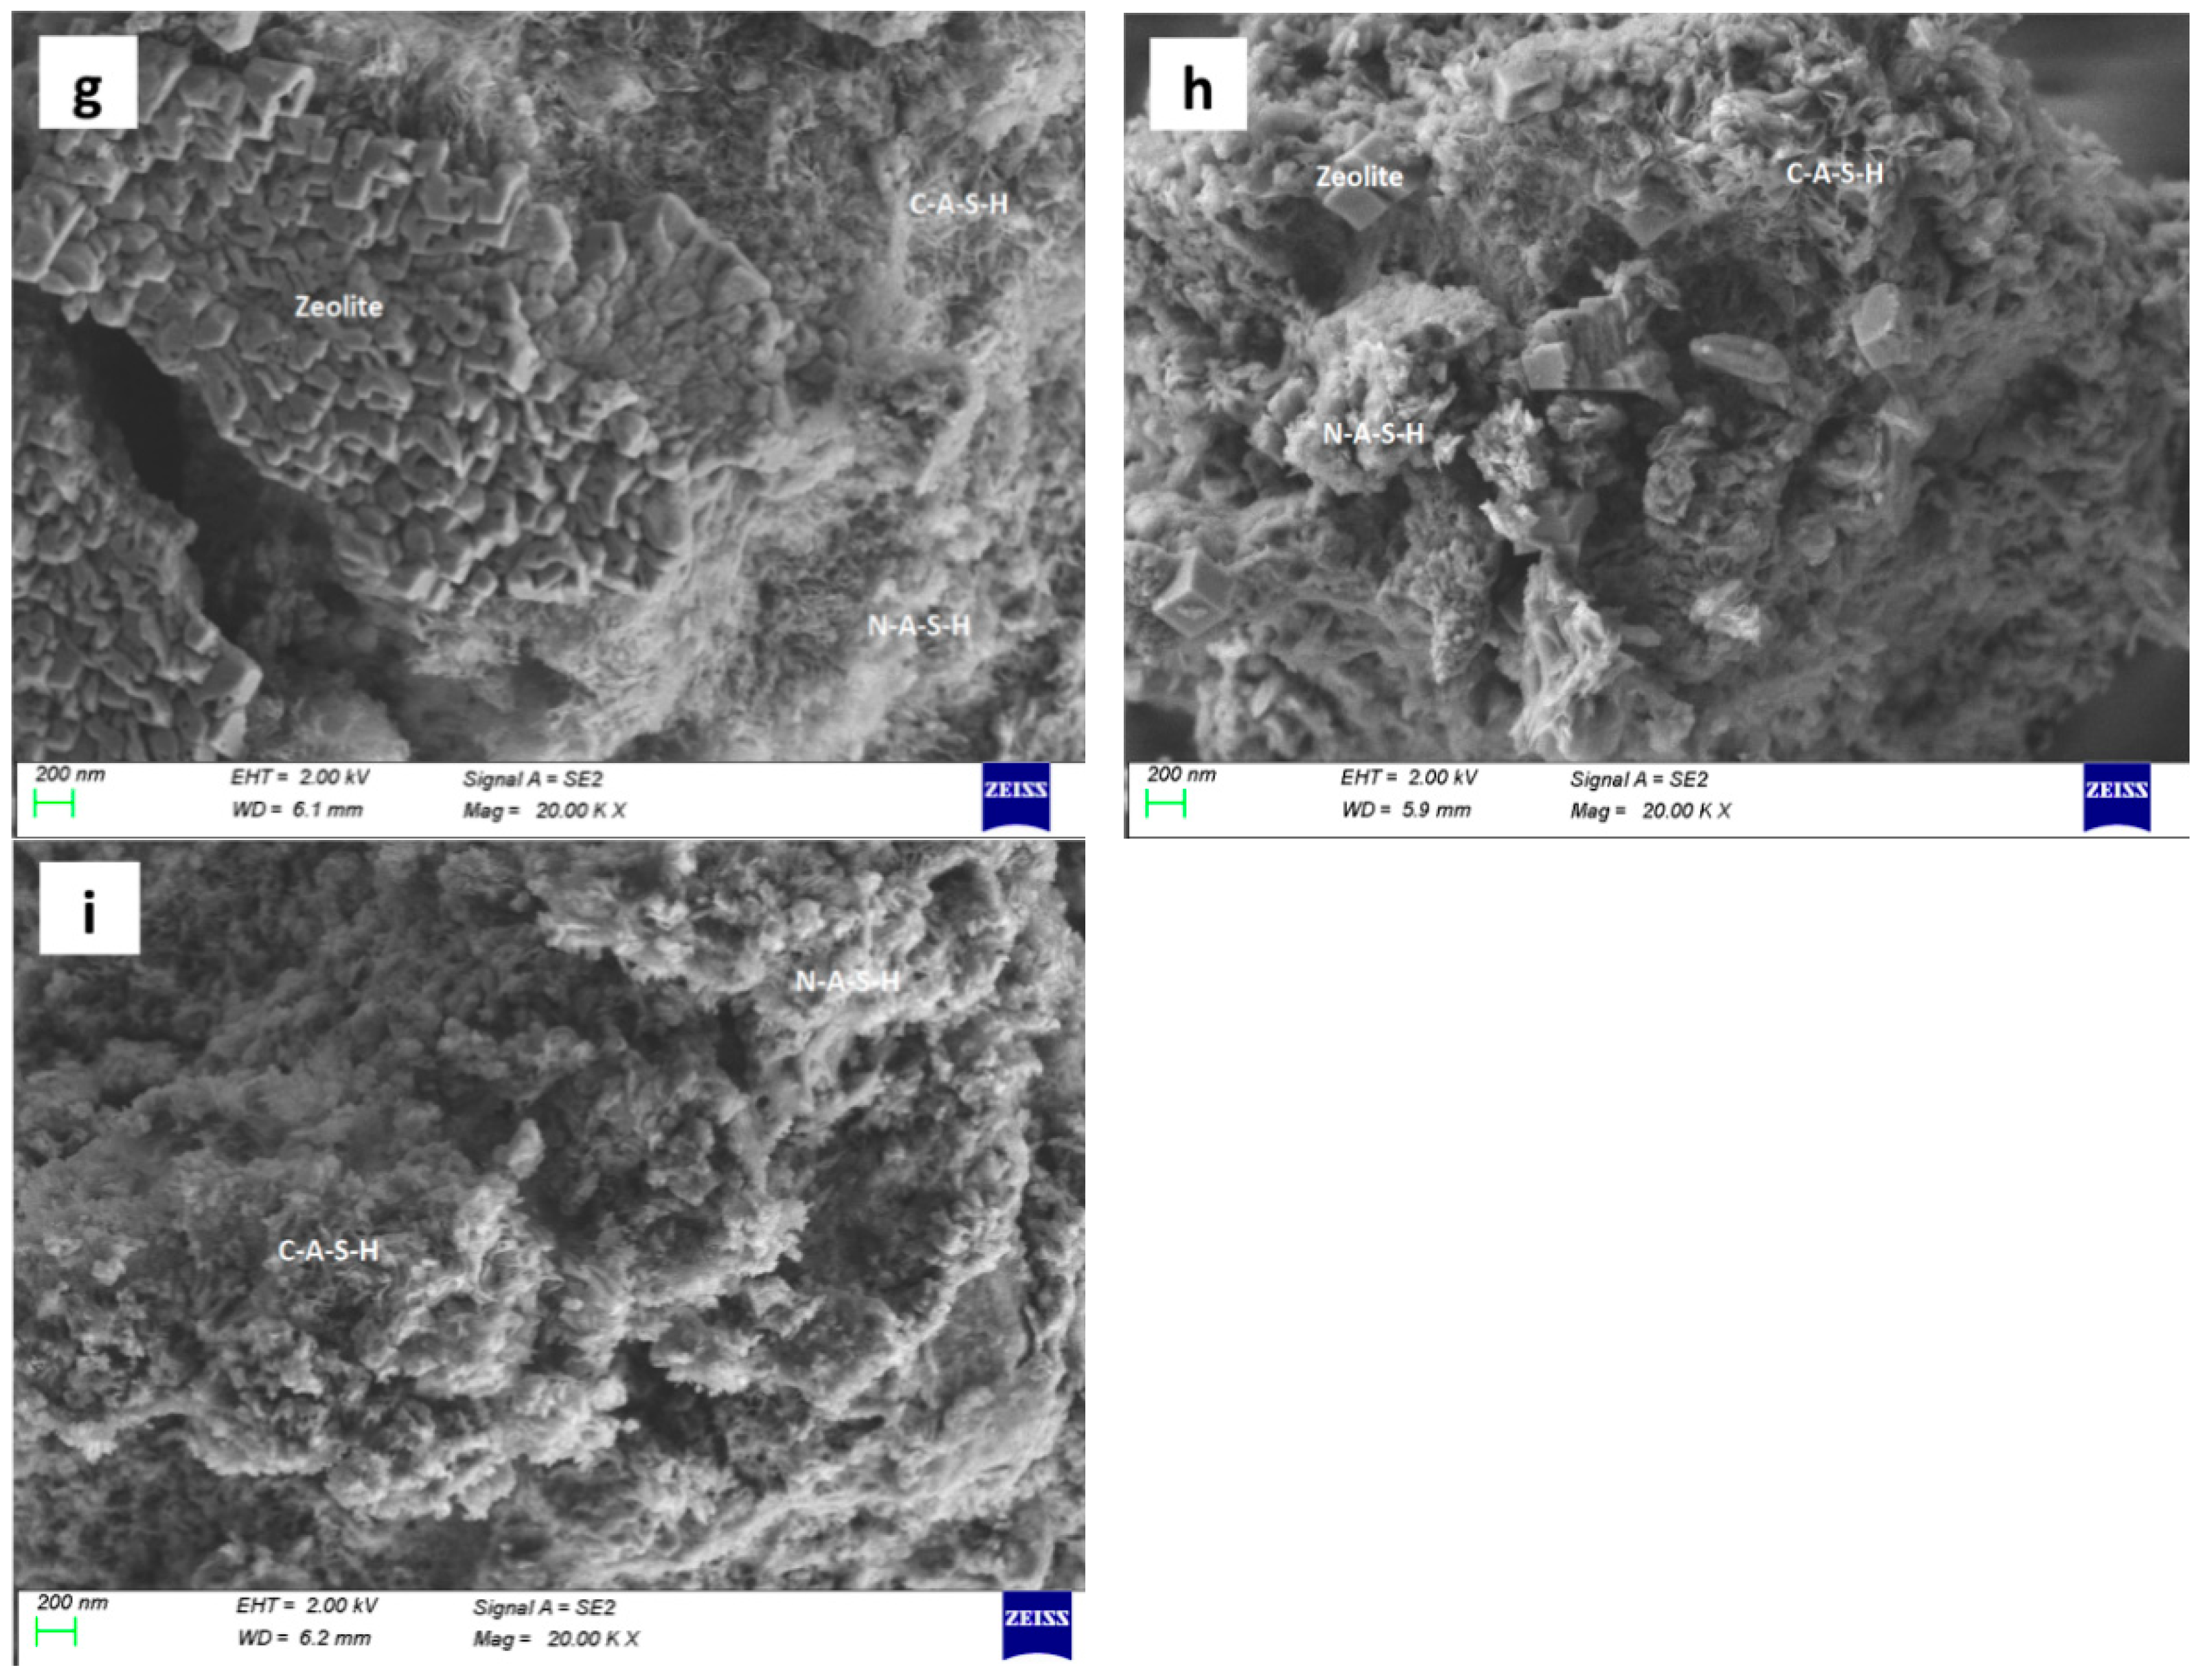
5.3. SEM
6. Conclusions
- (1)
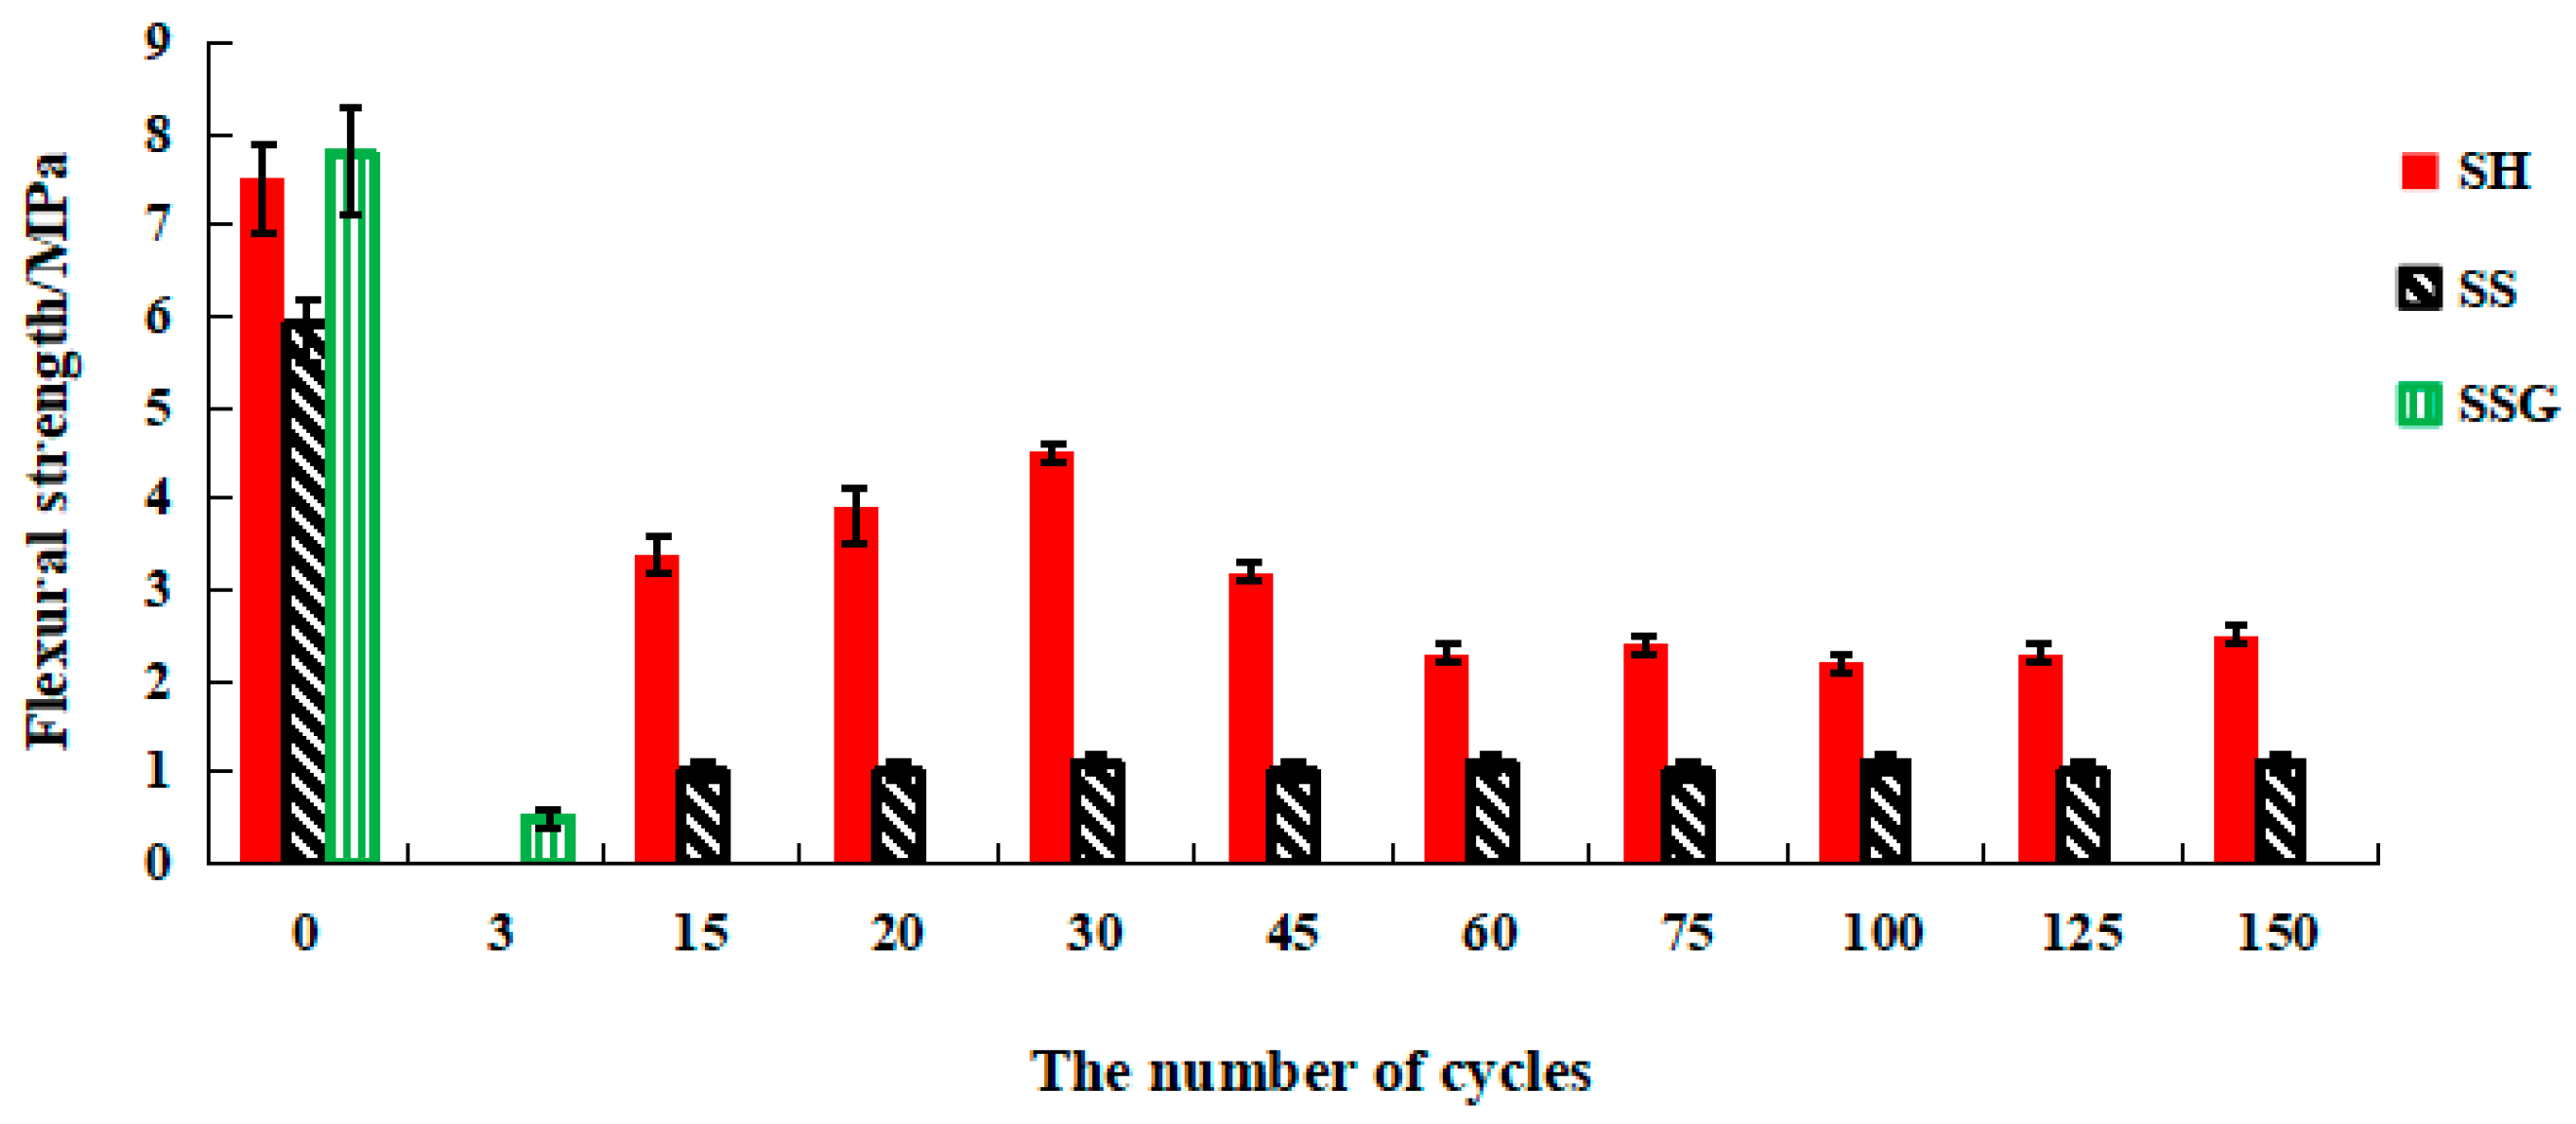
- The influence of dry and wet cycles on the flexural strength of geopolymers was greater than the compressive strength. The final sulphate cycle compressive strength of the SH and the SS was higher than that of the water cycle, while the sulphate corrosion resistance of the SSG was weak.
- (2)
- In terms of compressive strength, the SS geopolymer had stronger erosion resistance than the SH. After 150 cycles of W-D cycling, the SS geopolymer’s compressive strength could still reach more than 39 MPa. In terms of flexural strength, the erosion resistance of the SH geopolymer was better than that of the SS, and the compressive strength was more than 2.5 MPa after 150 cycles. The SSG geopolymers had the weakest resistance to erosion.
- (3)
- In the W-D cycles, the colour change, flexural resistance, and compressive strength of geopolymers were reduced because of the migration of water and the transition of polymerization reaction from the outside to the middle recombination. The SH recombination polymerization reaction is weaker than the SS and the SSG, resulting in fewer cracks and better bending strength. A large amount of zeolite minerals and dense gelling substances were generated in SS, such as Na-rich C–N–A–S–H, so its strength was higher. Because of the presence of desulfurized gypsum in the SS activator, a large amount of Ca2+ participated in the reaction to generate Ca-rich C-N–A–S–H, leading to premature external spalling and the most serious erosion.
- (4)
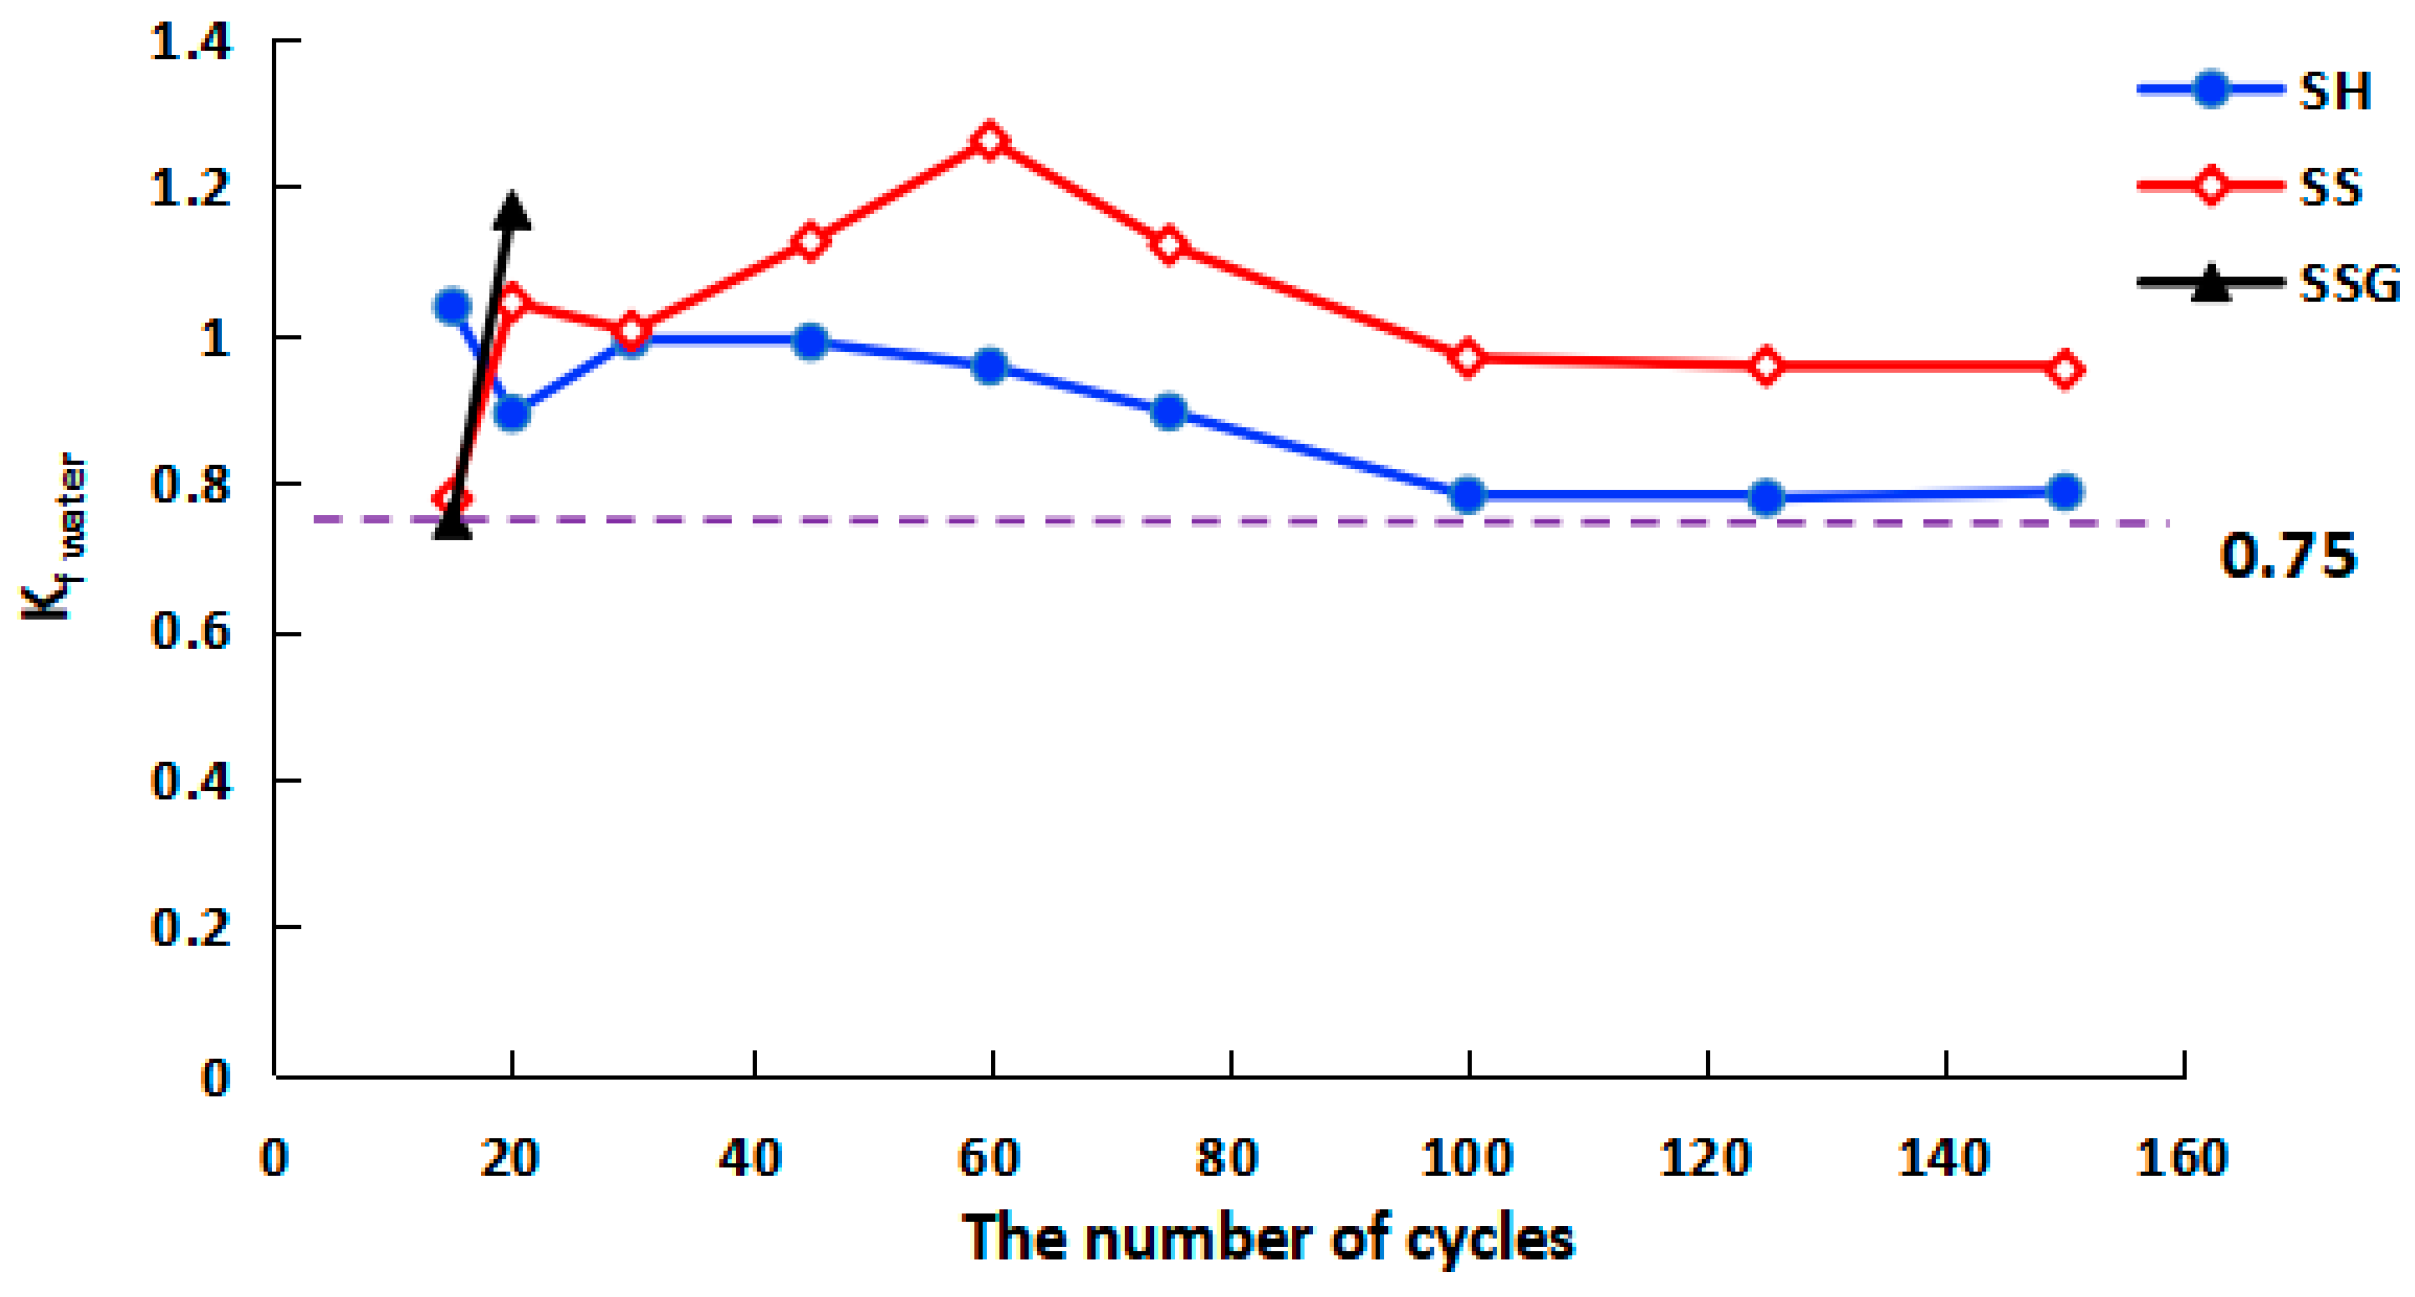
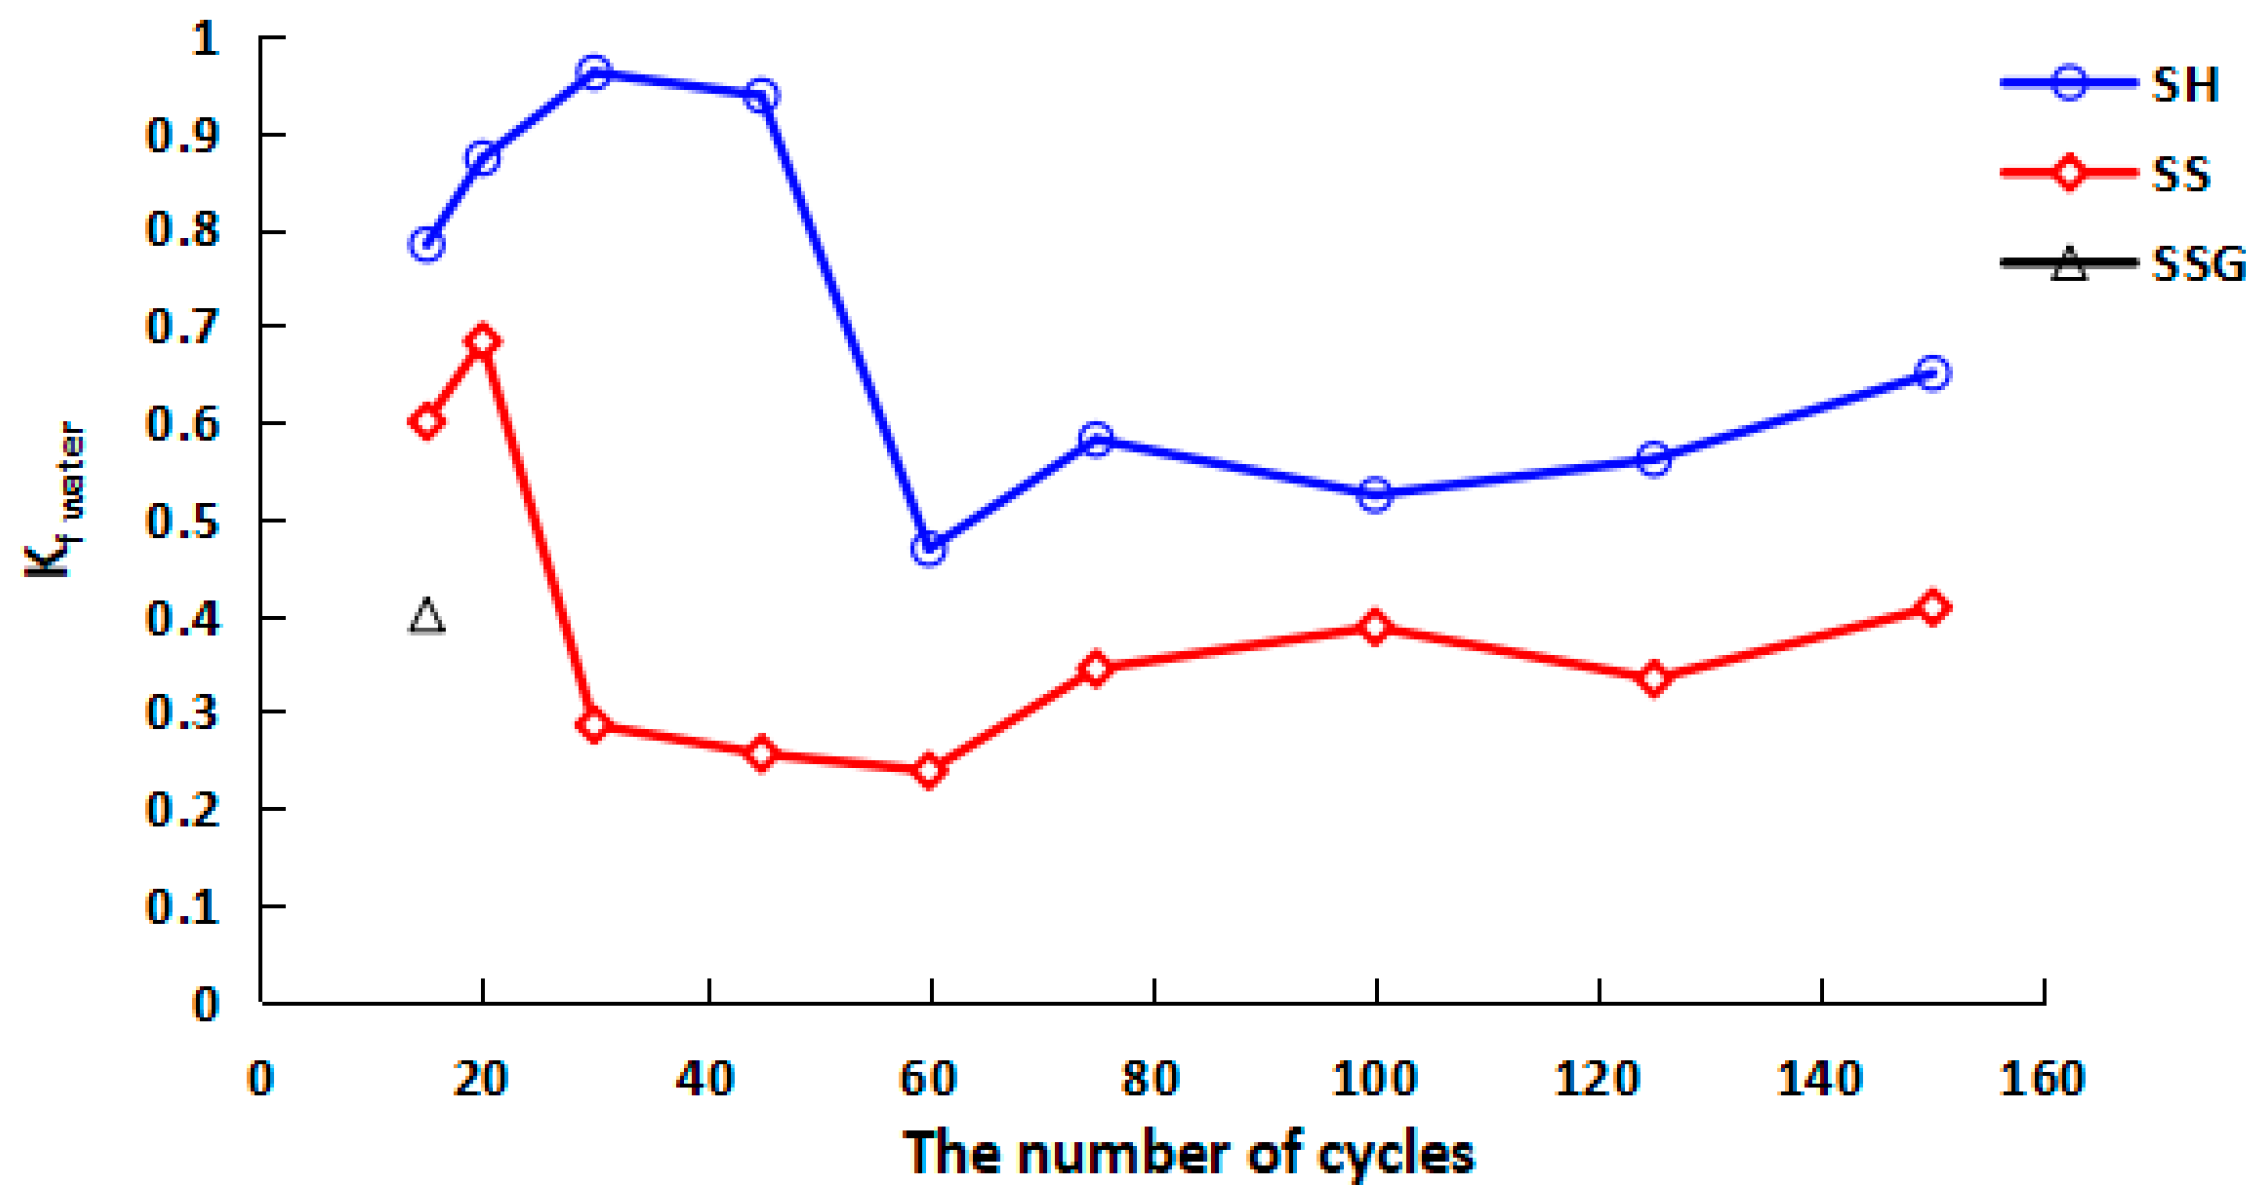
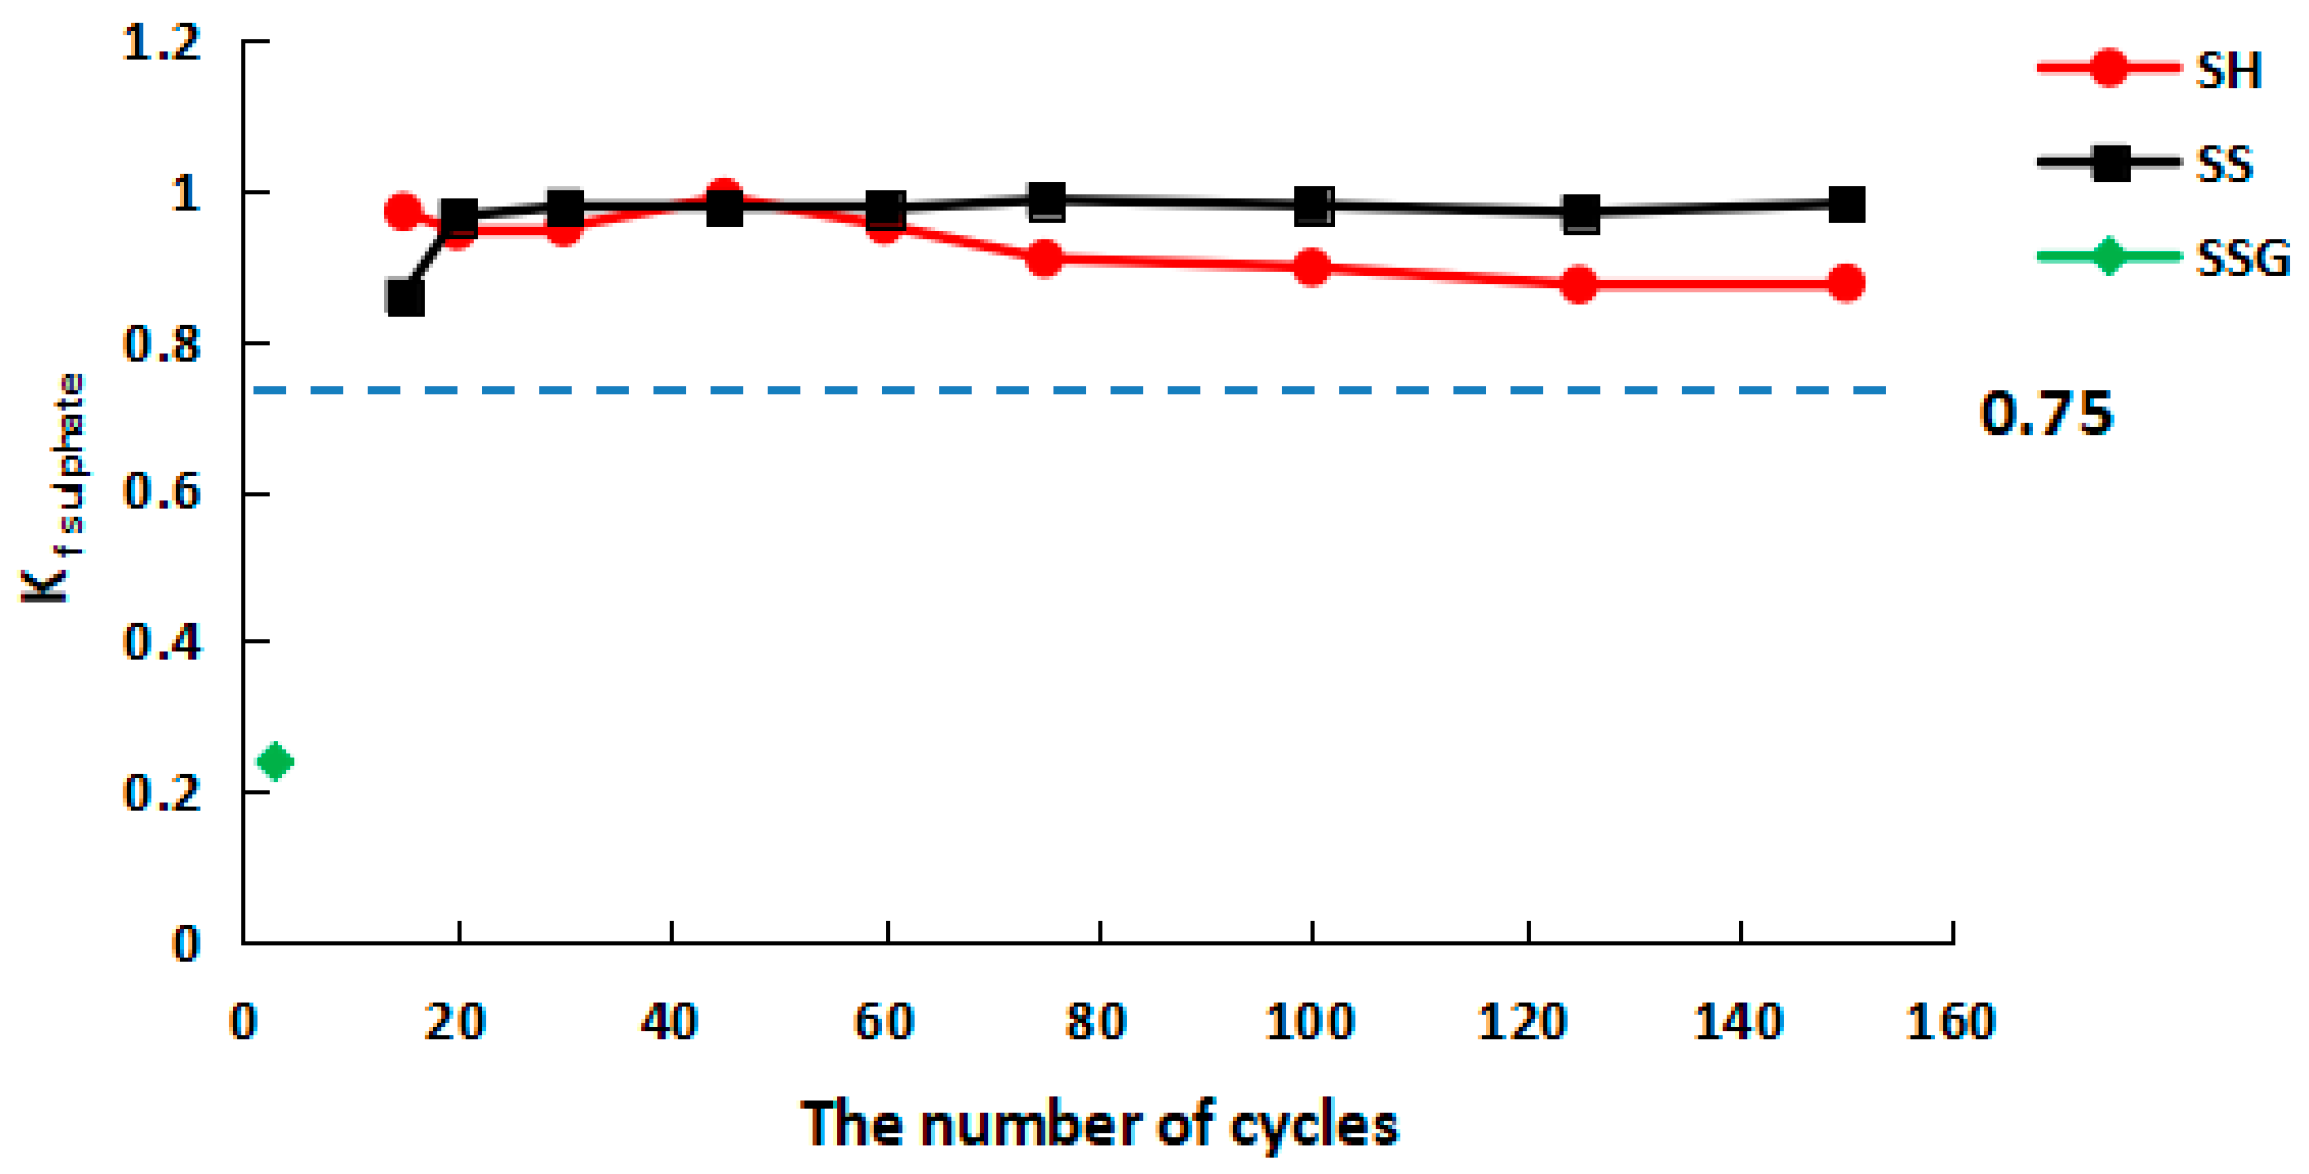
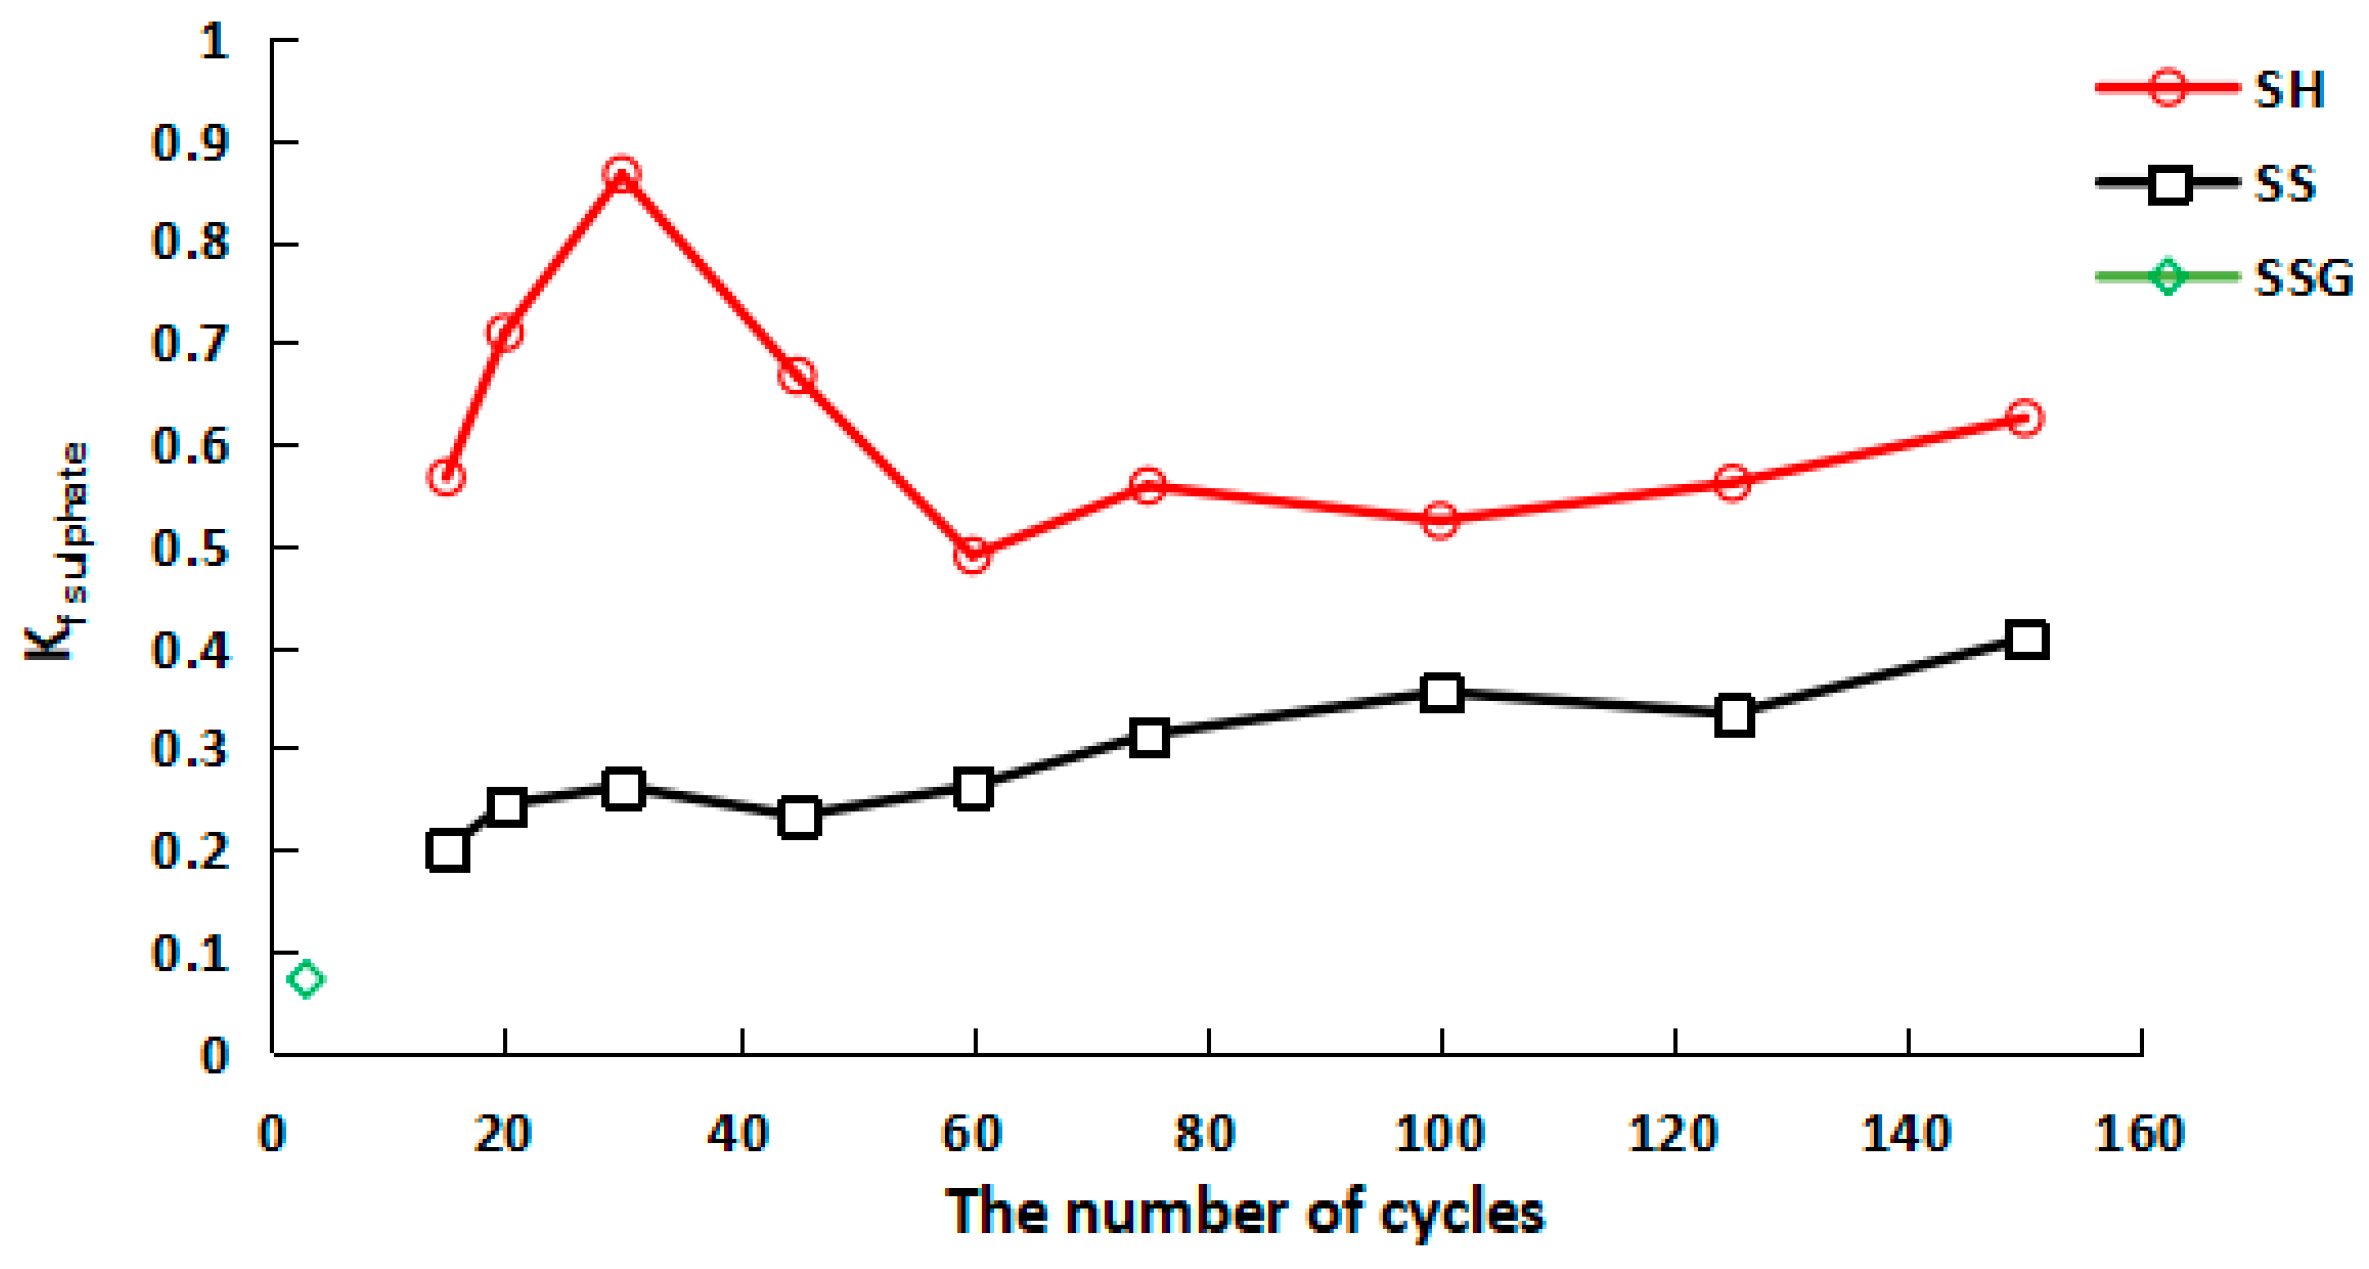
- The Kf sulphate of the SH and the SS specimens was higher than the Kf water, which proved that the sulphate solution promoted the hydration reaction in the sulphate cycles, and the C–N–A–S–H gel produced by the recombination reaction was greater than that of the water cycles, which effectively controlled the strength loss. Due to the rapid recombination and polymerization of SSG in the sulphate cycles, the outer skin was detached prematurely from the internal specimen, and the internal specimen was brittle and lost strength under the influence of sulphate crystallization.
Author Contributions
Funding
Data Availability Statement
Conflicts of Interest
References
- Zhang, G.-Y.; Ahn, Y.-H.; Lin, R.-S.; Wang, X.-Y. Effect of Waste Ceramic Powder on Properties of Alkali-Activated Blast Furnace Slag Paste and Mortar. Polymers 2021, 13, 2817. [Google Scholar] [CrossRef]
- Zifang, X.; Xiaotong, Z.; Juan, C. Preparation of Thermal Activation Sludge and Coal Gangue Polymer. Integr. Ferroelectr. 2015, 160, 1–9. [Google Scholar] [CrossRef]
- Mahmood, A.; Noman, M.T.; Pechočiaková, M.; Amor, N.; Petrů, M.; Abdelkader, M.; Militký, J.; Sozcu, S.; Hassan, S.Z.U. Geopolymers and Fiber-Reinforced Concrete Composites in Civil Engineering. Polymers 2021, 13, 2099. [Google Scholar] [CrossRef] [PubMed]
- Kupwade-Patil, K.; Allouche, E.N. Examination of Chloride-Induced Corrosion in Reinforced Geopolymer Concretes. J. Mater. Civ. Eng. 2013, 25, 1465–1476. [Google Scholar] [CrossRef]
- Quiatchon, P.R.J.; Dollente, I.J.R.; Abulencia, A.B.; Libre, R.G.D.G.; Villoria, M.B.D.; Guades, E.J.; Promentilla, M.A.B.; Ongpeng, J.M.C. Investigation on the Compressive Strength and Time of Setting of Low-Calcium Fly Ash Geopolymer Paste Using Response Surface Methodology. Polymers 2021, 13, 3461. [Google Scholar] [CrossRef]
- Zhao, Y.; Qiu, J.; Ma, Z.; Sun, X. Eco-friendly treatment of coal gangue for its utilization as supplementary cementitious materials. J. Clean. Prod. 2021, 285, 124834. [Google Scholar] [CrossRef]
- Jabłońska, B.; Kityk, A.V.; Busch, M.; Huber, P. The structural and surface properties of natural and modified coal gangue. J. Environ. Manag. 2017, 190, 80–90. [Google Scholar] [CrossRef] [PubMed]
- Huang, Y.; Zhang, J.; Yin, W.; Sun, Q. Analysis of Overlying Strata Movement and Behaviors in Caving and Solid Backfilling Mixed Coal Mining. Energies 2017, 10, 1057. [Google Scholar] [CrossRef] [Green Version]
- Guan, J.; Lu, M.; Yao, X.; Wang, Q.; Wang, D.; Yang, B.; Liu, H. An Experimental Study of the Road Performance of Cement Stabilized Coal Gangue. Crystals 2021, 11, 993. [Google Scholar] [CrossRef]
- Gao, X.; Liu, C.; Shui, Z.; Yu, R. Effects of Expansive Additives on the Shrinkage Behavior of Coal Gangue Based Alkali Activated Materials. Crystals 2021, 11, 816. [Google Scholar] [CrossRef]
- Li, Z.; Gao, Y.; Zhang, J.; Zhang, C.; Chen, J.; Liu, C. Effect of particle size and thermal activation on the coal gangue based geopolymer. Mater. Chem. Phys. 2021, 267, 124657. [Google Scholar] [CrossRef]
- Cremona, C.; Vildaer, S.; Cadillac, M. Experimental Study of Blended Binders with Metakaolin. Sustainability 2021, 13, 10548. [Google Scholar] [CrossRef]
- Yi, C.; Ma, H.; Zhu, H.; Li, W.; Xin, M.; Liu, Y.; Guo, Y. Study on chloride binding capability of coal gangue based cementitious materials. Constr. Build. Mater. 2018, 167, 649–656. [Google Scholar] [CrossRef]
- Juenger, M.C.G.; Winnefeld, F.; Provis, J.L.; Ideker, J.H. Advances in alternative cementitious binders. Cem. Concr. Res. 2011, 41, 1232–1243. [Google Scholar] [CrossRef]
- Zhao, Y.; Shi, T.; Cao, L.; Kan, L.; Wu, M. Influence of steel slag on the properties of alkali-activated fly ash and blast-furnace slag based fiber reinforced composites. Cem. Concr. Compos. 2021, 116, 103875. [Google Scholar] [CrossRef]
- Saludung, A.; Azeyanagi, T.; Ogawa, Y.; Kawai, K. Effect of silica fume on efflorescence formation and alkali leaching of alkali-activated slag. J. Clean. Prod. 2021, 315, 128210. [Google Scholar] [CrossRef]
- Algaifi, H.A.; Mustafa Mohamed, A.; Alsuhaibani, E.; Shahidan, S.; Alrshoudi, F.; Huseien, G.F.; Bakar, S.A. Optimisation of GBFS, Fly Ash, and Nano-Silica Contents in Alkali-Activated Mortars. Polymers 2021, 13, 2750. [Google Scholar] [CrossRef]
- Ma, H.; Zhu, H.; Wu, C.; Fan, J.; Yang, S.; Hang, Z. Effect of shrinkage reducing admixture on drying shrinkage and durability of alkali-activated coal gangue-slag material. Constr. Build. Mater. 2021, 270, 121372. [Google Scholar] [CrossRef]
- Liu, C.S.; Zhong, H.; Gao, X.; Ma, S. Performance evaluation of alkali-activated coal gangue-blast furnace slag composite. Bull. Chin. Ceram. Soc. 2020, 39, 2877–2884. [Google Scholar] [CrossRef]
- Ye, H.; Radlińska, A. Shrinkage mechanisms of alkali-activated slag. Cem. Concr. Res. 2016, 88, 126–135. [Google Scholar] [CrossRef] [Green Version]
- International Organization for Standardization. ISO 679:2009(E) Cement-Test Methods-Determination of Strength; International Standards Organization: Geneva, Switzerland, 2009. [Google Scholar]
- Ministry of Housing and Urban-Rural Development of the People’s Republic of China. G.T. 50082-2009 Standard for Test Methods of Long-Term Performance and Durability of Ordinary Concrete; China Architecture & Building Press: Beijing, China, 2009. [Google Scholar]
- Rovnaník, P. Effect of curing temperature on the development of hard structure of metakaolin-based geopolymer. Constr. Build. Mater. 2010, 24, 1176–1183. [Google Scholar] [CrossRef]
- Aredes, F.G.M.; Campos, T.M.B.; Machado, J.P.B.; Sakane, K.K.; Thim, G.P.; Brunelli, D.D. Effect of cure temperature on the formation of metakaolinite-based geopolymer. Cream. Int. 2015, 41, 7302–7311. [Google Scholar] [CrossRef]
- Huang, X.; Zhuang, R.; Muhammad, F.; Yu, L.; Shiau, Y.; Li, D. Solidification/stabilization of chromite ore processing residue using alkali-activated composite cementitious materials. Chemosphere 2017, 168, 300–308. [Google Scholar] [CrossRef] [PubMed]
- Zhao, S.; Muhammad, F.; Yu, L.; Xia, M.; Huang, X.; Jiao, B.; Lu, N.; Li, D. Solidification/stabilization of municipal solid waste incineration fly ash using uncalcined coal gangue–based alkali-activated cementitious materials. Environ. Sci. Pollut. Res. 2019, 26, 25609–25620. [Google Scholar] [CrossRef]
- Kaya, K.; Soyer-Uzun, S. Evolution of structural characteristics and compressive strength in red mud–metakaolin based geopolymer systems. Cream. Int. 2016, 42, 7406–7413. [Google Scholar] [CrossRef]
- Phair, J.W.; Van Deventer, J.S.J. Effect of the silicate activator pH on the microstructural characteristics of waste-based geopolymers. Int. J. Miner. Process. 2002, 66, 121–143. [Google Scholar] [CrossRef]
- Heikal, M.; Nassar, M.Y.; El-Sayed, G.; Ibrahim, S.M. Physico-chemical, mechanical, microstructure and durability characteristics of alkali activated Egyptian slag. Constr. Build. Mater. 2014, 69, 60–72. [Google Scholar] [CrossRef]
- Garcia-Lodeiro, I.; Palomo, A.; Fernández-Jiménez, A.; Macphee, D.E. Compatibility studies between N-A-S-H and C-A-S-H gels. Study in the ternary diagram Na2O–CaO–Al2O3–SiO2–H2O. Cem. Concr. Res. 2011, 41, 923–931. [Google Scholar] [CrossRef]
- Sore, S.O.; Messan, A.; Prud’homme, E.; Escadeillas, G.; Tsobnang, F. Synthesis and characterization of geopolymer binders based on local materials from Burkina Faso–Metakaolin and rice husk ash. Constr. Build. Mater. 2016, 124, 301–311. [Google Scholar] [CrossRef]
- Ye, N.; Yang, J.; Ke, X.; Zhu, J.; Li, Y.; Xiang, C.; Wang, H.; Li, L.; Xiao, B. Synthesis and Characterization of Geopolymer from Bayer Red Mud with Thermal Pretreatment. J. Am. Ceram. Soc. 2014, 97, 1652–1660. [Google Scholar] [CrossRef]
- Duxson, P.; Fernández-Jiménez, A.; Provis, J.L.; Lukey, G.C.; Palomo, A.; van Deventer, J.S.J. Geopolymer technology: The current state of the art. J. Mater. Sci. 2007, 42, 2917–2933. [Google Scholar] [CrossRef]


| Type | Geopolymer | Cracks | Polycondensation | Cycles | Damage or Ultimate Compressive/Flexural Strength (MPa) | Kf |
|---|---|---|---|---|---|---|
| Water cycles | SH | * | * | 150 | 24/2.6 | 0.79 |
| SS | ** | ** | 150 | 39.6/1.1 | 0.95 | |
| SSG | *** | ** | 20 | 32.2/0 | - | |
| Sulphate cycles | SH | * | * | 150 | 26.7/2.5 | 0.88 |
| SS | ** | ** | 150 | 40.8/1.1 | 0.98 | |
| SSG | *** | ** | 3 | 9.7/0 | - |
Publisher’s Note: MDPI stays neutral with regard to jurisdictional claims in published maps and institutional affiliations. |
© 2021 by the authors. Licensee MDPI, Basel, Switzerland. This article is an open access article distributed under the terms and conditions of the Creative Commons Attribution (CC BY) license (https://creativecommons.org/licenses/by/4.0/).
Share and Cite
Yang, X.; Zhang, Y.; Li, Z.; Wang, M. Research on Compressive and Flexural Properties of Coal Gangue-Slag Geopolymer under Wetting-Drying Cycles and Analysis of Micro-Mechanism. Polymers 2021, 13, 4160. https://doi.org/10.3390/polym13234160
Yang X, Zhang Y, Li Z, Wang M. Research on Compressive and Flexural Properties of Coal Gangue-Slag Geopolymer under Wetting-Drying Cycles and Analysis of Micro-Mechanism. Polymers. 2021; 13(23):4160. https://doi.org/10.3390/polym13234160
Chicago/Turabian StyleYang, Xiaoyun, Yan Zhang, Zhuhan Li, and Minglei Wang. 2021. "Research on Compressive and Flexural Properties of Coal Gangue-Slag Geopolymer under Wetting-Drying Cycles and Analysis of Micro-Mechanism" Polymers 13, no. 23: 4160. https://doi.org/10.3390/polym13234160