Hydroxyl Groups Induce Bioactivity in Silica/Chitosan Aerogels Designed for Bone Tissue Engineering. In Vitro Model for the Assessment of Osteoblasts Behavior

 , , , , and
Abstract
:
1. Introduction
- Biocompatibility and bioactivity, understood as the capacity to support normal cellular activities, without the appearance of toxic effects (osteoconductive and osteoinductive).
- Mechanical properties compatible with the elastic behavior of the bone, with the capacity to withstand the various kinds of stresses to which the bone is subjected.
- A distribution of interconnected pores from mesopores to gigapores (2 nm–300 μm).
- Bioreabsorbability and/or biodegradability.
2. Materials and Methods
2.1. Materials
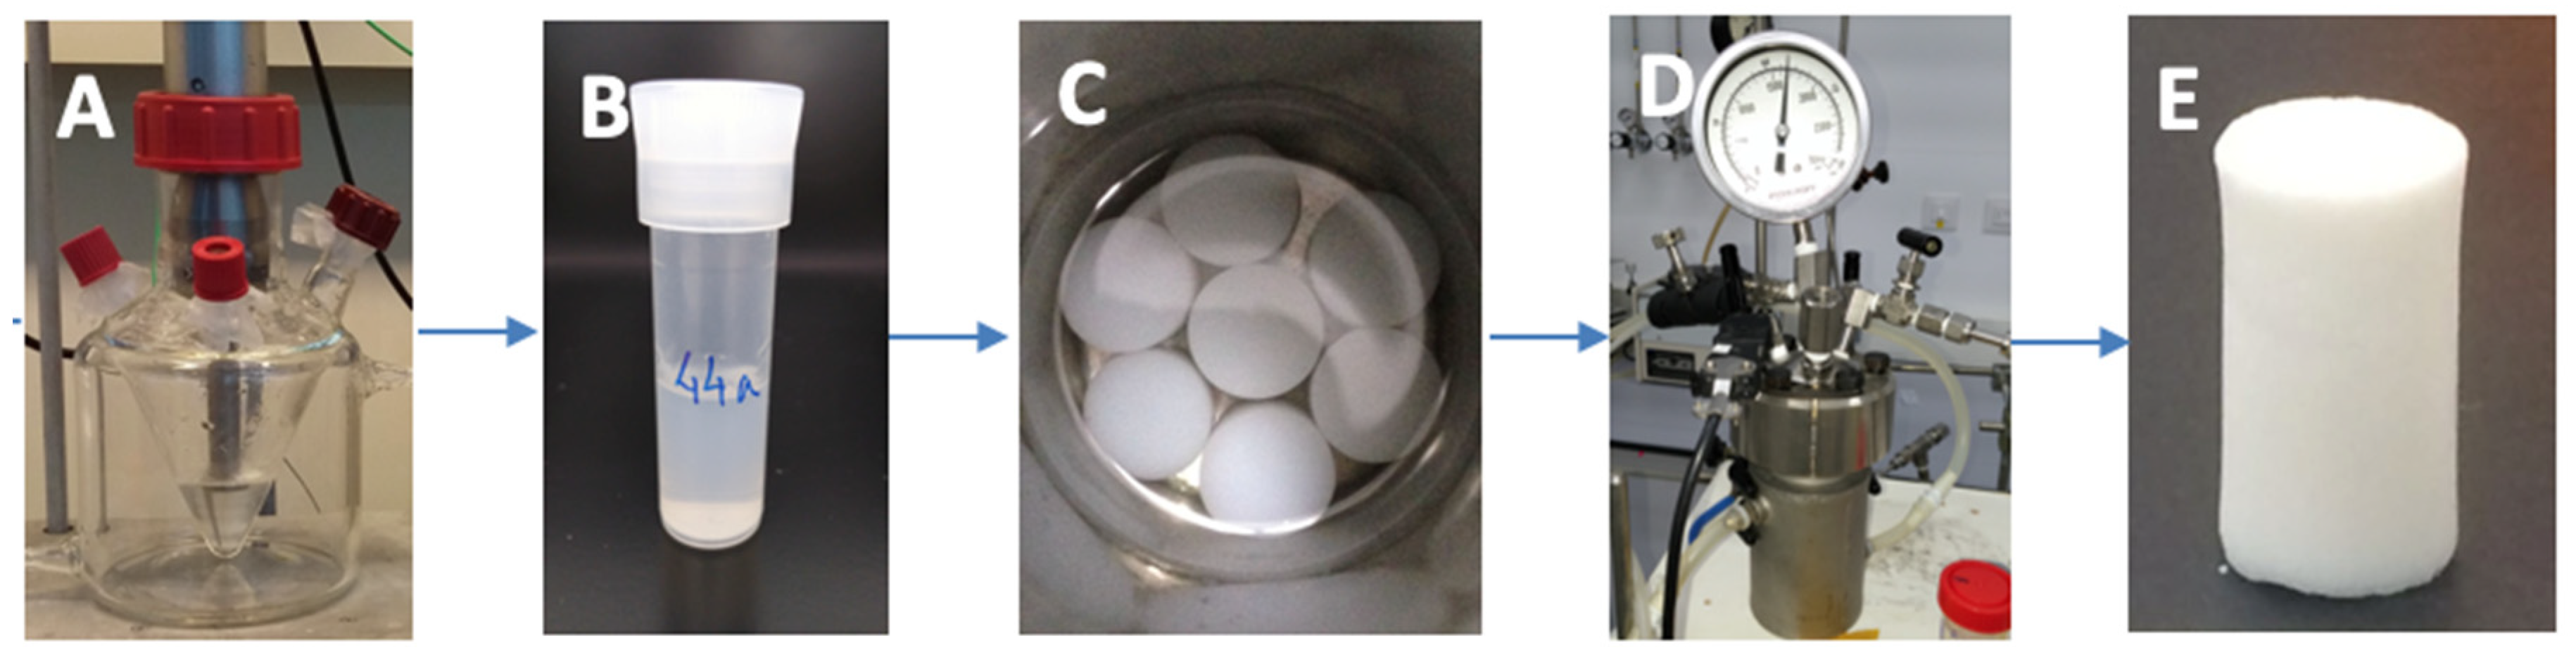
2.2. Aerogel Synthesis
2.3. Physicochemical Characterization
2.3.1. Textural Characterization
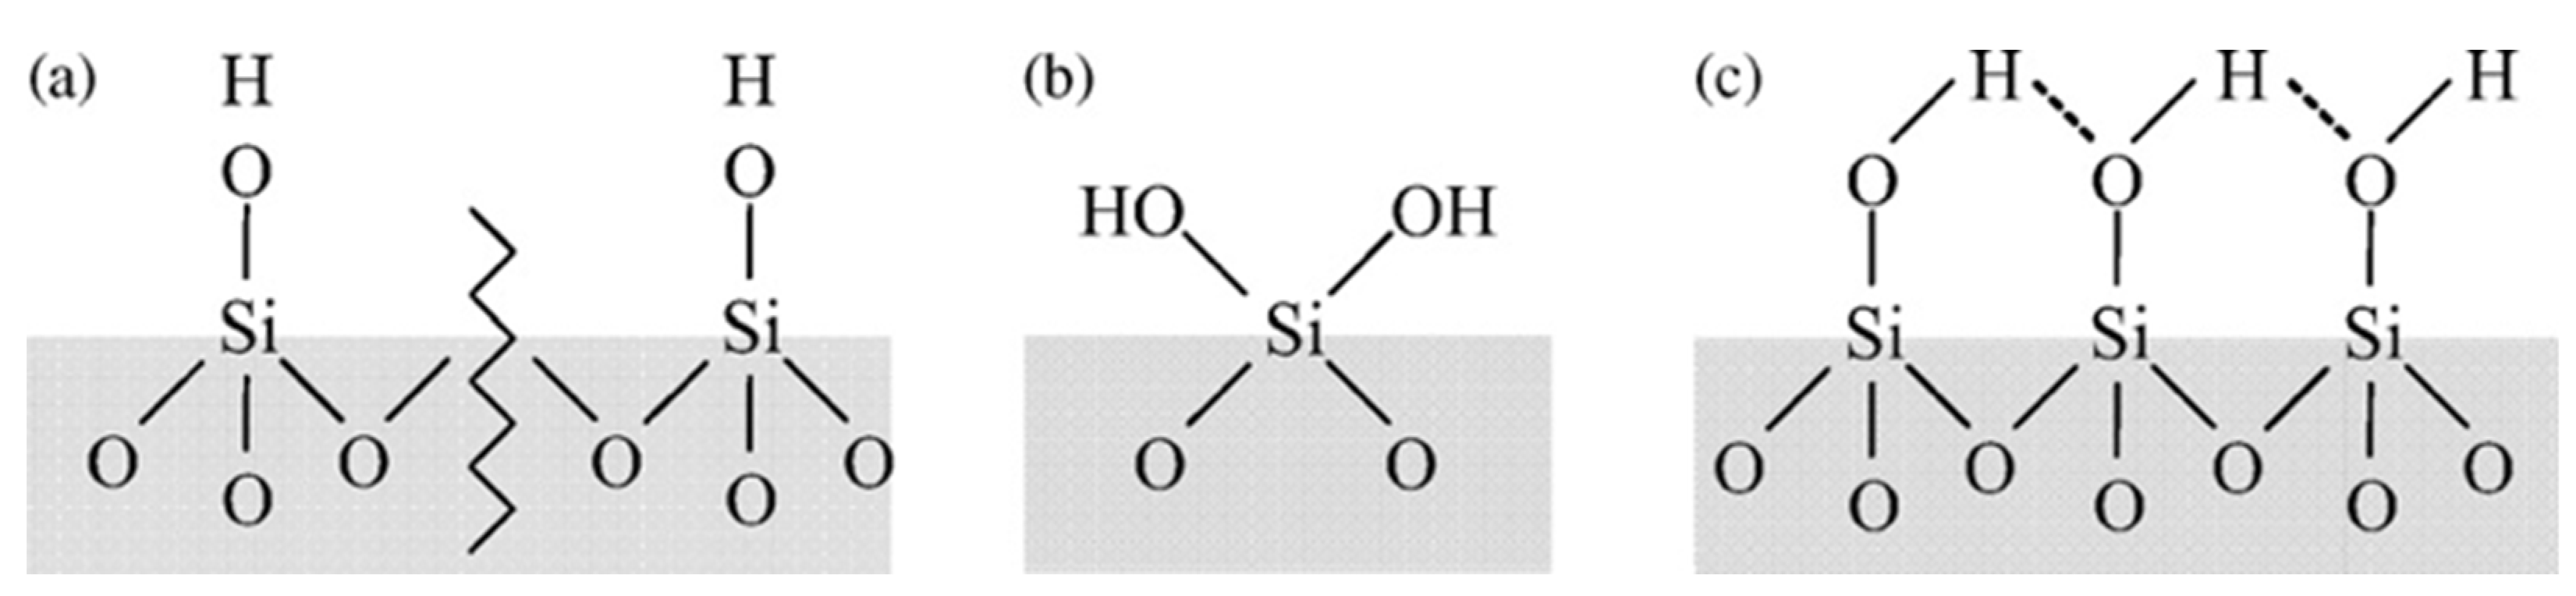
2.3.2. Structure Characterization
2.4. Mechanical Characterization
2.5. Water Uptake
2.6. Bioactivity Evaluation
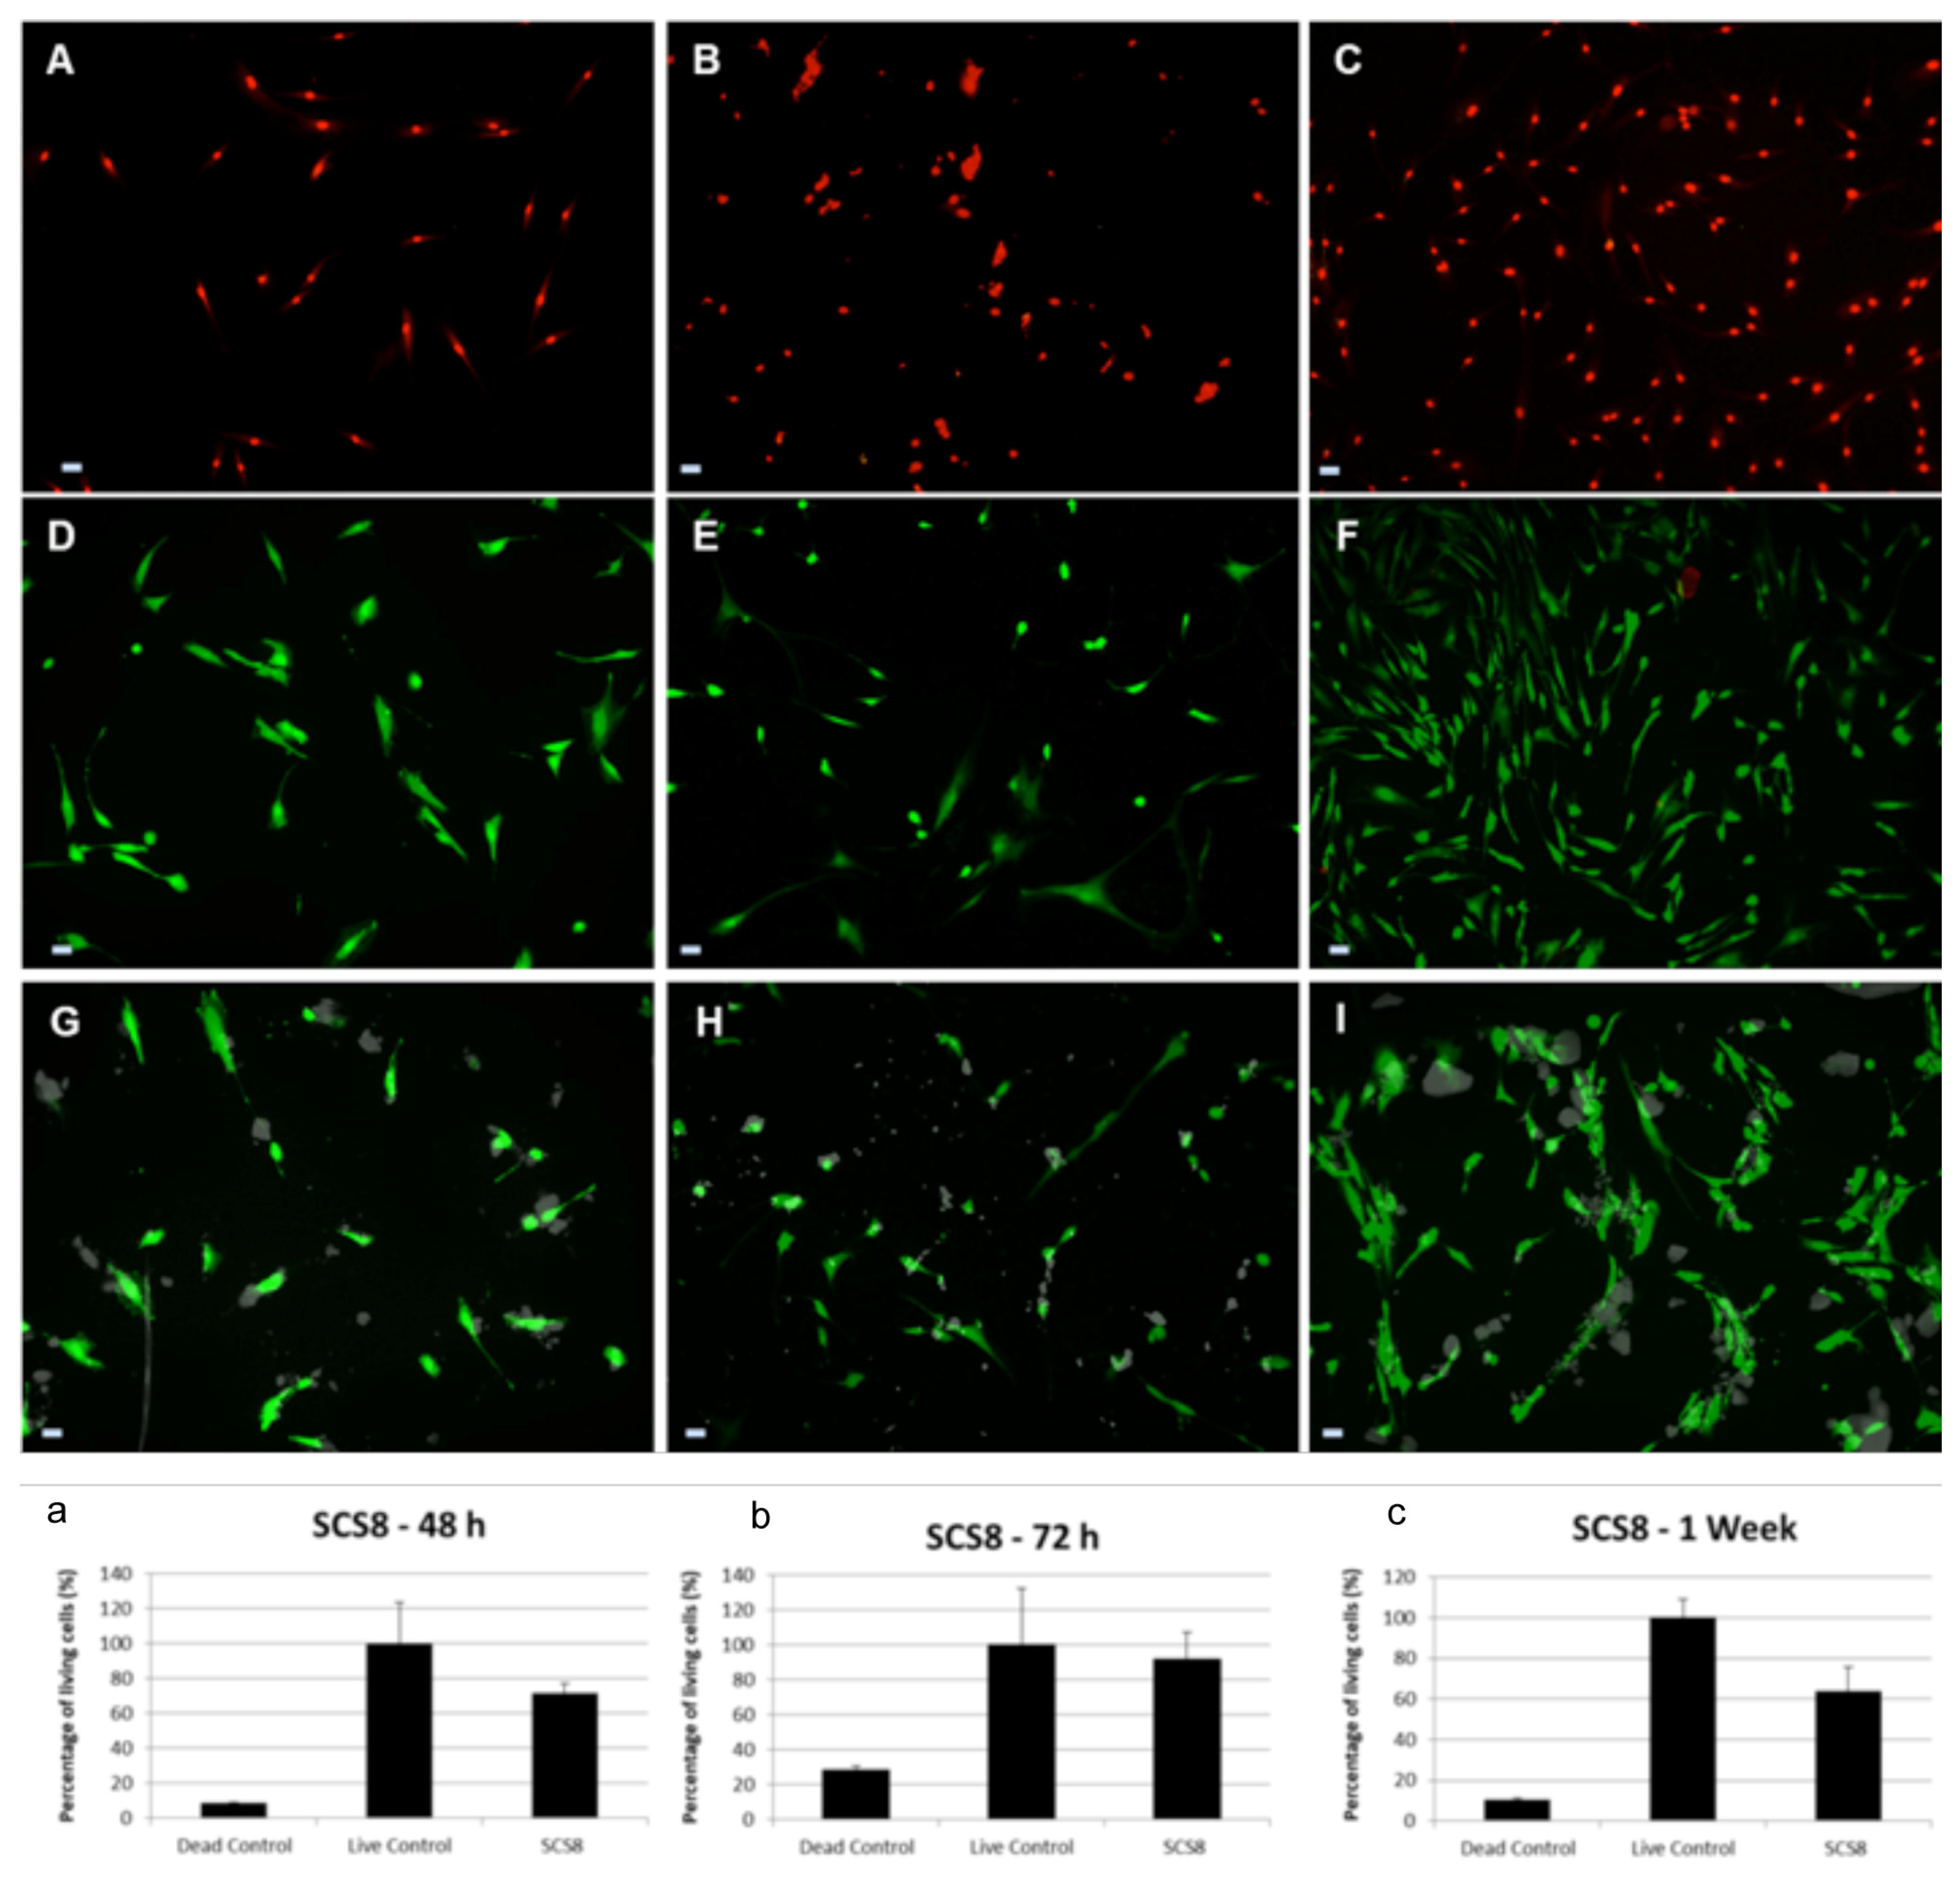
2.7. Biocompatibility Tests In Vitro
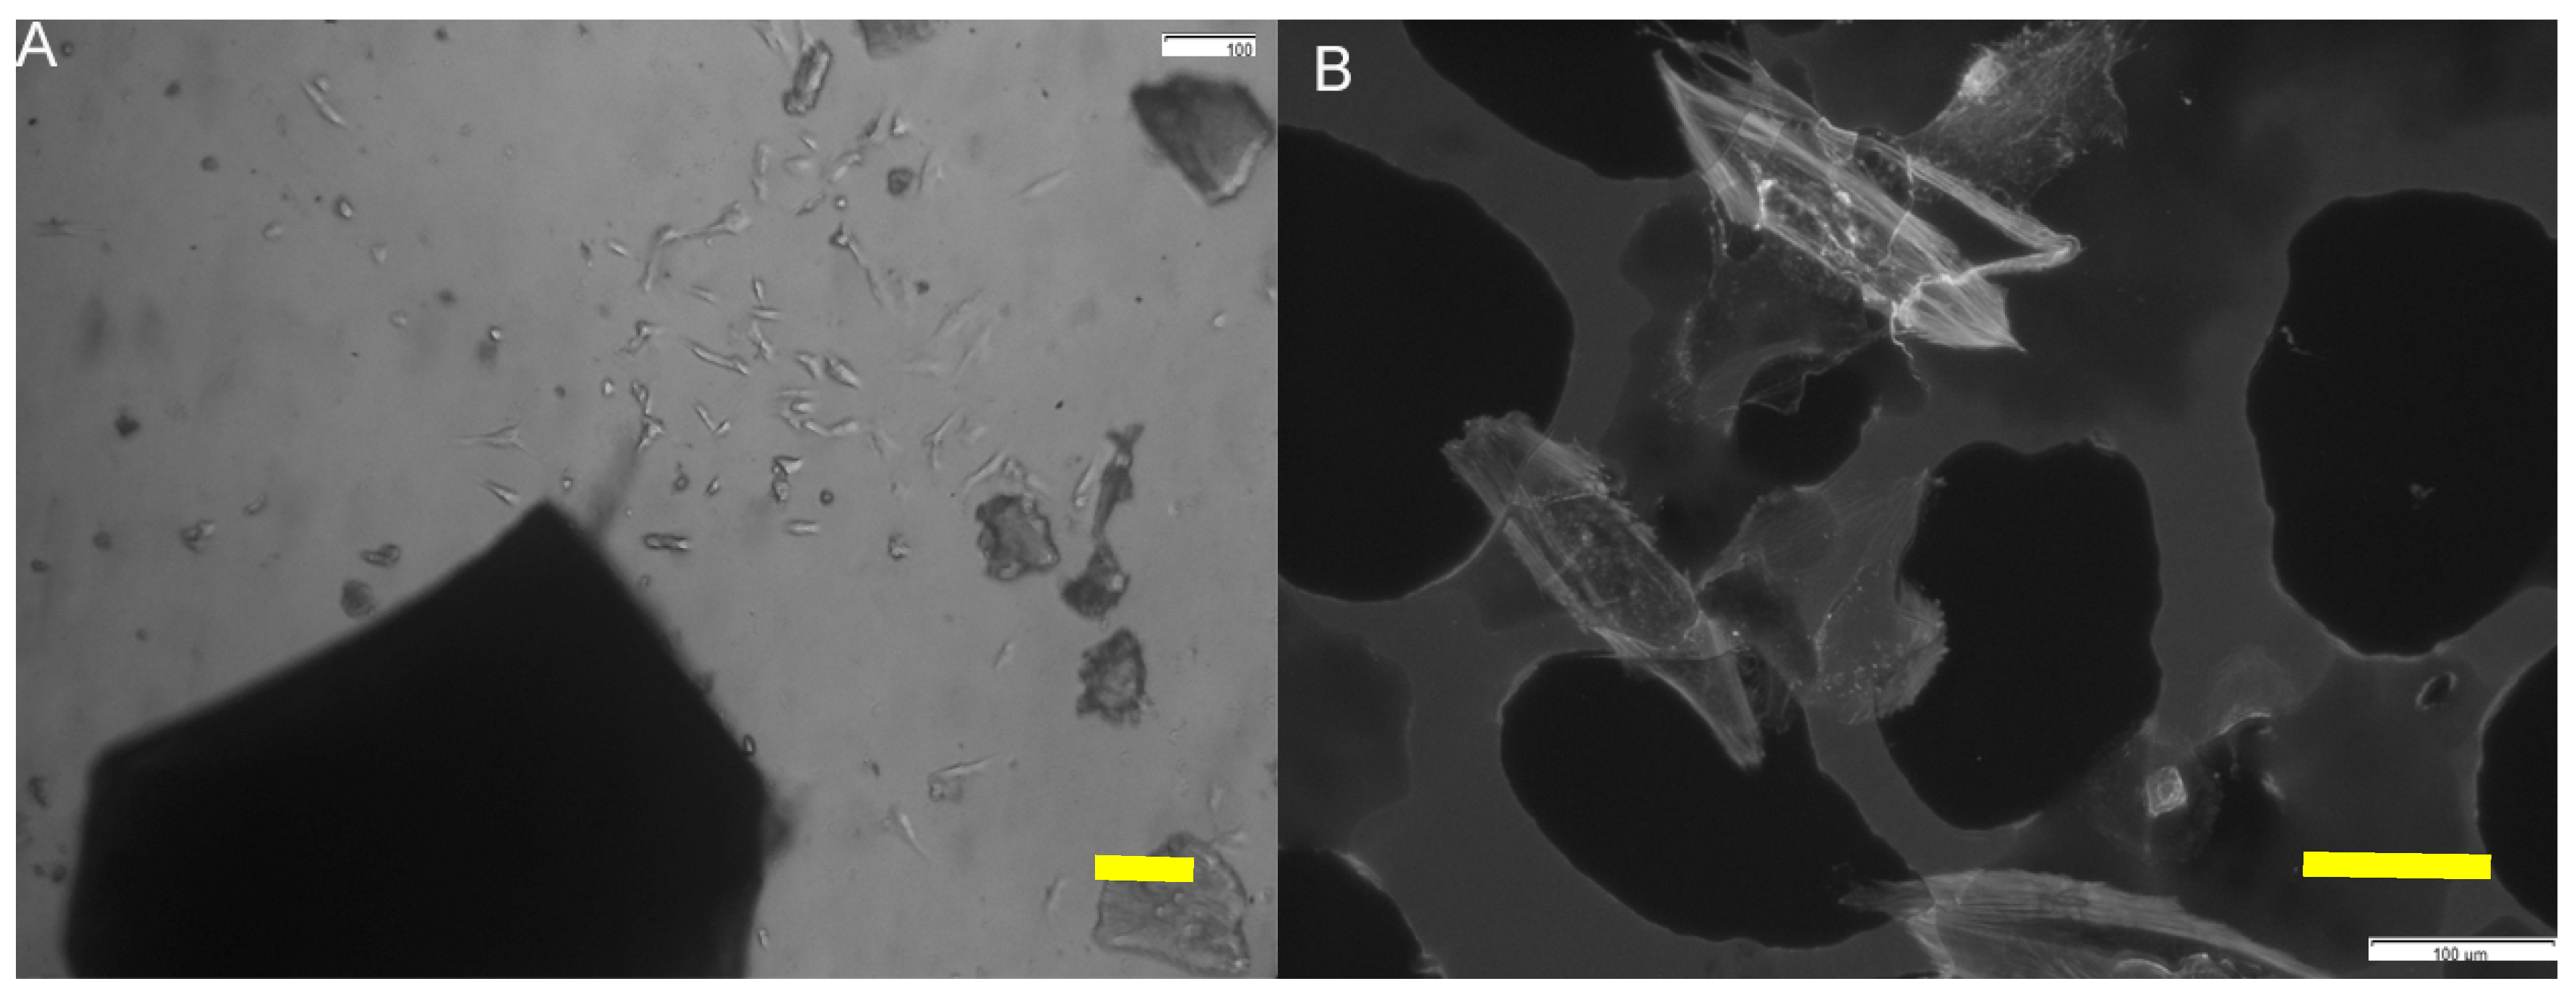
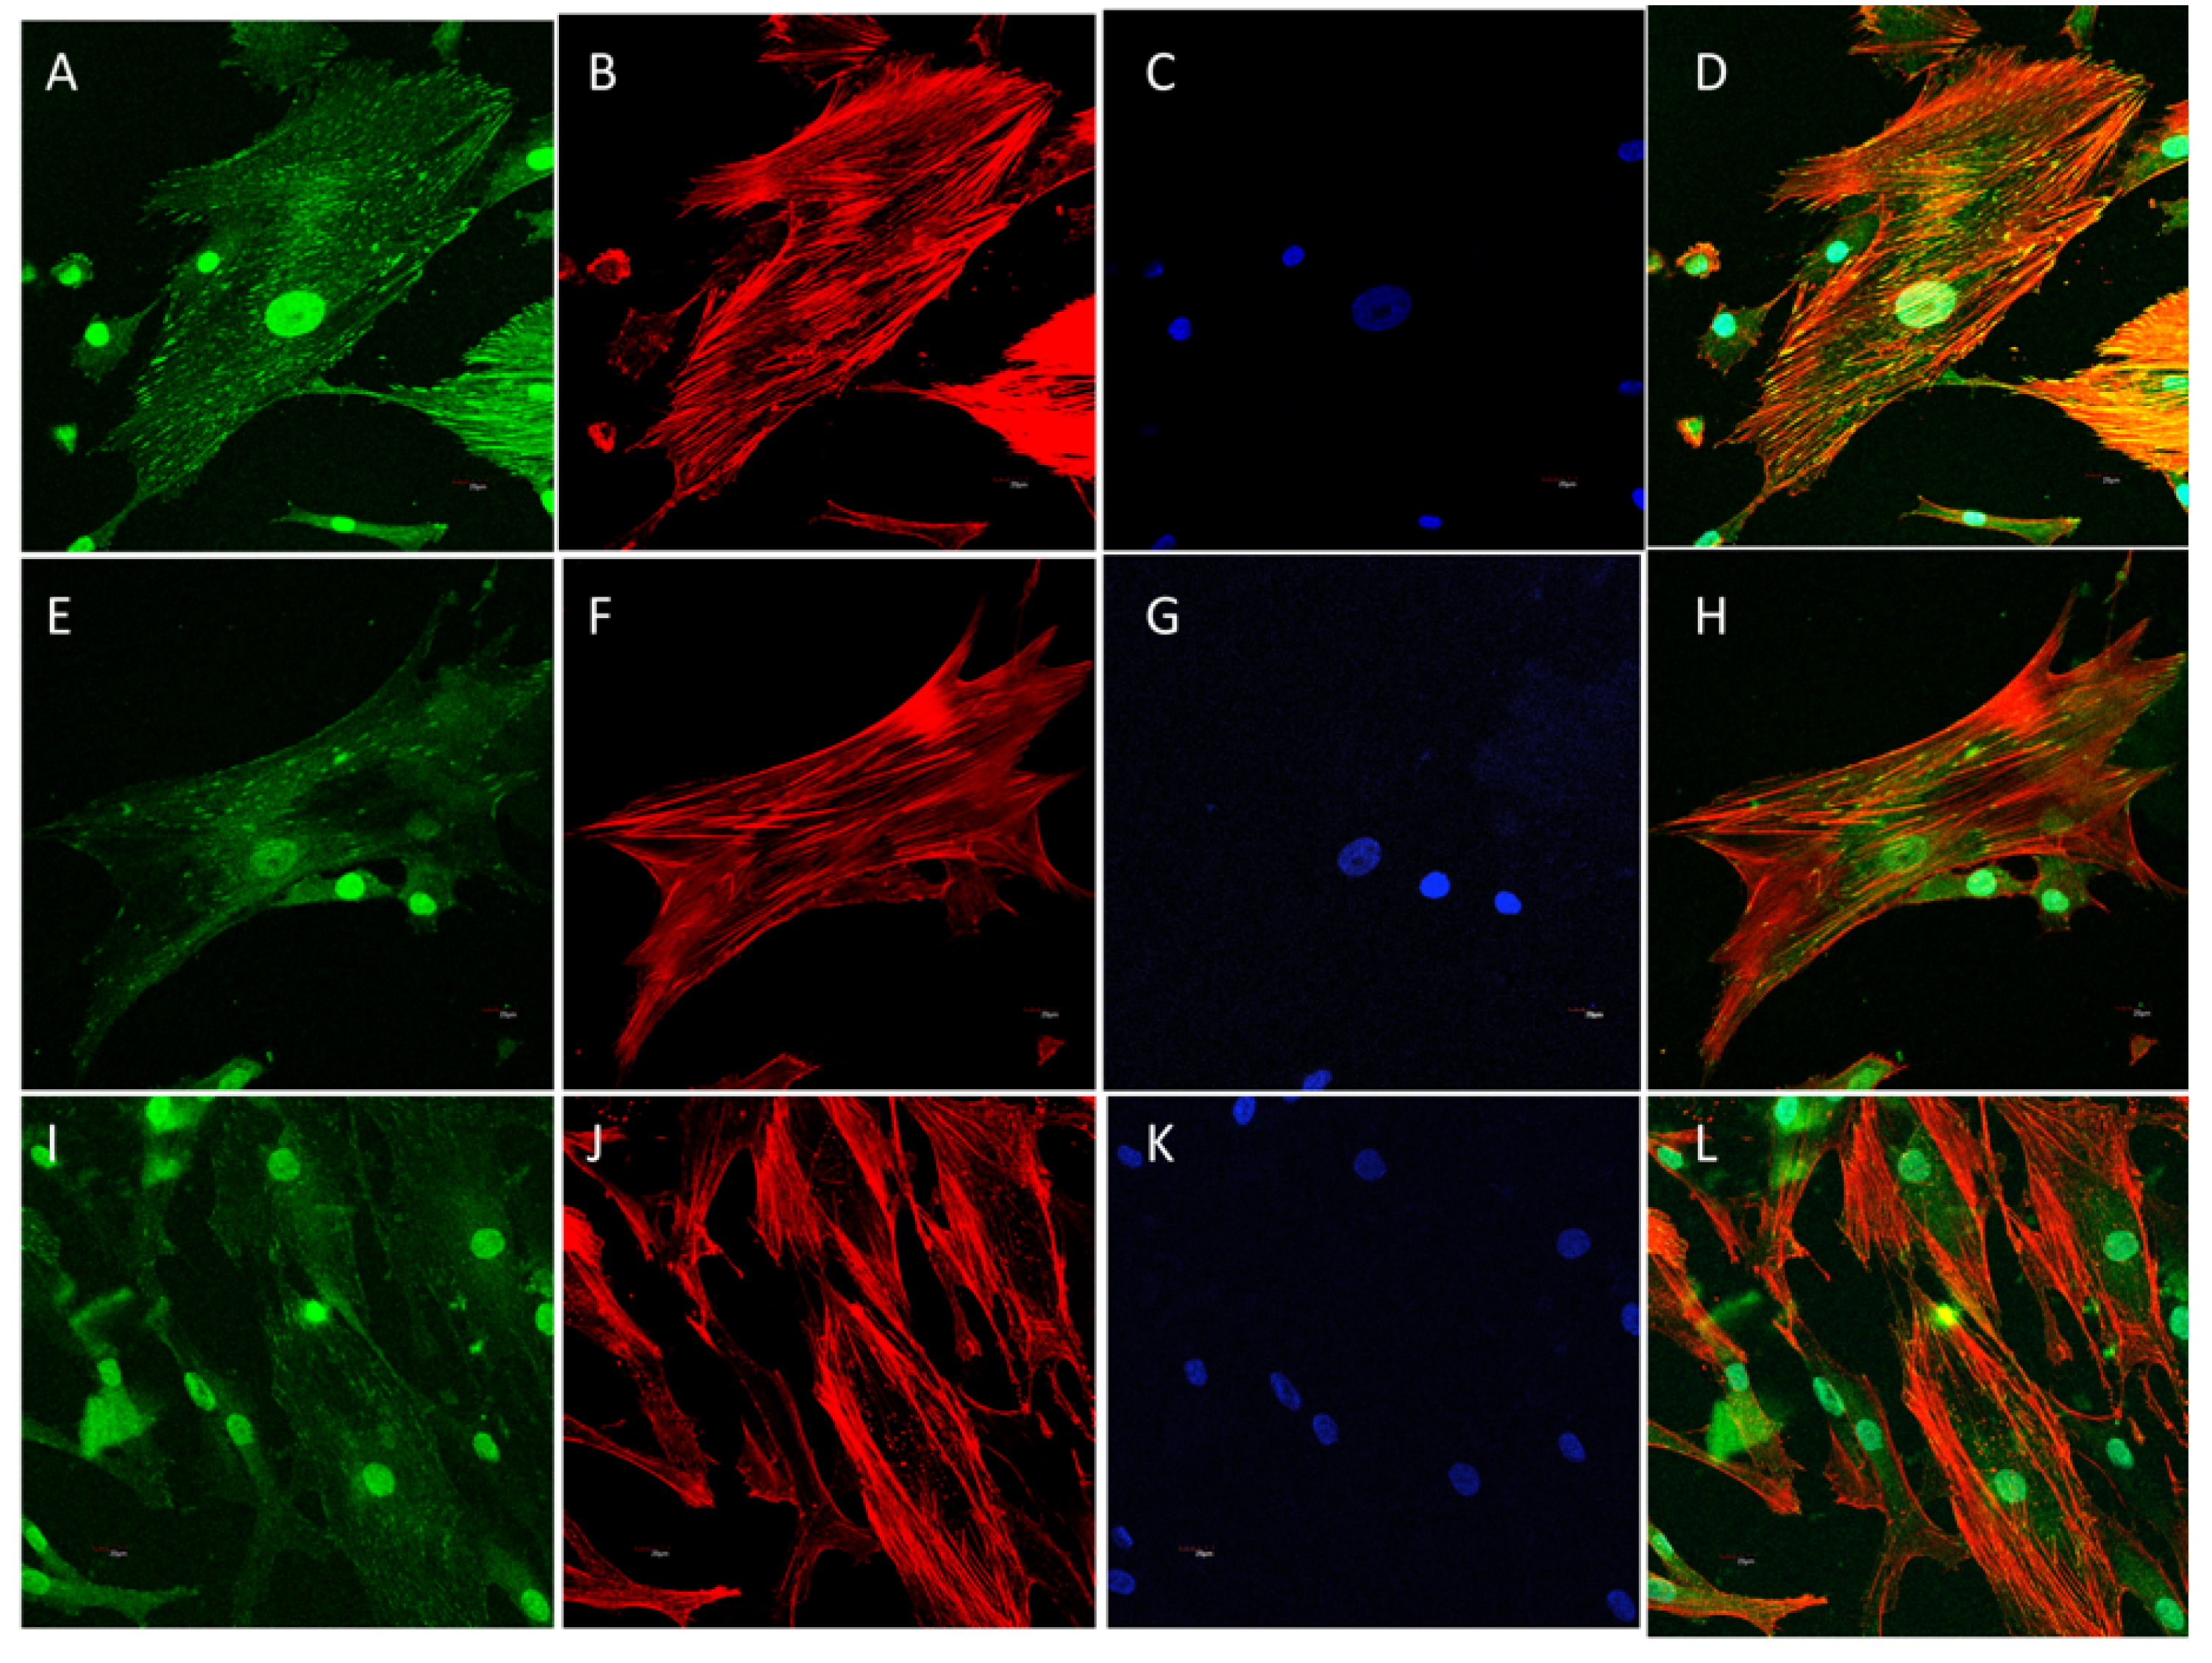
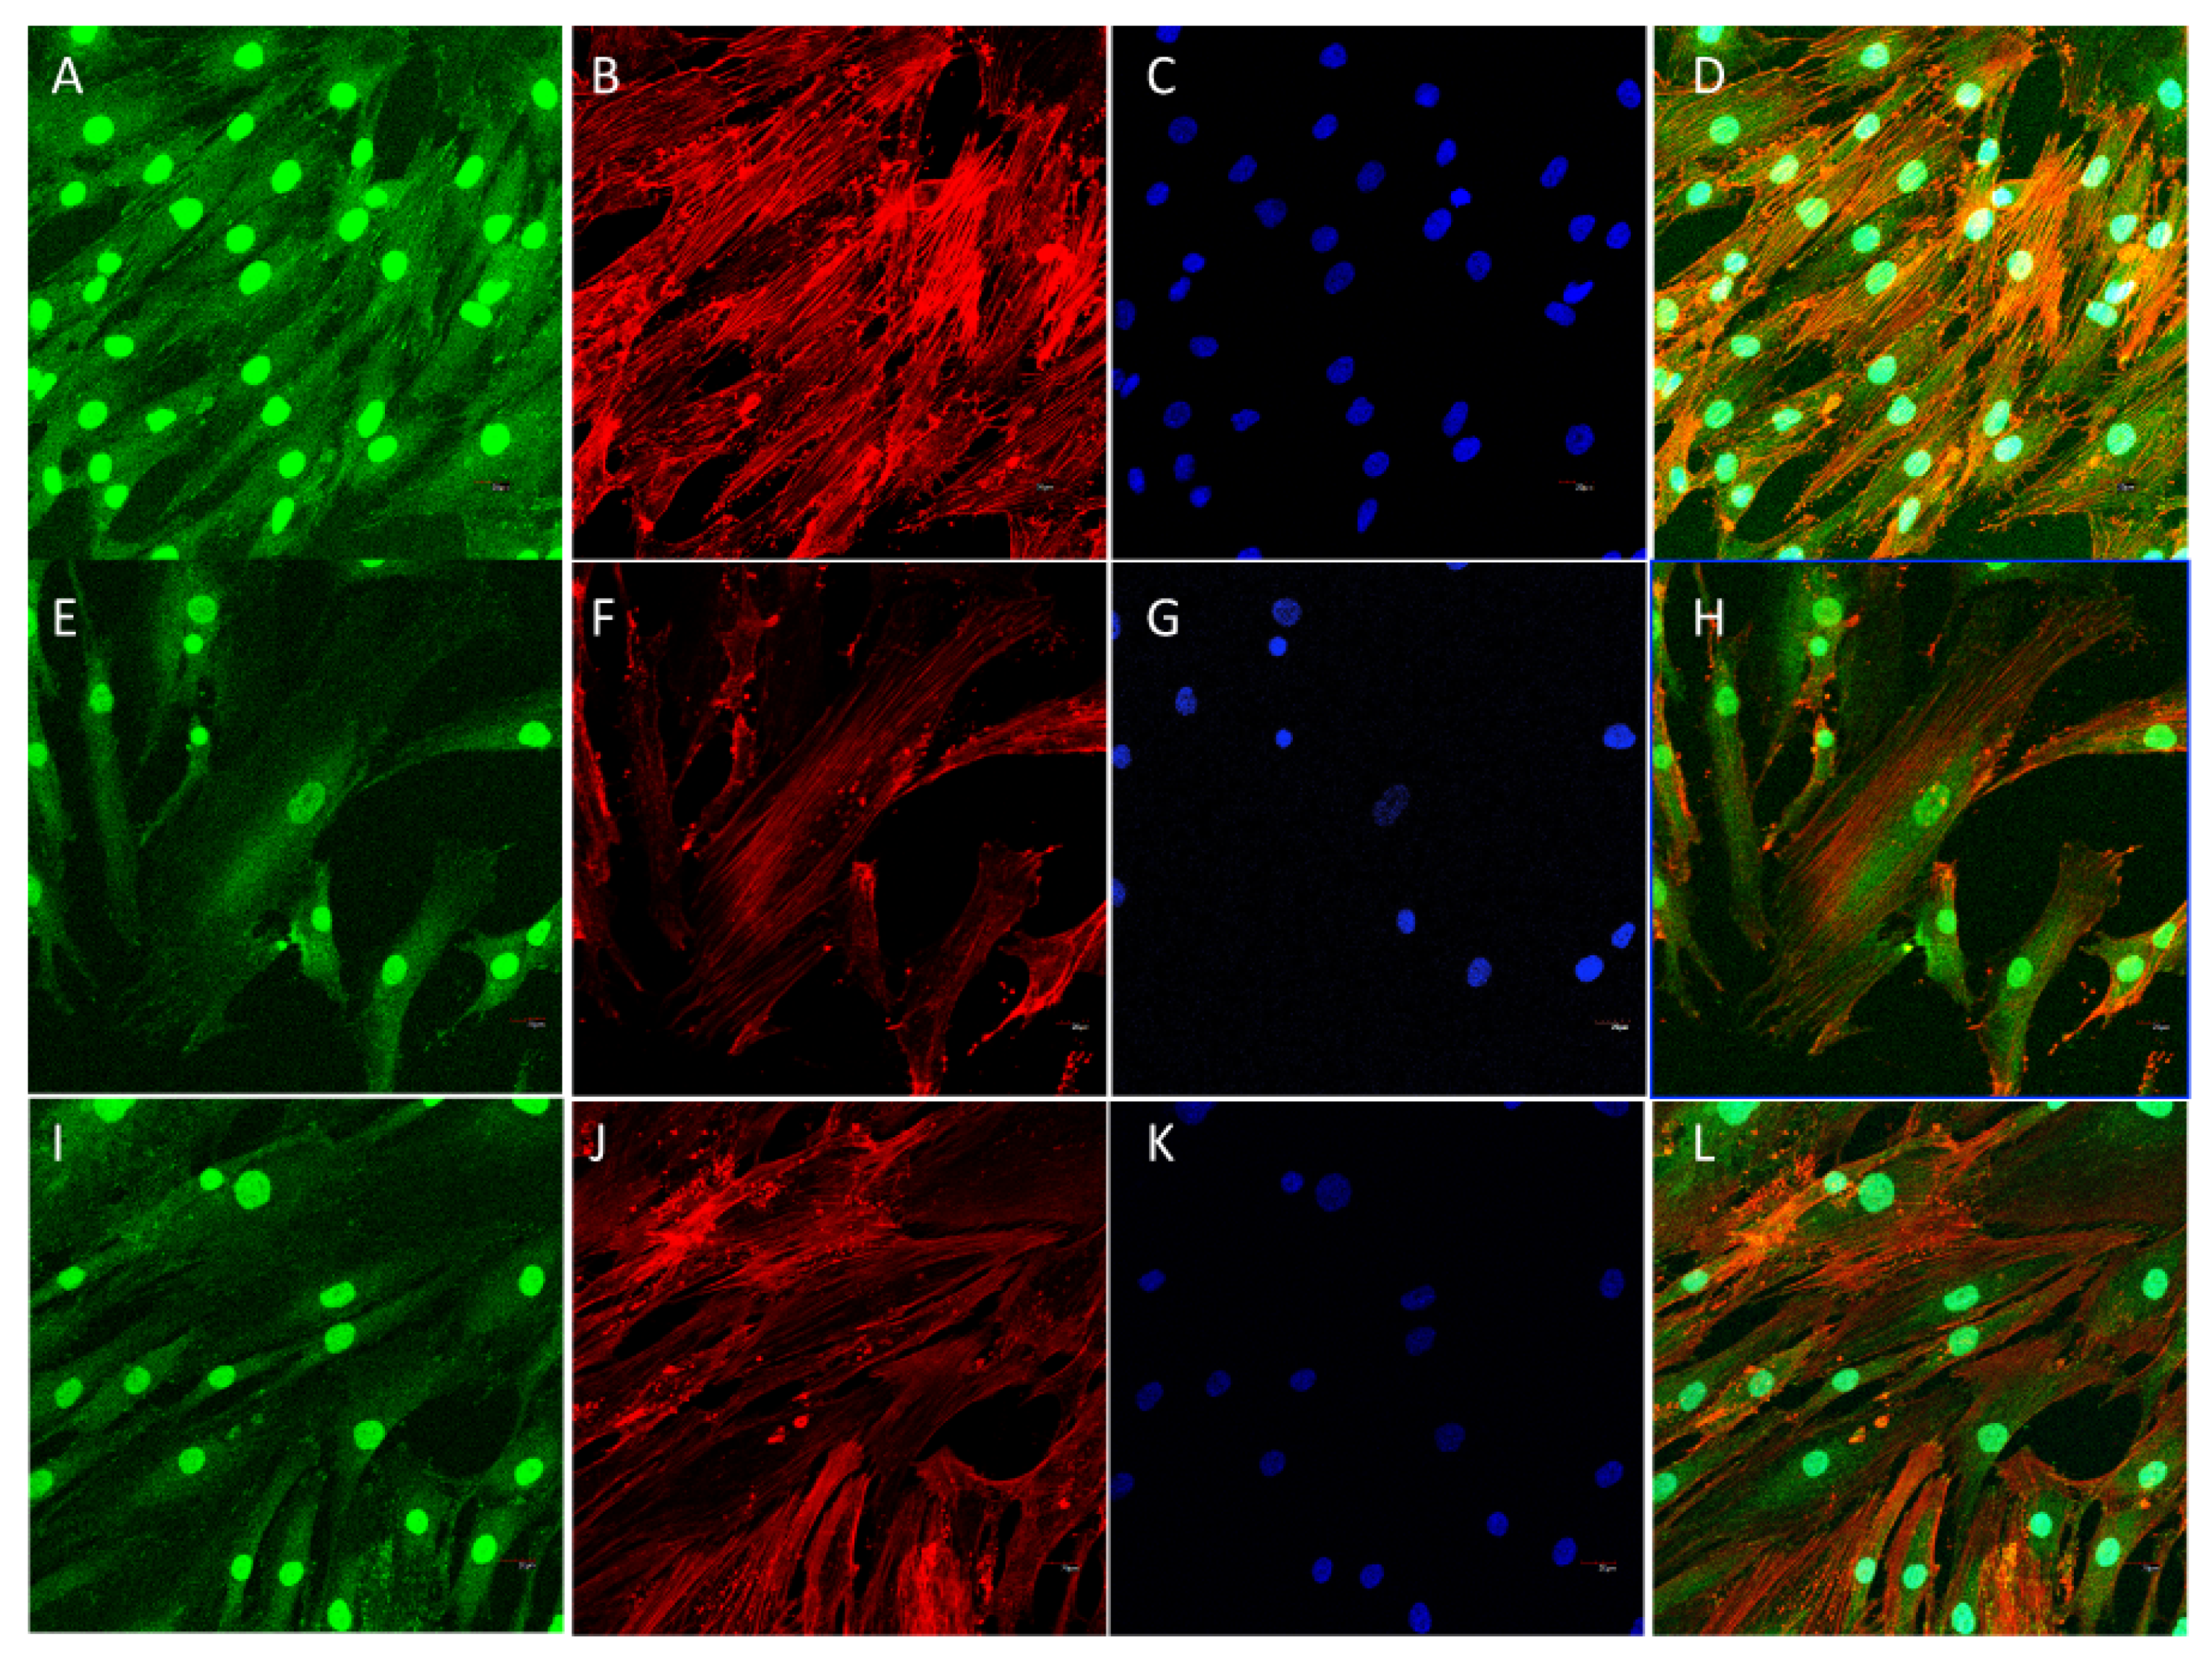
2.7.1. Cell Morphology and Spreading
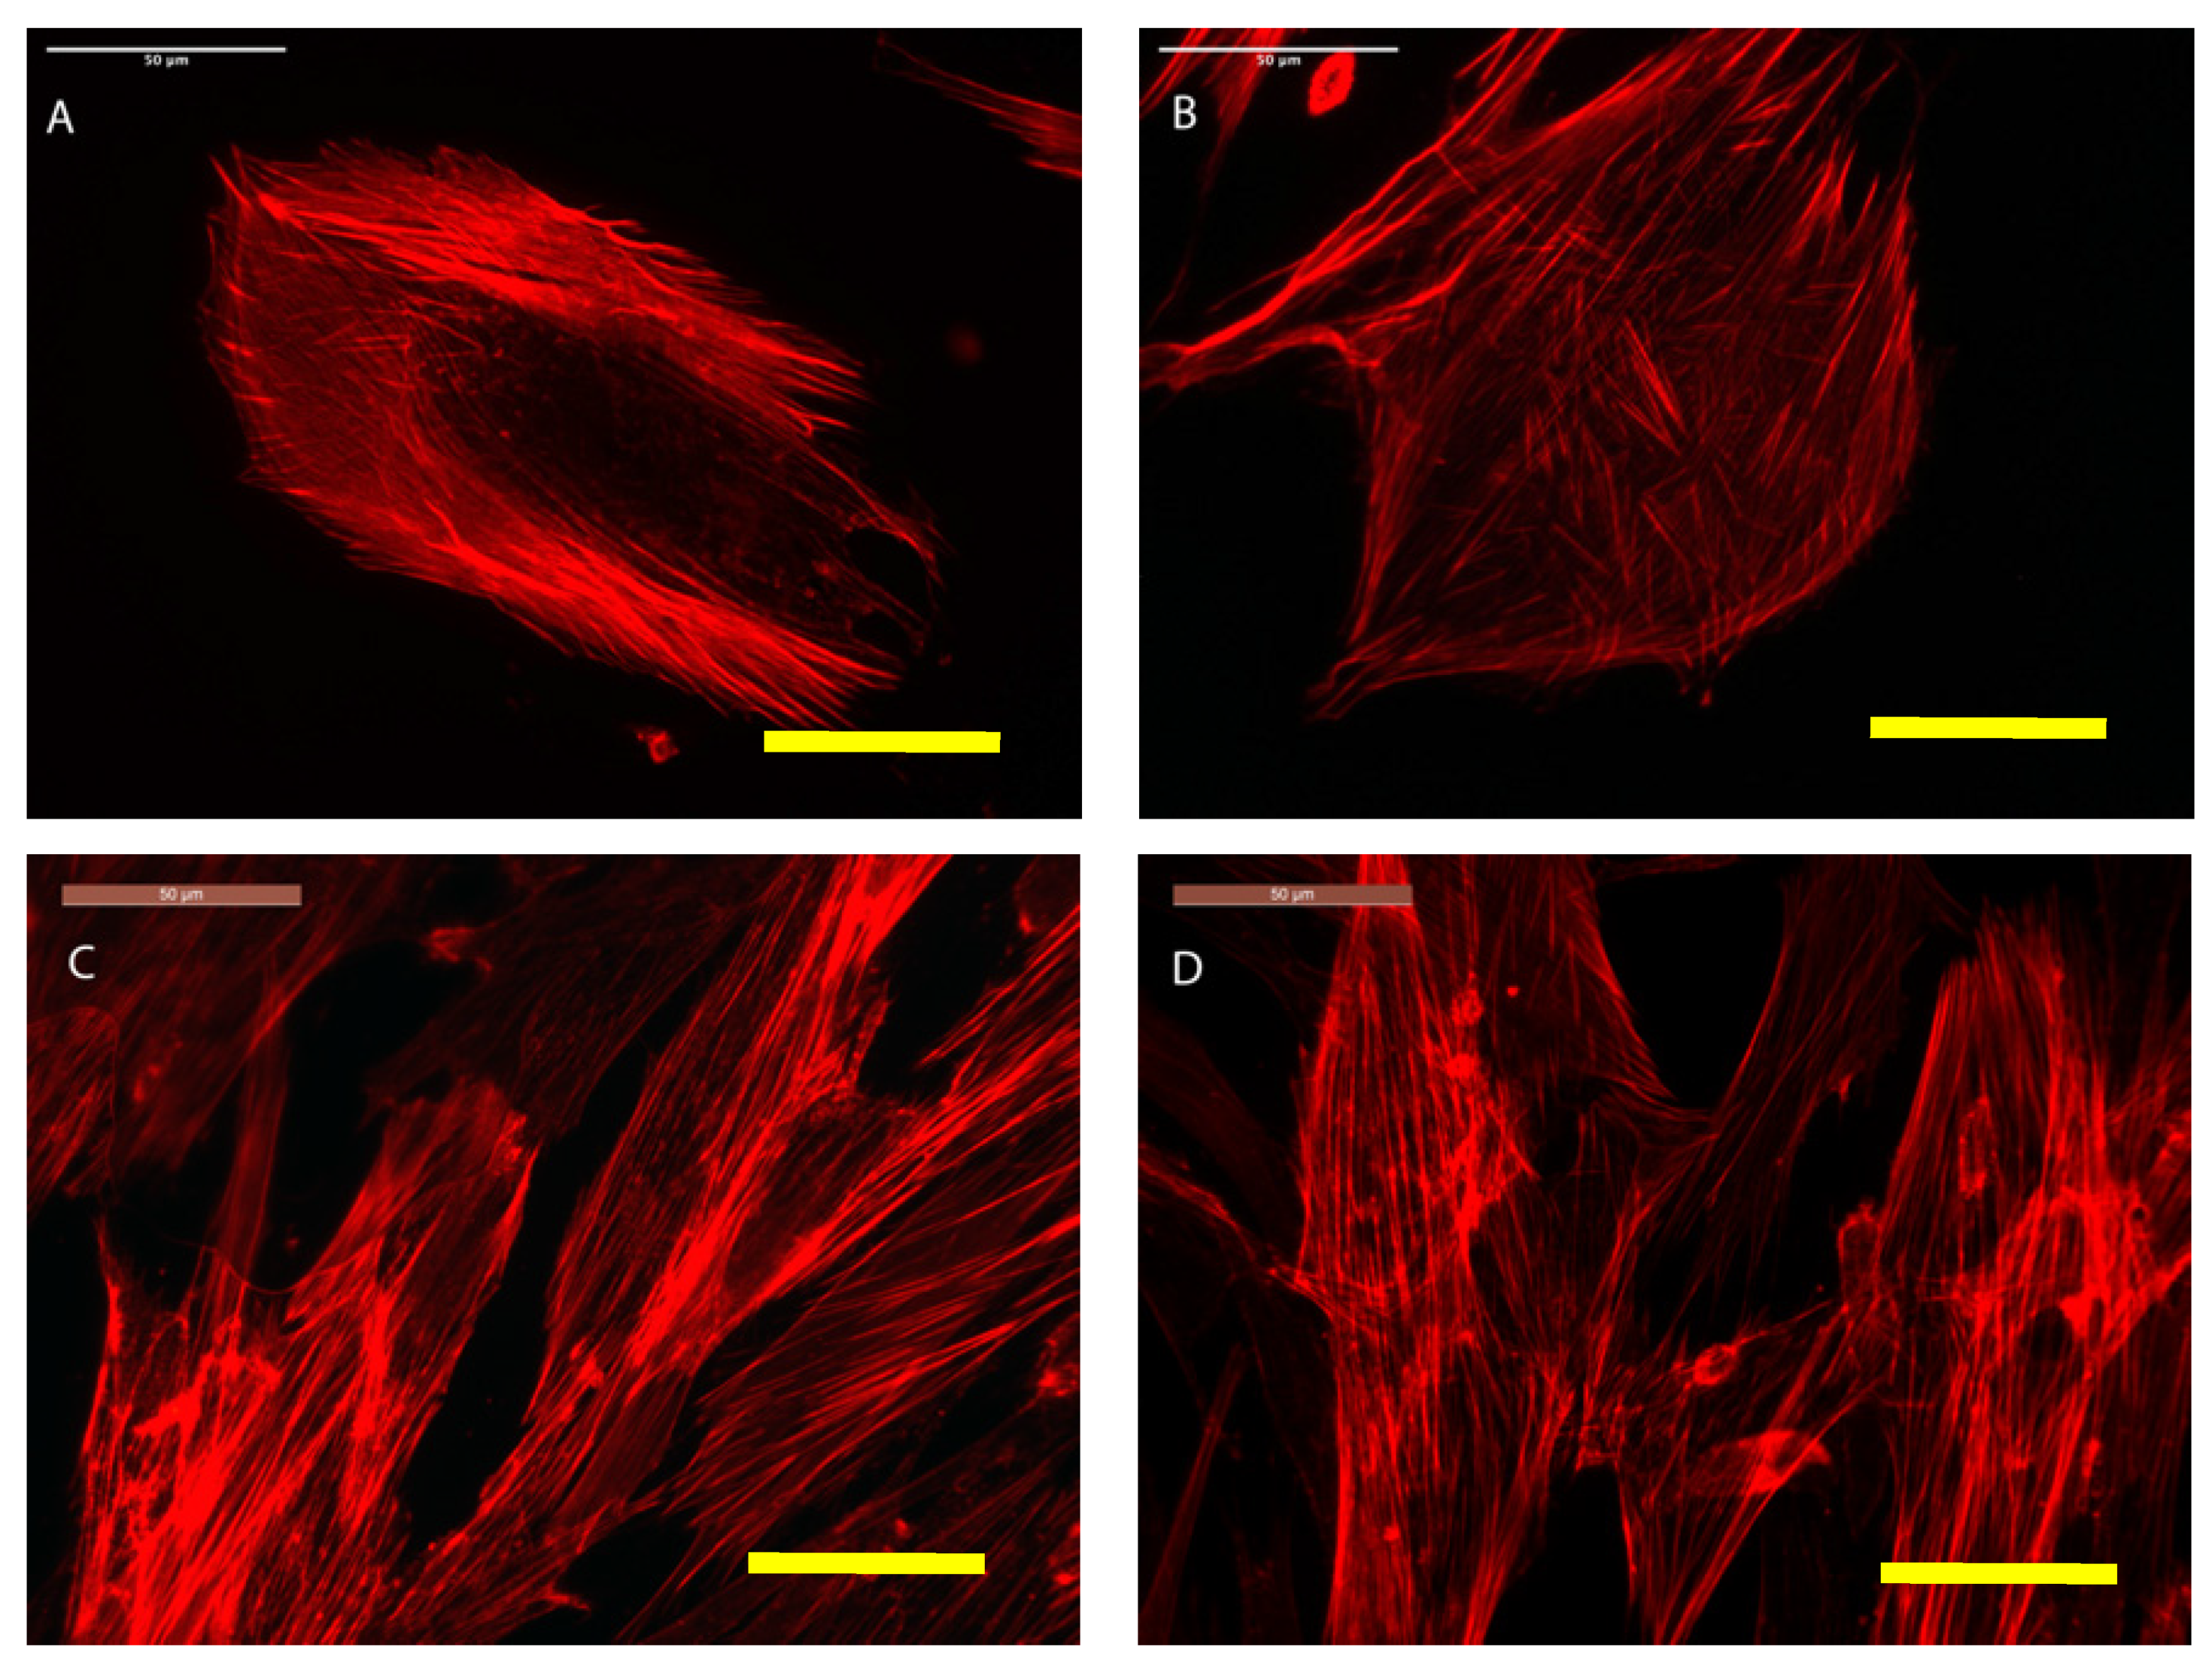
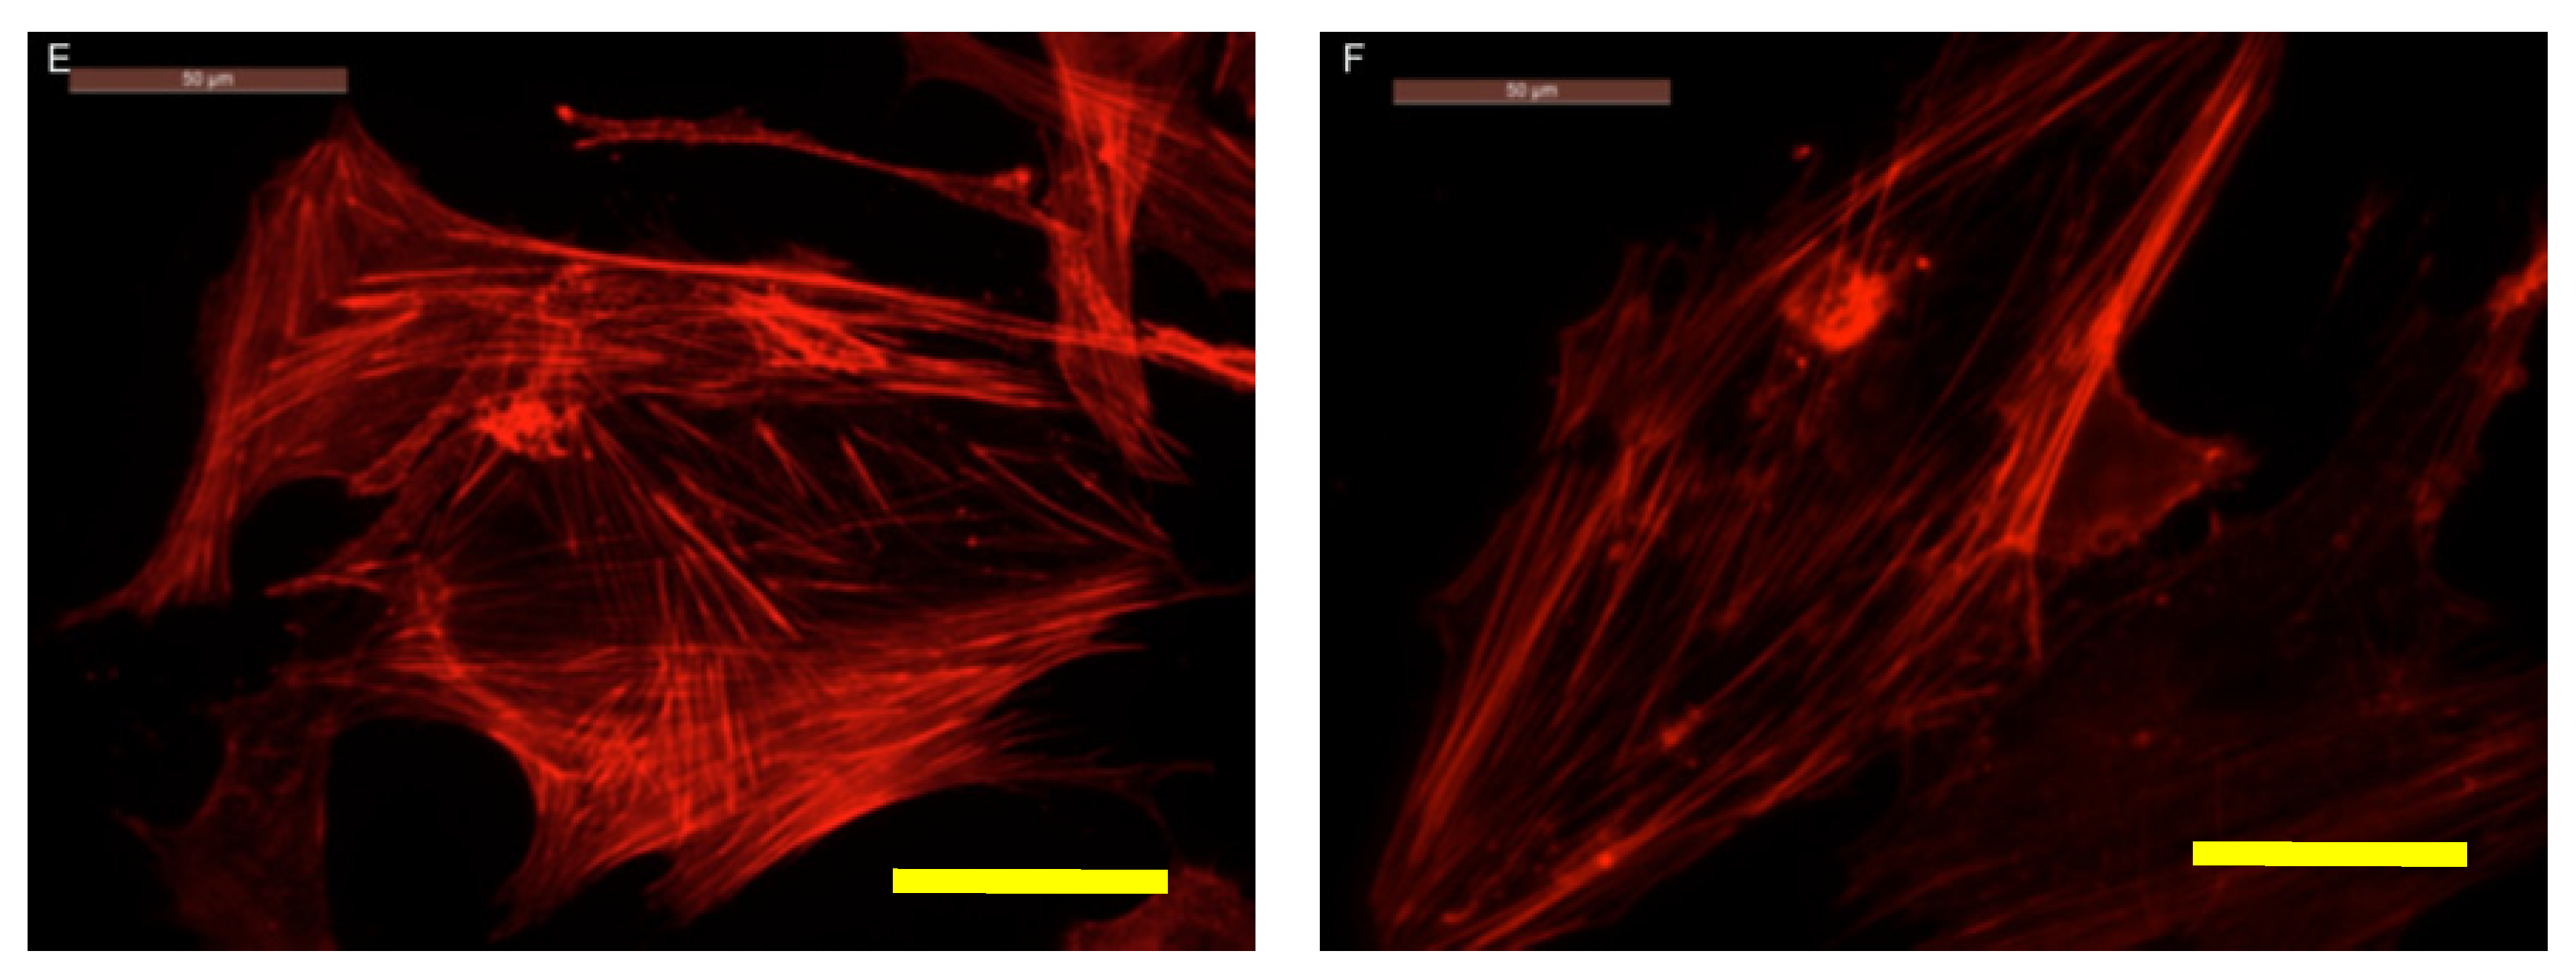
2.7.2. Actin Cytoskeletal Organization and Focal Adhesion Development
2.7.3. Confocal Examination
2.7.4. Image Analysis
3. Results and Discussion
3.1. Textural Characterization
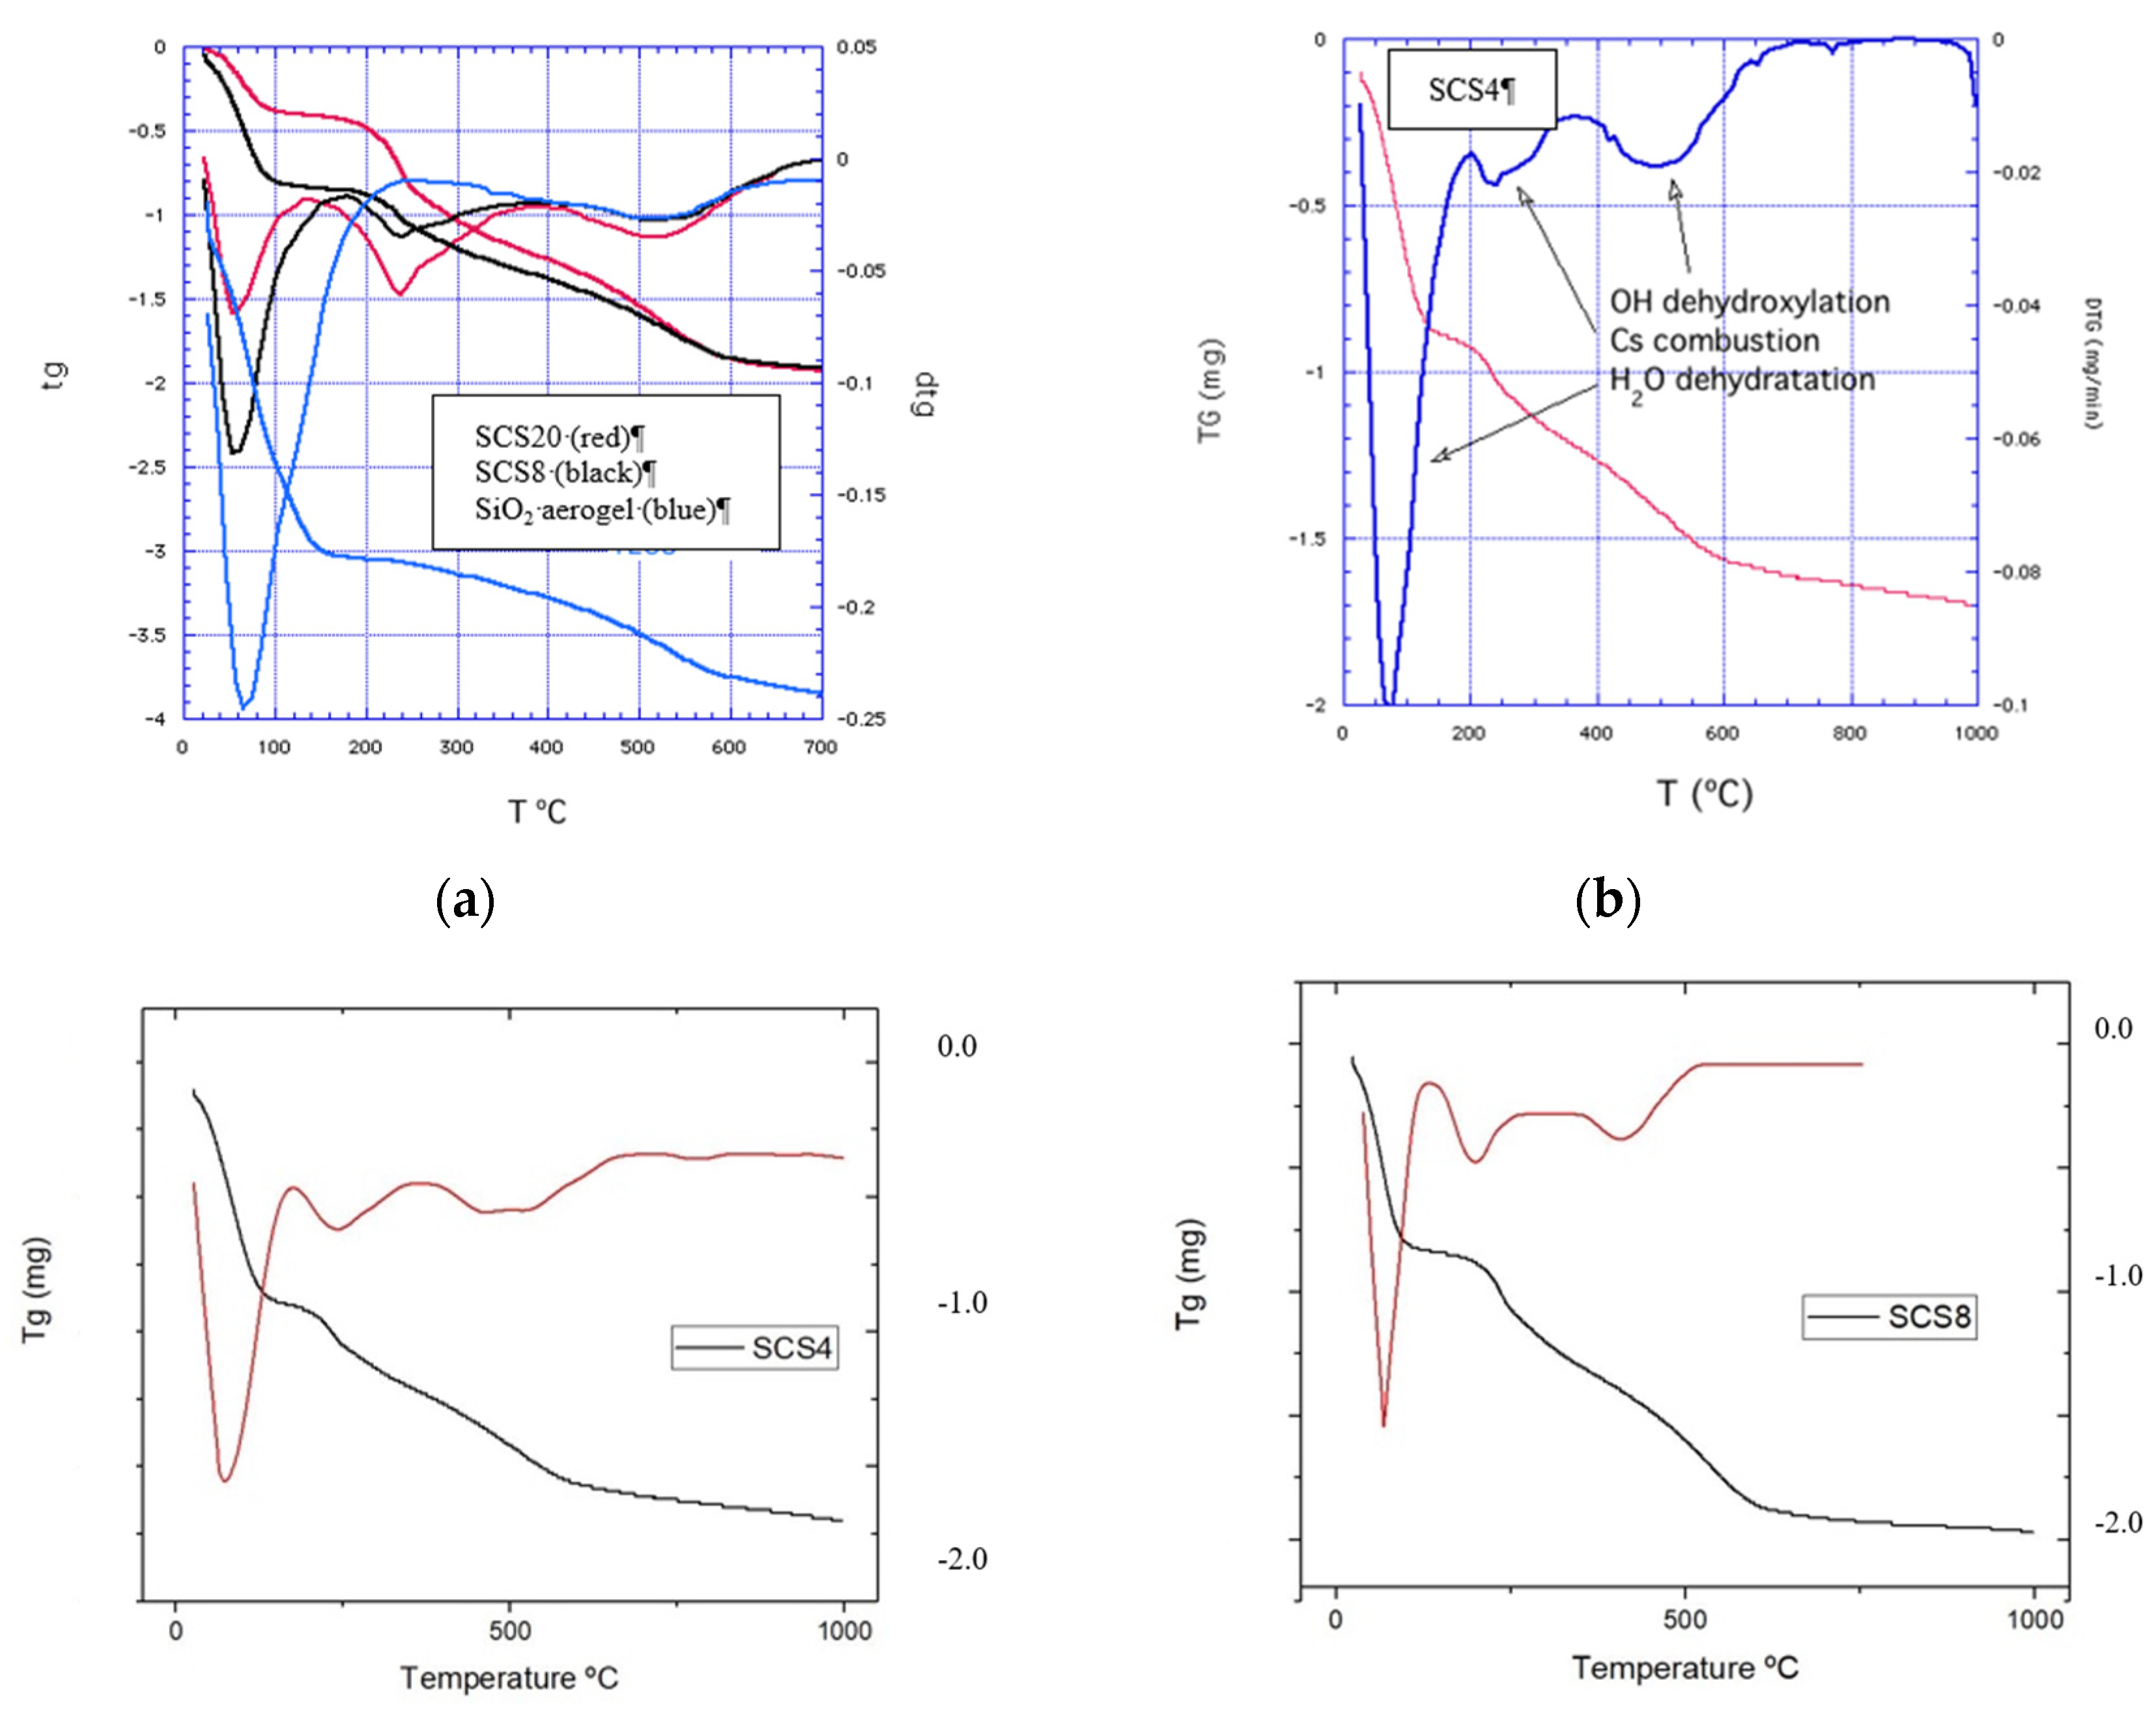
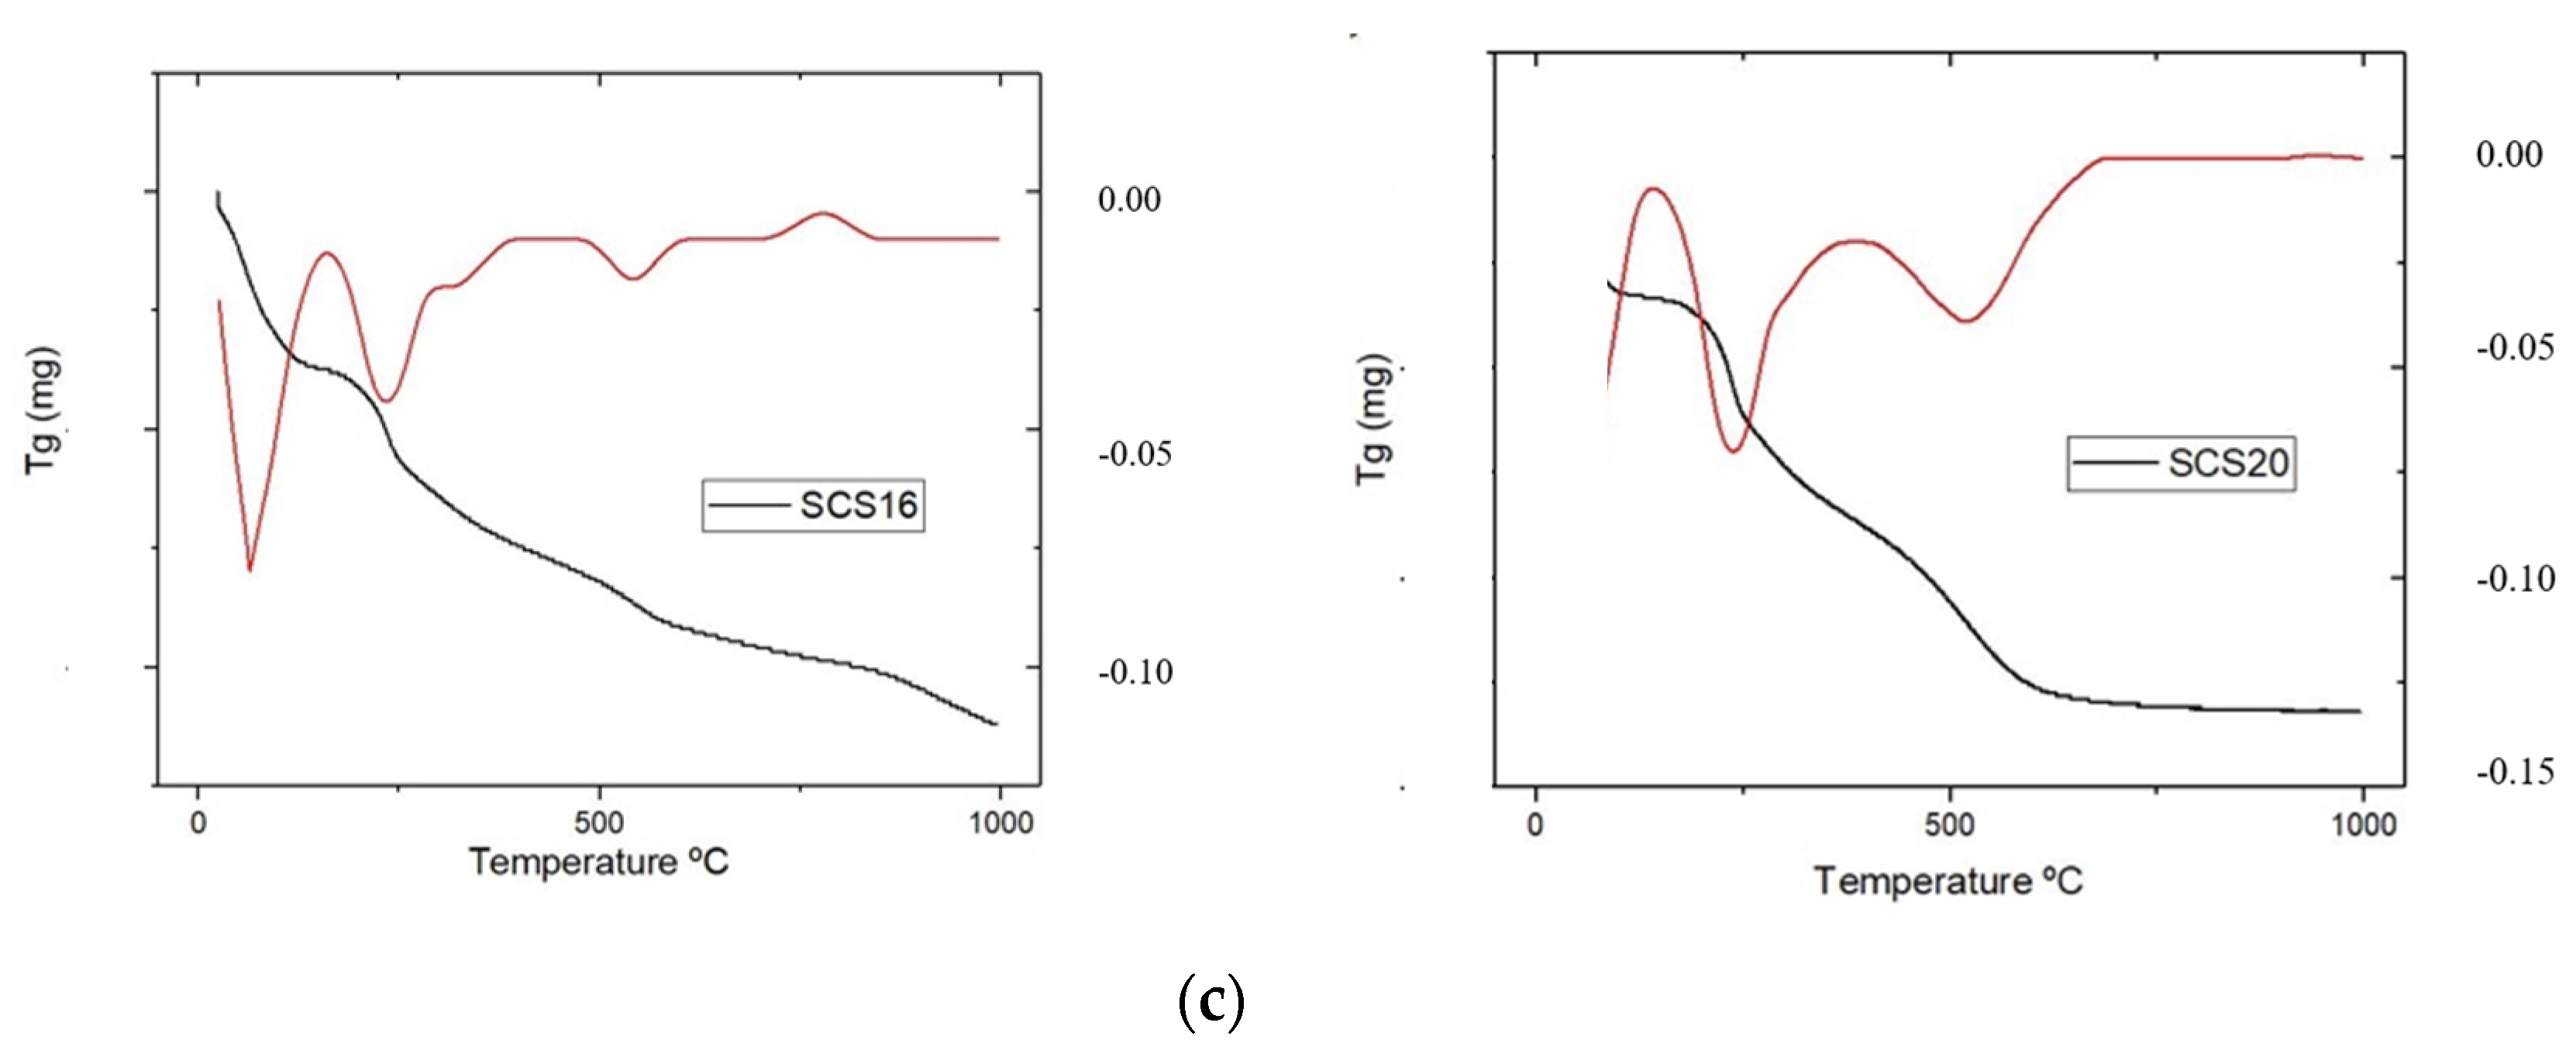
3.2. Thermal Analysis
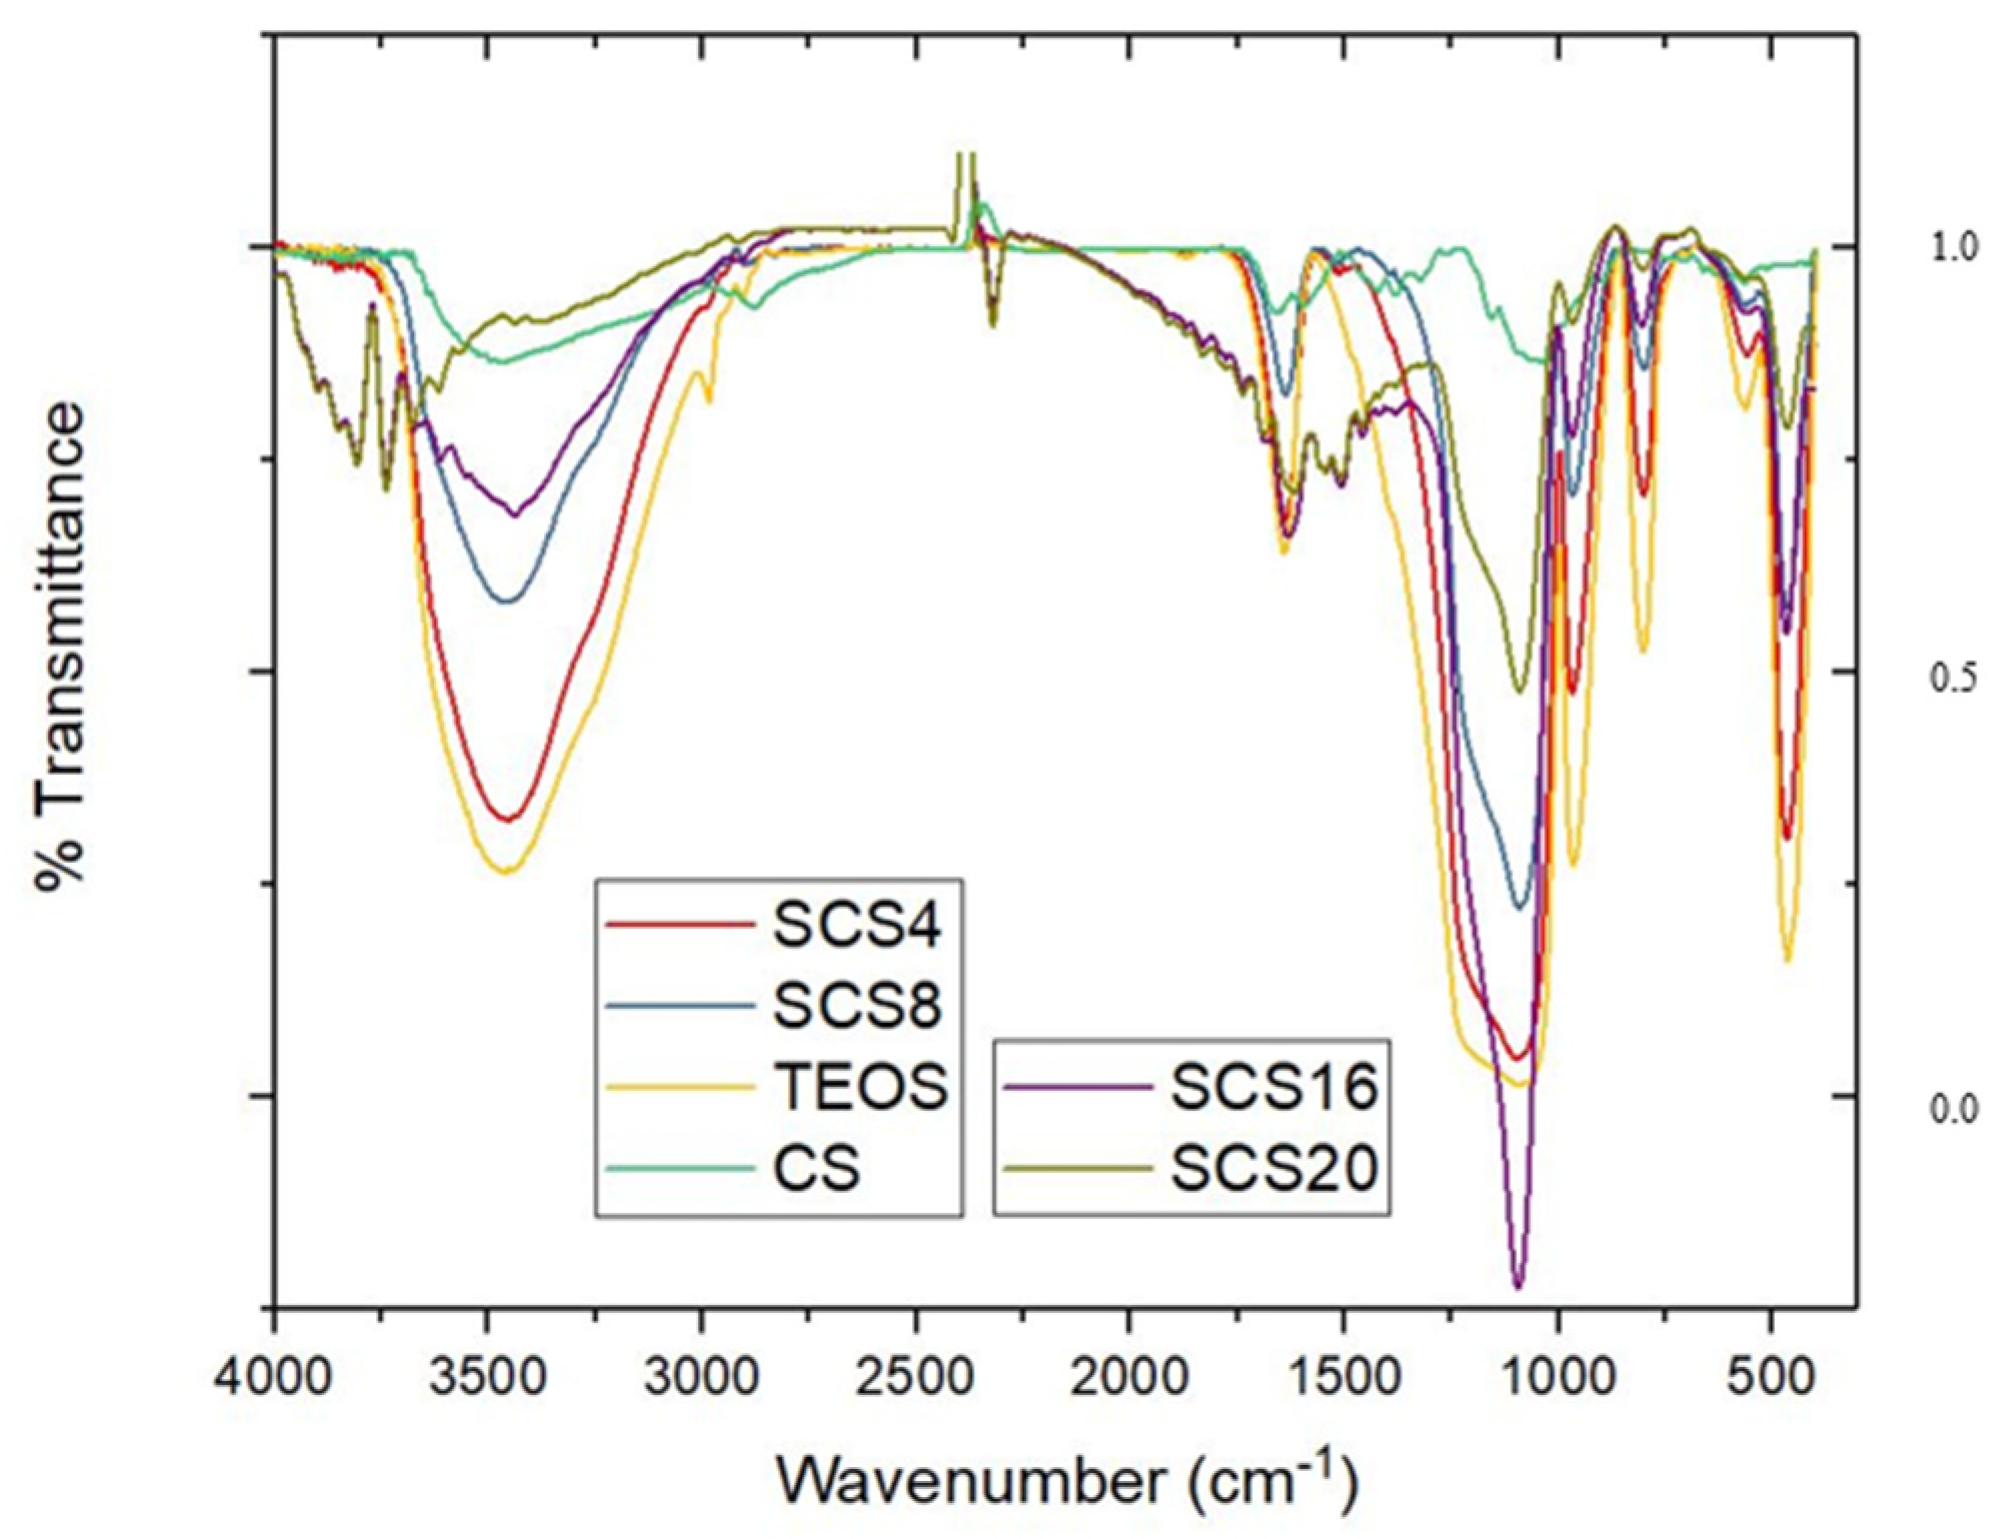
3.3. FTIR Spectra
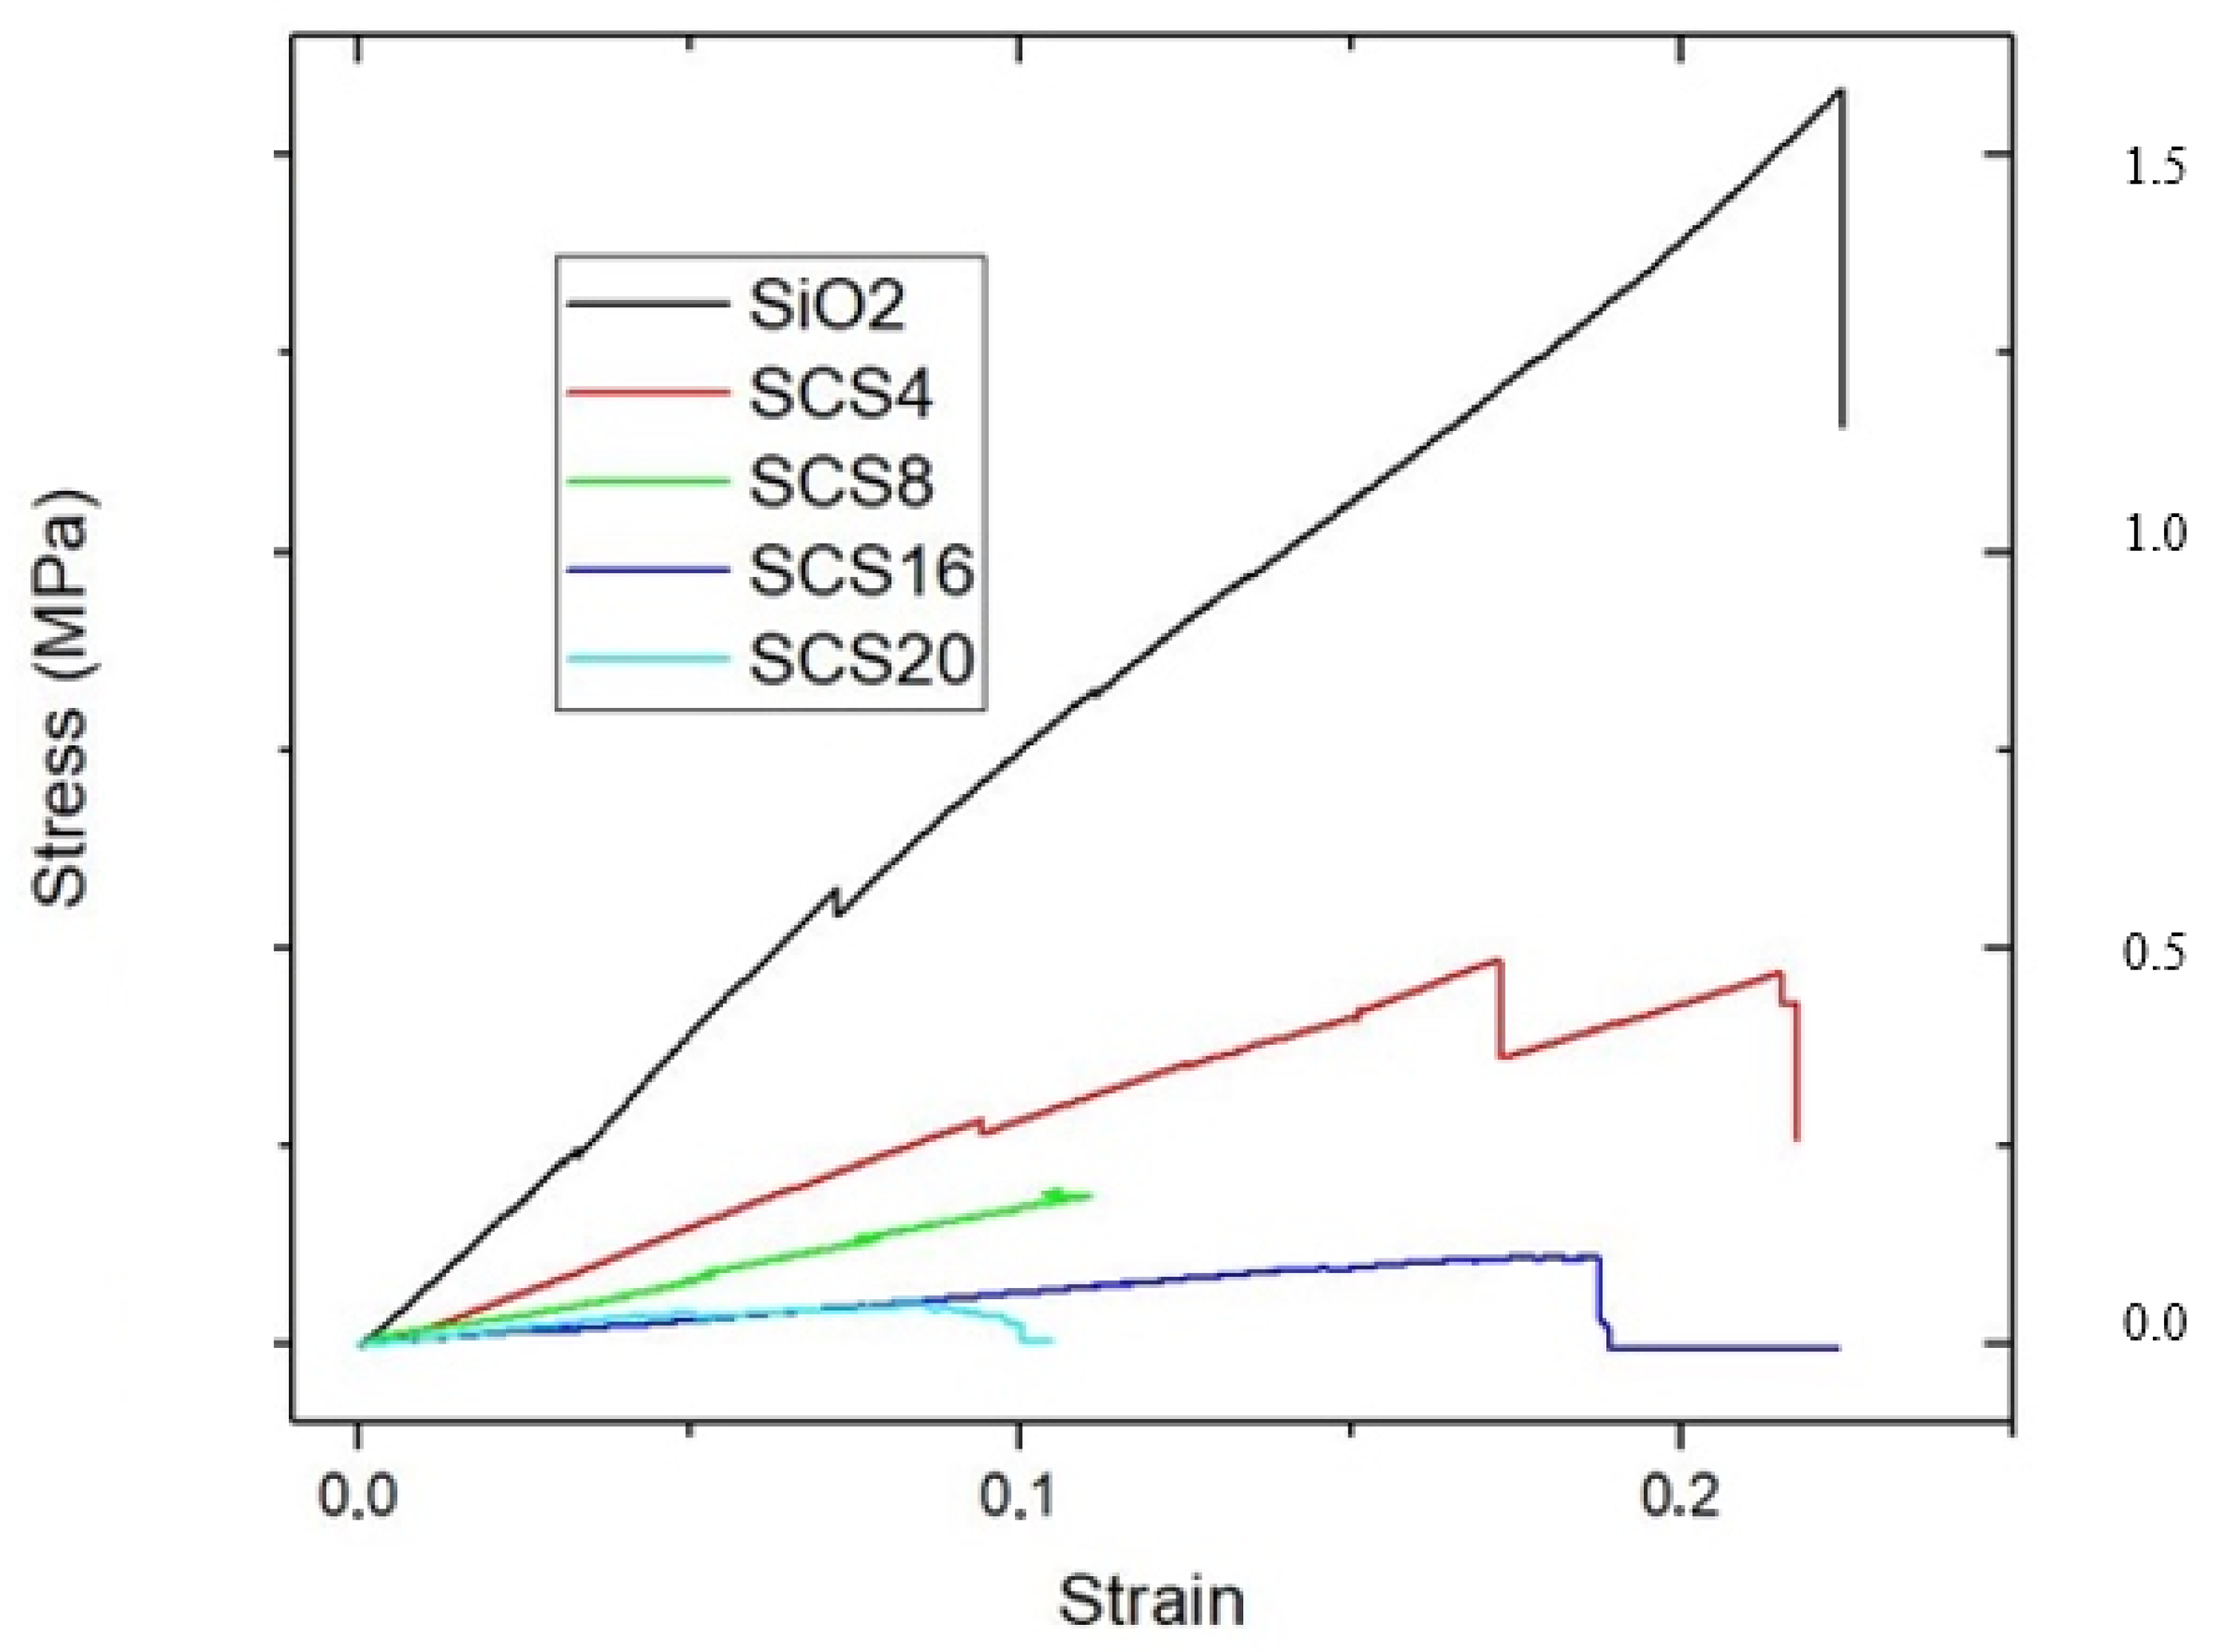
3.4. Mechanical Properties
3.5. Water Uptake
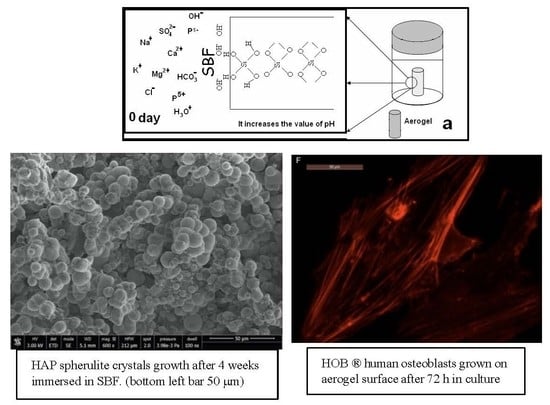
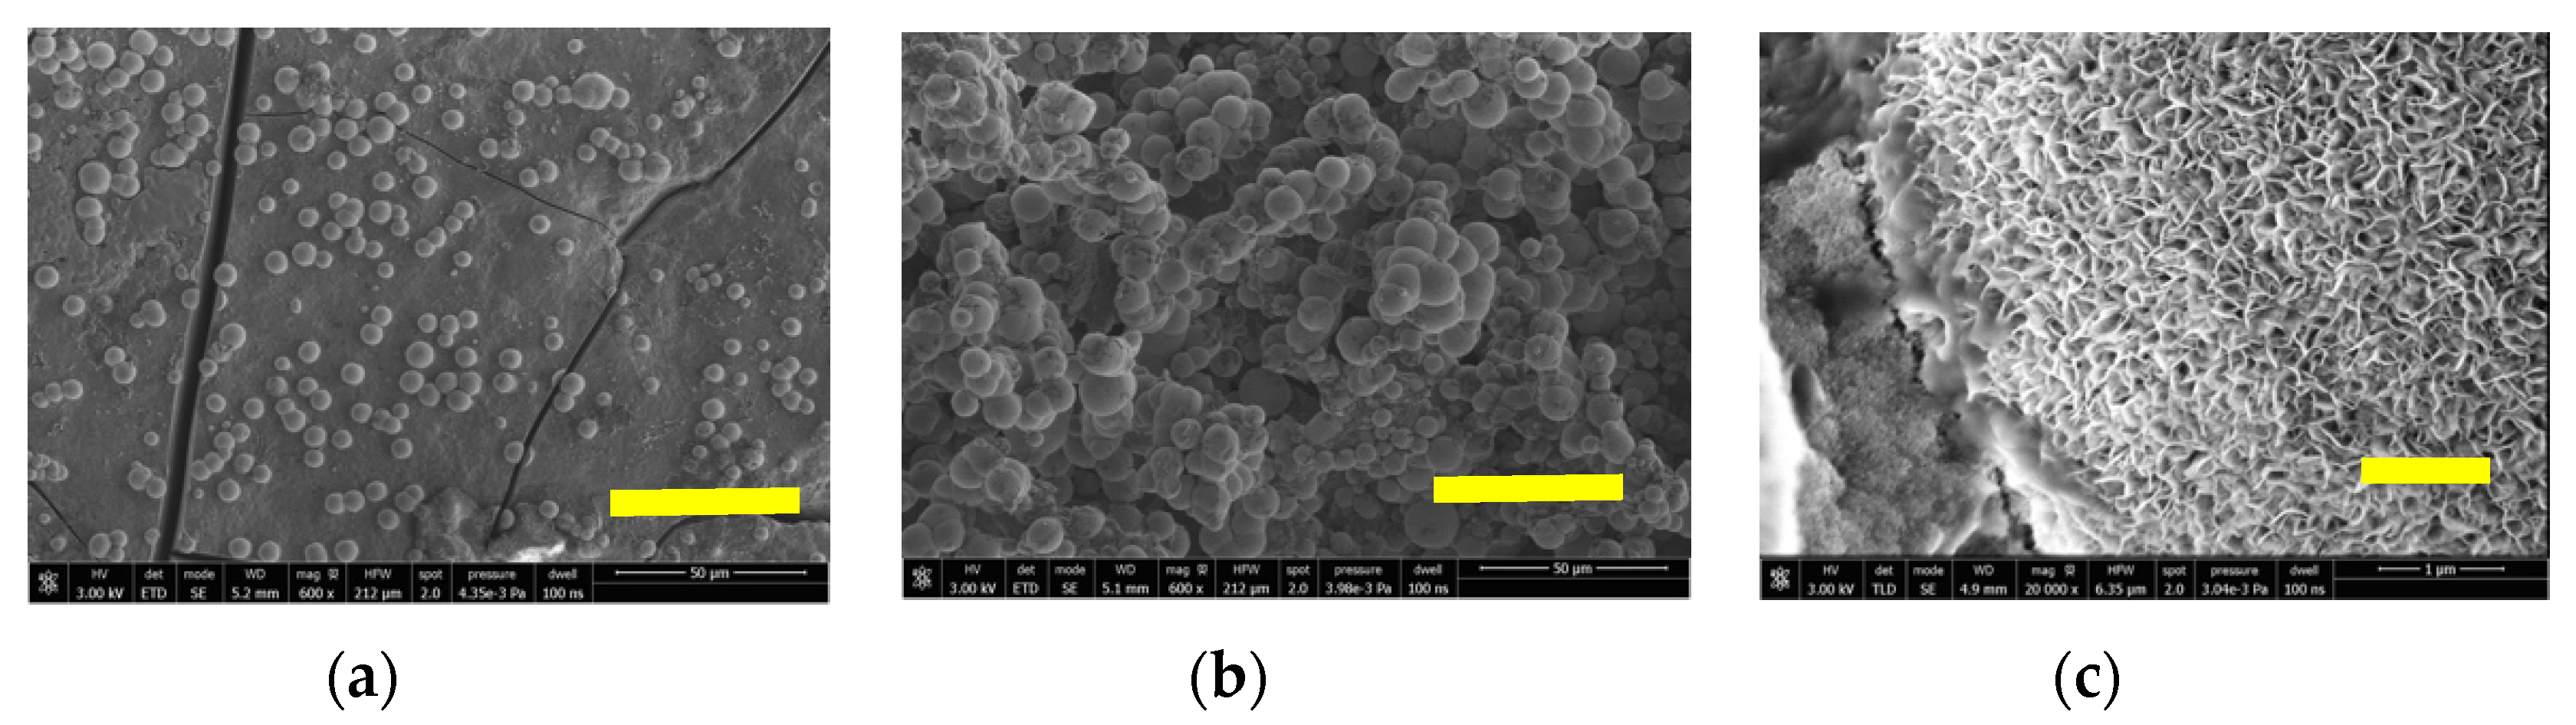
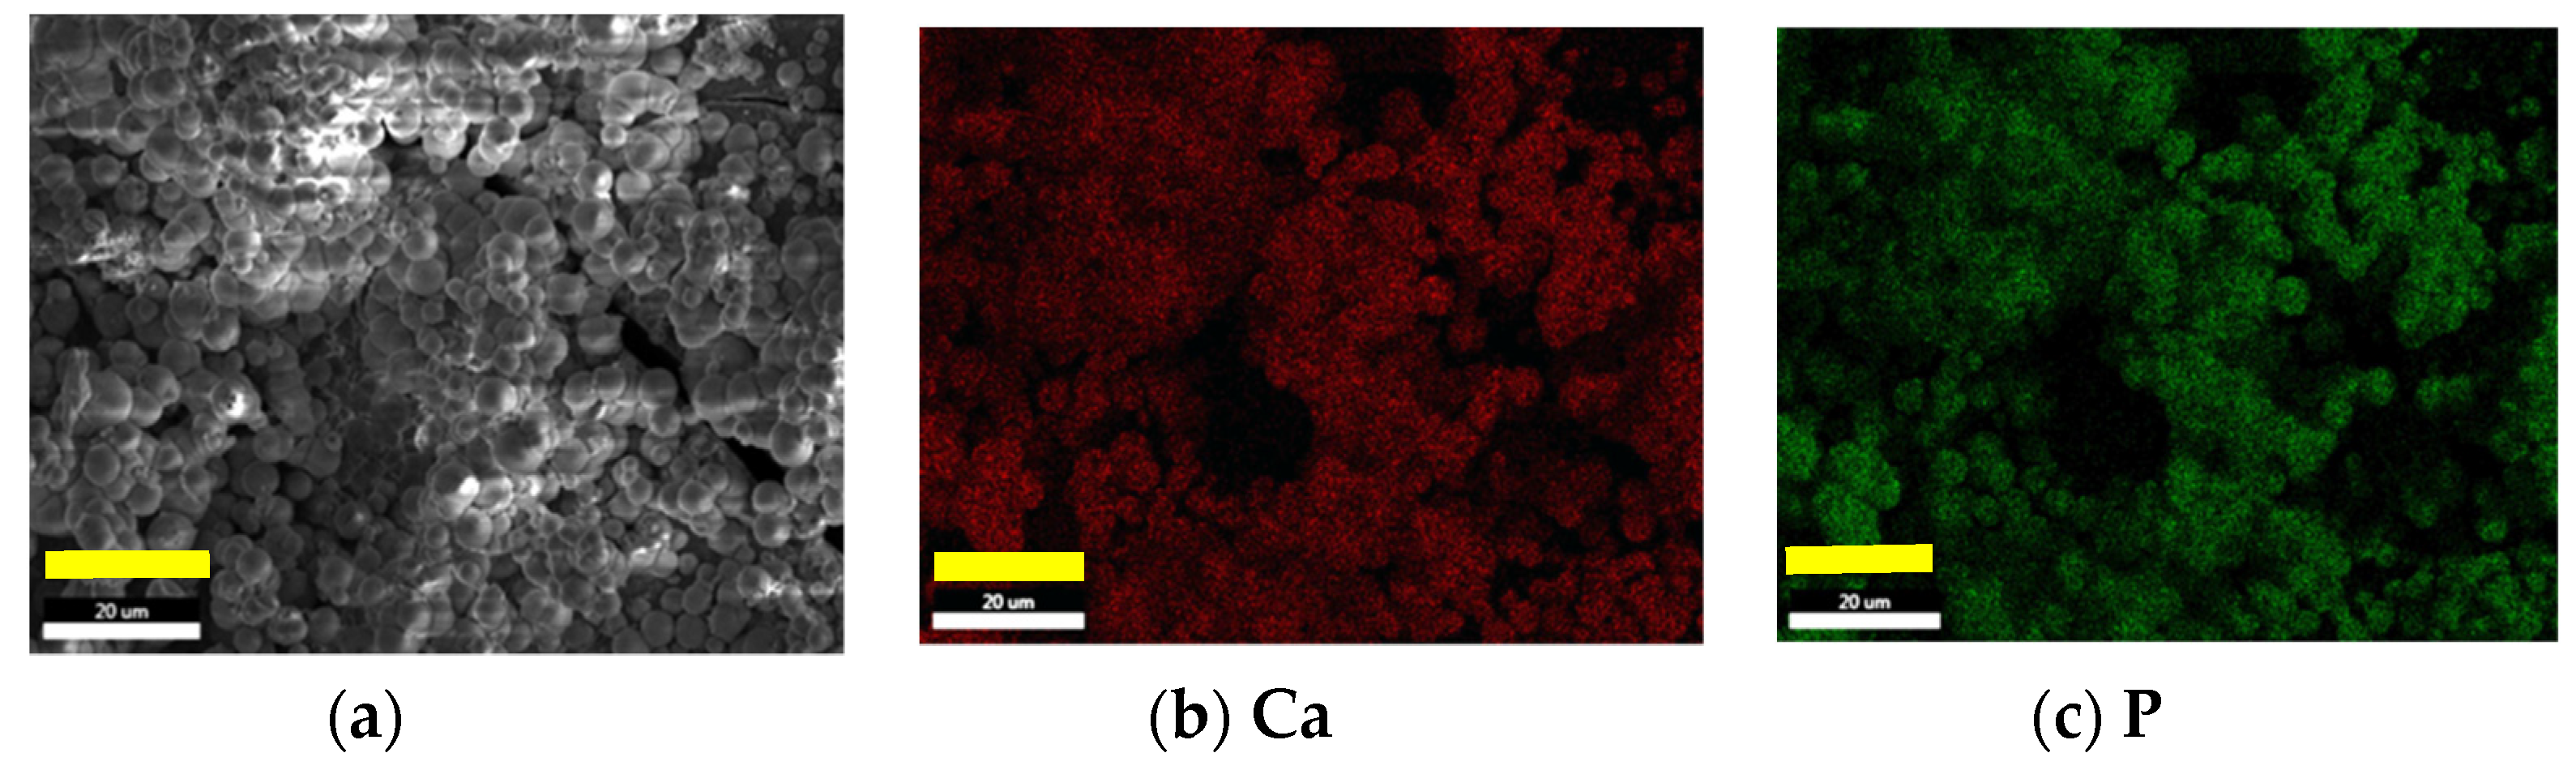
3.6. Bioactivity
3.7. Assessment of Osteoblast Behavior
4. Conclusions
Author Contributions
Funding
Acknowledgments
Conflicts of Interest
References
- Ward, B.B.; Brown, S.E.; Krebsbach, P.H. Bioengineering strategies for regeneration of craniofacial bone: A review of emerging technologies. Oral Dis. 2010, 16, 709–716. [Google Scholar] [CrossRef] [Green Version]
- Meyers, M.; Chawla, K. Mechanical Behavior of Materials, 2nd ed.; Cambridge University Press: Cambridge, UK, 2009. [Google Scholar]
- Bose, S.; Roy, M.; Bandyopadhyay, A. Recent advances in bone tissue engineering scaffolds. Trends Biotechnol. 2012, 30, 546–554. [Google Scholar] [CrossRef] [PubMed]
- Tevlin, R.; McArdle, A.; Atashroo, D.; Walmsley, G.; Senarath-Yapa, K.; Zielins, E.; Paik, K.; Longaker, M.; Wan, D.C. Biomaterials for Craniofacial Bone Engineering. J. Dent. Res. 2014, 93, 1187–1195. [Google Scholar] [CrossRef] [PubMed]
- Bencherif, S.; Braschler, T.; Renaud, P. Advences in the design of macroporous polymer scaffolds for petential applications in dentistry. J. Periodontal Implant. Sci. 2013, 43, 251–261. [Google Scholar] [CrossRef] [Green Version]
- Al-Sagheer, F.; Muslim, S. Thermal and mechanical properties of chitosan/SiO2 hybrid composites. J. Nanomater. 2009, 2010, 19. [Google Scholar]
- Ayers, M.; Hunt, A. Sysnthesis and properties of chitosan-silica hybrid aerogels. J. Non-Cryst. Solids 2001, 285, 123–127. [Google Scholar] [CrossRef] [Green Version]
- Budnyak, T.M.; Pylypchuk, I.V.; Tertykh, V.A.; Yanovska, E.S.; Kołodyńska, D. Synthesis and adsorption properties of chitosan-silica nanocomposite prepared by sol-gel method. Nanoscale Res. Lett. 2015, 10, 1–10. [Google Scholar] [CrossRef] [PubMed] [Green Version]
- Smitha, S.; Shajesh, P.; Mukundan, P.; Warrier, K.G.K. Sol-gel synthesis of biocompatible silica-chitosan hybrids and hydrophobic coatings. J. Mater. Res. 2008, 23, 2053–2060. [Google Scholar] [CrossRef]
- Brinker, C.J.; Scherer, G.W. Sol-Gel Science. Hydrolysis and Condensation II: Silicates; Academic Press: San Diego, CA, USA, 1990. [Google Scholar]
- Tarasevich, M. Ultrasonic hydrolysis of a metal alkoxide without alcohol solvents. Cer. Bull. 1984, 63, 500–502. [Google Scholar]
- Tarasevich, M. International Conference on Ultrastructure Processing o Ceramics, Glasses and Composites. Palm Coast; UCLA Department of Materials Science and Engineering: Los Angeles, CA, USA, 1985. [Google Scholar]
- Zarzycki, J.S. Heterogeneous Chemistry Reviews; John Wiley & Sons Ltd. Baffins: Hoboken, NJ, USA, 1994; Volume 1, pp. 243–253. [Google Scholar]
- Blanco, L.E.; Esquivias, R.; Litran, M.; Piñero, M. Ramírez-del-Solar, and N. de la Rosa-Fox, Sonogels and Derived Materials. Appl. Organomet. Chem. 1999, 13, 399. [Google Scholar] [CrossRef] [Green Version]
- Kistler, S.S. Coherent Expanded Aerogel. J. Phys. Chem. 1932, 36, 52. [Google Scholar] [CrossRef]
- Levengood, S.K.L.; Zhang, M. Chitosan-based scaffolds for bone tissue engineering. J. Mater. Chem. B 2014, 2, 3161–3184. [Google Scholar] [CrossRef] [PubMed]
- Lee, E.J.; Kasper, F.K.; Mikos, A. Biomaterials for Tissue Engineering. Ann. Biomed. Eng. 2014, 42, 323–337. [Google Scholar] [CrossRef] [PubMed] [Green Version]
- Hench, L.L. The story of Bioglass. J. Mater Sci. Mater Med. 2006, 17, 967–978. [Google Scholar] [CrossRef] [PubMed]
- Vallet-Regí, M. Ceramics for medical applications. J. Chem. Soc. Dalton Trans. 2001, 97–108. [Google Scholar] [CrossRef]
- Polo-Corrales, L.; Latorre-Esteves, M.; Ramírez-Vick, J. Scaffold design for bone regeneration. J. Nanosci. Nanotechnol. 2014, 14, 15–56. [Google Scholar] [CrossRef] [Green Version]
- Shadjou, N.; Hasanzadeh, M. Bone tissue engineering using silica-based mesoporous nanobiomaterials: Recent progress. Mater. Sci. Eng. C 2015, 55, 401–409. [Google Scholar] [CrossRef]
- Meng, H.; Xue, M.; Xia, T.; Ji, Z.; Tarn, D.Y.; Zink, J.I.; Nel, A.E. Use of Size and a Copolymer Design Feature to Improve the Biodistribution and the Enhanced Permeability and Retention Effect of Doxorubicin-Loaded Mesoporous Silica Nanoparticles in a Murine Xenograft Tumor Model. ACS Nano 2011, 5, 4131–4144. [Google Scholar] [CrossRef] [Green Version]
- Lin, Y.-S.; Haynes, C.L. Synthesis and Characterization of Biocompatible and Size-Tunable Multifunctional Porous Silica Nanoparticles. Chem. Mater. 2009, 21, 3979–3986. [Google Scholar] [CrossRef]
- He, X.; Nie, H.; Wang, K.; Tan, W.; Wu, X.; Zhang, P. In Vivo Study of Biodistribution and Urinary Excretion of Surface-Modified Silica Nanoparticles. Anal. Chem. 2008, 80, 9597–9603. [Google Scholar] [CrossRef]
- Costa-Pinto, A.R.; Reis, R.L.; Neves, N.M. Scaffolds Based Bone Tissue Engineering: The Role of Chitosan. Tissue Eng. Part B Rev. 2011, 17, 331–347. [Google Scholar] [CrossRef] [PubMed] [Green Version]
- Kokubo, T.; Takadama, H. How useful is SBF in predicting in vivo bone bioactivity? Biomaterials 2006, 27, 2907–2915. [Google Scholar] [CrossRef] [PubMed]
- Iler, R.K. The Chemistry of Silica: Solubility, Polymerization, Colloid and Surface Properties, and Biochemistry; Wiley: New York, NY, USA, 1979. [Google Scholar]
- Zhuravlev, L.T. The surface chemistry of amorphous silica. Zhuravlev model. Colloids Surf. 2000, 173, 1–38. [Google Scholar] [CrossRef] [Green Version]
- Kim, J.M.; Chang, S.M.; Kong, S.M.; Kim, K.-S.; Kim, J.; Kim, W.-S. Control of hydroxyl group content in silica particle synthesized by the sol-precipitation process. Ceram. Int. 2009, 35, 1015–1019. [Google Scholar] [CrossRef]
- Ek, S. Determination of the hydroxyl group content in silica by thermogravimetry and a comparison with 1H MAS NMR results. Thermochim. Acta 2001, 379, 201–212. [Google Scholar] [CrossRef]
- Dong, Y.; Liang, J.; Cui, Y.; Xu, S.; Zhao, N. Fabrication of novel bioactive hydroxyapatite-chitosan-silica hybrid scaffolds: Combined the sol-gel method with 3D plotting technique. Carbohydr. Polym. 2018, 197, 183–193. [Google Scholar] [CrossRef]
- Ruiz-Clavijo, A.; Hurt, A.P.; Kotha, A.K.; Coleman, N.J. Effect of Calcium Precursor on the Bioactivity and Biocompatibility of Sol-Gel-Derived Glasses. J. Funct. Biomater. 2019, 10, 13. [Google Scholar] [CrossRef] [Green Version]
- Liang, J.-N.; Yan, L.; Dong, Y.-F.; Liu, X.; Wu, G.; Zhao, N. Robust and nanostructured chitosan–silica hybrids for bone repair application. J. Mater. Chem. B 2020, 8, 5042–5051. [Google Scholar] [CrossRef]
- Niu, N.; Teng, S.-H.; Zhou, H.-J.; Qian, H. Synthesis, Characterization, and In Vitro Drug Delivery of Chitosan-Silica Hybrid Microspheres for Bone Tissue Engineering. J. Nanomater. 2019, 2019, 1–7. [Google Scholar] [CrossRef] [Green Version]
- Bačáková, L.; Filová, E.; Rypáček, F.; Švorčík, V.; Starý, V. Cell Adhesion on Artificial Materials for Tissue Engineering. Physiol. Res. 2004, 53, S35–S45. [Google Scholar]
- Bittig, A.T.; Matschegewski, C.; Nebe, J.B.; Staehlke, S.; Uhrmacher, A.M. Membrane related dynamics and the formation of actin in cells growing on micro-topographies: A spatial computational model. BMC Syst. Biol. 2014, 8, 106. [Google Scholar] [CrossRef] [PubMed] [Green Version]
- Terriza, A.; Vilches-Pérez, J.I.; González-Caballero, J.L.; De La Orden, E.; Yubero, F.; Barranco, A.; González-Elipe, A.; Vilches, J.; Salido, M. Osteoblasts Interaction with PLGA Membranes Functionalized with Titanium Film Nanolayer by PECVD. In vitro Assessment of Surface Influence on Cell Adhesion during Initial Cell to Material Interaction. Materials 2014, 7, 1687–1708. [Google Scholar] [CrossRef] [PubMed] [Green Version]
- Coyer, S.R.; Singh, A.; Dumbauld, D.W.; Calderwood, D.A.; Craig, S.W.; Delamarche, E.; García, A.J. Nanopatterning reveals an ECM area threshold for focal adhesion assembly and force transmission that is regulated by integrin activation and cytoskeleton tension. J. Cell Sci. 2012, 125, 5110–5123. [Google Scholar] [CrossRef] [PubMed] [Green Version]
- Stricker, J.; Aratyn-Schaus, Y.; Oakes, P.W.; Gardel, M.L. Spatiotemporal Constraints on the Force-Dependent Growth of Focal Adhesions. Biophys. J. 2011, 100, 2883–2893. [Google Scholar] [CrossRef] [PubMed] [Green Version]
- Mullen, C.A.; Vaughan, T.J.; Voisin, M.C.; Brennan, M.A.; Layrolle, P.; McNamara, L.M. Cell morphology and focal adhesion location alters internal cell stress. J. R. Soc. Interface 2014, 11, 20140885. [Google Scholar] [CrossRef] [PubMed]
- Lamers, E.; Van Horssen, R.; Riet, J.T.; Van Delft, F.C.; Luttge, R.; Walboomers, X.F.; Jansen, J.A. The influence of nanoscale topographical cues on initial osteoblast morphology and migration. Eur. Cells Mater. 2010, 20, 329–343. [Google Scholar] [CrossRef]
- Elosegui-Artola, A.; Jorge-Penas, A.; Moreno-Arotzena, O.; Oregi, A.; Lasa, M.; García-Aznar, J.M.; De-Juan-Pardo, E.M.; Aldabe, R. Image Analysis for the Quantitative Comparison of Stress Fibers and Focal Adhesions. PLoS ONE 2014, 9, e107393. [Google Scholar] [CrossRef] [Green Version]
- Tojkander, S.; Gateva, G.; Lappalainen, P. Actin stress fibers–assembly, dynamics and biological roles. J. Cell Sci. 2012, 125, 1855–1864. [Google Scholar] [CrossRef] [Green Version]
- McNamara, L.E.; Sjöström, T.; Burgess‡, K.; Kim, J.J.; Liu, E.; Gordonov, S.; Moghe, P.V.; Meek, R.D.; Oreffo, R.; Su, B.; et al. Skeletal stem cell physiology on functionally distinct titania nanotopographies. Biomaterials 2011, 32, 7403–7410. [Google Scholar] [CrossRef]
- Parsons, J.T.; Horwitz, A.R.; Schwartz, M.A. Cell adhesion: Integrating cytoskeletal dynamics and cellular tension. Nat. Rev. Mol. Cell Biol. 2010, 11, 633–643. [Google Scholar] [CrossRef]
- Gardel, M.L.; Schneider, I.C.; Aratyn-Schaus, Y.; Waterman, C.M. Mechanical Integration of Actin and Adhesion Dynamics in Cell Migration. Annu. Rev. Cell Dev. Biol. 2010, 26, 315–333. [Google Scholar] [CrossRef] [PubMed] [Green Version]
- Biggs, M.J.; Richards, R.G.; Dalby, M.J. Nanotopographical modification: A regulator of cellular function through focal adhesions. Nanomed. Nanotechnol. Biol. Med. 2010, 6, 619–633. [Google Scholar] [CrossRef] [PubMed] [Green Version]
- Zimerman, B.; Arnold, M.; Ulmer, J.; Blümmel, J.; Besser, A.; Spatz, J.P.; Geiger, B. Formation of focal adhesion-stress fiber complexes coordinated by adhesive and non-adhesive surface domains. IEEE Proc. Nanobiotech. 2004, 151, 62–66. [Google Scholar] [CrossRef] [PubMed]
- Maggi, A.; Li, H.; Greer, J.R. Three-dimensional nano-architected scaffolds with tunable stiffness for efficient bone tissue growth. Acta Biomater. 2017, 63, 294–305. [Google Scholar] [CrossRef] [Green Version]
- Ciobanasu, C.; Faivre, B.; Le Clainche, C. Integrating actin dynamics, mechanotransduction and integrin activation: The multiple functions of actin binding proteins in focal adhesions. Eur. J. Cell Biol. 2013, 92, 339–348. [Google Scholar] [CrossRef]
- Matschegewski, C.; Birkholz, H.; Staehlke, S.; Loeffler, R.; Kern, D.P.; Engel, K.; Nebe, B.; Nebe, J.B. Quantitative Analysis of the Cellular Actin Cytoskeleton on Geometrically Designed Surface Topography. Mater. Sci. Forum 2012, 706, 543–548. [Google Scholar] [CrossRef]


| Aerogels | Real CS% | S (BET) m2/g | ρ (g/cm3) | Vp (cm3/g) | Pore Size (nm) |
|---|---|---|---|---|---|
| SiO2 aerogel | 0 | 994 | 0.176 ± 0.011 | 3.195 | 12.854 |
| SCS4 | 1.67 ± 0.03 | 1072 | 0.199 ± 0.009 | 3.742 | 13.950 |
| SCS8 | 6.53 ± 0.04 | 1047 | 0.161 ± 0.033 | 2.936 | 11.211 |
| SCS16 | no data | 840 | 0.136 ± 0.003 | 2.964 | 14.108 |
| SCS20 | 10.29 ± 0.02 | 786 | 0.144 ± 0.007 | 2.401 | 12.213 |
| Aerogel (CS) | SBET (m2g−1) | OH nm−2 (400–700 °C) | OH nm−2 Geminal and Vicinal (25–190 °C) |
|---|---|---|---|
| SiO2 aerogel | 994 | 5.12 | 13.86 |
| SCS4 | 1072 | 1.81 | 4.74 |
| SCS8 | 1048 | 3.26 | 4.78 |
| SCS16 | 840 | 2.39 | 3.98 |
| SCS20 | 786 | 5.45 | 3.48 |
| Aerogel | Young’s Modulus (MPa) |
|---|---|
| SiO2 aerogel | 11.57 ± 3.84 |
| SCS4 | 2.61 ± 0.56 |
| SCS8 | 0.95 ± 0.13 |
| SCS16 | 0.66 ± 0.01 |
| SCS20 | 0.72 ± 0.16 |
| Time in SBF | SCS8 |
|---|---|
| 1 week | 0.48 |
| 2 weeks | 1.57 |
| 4 weeks | 1.99 |
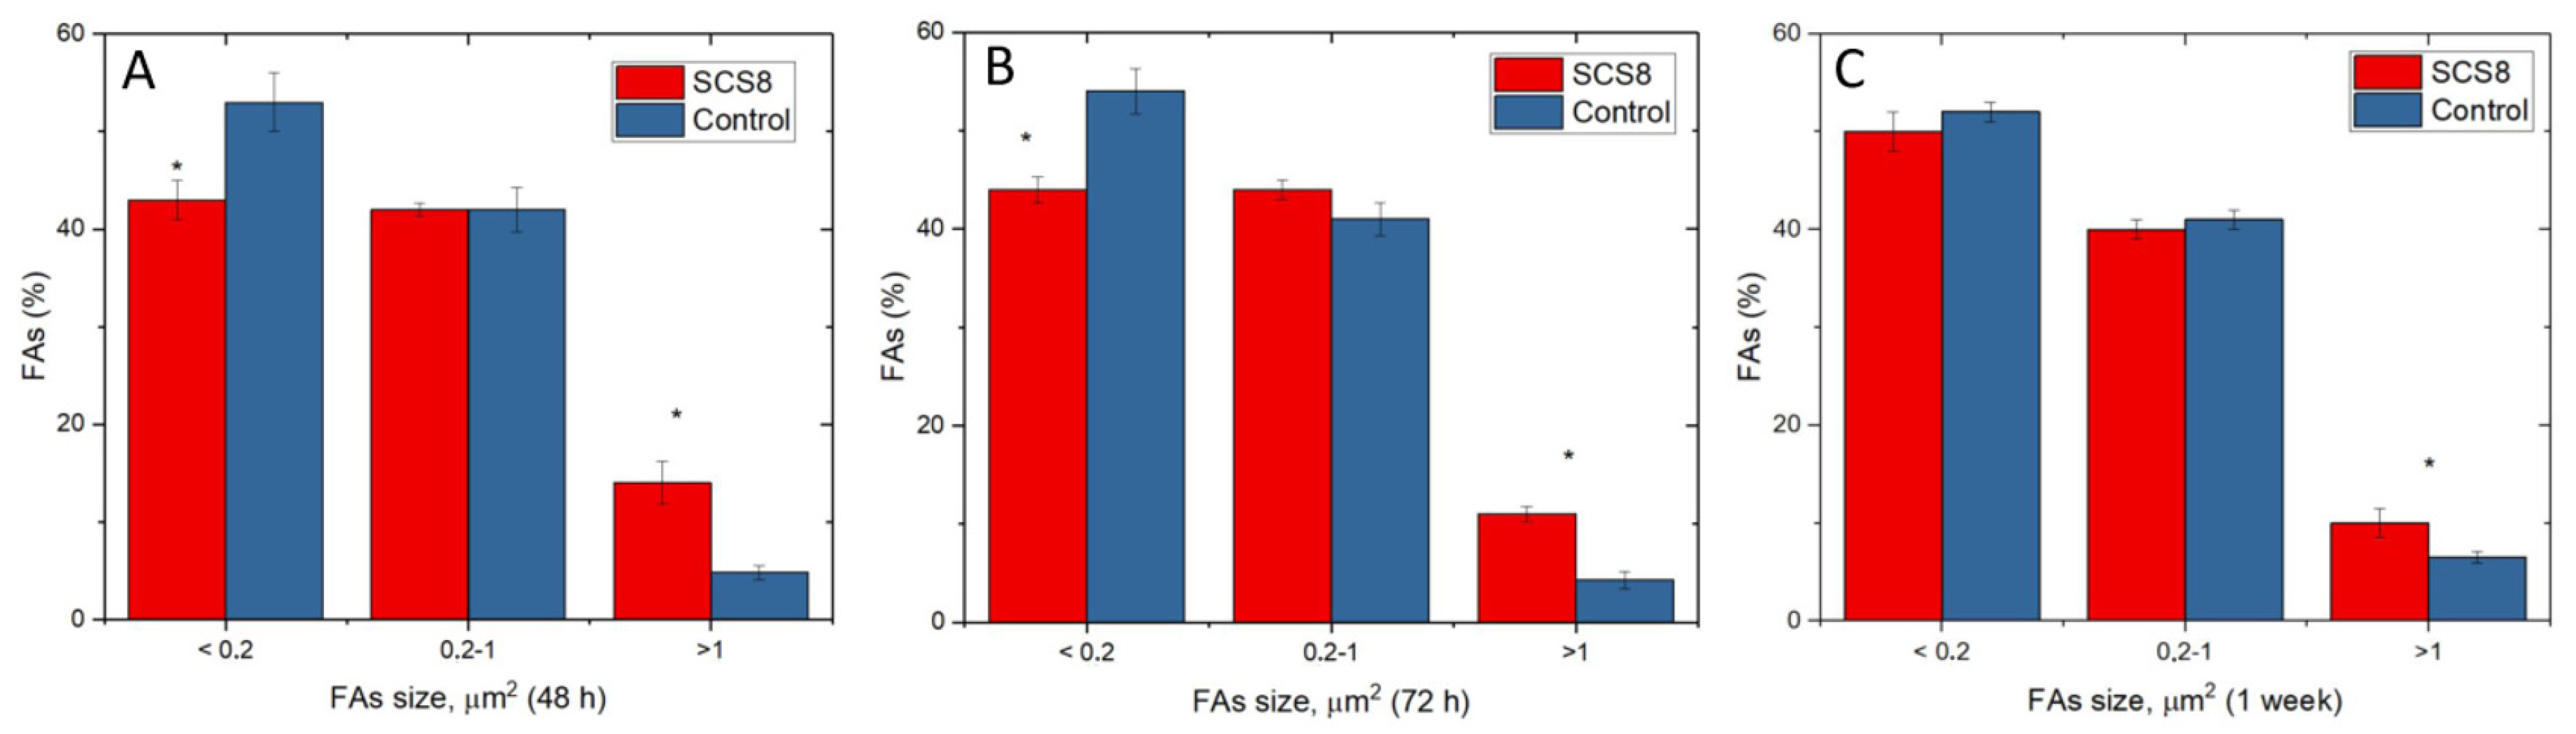
| SCS8 FAs 48 h | Controls FAs 48 h | SCS8 FAs 72 h | Controls FAs 72 h | SCS8 FAs 1 Week | Controls FAs 1 Week | |
|---|---|---|---|---|---|---|
| %FA < 0.2 μm2 | M = 43.777% SE = 2.075 (*) | M = 53.073% SE = 2.918 (*) | M = 44.464% SE = 1.319 (*) | M = 53.931% SE = 2.263 (*) | M = 49.52% SE = 5.26 | M = 52.42% SE = 3.62 |
| %FA 0.2–1 μm2 | M = 42.02% SE = 1.89 | M = 42.18% SE = 5.73 | M = 43.99% SE = 2.66 | M = 41.72% SE =5.09 | M = 40.52% SE = 2.56 | M = 41.14% SE = 2.92 |
| %FA > 1 μm2 | M = 14.203% SE = 2.189 (*) | M = 4.741% SE = 0.617 (*) | M = 11.546% SE = 0.750 | M = 4.343% SE = 0.859 (*) | M = 9.963% SE = 1.519 (*) | (M = 6.438% SE = 0.604 (*) |
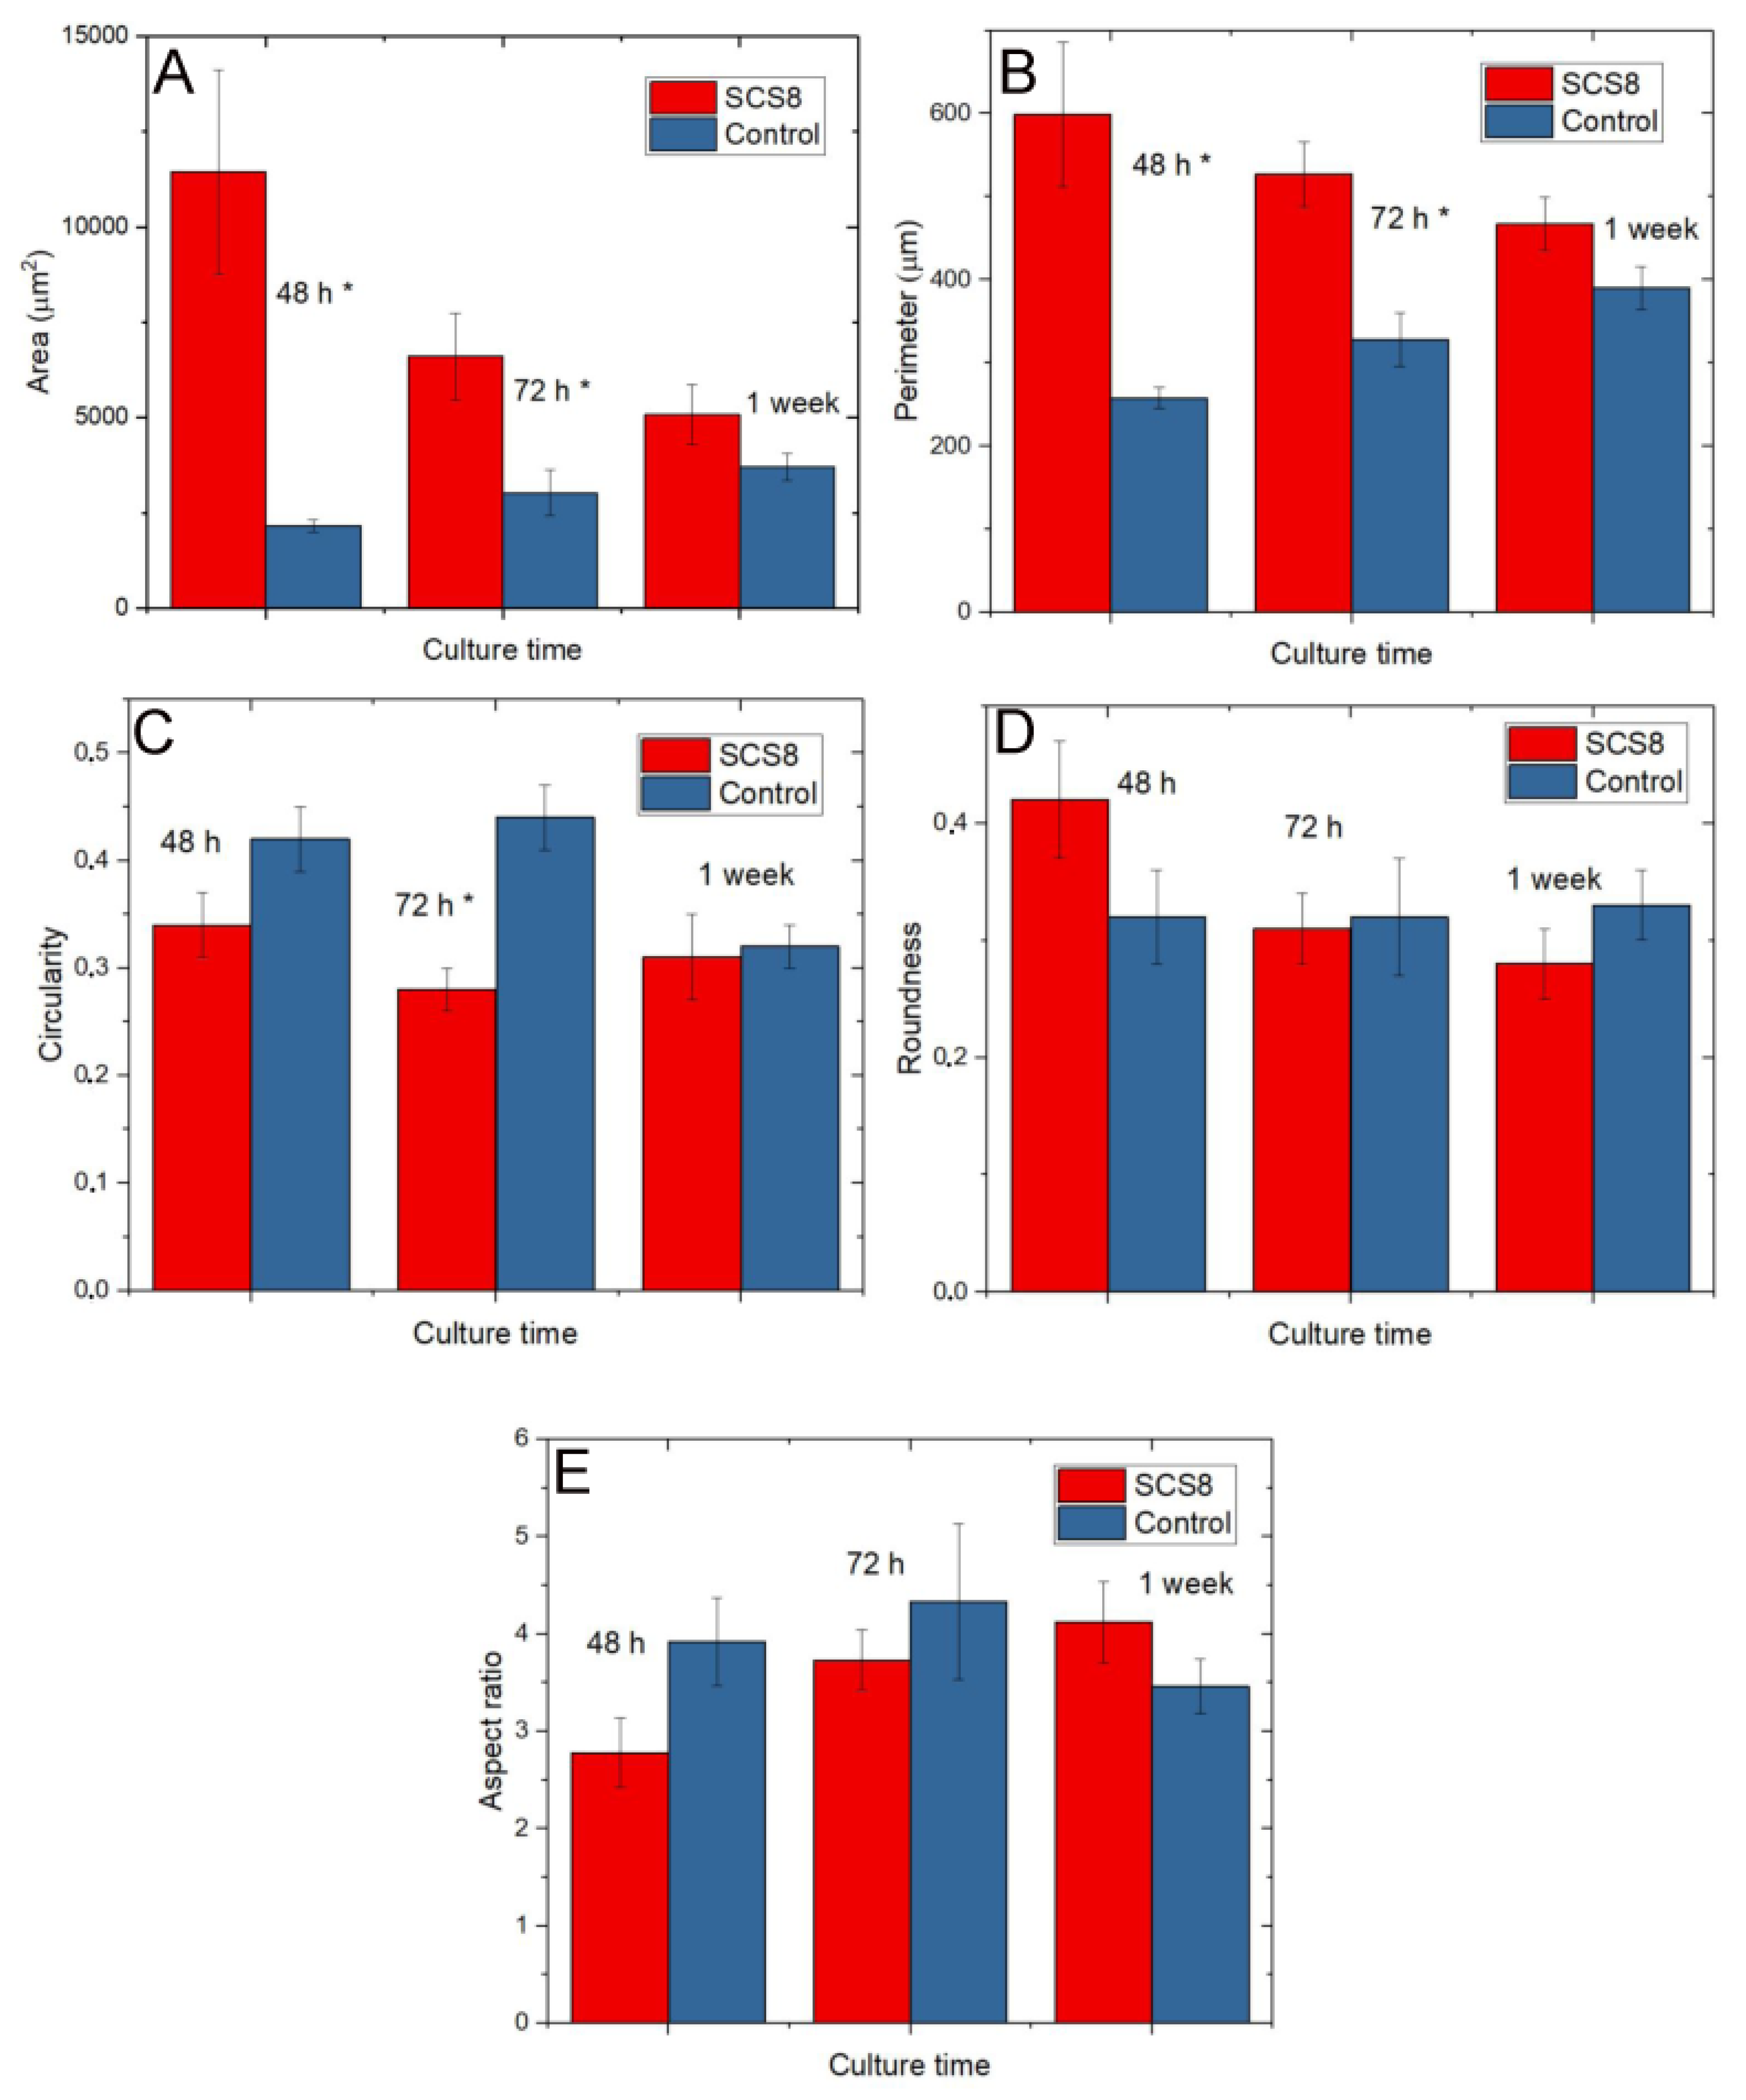
| SCS8 48 h | Controls 48 h | SCS8 72 h | Controls 72 h | SCS8 1 Week | Controls 1 Week | |
|---|---|---|---|---|---|---|
| Spread area (μm2) | M = 11439.794 SE = 2672.354 (*) | M = 2163.724 SE = 157.954 (*) | M = 6604.080 SE = 1138.230 (*) | M = 3030.626 SE = 602.313 (*) | M = 5079.371 SE = 791.598 | M = 3700.125 SE = 355.046 |
| Cell perimeter(μm) | M = 599.210 SE = 1138.230 (*) | M = 258.910 SE = 13.300 (*) | M = 527.810 SE = 38.884 (*) | M = 328.400 SE = 32.1 (*) | M = 467.580 SE = 32.461 | M = 390.394 SE = 26.502 |
| Circularity | M = 0.339 SE = 0.032 | M = 0.421 SE = 0.028 | M = 0.276 SE = 0.032 (*) | M = 0.437 SE = 0.024 (*) | M = 0.313 SE = 0.040 | M = 0.321 SE = 0.023 |
Publisher’s Note: MDPI stays neutral with regard to jurisdictional claims in published maps and institutional affiliations. |
© 2020 by the authors. Licensee MDPI, Basel, Switzerland. This article is an open access article distributed under the terms and conditions of the Creative Commons Attribution (CC BY) license (http://creativecommons.org/licenses/by/4.0/).
Share and Cite
Perez-Moreno, A.; Reyes-Peces, M.d.l.V.; de los Santos, D.M.; Pinaglia-Tobaruela, G.; de la Orden, E.; Vilches-Pérez, J.I.; Salido, M.; Piñero, M.; de la Rosa-Fox, N. Hydroxyl Groups Induce Bioactivity in Silica/Chitosan Aerogels Designed for Bone Tissue Engineering. In Vitro Model for the Assessment of Osteoblasts Behavior. Polymers 2020, 12, 2802. https://doi.org/10.3390/polym12122802
Perez-Moreno A, Reyes-Peces MdlV, de los Santos DM, Pinaglia-Tobaruela G, de la Orden E, Vilches-Pérez JI, Salido M, Piñero M, de la Rosa-Fox N. Hydroxyl Groups Induce Bioactivity in Silica/Chitosan Aerogels Designed for Bone Tissue Engineering. In Vitro Model for the Assessment of Osteoblasts Behavior. Polymers. 2020; 12(12):2802. https://doi.org/10.3390/polym12122802
Chicago/Turabian StylePerez-Moreno, Antonio, María de las Virtudes Reyes-Peces, Deseada María de los Santos, Gonzalo Pinaglia-Tobaruela, Emilio de la Orden, José Ignacio Vilches-Pérez, Mercedes Salido, Manuel Piñero, and Nicolás de la Rosa-Fox. 2020. "Hydroxyl Groups Induce Bioactivity in Silica/Chitosan Aerogels Designed for Bone Tissue Engineering. In Vitro Model for the Assessment of Osteoblasts Behavior" Polymers 12, no. 12: 2802. https://doi.org/10.3390/polym12122802