Cold Atmospheric Pressure Plasma Treatment Modulates Human Monocytes/Macrophages Responsiveness

 ,
,
Abstract
:
1. Introduction
2. Materials and Methods
2.1. Monocytes Isolation and Differentiation
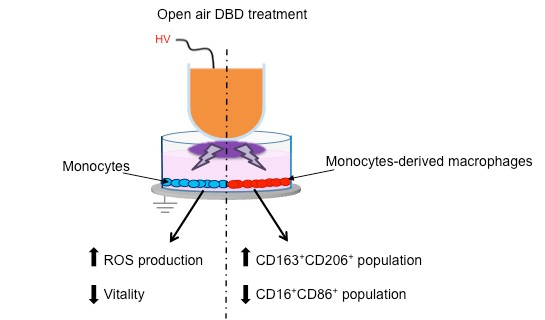
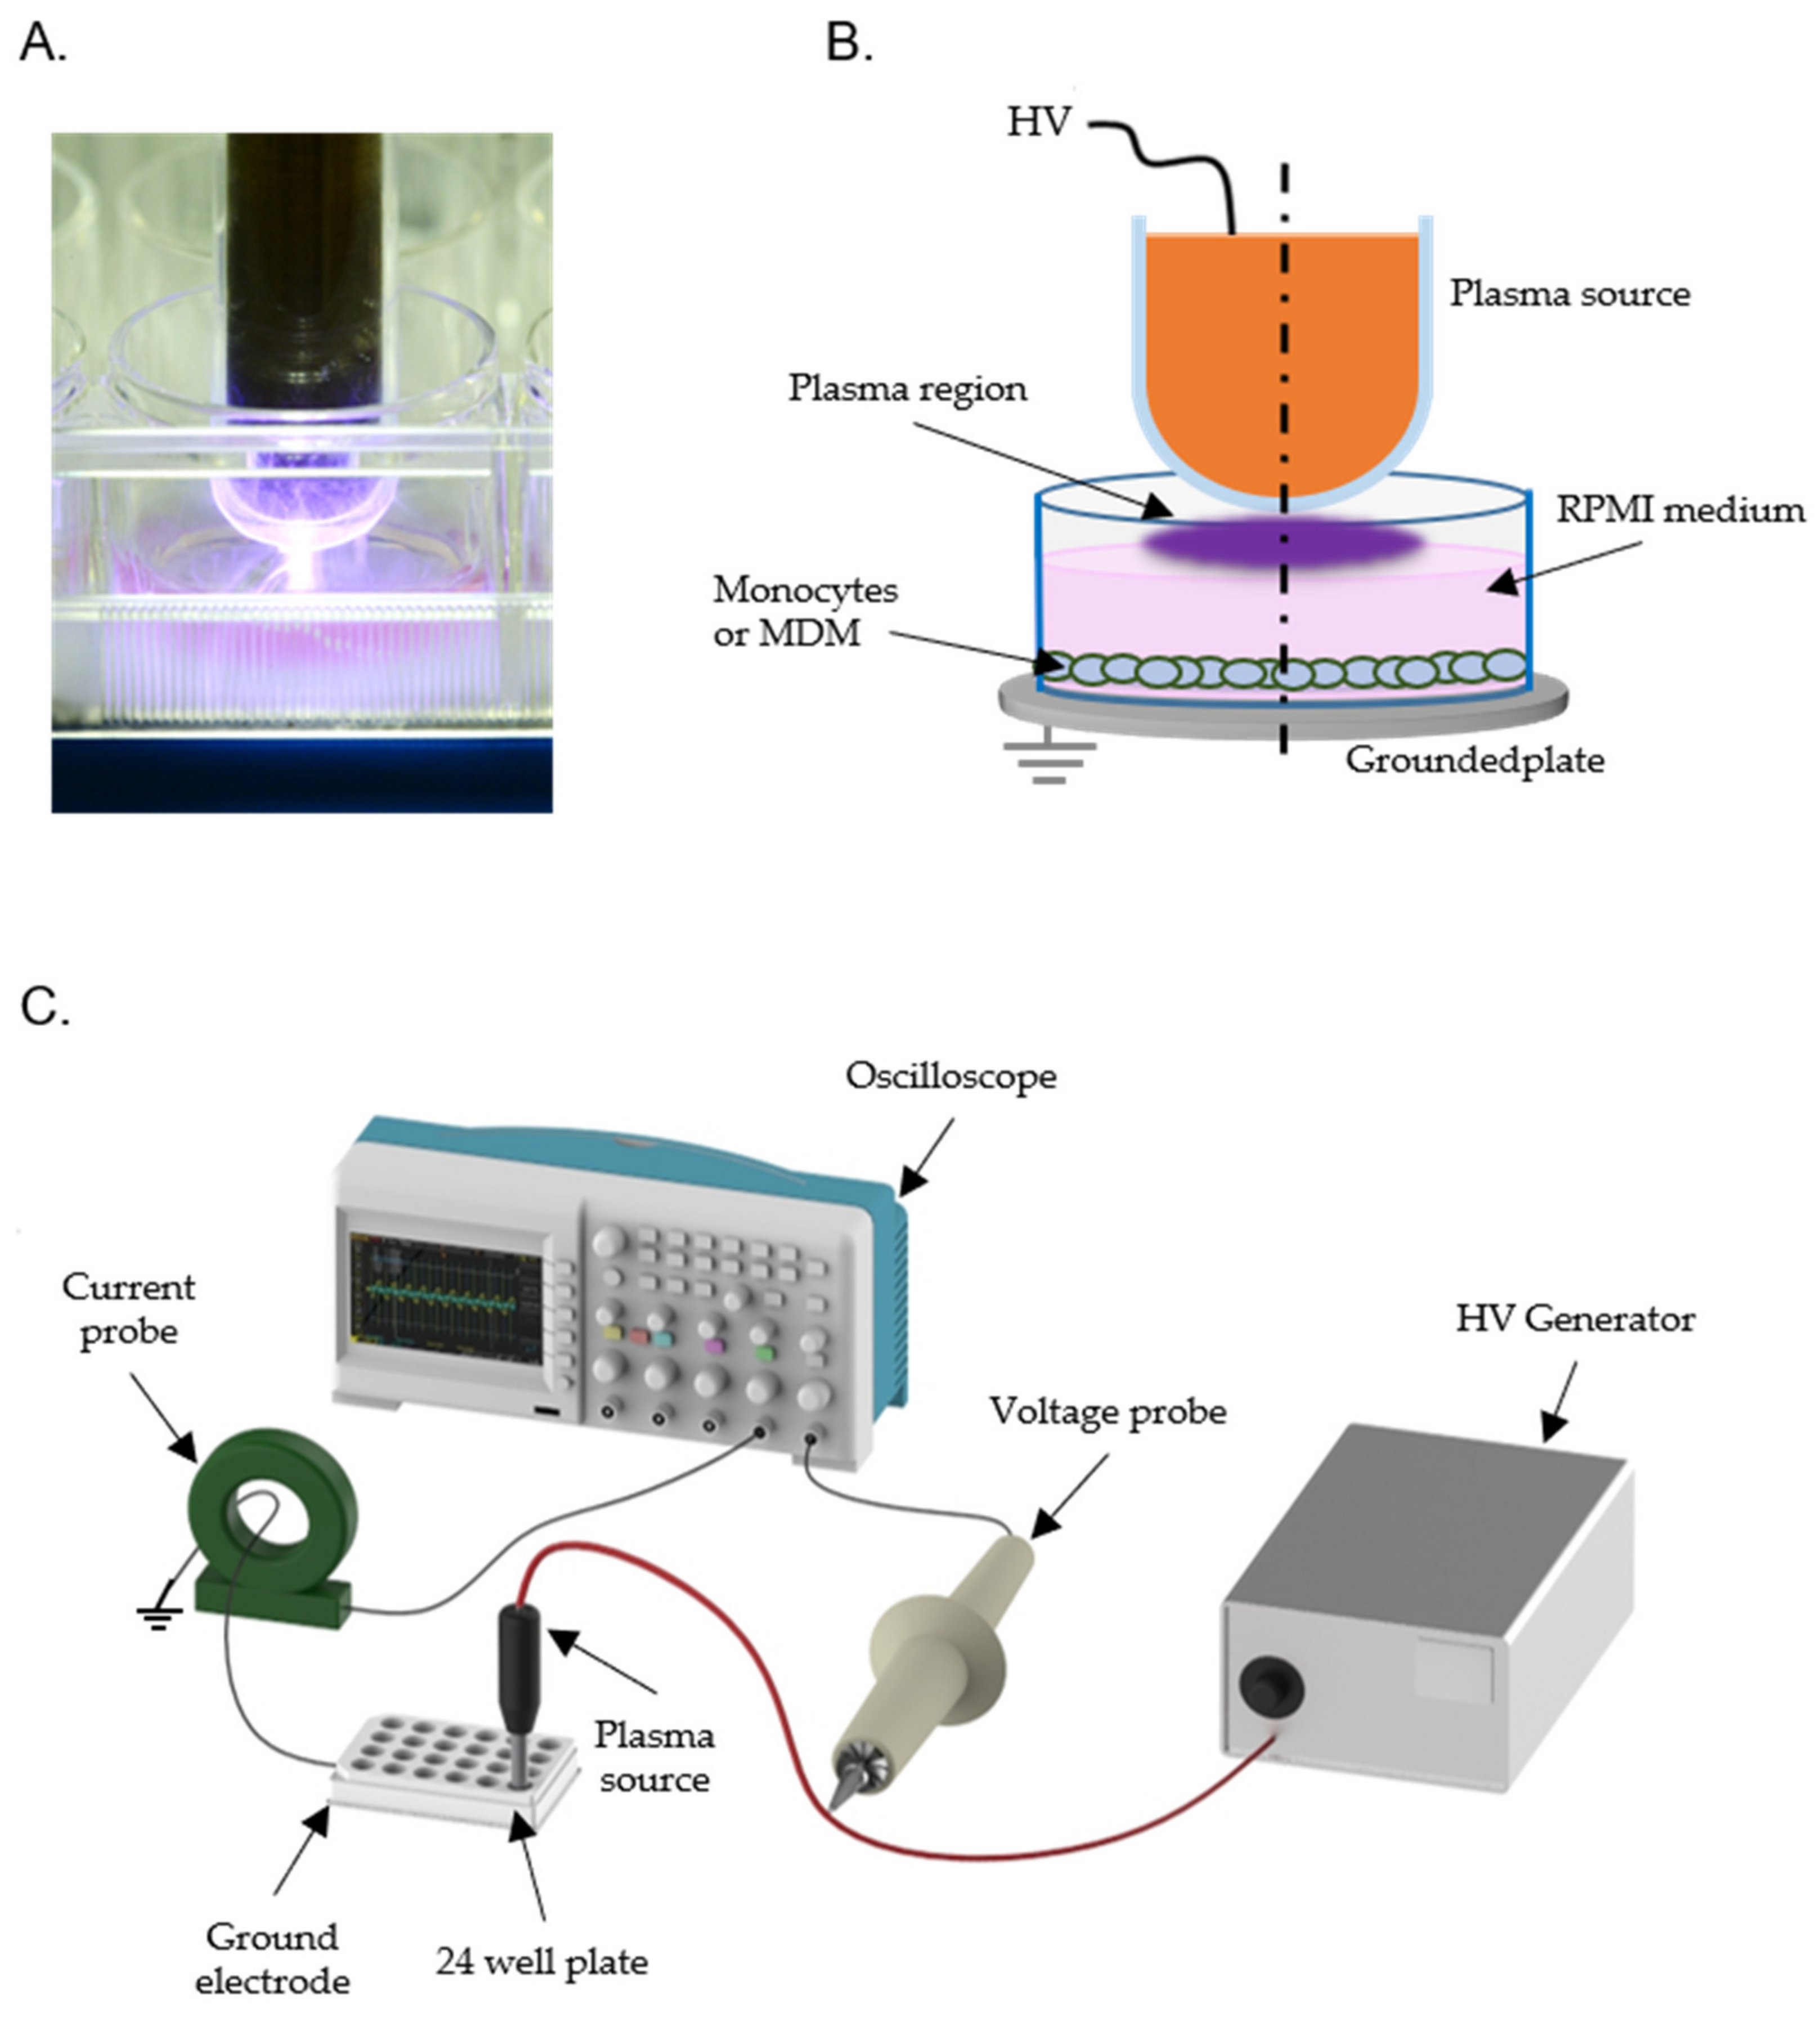
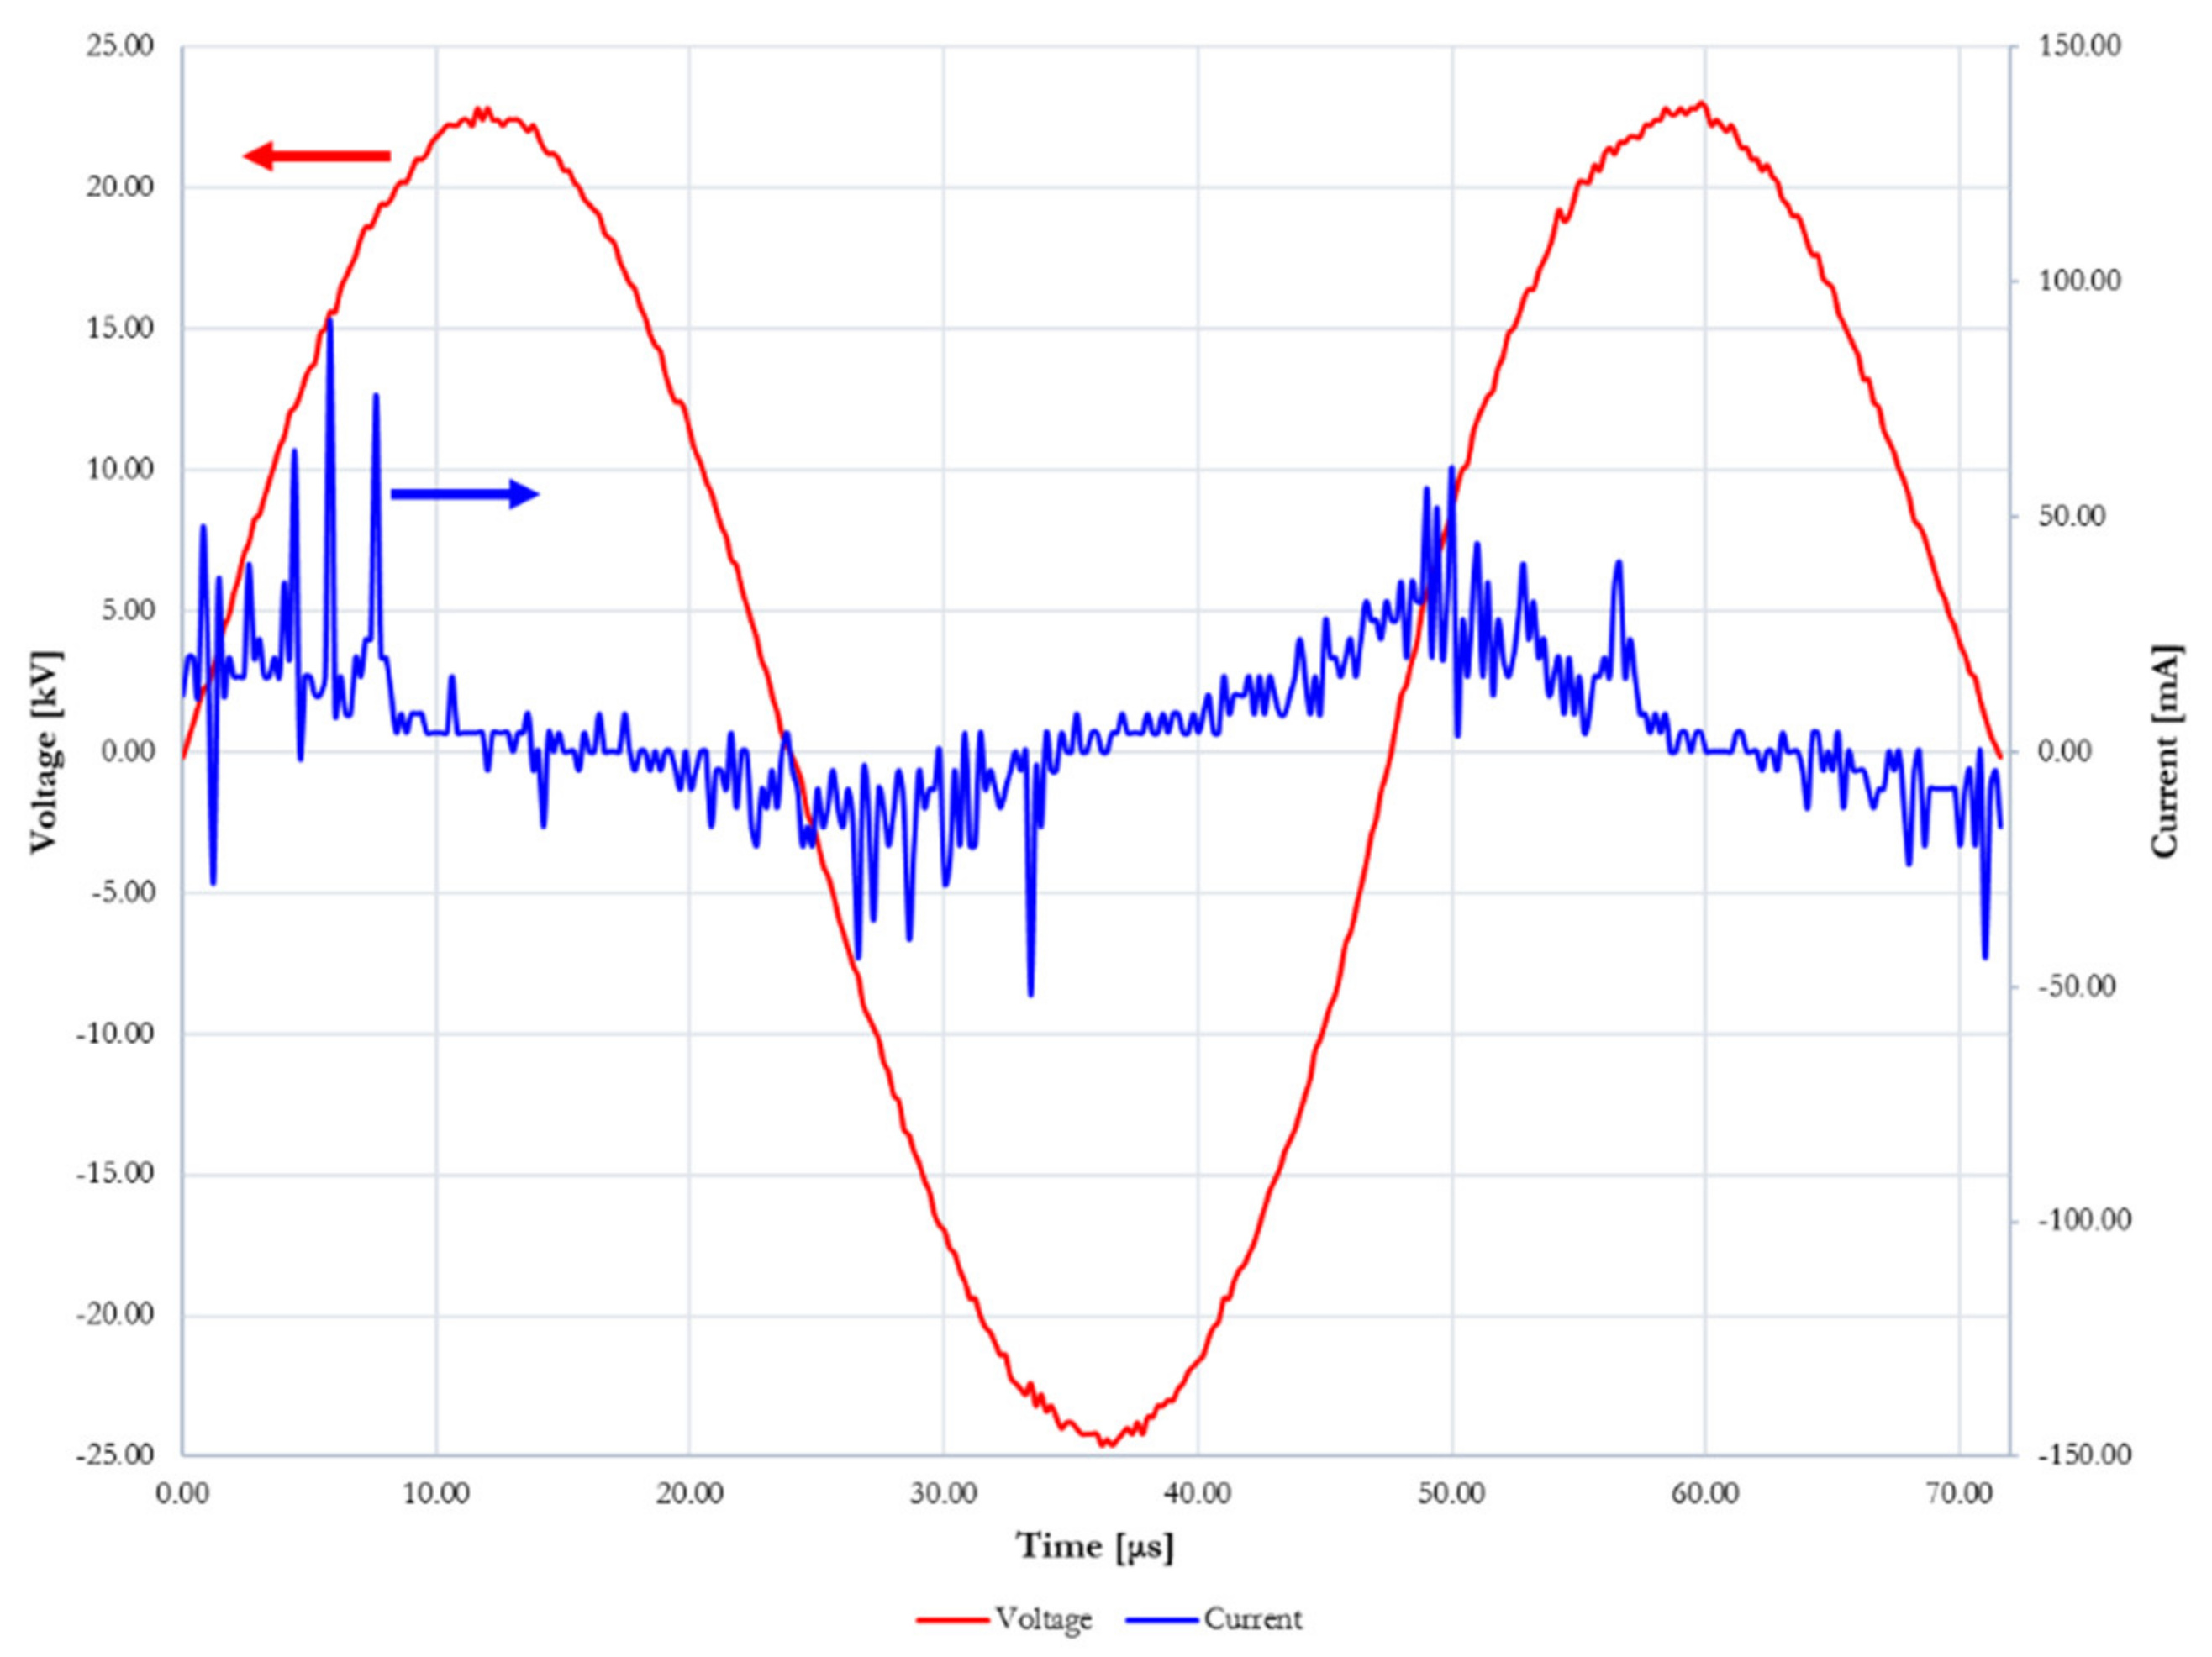
2.2. Plasma Treatment
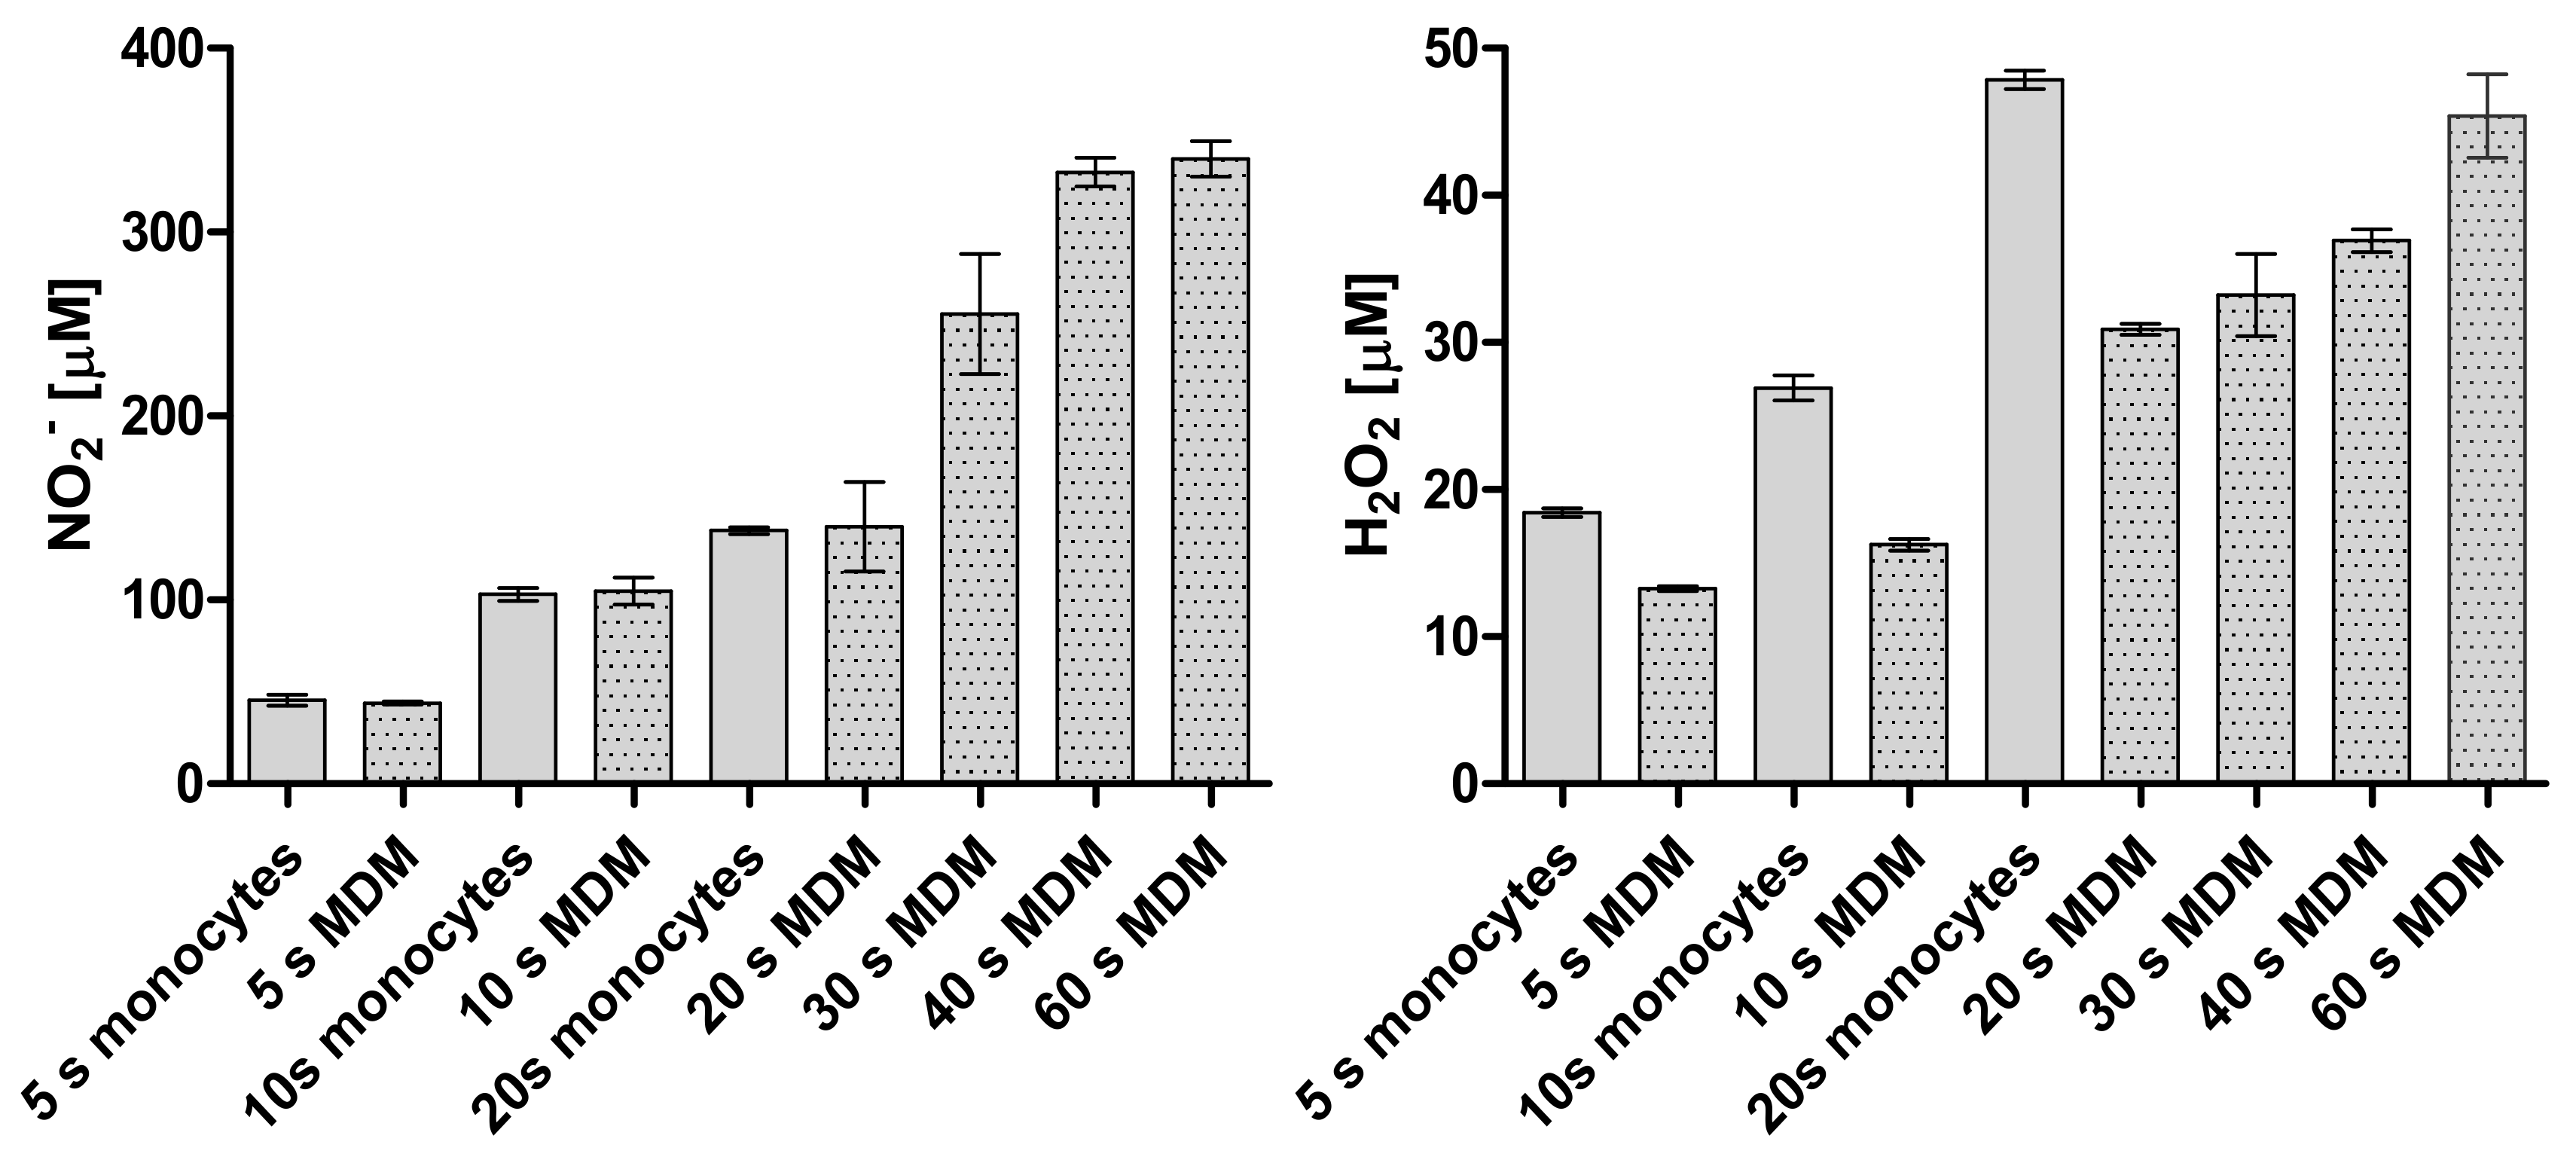
2.3. Detection of Reactive Oxygen and Nitrogen Species in Plasma-Treated Medium
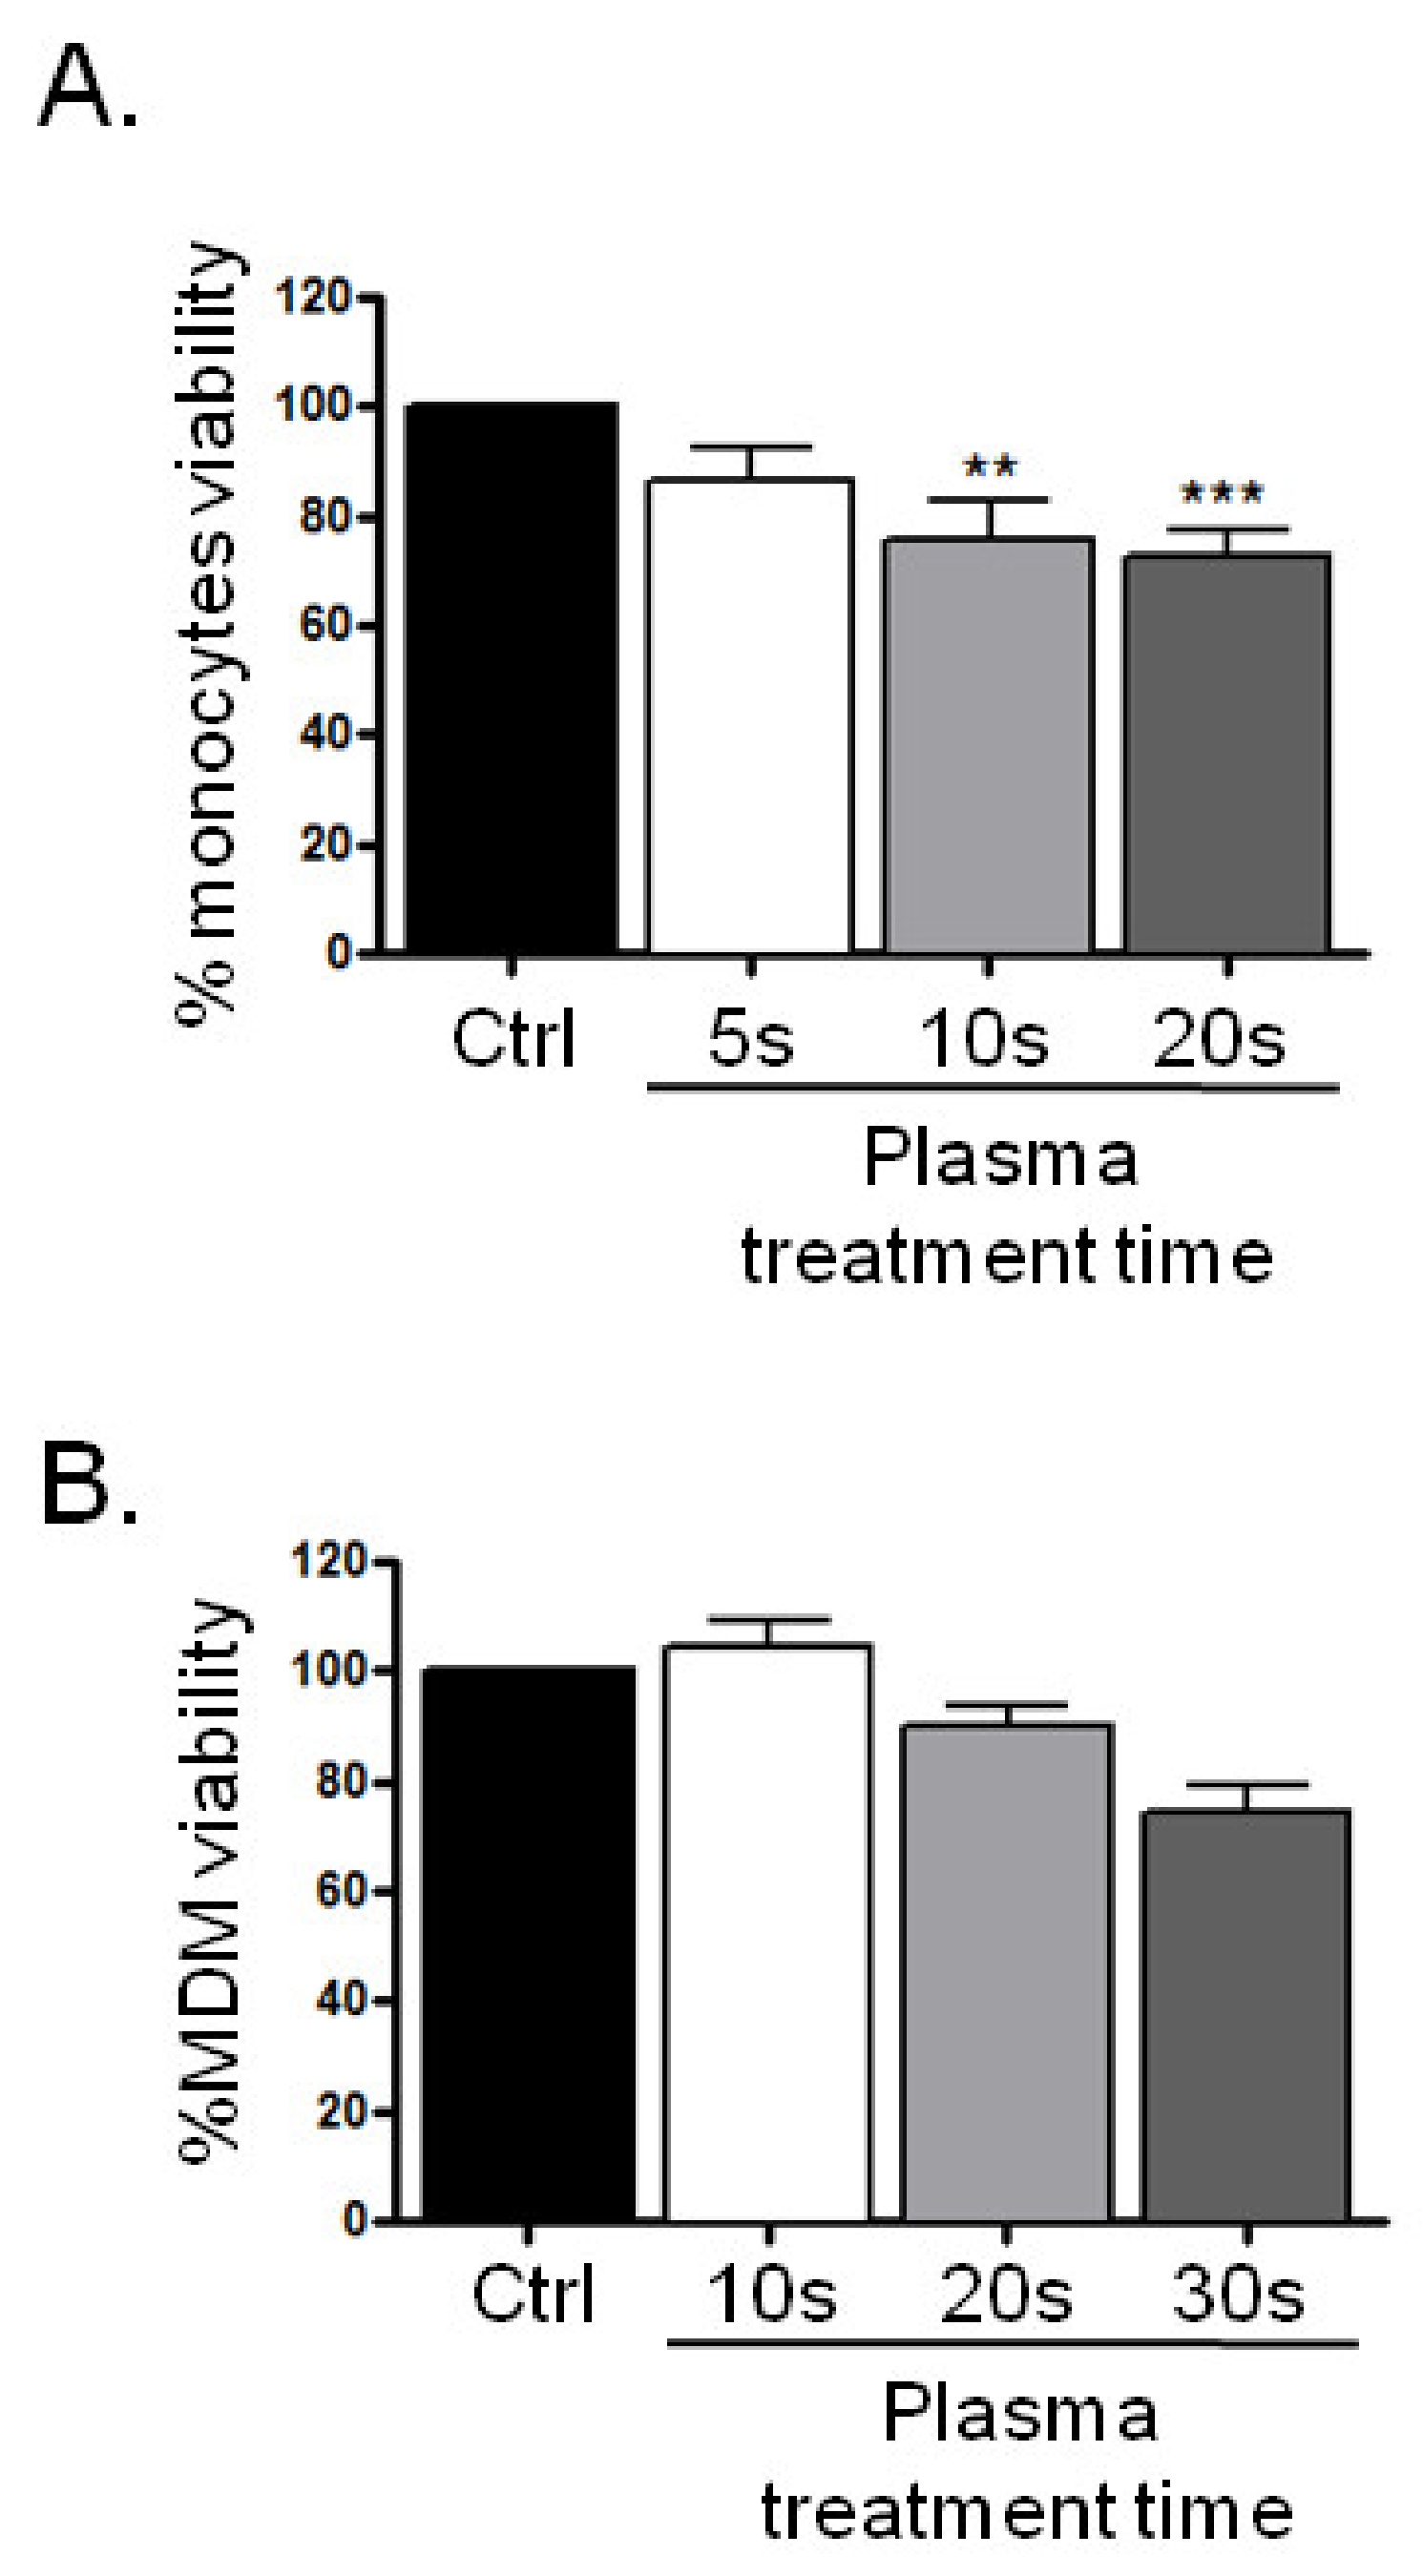
2.4. Viability Test
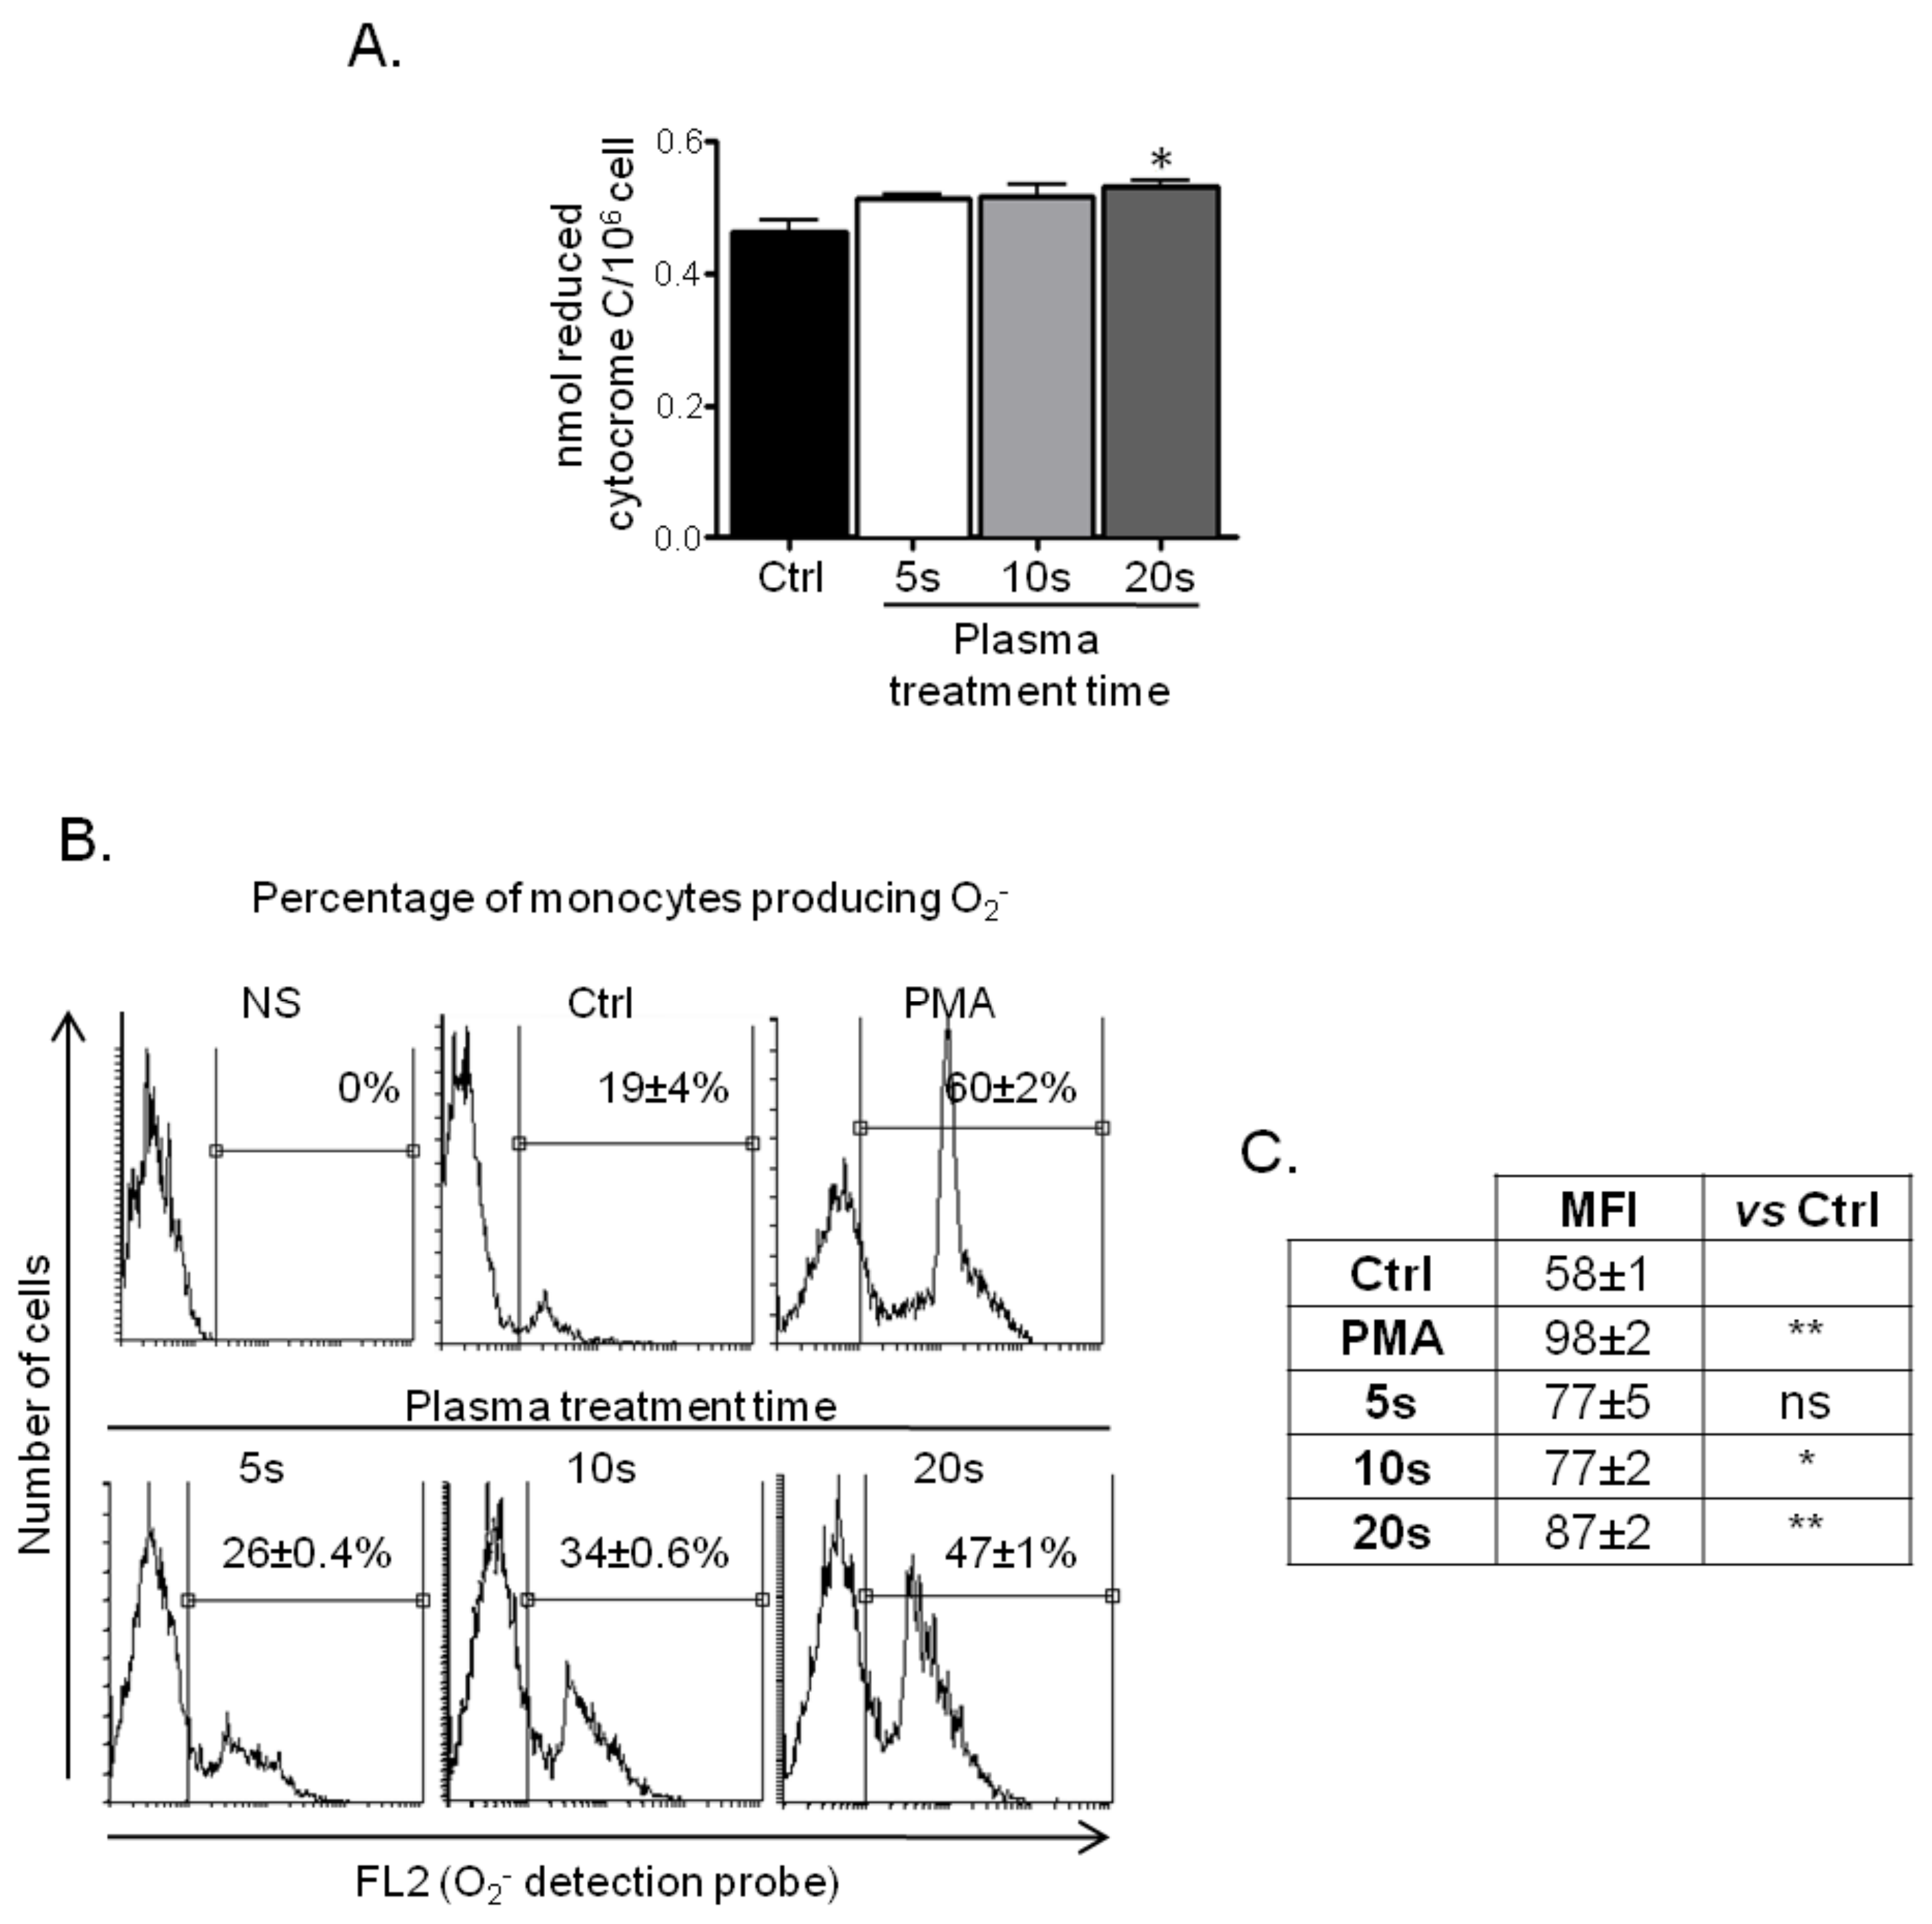
2.5. ROS/RNS and Superoxide Anion (O2−) Production
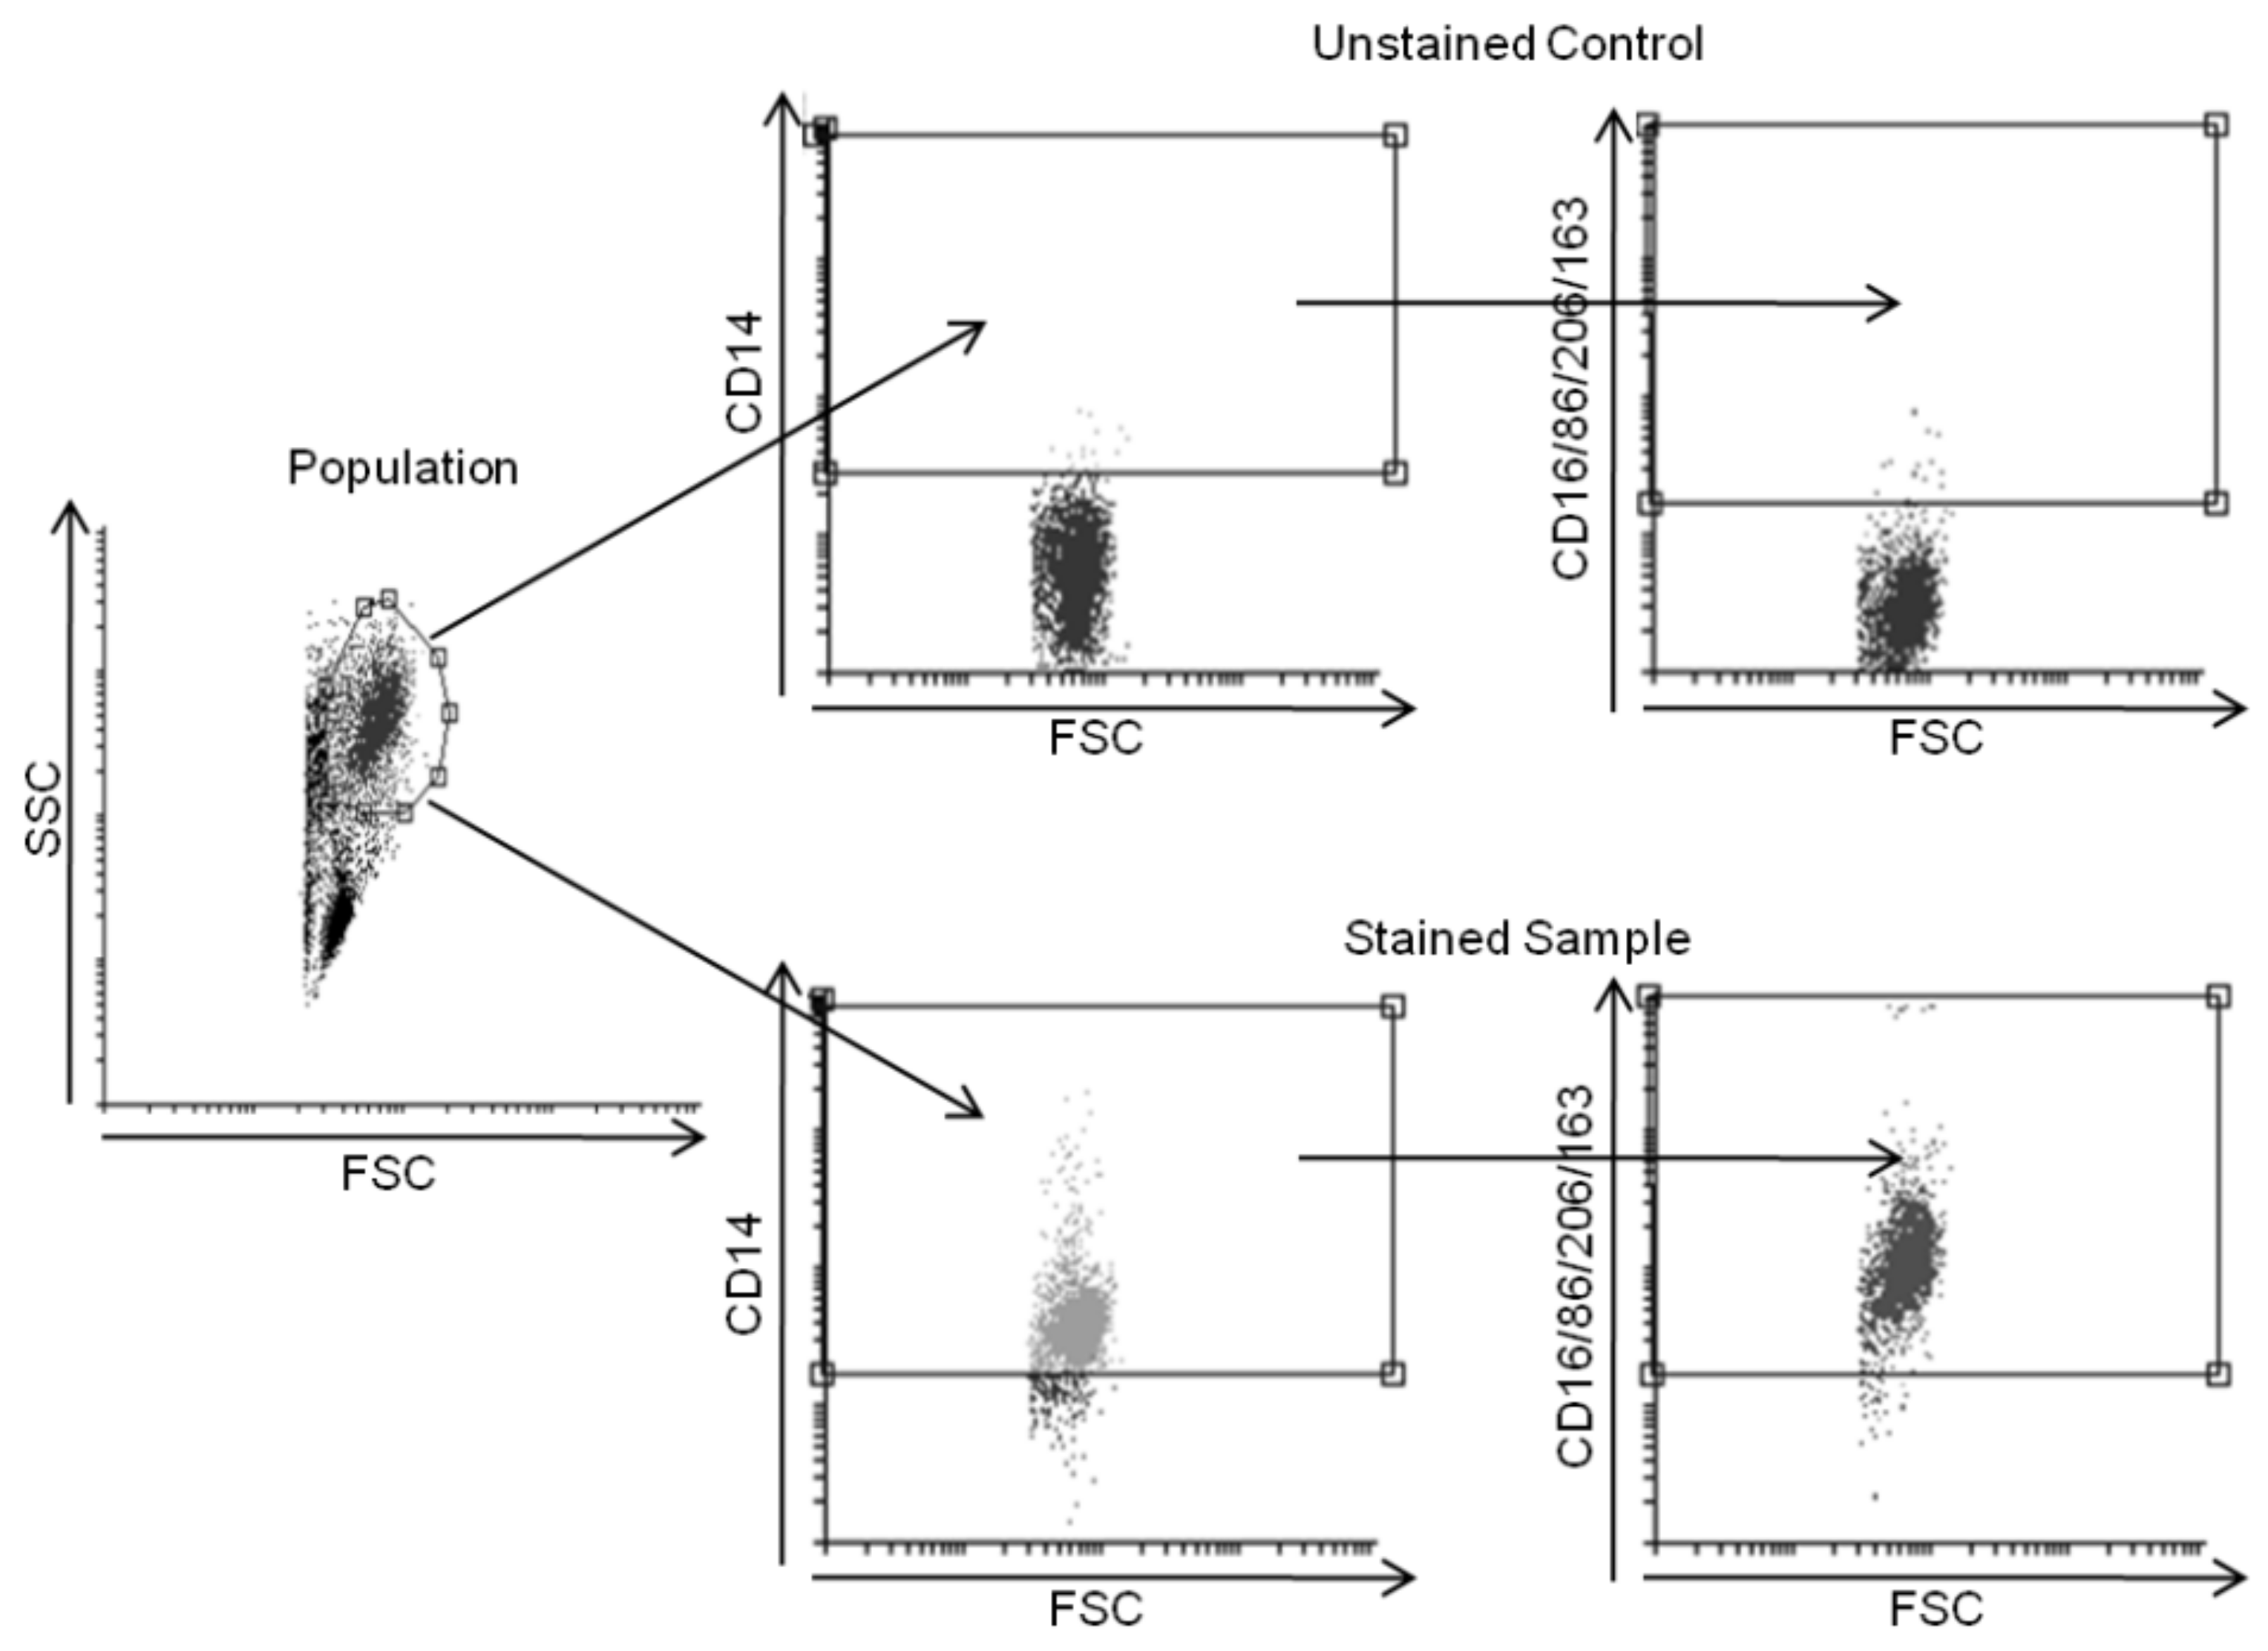
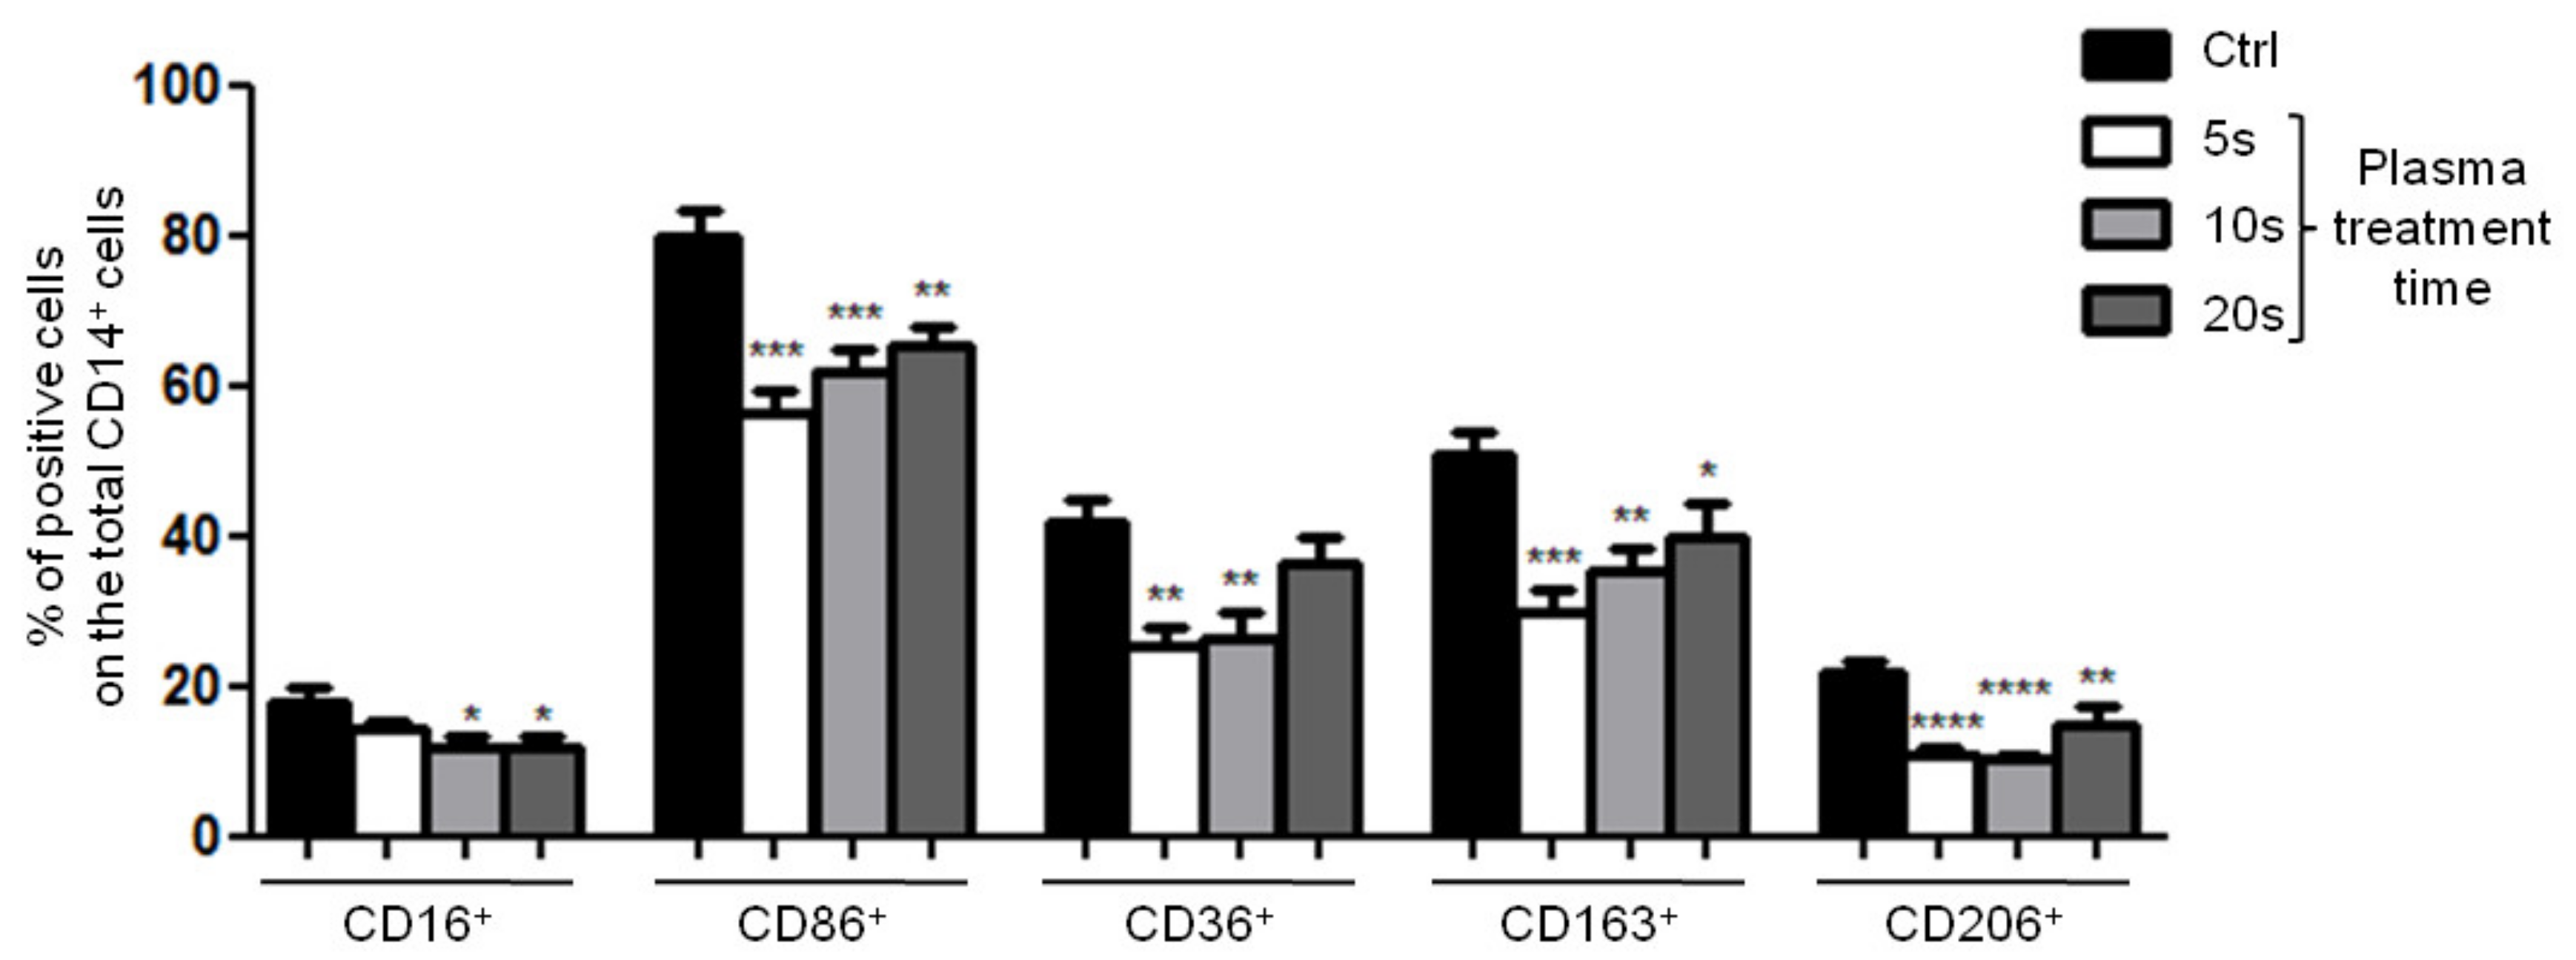
2.6. Flow Cytometry Analysis
2.7. Statistical Analysis
3. Results
3.1. Plasma Treatment and Viability Assay
3.2. Plasma Treatment Effects on Monocytes
3.2.1. ROS Production by Treated Monocytes
3.2.2. Surface Marker Expression
3.3. Plasma Treatment Effects on Monocytes-Derived Macrophages (MDM)
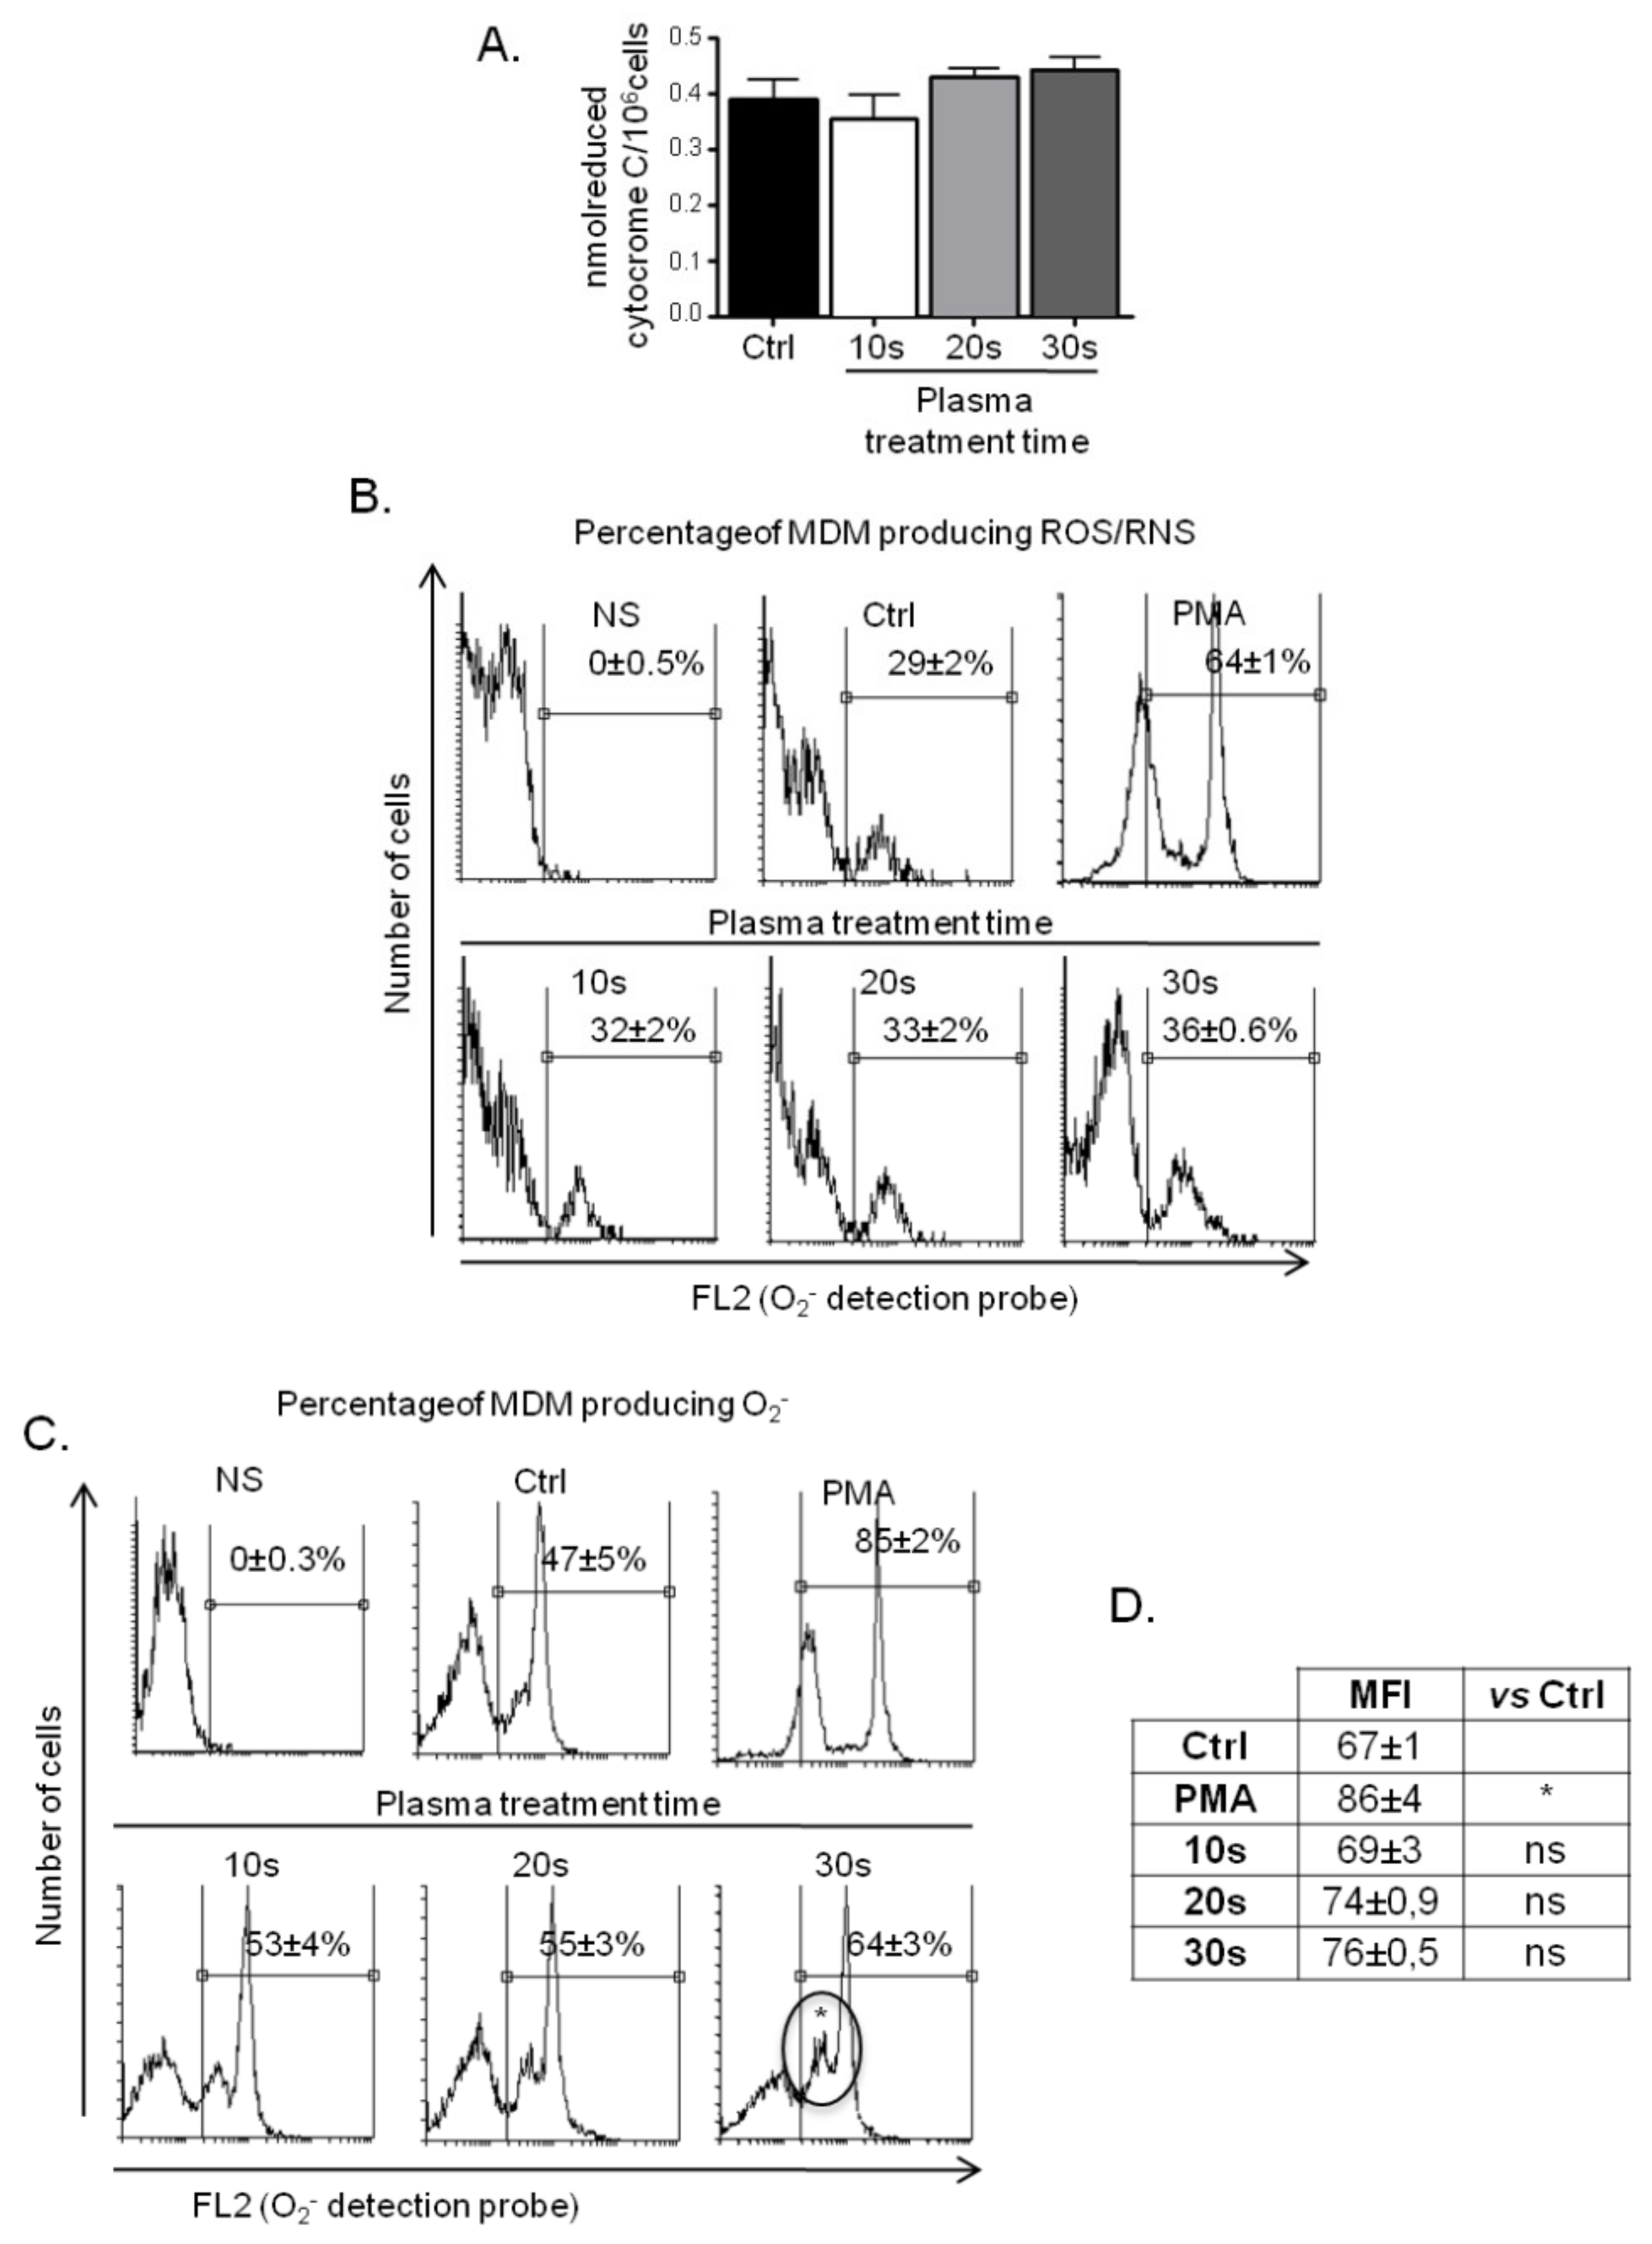
3.3.1. ROS Production by MDM
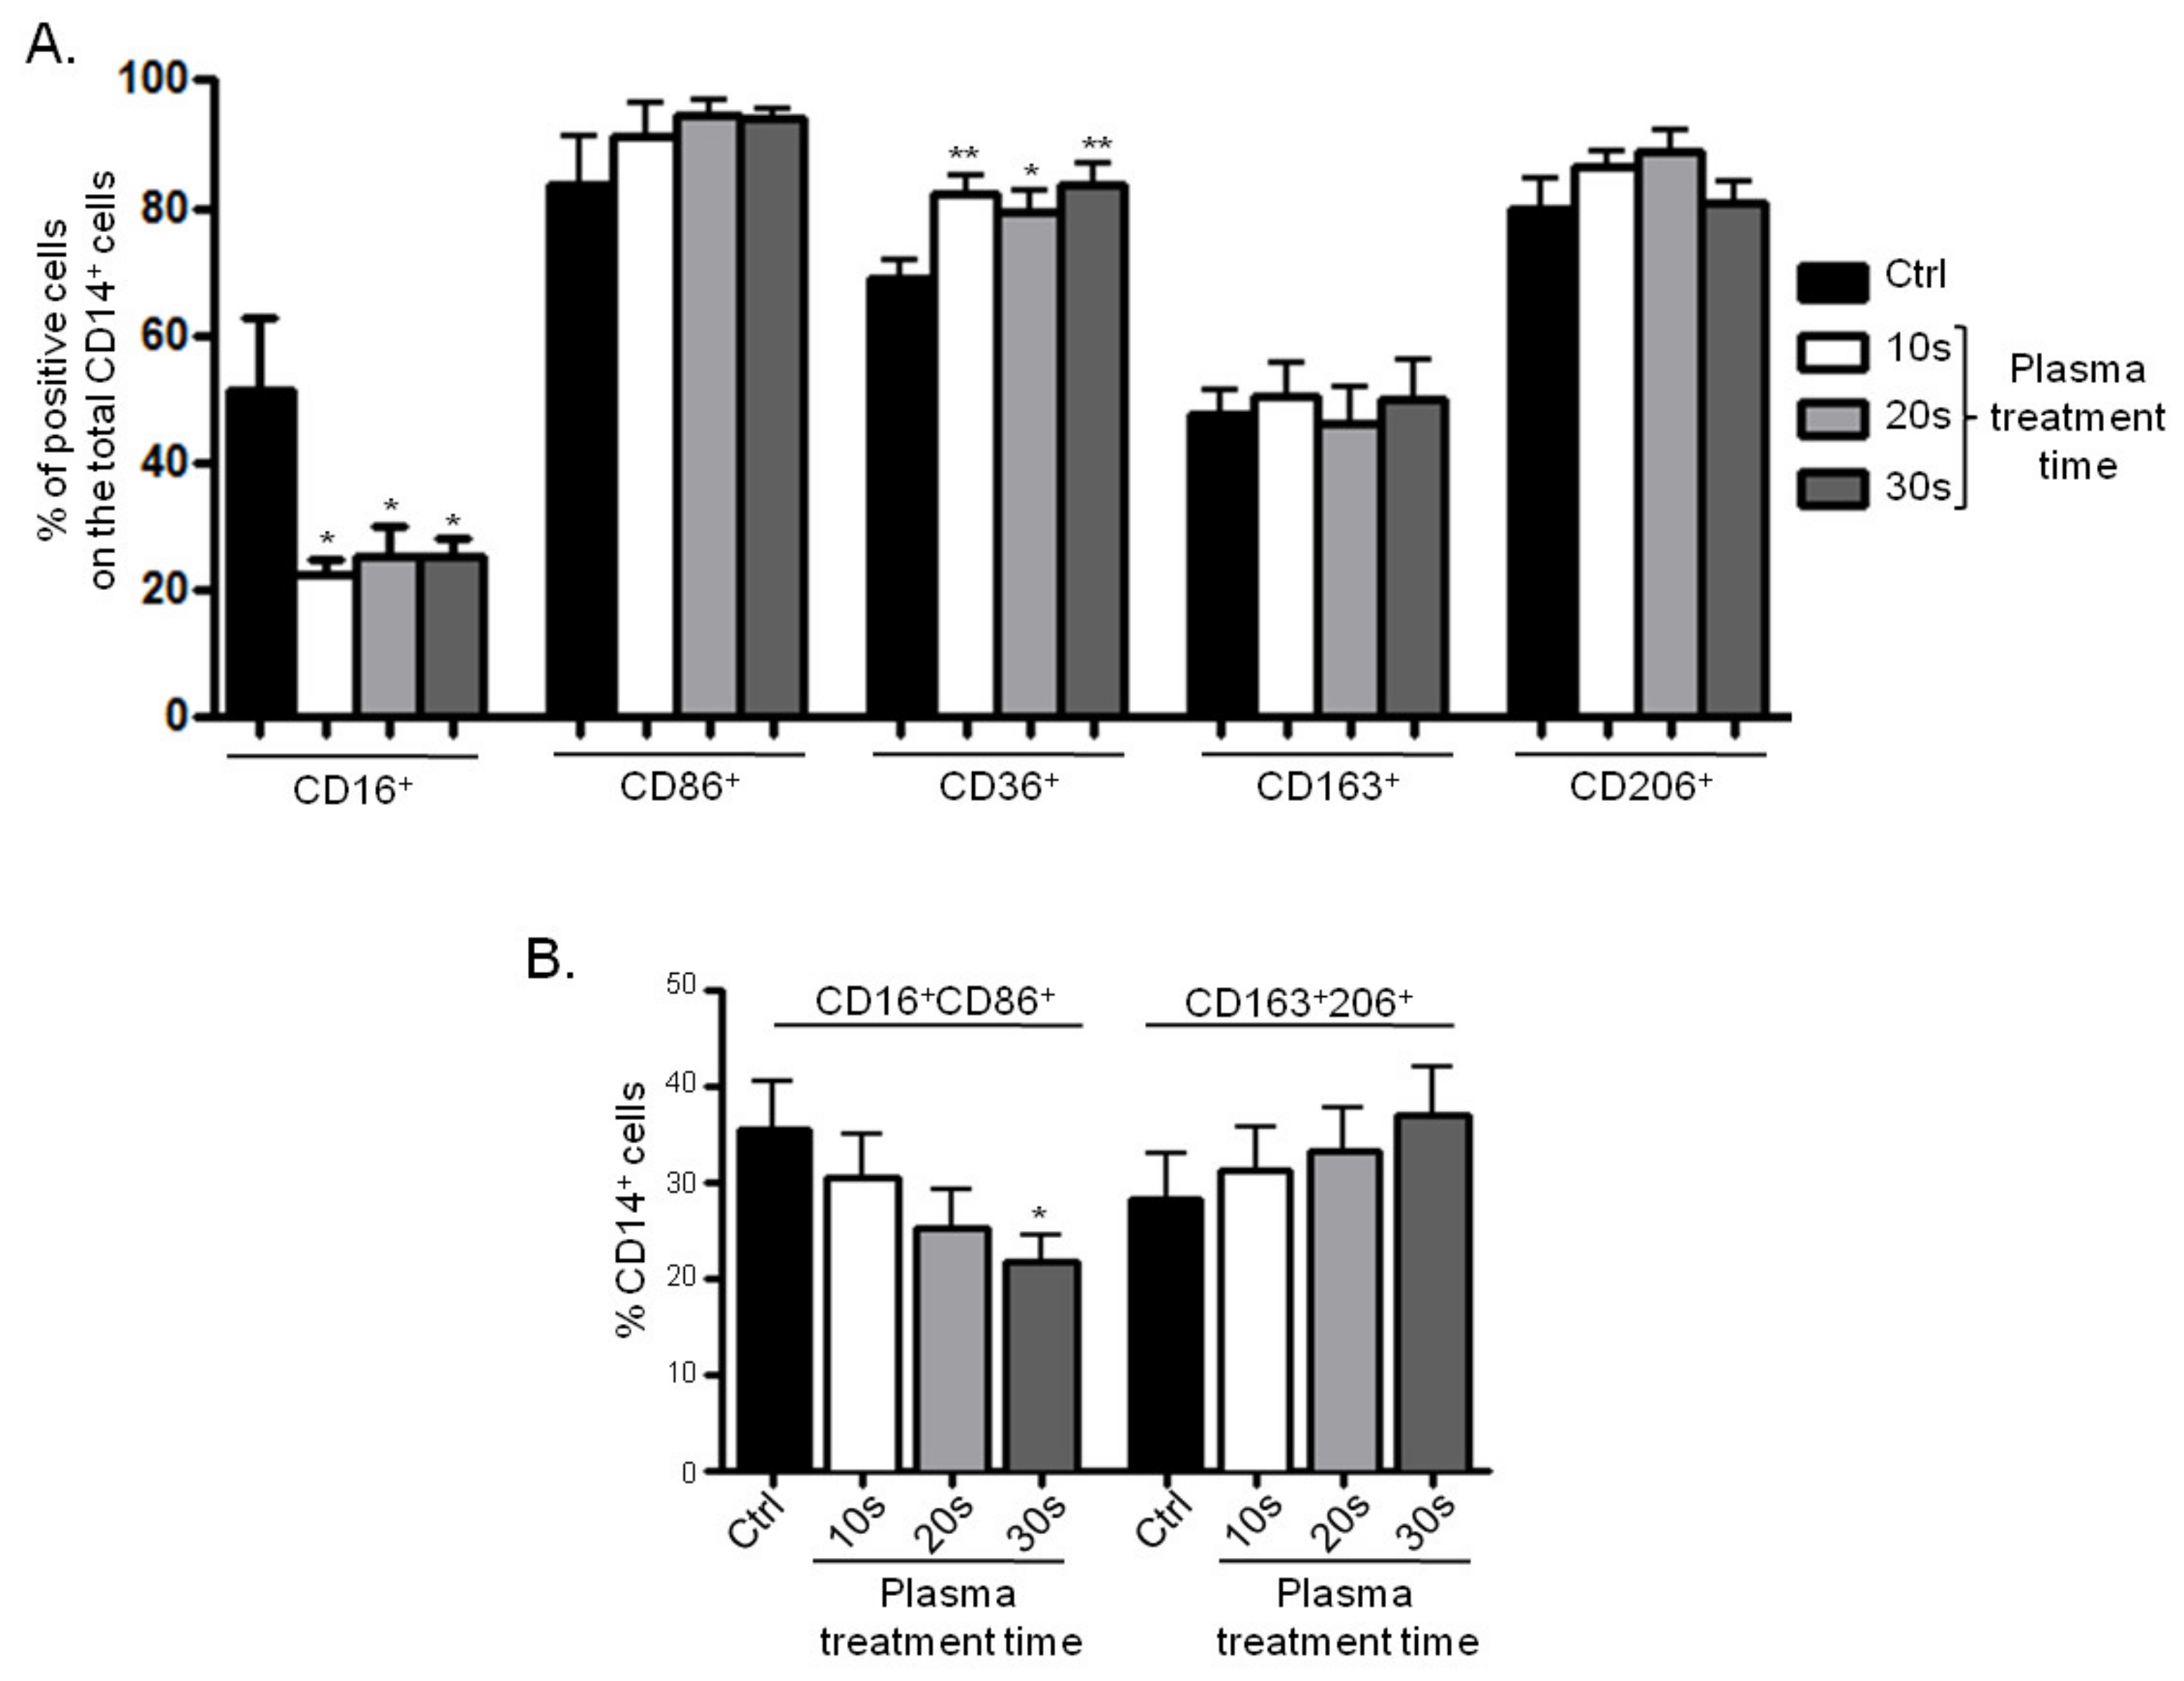
3.3.2. Surface Marker Expression
4. Discussion
5. Conclusions
Author Contributions
Funding
Conflicts of Interest
References
- Shi, C.; Pamer, E.G. Monocyte recruitment during infection and inflammation. Nat. Rev. Immunol. 2011. [Google Scholar] [CrossRef] [PubMed]
- Murray, P.J.; Wynn, T.A. Protective and pathogenic functions of macrophage subsets. Nat. Rev. Immunol. 2011, 11, 723. [Google Scholar] [CrossRef] [PubMed]
- Gordon, S.; Martinez, F.O. Alternative activation of macrophages: mechanism and functions. Immunity 2010. [Google Scholar] [CrossRef] [PubMed]
- Roszer, T. Understanding the Mysterious M2 Macrophage through Activation Markers and Effector Mechanisms. Mediat. Inflamm. 2015. [Google Scholar] [CrossRef] [PubMed]
- Cybulsky, M.I.; Cheong, C.; Robbins, C.S. Macrophages and Dendritic Cells: Partners in Atherogenesis. Circ Res. 2016, 118, 637. [Google Scholar] [CrossRef] [PubMed]
- Das, A.; Sinha, M.; Datta, S.; Abas, M.; Chaffee, S.; Sen, C.K.; Roy, S. Monocyte and macrophage plasticity in tissue repair and regeneration. Am. J. Pathol. 2015. [Google Scholar] [CrossRef] [PubMed]
- Mantovani, A.; Biswas, S.K.; Galdiero, M.R.; Sica, A.; Locati, M. Macrophage plasticity and polarization in tissue repair and remodelling. J. Path. 2013. [Google Scholar] [CrossRef] [PubMed]
- Wynn, T.A.; Chawla, A.; Pollard, J.W. Macrophage biology in development, homeostasis and disease. Nature 2013. [Google Scholar] [CrossRef] [PubMed]
- Sica, A.; Mantovani, A. Macrophage plasticity and polarization: In vivo veritas. J. Clin. Investig. 2012. [Google Scholar] [CrossRef] [PubMed]
- Zhou, D.; Huang, C.; Lin, Z.; Zhan, S.; Kong, L.; Fang, C.; Li, J. Macrophage polarization and function with emphasis on the evolving roles of coordinated regulation of cellular signaling pathways. Cell Sign. 2014, 2, 192–197. [Google Scholar] [CrossRef] [PubMed]
- Laroussi, M.M. Low Temperature Plasma-Based Sterilization: Overview and State-of-the-Art. Plasma Process. Polym. 2005. [Google Scholar] [CrossRef]
- Bekeschus, S.; Kolata, J.; Winterbourn, C.; Kramer, A.; Turner, R.; Weltmann, K.D.; Bröker, B.; Masur, K. Hydrogen peroxide: A central player in physical plasma-induced oxidative stress in human blood cells. Free Radicals Res. 2014. [Google Scholar] [CrossRef] [PubMed]
- Barbieri, D.B.; Cavrini, F.; Colombo, V.; Gherardi, M.; Landini, M.P.; Laurita, R.; Liguori, A.; Stancampiano, A. Investigation of the antimicrobial activity at safe levels for eukaryotic cells of a low power atmospheric pressure inductively coupled plasma source. Biointerphases 2015. [Google Scholar] [CrossRef] [PubMed]
- Gherardi, M.; Turrini, E.; Laurita, R.; De Gianni, E.; Ferruzzi, L.; Liguori, A.; Stancampiano, A.; Colombo, V.; Fimognari, C. Atmospheric Non-Equilibrium Plasma Promotes Cell Death and Cell-Cycle Arrest in a Lymphoma Cell Line. Plasma Process. Polym. 2015. [Google Scholar] [CrossRef]
- Laroussi, M.; Xi, L. Room-temperature atmospheric pressure plasma plume for biomedical applications. Appl. Phys. Lett. 2005. [Google Scholar] [CrossRef]
- Laurita, R.; Alviano, F.; Marchionni, C.; Abruzzo, P.M.; Bolotta, A.; Bonsi, L.; Colombo, V.; Gherardi, M.; Liguori, A.; Ricci, F.; et al. A study of the effect on human mesenchymal stem cells of an atmospheric pressure plasma source driven by different voltage waveforms. J. Phys. D Appl. Phys. 2016. [Google Scholar] [CrossRef]
- Stoffels, E.; Sakiyama, Y.; Graves, D.B. Cold Atmospheric Plasma: Charged Species and Their Interactions With Cells and Tissues. IEEE Trans. Plasma Sci. 2008. [Google Scholar]
- Kaushik, N.; Kumar, N.; Kim, C.H.; Kaushik, N.K.; Choi, E.H. Dielectric Barrier Discharge Plasma Efficiently Delivers an Apoptotic Response in Human Monocytic Lymphoma. Plasma Process. Polym. 2014. [Google Scholar] [CrossRef]
- Bekeschus, S.; Kolata, J.; Muller, A.; Kramer, A.; Weltmann, K.D.; Broker, B.; Masur, K. Differential Viability of Eight Human Blood Mononuclear Cell Subpopulations after Plasma Treatment. Plasma Med. 2013. [Google Scholar] [CrossRef]
- Bundscherer, L.; Nagel, S.; Hasse, S.; Tresp, H.; Wende, K.; Walther, R.; Lindequist, U. Non-thermal plasma treatment induces MAPK signaling in human monocytes. Open Chem. 2015. [Google Scholar] [CrossRef]
- Kaushik, N.; Kaushik, N.; Min, B.; Choi, K.; Hong, Y.; Miller, V.; Fridman, A; Choi, E.H. Cytotoxic macrophage-released tumour necrosis factor-alpha (TNF-α) as a killing mechanism for cancer cell death after cold plasma activation. J. Phys. D Appl. Phys. 2016. [Google Scholar] [CrossRef]
- Lin, A.; Truong, B.; Pappas, A.; Kirifides, L.; Oubarri, A.; Chen, S.; Lin, S.; Dobrynin, D.; Fridman, G; Fridman, A.; et al. Uniform Nanosecond Pulsed Dielectric Barrier Discharge Plasma Enhances Anti-Tumor Effects by Induction of Immunogenic Cell Death in Tumors and Stimulation of Macrophages. Plasma Process. Polym. 2015. [Google Scholar] [CrossRef]
- Miller, V.; Lin, A.; Fridman, G.; Dobrynin, D.; Fridman, A. Plasma Stimulation of Migration of Macrophages. Plasma Process. Polym. 2014. [Google Scholar] [CrossRef]
- Miller, V.; Lin, A.; Fridman, A. Why target immune cells for plasma treatment of cancer. Plasma Chem. Plasma Process. 2016. [Google Scholar] [CrossRef]
- Georgescu, N.; Lupu, R. Tumoral and normal cells treatment with high-voltage pulsed cold atmospheric plasma jets. IEEE Trans. Plasma Sci. 2010. [Google Scholar] [CrossRef]
- Lin, A.; Truong, B.; Fridman, G.; Fridman, A.; Miller, V. Immune cells enhance selectivity of nanosecond-pulsed dbd plasma against tumor cells. Plasma Med. 2017. [Google Scholar] [CrossRef]
- Bekeschus, S.; Scherwietes, L.; Freund, E.; Rouven Liedtke, K.; Hackbarth, C.; von Woedtke, T.; Partecke, L.I. Plasma-treated medium tunes the inflammatory profile in murine bone marrow-derived macrophages. Clin. Plasma Med. 2018. [Google Scholar] [CrossRef]
- Lavagno, L.; Gunella, G.; Bardelli, C.; Spina, S.; Fresu, L.G.; Viano, I.; Brunelleschi, S. Anti-inflammatory drugs and tumor necrosis factor-alpha production from monocytes: Role of transcription factor NF-kappa B and implication for rheumatoid arthritis therapy. Eur. J. Pharmacol. 2004. [Google Scholar] [CrossRef] [PubMed]
- Gantner, F.; Kupferschmidt, R.; Schudt, C.; Wendel, A.; Hatzelmann, A. In vitro differentiation of human monocytes to macrophages: Change of PDE profile and its relationship to suppression of tumour necrosis factor-alpha release by PDE inhibitors. Br. J. Pharmacol. 1997. [Google Scholar] [CrossRef] [PubMed]
- Amoruso, A.; Bardelli, C.; Gunella, G.; Fresu, L.G.; Ferrero, V.; Brunelleschi, S. Quantification of PPAR-gamma protein in monocyte/macrophages from healthy smokers and non-smokers: A possible direct effect of nicotine. Life Sci. 2007. [Google Scholar] [CrossRef] [PubMed]
- Babington, P.; Rajjoub, K.; Canady, J.; Siu, A.; Keidar, M.; Sherman, J.H. Use of cold atmospheric plasma in the treatment of cancer. Biointerphases 2015. [Google Scholar] [CrossRef] [PubMed]
- Turrini, E.; Laurita, R.; Stancampiano, A.; Catanzaro, E.; Calcabrini, C.; Maffei, F.; Gherardi, M.; Colombo, V.; Fimognari, C. Cold atmospheric plasma induces apoptosis and oxidative stress pathway regulation in T-lymphoblastoid leukemia cells. Oxid. Med. Cell. Longevity 2017. [Google Scholar] [CrossRef] [PubMed]
- Bardelli, C.; Gunella, G.; Varsaldi, F.; Balbo, P.; Del Boca, E.; Bernardone, I.S.; Amosuso, A.; Brunelleschi, S. Expression of functional NK1 receptors in human alveolar macrophages: Superoxide anion production, cytokine release and involvement of NF-κB pathway. Br. J. Pharmacol. 2005. [Google Scholar] [CrossRef] [PubMed]
- Van Gelden, B.; Slater, E.C. The extinction coefficient of cytochrome c. Biochim. Biophys. Acta 1962, 58, 593. [Google Scholar] [CrossRef]
- Myers, M.A.; McPhail, L.C.; Snyderman, R. Redistribution of protein kinase C activity in human monocytes: Correlation with activation of the respiratory burst. J Immunol. 1985, 135, 3411. [Google Scholar] [PubMed]
- Talmon, M.; Rossi, S.; Pastore, A.; Cattaneo, C.I.; Brunelleschi, S.; Fresu, L.G. Vortioxetine exerts anti-inflammatory and immunomodulatory effects on human monocytes/macrophages. Br. J. Pharmacol. 2018. [Google Scholar] [CrossRef] [PubMed]
- Boehm, D.; Heslin, C.; Cullen, P.J.; Bourke, P. Cytotoxic and mutagenic potential of solutions exposed to cold atmospheric plasma. Sci. Rep. 2016, 6, 21464. [Google Scholar] [CrossRef] [PubMed] [Green Version]
- Kalghatgi, S.; Friedman, G.; Fridman, A.; Clyne, A.M. Endothelial cell proliferation is enhanced by low dose non-thermal plasma through fibroblast growth factor-2 release. Ann. Biomed. Eng. 2010. [CrossRef] [PubMed]
- Wong-Ekkabut, J.; Xu, Z.; Triampo, W.; Tang, I.M.; Tieleman, D.P.; Monticelli, L. Effect of lipid peroxidation on the properties of lipid bilayers: A molecular dynamics study. Biophys. J. 2007. [Google Scholar] [CrossRef] [PubMed]
- Davies, M.J. Protein oxidation and peroxidation. Biochem. J. 2016. [Google Scholar] [CrossRef] [PubMed]
- Baran, C.P.; Zeigler, M.M.; Tridandapani, S.; Marsh, C.B. The role of ROS and RNS in regulating life and death of blood monocytes. Curr. Pharm. Des. 2004. [Google Scholar] [CrossRef]
- Bundscherer, L.; Bekeschus, S.; Tresp, H.; Hasse, S.; Reuter, S.; Weltmann, K.; Lindequist, U.; Masur, K. Viability of Human Blood Leukocytes Compared with Their Respective Cell Lines after Plasma Treatment. Plasma Med. 2013. [Google Scholar] [CrossRef]
- Zhang, Y.; Choksi, S.; Chen, K.; Pobezinskaya, Y.; Linnoila, I.; Liu, Z.G. ROS play a critical role in the differentiation of alternatively activated macrophages and the occurrence of tumor-associated macrophages. Cell Res. 2013. [Google Scholar] [CrossRef] [PubMed]
- Mantovani, A.; Sica, A.; Sozzani, S.; Allavena, P.; Vecchi, A.; Locati, M. The chemokine system in diverse forms of macrophage activation and polarization. Trends Immunol. 2004. [Google Scholar] [CrossRef] [PubMed]
- Duluc, D.; Delneste, Y.; Tan, F.; Moles, M.P.; Grimaud, L.; Lenoir, J.; Preisser, L.; Anegon, I.; Catala, L.; Ifrah, N.; et al. Tumor-associated leukemia inhibitory factor and IL-6 skew monocyte differentiation into tumor-associated macrophage-like cells. Blood 2007. [Google Scholar] [CrossRef] [PubMed]
- Yan, D.; Sherman, J.H.; Cheng, X.; Ratovitski, E.; Canady, J.; Keidar, M. Controlling plasma stimulated media in cancer treatment application. Appl. Phys. Lett. 2014. [Google Scholar] [CrossRef]


© 2018 by the authors. Licensee MDPI, Basel, Switzerland. This article is an open access article distributed under the terms and conditions of the Creative Commons Attribution (CC BY) license (http://creativecommons.org/licenses/by/4.0/).
Share and Cite
Crestale, L.; Laurita, R.; Liguori, A.; Stancampiano, A.; Talmon, M.; Bisag, A.; Gherardi, M.; Amoruso, A.; Colombo, V.; Fresu, L.G. Cold Atmospheric Pressure Plasma Treatment Modulates Human Monocytes/Macrophages Responsiveness. Plasma 2018, 1, 261-276. https://doi.org/10.3390/plasma1020023
Crestale L, Laurita R, Liguori A, Stancampiano A, Talmon M, Bisag A, Gherardi M, Amoruso A, Colombo V, Fresu LG. Cold Atmospheric Pressure Plasma Treatment Modulates Human Monocytes/Macrophages Responsiveness. Plasma. 2018; 1(2):261-276. https://doi.org/10.3390/plasma1020023
Chicago/Turabian StyleCrestale, Letizia, Romolo Laurita, Anna Liguori, Augusto Stancampiano, Maria Talmon, Alina Bisag, Matteo Gherardi, Angela Amoruso, Vittorio Colombo, and Luigia G. Fresu. 2018. "Cold Atmospheric Pressure Plasma Treatment Modulates Human Monocytes/Macrophages Responsiveness" Plasma 1, no. 2: 261-276. https://doi.org/10.3390/plasma1020023