Normal Cyclic Variation in CO2 Concentration in Indoor Chambers Decreases Leaf Gas Exchange and Plant Growth


Adaptive Cropping Systems Laboratory, USDA-ARS, Beltsville, MD 20705-2350, USA
Plants 2020, 9(5), 663; https://doi.org/10.3390/plants9050663
Submission received: 5 May 2020
/
Revised: 19 May 2020
/
Accepted: 21 May 2020
/
Published: 23 May 2020
(This article belongs to the Section Plant Physiology and Metabolism)
Abstract
:Attempts to identify crop genetic material with larger growth stimulation at projected elevated atmospheric CO2 concentrations are becoming more common. The probability of reductions in photosynthesis and yield caused by short-term variation in CO2 concentration within elevated CO2 treatments in the free-air CO2 enrichment plots raises the question of whether similar effects occur in glasshouse or indoor chamber experiments. These experiments were designed to test whether even the normal, modest, cyclic variation in CO2 concentration typical of indoor exposure systems have persistent impacts on photosynthesis and growth, and to explore mechanisms underlying the responses observed. Wheat, cotton, soybeans, and rice were grown from seed in indoor chambers at a mean CO2 concentration of 560 μmol mol−1, with “triangular” cyclic variation with standard deviations of either 4.5 or 18.0 μmol mol−1 measured with 0.1 s sampling periods with an open path analyzer. Photosynthesis, stomatal conductance, and above ground biomass at 20 to 23 days were reduced in all four species by the larger variation in CO2 concentration. Tests of rates of stomatal opening and closing with step changes in light and CO2, and tests of responses to square-wave cycling of CO2 were also conducted on individual leaves of these and three other species, using a leaf gas exchange system. Reduced stomatal conductance due to larger amplitude cycling of CO2 during growth occurred even in soybeans and rice, which had equal rates of opening and closing in response to step changes in CO2. The gas exchange results further indicated that reduced mean stomatal conductance was not the only cause of reduced photosynthesis in variable CO2 conditions.
Keywords:
CO2; light; photosynthesis; plant growth; gas exchange; stomatal opening; stomatal closing; CO2 variation1. Introduction
The concentration of CO2 in the atmosphere has increased from about 280 μmol mol−1 in 1900 to over 407 μmol mol−1 currently [1] and is projected to continue to increase rapidly [2]. Higher than current CO2 concentrations often increase photosynthesis and growth of C3 species, and often increase crop yields [3]. Cultivar differences in yield response to elevated CO2 were found in many of the major C3 crop species, including wheat, soybeans, rice, barley, and beans [4,5,6,7,8,9,10,11,12,13,14,15,16,17,18,19,20,21], cf. [22], and this may provide an avenue to increase future yields. Because of this possibility, the screening of cultivars for yield increases at elevated CO2 has become more common [5,7,8,9,10,11,16,17,18].
Field-based screening for CO2 responsiveness in free-air carbon dioxide enrichment (FACE) systems has the advantage of larger experimental areas than many indoor facilities, which allow more lines to be compared simultaneously, and can have otherwise natural field conditions of weather and soil. FACE systems were used in several species to screen cultivars for CO2 responsiveness [5,6,7,9,14,18]. However, FACE systems generally have large short-term variation in CO2 concentration for elevated CO2 treatments [23]. This recent review [23] concluded that short-term variation in CO2 concentrations in FACE systems reduce plant growth relative to that in more constant elevated CO2 environments such as open top chambers. In that review, it was proposed that reduced growth occurred because of reduced photosynthesis at least partly caused by reduced stomatal conductance. Slower plant growth caused by variable CO2 raises the question of whether the superior response of a genotype to elevated CO2 in a FACE system could reflect better tolerance to CO2 variation rather than a better response to elevated CO2. It also adds uncertainty to current estimates of the amount of increased plant growth to be expected as atmospheric CO2 increases.
Controlled environment facilities such as growth cabinets, glasshouses, and tunnels can provide elevated CO2 conditions with much smaller short-term CO2 variation than FACE systems. However, not all such systems have the same CO2 control characteristics. For example, some air-tight sunlit systems use variable flow valves such as mass flow controllers to control CO2, while on–off control valves are more common in glasshouses and artificially lighted chambers. In many cases, the controlling CO2 analyzers are outside of the plant compartment, with samples of air pumped to closed analysis cells through tubing and water traps, which result in lags in control despite rapid-response analyzers. The CO2 control limits are often given as mean ± x μmol mol−1, as detected by the remote analyzers, but “x” may be the standard deviation or the maximum deviation. It is most often not specified which type of deviation “x” indicates, and values of “x” are sometimes not even provided.
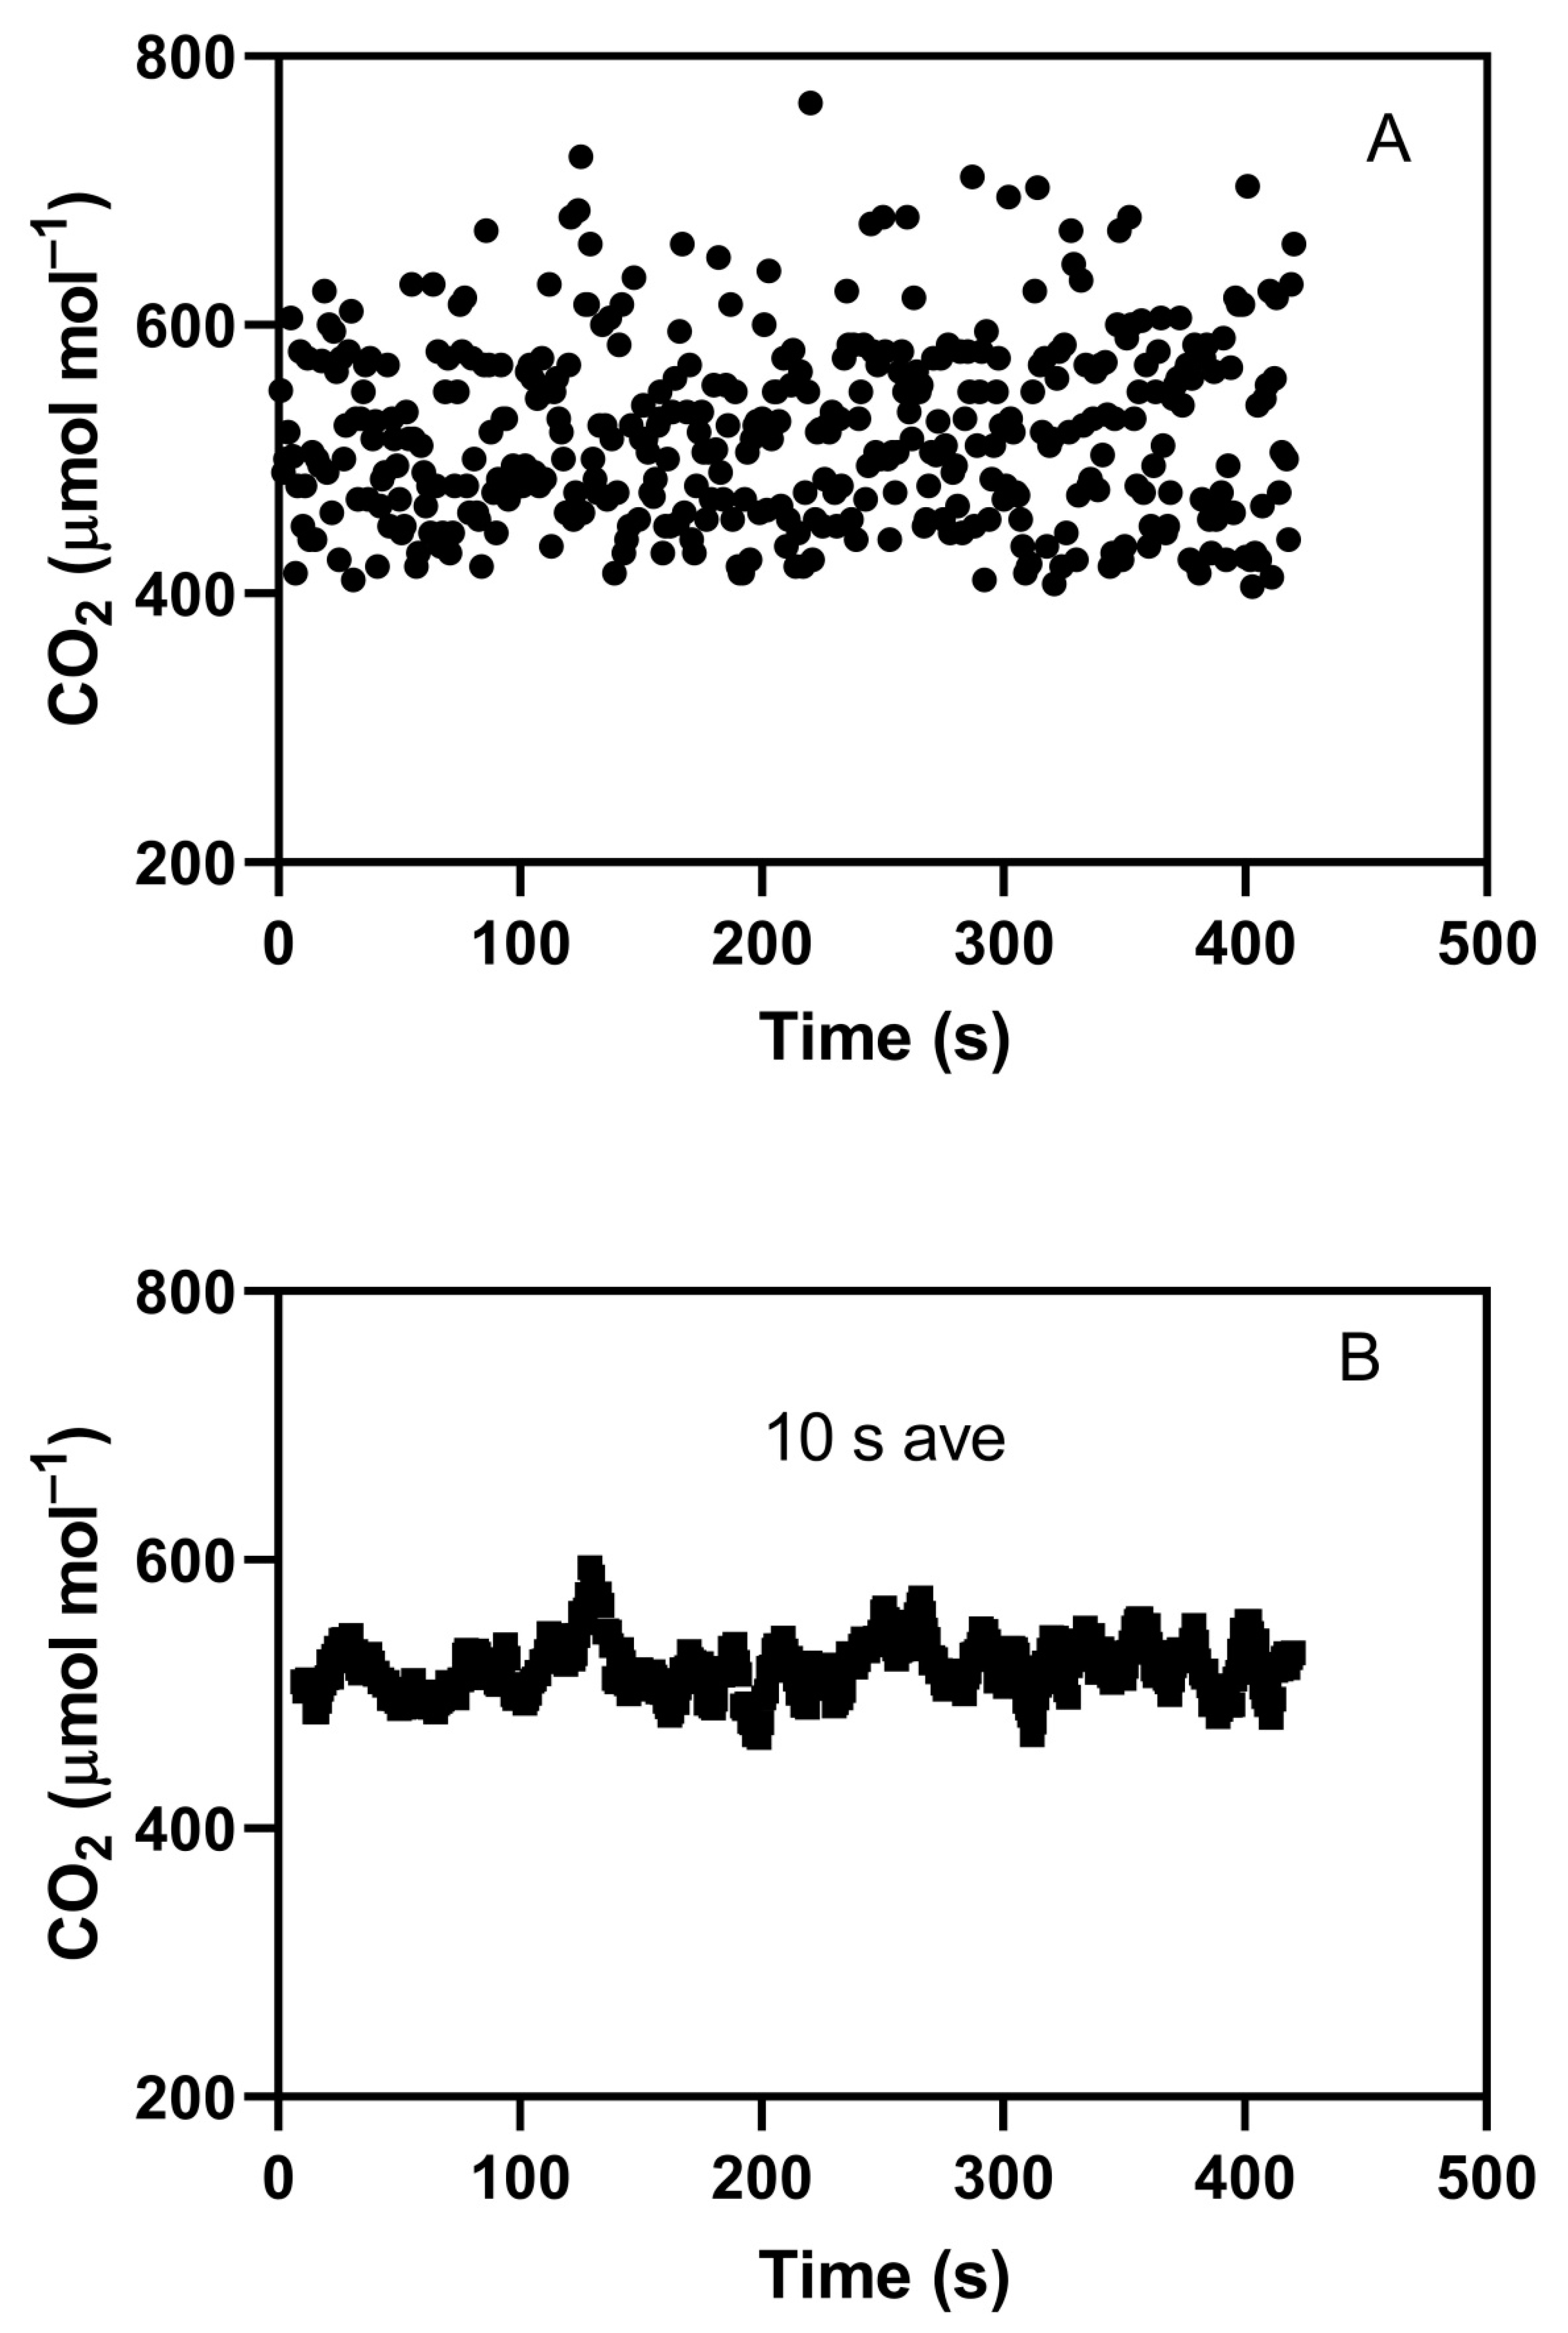
An example of an indoor chamber with on–off CO2 control showing a large degree of short-term CO2 variation is shown in Figure 1A. In this case, an M-18 chamber, interior dimensions 90 × 180 cm, with an interior height of 190 cm (EGC Inc., Chagrin Falls, OH, USA) was controlled with a TC3 controller (EGC Inc., Chagrin Falls, OH, USA). CO2 for control was sampled with an external WMA-4 CO2 analyzer (PP Systems, Amesbury, MA, USA) just outside the chamber, with analyzer output sent to the TC3 controller, which utilized proportional-integral-derivative PID control of an on–off solenoid valve. Air for CO2 control purposes was sampled from a shaded, ventilated box about 30 cm above the top of a full soybean canopy with a leaf area index of about 4. Pure CO2 was added to the chamber at the outlet of the air circulation fans mounted in the chamber side walls. Chamber air flow was downward in the plant compartment and upward through the side walls, which contained the temperature-control heat exchangers. For short-term CO2 analysis, air was sampled for 0.1 s at 1 s intervals using a LiCor open-path CO2 analyzer (LI-7500, Li-Cor, Inc., Lincoln, NE, USA) mounted horizontally 10 cm above the center of the plant canopy. The target CO2 concentration was 515 μmol mol−1. The standard deviation of CO2 detected by the WMA-4 analyzer was 15 μmol mol−1, while that detected by the Li-Cor analyzer was 68 μmol mol−1, with mean values of 515 and 520 μmol mol−1, respectively. The same 0.1 s data, but with a 10 s running average applied, is shown in Figure 1B. This running average also produced a standard deviation of about 15 μmol mol−1. A standard deviation of 15 μmol mol−1 is in the low range of those reported for elevated CO2 treatments in indoor chambers. This example indicates that actual short-term variation in CO2 in indoor chambers may routinely be much larger than detected by the analyzer controlling CO2 injection and documenting the CO2 control, because of averaging during sampling by the controlling analyzer. The primary purpose of this paper is to test whether even the normal and modest cyclic variation in CO2 concentration that occurs in most indoor chambers has an impact on plant growth through its effect on stomatal conductance and photosynthesis.
It is well known that stomatal closing after a decrease in light is often more rapid than opening after an increase in light [24]. If that were also true for opening and closing responses to CO2 changes, variation in CO2 could decrease mean stomatal conductance and photosynthesis, depending on the frequency of changes in CO2. In these experiments, two different amplitudes of cyclic variation in CO2 concentration, as detected by an open path analyzer, were tested for persistent differences in photosynthesis and stomatal conductance, and for aboveground biomass production in four crop species, cotton, rice, soybean, and wheat, in indoor chambers. Tests of rates of leaf stomatal opening and closing to large step changes in CO2 and light were made in these four species and three other species, grain amaranth, smooth pigweed, and velvet leaf. Two C4 species, grain amaranth and smooth pigweed, were tested because stomatal conductance response to CO2 is often stronger in C4 than in C3 species [24]. The step changes in CO2 were used to test whether stomatal conductance responses to the normal cyclic CO2 variation correlated with differences in rates of stomatal opening and closing in response to CO2. Step changes in light were used to test whether relative rates of opening and closing with changes in CO2 were correlated with rates of opening and closing in response to changes in light. Impacts of larger amplitude cycles of CO2 on stomatal conductance and photosynthesis were also assessed in order to further examine the possible role of stomatal conductance in limiting photosynthesis. These later tests utilized square-wave cycles of CO2 such that photosynthesis could be measured at the end of each half-cycle, which was not possible with triangular-wave cycles.
2. Results
2.1. Responses of Growth to CO2 Cycle Amplitude
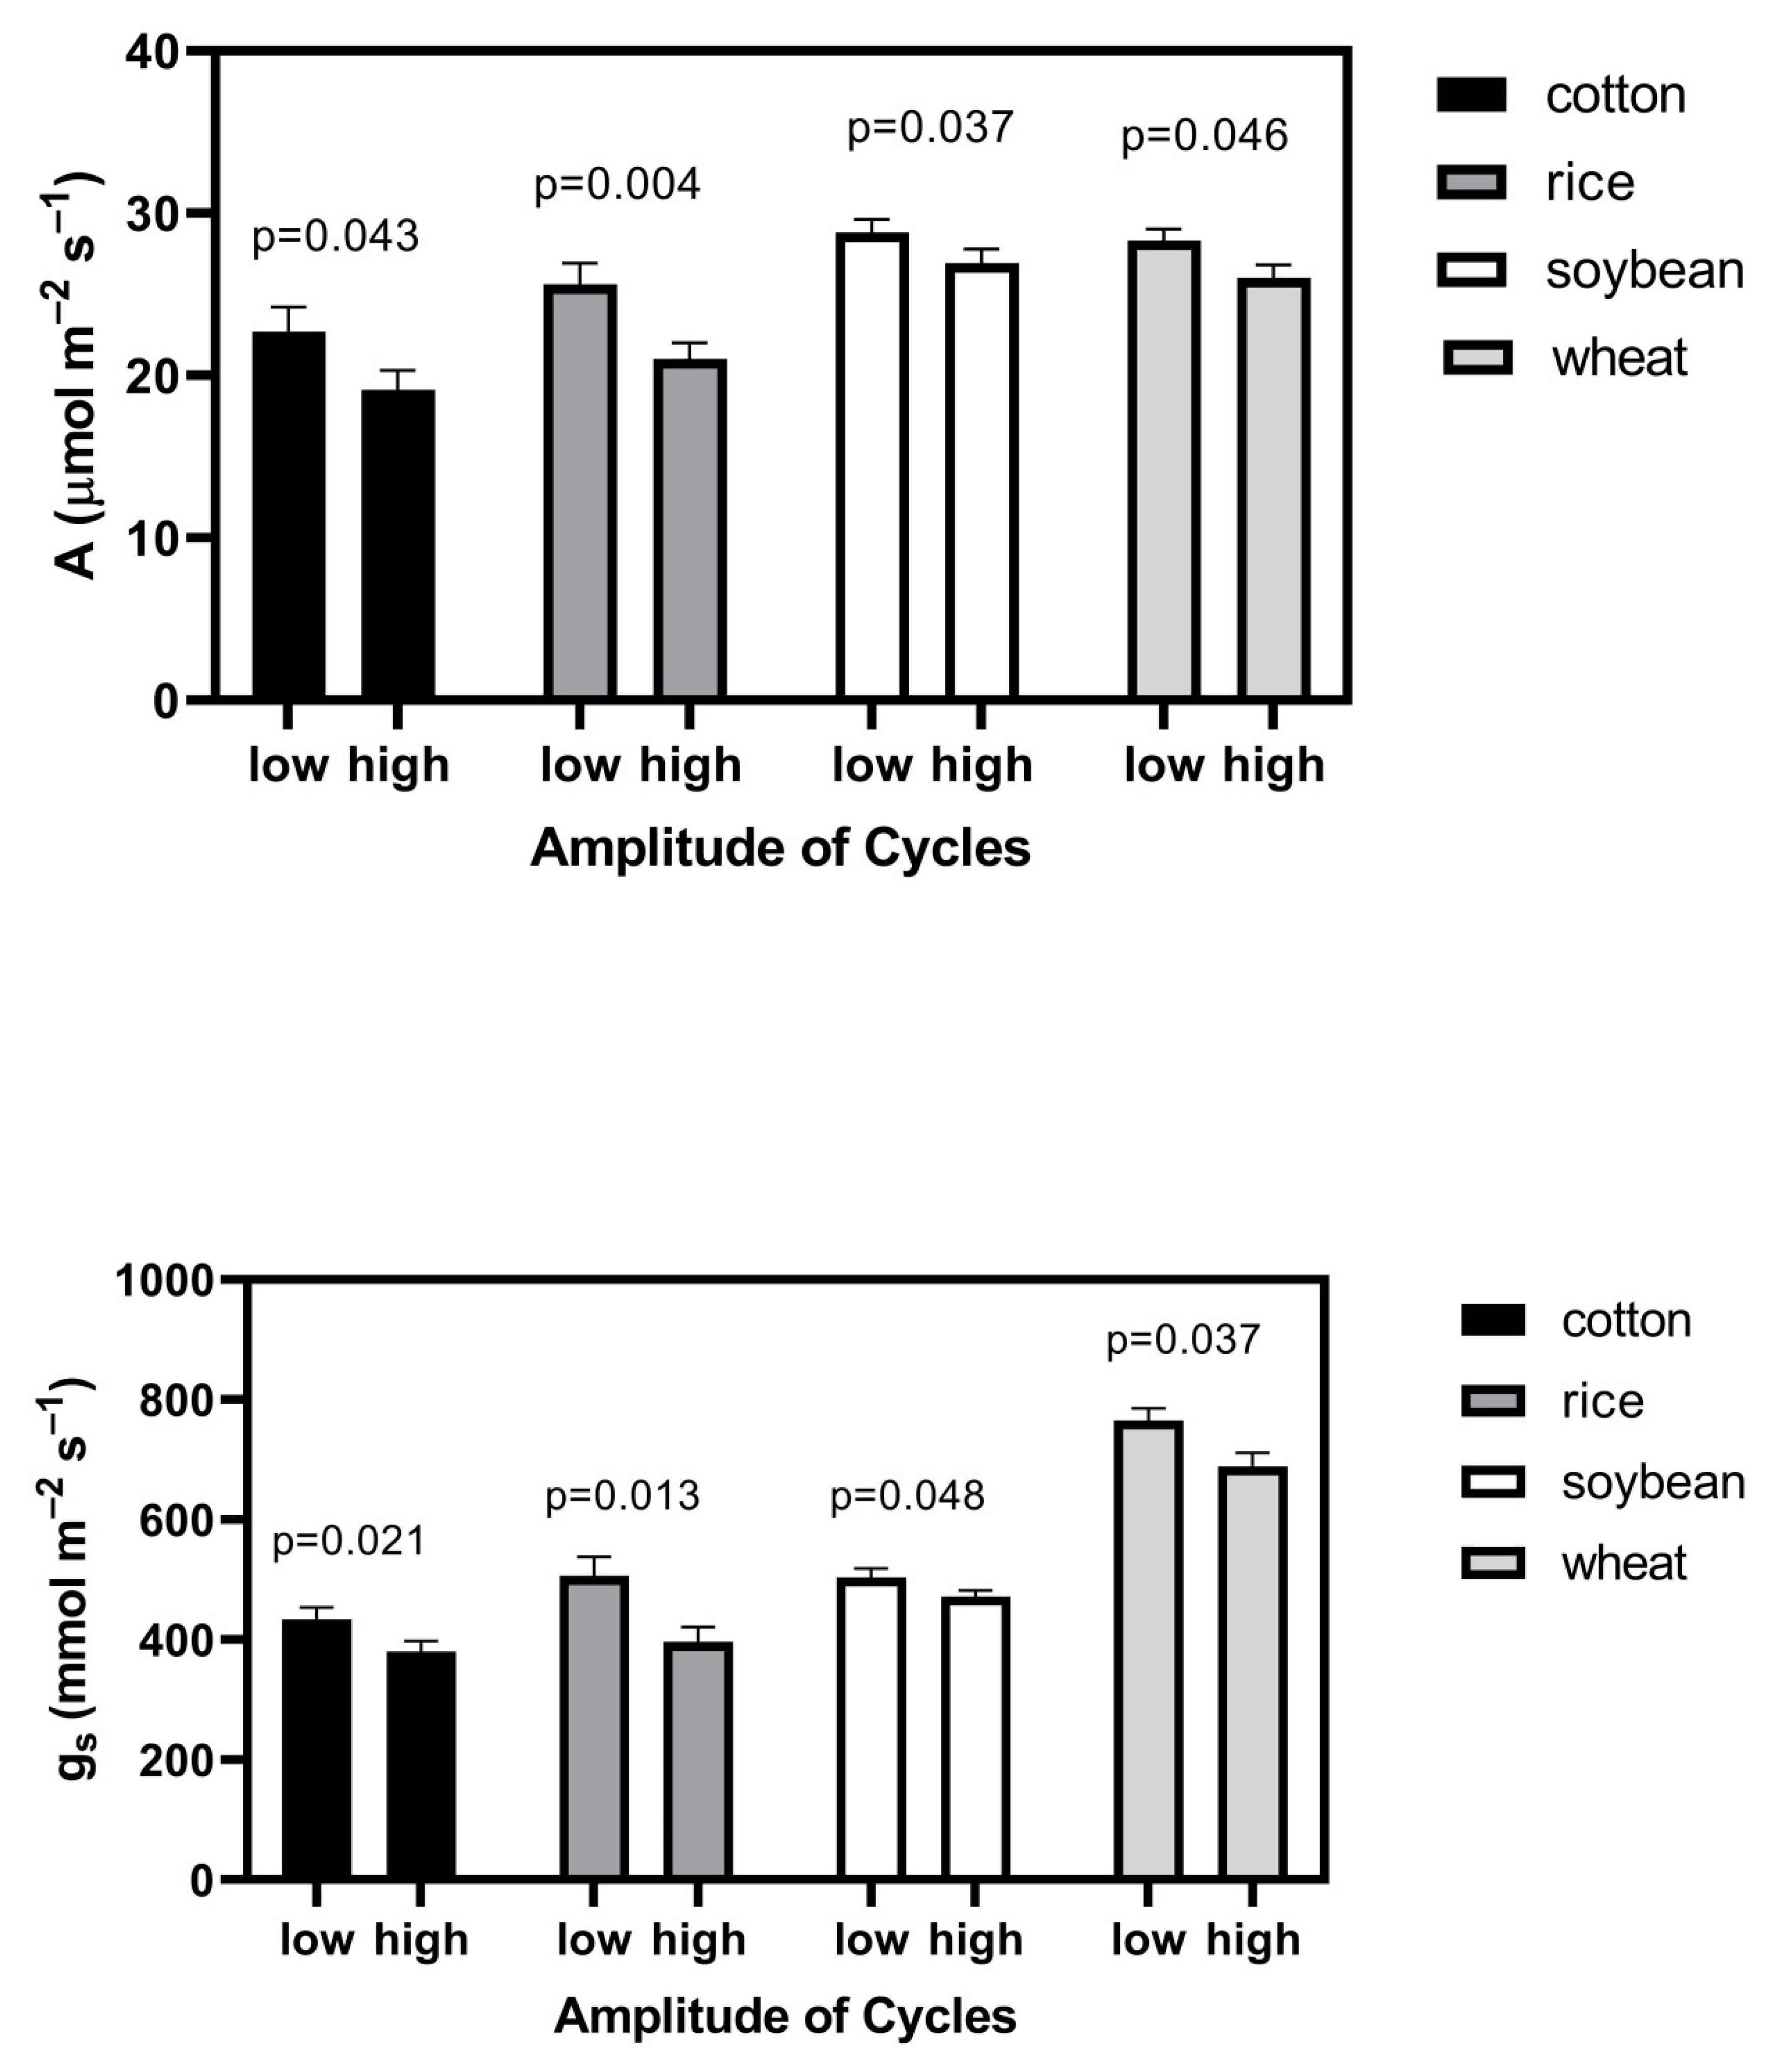
The aboveground dry mass of plants was significantly less in all four species when there were larger amplitude cycles in CO2 (Table 1). Both leaf photosynthesis and stomatal conductance were lower when plants were grown with the larger CO2 fluctuation (Figure 2). The relative effect of larger CO2 cycles on photosynthesis was very similar to that on stomatal conductance in each species (Figure 2). Substomatal CO2 concentrations did not differ significantly between the CO2 cycle treatments in any species, with mean (SD) values for low amplitude and high amplitude cycles of 436 (8) and 440 (10) μmol mol−1, respectively, in cotton, 450 (13) and 441 (11) in rice, 447 (11) and 446 (14) in soybean, and 466 (8) and 469 (10) in wheat.
2.2. Rates of Stomatal Opening and Closing in Response to Step Changes in CO2 and Light
In order to test whether lower stomatal conductance in response to increased variation in CO2 resulted from slower stomatal opening than closing, rates of opening and closing in response to changes in CO2 were determined. These opening and closing rates were compared with rates of stomatal conductance responses to changes in light levels that had the equivalent effects on values of steady-state stomatal conductance.
Stomatal responses to changes in both CO2 and light were essentially linear with time, after initial lag periods of 2 to 7 min of no change. Lag periods for opening responses were usually longer than those for closing responses (not shown). The final transition from changing stomatal conductance to constant conductance was abrupt in all cases. The opening and closing times reported include the lag periods.
For changes in CO2, opening times when going from 800 to 400 μmol mol−1 were, with two exceptions, longer than closing times (400 to 800 μmol mol−1), by factors of about 1.5 to 2 (Table 2). The two exceptions were soybean and rice, where opening times did not differ from closing times. The two C4 species were unexceptional compared to the five C3 species.
For changes in light, results were even more variable among species. Closing was faster than opening in only three species, grain amaranth, rice, and velvet leaf. Opening and closing times were nearly equal to each other in three species, soybean, cotton, and smooth pigweed. In wheat, opening was faster than closing (Table 2).
2.3. Responses to Square-Wave Cycles of CO2 (400 and 800 μmol mol−1)
2.3.1. Stomatal Conductance
There was a clear distinction between the C3 and C4 species in responses of stomatal conductance to the square-wave cycles of CO2. In the two C4 species, grain amaranth and smooth pigweed, the final stomatal conductance equaled the mean of the steady-state conductance values at 400 and 800 μmol mol−1 (Table 3). This conductance value was somewhat larger than the steady-state stomatal conductance value at 600 μmol mol−1. In the C3 species, the final stomatal conductance values were in all cases equal to or less than the steady-state values at 800 μmol mol−1 (Table 3), and substantially less than the steady-state values at 600 μmol mol−1. An example time course of changes in stomatal conductance of rice during the cyclic CO2 treatment is given in Figure 3, and shows a gradual decrease in conductance in this case.
2.3.2. Photosynthesis
The final value of photosynthesis measured at constant 600 μmol mol−1 was less than the initial steady-state value at that concentration in three of the seven species, wheat, rice, and soybean (Table 4), but only by 6% to 8%, and was not different in the other four species. The relative reduction in photosynthesis in these three species was less than the relative reduction in stomatal conductance, which was 15% to 19%. On the other hand, the final average value of photosynthesis at 600 μmol mol−1 (i.e., the mean rate during the final 400 to 800 μmol mol−1 cycle) was in all species lower than the initial steady-state rate of photosynthesis at 600 μmol mol−1, by 8 to 14% (Table 4). This fairly small overall reduction resulted primarily from lower rates at 400 μmol mol−1 during the last cycle compared to initial steady-state rates at 400 μmol mol−1. In the case of soybean, higher rates occurred at 800 μmol mol−1 during the last cycle than the initial steady-state rates at 800 μmol mol−1 (Figure 4), which also illustrates that the higher rates after cycling occurred despite lower Ci. In cotton and both C4 species, higher photosynthetic rates at 800 μmol mol−1 also occurred after the last cycle (Table 5). Only wheat had lower rates at 800 μmol mol−1 during the last cycle than occurred in the initial steady-state measurement (Table 5).
3. Discussion
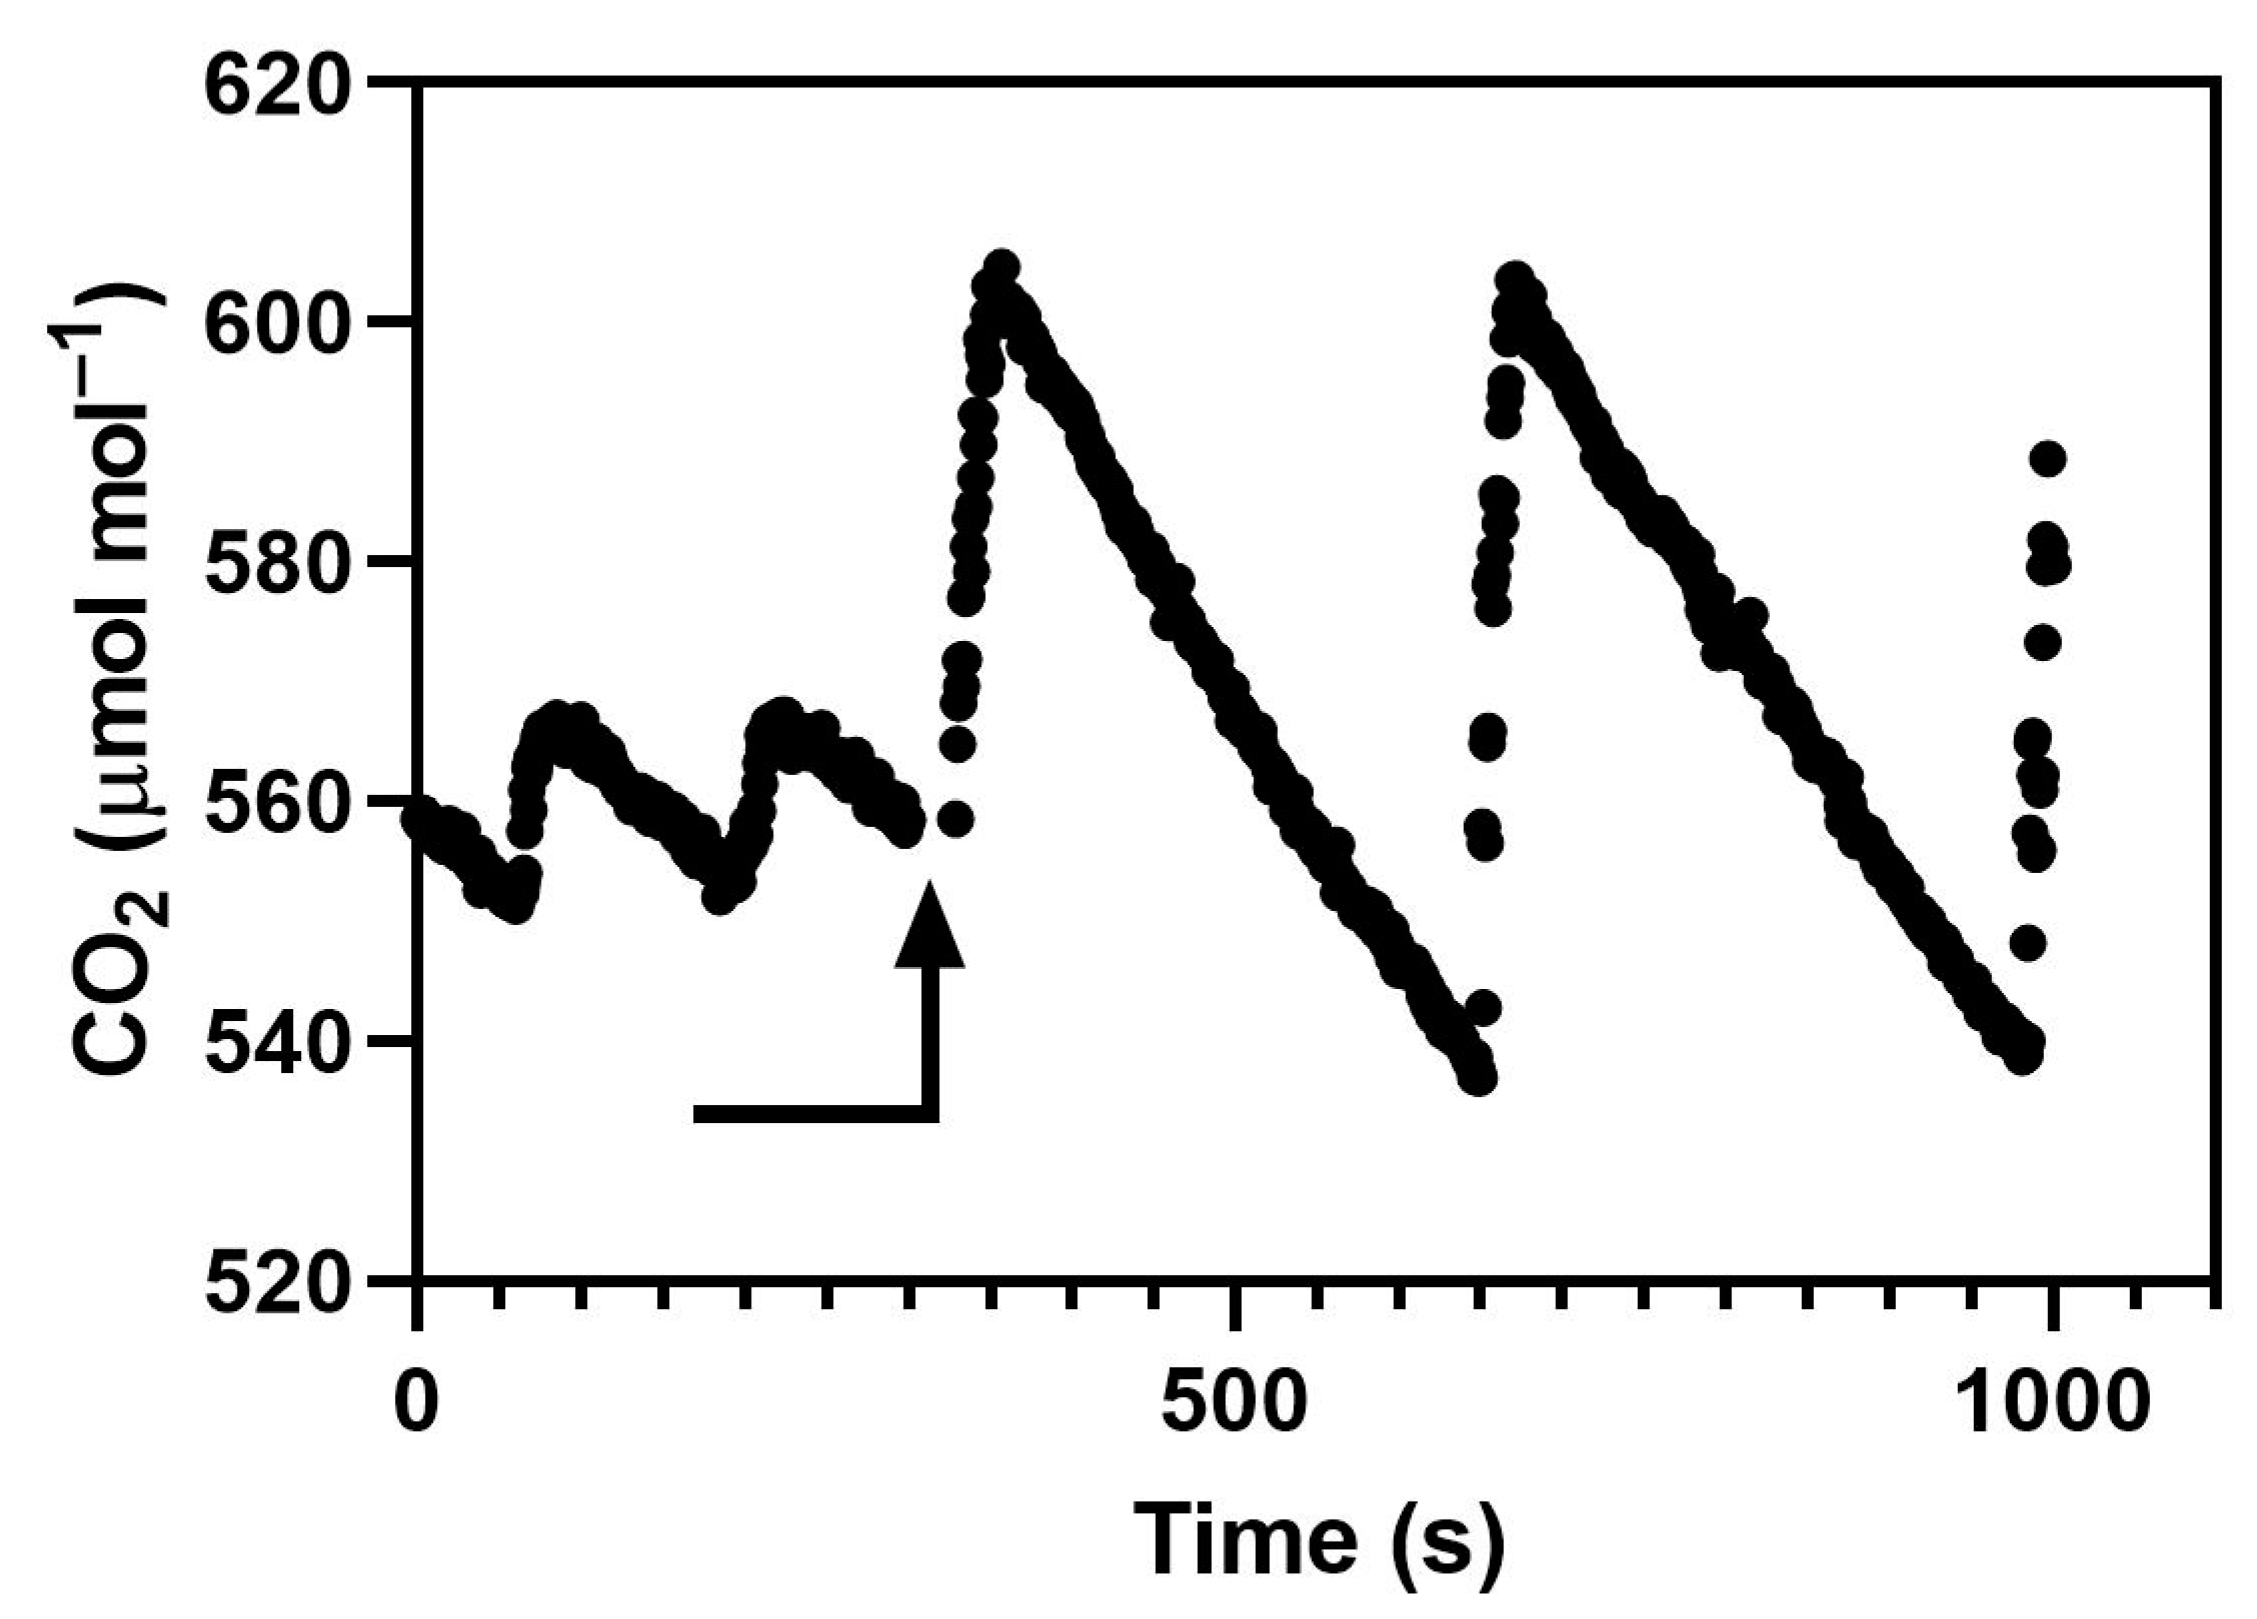
Chambers in which CO2 addition is controlled by an on–off valve will have cyclic CO2 concentrations. The amplitude of the cycle depends on the lag in the CO2 measurement system, the flow rate of injected CO2, and the rate of loss of CO2 from the chamber, whether from leakage or from plant usage. The striking difference in CO2 variation between the examples shown in Figure 1A and Figure 5 was caused by differences in CO2 use rate caused by differences in canopy leaf area, not by the CO2 control systems. The leaf area index was about 4 in Figure 1 and less than 0.5 in Figure 5. Experiments screening lines of crops for the CO2 responsiveness of yield in indoor chambers would have canopy leaf areas more like Figure 1 than Figure 5 most of the time. At a minimum, variation in CO2 as shown in Figure 1A would reduce mean photosynthesis relative to a constant mean CO2 because of the curvilinear response of photosynthesis to CO2 [23]. Our experimental results also show that cyclic variation in CO2 such as would occur in all indoor chambers and glasshouses with on–off CO2 control decreases photosynthesis and growth compared to a more nearly constant concentration. The smaller amplitude CO2 cycles used in this experiment and shown in Figure 5 require very careful balancing of the CO2 injection rate with the plant use of CO2, and would not be practical to achieve in long-term studies of plant growth. Thus, short-term variation in CO2 sufficient to inhibit photosynthesis and growth may frequently occur in indoor chambers with CO2 addition, but would not be apparent with the usual CO2 monitoring systems. Of course, for indoor chambers even “ambient” CO2 treatments usually require CO2 addition when plants are large, so variation in CO2 could affect plants in both “ambient” and “elevated” treatments, but whether such effects would be equal among CO2 treatments is unknown. In temperature gradient chambers, the standard deviation of CO2 measured with a closed cell analyzer was 17–18 μmol mol−1 in the ambient chambers and 36–37 μmol mol−1 in the elevated chambers [13]. I know of no examples of measurement of short-term CO2 variation for air-tight sunlit chambers, but presumably “ambient” and “elevated” treatments in sunlit chambers would have identical CO2 control systems and probably similar CO2 variation. Thus, indoor chambers and sunlit chambers contrast with field-based systems like free-air carbon dioxide enrichment (FACE) systems, where “ambient” treatments would have much less short-term variation in CO2 than elevated treatments [23]. I do not know of information about short-term CO2 variation in ambient and elevated CO2 glasshouse compartments. The persistently reduced photosynthesis and stomatal conductance, and reduced plant growth in the four species observed in these experiments with only modest cyclic variation in CO2 provides a possible explanation for slower plant growth in elevated CO2 in FACE systems compared with open top chamber (OTC) systems, although reduced photosynthesis in FACE has yet to be demonstrated experimentally. The results presented here make it unlikely that long-term exposure to CO2 variation in FACE would eliminate its negative effects on leaf gas exchange. The reductions in biomass production due to cycling of CO2 in these experiments ranged from about 10% to 20% in cotton, rice, soybean, and wheat, which is smaller than the approximately 35% reduction summarized from FACE experiments [23]. However, the peak-to-peak variation in CO2 in these experiments was less than 80 μmol mol−1, while in FACE systems it was often more than 200 μmol mol−1, and the FACE experiments covered a much longer period of plant growth.
The results of responses to step changes in environment clearly indicated that lower stomatal conductance resulting from CO2 variation was unrelated to whether stomatal opening was slower than closing in response to step changes in environment. Lower stomatal conductance at 600 μmol mol−1 CO2 occurred after cycles of CO2 in all C3 species examined, but not in either C4 species. The lower stomatal conductance after repeated cycles of CO2 in the C3 species suggests that the cycling resulted in long lags in stomatal reopening. This is similar to slow stomatal reopening after treatments consisting of brief pulses of high CO2 in wheat and rice [25].
The reduction in the final average value of photosynthesis at 600 μmol mol−1 (i.e., throughout the final 400 to 800 μmol mol−1 cycle) compared with the initial steady-state rate of photosynthesis at 600 μmol mol−1, was 8% to 14% (Table 3) in all of the species in this study. “Triangular” cycles of CO2 applied to cotton and wheat in open top chambers in the field similarly reduced photosynthesis measured at 550 μmol mol−1 by 7% to 17% in cotton and wheat flag leaves (Tables 1 and 3 in [26]). Holtum and Winter [27] found larger, about 30% reductions in photosynthesis in two tree species in response to “sawtooth” (triangular) cycles of CO2, but provided no information about stomatal conductance.
The apparent nonstomatal inhibition of photosynthesis in the four crop species grown with the larger amplitude of cyclic CO2 variation could possibly be caused by patchy stomatal closure. Steady-state photosynthesis models, even when considering slower stomatal opening than closing, do not account for the observations [28]. Complete closure of stomata in patches would essentially stop both CO2 and H2O exchange from the patches and reduce photosynthesis and stomatal conductance by the proportion of leaf surface area of the closed patches, without there being any change in calculated values of substomatal CO2 [29,30]. Patchy stomatal behavior frequently occurs in response to sudden environmental changes [31,32], so it seems possible that sudden changes in CO2 concentration could cause patchy stomatal conductance. Reopening of closed patches may also have a substantial lag period, consistent with the prolonged inhibition of gas exchange seen in response to both pulses of CO2 [25] and observed in this study.
On the other hand, the large amplitude square-wave cycles of CO2 in this study probably did not induce patchy stomatal closure, as evidenced by the lack of reduction in photosynthesis in most species when measured at 800 μmol mol−1. Patchy stomatal closure would have resulted in equal relative reductions in photosynthesis measured at both 400 and 800 μmol mol−1, which did not occur in this experiment. Modeling suggested that stomatal conductance remaining at the steady-state value at the high CO2 concentration might explain significantly reduced photosynthesis during square-wave cycles of CO2 [28]. That pattern of stomatal response occurred in all of the C3 species in this study in response to square-wave CO2 cycling. However, in this study, in C3 species the square-wave CO2 cycling resulted in a shift in the response of A to Ci, which in some cases actually increased photosynthesis at the highest external concentration despite lower Ci (e.g., Figure 4, Table 5). This response was not previously reported, but suggests a loosening of the limitation to photosynthesis imposed by electron transport processes after exposure to low CO2.
4. Materials and Methods
4.1. Response of Growth to CO2 Cycling
Cotton (Gossypium hirsutum cv. Delta Pine 555), rice (Oryza sativa cv. Akitakomachi), soybean (Glycine max cv. Clark and wheat (Triticum aestivum cv. Choptank) plants were grown in two M-12 growth chambers (EGC, Chagrin Falls, OH, USA) both maintained at 26/20 °C day/night air temperature, a dewpoint temperature of 18 °C, with 1000 μmol m−2 s−1 photosynthetic photon flux density (PPFD) from high pressure sodium and metal halide lamps for 12 h per day. The chamber interior dimensions were 91 × 120 cm, with an interior height of 120 cm. Chamber air was mixed at 5 m3 per minute. Plants were grown from seed, one per 10 cm square pot, in pots filled with 1.9 L of a medium-grade vermiculite and flushed daily with a complete nutrient solution. In each chamber run, there were six pots of each species, with pots evenly spaced across the bed. Plants were harvested at 20 days after planting in soybean, 21 days in wheat, 22 days in rice, and 23 days in cotton. The maximum leaf area index was less than 0.5. Both chambers had the same types of CO2 control systems, consisting of a WMA-4 CO2 analyzer outside the chamber, with CO2 addition by an on–off solenoid valve controlled by a PID controller (model CN76000, Omega Engineering, Stamford, CT), which adjusted the amount of time that the solenoid was on to achieve mean CO2 of 560 μmol mol−1. Two different standard deviations of CO2, 4.5 or 18.0 μmol mol−1, were achieved in the two chambers by having different CO2 injection flow rates when the solenoid valves were open, resulting in more overshooting of CO2 in one chamber than the other despite the PID control. The two CO2 injection rates were approximately 0.2 and 0.8 L per minute. An open path CO2 analyzer (LI-7500, LiCor, Inc., Lincoln, NE, USA) sampling CO2 for 0.1 s, every 1 s was used to characterize the CO2 cycling within both chambers several times during each approximately 3 week chamber run (Figure 5). There were four chamber runs, with the CO2 variation treatments switched between chambers for each run.
Rates of photosynthesis and stomatal conductance were measured 19 days after planting using a CIRAS-3 portable photosynthesis system with the leaf cuvette inside the chambers. Cuvette air temperature and leaf-to-air water vapor pressure difference were set to match the growth conditions, and the chamber light system provided the growth PPFD to the leaves inside the cuvette. The analysis CO2 concentration was set to 560 μmol mol−1. Gas exchange parameters were recorded within a few minutes of placing leaves into the cuvette, before any change in stomatal conductance caused by the switch from cyclic to constant CO2 occurred. Measurements were made on upper, mature leaves of all plants near midday.
4.2. Rates of Response to Step Changes in CO2
Plants of cotton, rice, soybean and wheat, as well as velvet leaf (Abutilon theophrasti), grain amaranth (Amaranthus hypochondriacus × hybridus cv. Plainsman), and smooth pigweed (Amaranthus hybridus) were grown under the same conditions as previously described, except at 400 ± 15 (S.D.) μmol mol−1 CO2. Plants were grown from seed, one plant per pot. Pots were filled with a medium grade vermiculite and flushed daily with a complete nutrient solution. Leaf gas exchange measurements conducted on recently fully expanded leaves. Gas exchange measurements were all made at 26 °C, with a VPD of about 1.5 kPa, using a CIRAS-3 photosynthesis system (PP Systems, Amesbury, MA, USA). Plants and the measurement cuvette were inside the growth chamber. Light for the gas exchange was provided by LED lamps set at 38% red, 37% green, and 25% blue for determination of rates of stomatal opening and closing and photosynthetic responses to programmed cycles of CO2. These percentages of red, green and blue give the closest approximation to sunlight for these LEDs.
For step changes in CO2, light was 1500 μmol m−2 s−1, and CO2 was stepped from 400 to 800 μmol mol−1 (or the reverse) until stomatal conductance responded and then became stable, and then switched to the opposite CO2 until stomatal conductance responded and then became stable again. For step changes in light, CO2 was kept at 400 μmol mol−1, light was initially 1500 μmol m−2 s−1, and then reduced to between 200 and 500 μmol m−2 s−1, depending on the species. The lower light level was based on initial tests of the PPFD required to reduce stomatal conductance to approximately that at high light at 800 μmol mol−1 CO2 for each species. Rates of stomatal opening and closing caused by changes in CO2 and light were determined using 3 to 5 leaves per species. Stomatal conductances were considered stable when changes in conductance of less than 10 mmol m−2 s−1 occurred in two minutes.
4.3. Gas Exchange Responses to Large Amplitude Cycles of CO2
Steady-state values of assimilation (A) and stomatal conductance (gs) were first measured at 1500 μmol m−2 s−1 PPFD, at 400, 600, and 800 μmol mol−1 CO2 at 26 °C, with a VPD of about 1.5 kPa. Leaves were then exposed to square-wave cycles of CO2 between 400 and 800 μmol mol−1, with a period of 168 s until A and gs were stable. They became stable in less than 15 min of cycling of CO2 in all cases. The 168 s period was chosen to ensure that gas exchange rates had stabilized after each switch of CO2, i.e., to overcome instrumental lags, so that accurate A and gs values could be recorded at the end of each half cycle. This stability is illustrated in Figure 3, where three determinations of A and gs were stable after each step in the cycles. At the end of the CO2 cycling, photosynthesis was again measured at 600 μmol mol−1 for comparison with initial values at that concentration. These tests were conducted on 3 to 5 leaves per species.
5. Conclusions
Stomatal opening was not universally slower than closing in response to CO2 changes among species, nor in response to changes in PPFD. Rates of opening and closing caused by changes in PPFD were not good predictors of rates of opening and closing caused by changes in CO2. Stomatal conductance under cyclic CO2 treatments was not well predicted by rates of opening and closing in response to step changes in CO2. Even modest short-term variation in CO2, in this case cycles with a standard deviation of 18 μmol mol−1, with a mean value of 560 μmol mol−1, caused a persistent apparent nonstomatal inhibition of photosynthesis, in addition to lower stomatal conductance, and resulted in slower plant growth in all four species that were tested.
Funding
This research received no external funding.
Conflicts of Interest
The author declares no conflict of interest.
References
- Available online: https://www.esrl.noaa.gov/gmd/ccgg/trends/full.html (accessed on 1 April 2020).
- Available online: https://www.ipcc-data.org/observ/ddc_co2.html (accessed on 1 April 2020).
- Kimball, B.A.; Kobayashi, K.; Bindi, M. Responses of agricultural crops to free-air CO2 enrichment. Adv. Agron. 2002, 77, 293–368. [Google Scholar]
- Baker, J.T. Yield responses of southern US rice cultivars to CO2 and temperature. Agric. For. Meteorol. 2004, 122, 129–137. [Google Scholar] [CrossRef]
- Bishop, K.A.; Betzelberger, A.M.; Long, S.P.; Ainsworth, E.A. Is there potential to adapt soybean (Glycine max Merr.) to future CO2? An analysis of the yield response of 18 genotypes in free–air CO2 enrichment. Plant Cell Environ. 2015, 38, 1765–1774. [Google Scholar] [CrossRef] [PubMed]
- Bunce, J.A. Elevated carbon dioxide effects on reproductive phenology and seed yield among soybean cultivars. Crop Sci. 2015, 55, 339–343. [Google Scholar] [CrossRef]
- Bunce, J. Using FACE Systems to Screen Wheat Cultivars for Yield Increases at Elevated CO2. Agronomy 2017, 7, 20. [Google Scholar] [CrossRef] [Green Version]
- Clausen, S.K.; Frenck, G.; Linden, L.G.; Mikkelsen, T.N.; Lunde, C.; Jorgensen, R.B. Effect of single and multifactor treatments with elevated temperature, CO2 and ozone on oilseed rape and barley. J. Agron. Crop Sci. 2011, 197, 442–453. [Google Scholar] [CrossRef]
- Hasegawa, T.; Tokida, T.; Nakamura, H.; Zhu, C.; Usui, Y.; Yoshimoto, M.; Fukuoka, M.; Fukuoka, M.; Wakatsuki, H.; Katayanagi, N.; et al. Rice cultivar responses to elevated CO2 at two free–air CO2 enrichment (FACE) site in Japan. Funct. Plant Biol. 2013, 40, 148–159. [Google Scholar] [CrossRef] [Green Version]
- Johannessen, M.M.; Mikkelsen, T.N.; Jorgensen, R.B. CO2 exploitation and genetic diversity in winter varieties of oilseed rape (Brassica napus); varieties of tomorrow. Euphytica 2002, 128, 75–86. [Google Scholar] [CrossRef]
- Johannessen, M.M.; Mikkelsen, T.N.; Nersting, L.G.; Gullord, M.; von Bothmer, R.; Jorgenses, R.B. Effect of increased atmospheric CO2 on varieties of oat. Plant Breed. 2005, 124, 253–256. [Google Scholar] [CrossRef]
- Bourgault, M.; Dreccer, M.F.; James, A.Y.; Chapman, S.C. Genotypic variability in the response to elevated CO2 of wheat lines differing in adaptive traits. Funct. Plant Biol. 2013, 403, 172–184. [Google Scholar] [CrossRef]
- Kumagai, E.; Aoki, N.; Masuya, Y.; Simono, H. Phenotypic plasticity conditions the response of soybean seed yield to elevated atmospheric CO2 concentration. Plant Physiol. 2015, 169, 2021–2029. [Google Scholar] [CrossRef] [PubMed] [Green Version]
- Manderscheid, R.; Weigel, H.J. Photosynthetic and growth responses of old and modern spring wheat cultivars to atmospheric CO2 enrichment. Agric. Ecosyst. Environ. 1997, 64, 65–73. [Google Scholar] [CrossRef]
- Shimono, H.; Okada, M.; Yamakawa, Y.; Nakamura, H.; Kobayashi, K.; Hasegawa, T. Genotypic variation in rice yield enhancement by elevated CO2 relates to growth before heading, and not to maturity group. J. Exp. Bot. 2009, 60, 523–532. [Google Scholar] [CrossRef] [PubMed] [Green Version]
- Soares, J.; Deuchande, T.; Valente, L.M.P.; Pintado, M.; Vasconcelos, M.W. Growth and nutritional responses of bean and soybean genotypes to elevated CO2 in a controlled environment. Plants 2019, 8, 465. [Google Scholar] [CrossRef] [PubMed] [Green Version]
- Thilakarathne, C.L.; Tausz-Posch, S.; Cane, K.; Norton, M.; Tausz, M.; Seneweera, S. Intraspecific variation in growth and yield response to elevated CO2 in wheat depends on the differences in leaf mass per unit area. Funct. Plant Biol. 2013, 40, 185–194. [Google Scholar] [CrossRef]
- Seneweera, S.; Posch, S.; Norton, R.; Tausz, M.; Fitzgerald, G.; Korte, C.; Rebetzke, G.; Mollah, M.; Barlow, S. Intraspecific variation of growth and yield response of wheat to elevated CO2 in Australian Grains Free Air Carbon Dioxide Enrichment (AGFACE). In Food Security from Sustainable Agriculture. Proceedings of the 15th Australian Agronomy Conference, Lincoln, New Zealand, 15–18 November 2010; Dove, H., Culvenor, R.H., Eds.; Australian Society of Agronomy: Lincoln, New Zealand, 2010. [Google Scholar]
- Tausz-Posch, S.; Seneweera, S.; Norton, R.M.; Fitzgerald, G.J.; Tausz, M. Can a wheat cultivar with high transpiration efficiency maintain its yield advantage over a near–isogenic cultivar under elevated CO2? Field Crop Res. 2012, 133, 160–165. [Google Scholar] [CrossRef]
- Zhu, C.; Xu, X.; Wang, D.; Zhu, J.; Liu, G. An indica rice genotype showed a similar yield enhancement to that of hybrid rice under free air carbon dioxide enrichment. Sci. Rep. 2015, 5, 12719. [Google Scholar] [CrossRef]
- Ziska, L.H.; Teramura, A.H. Intraspecific variation in response of rice (Oryza sativa) to increased CO2-photosynthetic, biomass and reproductive characteristics. Physiol. Plant. 1992, 84, 269–276. [Google Scholar] [CrossRef]
- Bunce, J.A. Variation in yield responses to elevated CO2 and a brief high temperature treatment in quinoa. Plants 2017, 6, 26. [Google Scholar] [CrossRef] [Green Version]
- Allen, L.H.; Kimball, B.A.; Bunce, J.A.; Yoshimoto, M.; Harazono, Y.; Baker, J.T.; Boote, K.J.; White, J.W. Fluctuations of CO2 in Free-Air CO2 Enrichment (FACE) depress plant photosynthesis, growth, and yield. Agric. For. Meteorol. 2020, 284, 10899. [Google Scholar] [CrossRef]
- Jones, H.G. Chapter 6 in: Plants and Microclimate. A Quantitative Approach to Environmental Plant Physiology, 3rd ed.; Cambridge University Press: Cambridge, UK, 2014; 407p, ISBN 978-0-521-27959-8. [Google Scholar]
- Bunce, J.A. Effects of pulses of elevated carbon dioxide concentration on stomatal conductance and photosynthesis in wheat and rice. Physiol. Plant. 2013, 149, 214–221. [Google Scholar] [CrossRef] [PubMed]
- Bunce, J.A. Responses of cotton and wheat photosynthesis and growth to cyclic variation in carbon dioxide concentration. Photosynthetica 2012, 50, 395–400. [Google Scholar] [CrossRef]
- Holtum, J.A.M.; Winter, K. Photosynthetic CO2 uptake in seedlings of two tropical tree species exposed to oscillating elevated concentrations of CO2. Planta 2003, 218, 152–158. [Google Scholar] [CrossRef] [PubMed]
- Allen, L.H.; Kimball, B.A.; Bunce, J.A.; Yoshimoto, M.; Harazono, Y.; Baker, J.T.; Boote, K.J.; White, J.W. Fluctuations of CO2 in Free-Air CO2 Enrichment (FACE) depress plant photosynthesis, growth, and yield. Agric. For. Meteorol. 2020, 284, 10899, Supplemental Data. [Google Scholar] [CrossRef]
- Beyschlag, W.; Pfanz, H.; Ryel, R.J. Stomatal patchiness in Mediterranean evergreen sclerophylls. Phenomenology and consequences for the interpretation of the midday depression in photosynthesis and transpiration. Planta 1992, 187, 546–553. [Google Scholar] [CrossRef] [PubMed]
- Buckley, T.N.; Farquhar, G.D.; Mott, K.A. Qualitative effects of patchy stomatal conductance distribution features on gas-exchange calculations. Plant Cell Environ. 1997, 20, 867–880. [Google Scholar] [CrossRef] [Green Version]
- Eckstein, J.; Beyschlag, W.; Mott, K.A.; Ryel, R.J. Changes in photon flux can induce stomatal patchiness. Plant Cell Environ. 1996, 19, 1066–1074. [Google Scholar] [CrossRef]
- Mott, K.A. Effects of patchy stomatal closure on gas exchange measurements following abscisic acid treatment. Plant Cell Environ. 1995, 18, 1291–1300. [Google Scholar] [CrossRef]
Figure 1.
CO2 concentrations measured inside a controlled-environment chamber using an open path CO2 analyzer sampling chamber air for 0.1 s every 1 s (A), and concentrations calculated using a 10 s running average (B). The CO2 concentration was under the control of an external CO2 analyzer that sampled chamber air continuously and was used to control an on–off solenoid valve injecting pure CO2 into the chamber at 0.5 L per minute.

Figure 2.
Leaf photosynthesis, A, and stomatal conductance, gs measured at constant CO2 of 560 μmol mol−1, 26 °C, 1000 μmol m−2 s−1 photosynthetic photon flux density, and a water vapor pressure deficit of 1.5 kPa for four species grown with lower and higher amplitudes cycles of CO2 (see text for details). “p” indicates the probability of a greater F value, using ANOVA, with four chamber means per species per treatment, with each chamber value representing a mean value for six individual plants per species. Bars indicate SD.

Figure 3.
Time course of stomatal conductance, gs, and photosynthesis, A in a rice leaf during square-wave cycles of CO2 between 400 and 800 μmol mol−1. Three samples of gs and A were taken when CO2 was stable at either 400 or 800 μmol mol−1, following initial measurements made at 600 μmol mol−1.
Figure 3.
Time course of stomatal conductance, gs, and photosynthesis, A in a rice leaf during square-wave cycles of CO2 between 400 and 800 μmol mol−1. Three samples of gs and A were taken when CO2 was stable at either 400 or 800 μmol mol−1, following initial measurements made at 600 μmol mol−1.

Figure 4.
Photosynthesis, A measured at three external CO2 concentrations before and after 15 min of square-wave cycling of CO2 between 400 and 800 μmol mol−1. Each point is the mean of four leaves of soybean. Bars represent SD. Mean substomatal CO2 concentrations (Ci) are indicated near each data point.

Figure 5.
CO2 measured sequentially inside two controlled environment chambers with an open path CO2 analyzer. The arrow indicates the time when the analyzer was moved between chambers. The chambers differed in the rate of CO2 flow during injection, but had identical control systems.
Figure 5.
CO2 measured sequentially inside two controlled environment chambers with an open path CO2 analyzer. The arrow indicates the time when the analyzer was moved between chambers. The chambers differed in the rate of CO2 flow during injection, but had identical control systems.


Table 1.
Total aboveground dry mass in four species grown with low or high amplitudes of CO2 cycling (see text for details). Harvests were at 20 days after planting in soybean, 21 days in wheat, 22 days in rice, and 23 days in cotton. There were four replicates for each species, with each replicate consisting of the mean value for six plants per treatment. Standard deviations are in parenthesis.
| Species | Mass, Low Amplitude | Mass, High Amplitude | Probability of >F |
|---|---|---|---|
| (g) | (g) | ||
| Cotton | 1.95 (0.26) | 1.57 (0.10) | 0.028 |
| Rice | 0.563 (0.043) | 0.436 (0.083) | 0.035 |
| Soybean | 3.61 (0.18) | 3.28 (0.17) | 0.032 |
| Wheat | 0.552 (0.022) | 0.485 (0.017) | 0.009 |
Table 2.
Times required to open and close stomata with change in CO2 between 400 and 800 μmol mol−1 at a PPFD of 1500 μmol m−2 s−1, and to open or close between PPFDs of 1500 and 200–500 μmol m−2 s−1, depending upon species, at a CO2 concentration of 400 μmol mol−1. Within species, means followed by different letters are significantly different at p = 0.05 using ANOVA. Standard deviations are in parenthesis.
| Species | Time (Minutes) to Open or Close | |||
|---|---|---|---|---|
| Change in CO2 | Change in PPFD | |||
| Open | Close | Open | Close | |
| Soybean | 21 a (1.7) | 22 a (1.6) | 11 b (0.6) | 11 b (0.6) |
| Cotton | 18 a (2.5) | 12 b (0.7) | 13 b (2.1) | 13 b (2.0) |
| Rice | 12 a (2.4) | 12 a (2.3) | 11 a (0.5) | 6 b (0.6) |
| Wheat | 18 a (1.5) | 11 b (1.0) | 7 c (1.5) | 15 a (2.1) |
| Velvet leaf | 27 a (2.0) | 18 b (1.0) | 16 b (1.0) | 11 c (1.5) |
| Grain amaranth | 22 a (2.6) | 12 b (1.5) | 8 b (1.5) | 4 c (1.0) |
| Smooth pigweed | 15 a (0.8) | 10 b (2.0) | 5 c (1.2) | 4 c (1.2) |
Table 3.
Steady-state stomatal conductance (mmol m−2 s−1) at three CO2 concentrations at PPFD = 1500 μmol m−2 s−1, and final stomatal conductance after square-wave cycles of CO2 between 400 and 800 μmol mol−1. Within species, means followed by different letters are significantly different at p = 0.05 using repeated measures ANOVA. Standard deviations are in parenthesis.
| Species | Steady-State Stomatal Conductance | Final Cycle | ||
|---|---|---|---|---|
| CO2 μmol mol−1 | 400 | 600 | 800 | mean = 600 |
| Soybean | 380 (25) a | 318 (12) b | 297 (14) c | 258 (18) d |
| Cotton | 265 (19) a | 235 (15) b | 224 (11) c | 213 (10) d |
| Rice | 425 (28) a | 300 (26) b | 250 (19) c | 247 (19) c |
| Wheat | 500 (45) a | 365 (23) b | 323 (24) c | 312 (19) c |
| Velvet leaf | 683 (38) a | 516 (18) b | 478 (17) c | 478 (19) c |
| Grain amaranth | 283 (22) a | 211 (16) b | 185 (15) c | 230 (20) b |
| Smooth pigweed | 251 (18) a | 155 (18) b | 120 (16) c | 187 (17) b |
Table 4.
Photosynthetic rates (μmol m−2 s−1) measured at 600 μmol mol−1 CO2 and 1500 μmol m−2 s−1 PPFD before and after square-wave cycles of CO2 between 400 and 800 μmol mol−1, and during the last cycle. Within species, means followed by different letters are significantly different at p = 0.05 using repeated measures ANOVA. Standard deviations are in parenthesis.
| Species | Before | After | During |
|---|---|---|---|
| Soybean | 31.1 (1.5) a | 29.3 (0.7) b | 28.3 (0.6) c |
| Cotton | 35.0 (1.5) a | 35.0 (1.4) a | 32.1 (1.3) b |
| Rice | 30.0 (1.3) a | 28.3 (1.7) b | 25.7 (1.6) c |
| Wheat | 38.3 (1.4) a | 35.3 (1.9) b | 33.0 (1.3) c |
| Velvet leaf | 38.3 (1.8) a | 38.0 (1.9) a | 34.2 (1.9) b |
| Grain amaranth | 33.7 (1.8) a | 33.1 (1.9) a | 31.1 (1.7) b |
| Smooth pigweed | 39.1 (2.0) a | 39.3 (1.8) a | 36.2 (1.8) b |
Table 5.
Photosynthetic rates (μmol m−2 s−1) and substomatal CO2 concentrations (μmol mol−1) measured at 800 μmol mol−1 CO2 and 1500 μmol m−2 s−1 PPFD before and after square-wave cycles of CO2 between 400 and 800 μmol mol−1. Within species, means for each parameter followed by different letters are significantly different at p = 0.05 using repeated measures ANOVA. Standard deviations are in parenthesis.
| Species | Before | After | ||
|---|---|---|---|---|
| A | Ci | A | Ci | |
| Cotton | 38.0 (2.2) b | 427 (31) a | 41.1 (1.8) a | 412 (22) a |
| Rice | 35.3 (1.6) a | 526 (17) a | 34.5 (2.1) a | 529 (34) a |
| Wheat | 44.1 (3.7) a | 545 (25) a | 41.0 (4.0) b | 520 (20) a |
| Velvet leaf | 40.4 (2.1) a | 587 (24) a | 41.1 (2.6) a | 576 (36) a |
| Grain amaranth | 33.1 (2.0) b | 411 (15) a | 36.3 (2.5) a | 412 (13) a |
| Smooth pigweed | 38.3 (2.1) b | 362 (15) a | 40.7 (2.7) a | 360 (25) a |
© 2020 by the author. Licensee MDPI, Basel, Switzerland. This article is an open access article distributed under the terms and conditions of the Creative Commons Attribution (CC BY) license (http://creativecommons.org/licenses/by/4.0/).
Share and Cite
MDPI and ACS Style
Bunce, J. Normal Cyclic Variation in CO2 Concentration in Indoor Chambers Decreases Leaf Gas Exchange and Plant Growth. Plants 2020, 9, 663. https://doi.org/10.3390/plants9050663
AMA Style
Bunce J. Normal Cyclic Variation in CO2 Concentration in Indoor Chambers Decreases Leaf Gas Exchange and Plant Growth. Plants. 2020; 9(5):663. https://doi.org/10.3390/plants9050663
Chicago/Turabian StyleBunce, James. 2020. "Normal Cyclic Variation in CO2 Concentration in Indoor Chambers Decreases Leaf Gas Exchange and Plant Growth" Plants 9, no. 5: 663. https://doi.org/10.3390/plants9050663
Note that from the first issue of 2016, this journal uses article numbers instead of page numbers. See further details here.