Article

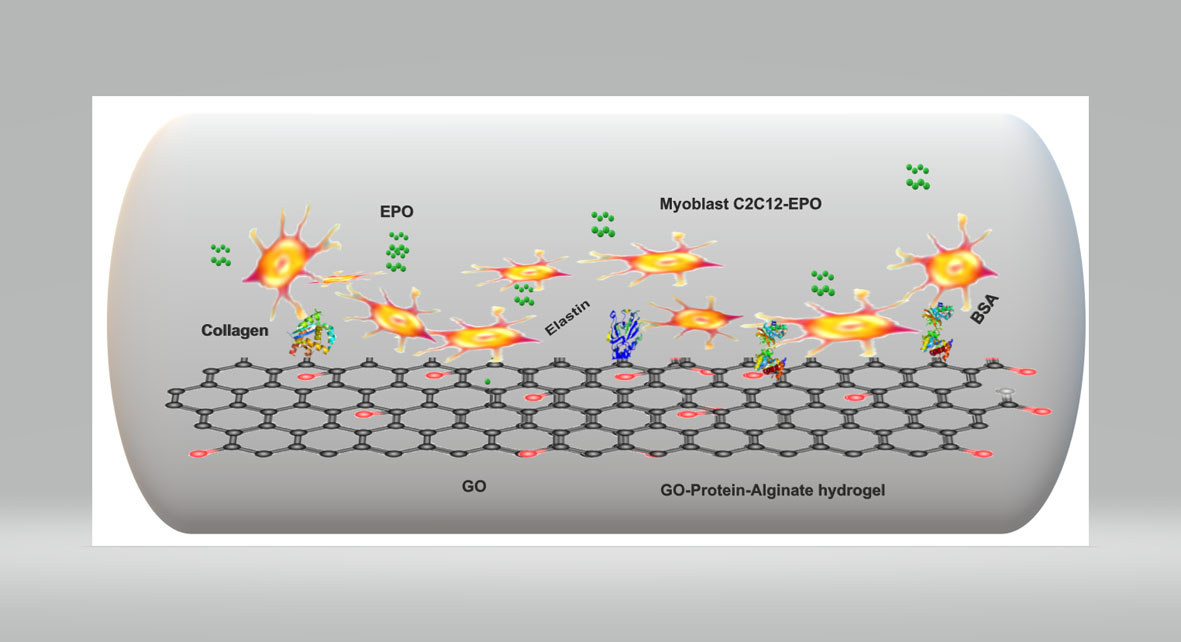
BSA- and Elastin-Coated GO, but Not Collagen-Coated GO, Enhance the Biological Performance of Alginate Hydrogels

by
Ahmed Raslan
1,2,†,
Laura Saenz del Burgo
1,2,†,
Albert Espona-Noguera
1,2,
Ana María Ochoa de Retana
3,
María Luisa Sanjuán
4,
Alberto Cañibano-Hernández
1,2,
Patricia Gálvez-Martín
5,
Jesús Ciriza
1,2,* and
Jose Luis Pedraz
1,2,*
1
NanoBioCel Group, Laboratory of Pharmacy and Pharmaceutical Technology, Faculty of Pharmacy, University of the Basque Country UPV/EHU, 01006 Vitoria-Gasteiz, Spain
2
Biomedical Research Networking Center in Bioengineering, Biomaterials, and Nanomedicine, CIBER-BBN, 28029 Madrid, Spain
3
Department of Organic Chemistry I, Faculty of Pharmacy and Lascaray Research Center, University of the Basque Country (UPV/EHU), Paseo de la Universidad 7, 01006 Vitoria, Spain
4
Instituto de Ciencia de Materiales de Aragón (Universidad de Zaragoza-CSIC), Facultad de Ciencias, 50009 Zaragoza, Spain
5
R&D Human Health, Bioibérica S.A.U., 08029 Barcelona E-, Spain
*
Authors to whom correspondence should be addressed.
These authors contributed equally to this work.
Pharmaceutics 2020, 12(6), 543; https://doi.org/10.3390/pharmaceutics12060543
Submission received: 20 May 2020 / Revised: 5 June 2020 / Accepted: 8 June 2020 / Published: 11 June 2020
(This article belongs to the Section Drug Delivery and Controlled Release)

Abstract

:
The use of embedded cells within alginate matrices is a developing technique with great clinical applications in cell-based therapies. However, one feature that needs additional investigation is the improvement of alginate-cells viability, which could be achieved by integrating other materials with alginate to improve its surface properties. In recent years, the field of nanotechnology has shown the many properties of a huge number of materials. Graphene oxide (GO), for instance, seems to be a good choice for improving alginate cell viability and functionality. We previously observed that GO, coated with fetal bovine serum (FBS) within alginate hydrogels, improves the viability of embedded myoblasts. In the current research, we aim to study several proteins, specifically bovine serum albumin (BSA), type I collagen and elastin, to discern their impact on the previously observed improvement on embedded myoblasts within alginate hydrogels containing GO coated with FBS. Thus, we describe the mechanisms of the formation of BSA, collagen and elastin protein layers on the GO surface, showing a high adsorption by BSA and elastin, and a decreasing GO impedance and capacitance. Moreover, we described a better cell viability and protein release from embedded cells within hydrogels containing protein-coated GO. We conclude that these hybrid hydrogels could provide a step forward in regenerative medicine.

Graphical Abstract

1. Introduction

Hydrogels are 3D structures capable of supporting living cells and creating a suitable microenvironment that enables cells to maintain their viability. Hydrogels are characterized by excellent properties, such as having enough porosity to allow for the exchange of nutrients and oxygen inside, while releasing waste products and therapeutic proteins outside. Moreover, hydrogels provide protection to embedded cells from the immune system, avoiding their rejection [1] Alginate is the most popular natural biomaterial used in the performance of the aforementioned hydrogels for tissue engineering, due to its high biocompatibility and ease of performance. Alginate hydrogels have been extensively studied for wound healing, drug delivery, cell-based therapies and tissue engineering applications. Although alginate hydrogels retain a structure similar to the extracellular 3D structure [2,3] this inert polymer is unable to mimic interactions with cells, since it inherently lacks cellular adhesion [4]. Therefore, the modification of the alginate surface in order to create a closer bio-mimic support for embedded cells is desired.
In the last few years, the incorporation of nanotechnology into a huge number of materials has shown the improvement of their properties. Thus, for example, graphene oxide (GO), the most studied graphene derivative, has been incorporated into alginate matrices to provide bio-mimetic support, suggesting that is a suitable candidate for the improvement of alginate surface properties and mechanical strength, partly due to its excellent mechanical properties [5,6,7]. In fact, graphene and its derivates can reinforce the physical characteristics of different materials, such as thermoplastic polyurethane [8], hydroxyapatite (HAp) and β-tricalcium phosphate (β-TCP) [9]. GO has also been shown to be a good candidate in the development of drug delivery systems, gene therapy or in the improvement of contrast substances for diagnostic images [10,11,12,13].
GO is produced by the oxidation and exfoliation of natural graphite powder, using various oxidizing agents in a strong acid medium, this being the traditional synthesis method developed by Hummers and colleagues [14]. It shows unique properties, such as high specific surface area (890 m2 g–1) [15] and mechanical strength (Young’s modulus of ~1.0 and breaking strength of ~130 GPa) [16]. Moreover, the oxidation procedure from graphene to generate GO, provides the material with a high hydrophilicity. In fact, GO is formed by abundant oxygenated groups, such as hydroxyl and epoxy groups on the basal plane, with slight amounts of carboxyl, carbonyl, phenol, lactone and quinone [13], clearly observed by FT-IR spectroscopy [14,15,16]. These groups facilitate the formation of the stable dispersion of the graphene derivate in aqueous media and other polar solvents [17,18,19], also allowing biochemical and bio-conjugation reactions on its basal plane and edges [20]. These reactions facilitate the functionalization of the GO surface with proteins, antibodies and DNA fragments [21,22], providing a wide number of biological applications [23].
Moreover, GO can adsorb proteins and antibodies, providing them with stability against proteolysis [24,25], resulting in an effective platform for protein delivery [26] or biosensors [27,28]. Depending on GO morphology, hydrophobicity [25] and the type of adsorbed protein [25], physical or chemical adsorption on GO can be involved in the adsorption of those proteins. Physical adsorption includes hydrophobic interaction, Van der Waals forces, electrostatic interactions and hydrogen bonds [25,29,30]. Protein adsorption on the GO surface mostly occurs via hydrophobic–hydrophobic interactions through the sp2 hybridization of GO [31], with a high affinity for the hydrophobic carbon lattice from the hydrophobic domain of proteins [32]. Van der Waals forces also play an important role in the adsorption of hydrophobic drugs or nanocomposites [27], while electrostatic interactions are generated at lower pH than 6.0 [28]. Hydrogen bonds are particularly described in the adsorption of gases, such as nitrogen oxides, with the formation of hydrogen bonds OH···O (N), between –OH and nitrogen oxides [33]. Moreover, π–π stacking interactions have been described due to the abundant π electrons on the basal plane of the GO surface [30]. On the other hand, the chemical adsorption of proteins on GO provides stability to the proteins against heat, pH and organic solvents [34]. However, this interaction alters the protein structure, decreasing protein functionality or enzymatic activity [35].
However, current studies regarding cytotoxicity with graphene and its derivates are contradictory [36,37]. While some studies reported that GO has no effects on cell behavior at certain doses [38,39], others demonstrated that GO can induce cellular damage [40,41]. On one hand, some studies reported that GO has no effects on the behavior of cells [38,39], such as the high hemocompatibility of pristine and functionalized graphene, even at high concentrations, with red blood cells, platelets and plasma coagulation pathways, the mediation of the activation of cytokines, [38] or on the lack of cytotoxicity of GO at low doses in A549 cells [42]. On the other hand, other studies have demonstrated that this material could induce cellular damage [40,41], such as mitochondrial toxicity and the cell membrane damage of neuronal PC12 cells in a dose-dependent manner with high cytotoxicity even at low concentrations [43] or the cytotoxicity and oxidative stress detected in BF-2 cells at low GO concentrations after 24 h of incubation [44,45]. However, another study demonstrated that low concentrations of GO (≤20 μg/mL) do not show toxicity on human fibroblast cells, while concentrations over 50 μg/mL decrease cell adhesion, induce cell apoptosis and show carbon material within the lysosomes, mitochondrion, endoplasm and cell nucleus [46]. We have also reported that concentrations between 25 and 50 µg/mL GO improve the viability, metabolic activity and membrane integrity of alginate encapsulated myoblasts [10,47,48]. Nevertheless, we also detected adsorption on the GO surface, precluding the release of the studied therapeutic protein, erythropoietin (EPO). We hypothesized that adsorption could occur probably via electrostatic interactions and the formation of hydrogen bonds with oxygenated groups from GO. In addition, the presence of surface defects on the GO surface could also act as active sites where the EPO molecules would be adsorbed. We were able to block the adsorption of EPO by previously incubating GO platelets with fetal bovine serum (FBS), which also further improved the viability of encapsulated cells.
Following our previous results, we aimed to discern a protein that could prevent the adsorption by GO, instead of using a complex mixture of unknown proteins, such as FBS, and describe and characterize which processes could be involved in the interaction between the selected proteins and GO platelets. Therefore, we have deeply characterized the interaction with three proteins—bovine serum albumin (BSA), type I collagen and elastin—next studying their biological outcomes for embedded myoblasts within alginate hydrogels in the presence of selected protein-coated GO platelets.

2. Materials and Methods

2.1. Materials

GO suspension was purchased from Graphenea (San Sebastián, Spain). In order to avoid the formation of aggregates, the suspension was diluted to 250 ug/mL in deionized water and sonicated for 1 h before use. BSA, collagen, calcium sulphate and mannitol were purchased from Sigma Aldrich (St. Louis, MO, USA). Elastin was provided by Bioiberica (Barcelona, Spain). Ultrapure low-viscosity and high guluronic (LVG) sodium alginate was purchased from FMC Biopolymer (Sandvika, Norway). Glacial acetic acid was supplied by Panreac. FBS, L-glutamine, Dulbecco’s phosphate-buffered saline (DPBS) and the antibiotic/antimycotic solution were purchased from Gibco. Trypsin-EDTA was purchased from Life Technologies (Carlsbad, CA, USA).

2.2. Characterization of GO-Protein Interactions

GO (250 µg/mL) was dispersed in either a BSA solution (900 µg/mL), collagen solution (315 µg/mL) or elastin solution (900 µg/mL). These mixtures were incubated for 2 h at 37 °C. Then, the samples were centrifuged at 14,000 rpm for 15 min and lyophilized in a lyobeta 15 Telstar. The GO and proteins alone were also analyzed in parallel. All of the samples were analyzed in triplicate. Thus, FT-IR spectroscopy measurements were performed with a BRUKER IFS 66/S Spectrometer (Bruker, Billerica, MA, USA), using 32 scans with a resolution of 4 (cm−1) in 4000–400 cm−1 regions. The Raman spectrum was acquired using a Confocal Raman Imaging Alpha 300 M (Company WITEC) with a 532 nm laser (1 mW laser power, 50× microscope objective, an exposure time of 50 s, and four accumulations).

2.3. Adsorption Capacity Experiments

2.3.1. Effect of Initial Concentration

In order to study the effect of the initial concentration (C0) of selected proteins on the GO adsorption capacity (qe), sequential protein concentrations from 0 to 2 mg/mL were incubated with a GO suspension (250 µg/mL) for 2 h at 37 °C. The resulting GO-protein suspensions were centrifuged at 14,000 rpm for 15 min. Then, the quantification of non-adsorbed protein was determined from the supernatant using a BCA kit (Thermo Fisher, Waltham, MA, USA). Absorbance was read at 562 nm on a M 200 TECAN Microplate reader (TECAN Trading AG, Männedorf, Switzerland). Each experiment was performed in triplicate. The percentages of adsorbed proteins were calculated according to Equation (1) and the adsorption capacity qe (µg/µg) was calculated using Equation (2).
Adsorption   capability   ( % ) = ( C 0 Ce ) × 100 C 0
Adsorption   capacity   qe = ( C 0 Ce ) × V W
where C0 (µg/mL) and Ce (µg/mL) are the initial and final protein concentrations, respectively; V is the volume of the samples (0.1 mL) and W is the mass of GO (250 µg).

2.3.2. Adsorption Isotherms

Langmuir and Freundlich adsorption models were applied to study the adsorption isotherm. The Langmuir equation is expressed as follows in Equations (3) and (4):
Ce/qe = Ce/qmax + 1/(qmax.KL)
RL = 1/(1 + KL × C0)
where Ce (µg/mL) is the concentration of the adsorbed protein at equilibrium, qe is the adsorption capacity (ug/ug), qmax (µg/µg) is the maximum amount of protein absorbed per unit weight of GO, KL (mL/µg) is the Langmuir constant related to the surface affinity for the protein, (C0) is the initial protein concentration and RL is the separation factor, which describes the essential characteristics of the Langmuir isotherm.
The Freundlich equation was expressed as follows in Equation (5):
Log qe = log KF + 1/n × log Ce
where KF and n are the Freundlich constant and intensity adsorption, respectively.

2.4. Kinetic Study of Protein Adsorption

GO (250 µg/mL) was dispersed in either a BSA solution (900 µg/mL), collagen solution (315 µg/mL) or elastin solution (900 µg/mL). These mixtures were incubated at 37 °C and the samples were centrifuged at 14,000 rpm for 10 min at 12,000 rpm after 0, 5, 10, 20, 30 and 80 min of incubation. The supernatants were collected for the quantification of the non-adsorbed proteins with the BCA kit (Thermo Fisher). The results were analyzed using the pseudo-second-order model in order to clarify the nature of the adsorption phenomenon. This pseudo-second-order model is described by Equation (6) [49]:
t/qt = t/qe + 1/k2 × (qe)2
where qe (µg/µg) and qt (µg/µg) are the adsorption capacity at equilibrium and at selected times, respectively, t (min) is the time and k2 (µg/µg.min−1) is the rate constant of the pseudo-second-order adsorption. The intra-particle diffusion model was also used to find out the diffusion mechanism, denoted in Equation (7):
qt = Kp.t1/2 + C
where qt is the amount of protein adsorbed at the equilibrium (µg/µg) at time t, C (µg/µg) refers to the intra-particle diffusion constant related to the thickness of the boundary layer and Kp is the intra-particle diffusion rate constant KP (µg/µg. min1/2) [50,51].

2.5. Thermodynamic Studies

GO (250 µg/mL) was dispersed in either BSA solution (900 µg/mL), collagen solution (315 µg/mL) or elastin solution (900 µg/mL). These mixtures were incubated for 2 h at different temperatures (5 °C, 10 °C, 15 °C, 25 °C, 37 °C and 39 °C). Samples were centrifuged for 10 min at 12,000 rpm and the supernatants were collected for the quantification of the non-adsorbed proteins with the BCA kit (Thermo Fisher). The three basic thermodynamic parameters—Gibbs free energy change (∆G°), entropy change (∆S°) and enthalpy change (∆H°)—were calculated using the following Equations (8)–(11) [29,52]:
Kd = qe/Ce
∆G = −RT lnKd
Ln Kd = −∆H/RT + ∆S/R
∆G° = ∆H − T∆S
where R is the gas constant (8.314 J/mol K), T is the absolute temperature (K), Kd is the equilibrium constant, qe (µg/µg) is the amount of protein adsorbed per mass unit of GO at equilibrium and Ce (µg/mL) is the equilibrium concentration of the proteins.

2.6. Electrochemical Study

First, sodium alginate solutions in combination with GO or GO-protein mixtures were prepared as follows: 1.87% (w/v) sodium alginate solutions were prepared in 1% mannitol and were then mixed with a GO suspension or mixtures of GO with the studied proteins at the aforementioned concentrations. With these reagents, the alginate hydrogels were elaborated. For this purpose, 2.7 mL of the previous solutions (alginate, alginate-GO and alginate-GO-proteins) were mixed with 60 μL of calcium sulphate 1.22 M and 240 μL of mannitol 1%, through two Luer Lock syringes (BS Syringe) connected with a Fluid Dispensing Connector (Braun), for 15 s. Then, the resulting mixtures were kept for gelification between two glass plates with a separation of 2 mm. The obtained hydrogels were cut into 14 mm diameter disks for electrochemical studies.
Electrochemical Impedance Spectroscopy (EIS) was conducted using a versa state-3 instrument (Princeton Applied research-USA), and a screen-printed electrode (Dropsens-Spain), based on carbon and a silver electrode for reference. The samples were immersed in 0.1 M PBS performing EIS measurements at room temperature, with a frequency range from 10–1 to 103 Hz. Cyclic Voltammetry (CV) was performed to quantify the specific capacitance. The samples were immersed in 0.1 M PBS and CV measurements were carried out at the potential window of −0.5 to 0.2 V at various scan rates (100 mVs−1). The specific capacitance was calculated from the CV curves according to the following Equation (12) [53]:
C = Q/(2 Vm)
where C (F·g−1) is the specific capacitance, Q (C) is the average charge during the charging and discharging process, V (Volt) is the potential window and m (g) is the mass of the hydrogel disk.

2.7. In Vitro Cell Viability Studies

The biological effects of alginate hydrogels containing GO or GO with different adsorbed proteins (BSA, collagen and elastin) were studied on murine C2C12 myoblasts genetically engineered to secrete erythropoietin (C2C12-EPO). The cells were grown in Dulbecco’s modified Eagle’s medium (Gibco) supplemented with 10% FBS, 2 mM L-glutamine and 1% antibiotic/antimycotic solution (basal medium) at 37 °C in a humidified atmosphere containing 5% CO2. The cells were passaged every 2–3 days. For the preparation of the C2C12-EPO containing hydrogels, the alginate, alginate-GO and alginate-GO-proteins (BSA, collagen or elastin) hydrogels were prepared as explained in Section 2.6 under aseptic conditions, filtering all of the solutions through a 0.20 μm syringe filter (Millipore, MA, USA). The myoblasts were harvested with 0.25% trypsin-EDTA, centrifuged and mixed with the hydrogels at a 5 × 10⁶ cells/mL cell density. Afterwards, the resulting mixtures were kept for gelling between two glass plates with 2 mm of thickness and disks were cut in aseptic conditions. The disks were cultured at 37 °C in a humidified atmosphere containing 5% CO2 with basal medium.
For fluorescence microscopy viability imaging, the hydrogels were stained with the LIVE/DEAD® Viability/Cytotoxicity Kit (Invitrogen™) at different time points. The hydrogels were washed with DPBS and stained with 0.5 μM calcein AM and 0.5 μM ethidium homodimer-1. The samples were incubated at room temperature for 40 min, protected from light and observed under a Nikon TMS microscope (excitation/emission settings for calcein AM: 495/515 nm and for ethidium homodimer: 495/635 nm). At least three independent experiments were analyzed for each condition. For metabolic activity study, six disks from each condition were placed on 96-well plates, adding 100 μL of culture medium with 10 μL of Cell Counting Kit-8 solution (CCK-8, Sigma-Aldrich) per well. The plates were incubated inside a humidified chamber for 4 h at 37 °C. Then, the absorbance was read out on an Infinite M200 TECAN plate reader at 450 nm with a reference wavelength set at 650 nm. The secretion of EPO was also quantified from three disks/conditions. The disks were placed in 12-well plates adding 1 mL of the culture medium and collecting supernatants the next day. The amount of released EPO was quantified using the Quantikine IVD EPO ELISA kit (R&D Systems). All of the samples and standards were measured at least in triplicate.

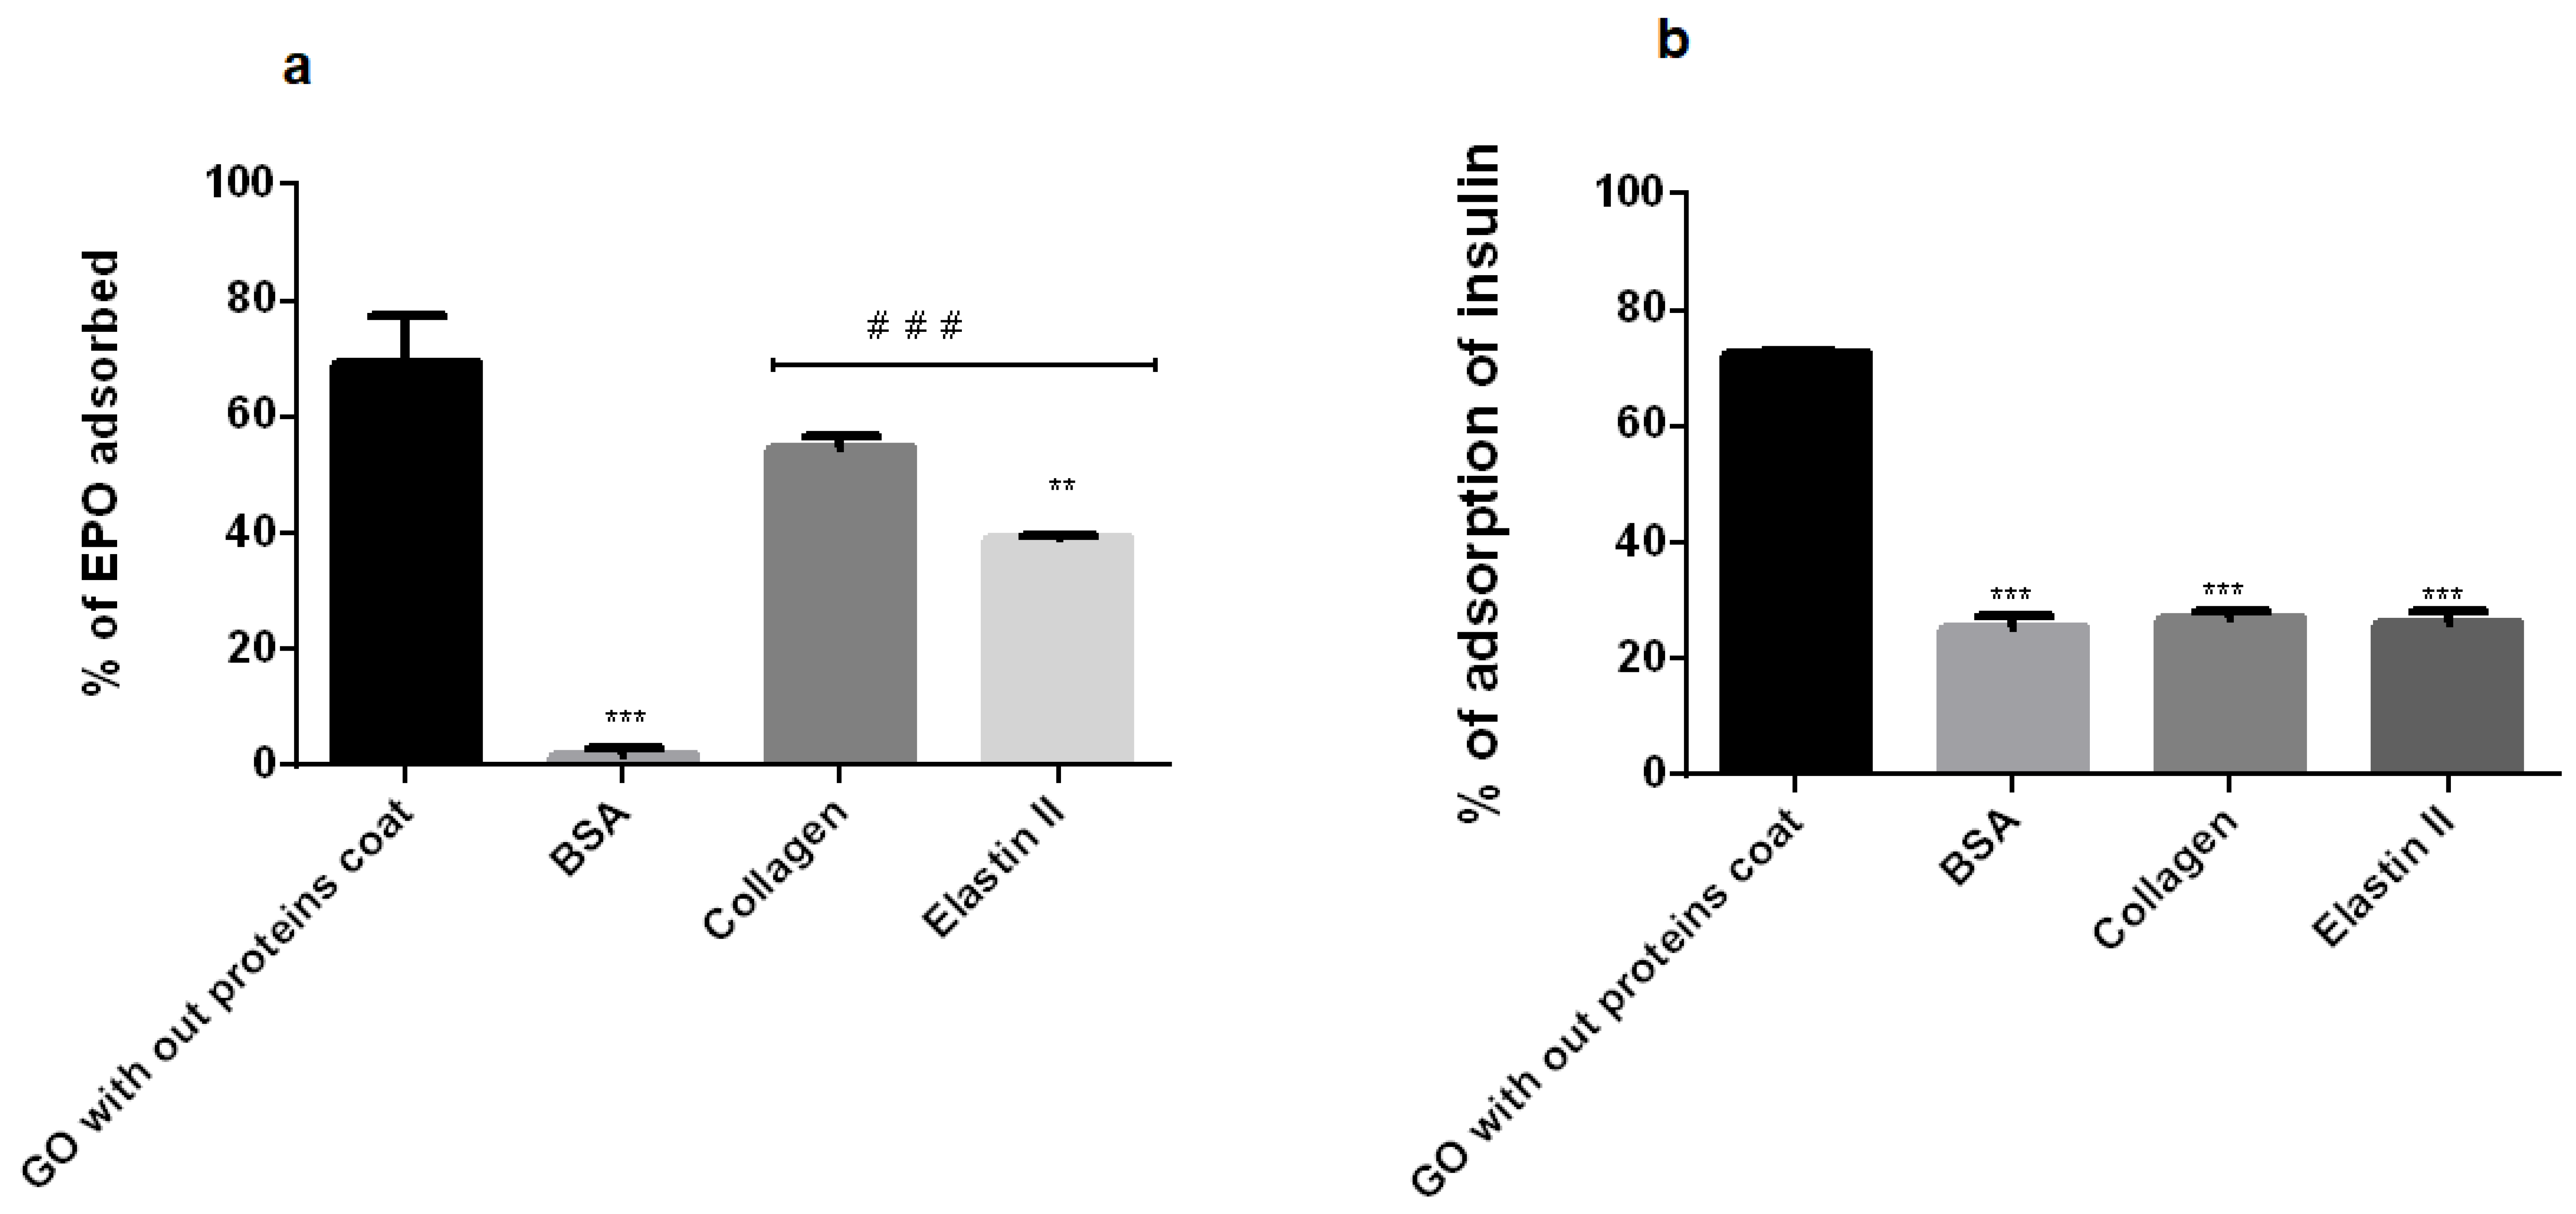
2.8. EPO and Insulin Adsorption Blocking Study

We evaluated the capacity of BSA, collagen and elastin for avoiding the adsorption of other proteins to the GO particle surface, such as EPO and insulin. First, GO-BSA, GO-collagen and GO-elastin mixtures were obtained as previously described in Section 2.5. These mixtures were incubated overnight with either recombinant EPO (200 mIU/mL) or insulin (150 mIU/mL). Next, the samples were spun for 5 min at 12,000 rpm, and then the supernatants were collected. The non-adsorbed EPO and insulin was quantified with the ELISA kits, the Quantikine IVD-EPO ELISA kit (R&D Systems) and the Insulin ELISA Kit (Mercodia), respectively. The GO without adsorbed proteins was considered as a control. All of the samples and standards were measured in duplicate. Three independent experiments were analyzed for each condition.

2.9. Statistical Analysis

Statistical analysis was done with SPSS software, version 24.00, or GraphPad Prism 8.0 (GraphPad Inc., San Diego, CA, USA). The data are shown as mean ± standard deviation. Values with p < 0.05 were considered significant for comparison between groups after confirming normality and performing ANOVA and Tukey’s post-hoc test for bivariate correlation. Pearson’s correlation coefficient was used for continuous data and Spearman’s for ordinal and nominal data.

3. Results and Discussion

In this experimental work, we studied how BSA, type I collagen and elastin, interact with the GO surface, analyzing their electrochemical characteristics after being embedded within alginate hydrogels. Next, we evaluated the biological impact of embedded C2C12-EPO cells within hybrid protein-coated GO particles with alginate hydrogels.

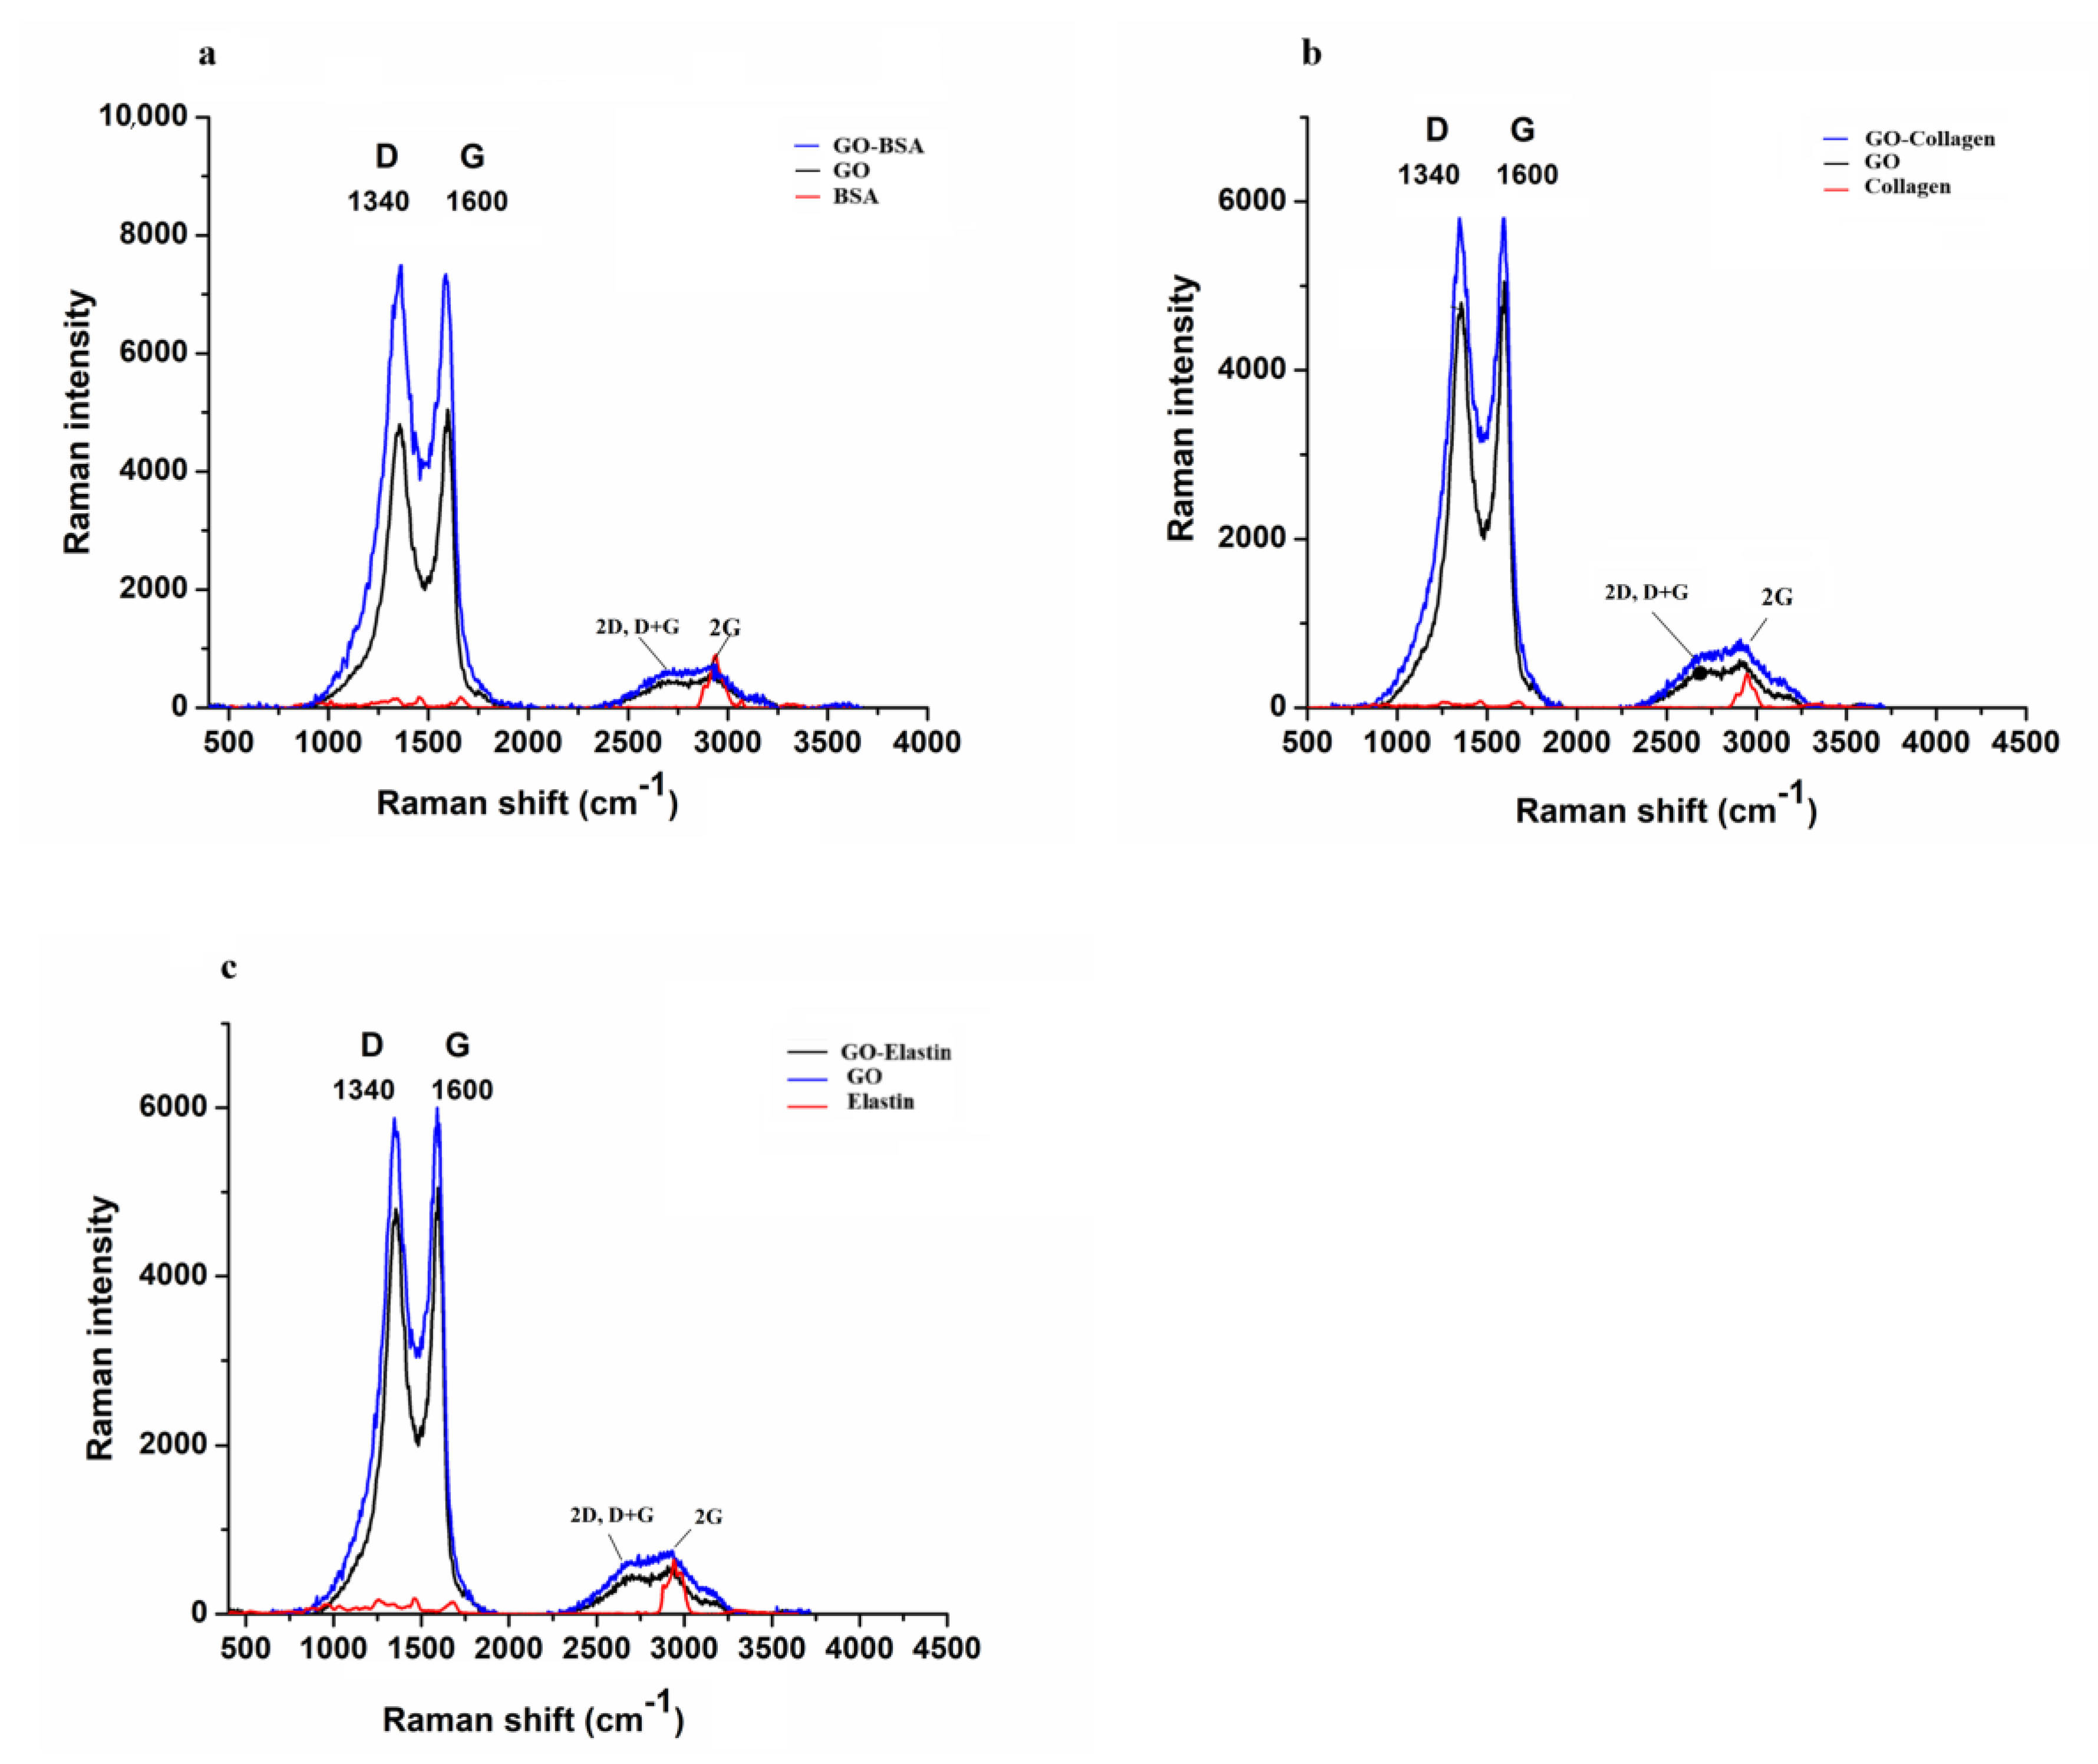
3.1. Raman Spectroscopy Shows the Functionalization of GO by BSA, Collagen and Elastin

The interactions between the studied proteins and GO were analyzed by Raman spectroscopy, obtaining the spectra of GO, BSA, collagen, elastin and the combinations of GO with each protein type, as shown in Figure 1. The proteins were hardly detected after mixing with the GO due to the higher Raman activity of the GO compared to the proteins. In the GO spectrum, two prominent peaks, commonly observed in sp2 graphite systems, corresponding to D (~1340 cm−1) and G (~1600 cm−1) bands, were clearly visible [54]. Moreover, the combination of 2D, D + G bands and 2G bands at 2500 cm−1 and 3200 cm−1 were detected, with a wide band around 3500 cm−1, maybe due to OH- presence. More detailed analysis of the spectrum evidenced the presence of a band (I) at the low wavenumber side (1100–1250 cm−1) of the D band, usually attributed to sp3 bonds arising from broken sp2 rings or surface functionalization.
Two components (G1 and G2) are required to fit the asymmetry of the G band. These excitations were present both in the GO and GO with protein spectra and were used to determine GO modifications after combining with protein. Detection at the same excitation wavelength (532 nm) did not show significant differences between the band wavenumbers of the GO and GO mixed with proteins, as shown in Table 1. Similarly, no appreciable wavenumber differences were observed among the three proteins mixed with the GO. However, interestingly, there was an evolution of the integrated band intensities comparing the GO and GO mixed with protein spectra. A constant D/G intensity ratio was observed for all of the proteins studied, within error, while the I/D ratio was enhanced after mixing the GO and proteins, shown in Table 1, indicating an increment in the functionalization of GO.

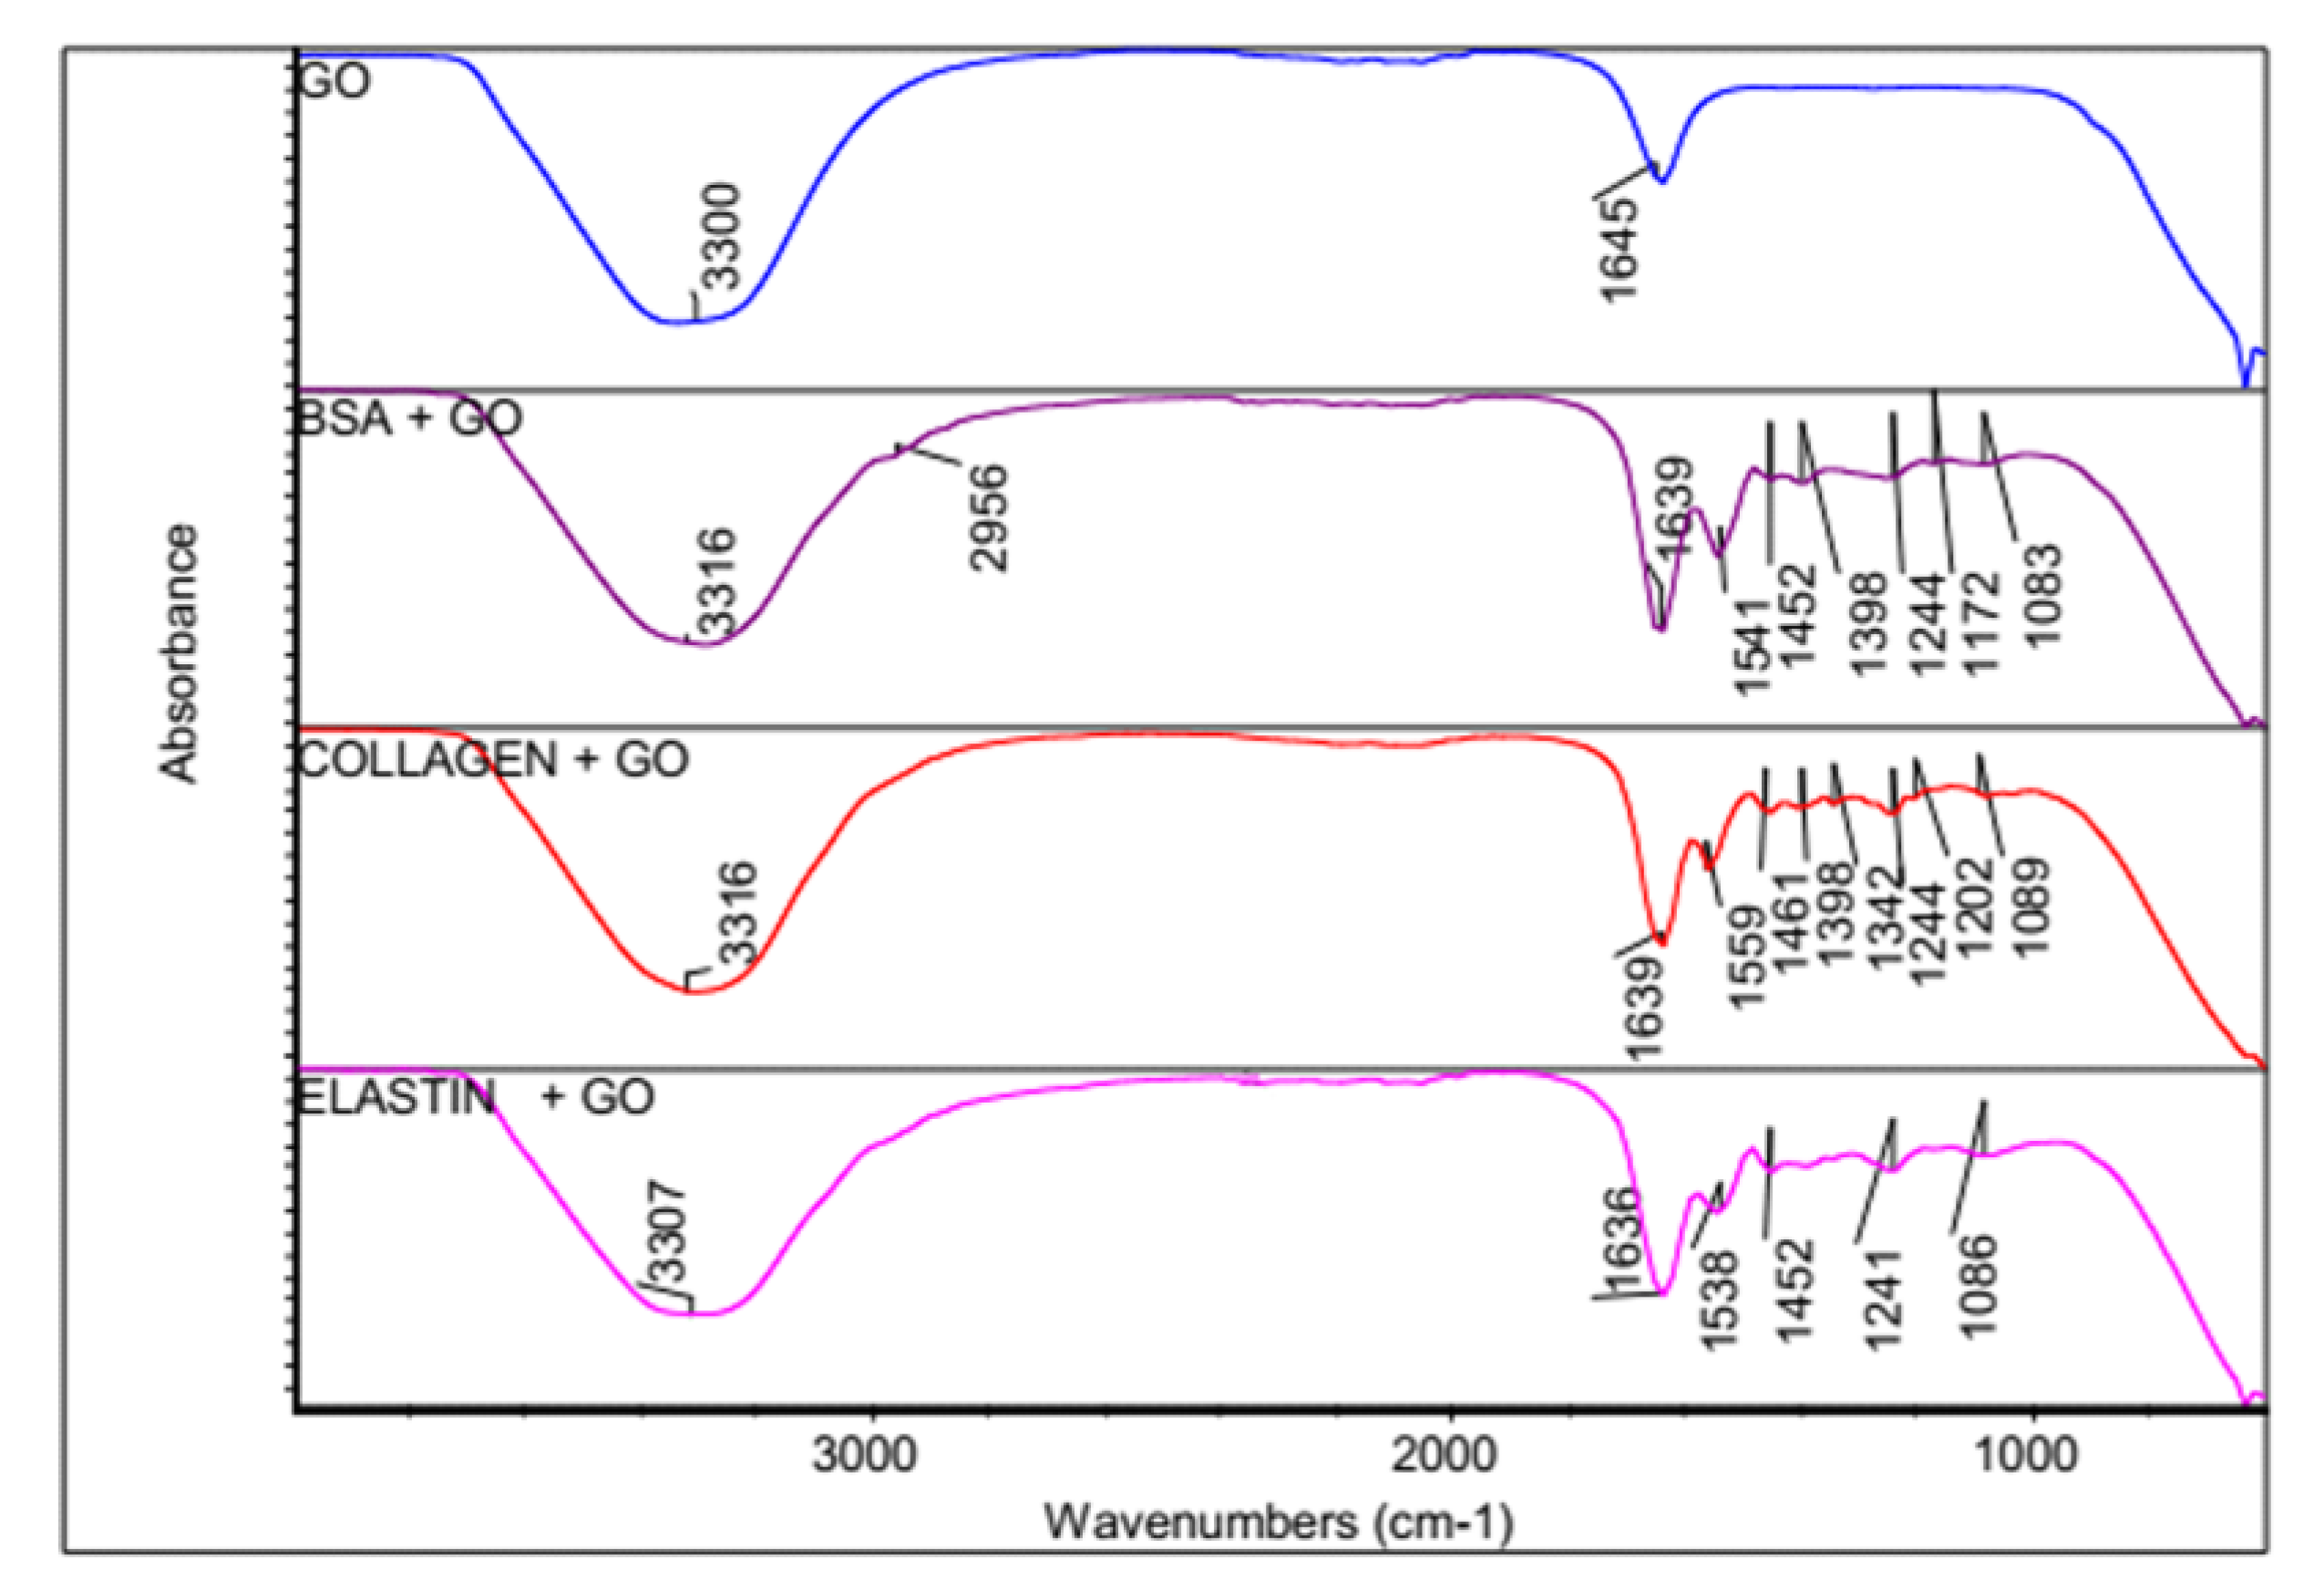
3.2. FTIR Spectroscopy Indicates a Formation of a Bio-Corona on the GO Surface

In order to determine the adsorption of proteins on the GO surface, Fourier Transform Infrared Spectroscopy (FTIR) spectra from the GO of GO-proteins before and after the adsorption of the studied proteins was compared, as shown in Figure 2. The GO spectrum showed a broadband for H-bonded and an OH stretch at 3300 cm−1, a C=C characteristic band at 1645 cm−1 and a C-O stretch at 1056 cm−1 [54]. However, when the studied proteins were adsorbed on the GO surface, bands from the GO and proteins were overlapped. Thus, the FTIR spectrum for protein-coated GO showed NHCO stretching vibrations at 1636–1639 cm−1, characteristic of amide bonds from proteins and primary alcohol (C-OH stretch) at 1083–1089 cm−1. The amide II band from BSA was shifted from 1523 cm−1 to 1541 cm−1 when adsorbed within the GO, while collagen shifted from 1544 cm−1 to 1559 cm−1 and elastin from 1538 cm−1 to 1552 cm−1. Similarly, the amide III bands shifted from 1247 cm−1 to 1256 cm−1 with BSA, from 1250 cm−1 to 1244 cm−1 with collagen and from 1244 cm−1 to 1241 cm−1 with elastin. A peak at 1645 cm−1 in the GO spectrum, attributed to the aromatic C=C group of the sp2 carbon atom structure, was detected. However, this peak was not detected after the adsorption of the proteins, suggesting either the loss of the sp2 structure or the formation of a bio-corona on the GO surface. These results would indicate that the formation of such bio-corona on the GO surface would occur through the π–π interactions between the benzene ring from the proteins and the C=C from GO [55,56]. Nevertheless, other interactions, such as hydrogen bonds, could participate in the bio-corona formation.

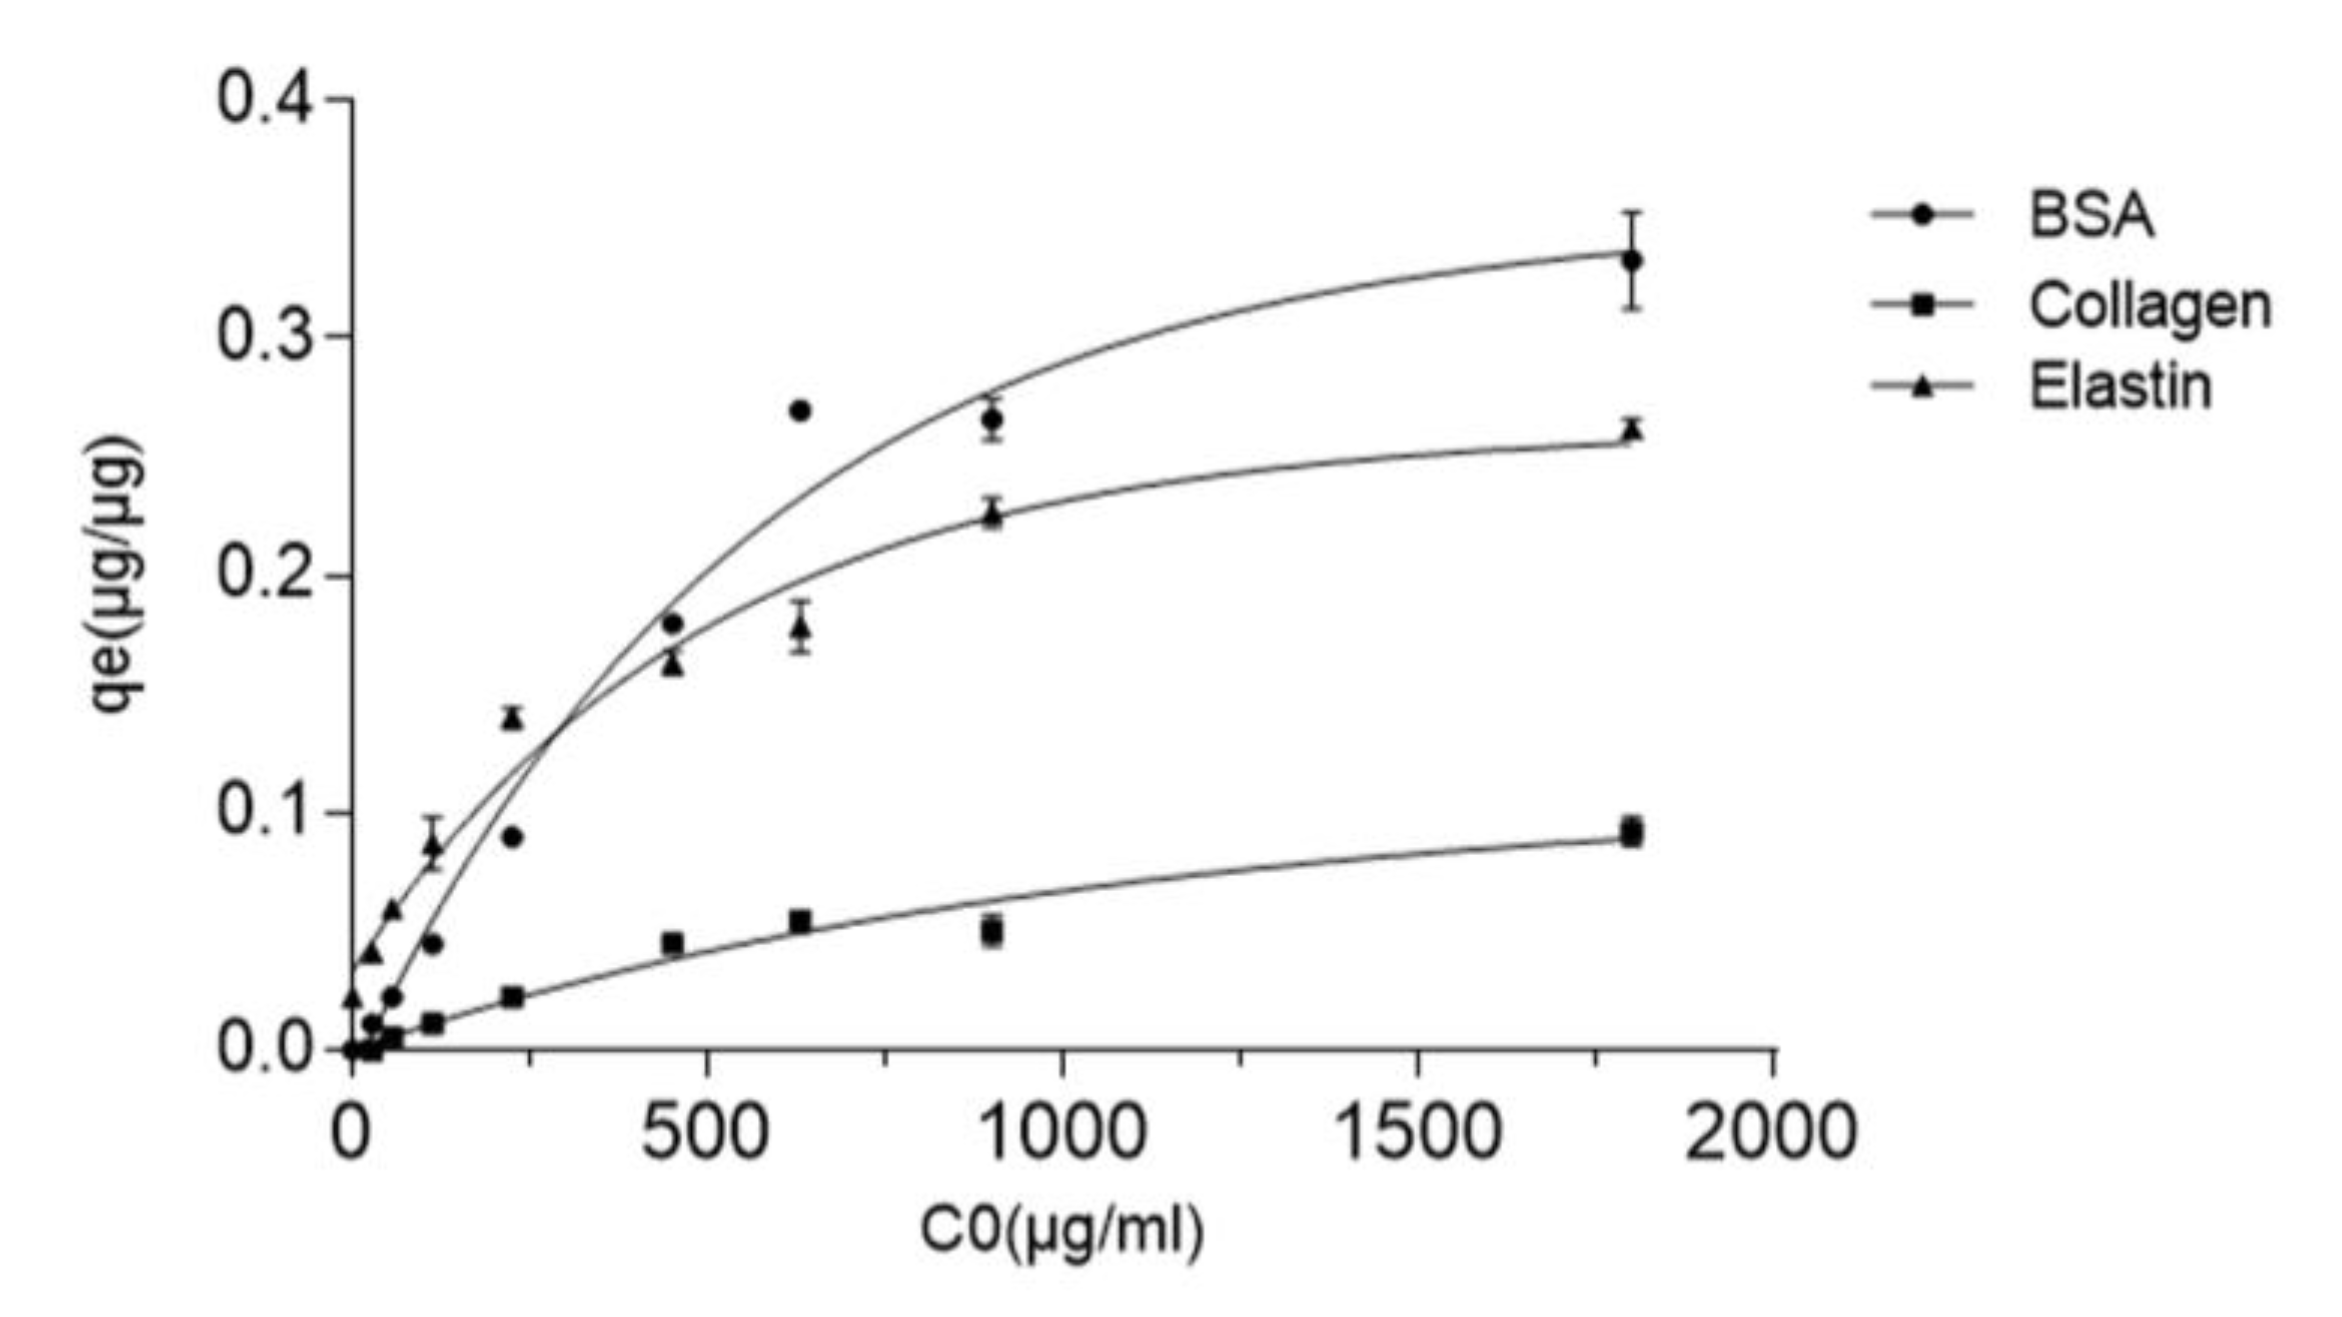
3.3. Protein-GO Adsorption Capacity Is Related to the Protein Molecular Weight

The adsorption capacity of GO platelets was studied by exposing them to different initial concentrations of BSA, collagen and elastin. From the quantified data, it was clear that the adsorption capacity of GO increased when the initial concentration of the proteins was enhanced, as shown in Figure 3. In fact, an increment in the initial protein concentration accelerated the diffusion of more protein from the solution towards the GO particle surface, indicating that the initial adsorbed protein provides the needed driving force for overcoming the resistance to the mass transfer of the protein between the aqueous phase and the GO particles’ solid phase [57]. However, this effect seems to be different among the three studied proteins. Thus, BSA-GO was the most affected interaction by the increment of the initial protein concentration, showing a qe of 0.045 ug/ug at an initial BSA concentration of 112.5 µg/mL and a 5.9-times increment at an initial BSA concentration of up to 1000 µg/mL. The maximum BSA adsorption capacity value on the GO surface was 0.332 ± 0.02 µg/µg. In contrast, collagen was the least affected in terms of GO surface adsorption when modifying the initial concentration, with the highest qe value at 0.092 ± 0.005 µg/µg.
All of the studied protein-GO interactions reached a plateau, indicating that all of the active sites of the GO surface were occupied. Since BSA and elastin are small molecular weight proteins, with 66.5 KDa and 70 KDa, respectively, while collagen has 300 KDa, we consider that the theoretical Random Sequential Adsorption (RSA) model can explain this adsorption process. In the RSA model, adsorption is described as a stochastic process with particles successively placed onto a surface where other particles have already existed. According to the RSA model, proteins will be adsorbed if they are not overlapped with previously adsorbed proteins (steric repulsion) [58]. Based on this model, collagen would show higher steric repulsion than BSA or elastin, because higher molecular weight would have more chance of overlapping with other collagen molecules on the GO surface, reflecting in a lower adsorption capacity than BSA or collagen, as observed.

3.4. Proteins Are Adsorbed in GO Platelets as a Monolayer

Langmuir and Freundlich models were applied to the adsorption capacity experimental data at constant temperature to determine the adsorption performance on the GO surface from the studied proteins, as shown in Table 2. Experimental data from the three proteins fitted to Langmuir model with a R2 value between 0.97–0.99, suggesting that the adsorption process occurs on the homogeneous surface. Moreover, the calculated qmax values from the three proteins are close to the qe experimental results, indicating that this model describes the adsorption of the proteins in contact with the GO particles in suspension. Therefore, we can conclude that the three proteins cover the finite number of adsorption sites from the surface of the GO platelets as a monolayer, without transmigration along the plane of the surface [51] and without interactions between the adsorbed proteins along the surface [59]. Since, no good R2 values were detected after applying the Freundlich model, we can discard the adsorption of an heterogeneous adsorbent with the formation of multiple layers of adsorbed proteins [52,60]. Separation factor values (RL) below 1 indicated a favorable adsorption into the GO surface of the three studied proteins, with the indication of an interaction with BSA with a value close to zero [51].

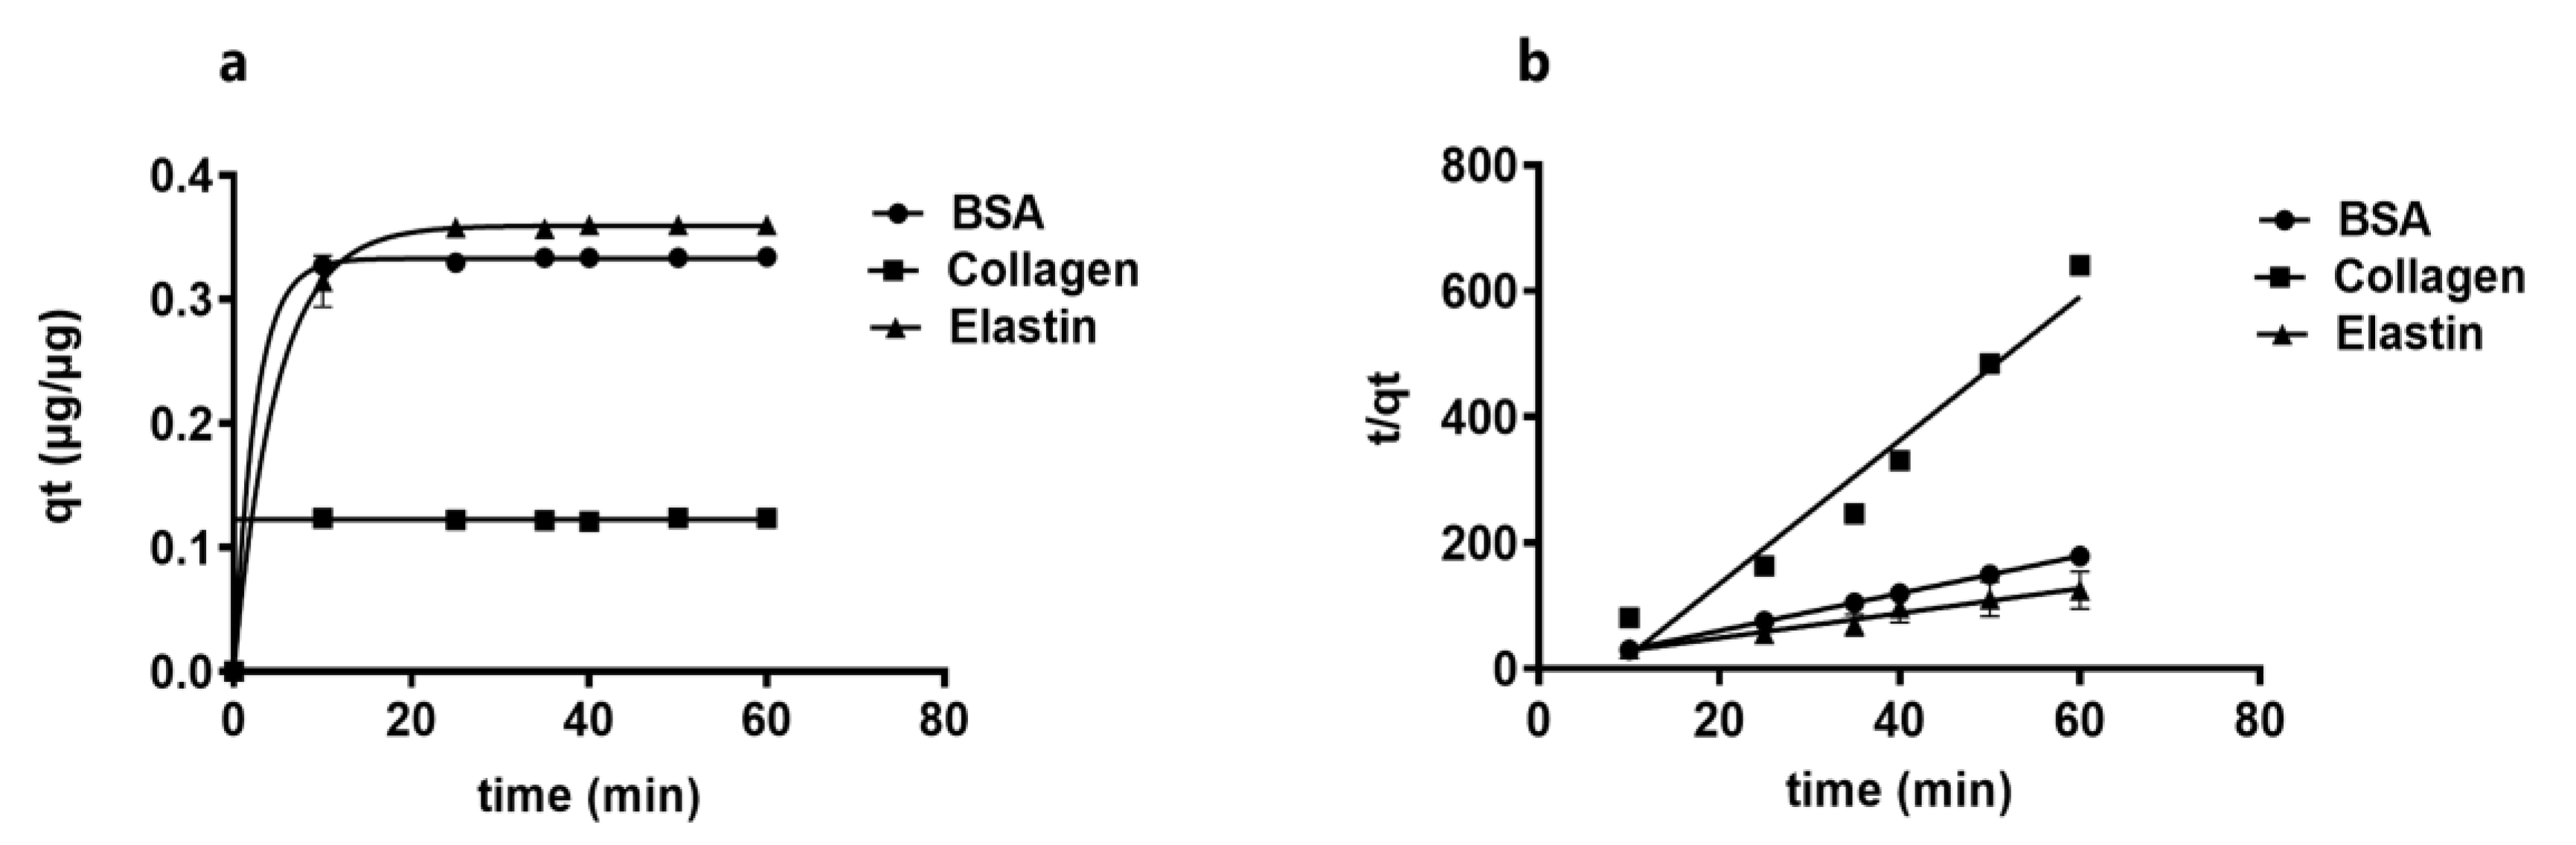
3.5. Kinetic Study of the Protein Adsorption into GO Shows that Lower Molecular Weight Proteins Are Adsorbed Faster

Next, we studied the kinetics of the protein adsorption, detecting that the rate of adsorption rapidly increases after proteins and GO platelets are mixed, due to the high available number of active sites on the GO platelets surface, shown in Figure 4a. The GO demonstrated a high capacity to adsorb the studied proteins on its surface and, ten minutes later when equilibrium state was reached, adsorption gradually slowed down since fewer sorption sites were available.
To understand the nature of this process, both pseudo-first-order and pseudo-second-order kinetic models were applied. The experimental data did not fit on the pseudo-first order kinetic mode, indicating that adsorption does not occur between one protein and one sorption site on the GO solid surface. However, the data did fit onto the pseudo-second-order kinetic model, shown in Figure 4b and Table 3, suggesting that each protein can be adsorbed into two sorption sites on the GO platelets [56]. Among the three proteins, collagen showed the lowest affinity based on its qt value, maybe due to its higher molecular weight (300 kDa), compared to BSA (66.5 kDa) and elastin (70 kDa) which increase steric repulsion forces, shown in Figure 4.
Next, to find the mechanism that fits the uptake of the protein into the GO surface, we applied the intra-particle diffusion model, a common study for material adsorption on solid adsorbents, such as GO, which would assume the adsorption process in three steps: the diffusion of molecules from the bulk solution to the external surface of GO particles; a diffusion through the internal surface of GO pores; a final adsorption into the internal sites of GO [44]. According to this model, elastin and BSA showed higher adsorption capacities (qt) than collagen (I). However, the plot of qt against t1/2 was linear, as shown in Figure 5, indicating that the intra-particle diffusion is not the unique process interposed in the GO adsorption of proteins, but film diffusion is also involved [50,61].
Values calculated from the intra-particle diffusion model indicate that elastin and BSA have higher Kp (as the intra-particle diffusion rate is constant), than collagen, which is similar to C, the thickness of the boundary layer, shown in Table 4. We consider that Kp and C provide an indication of the high affinity of BSA and elastin to the GO surface through the hydrophilic–hydrophilic interactions of the proteins to the carbon material. In contrast, interfering forces from the hydrophobic interaction with collagen, in addition to its high molecular weight, would be responsible of the lower Kp and C values.

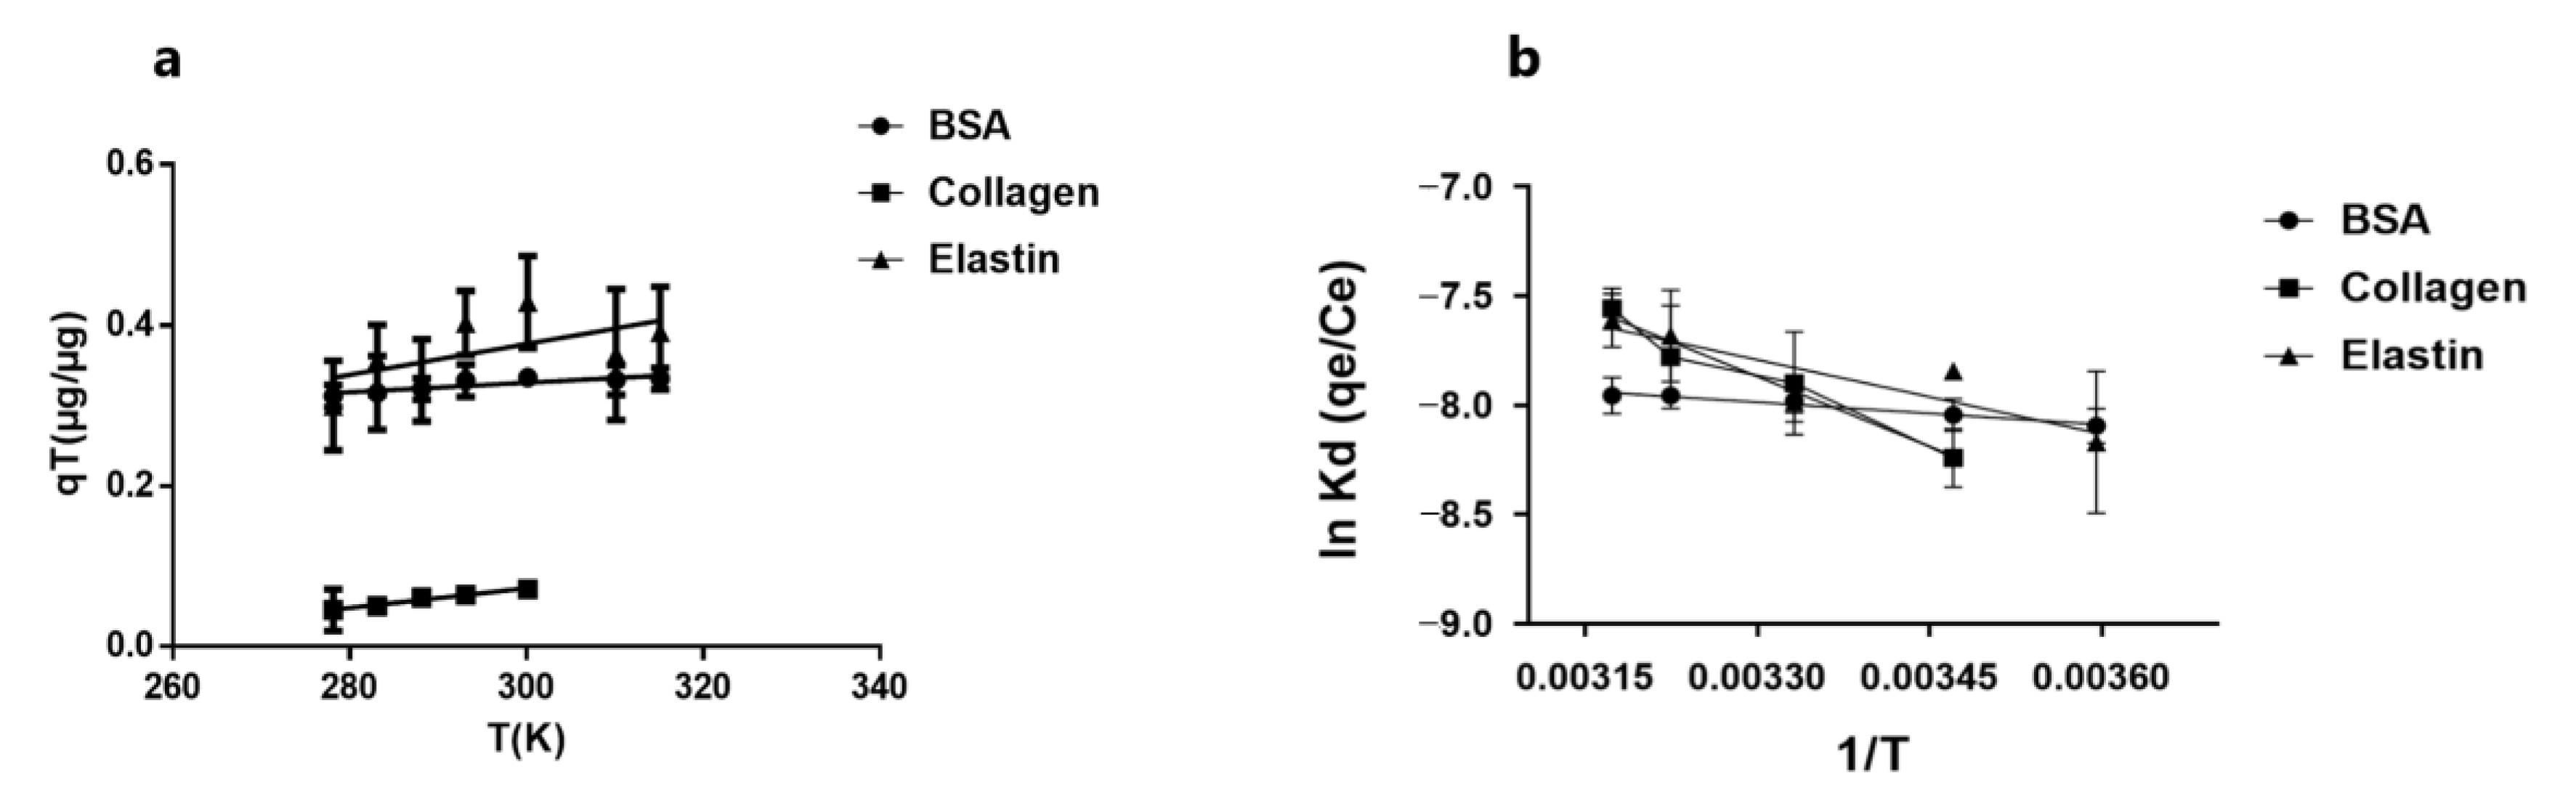
3.6. Protein Molecules Determine Thermodynamic Behavior in Their Adsorption by GO

We studied the effect of temperature on the protein adsorption into the GO platelets surface, since a change in temperature could modify the protein adsorption into GO. Therefore, we analyzed the protein adsorption from 278 K to 315 K, and calculated the parameters ∆H°, ∆S° and ∆G° with Equations (8)–(11), shown in Table 5. We detected an increase in adsorption capacity with the increment of temperature, as shown in Figure 6. The positive ∆H° values indicate that the adsorption of proteins on the GO surface is endothermic, evidencing that the interaction of BSA with GO is weaker than collagen and elastin, as observed with its lower ∆H° value [62]. Since adsorption is the sum of two steps, the endothermic hydration of the protein in the solution and the exothermic adsorption on the GO surface [53], the positive ∆H° values indicate that, in the protein adsorption on GO, hydration is the most predominant step.
Entropy at this range of temperature for the three studied proteins was negative (ΔS° < 0), indicating a decrease in randomness after the adsorption of the proteins into GO, in accordance with common protein behavior [1,51,60]. The highest ∆S° was detected in collagen while the lowest was in BSA, suggesting again that protein molecular weight plays an important role. Finally, the positive ∆G° values, characteristic of an endergonic reaction, suggest a non-spontaneous adsorption process of these proteins and an energy barrier for proteins to diffuse from the solution to the GO surface, with a hydration shell around the proteins that could prevent its adsorption into GO. Moreover, the values below 40 KJ/mol indicated not a physisorption process [43,54,56], but a chemisorption process instead.

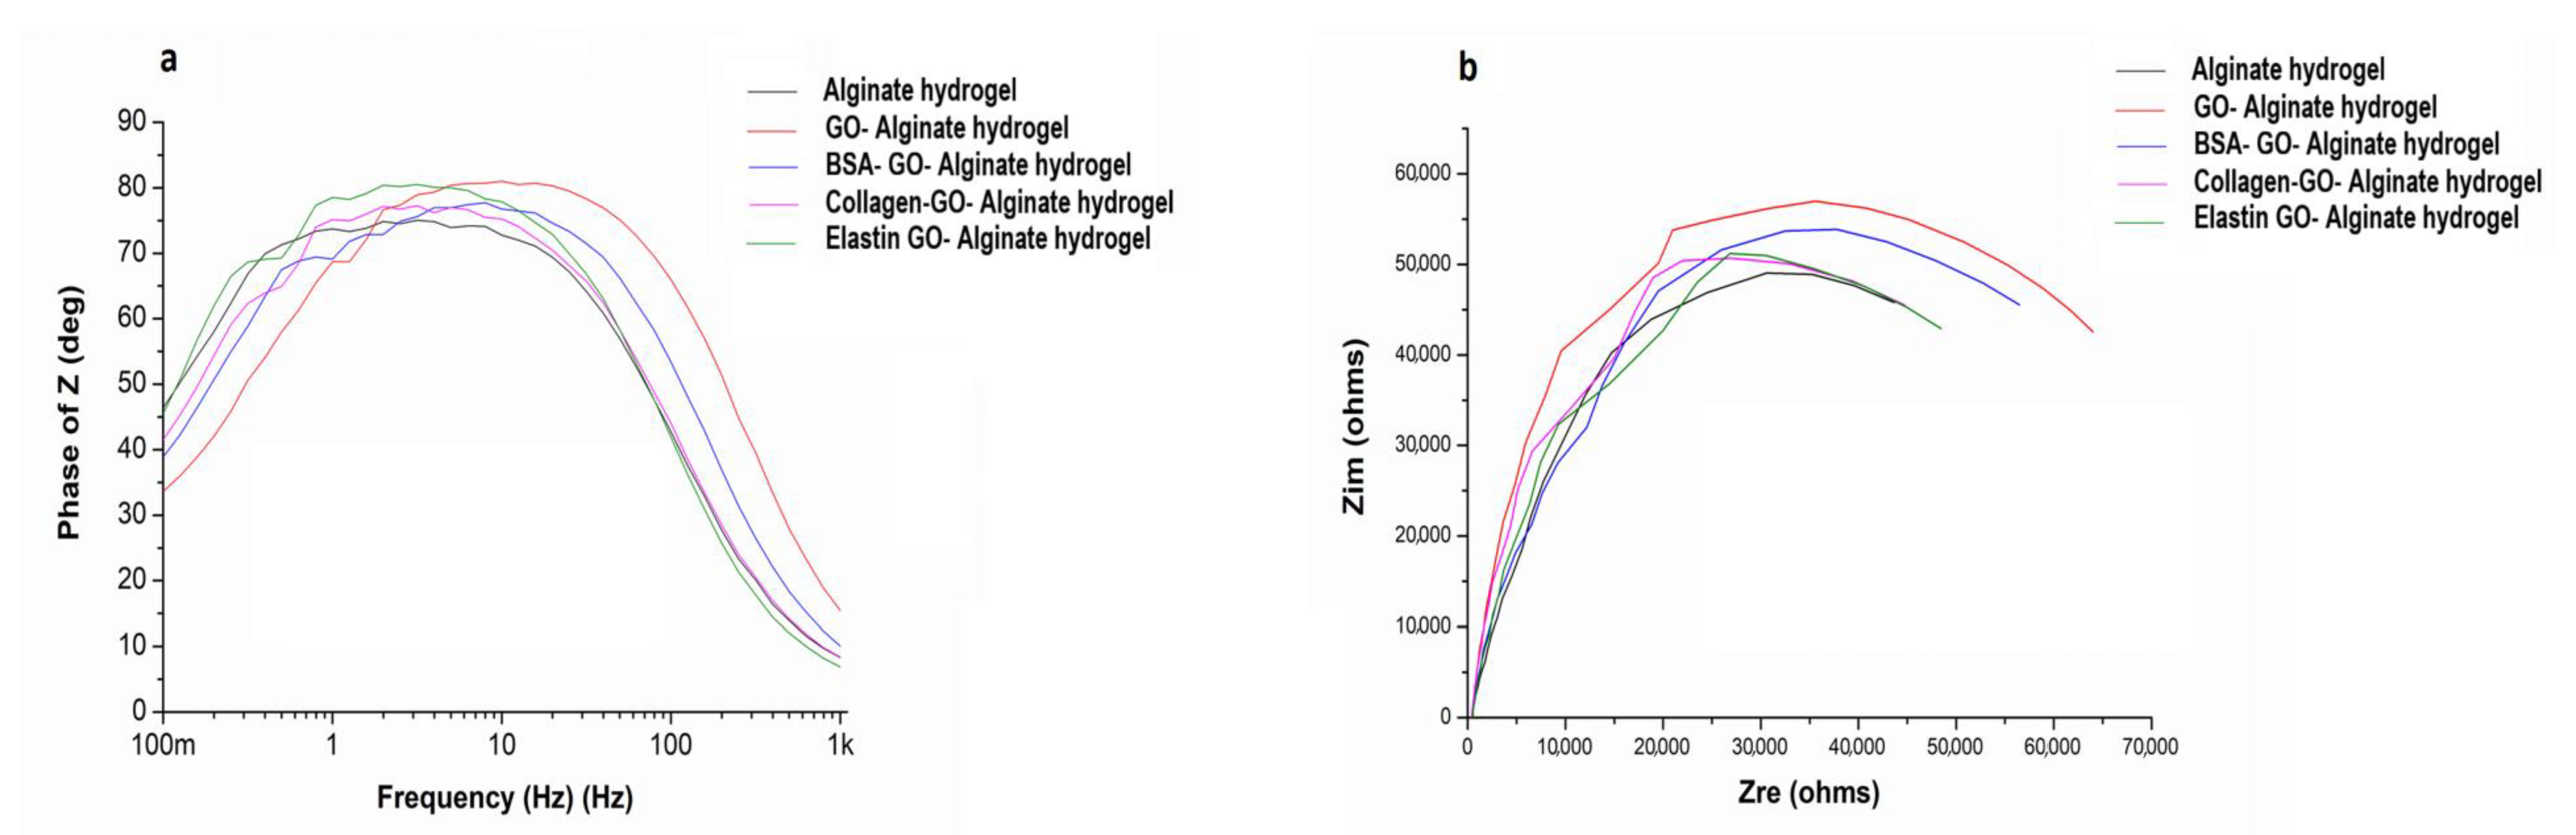
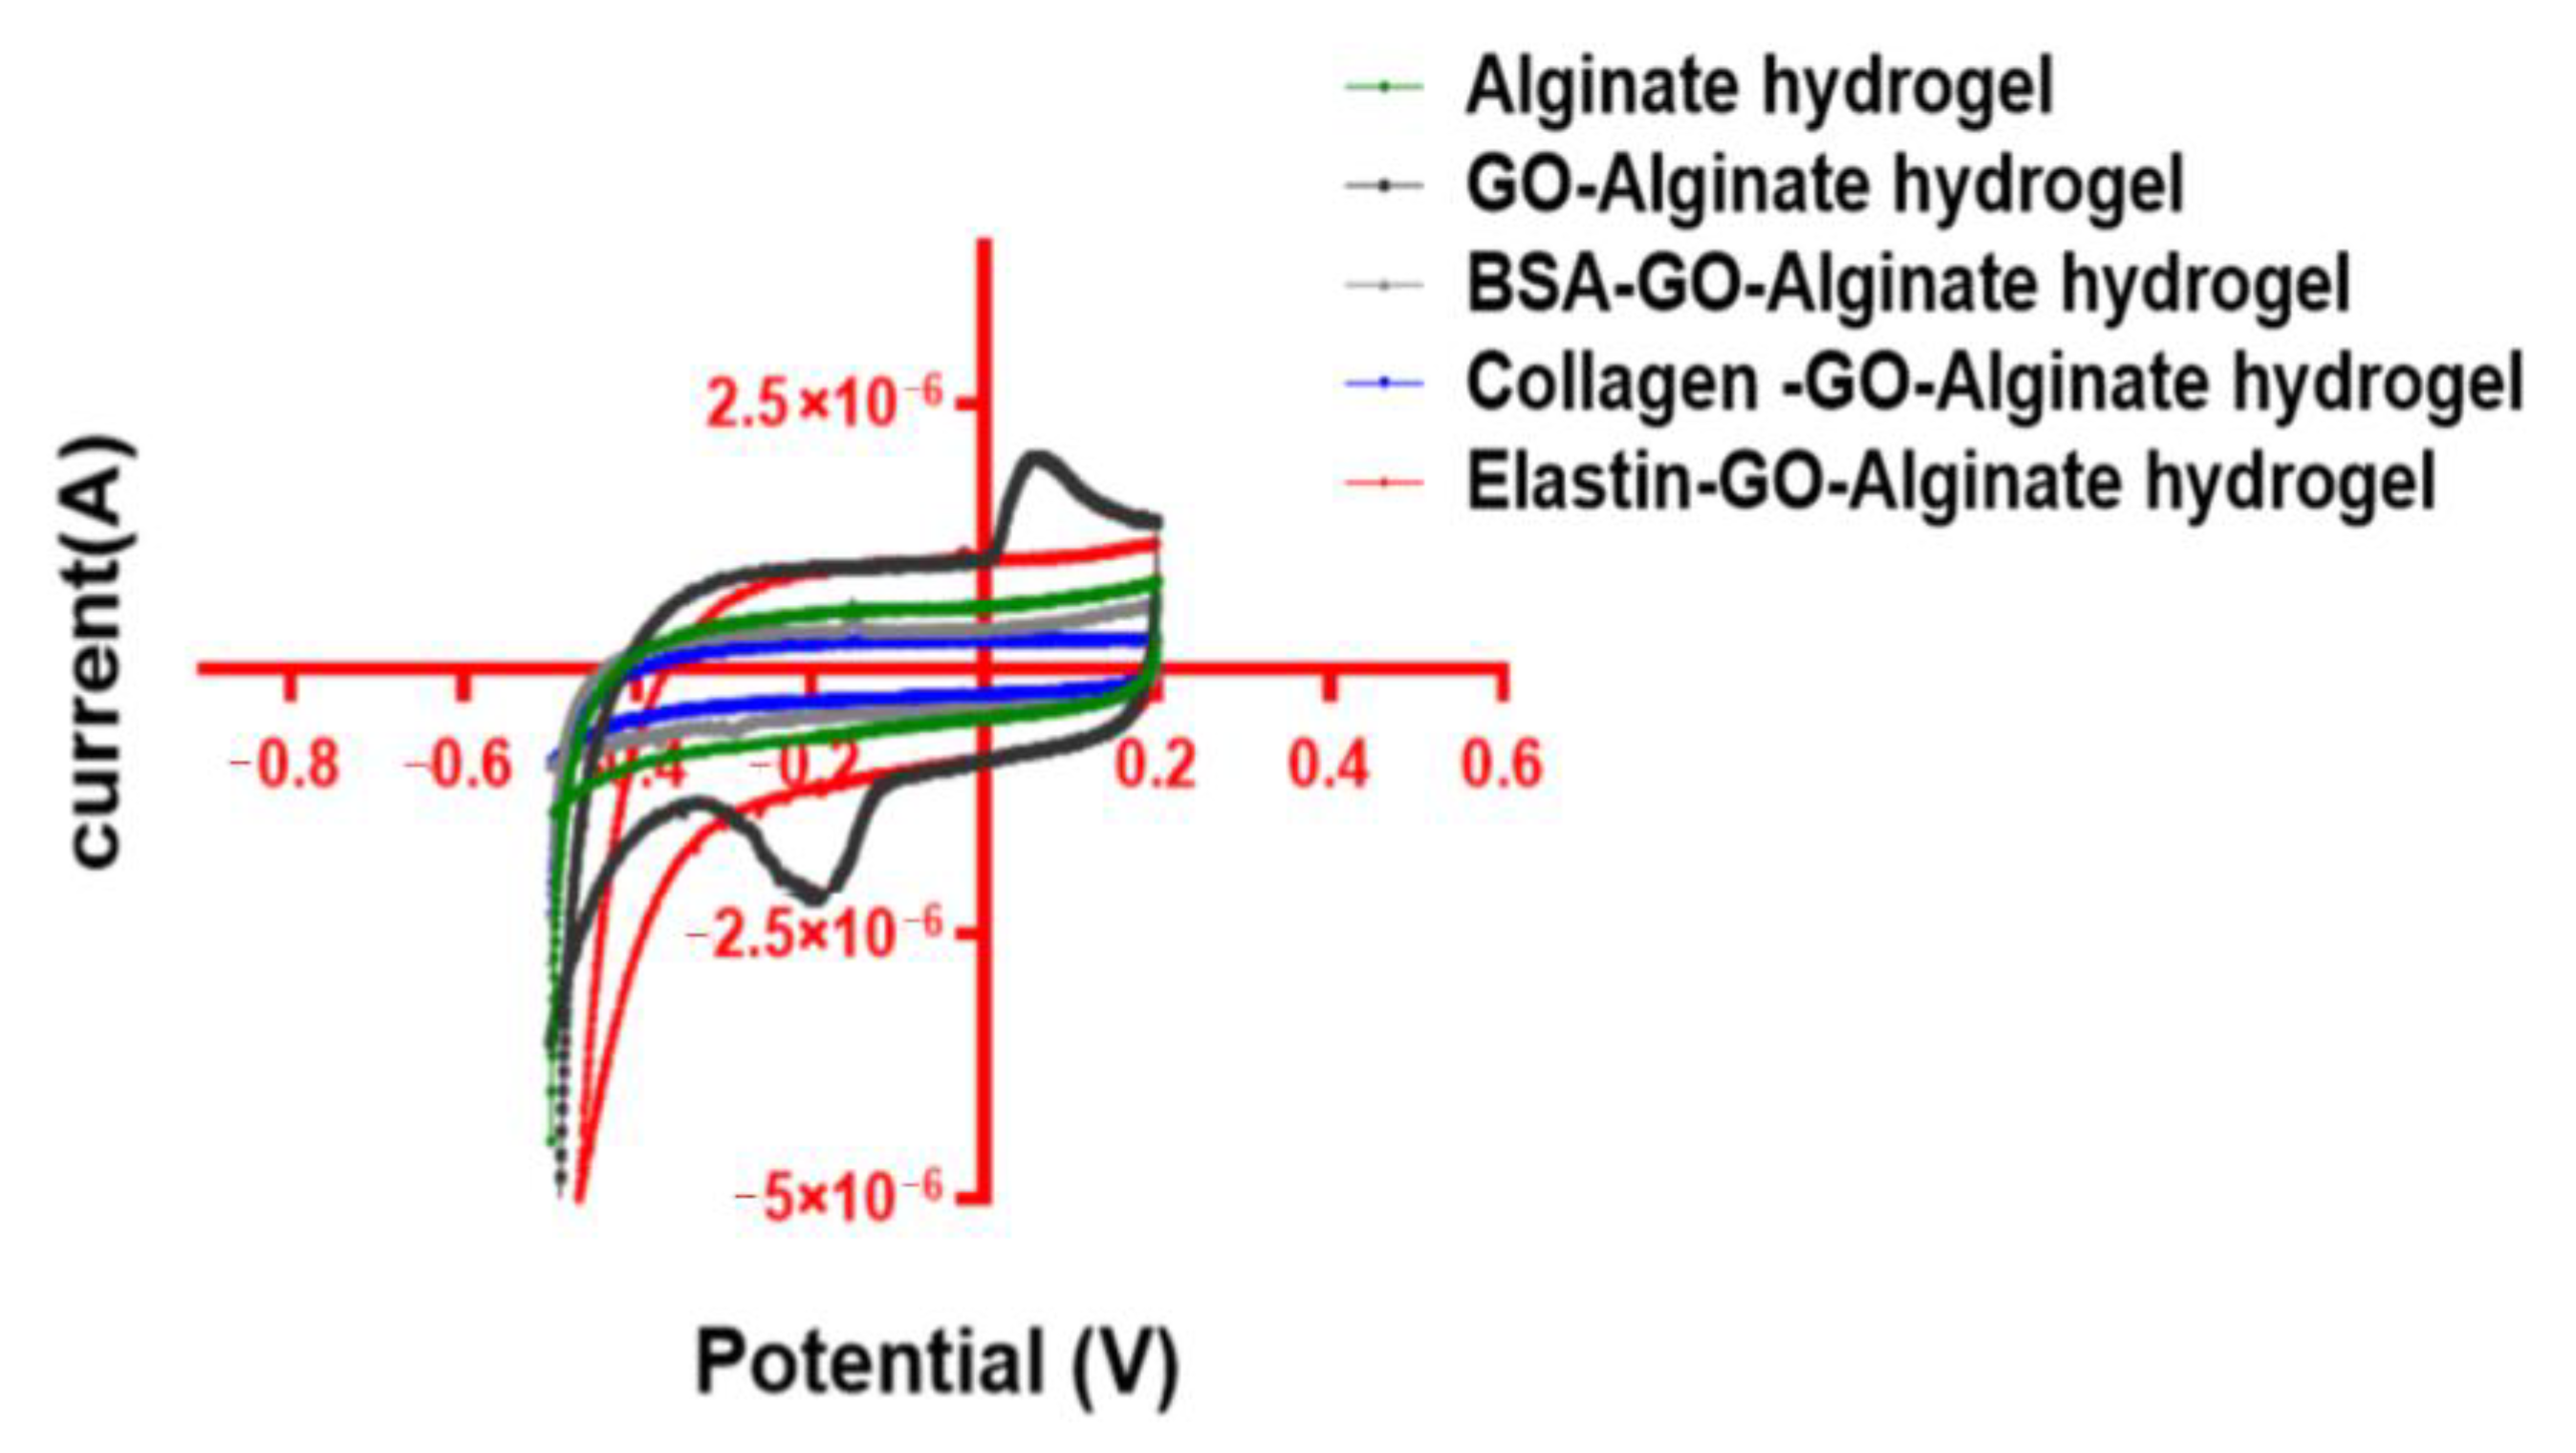
3.7. Conductivity Is Improved after Coating GO with Proteins within Alginate Matrixes

GO is an electrically insulating material due to its disrupted sp2 bonding networks, but it can act as a semiconductor, depending on the degree of oxidation [63], mediating as an electrochemical mediator in contact with cells. Therefore, we studied the electrochemical activity of protein coated-GO-hydrogels. We first determined the electrochemical impedance spectroscopy by measuring the phase impedance (Z) in the frequency range of 10−1–103 Hz, as shown in Figure 7. The data indicated an insulating/conducting behavior in the studied hydrogels.
We quantified the phase angles of Z from all the samples and represented them in Bode plots, shown in Figure 7a. Although the data at the lowest frequencies could not be represented due to the noise caused by the high values of impedance, we could detect that the phase angle tended to decrease towards zero at the high-frequencies region, reaching close to 90 degrees at lower high-frequencies, shown in Figure 7a. However slight modifications could be detected when GO or protein-coated GO was embedded in the alginate matrixes. We also quantified the impedances (Zim) from the different samples and represented them in Nyquist plots, shown in Figure 7b, detecting slight differences after embedding GO or coated-GO within alginate hydrogels. GO-alginate matrixes showed higher impedance than alginate hydrogels. However, although the presence of GO increased the impedance, protein-coating the GO decreased it, indicating an improvement in conductive behavior. The disrupted sp2 bonding networks from GO provided an insulating behavior [63], but coating with proteins could have led to the recovery of the sp2 networks, improving its conductivity properties [64], and therefore, creating a suitable signal conduction between cells and the alginate matrix when used in vivo. In fact, conductivity, among other GO-containing scaffold properties, would help to overcome the limitations from metals and silicon implantable devices, providing safer and effective treatments for pathological conditions in the clinic, particularly in the field of neurology or cardiology [65,66,67].

3.8. Capacitance Is Reduced after GO Protein Coating

We determined the capacitance (Zim) of the protein-coated alginate hydrogels by cyclic voltammetry (CV) at scan rates of ± 100 mV, in a potential window of −0.5 to 0.2 V, as shown in Figure 8.
The calculated non-coated GO-alginate hydrogel capacitance was the highest among the studied hydrogels (2.78 × 10³ f/g), 5.64-times higher than alginate hydrogels (4.77 × 10⁴ f/g). However, we detected a reduction in the capacitance of the protein-coated GO-alginate hybrid hydrogels compared to GO-alginate hydrogels. BSA-GO and collagen-GO containing hydrogels showed a value of 7.04 × 10⁴ f/g and 4.98 × 10⁴ f/g, smaller than the hydrogels containing elastin (2.47 × 10³ f/g). This reduction in the GO capacitance after protein coating is in agreement with those observed in EIS measurements, indicating that there is an accelerated electron transfer evidenced by a decreased Zim, lower phase shift and smaller impedance after the adsorption of proteins by GO sheets [68]. We consider that impedance decrease, in combination with observed capacitance measurements, indicate a slight improvement in the conductivity of protein-coated GO hybrid alginate hydrogels.

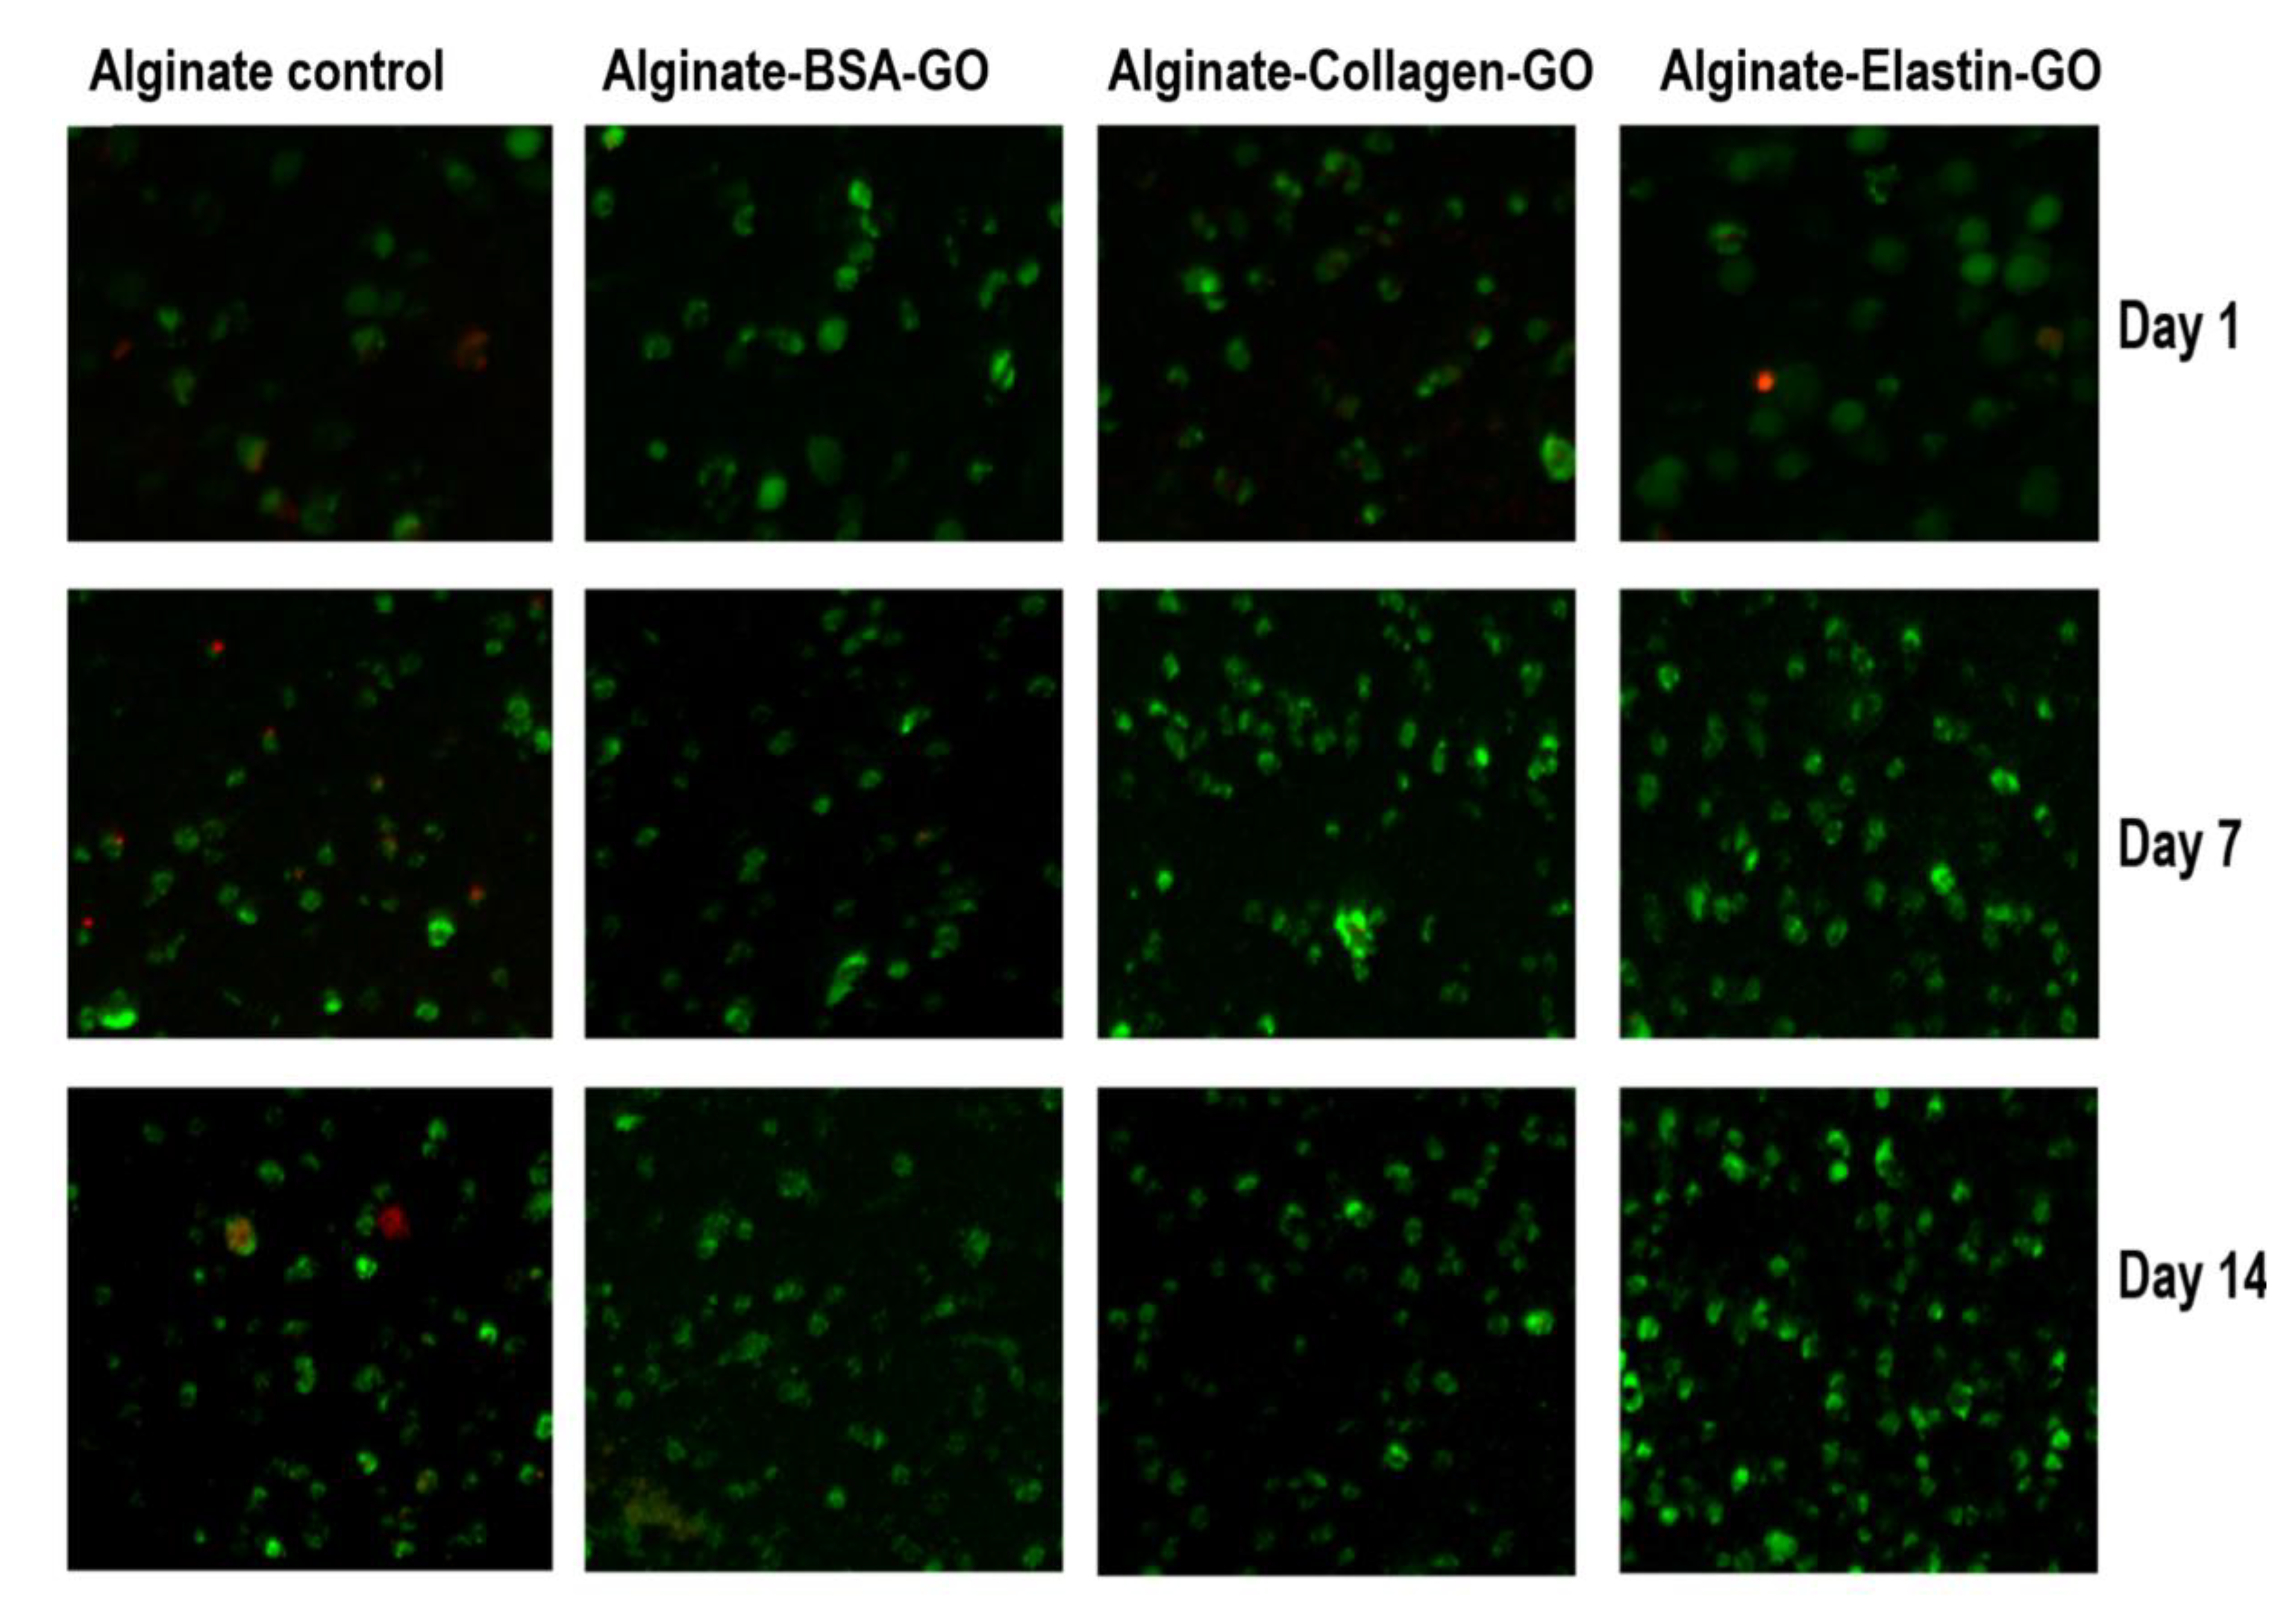
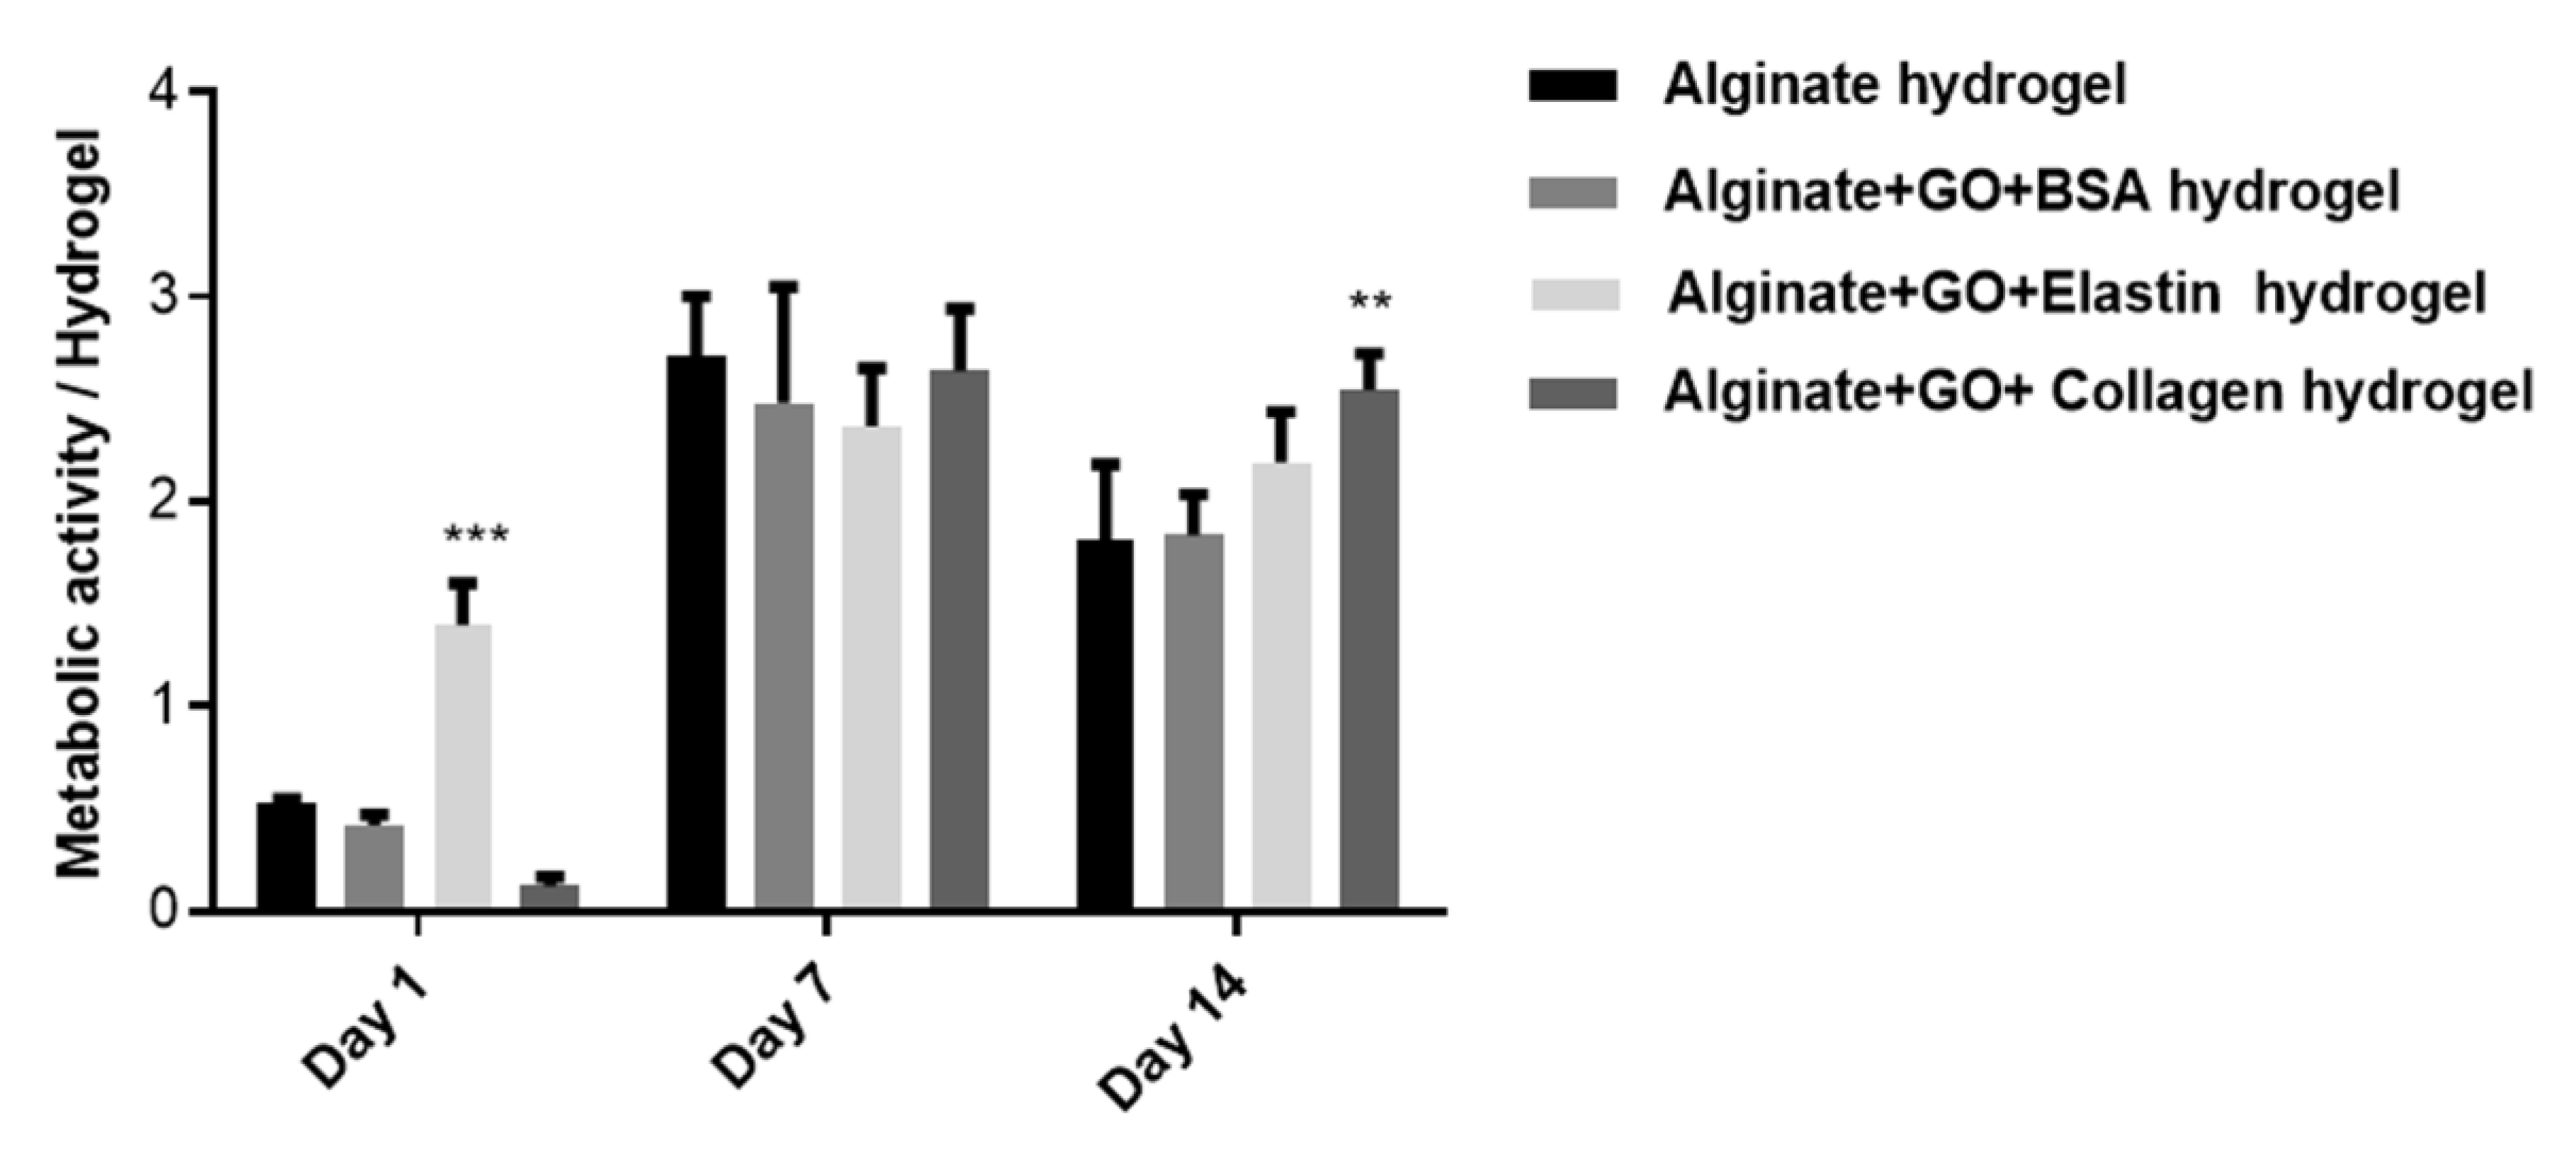
3.9. Collagen and Elastin Coated GO Improves Alginate Hydrogel-Embedded C2C12 Cell Viability

The introduction of FBS-coated GO nanoparticles in the matrix of alginate-poly-l-lysine-alginate hydrogels has shown to enhance the viability of the encapsulated erythropoietin-releasing C2C12 myoblasts (C2C12-EPO) [10,47,48], but if a sole protein could reproduce, this enhancement has not been discerned yet. Therefore, after characterizing the interaction between BSA, collagen or elastin with the GO surface, we generated alginate-based hydrogels containing protein-coated GO platelets to embed C2C12-EPO cells in order to study the in vitro outcomes from each protein-coated GO on a 3D model. Cell viability, assessed by confocal microscopy, showed that one day after embedding the cells, there were no differences among all the studied groups of hydrogels, with a similar number of live and dead cells, shown in Figure 9. However, one week later, there was a noteworthy cell viability enhancement from hydrogels containing collagen- and elastin-coated GO particles, increasing even more the second week in the elastin-coated GO group, indicating that collagen, and especially elastin, are able to improve the viability of embedded C2C12 cells within alginate hydrogels.
Next, we complemented the imaging studies through the quantification of metabolic activity. On the first day, the metabolic activity of the embedded cells was low with all of the studied protein-coated GO, perhaps due to the high shear stress that cells suffer during hydrogel fabrication after 24 h, shown in Figure 10. However, a significantly higher metabolic activity (p < 0.001) was already detected at this time point from the elastin-coated GO hydrogels. One and two weeks later, metabolic activity had increased over all of the hydrogels studied, showing only a statistically significant increment (p < 0.01) at two weeks in collagen-coated GO samples, as shown in Figure 10.

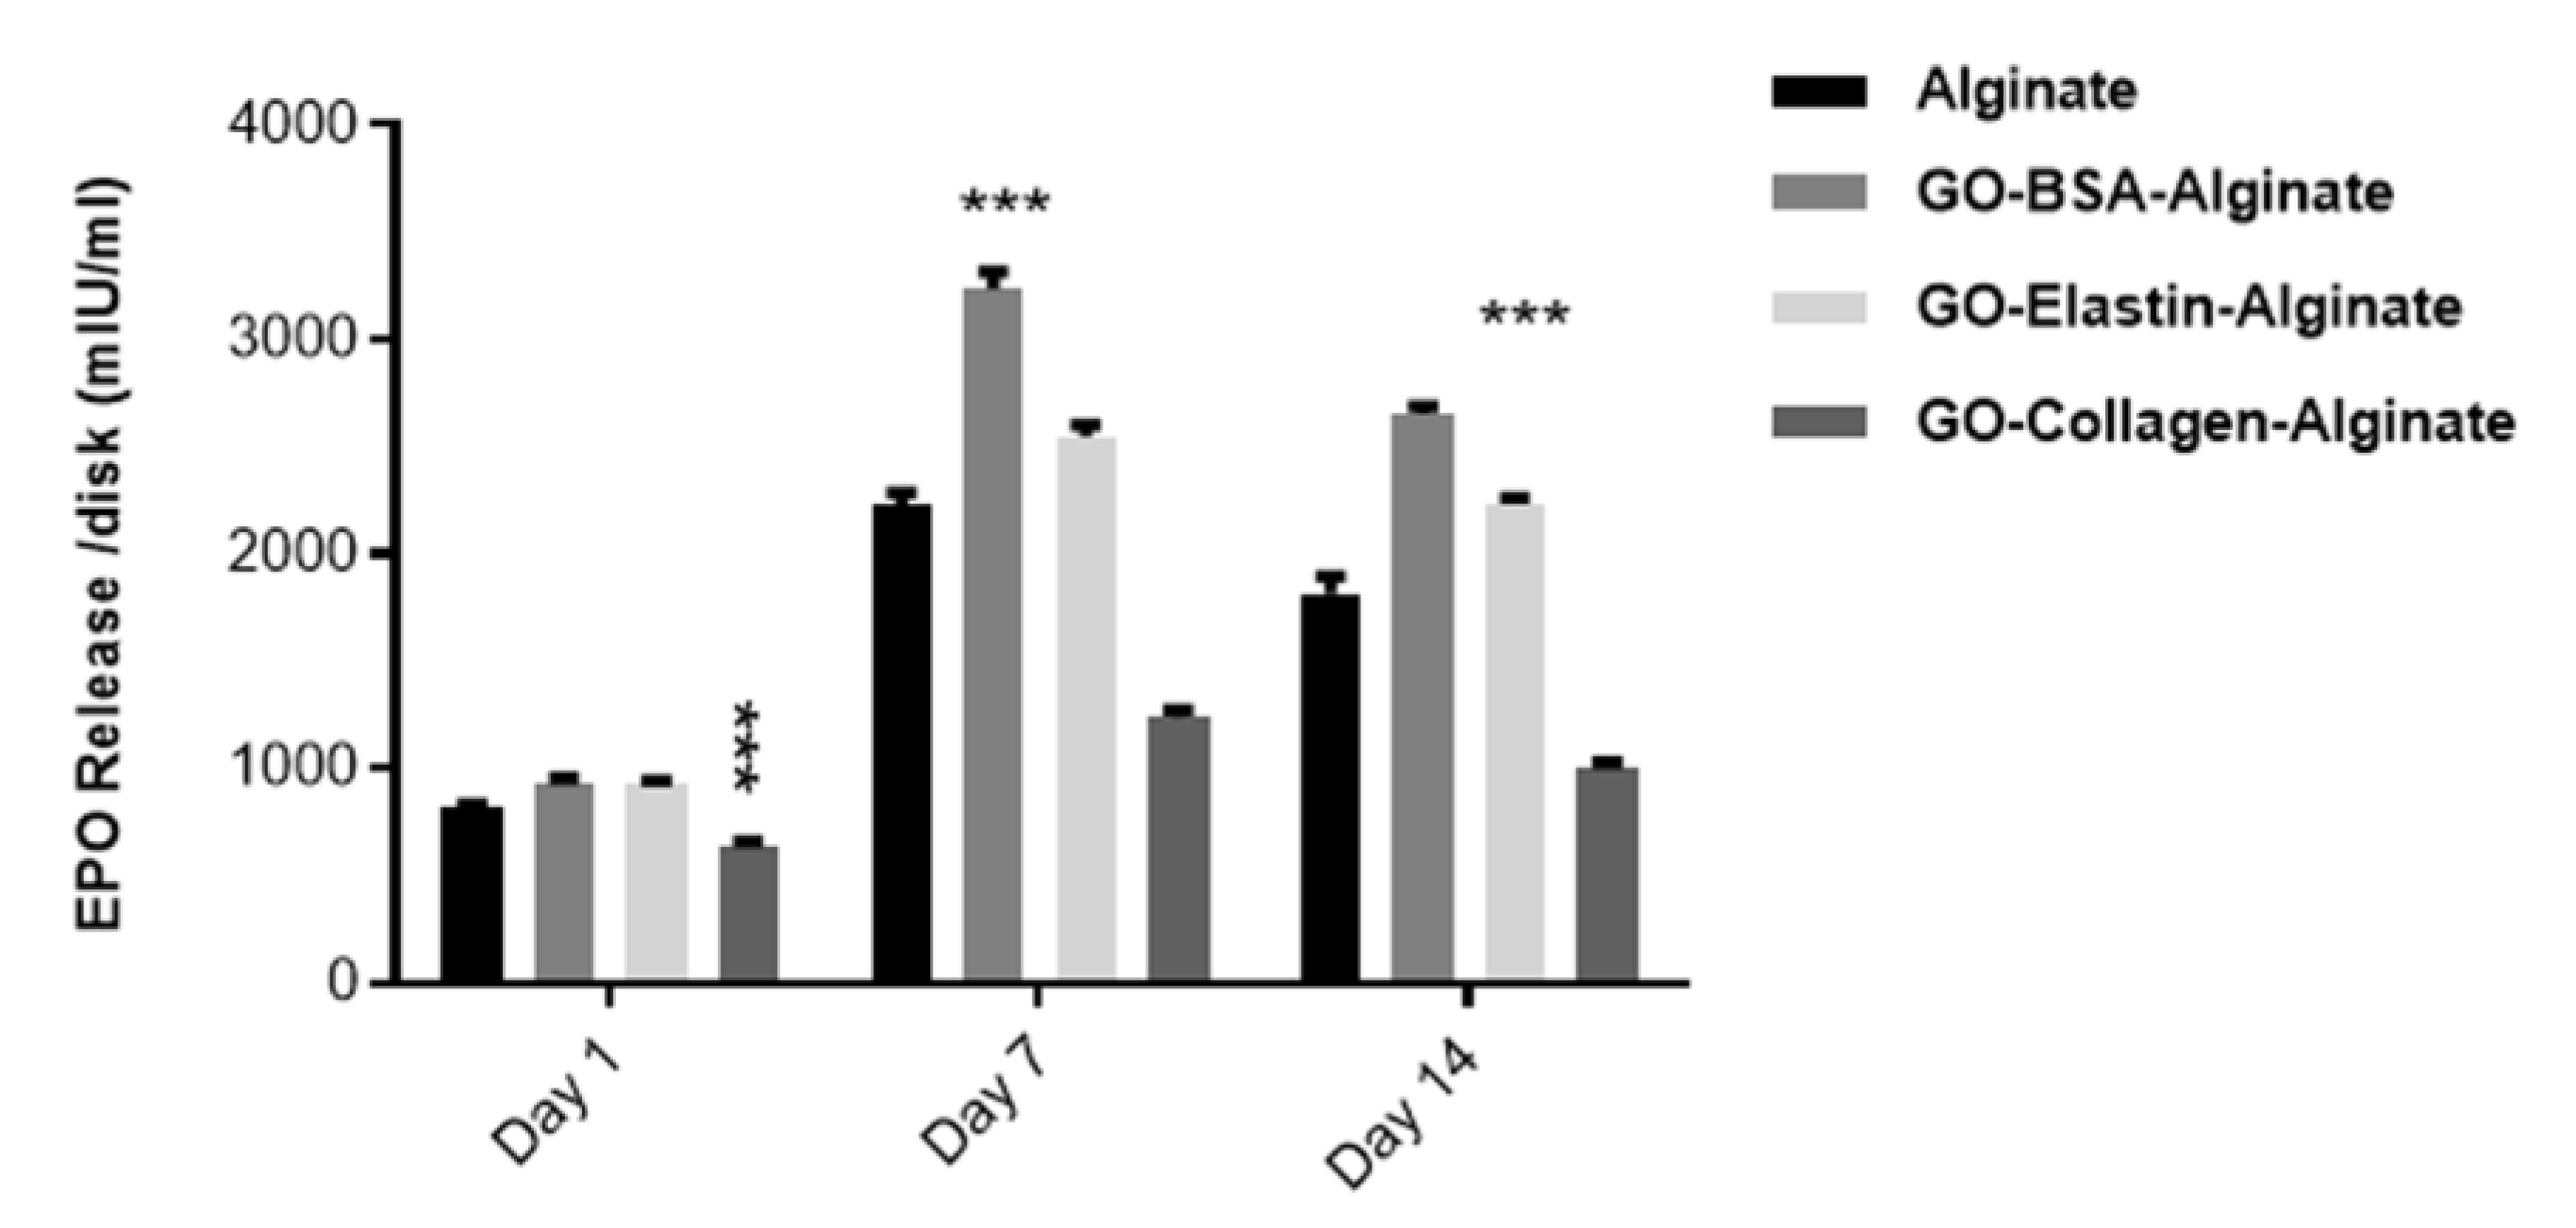
3.10. Protein Release by Embedded Cells Is Influenced by the Type of Protein-Coated GO

Next we quantified if the different protein-coated GO platelets had any effect on the production and release of the therapeutic protein, EPO. The BSA-coated GO containing alginate hydrogel showed the highest EPO release among the analyzed groups, while the elastin group had a similar profile in comparison to the control and the collagen group released a lower amount, as shown in Figure 11. These results were difficult to foresee, taking into account the viability results obtained with the calcein/ethidium staining, shown in Figure 9. We expected that a higher cell viability would represent a higher release of the therapeutic protein EPO. In addition, the collagen-GO-alginate hydrogels did not show lower viability in comparison to the controls but released a lower amount of EPO. One possible explanation is that elastin and collagen proteins are not able to form a stable and uniform bio-corona around the GO platelets of the release protein before their use for hydrogel fabrication, therefore avoiding the GO-inherent adsorption of the released proteins. Thus, although cells could be producing high quantities of EPO, the therapeutic protein could be retained in the GO surface, avoiding its release.
In order to confirm this hypothesis, we studied the capacity of BSA, elastin and collagen to block the GO platelets surface and avoid the adherence or interaction of EPO, shown in Figure 12a. Thus, the GO platelets were able to adsorb the 70% of the recombinant protein EPO when mixed and incubated in vitro. Interestingly, the BSA pre-coating of the GO nanoparticles was able to reduce this adsorption almost completely, which means that all of the EPO produced by the encapsulated C2C12 myoblast inside the BSA-GO-alginate hydrogels should be released into the culture media. In contrast, collagen and elastin reduced the percentage of EPO adsorption, but not completely, suggesting that some of the therapeutic protein can be retained within the hydrogels adsorbed into the GO particles. These results would explain why the amount of therapeutic protein detected on the culture media was similar to the alginate control group, although higher levels of viability were detected from elastin-GO-alginate hybrid hydrogels. Thus, although cells in the elastin group would produce higher amounts of protein (39.71% more than the detected levels), we were not able to quantify this difference. Regarding collagen, it was only able to block 45.29% of the EPO protein, indicating that 54.71% of the produced EPO should be retained within the hydrogels, shown in Figure 12a. However, even if we take into account this low blocking capacity, the amount of protein released by the cells on this hybrid hydrogel would be lower than in the BSA or elastin group. Therefore, we believe that another mechanism could be affecting the low protein release in collagen-coated GO hydrogels, such as the adsorption of EPO not only by the GO platelets, but also by collagen itself, since EPO has a tendency to cross-link soluble type IV collagen in vitro [69,70].
Aiming to establish if the blocking effect of the assayed three proteins has the same effect on different therapeutic proteins, we performed this study with insulin, since insulin producing cells in alginate microcapsules or hydrogels are a wide field of investigation for the treatment of type one diabetes mellitus [71,72]. Insulin showed a similar percentage of the adsorption of EPO to the GO surface, close to 70%. However, in contrast to EPO, the three studied proteins had the same blocking capacity in the interaction between the GO particles and insulin, reducing the adsorption of insulin into the GO surface by up to 60%, shown in Figure 12b. Therefore, we hypothesized that the hydrophilic nature of BSA and elastin interferes with the hydrophobic nature of EPO [73], decreasing the affinity of EPO to be adsorbed on the GO surface, in contrast to the hydrophobic nature of collagen, which would interact with the therapeutic protein, reducing its ability to prevent the trapping of EPO on the GO surface. Regarding insulin, its small molecular weight (6 kD) and its high hydrophilic nature, could possibly compete with the studied proteins at the GO binding sites, replacing part of the coating protein, or being inserted into the void spaces between the adsorbed proteins.

4. Conclusions

We have confirmed the formation of protein layers on the GO surface by Raman spectroscopy and FTIR, studying BSA, collagen and elastin. To understand the mechanisms underlying the bio-corona formation, we have described how the protein–GO adsorption capacity is related to the protein molecular weight, showing that collagen, with higher molecular weight, would have higher steric repulsion by overlapping with other collagen molecules on the GO surface. Moreover, we have concluded that proteins are adsorbed in the GO platelets as a monolayer, since the three proteins fit into the Langmuir model, with faster adsorption in lower molecular weight proteins. In this adsorption, each protein would be adsorbed by two sorption sites on the GO platelets, fitting to the pseudo-second-order models and following an endothermic process. The functionalization of GO with the studied proteins would alter the electrochemical activity of GO, decreasing its impedance and its specific capacitance, which could improve the biocompatibility of the carbon platelets.
All these mechanisms would be reflected in better cell viability and EPO release in hydrogels based more on GO-BSA and GO-elastin, than on GO-collagen. However, the hydrophilic nature of the adsorbed protein would play an important role in the biocompatibility of protein-coated GO, perhaps by attracting cells via π–π interactions and boosting more cells to adhere and proliferate on these matrices. Finally, although cells could be producing high quantities of EPO within the hybrid hydrogels, the therapeutic protein is retained in the GO surface, preventing its release. This retention is dramatically observed in the collagen-coated GO hybrid hydrogels, precluding their clinical translation. Therefore, we conclude that BSA- or elastin-coated GO hybrid hydrogels could act as promising scaffolds for improving the viability and functionality of embedded cells.

Author Contributions

Conceptualization, J.C., L.S. and J.L.P.; methodology, A.R., A.E.-N. and A.C.-H.; software, A.M.O.d.R. and M.L.S.; validation, J.C., L.S.d.B. and J.L.P.; formal analysis, A.R., J.C., L.S.d.B. and J.L.P.; investigation, A.R., J.C., L.S.d.P. and J.L.P.; resources, P.G.-M.; writing—original draft preparation, A.R.; writing—review and editing, J.C., L.S. and J.L.P.; visualization, A.R.; supervision, J.C., L.S.d.B. and J.L.P.; project administration, J.C., L.S.d.P. and J.L.P.; funding acquisition, J.L.P. All authors have read and agreed to the published version of the manuscript.

Funding

This research was funded by the University of the Basque Country UPV/EHU and the Basque Country Government (Grupos Consolidados, No ref: IT907-16).

Acknowledgments

The authors also wish to thank the intellectual and technical assistance provided by the ICTS “NANBIOSIS”, more specifically by the Drug Formulation Unit (U10) of the CIBER in Bioengineering, Biomaterials and Nanomedicine (CIBER-BBN) at the University of Basque Country (UPV/EHU).

Conflicts of Interest

The authors declare no conflict of interest.

References

  1. Paredes Juárez, G.A.; Spasojevic, M.; Faas, M.M.; de Vos, P. Immunological and technical considerations in application of alginate-based microencapsulation systems. Front. Bioeng. Biotechnol. 2014, 2, 106–126. [Google Scholar] [CrossRef] [Green Version]
  2. Lee, K.Y.; Mooney, D.J. Alginate: Properties and biomedical applications. Prog. Polym. Sci. 2012, 37, 106–126. [Google Scholar] [CrossRef] [PubMed] [Green Version]
  3. Orive, G.; De Castro, M.; Kong, H.; Hernández, R.M.A.; Ponce, S.; Mooney, D.J.; Pedraz, J.L. Bioactive cell-hydrogel microcapsules for cell-based drug delivery. J. Control. Release 2009, 135, 203–210. [Google Scholar] [CrossRef] [PubMed]
  4. Garate, A.; Ciriza, J.; Casado, J.G.; Blazquez, R.; Pedraz, J.L.; Orive, G.; Hernandez, R.M. Assessment of the Behavior of Mesenchymal Stem Cells Immobilized in Biomimetic Alginate Microcapsules. Mol. Pharm. 2015, 12, 3953–3962. [Google Scholar] [CrossRef] [PubMed]
  5. Huang, X.; Yin, Z.; Wu, S.; Qi, X.; He, Q.; Zhang, Q.; Yan, Q.; Boey, F.; Zhang, H. Graphene-based materials: Synthesis, characterization, properties, and applications. Small 2011, 7, 1876–1902. [Google Scholar] [CrossRef]
  6. Novoselov, K.S.; Fal’ko, V.I.; Colombo, L.; Gellert, P.R.; Schwab, M.G.; Kim, K. A roadmap for graphene. Nature 2012, 490, 192. [Google Scholar] [CrossRef]
  7. Kuila, T.; Bose, S.; Khanra, P.; Mishra, A.K.; Kim, N.H.; Lee, J.H. Recent advances in graphene-based biosensors. Biosens. Bioelectron. 2011, 26, 4637–4648. [Google Scholar] [CrossRef]
  8. Nguyen, D.A.; Lee, Y.R.; Raghu, A.V.; Jeong, H.M.; Shin, C.M.; Kim, B.K. Morphological and physical properties of a thermoplastic polyurethane reinforced with functionalized graphene sheet. Polym. Int. 2009, 58, 412–417. [Google Scholar] [CrossRef]
  9. Wang, L.; Fan, H.; Zhang, Z.; Lou, A.; Pei, G.; Jiang, S.; Mu, T.; Qin, J.; Chen, S.; Jin, D. Osteogenesis and angiogenesis of tissue-engineered bone constructed by prevascularized β-tricalcium phosphate scaffold and mesenchymal stem cells. Biomaterials 2010, 31, 9452–9461. [Google Scholar] [CrossRef]
  10. Ciriza, J.; Saenz del Burgo, L.; Virumbrales-Muñoz, M.; Ochoa, I.; Fernandez, L.J.; Orive, G.; Hernandez, R.M.; Pedraz, J.L. Graphene oxide increases the viability of C2C12 myoblasts microencapsulated in alginate. Int. J. Pharm. 2015, 493, 260–270. [Google Scholar] [CrossRef]
  11. Goenka, S.; Sant, V.; Sant, S. Graphene-based nanomaterials for drug delivery and tissue engineering. J. Control. Release 2014, 173, 75–88. [Google Scholar] [CrossRef] [PubMed]
  12. Liu, J.; Cui, L.; Losic, D. Graphene and graphene oxide as new nanocarriers for drug delivery applications. Acta Biomater. 2013, 9, 9243–9257. [Google Scholar] [CrossRef] [PubMed]
  13. Sun, X.; Liu, Z.; Welsher, K.; Robinson, J.; Goodwin, A.; Zaric, S.; Dai, H. Nano-graphene oxide for cellular imaging and drug delivery. Nano Res. 2008, 1, 203–212. [Google Scholar] [CrossRef] [PubMed] [Green Version]
  14. Li, J.; Zeng, X.; Ren, T.; van der Heide, E. The preparation of graphene oxide and its derivatives and their application in bio-tribological systems. Lubricants 2014, 2, 137–161. [Google Scholar] [CrossRef] [Green Version]
  15. Bradder, P.; Ling, S.K.; Wang, S.; Liu, S. Dye adsorption on layered graphite oxide. J. Chem. Eng. Data 2011, 56, 138–141. [Google Scholar] [CrossRef]
  16. Suk, J.W.; Piner, R.D.; An, J.; Ruoff, R.S. Mechanical properties of monolayer graphene oxide. ACS Nano 2010, 4, 6557–6564. [Google Scholar] [CrossRef]
  17. Konkena, B.; Vasudevan, S. Understanding aqueous dispersibility of graphene oxide and reduced graphene oxide through pKa measurements. J. Phys. Chem. Lett. 2012, 3, 867. [Google Scholar] [CrossRef]
  18. Park, S.; An, J.; Jung, I.; Piner, R.D.; An, S.J.; Li, X.; Velamakanni, A.; Ruoff, R.S. Colloidal suspensions of highly reduced graphene oxide in a wide variety of organic solvents. Nano Lett. 2009, 9, 1593–1597. [Google Scholar] [CrossRef]
  19. Anonymous. Graphene Oxide: Preparation, Functionalization, and Electrochemical Applications. Available online: https://pubs.acs.org/doi/ipdf/10.1021/cr300115g (accessed on 7 September 2018).
  20. Park, S.; Ruoff, R.S. Chemical methods for the production of graphenes. Nat. Nanotechnol. 2009, 4, 217–224. [Google Scholar] [CrossRef]
  21. Zhang, L.; Lu, Z.; Zhao, Q.; Huang, J.; Shen, H.; Zhang, Z. Enhanced chemotherapy efficacy by sequential delivery of siRNA and anticancer drugs using PEI-grafted graphene oxide. Small 2011, 7, 460–464. [Google Scholar] [CrossRef]
  22. Liu, Z.; Robinson, J.T.; Sun, X.; Dai, H. PEGylated nanographene oxide for delivery of water-insoluble cancer drugs. J. Am. Chem. Soc. 2008, 130, 10876–10877. [Google Scholar] [CrossRef] [PubMed] [Green Version]
  23. Chung, C.; Kim, Y.; Shin, D.; Ryoo, S.; Hong, B.H.; Min, D. Biomedical applications of graphene and graphene oxide. Acc. Chem. Res. 2013, 46, 2211–2224. [Google Scholar] [CrossRef]
  24. Simsikova, M.; Šikola, T. Interaction of graphene oxide with proteins and applications of their conjugates. J. Nanomed. Res. 2017, 5. [Google Scholar] [CrossRef]
  25. Emadi, F.; Amini, A.; Gholami, A.; Ghasemi, Y. Functionalized graphene oxide with chitosan for protein nanocarriers to protect against enzymatic cleavage and retain collagenase activity. Sci. Rep. 2017, 7, 42258. [Google Scholar] [CrossRef] [Green Version]
  26. Yang, P.; Liu, Q.; Liu, J.; Zhang, H.; Li, Z.; Li, R.; Liu, L.; Wang, J. Bovine serum albumin-coated graphene oxide for effective adsorption of uranium(VI) from aqueous solutions. Ind. Eng. Chem. Res. 2017, 56, 3588–3598. [Google Scholar] [CrossRef]
  27. Hassan, M.; Walter, M.; Moseler, M. Interactions of polymers with reduced graphene oxide: Van der Waals binding energies of benzene on graphene with defects. Phys. Chem. Chem. Phys. 2014, 16, 33–37. [Google Scholar] [CrossRef] [PubMed]
  28. Yu, S.; Wang, X.; Ai, Y.; Liang, Y.; Ji, Y.; Li, J.; Hayat, T.; Alsaedi, A.; Wang, X. Spectroscopic and theoretical studies on the counterion effect of Cu(ii) ion and graphene oxide interaction with titanium dioxide. Environ. Sci. Nano 2016, 3, 1361–1368. [Google Scholar] [CrossRef]
  29. Xu, X.; Mao, X.; Wang, Y.; Li, D.; Du, Z.; Wu, W.; Jiang, L.; Yang, J.; Li, J. Study on the interaction of graphene oxide-silver nanocomposites with bovine serum albumin and the formation of nanoparticle-protein corona. Int. J. Biol. Macromol. 2018, 116, 492–501. [Google Scholar] [CrossRef]
  30. Lv, M.; Yan, L.; Liu, C.; Su, C.; Zhou, Q.; Zhang, X.; Lan, Y.; Zheng, Y.; Lai, L.; Liu, X.; et al. Non-covalent functionalized graphene oxide (GO) adsorbent with an organic gelator for co-adsorption of dye, endocrine-disruptor, pharmaceutical and metal ion. Chem. Eng. J. 2018, 349, 791–799. [Google Scholar] [CrossRef]
  31. Kuchlyan, J.; Kundu, N.; Banik, D.; Roy, A.; Sarkar, N. Spectroscopy and fluorescence lifetime imaging microscopy to probe the interaction of bovine serum albumin with graphene oxide. Langmuir ACS J. Surf. Colloids 2015, 31, 13793–13801. [Google Scholar] [CrossRef]
  32. Šimšíková, M. Interaction of graphene oxide with albumins: Effect of size, pH, and temperature. Arch. Biochem. Biophys. 2016, 593, 69–79. [Google Scholar] [CrossRef] [PubMed]
  33. Tang, S.; Cao, Z. Adsorption of nitrogen oxides on graphene and graphene oxides: Insights from density functional calculations. J. Chem. Phys. 2011, 134, 044710. [Google Scholar] [CrossRef] [PubMed]
  34. Oliveira, S.F.; Bisker, G.; Bakh, N.A.; Gibbs, S.L.; Landry, M.P.; Strano, M.S. Protein functionalized carbon nanomaterials for biomedical applications. Carbon 2015, 95, 767–779. [Google Scholar] [CrossRef] [Green Version]
  35. Carrier-bound Immobilized Enzymes: Principles, Application and Design. Available online: https://www.wiley.com/enus/Carrier+bound+Immobilized+Enzymes%3A+Principles%2C+Application+and+Design-p-9783527312320 (accessed on 26 March 2019).
  36. Feng, L.; Liu, Z. Graphene in biomedicine: Opportunities and challenges. Nanomedicine (London) 2011, 6, 317–324. [Google Scholar] [CrossRef] [PubMed]
  37. Yan, L.; Zhao, F.; Li, S.; Hu, Z.; Zhao, Y. Low-toxic and safe nanomaterials by surface-chemical design, carbon nanotubes, fullerenes, metallofullerenes, and graphenes. Nanoscale 2011, 3, 362–382. [Google Scholar] [CrossRef]
  38. Sasidharan, A.; Panchakarla, L.S.; Sadanandan, A.R.; Ashokan, A.; Chandran, P.; Girish, C.M.; Menon, D.; Nair, S.V.; Rao, C.N.R.; Koyakutty, M. Hemocompatibility and macrophage response of pristine and functionalized graphene. Small 2012, 8, 1251–1263. [Google Scholar] [CrossRef]
  39. Yue, H.; Wei, W.; Yue, Z.; Wang, B.; Luo, N.; Gao, Y.; Ma, D.; Ma, G.; Su, Z. The role of the lateral dimension of graphene oxide in the regulation of cellular responses. Biomaterials 2012, 33, 4013–4021. [Google Scholar] [CrossRef] [PubMed]
  40. Singh, S.K.; Singh, M.K.; Kulkarni, P.P.; Sonkar, V.K.; Grácio, J.J.A.; Dash, D. Amine-modified graphene: Thrombo-protective safer alternative to graphene oxide for biomedical applications. ACS Nano 2012, 6, 2731–2740. [Google Scholar] [CrossRef]
  41. Hu, W.; Peng, C.; Luo, W.; Lv, M.; Li, X.; Li, D.; Huang, Q.; Fan, C. Graphene-based antibacterial paper. ACS Nano 2010, 4, 4317–4323. [Google Scholar] [CrossRef]
  42. Chang, Y.; Yang, S.; Liu, J.; Dong, E.; Wang, Y.; Cao, A.; Liu, Y.; Wang, H. In vitro toxicity evaluation of graphene oxide on A549 cells. Toxicol. Lett. 2011, 200, 201–210. [Google Scholar] [CrossRef] [PubMed]
  43. Zhang, Y.; Ali, S.F.; Dervishi, E.; Xu, Y.; Li, Z.; Casciano, D.; Biris, A.S. Cytotoxicity effects of graphene and single-wall carbon nanotubes in neural phaeochromocytoma-derived PC12 cells. ACS Nano 2010, 4, 3181–3186. [Google Scholar] [CrossRef] [PubMed]
  44. Srikanth, K.; Sundar, L.S.; Pereira, E.; Duarte, A.C. Graphene oxide induces cytotoxicity and oxidative stress in bluegill sunfish cells. J. Appl. Toxicol. 2018, 38, 504–513. [Google Scholar] [CrossRef] [PubMed]
  45. Raslan, A.; Saenz del Burgo, L.; Ciriza, J.; Luis Pedraz, J. Graphene oxide and reduced graphene oxide-based scaffolds in regenerative medicine. Int. J. Pharm. 2020, 580, 119–226. [Google Scholar] [CrossRef] [PubMed]
  46. Wang, K.; Ruan, J.; Song, H.; Zhang, J.; Wo, Y.; Guo, S.; Cui, D. Biocompatibility of graphene oxide. Nanoscale Res. Lett. 2011, 6, 1–8. [Google Scholar] [CrossRef] [Green Version]
  47. Ciriza, J.; Saenz Del Burgo, L.; Gurruchaga, H.; Borras, F.E.; Franquesa, M.; Orive, G.; Hernández, R.M.; Pedraz, J.L. Graphene oxide enhances alginate encapsulated cells viability and functionality while not affecting the foreign body response. Drug Deliv. 2018, 25, 1147–1160. [Google Scholar] [CrossRef] [Green Version]
  48. Saenz del Burgo, L.; Ciriza, J.; Acarregui, A.; Gurruchaga, H.; Blanco, F.J.; Orive, G.; Hernández, R.M.; Pedraz, J.L. Hybrid alginate–protein-coated graphene oxide microcapsules enhance the functionality of erythropoietin secreting C2C12 myoblasts. Mol. Pharm. 2017, 14, 885–898. [Google Scholar] [CrossRef]
  49. Simonin, J. On the comparison of pseudo-first order and pseudo-second order rate laws in the modeling of adsorption kinetics. Chem. Eng. J. 2016, 300, 254–263. [Google Scholar] [CrossRef] [Green Version]
  50. Fierro, V.; Torné-Fernández, V.; Montané, D.; Celzard, A. Adsorption of phenol onto activated carbons having different textural and surface properties. Microporous Mesoporous Mater. 2008, 111, 276–284. [Google Scholar] [CrossRef]
  51. Nuengmatcha, P.; Mahachai, R.; Chanthai, S. Adsorption capacity of the as-synthetic graphene oxide for the removal of alizarin red S dye from aqueous solution. Orient. J. Chem. 2016, 32, 1399–1410. [Google Scholar] [CrossRef] [Green Version]
  52. Ahmad, M.A.; Ahmad Puad, N.A.; Bello, O.S. Kinetic, equilibrium and thermodynamic studies of synthetic dye removal using pomegranate peel activated carbon prepared by microwave-induced KOH activation. Water Resour. Ind. 2014, 6, 18–35. [Google Scholar] [CrossRef] [Green Version]
  53. Hong, F.; Yue, B.; Hirao, N.; Liu, Z.; Chen, B. Significant improvement in Mn2O3 transition metal oxide electrical conductivity via high pressure. Sci. Rep. 2017, 7, 44078. [Google Scholar] [CrossRef] [PubMed] [Green Version]
  54. Hu, X.; Li, D.; Mu, L. Biotransformation of graphene oxide nanosheets in blood plasma affects their interactions with cells. Environ. Sci. Nano 2017, 4, 1569–1578. [Google Scholar] [CrossRef]
  55. Peng, B.; Chen, L.; Que, C.; Yang, K.; Deng, F.; Deng, X.; Shi, G.; Xu, G.; Wu, M. Adsorption of antibiotics on graphene and biochar in aqueous solutions induced by π-π interactions. Sci. Rep. 2016, 6, 31920. [Google Scholar] [CrossRef] [PubMed] [Green Version]
  56. Yuan, X.; Wei, Y.; Chen, S.; Wang, P.; Liu, L. Bio-based graphene/sodium alginate aerogels for strain sensor. RSC Adv. 2016, 6, 64056–64064. [Google Scholar] [CrossRef]
  57. Sarfert, F.T.; Etzel, M.R. Mass transfer limitations in protein separations using ion-exchange membranes. J. Chromatogr. A 1997, 764, 3–20. [Google Scholar] [CrossRef]
  58. Manzi, B.M.; Werner, M.; Ivanova, E.P.; Crawford, R.J.; Baulin, V.A. Simulations of protein adsorption on nanostructured surfaces. Sci. Rep. 2019, 9, 1–13. [Google Scholar] [CrossRef]
  59. Foo, K.Y.; Hameed, B.H. Insights into the modeling of adsorption isotherm systems. Chem. Eng. J. 2010, 156, 2–10. [Google Scholar] [CrossRef]
  60. Chen, P.; Li, H.; Song, S.; Weng, X.; He, D.; Zhao, Y. Adsorption of dodecylamine hydrochloride on graphene oxide in water. Results Phys. 2017, 7, 2281–2288. [Google Scholar] [CrossRef]
  61. Wu, F.; Tseng, R.; Juang, R. Initial behavior of intraparticle diffusion model used in the description of adsorption kinetics. Chem. Eng. J. 2009, 153, 1–8. [Google Scholar] [CrossRef]
  62. Vijayakumar, G.; Tamilarasan, R.; Dharmendirakumar, M. Adsorption, Kinetic, Equilibrium and Thermodynamic studies on the removal of basic dye Rhodamine-B from aqueous solution by the use of natural adsorbent perlite. J. Mater. Environ. Sci. 2012, 3, 157–170. [Google Scholar]
  63. Dreyer, D.R.; Park, S.; Bielawski, C.W.; Ruoff, R.S. The chemistry of graphene oxide. Chem. Soc. Rev. 2009, 39, 228–240. [Google Scholar] [CrossRef]
  64. Mohan Kumar, T.M.; Praveen, D. Impedance analysis of sodium alginate: Graphene oxide composite. In IOP Conference Series: Materials Science and Engineering; IOP Science: Bengaluru, India, 2018; Volume 310, p. 12150. [Google Scholar] [CrossRef]
  65. Kostarelos, K.; Vincent, M.; Hebert, C.; Garrido, J.A. Graphene in the design and engineering of next-generation neural interfaces. Adv. Mater. Weinheim. 2017, 29. [Google Scholar] [CrossRef]
  66. Reina, G.; González-Domínguez, J.M.; Criado, A.; Vázquez, E.; Bianco, A.; Prato, M. Promises, facts and challenges for graphene in biomedical applications. Chem. Soc. Rev. 2017, 46, 4400–4416. [Google Scholar] [CrossRef] [Green Version]
  67. Shin, S.R.; Li, Y.; Jang, H.L.; Khoshakhlagh, P.; Akbari, M.; Nasajpour, A.; Zhang, Y.S.; Tamayol, A.; Khademhosseini, A. Graphene-based materials for tissue engineering. Adv. Drug Deliv. Rev. 2016, 105, 255–274. [Google Scholar] [CrossRef] [Green Version]
  68. Qhatani, M.; Fadl-allah, S.; El-Shenawy, N. Electrochemical impedance spectroscopy study of the adsorption behavior of bovine serum albumin at biomimetic calcium–phosphate coating. Int. J. Electrochem. Sci. 2012, 7, 4510–4527. [Google Scholar]
  69. Ero-Tolliver, I.A.; Hudson, B.G.; Bhave, G. The ancient immunoglobulin domains of peroxidasin are required to form sulfilimine cross-links in collagen IV. J. Biol. Chem. 2015, 290, 21741–21748. [Google Scholar] [CrossRef] [Green Version]
  70. Bhave, G.; Cummings, C.F.; Vanacore, R.M.; Kumagai-Cresse, C.; Ero-Tolliver, I.A.; Rafi, M.; Kang, J.; Pedchenko, V.; Fessler, L.I.; Fessler, J.H.; et al. Peroxidasin forms sulfilimine chemical bonds using hypohalous acids in tissue genesis. Nat. Chem. Biol. 2012, 8, 784–790. [Google Scholar] [CrossRef] [Green Version]
  71. Zhou, H.; Xu, H.H.K. The fast release of stem cells from alginate-fibrin microbeads in injectable scaffolds for bone tissue engineering. Biomaterials 2011, 32, 7503–7513. [Google Scholar] [CrossRef] [Green Version]
  72. Hernández, R.M.A.; Orive, G.; Murua, A.; Pedraz, J.L. Microcapsules and microcarriers for in situ cell delivery. Adv. Drug Deliv. Rev. 2010, 62, 711–730. [Google Scholar] [CrossRef]
  73. Toyoda, T.; Arakawa, T.; Yamaguchi, H. N-Glycans stabilize human erythropoietin through hydrophobic interactions with the hydrophobic protein surface: Studies by surface plasmon resonance analysis. J. Biochem. 2002, 131, 511–515. [Google Scholar] [CrossRef]
Figure 1. Raman spectrum of GO, BSA (a), collagen (b) and elastin (c), and the combination of each protein with GO.
Pharmaceutics 12 00543 g001
Figure 2. FTIR spectrum for GO, GO-BSA, GO-collagen and GO-elastin matrix.
Pharmaceutics 12 00543 g002
Figure 3. Effect on the GO adsorption capacity (qe) of the initial concentration (C0) of BSA, collagen and elastin at 37 °C after 2 h of incubation.
Pharmaceutics 12 00543 g003
Figure 4. Kinetic study of protein adsorption and the GO adsorption capacity for BSA, collagen and elastin: (a) Representation of adsorption capacity (qt) over time. (b) Pseudo-second-order kinetic model.
Pharmaceutics 12 00543 g004
Figure 5. Intra-particle diffusion model plot.
Pharmaceutics 12 00543 g005
Figure 6. (a) Effect of temperature on adsorption capacity of BSA, collagen and elastin onto GO platelets surface. (b) van ’t Hoff plot: Kd: equilibrium constant; T: absolute temperature in K.
Pharmaceutics 12 00543 g006
Figure 7. Electrochemical study from protein coated-GO alginate hydrogels compared to alginate hydrogels. (a) Bode plots, (phase angle Z vs. frequency from 10−1 to 103 Hz. (b) Nyquist diagram, Zim vs. Zre (ohm).
Pharmaceutics 12 00543 g007
Figure 8. Voltammograms from protein-coated GO alginate and alginate hydrogels.
Pharmaceutics 12 00543 g008
Figure 9. Fluorescence microscopy images, after calcein/ethidium staining for C2C12–EPO myoblasts incorporated within the modified alginate hydrogels based on GO-BSA, GO-collagen and GO-elastin matrices. Green: live cells. Red: dead cells. Scale bar: 100 µm.
Pharmaceutics 12 00543 g009
Figure 10. Metabolic activity of hybrid alginate-GO embedded C2C12-EPO myoblasts over two weeks. Note: **: p < 0.01; ***: p < 0.001 compared with cells encapsulated in alginate without GO.
Pharmaceutics 12 00543 g010
Figure 11. EPO production and release from C2C12-EPO myoblasts embedded in different hybrid protein-GO-alginate hydrogels. Note:; ***: p < 0.001 compared with cells embedded in alginate without GO.
Pharmaceutics 12 00543 g011
Figure 12. Percentage of (a) EPO and (b) insulin adsorbed by GO without coating, and BSA-, collagen- and elastin-coating. Incubation conditions: GO final concentration, 50 µg/mL; temperature, 37 °C; incubation time, 24 h. Note: p < 0.01; **: p < 0.001; *** compared with non-coated GO. ###: p < 0.001 compared to BSA coated-GO.
Pharmaceutics 12 00543 g012
Table 1. Raman spectroscopy data from the GO and protein-coated GO nanoparticles (proteins = BSA, collagen or elastin).
Wavenumbers (cm−1) at 532 nm Excitation WavelengthGOGO + Protein
(I)12451230–1250
(D)13541352–1354
(G1)15691530–1570
(G2)16031595–1605
Band Intensity RatioGOGO + Protein
I/D0.250.45–0.48
D/(G1 + G2)1.31.1–1.5
(D + I)/(G1 + G2)1.71.6–2.2
Table 2. Parameters calculated from experimental data for Langmuir and Freundlich models. Notes: qe: amount of protein adsorbed per GO weight at equilibrium; qmax: maximum amount of protein adsorbed per GO weight; KL: Langmuir constant; RL: separation factor; n: adsorption intensity; KF: Freundlich constant.
Langmuir ModelFreundlich Model
qe (µg/µg)qmax (µg/µg)KL (mL/µg)RLR21/nNKFR2
BSA0.3320.3300.0570.0090.990.05022.0300.2250.750
Elastin0.2620.3800.0020.2490.970.3802.6000.0140.950
Collagen0.1220.0710.0230.0440.970.2004.7800.0190.700
Table 3. Parameters calculated from the pseudo-second-order kinetic model.
qe (µg/µg)K2(µg/µg.min)R2qt (µg/µg)
BSA0.3367.2200.9900.332
Collagen0.36212.8600.9900.123
Elastin0.1254.1580.9900.352
Table 4. Parameters calculated from intra-particle diffusion model. Note: Kp, intra-particle diffusion rate constant; C, the thickness of the boundary layer.
Kp (µg/µg.min1/2)CR2
BSA0.000140.1630.91
Collagen1.15 × 10−50.0600.37
Elastin0.000780.1610.70
Table 5. Thermodynamic parameters. Enthalpy change: ΔH°; Entropy change: ΔS°; Gibbs free energy change: ΔG° at 300 K.
ΔH° (kJ/mol)ΔS° (kJ/mol.K)ΔG° (kJ/mol)R2
BSA2.598−0.05788720.5430.981
Elastin16.270−0.00888119.0310.779
Collagen17.363−0.00693519.5130.935

