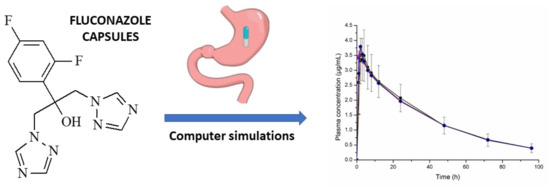
In Silico Prediction of Plasma Concentrations of Fluconazole Capsules with Different Dissolution Profiles and Bioequivalence Study Using Population Simulation


Abstract
:
1. Introduction
2. Methods
2.1. Plasma Concentration Simulations
2.2. Population Simulations
3. Results and Discussion
4. Conclusions
Author Contributions
Funding
Acknowledgments
Conflicts of Interest
References
- Silva, M.F.; Schramm, S.G.; Kano, E.K.; Koono, E.D.M.; Porta, V.; Serra, C.H.R. Bioequivalence evaluation of single doses of two tramadol formulations: A randomized, open-label, two-period crossover study in healthy Brazilian volunteers. Clin. Ther. 2010, 32, 758–765. [Google Scholar] [CrossRef]
- Kano, E.K.; Koono, E.E.M.; Schramm, S.G.; Serra, C.H.R.; Junior, E.A.; Pereira, R.; Freitas, M.S.T.; Iecco, M.C.; Porta, V. Average bioequivalence of single 500 mg doses of two oral formulations of levofloxacin: A randomized, open-label, two-period crossover study in healthy adult Brazilian volunteers. Braz. J. Pharm. Sci. 2015, 51, 203–211. [Google Scholar] [CrossRef]
- FDA. Food and Drug Administration. Guidance for Industry: Bioavailability and Bioequivalence Studies Submitted in NDAs or INDs—General Considerations. Draft Guidance. U.S. Department of Health and Human Services, Center for Drug Evaluation and Research (CDER). 2014. Available online: https://www.fda.gov/downloads/Drugs/GuidanceComplianceRegulatoryInformation/Guidances/UCM389370.pdf (accessed on 7 June 2018).
- FDA. Food and Drug Administration. Guidance for Industry: Waiver on In Vivo Bioavailability and Bioequivalence Studies for Immediate-Release Solid Oral Dosage Forms Based on a Biopharmaceutics Classification System. U.S. Department of Health and Human Services, Center for Drug Evaluation and Research (CDER). 2017. Available online: https://www.fda.gov/downloads/Drugs/GuidanceComplianceRegulatoryInformation/Guidances/UCM070246.pdf (accessed on 7 June 2018).
- Modi, N.B. In vitro-in vivo correlation. In Pharmaceutical Product Development: In Vitro-In Vivo Correlation, 1st ed.; Chilukuri, D.M., Sunkara, G., Young, D., Eds.; Informa Healthcare: New York, NY, USA, 2007; Volume 1, pp. 107–112. [Google Scholar]
- BRASIL. Brazilian Health Surveillance Agency (ANVISA). Resolução da Diretoria Colegiada RDC nº 37 de 03 de agosto de 2011. Dispõe sobre o guia para isenção e substituição de estudos de biodisponibilidade relativa/bioequivalência e dá outras providências. CFAR/GTFAR/CGMED/ANVISA. 2011. Available online: http://portal.anvisa.gov.br/documents/33880/2568070/rdc0037_03_08_2011.pdf/13c41657-e93b-4d09-99eb-377f760f3aa0 (accessed on 7 June 2018).
- BRASIL. Brazilian Health Surveillance Agency (ANVISA). Instrução Normativa IN nº 04 de 03 de agosto de 2011. Dispõe sobre a lista de fármacos candidatos à biosenção baseada no sistema de classificação biofarmacêutica (SCB) e dá outras providências. CFAR/GTFAR/CGMED/ANVISA. 2011. Available online: http://bvsms.saude.gov.br/bvs/saudelegis/anvisa/2011/int0004_03_08_2011.html (accessed on 7 June 2018).
- BRASIL. Brazilian Health Surveillance Agency (ANVISA). Instrução Normativa IN nº 07 de 21 de agosto de 2014. Determina a publicação da lista de fármacos candidatos à biosenção baseada no sistema de classificação biofarmacêutica (SCB) e dá outras providências. CFAR/GTFAR/CGMED/ANVISA. 2014. Available online: http://portal.anvisa.gov.br/documents/33836/349509/IN%2B07%2B2014.pdf/0996340b-24e5-4855-8bfd-0756765e422e?version=1.0 (accessed on 7 June 2018).
- BRASIL. Brazilian Health Surveillance Agency (ANVISA). Resolução da Diretoria Colegiada RDC nº 31 de 11 de agosto de 2010. Dispõe sobre a realização dos estudos de equivalência farmacêutica e de perfil de dissolução comparativo. CFAR/GTFAR/CGMED/ANVISA. 2010. Available online: http://portal.anvisa.gov.br/documents/33880/2568070/res0031_11_08_2010.pdf/5e157d15-d3d5-4bb9-98db-5667e4d9e0c8 (accessed on 7 June 2018).
- Sweetman, S.C. Martindale: The Complete Drug Reference, 36th ed.; Pharmaceutical Press: London, UK, 2009; pp. 532–534. [Google Scholar]
- Charoo, N.; Cristofoletti, R.; Graham, A.; Lartey, P.; Abrahamsson, B.; Groot, D.W.; Kopp, S.; Langguth, P.; Polli, J.; Shah, V.P.; et al. Biowaiver monograph for immediate-release solid oral dosage forms: Fluconazole. J. Pharm. Sci. 2014, 103, 3843–3858. [Google Scholar] [CrossRef] [PubMed]
- Charoo, N.A.; Cristofoletti, R.; Dressman, J.B. Risk assessment for extending the Biopharmaceutics Classification System-based biowaiver of immediate release dosage forms of fluconazole in adults to the paediatric population. J. Pharm. Pharmacol. 2015, 67, 1156–1169. [Google Scholar] [CrossRef] [PubMed]
- Okumo, A.; Dimaso, M.; Löbenberg, R. Dynamic dissolution testing to establish in vitro/in vivo correlations for montelukast sodium, a poorly soluble drug. Pharmaceut. Res. 2008, 12, 2778–2785. [Google Scholar] [CrossRef] [PubMed]
- Okumo, A.; Dimaso, M.; Löbenberg, R. Computer simulations using GastroPlus™ to justify a biowaiver for etoricoxib solid oral drug products. Eur. J. Pharm. Biopharm. 2009, 72, 91–98. [Google Scholar] [CrossRef] [PubMed]
- Wei, H.; Dalton, C.; Dimaso, M.; Kanfer, I.; Löbenberg, R. Physicochemical characterization of file glyburide powders: A BCS based approach to predict oral absorption. Eur. J. Pharm. Biopharm. 2008, 69, 1046–1056. [Google Scholar] [CrossRef] [PubMed]
- Honório, T.S.; Pinto, E.C.; Rocha, H.V.A.; Esteves, V.S.D.; Santos, T.C.; Castro, H.C.R.; Rodrigues, C.R.; Sousa, V.P.; Cabral, L. In vitro-in vivo correlation of efavirenz tablets using GastroPlus®. AAPS PharmSciTech 2013, 14, 1244–1254. [Google Scholar] [CrossRef]
- Kostewicz, E.S.; Aarons, L.; Bergstrand, M.; Bolger, M.B.; Galetin, A.; Hatley, O.; Jamei, M.; Lloyd, R.; Pepin, X.; Rostami-Hodjegan, A.; et al. PBPK models for the prediction of in vivo performance of oral dosage forms. Eur. J. Pharm. Sci. 2014, 57, 300–321. [Google Scholar] [CrossRef] [PubMed]
- Almukainzi, M.; Jamali, F.; Aghazadeh-Habashi, A.; Löbenberg, R. Disease specific modeling: Simulation of the pharmacokinetics of meloxicam and ibuprofen in disease state vs. healthy conditions. Eur. J. Pharm. Biopharm. 2016, 100, 77–84. [Google Scholar] [CrossRef]
- Kesisoglou, F.; Ghung, J.; Van Asperen, J.; Heimbach, T. Physiologically based absorption modeling to impact biopharmaceutics and formulation strategies in drug development- industry case studies. J. Pharm. Sci. 2016, 105, 2723–2734. [Google Scholar] [CrossRef]
- Almukainzi, M.; Gabr, R.; Abdelhamid, G.; Löbenberg, R. Mechanistic understanding of the effect of renal impairment on metformin oral absorption using computer simulations. J. Pharm. Investig. 2017, 47, 151–161. [Google Scholar] [CrossRef]
- Silva, D.A.; Duque, M.D.; Davies, N.M.; Löbenberg, R.; Ferraz, H.G. Application of in silico tools in clinical practice using ketoconazole as model drug. J. Pharm. Pharm. Sci. 2018, 21, 242s–253s. [Google Scholar] [CrossRef]
- Tubic-Grozdanis, M.; Bolger, M.G.; Langguth, P. Application of gastrointestinal simulation for extensions for biowaivers of highly permeable compounds. AAPS J. 2008, 10, 213–226. [Google Scholar] [CrossRef] [PubMed]
- Kovačević, I.; Parojčić, J.; Homšek, I.; Tubić-Grozdanis, M.; Langguth, P. Justification of biowaiver for carbamazepine, a low soluble high permeable compound, in solid dosage forms based on IVIVC and gastrointestinal simulation. Mol. Pharm. 2009, 6, 40–47. [Google Scholar] [CrossRef]
- Tsume, Y.; Amidon, G.L. The biowaiver extension for BCS class III drugs: The effect of dissolution rate on the bioequivalence of BCS class III immediate-release drugs predicted by computer simulation. Mol. Pharm. 2010, 7, 1235–1243. [Google Scholar] [CrossRef] [PubMed]
- Kortejärvi, H.; Shawahna, R.; Koski, A.; Malkki, J.; Ojala, K.; Yliperttula, M. Very rapid dissolution is not needed to guarantee bioequivalence for biopharmaceutics classification system (BCS) I drugs. J. Pharm. Sci. 2010, 99, 621–625. [Google Scholar] [CrossRef] [PubMed]
- Chen, Z.-F.; Ying, G.-G.; Jiang, Y.-X.; Yang, B.; Lai, H.-J.; Liu, Y.-S.; Pan, C.-G.; Peng, F.-Q. Photodegradation of the azole fungicide fluconazole in aqueous solution under UV-254: Kinetics, mechanistic investigations and toxicity evaluation. Water Res. 2014, 52, 83–91. [Google Scholar] [CrossRef] [PubMed] [Green Version]
- Corrêa, J.C.R.; Vianna-Soares, C.D.; Salgado, H.R.N. Development and validation of dissolution test for fluconazole capsules by HPLC and derivative UV spectrophotometry. Chromatogr. Res. Int. 2012, 610427, 1–8. [Google Scholar] [CrossRef]
- Porta, V.; Chang, K.H.; Storpirtis, S. Evaluation of the bioequivalence of capsules containing 150 mg of fluconazole. Int. J. Pharm. 2005, 288, 81–86. [Google Scholar] [CrossRef] [PubMed]
- Porta, V.; Yamamichi, E.; Storpirtis, S. Avaliação biofarmacêutica in vitro de cápsulas de fluconazol. Braz. J. Pharm. Sci. 2002, 38, 333–343. [Google Scholar] [CrossRef]
- Rohatgi, A. WebPlotDigitizer: Web Based Tool to Extract Data from Plot, Images, and Maps. Version 4.1. January 2018. Available online: https://automeris.io/WebPlotDigitizer/citation.html (accessed on 17 March 2019).
- Simulations Plus. GastroPlus™ Version 9.0 Manual; Simulations Plus: Lancaster, CA, USA, 2015. [Google Scholar]
- FDA. Food and Drug Administration. Guidance for Industry: Statistical Approaches to Establishing Bioequivalence. U.S. Department of Health and Human Services, Center for Drug Evaluation and Research (CDER). 2001. Available online: https://www.fda.gov/downloads/Drugs/GuidanceComplianceRegulatoryInformation/Guidances/UCM070244.pdf (accessed on 7 June 2018).
- BRASIL. AGÊNCIA NACIONAL DE VIGILÂNCIA SANITÁRIA (ANVISA). Resolução RE nº 1.170 de 19 de abril de 2006. Guia para provas de biodisponibilidade relativa/bioequivalência de medicamentos. CFAR/GTFAR/CGMED/ANVISA. 2006. Available online: http://portal.anvisa.gov.br/documents/10181/2718376/%281%29RE_1170_2006_COMP.pdf/52326927-c379-45b4-9a7e-9c5ecabaa16b (accessed on 7 June 2018).
- Debruyne, D. Clinical pharmacokinetics of fluconazole in superficial and systemic mycoses. Clin. Pharmacokinet. 1997, 33, 52–77. [Google Scholar] [CrossRef]
- Charoo, N.A.; Cristofoletti, R.; Kim, S.K. Integrating biopharmaceutics risk assessment and in vivo absorption model in formulation development of BCS class I drug using the QbD approach. Drug Dev. Ind. Pharm. 2017, 43, 668–677. [Google Scholar] [CrossRef]
- Alkhamis, K.A.; Obaidat, A.A.; Nuseirat, A.F. Solid-state characterization of fluconazole. Pharm. Dev. Technol. 2002, 7, 491–503. [Google Scholar] [CrossRef]
- Park, H.J.; Kim, M.S.; Kim, J.S.; Cho, W.; Park, J.; Cha, K.H.; Kang, Y.S.; Hwang, S.J. Solid-state carbon NMR characterization and investigation of intrinsic dissolution behavior of fluconazole polymorphs, anhydrate forms I and II. Chem. Pharm. Bull. 2010, 58, 1243–1247. [Google Scholar] [CrossRef] [PubMed]
- Modha, N.B.; Chotai, N.P.; Patel, V.A.; Patel, B.G. Preparation, characterization and evaluation of fluconazole polymorphs. Int. J. Res. Pharm. Biomed. Sci. 2010, 1, 124–127. [Google Scholar]
- Desai, S.R.; Dharwadkar, S.R. Study of process induced polymorphic transformations in fluconazole drug. Acta Pol. Pharm. Drug Res. 2009, 66, 115–122. [Google Scholar]
- Obaidat, R.M.; Alkhamis, K.A.; Salem, M.S. Determination of factors affecting kinetics of solid-state transformation of fluconazole polymorph II to polymorph I using diffuse reflectance Fourier transform spectroscopy. Drug Dev. Ind. Pharm. 2010, 36, 570–580. [Google Scholar] [CrossRef] [PubMed]
- Al-Tabakha, M.M.; Fahelelbom, K.M.S.; Obaid, D.E.E.; Sayed, S. Quality attributes and in vitro bioequivalence of different brands of amoxicillin trihydrate tablets. Pharmaceutics 2017, 9, 18. [Google Scholar] [CrossRef]
- EMEA. European Medicines Agency. Committee for Medical Products for Human Use (CHMP). Guideline on the Investigation of Bioequivalence. 2010. Available online: https://www.ema.europa.eu/en/documents/scientific-guideline/guideline-investigation-bioequivalence-rev1_en.pdf (accessed on 22 March 2019).


| Parameter | Value | Reference/Data Source |
|---|---|---|
| Solubility (mg/mL) | 8.03 at pH 0.8; | [11,12] |
| 6.91 at pH 4.5; | ||
| 7.82 at pH 6.8; | ||
| 6.90 at pH 7.4 | ||
| pKa | 2.56; 2.94; 11.01 | [26,27] |
| Log P | 0.82 | ADMET Predictor™ |
| Dose (mg) | 150 | [28,29] |
| Effective permeability, Peff (cm/s × 10−4) | 4.06 | ADMET Predictor™ |
| Blood/plasma ratio | 1.1 | ADMET Predictor™ |
| Unbound plasma (%) | 27.41 | ADMET Predictor™ |
| Physiology | Human, fasting conditions | [28] |
| Body weight (kg) | 61 | [28] |
| Compartmental Models | T1/2 (h) | R2 | AIC |
|---|---|---|---|
| One-compartmental | 29.55 | 0.9936 | −80.27 |
| Two-compartmental | 30.25 | 0.9977 | −87.53 |
| Three-compartmental | 1523.50 | 0.9976 | −83.84 |
| Parameter | Value |
|---|---|
| Clearance, CL (L/h) | 0.99565 |
| Central compartment volume, Vc (L) | 30.66 |
| Elimination half-life, T1/2 (h) | 30.25 |
| Distribution rate constant from C1 to C2, K12 (h−1) | 0.16515 |
| Distribution rate constant from C2 to C1, K21 (h−1) | 0.41884 |
| Distribution volume of second compartment, V2 (L/kg) | 0.19817 |
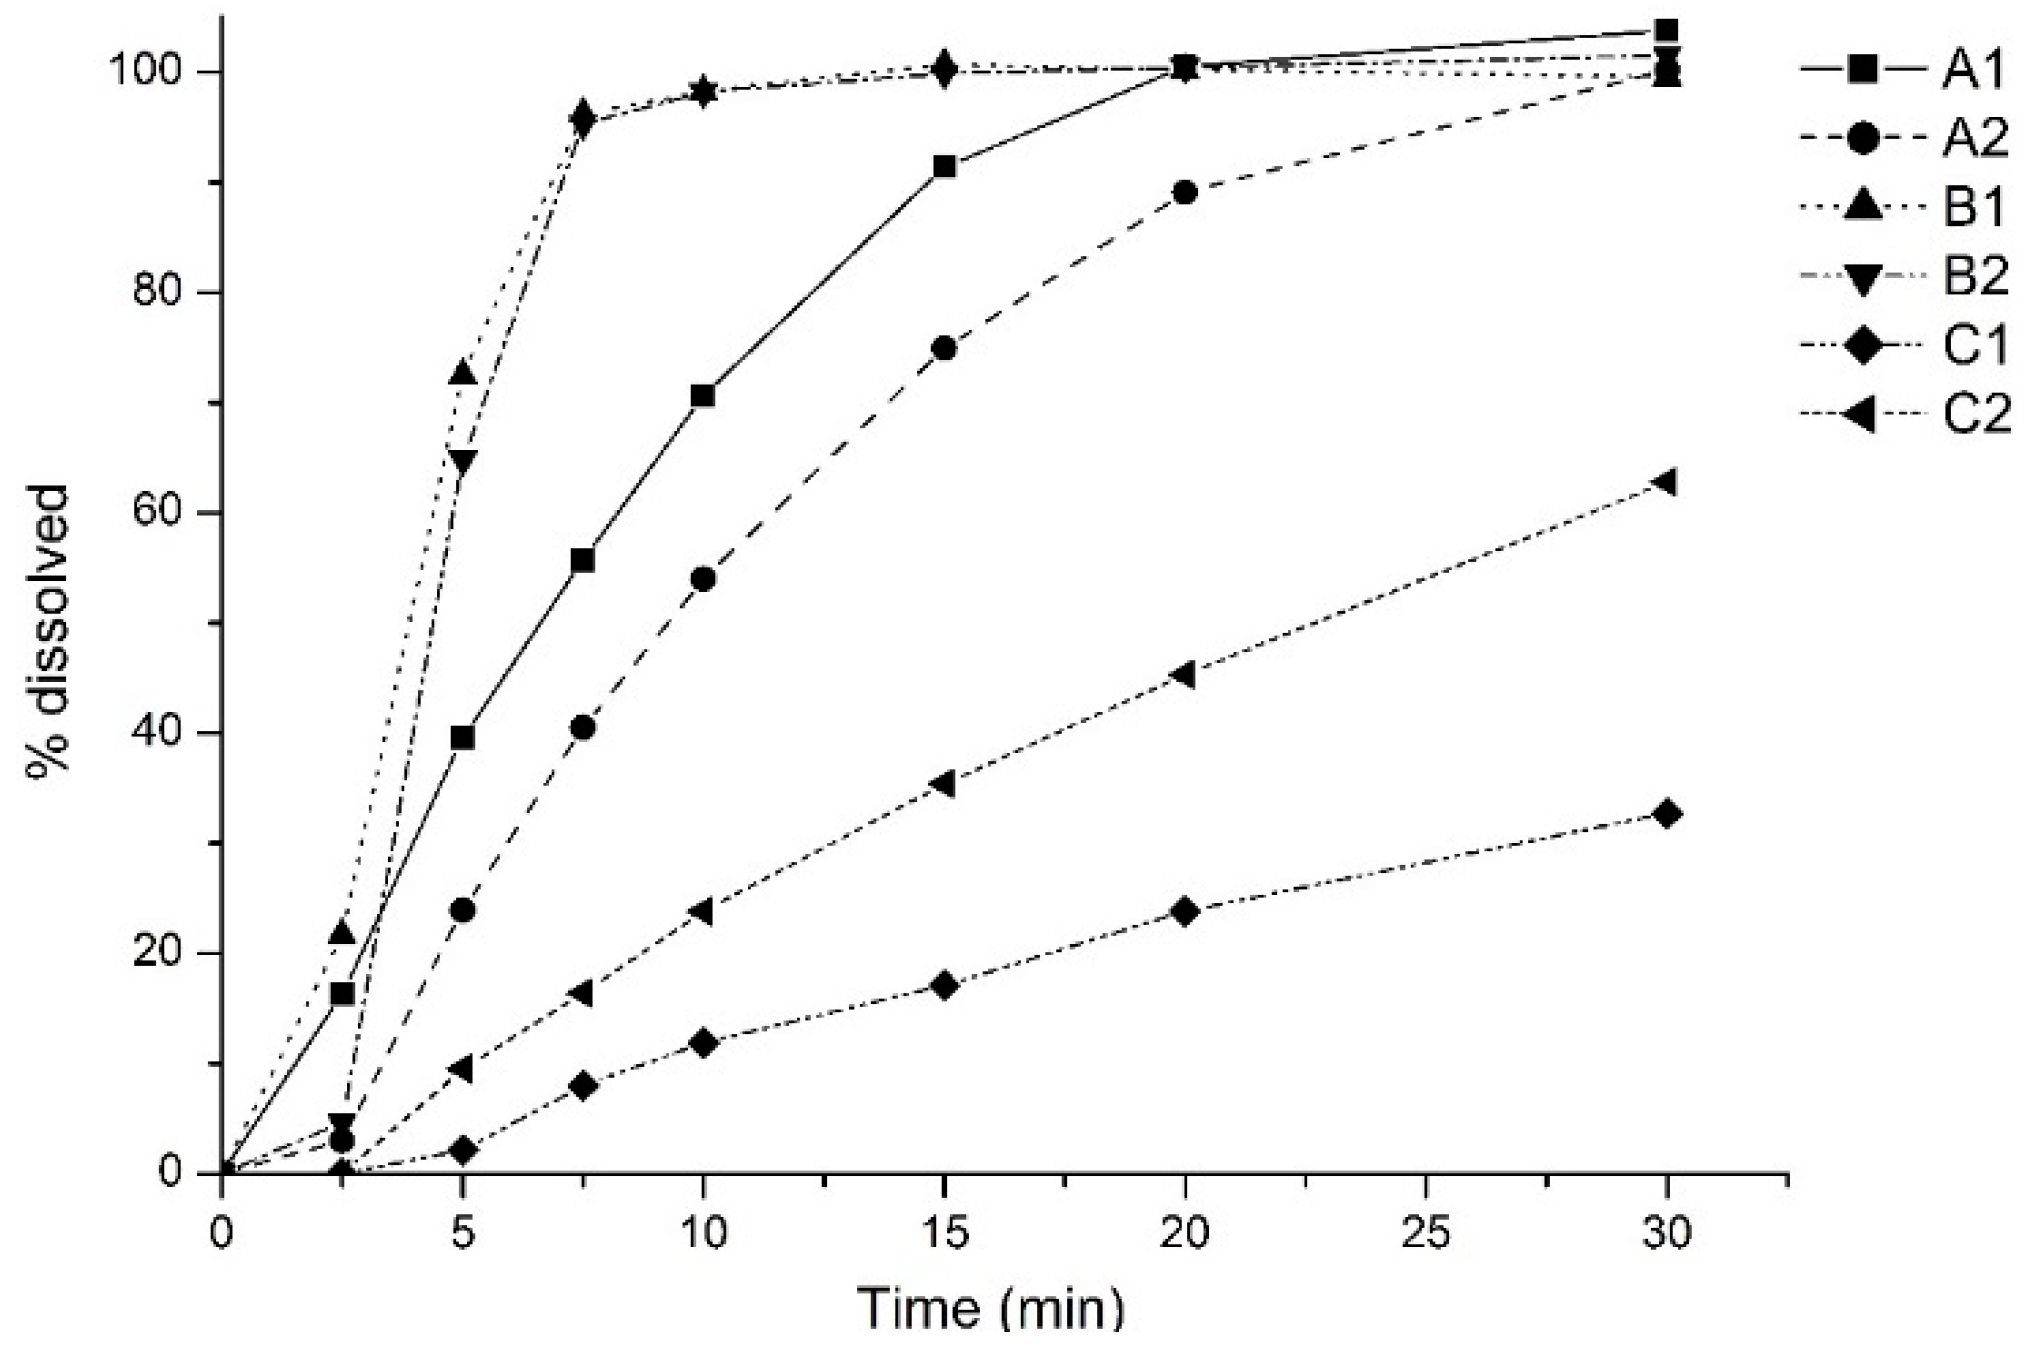
| Product | R2 | SSE | RMSE | MAE |
|---|---|---|---|---|
| A1 | 0.987 | 1.482 × 10⁻¹ | 1.161 × 10⁻¹ | 7.561 × 10⁻² |
| A2 | 0.936 | 9.806 × 10⁻¹ | 2.986 × 10⁻¹ | 1.833 × 10⁻¹ |
| B1 | 0.929 | 1.097 | 3.158 × 10⁻¹ | 1.898 × 10⁻¹ |
| B2 | 0.929 | 1.094 | 3.154 × 10⁻¹ | 1.897 × 10⁻¹ |
| C1 | 0.832 | 2.382 | 4.653 × 10⁻¹ | 2.402 × 10⁻¹ |
| C2 | 0.969 | 4.301 × 10⁻¹ | 1.977 × 10⁻¹ | 1.366 × 10⁻¹ |
| Products | F% | Tmax (h) | Cmax (µg/mL) | AUC0–t (µg h/mL) | ||
|---|---|---|---|---|---|---|
| Obs | Pred | Obs | Pred | |||
| Ref | 90.0 | 4.00 | 3.49 | -- | 135.77 | -- |
| A1 | 99.6 | 2.30 | -- | 3.26 | -- | 133.24 |
| A2 | 99.6 | 1.66 | -- | 3.82 | -- | 132.48 |
| B1 | 99.6 | 1.60 | -- | 3.82 | -- | 132.51 |
| B2 | 99.6 | 1.60 | -- | 3.82 | -- | 132.51 |
| C1 | 99.4 | 3.20 | -- | 3.16 | -- | 132.66 |
| C2 | 99.6 | 1.80 | -- | 3.81 | -- | 132.37 |
| PK Parameter | Ref | A1 | A2 | B1 | B2 | C1 | C2 |
|---|---|---|---|---|---|---|---|
| F% | 90 | 99.62 (99.58–99.66) | 99.53 (99.44–99.63) | 99.55 (99.48–99.63) | 99.58 (99.54–99.62) | 99.25 (99.11–99.38) | 99.64 (99.60–99.68) |
| Cmax (µg/mL) | 3.49 | 3.22 (3.06–3.40) | 3.79 (3.61–3.98) | 3.88 (3.71–4.07) | 3.80 (3.65–3.96) | 3.16 (3.02–3.31) | 3.73 (3.58–3.89) |
| Tmax (h) | 4 | 2.24 (2.14–2.35) | 1.66 (1.59–1.74) | 1.60 (1.53–1.68) | 1.60 (1.55–1.65) | 3.36 (3.20–3.53) | 1.77 (1.73–1.82) |
| AUC0–inf (µg h/mL) | 153.56 | 135.06 (126.60–144.10) | 146.81 (135.90–158.60) | 156.58 (146.50–167.30) | 157.02 (148.30–166.30) | 141.3 (129.3–154.4) | 150.58 (142.10–159.60) |
| AUC0–t (µg h/mL) | 135.77 | 121.59 (115.70–127.80) | 128.43 (121.50–135.70) | 135.81 (129.30–142.60) | 135.81 (129.30–142.70) | 125.48 (117.20–134.40) | 130.6 (124.90–136.60) |
| Average AUC0–t/AUC0–inf | 0.88 | 0.90 | 0.87 | 0.87 | 0.86 | 0.88 | 0.87 |
© 2019 by the authors. Licensee MDPI, Basel, Switzerland. This article is an open access article distributed under the terms and conditions of the Creative Commons Attribution (CC BY) license (http://creativecommons.org/licenses/by/4.0/).
Share and Cite
Duque, M.D.; Silva, D.A.; Issa, M.G.; Porta, V.; Löbenberg, R.; Ferraz, H.G. In Silico Prediction of Plasma Concentrations of Fluconazole Capsules with Different Dissolution Profiles and Bioequivalence Study Using Population Simulation. Pharmaceutics 2019, 11, 215. https://doi.org/10.3390/pharmaceutics11050215
Duque MD, Silva DA, Issa MG, Porta V, Löbenberg R, Ferraz HG. In Silico Prediction of Plasma Concentrations of Fluconazole Capsules with Different Dissolution Profiles and Bioequivalence Study Using Population Simulation. Pharmaceutics. 2019; 11(5):215. https://doi.org/10.3390/pharmaceutics11050215
Chicago/Turabian StyleDuque, Marcelo Dutra, Daniela Amaral Silva, Michele Georges Issa, Valentina Porta, Raimar Löbenberg, and Humberto Gomes Ferraz. 2019. "In Silico Prediction of Plasma Concentrations of Fluconazole Capsules with Different Dissolution Profiles and Bioequivalence Study Using Population Simulation" Pharmaceutics 11, no. 5: 215. https://doi.org/10.3390/pharmaceutics11050215