
Marine Sponge Aaptos suberitoides Extract Improves Antiproliferation and Apoptosis of Breast Cancer Cells without Cytotoxicity to Normal Cells In Vitro

 , , ,
, , ,  and
and 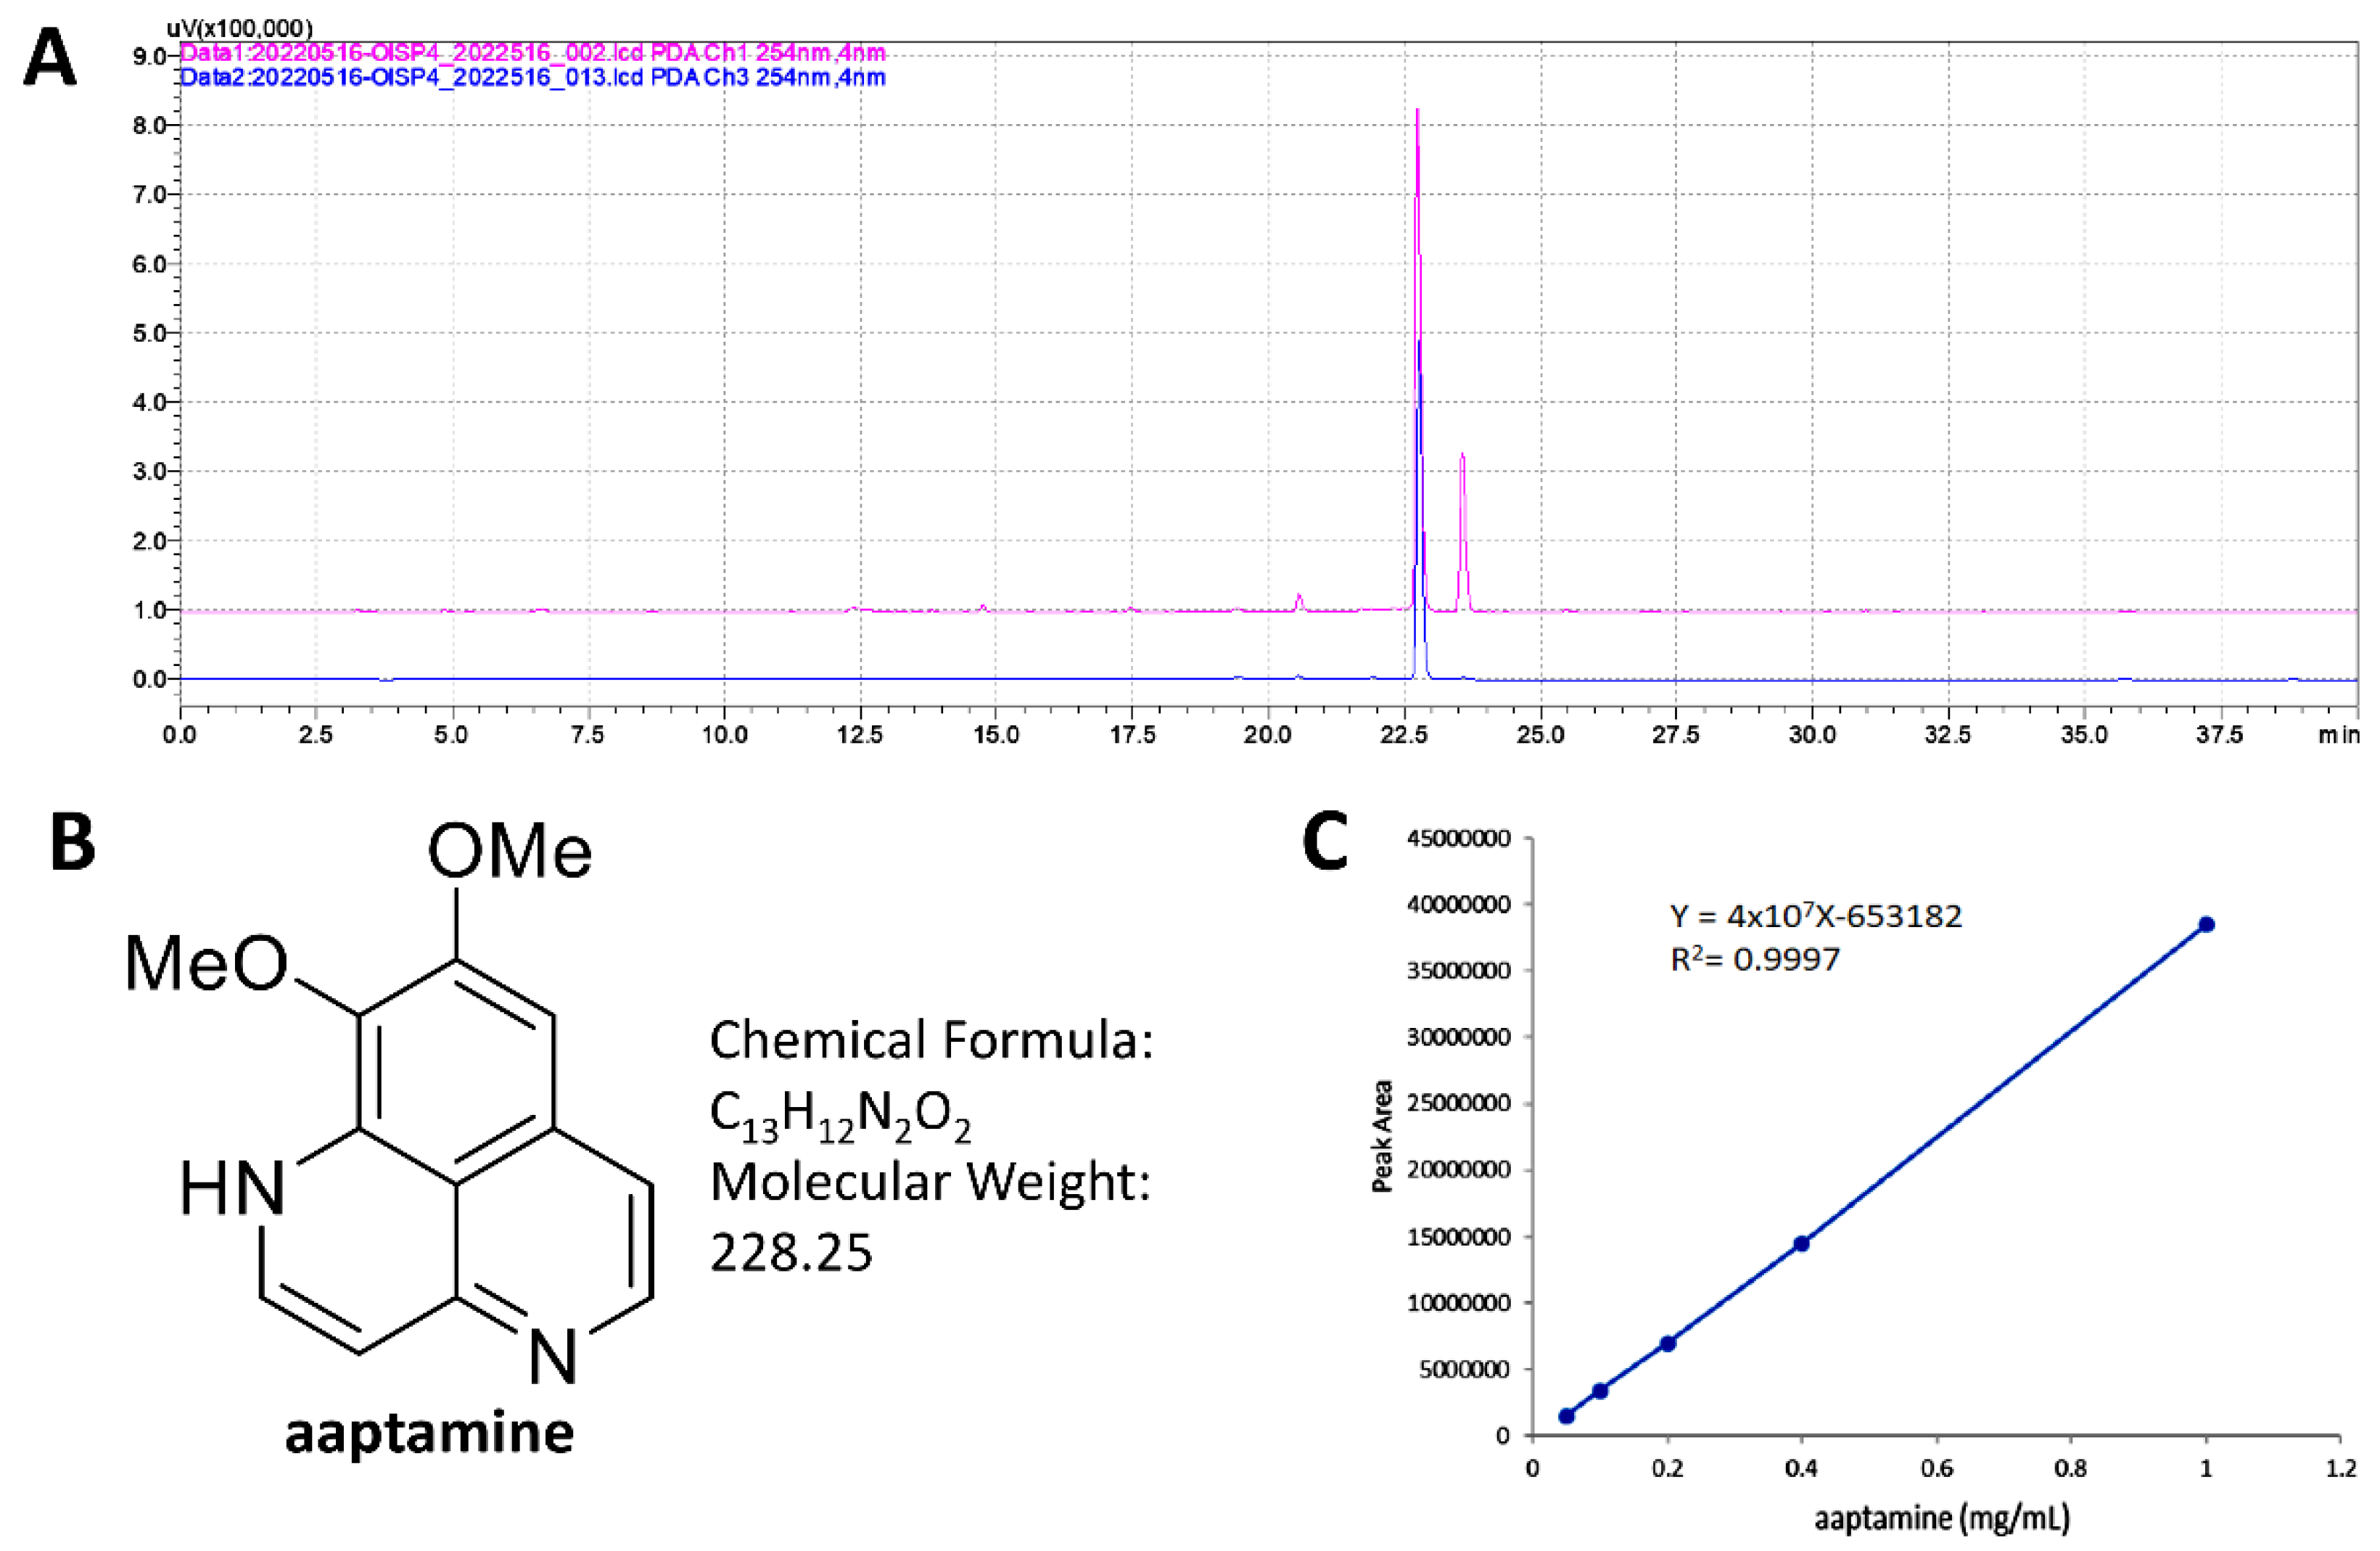
Abstract
:1. Introduction
2. Results
2.1. HPLC Analysis of MEAS and Aaptamine
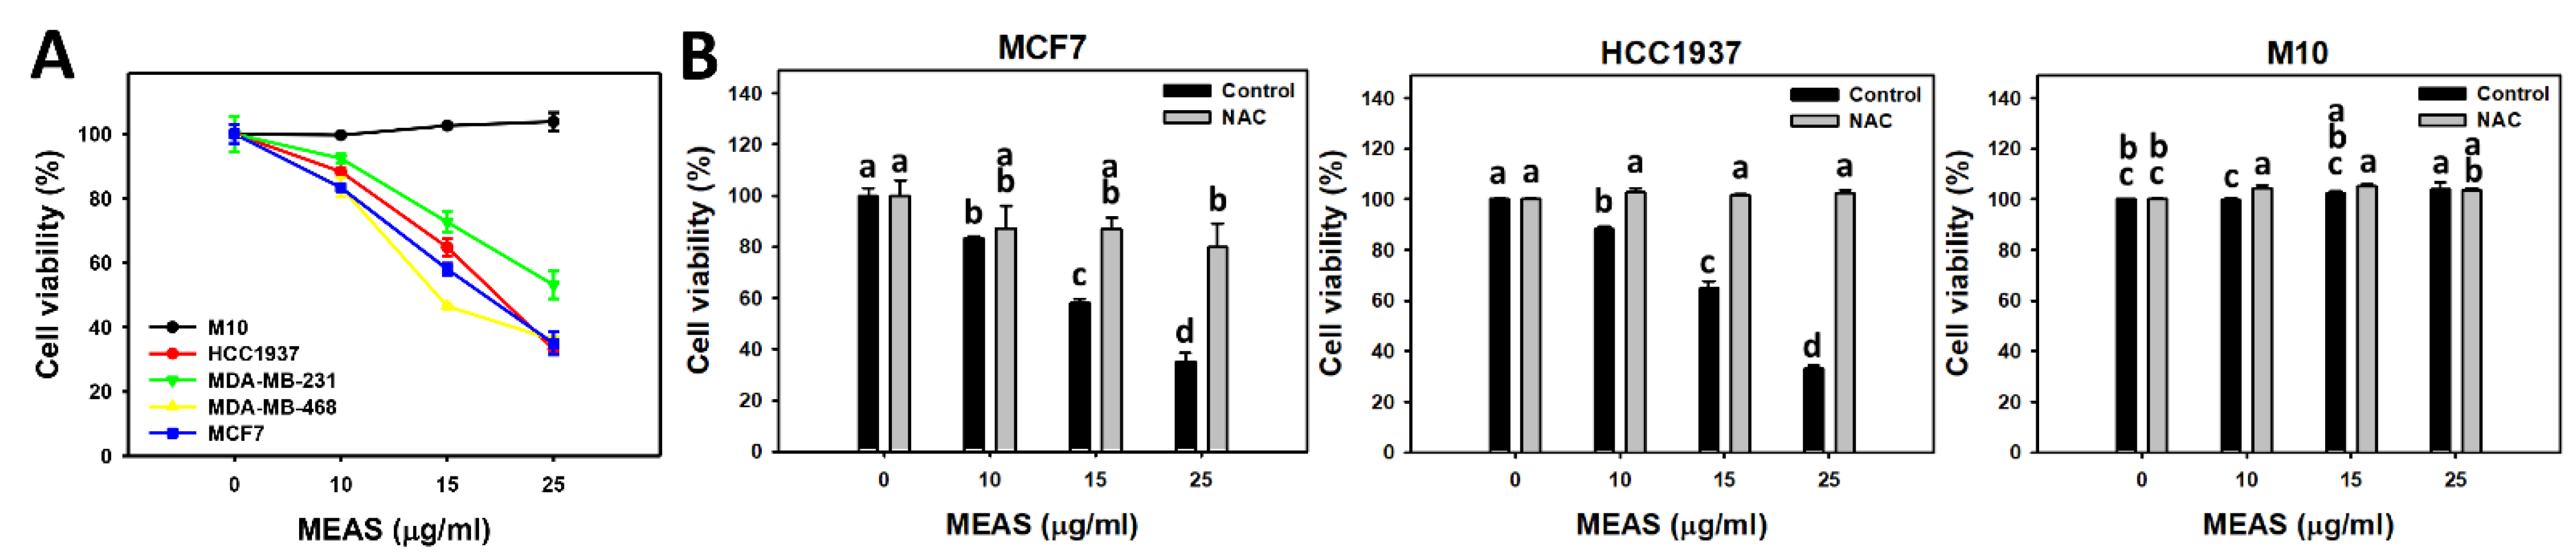
2.2. Antiproliferation of MEAS-Treated Breast Cancer and Normal Cells
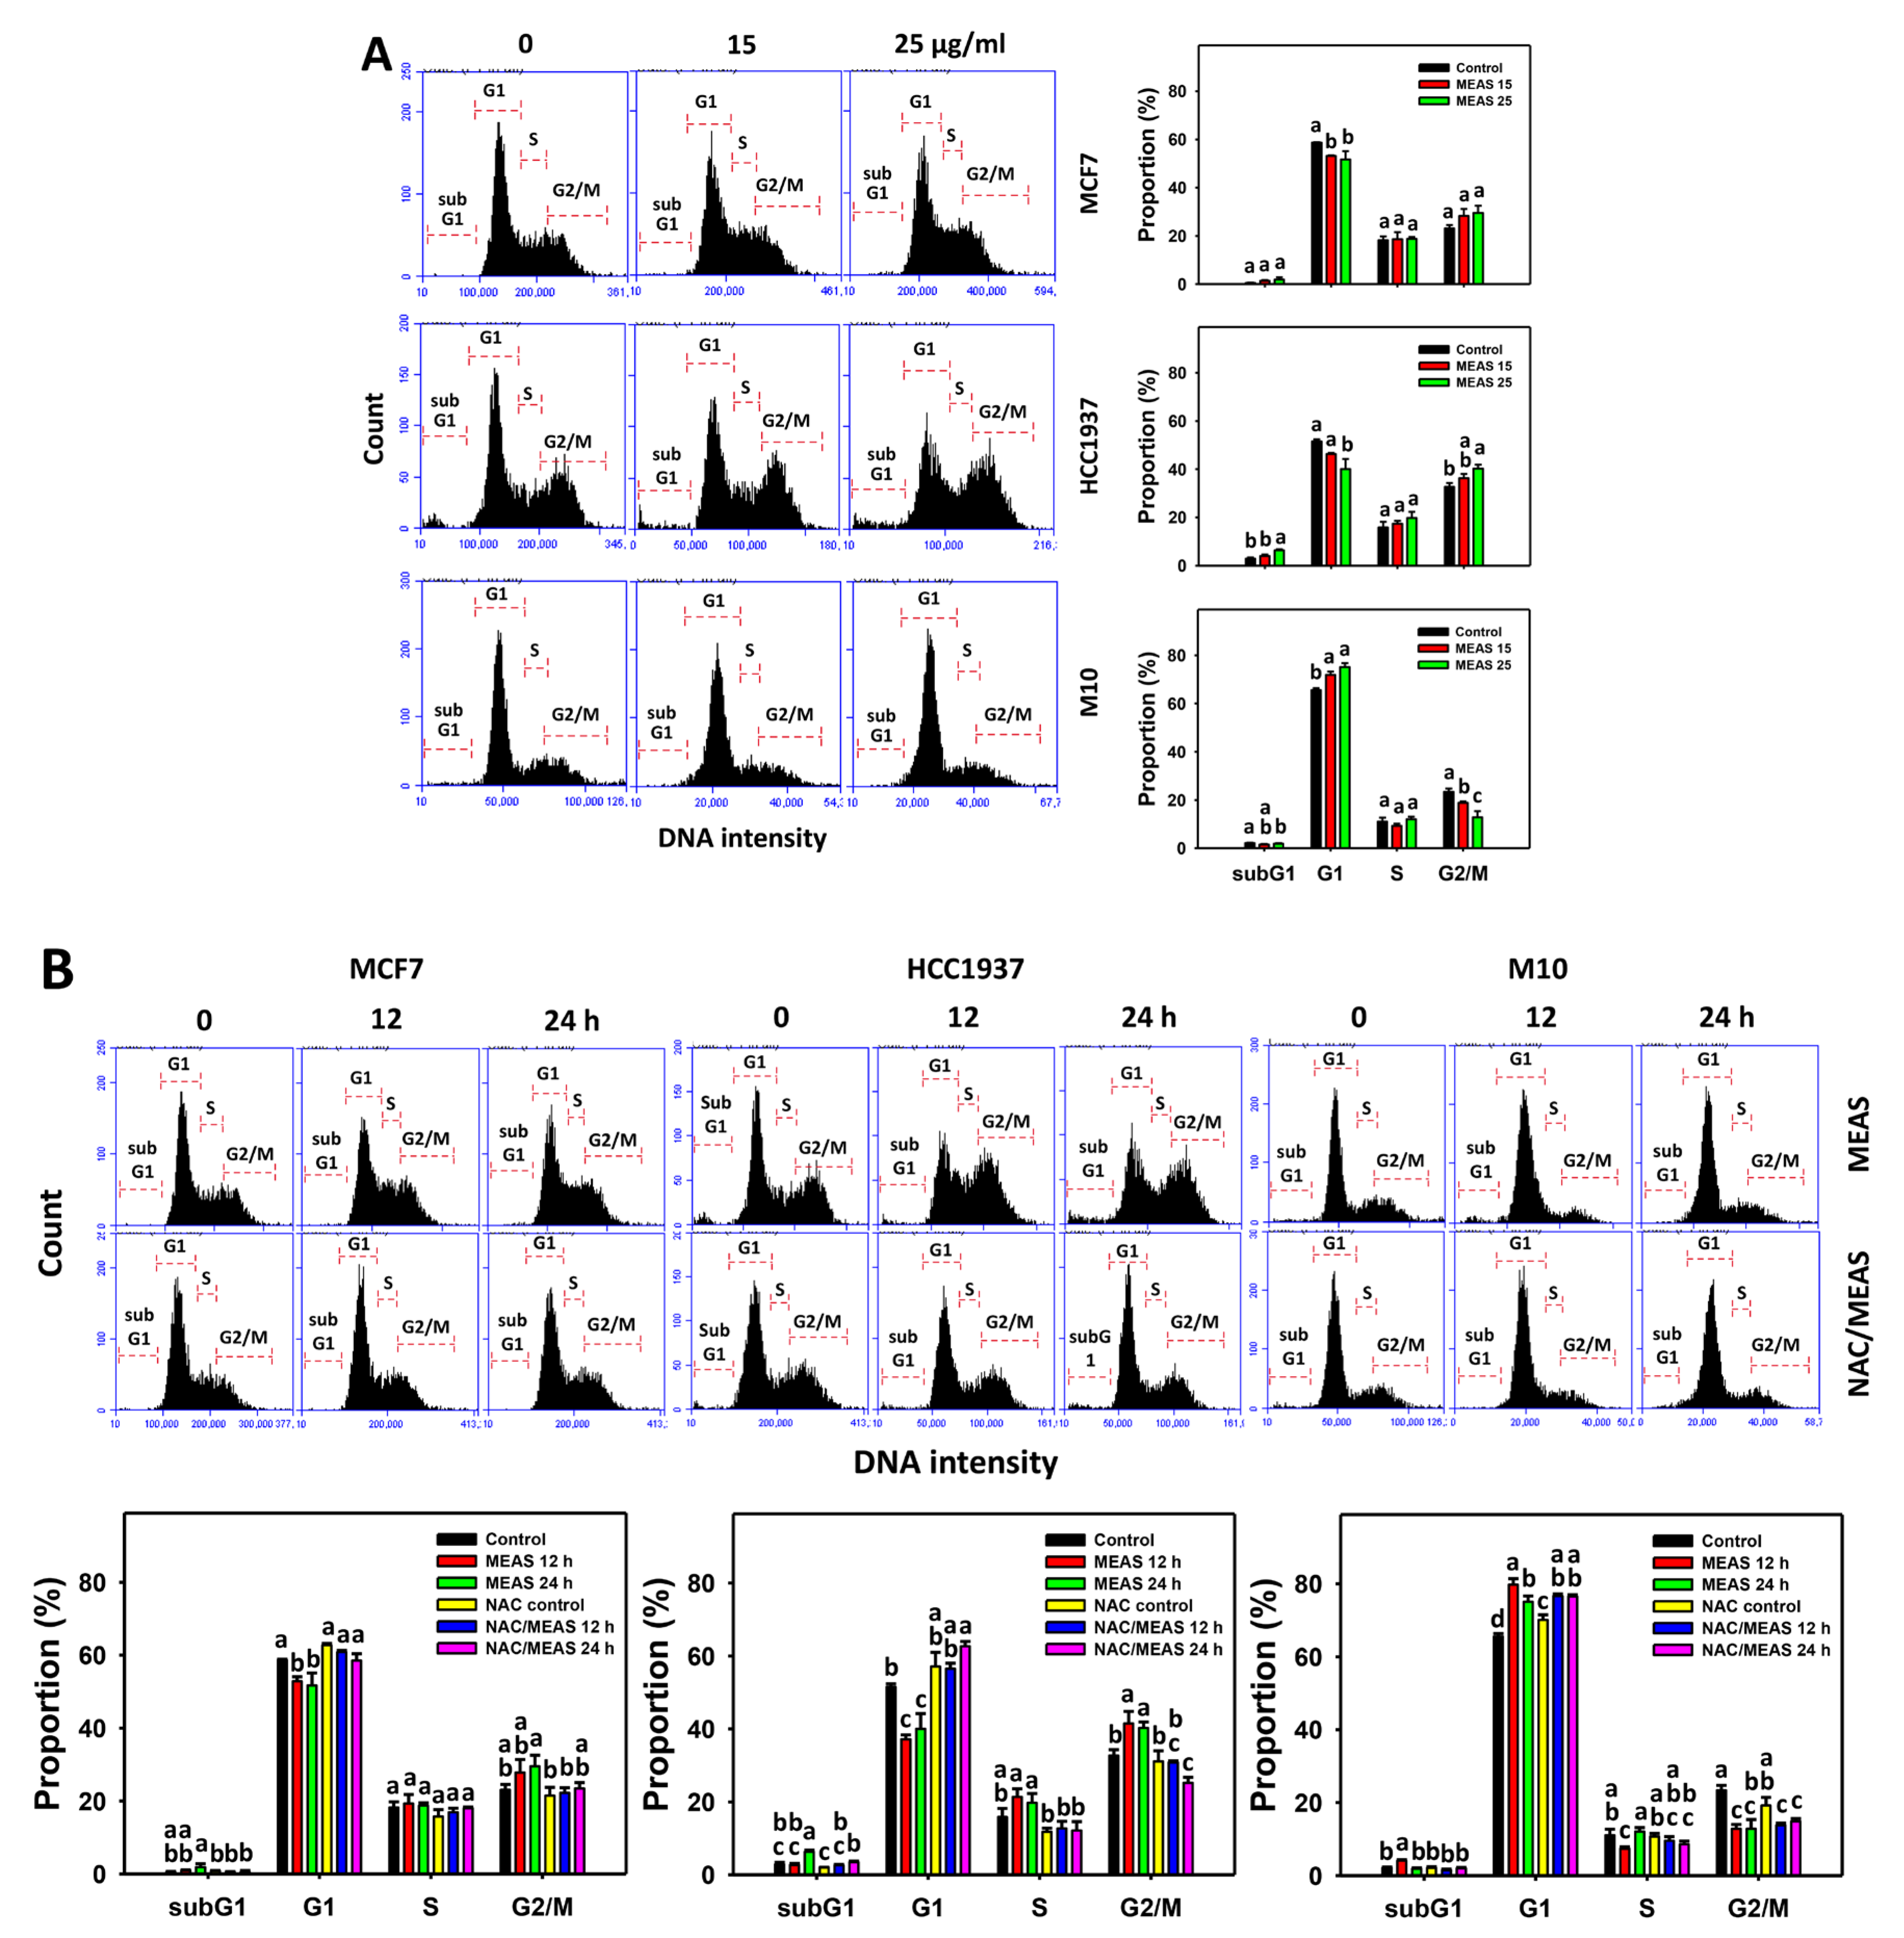
2.3. Cell Cycle Status of MEAS-Treated Breast Cancer and Normal Cells
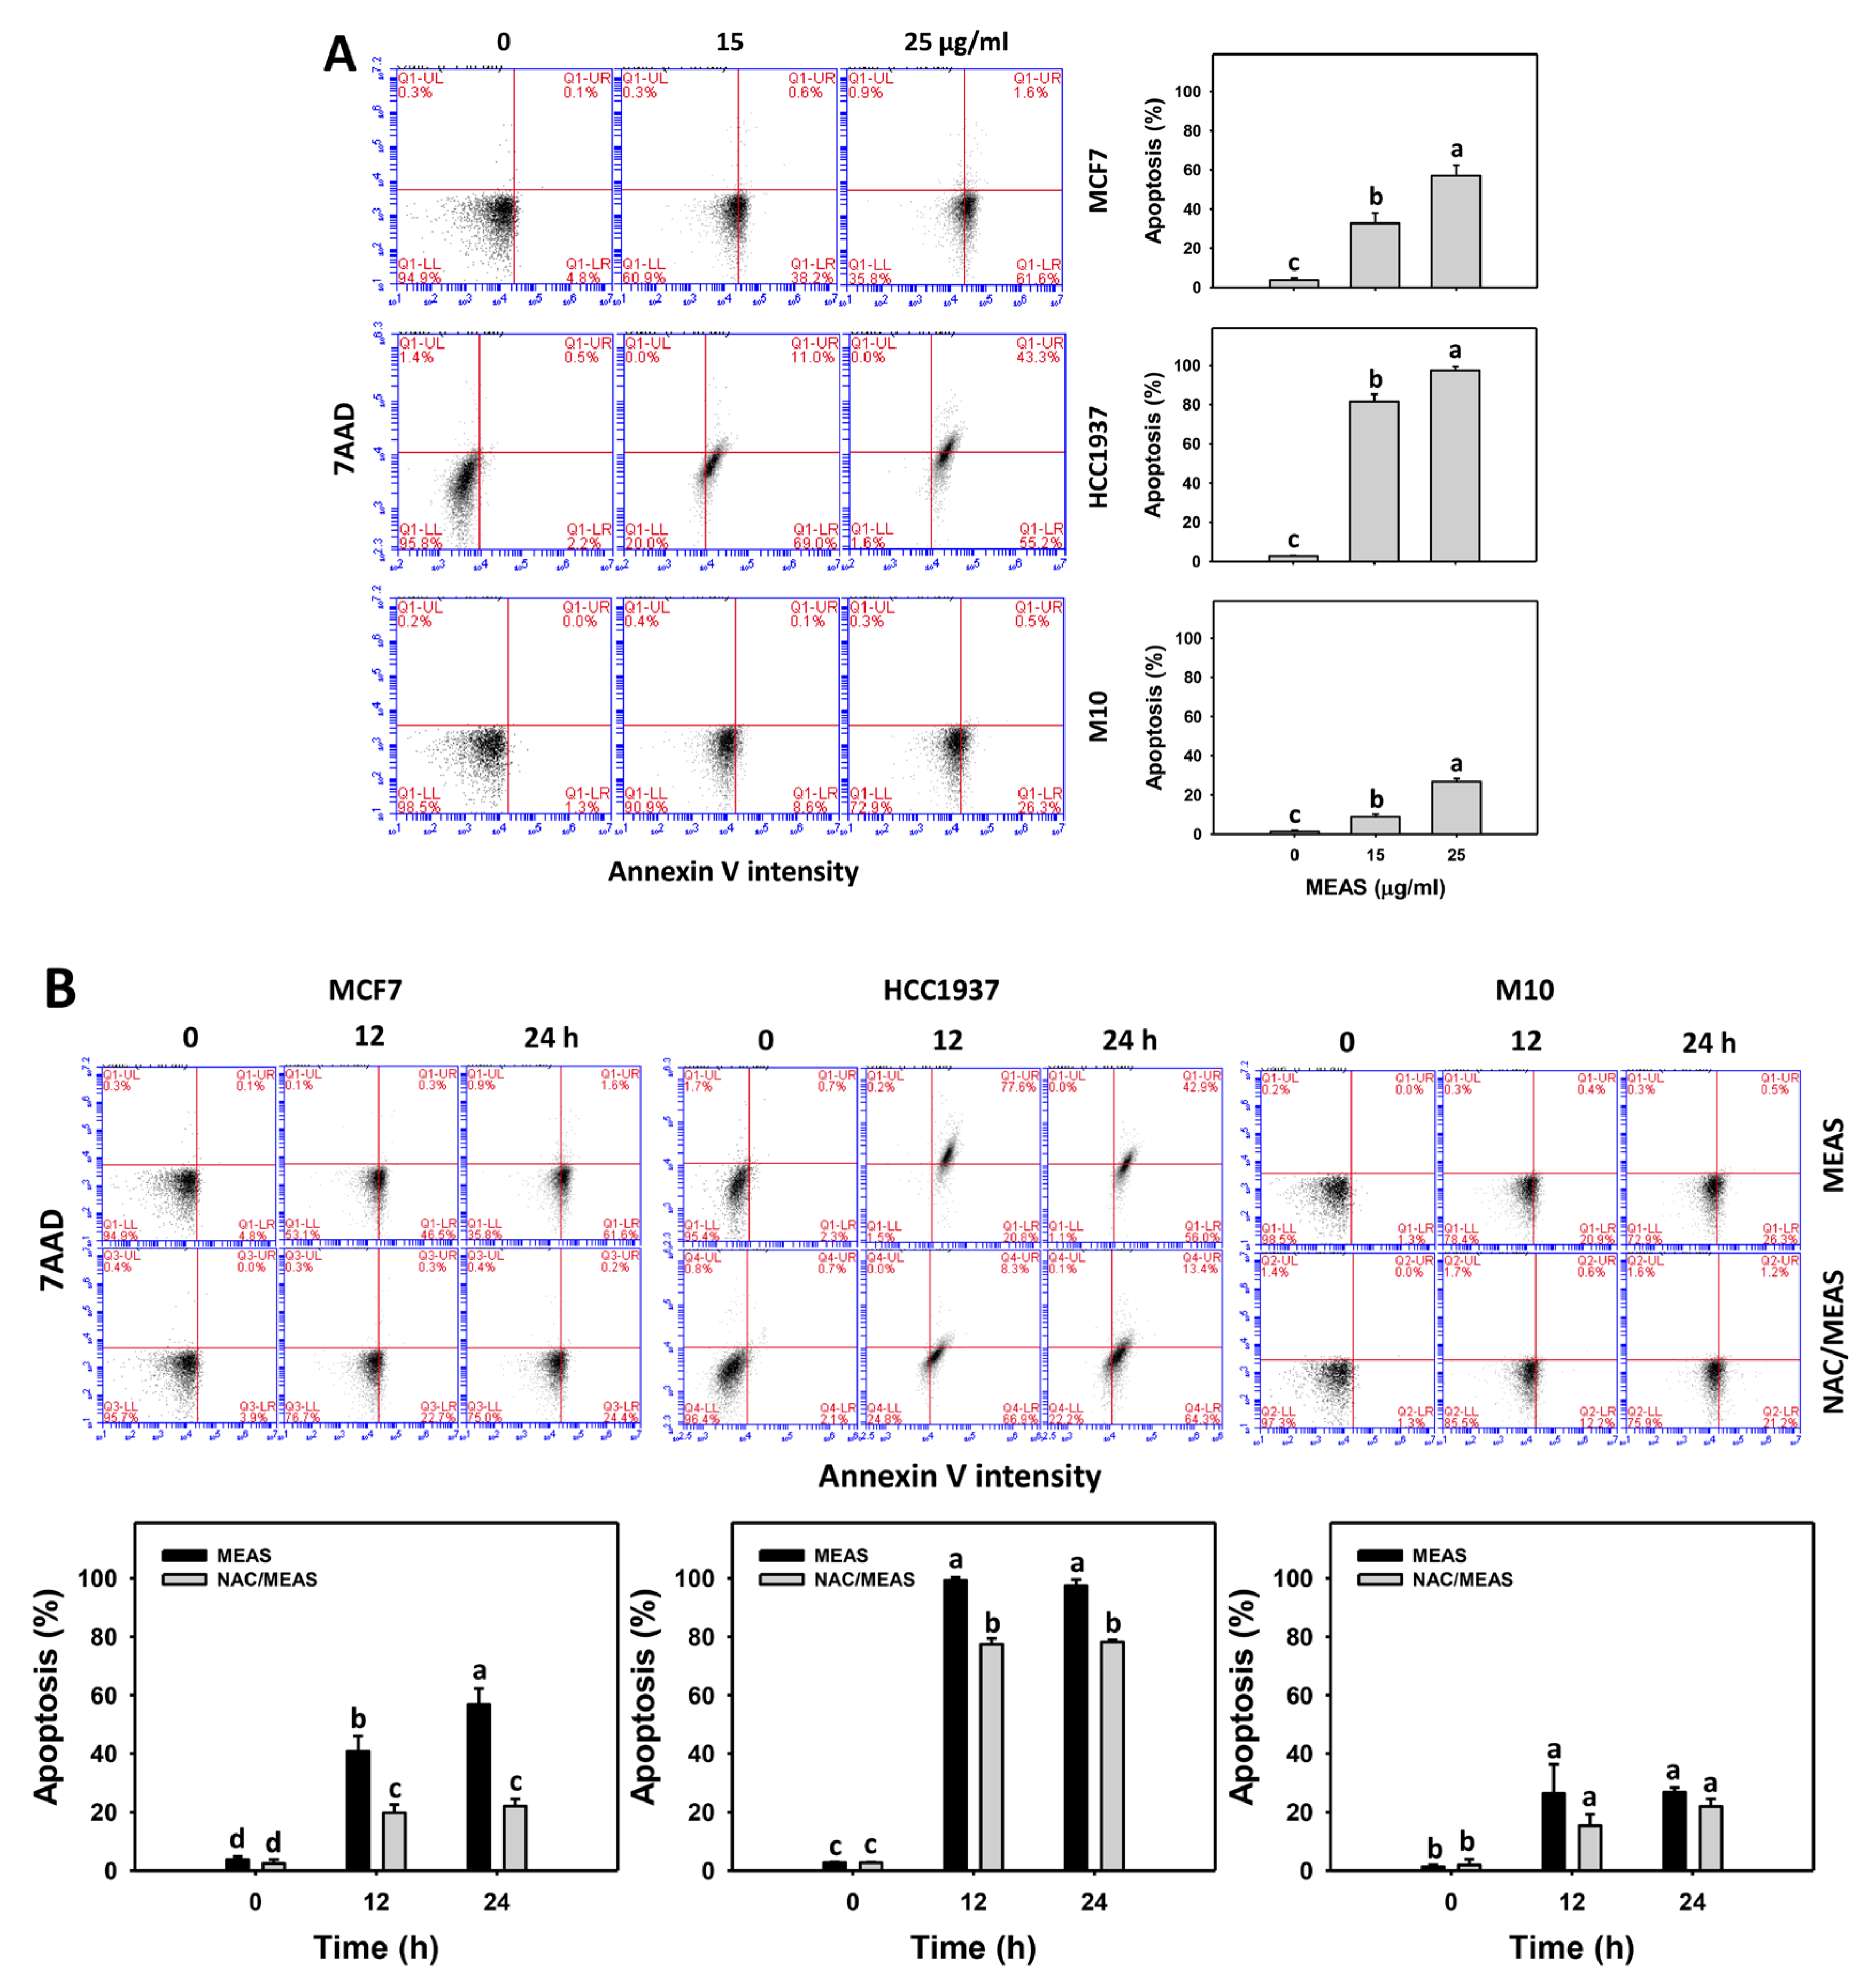
2.4. Annexin V Status of MEAS-Treated Breast Cancer and Normal Cells
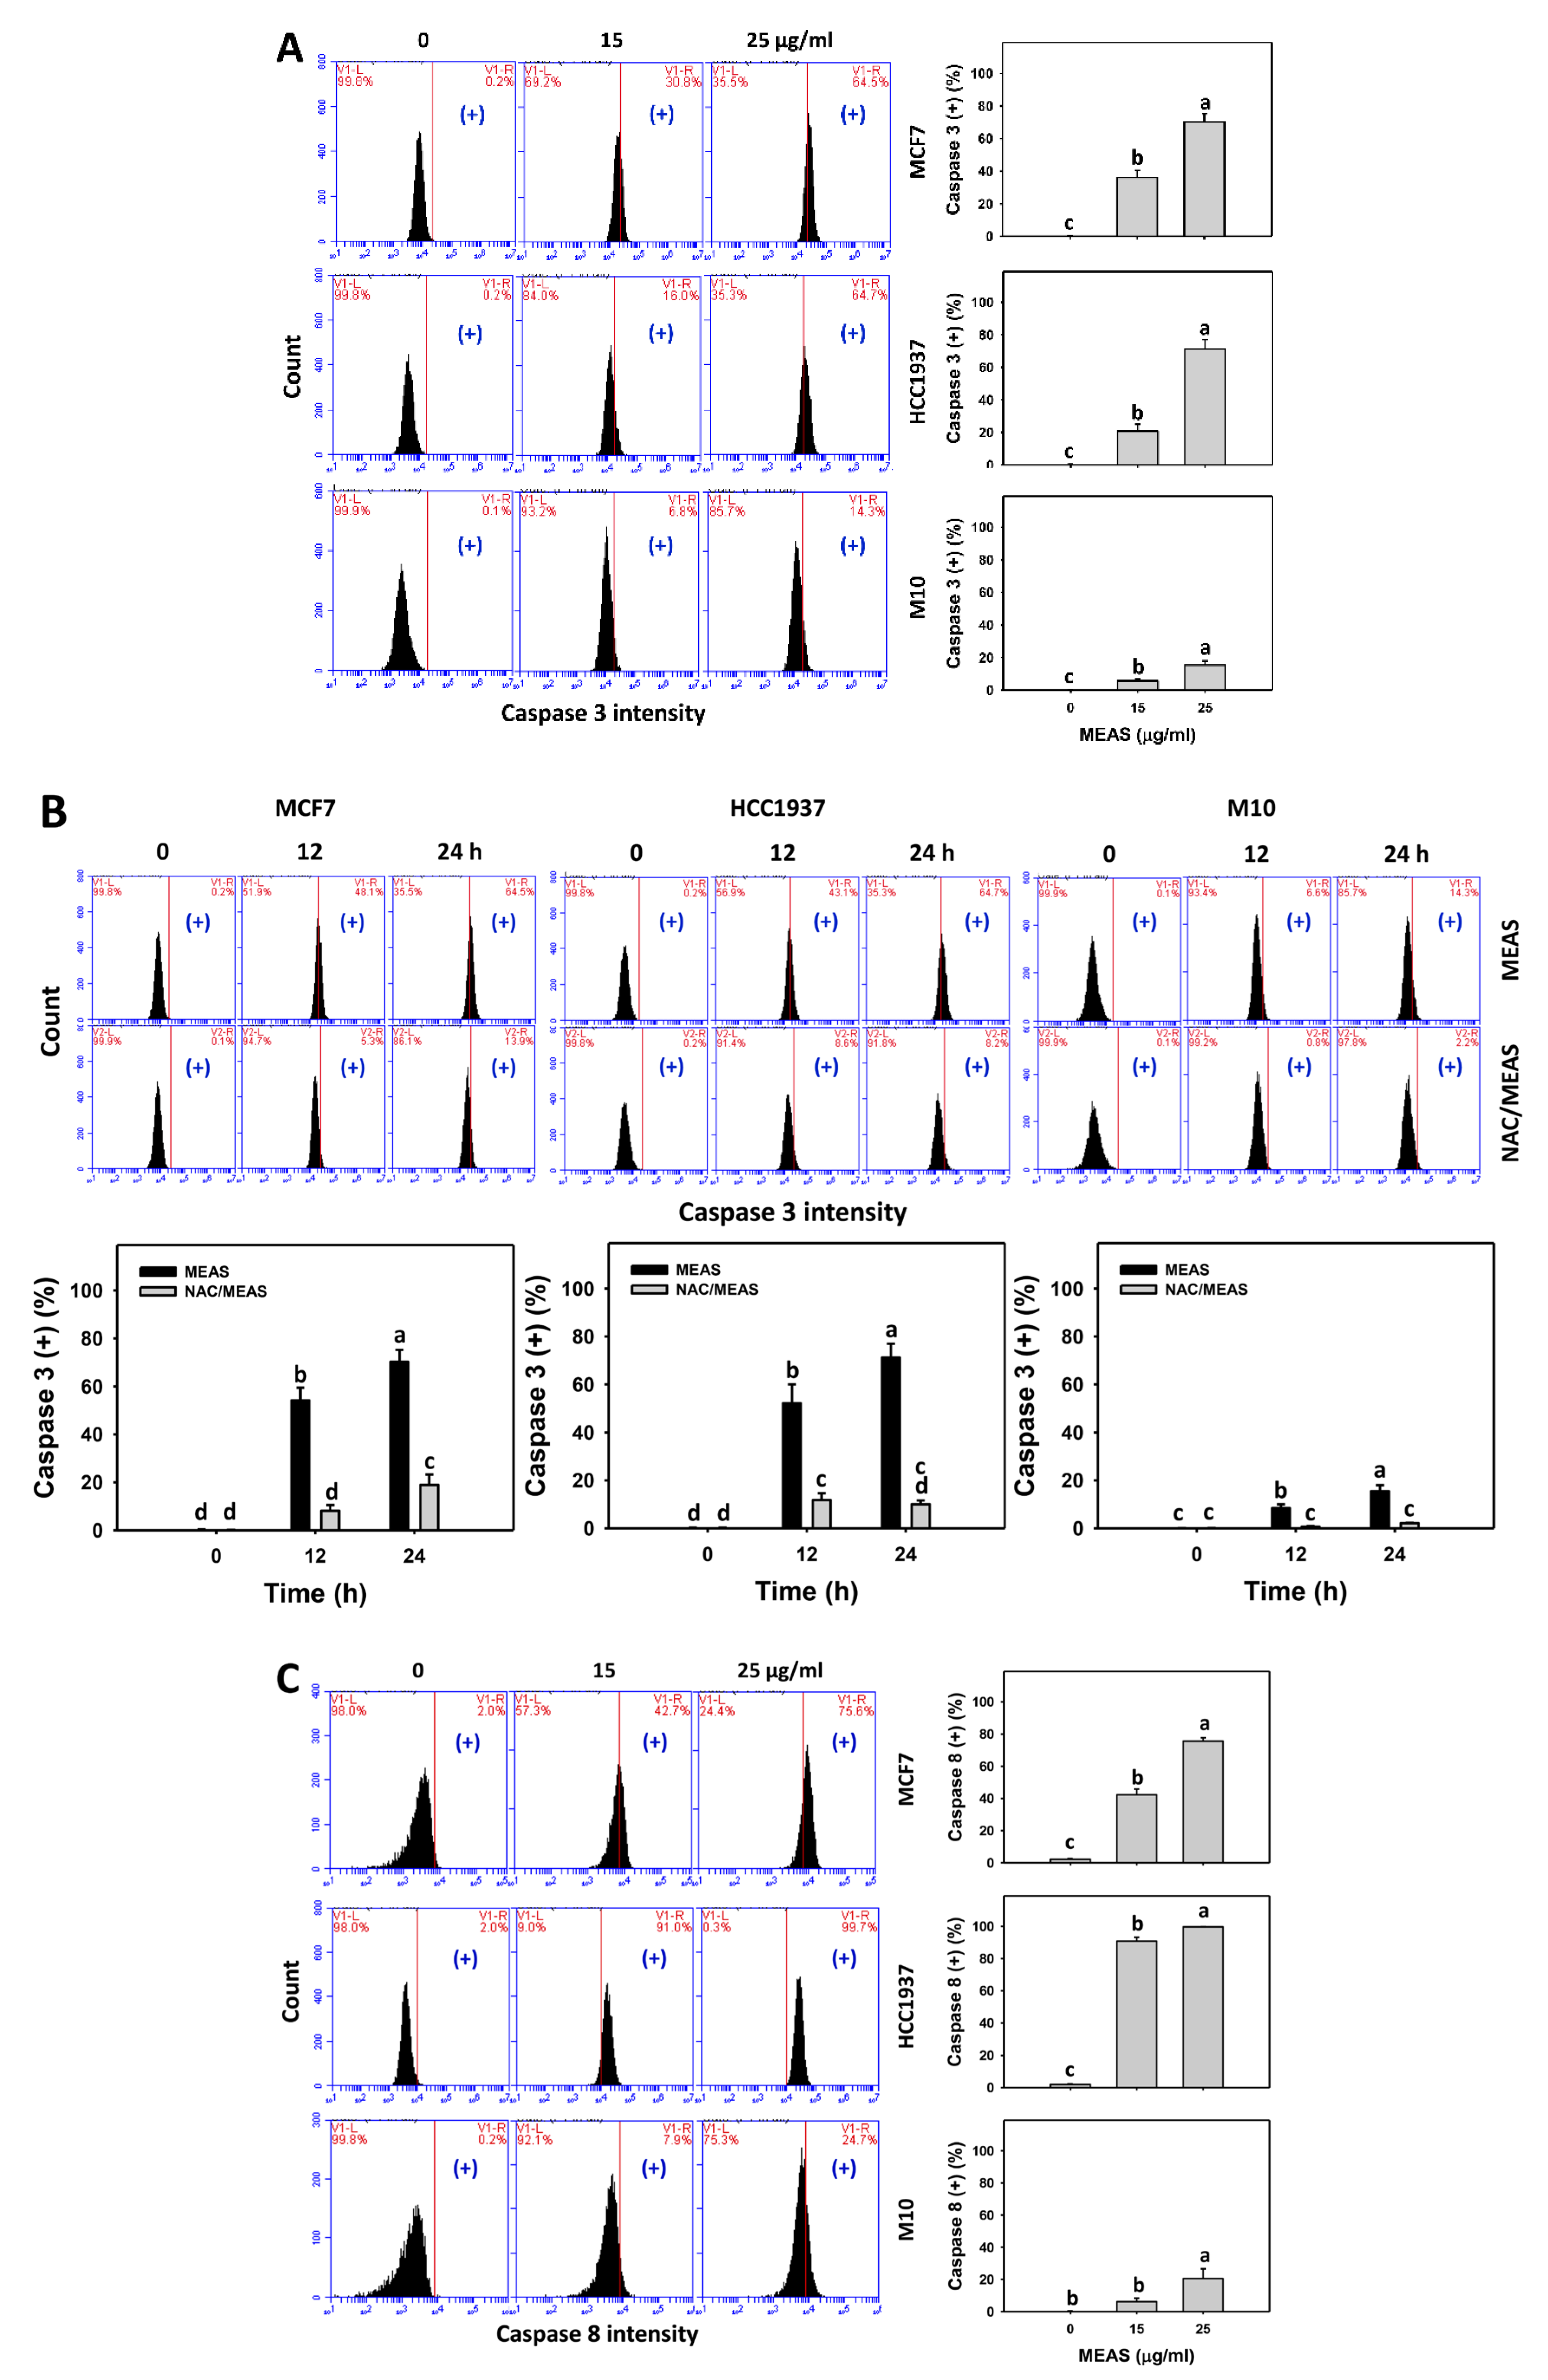
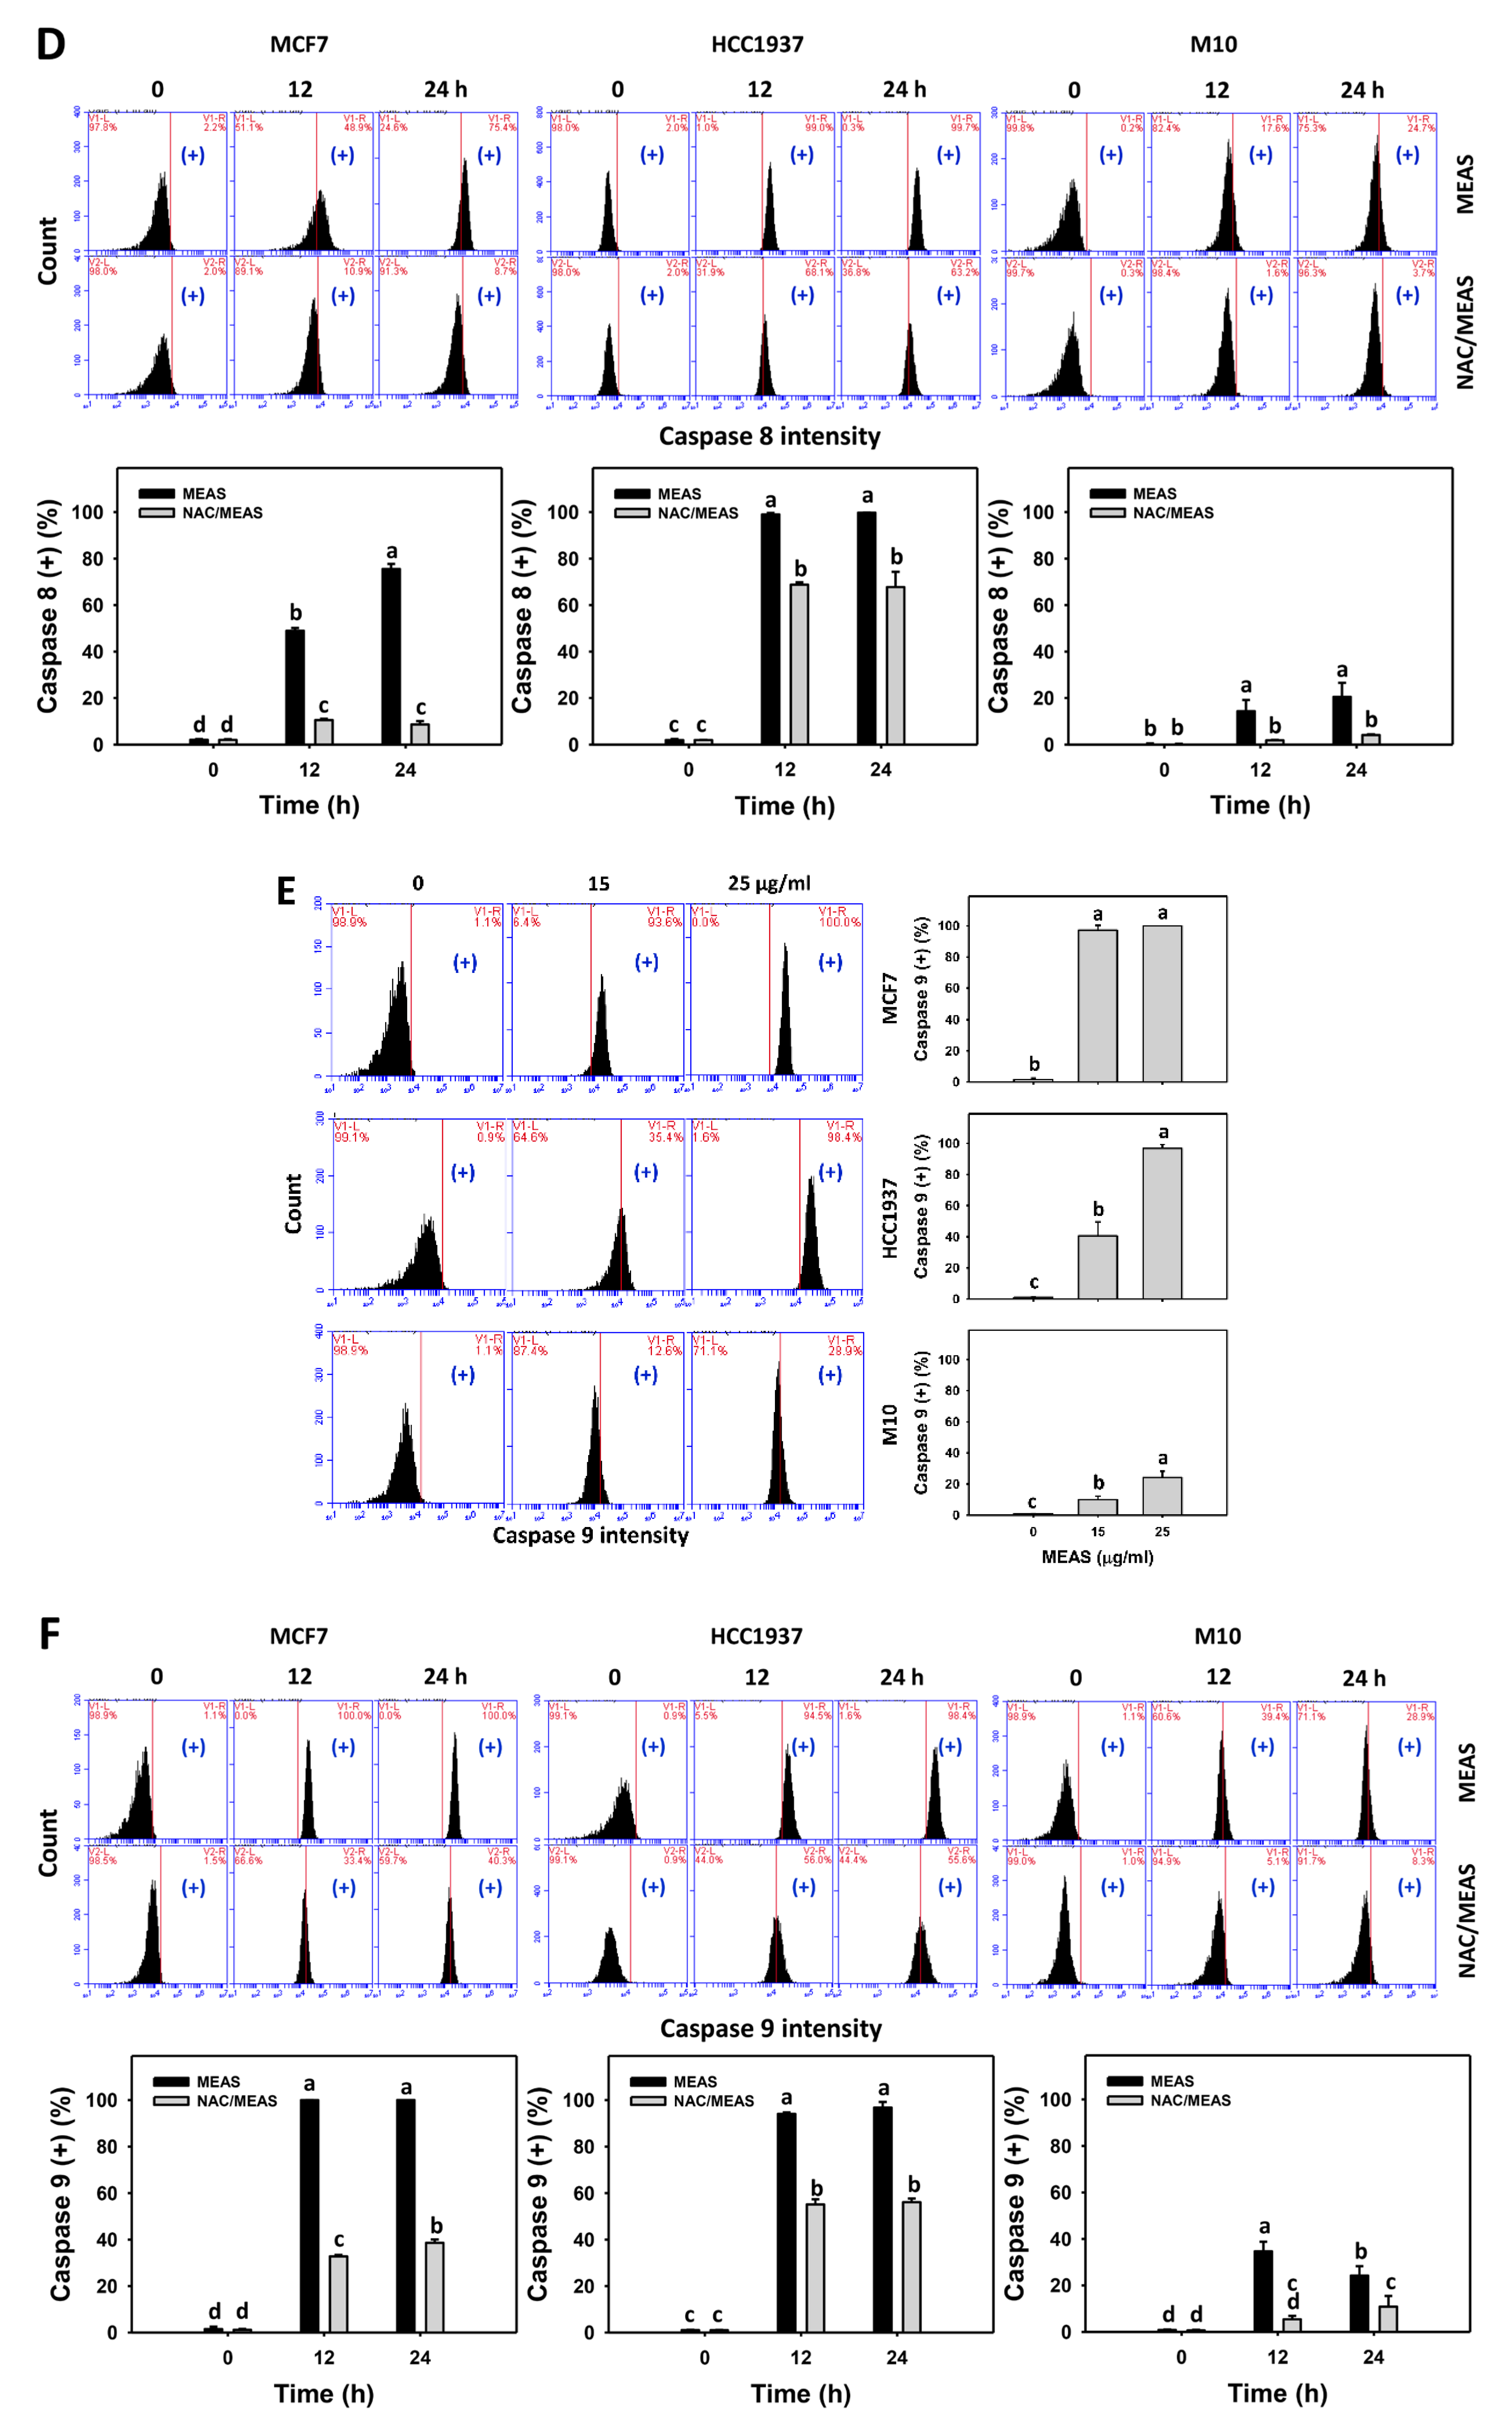
2.5. Caspase Status of MEAS-Treated Breast Cancer and Normal Cells
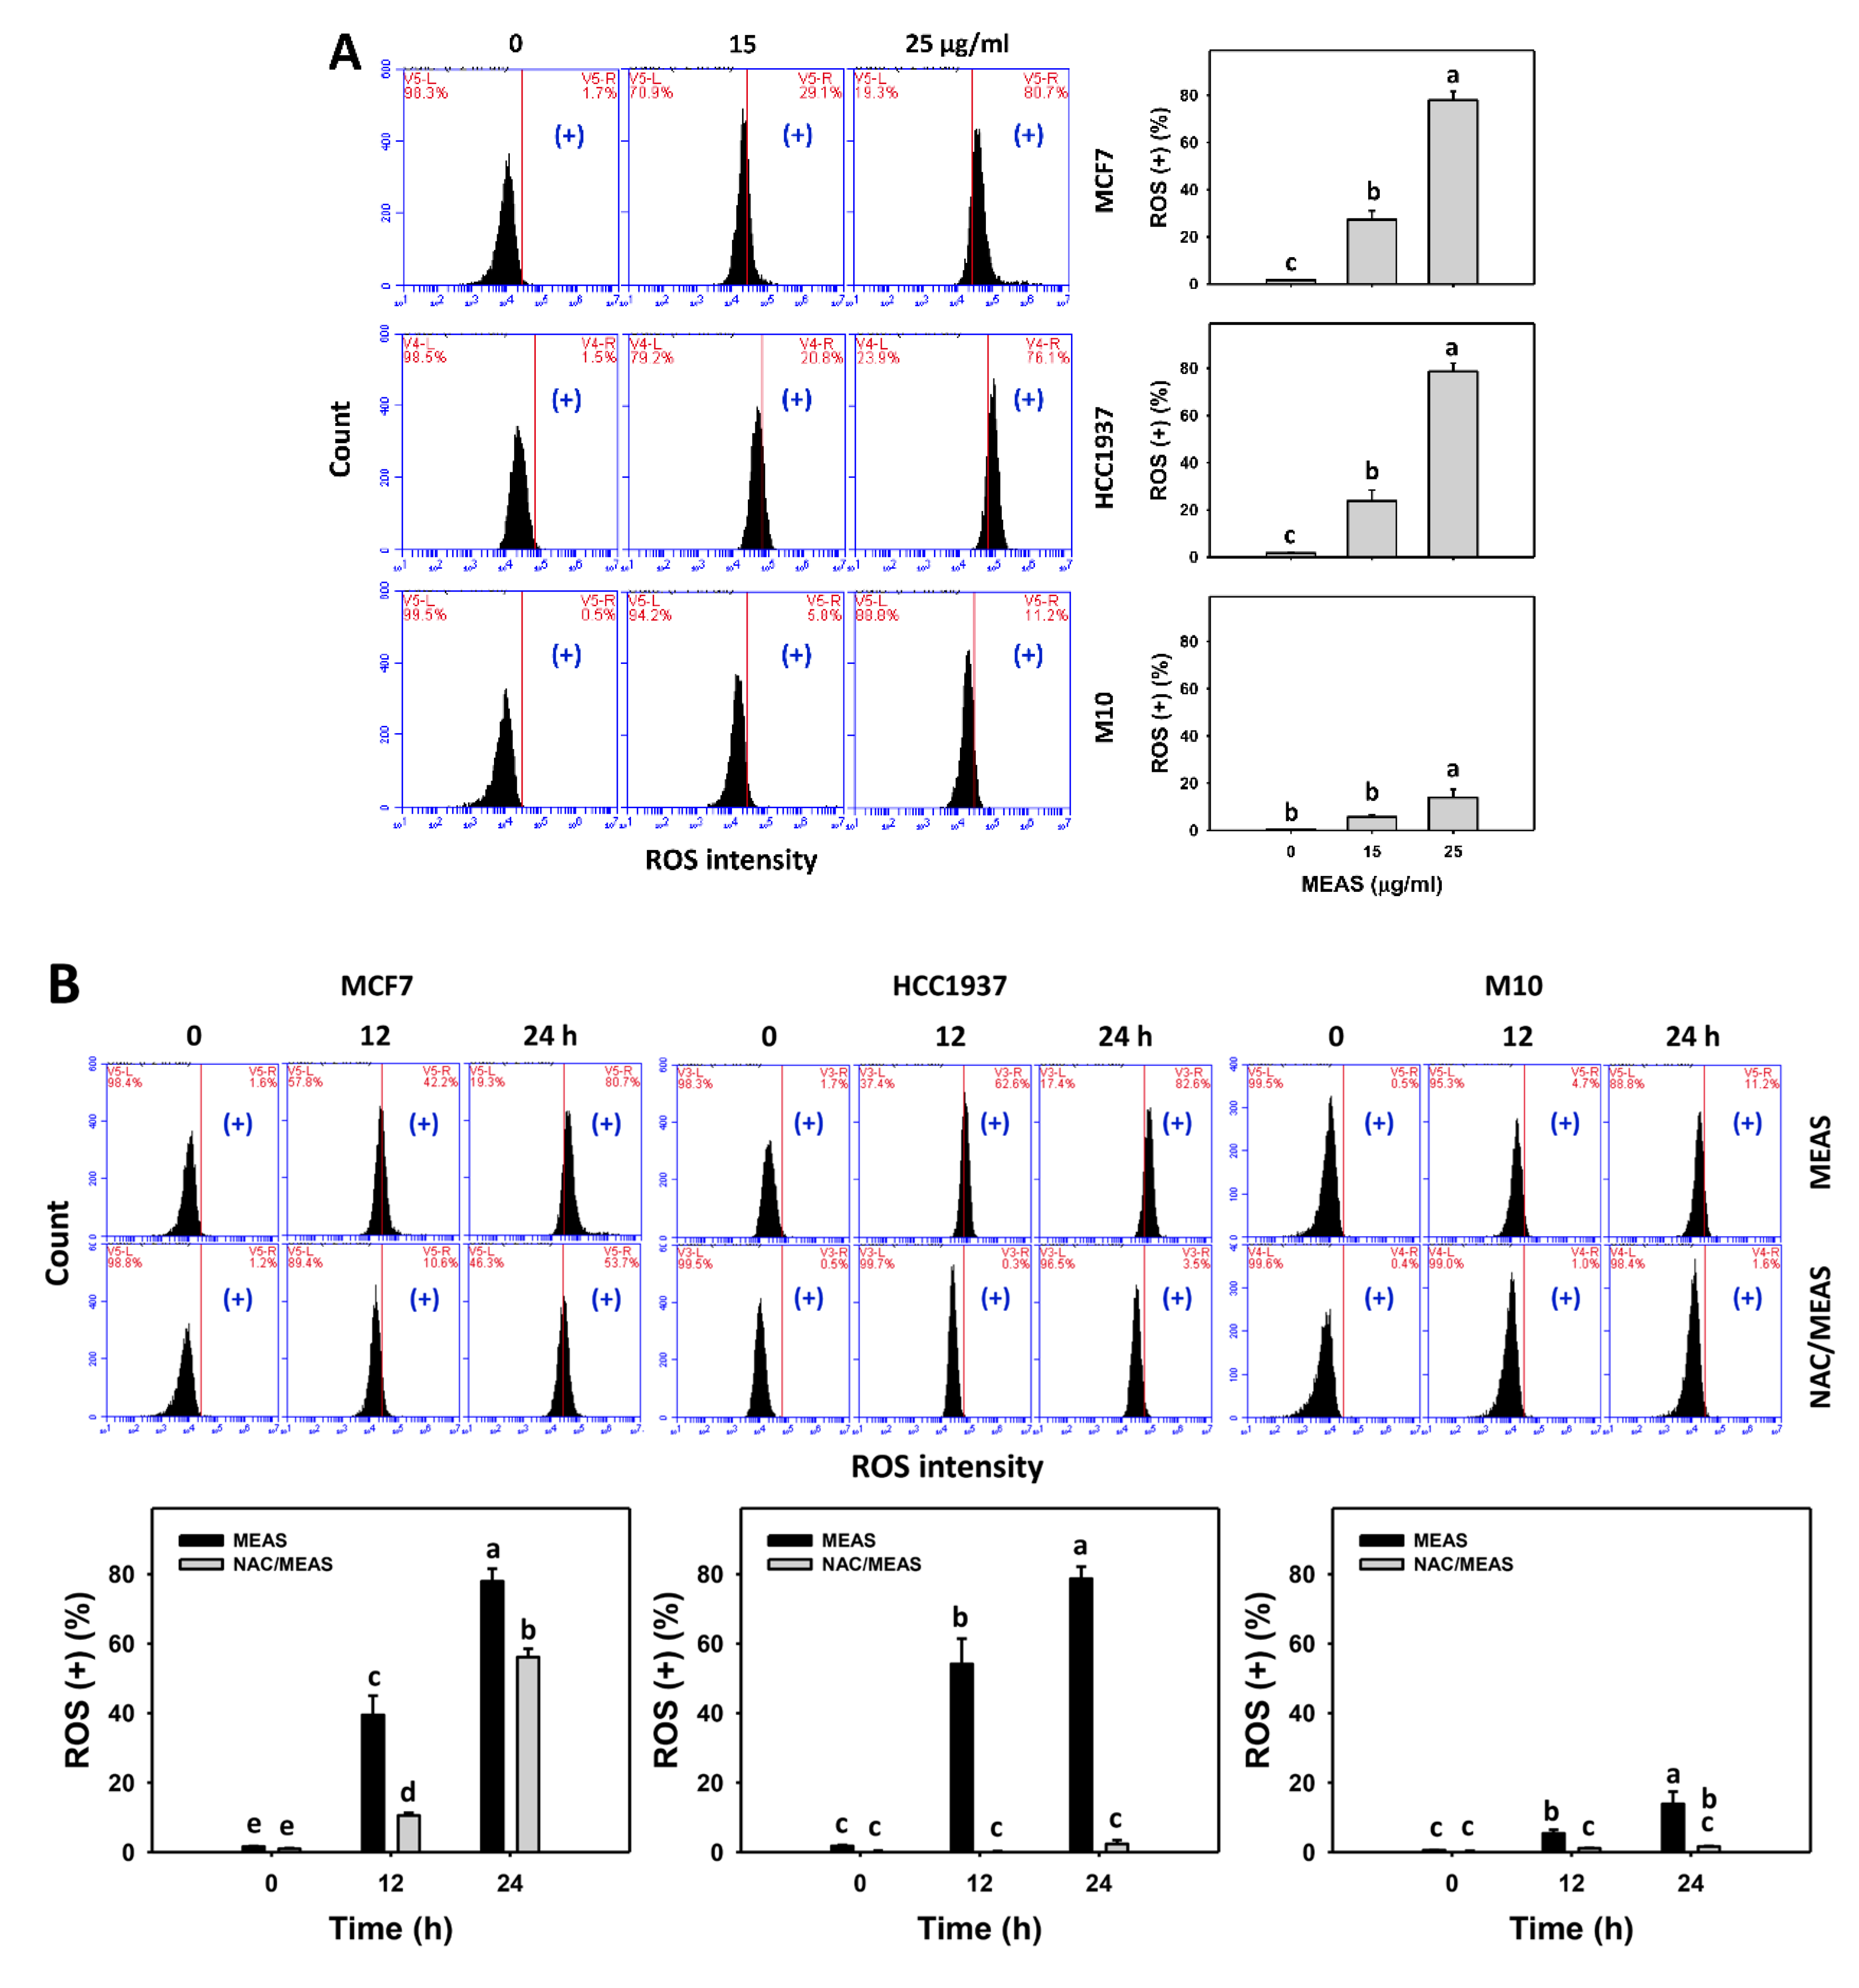
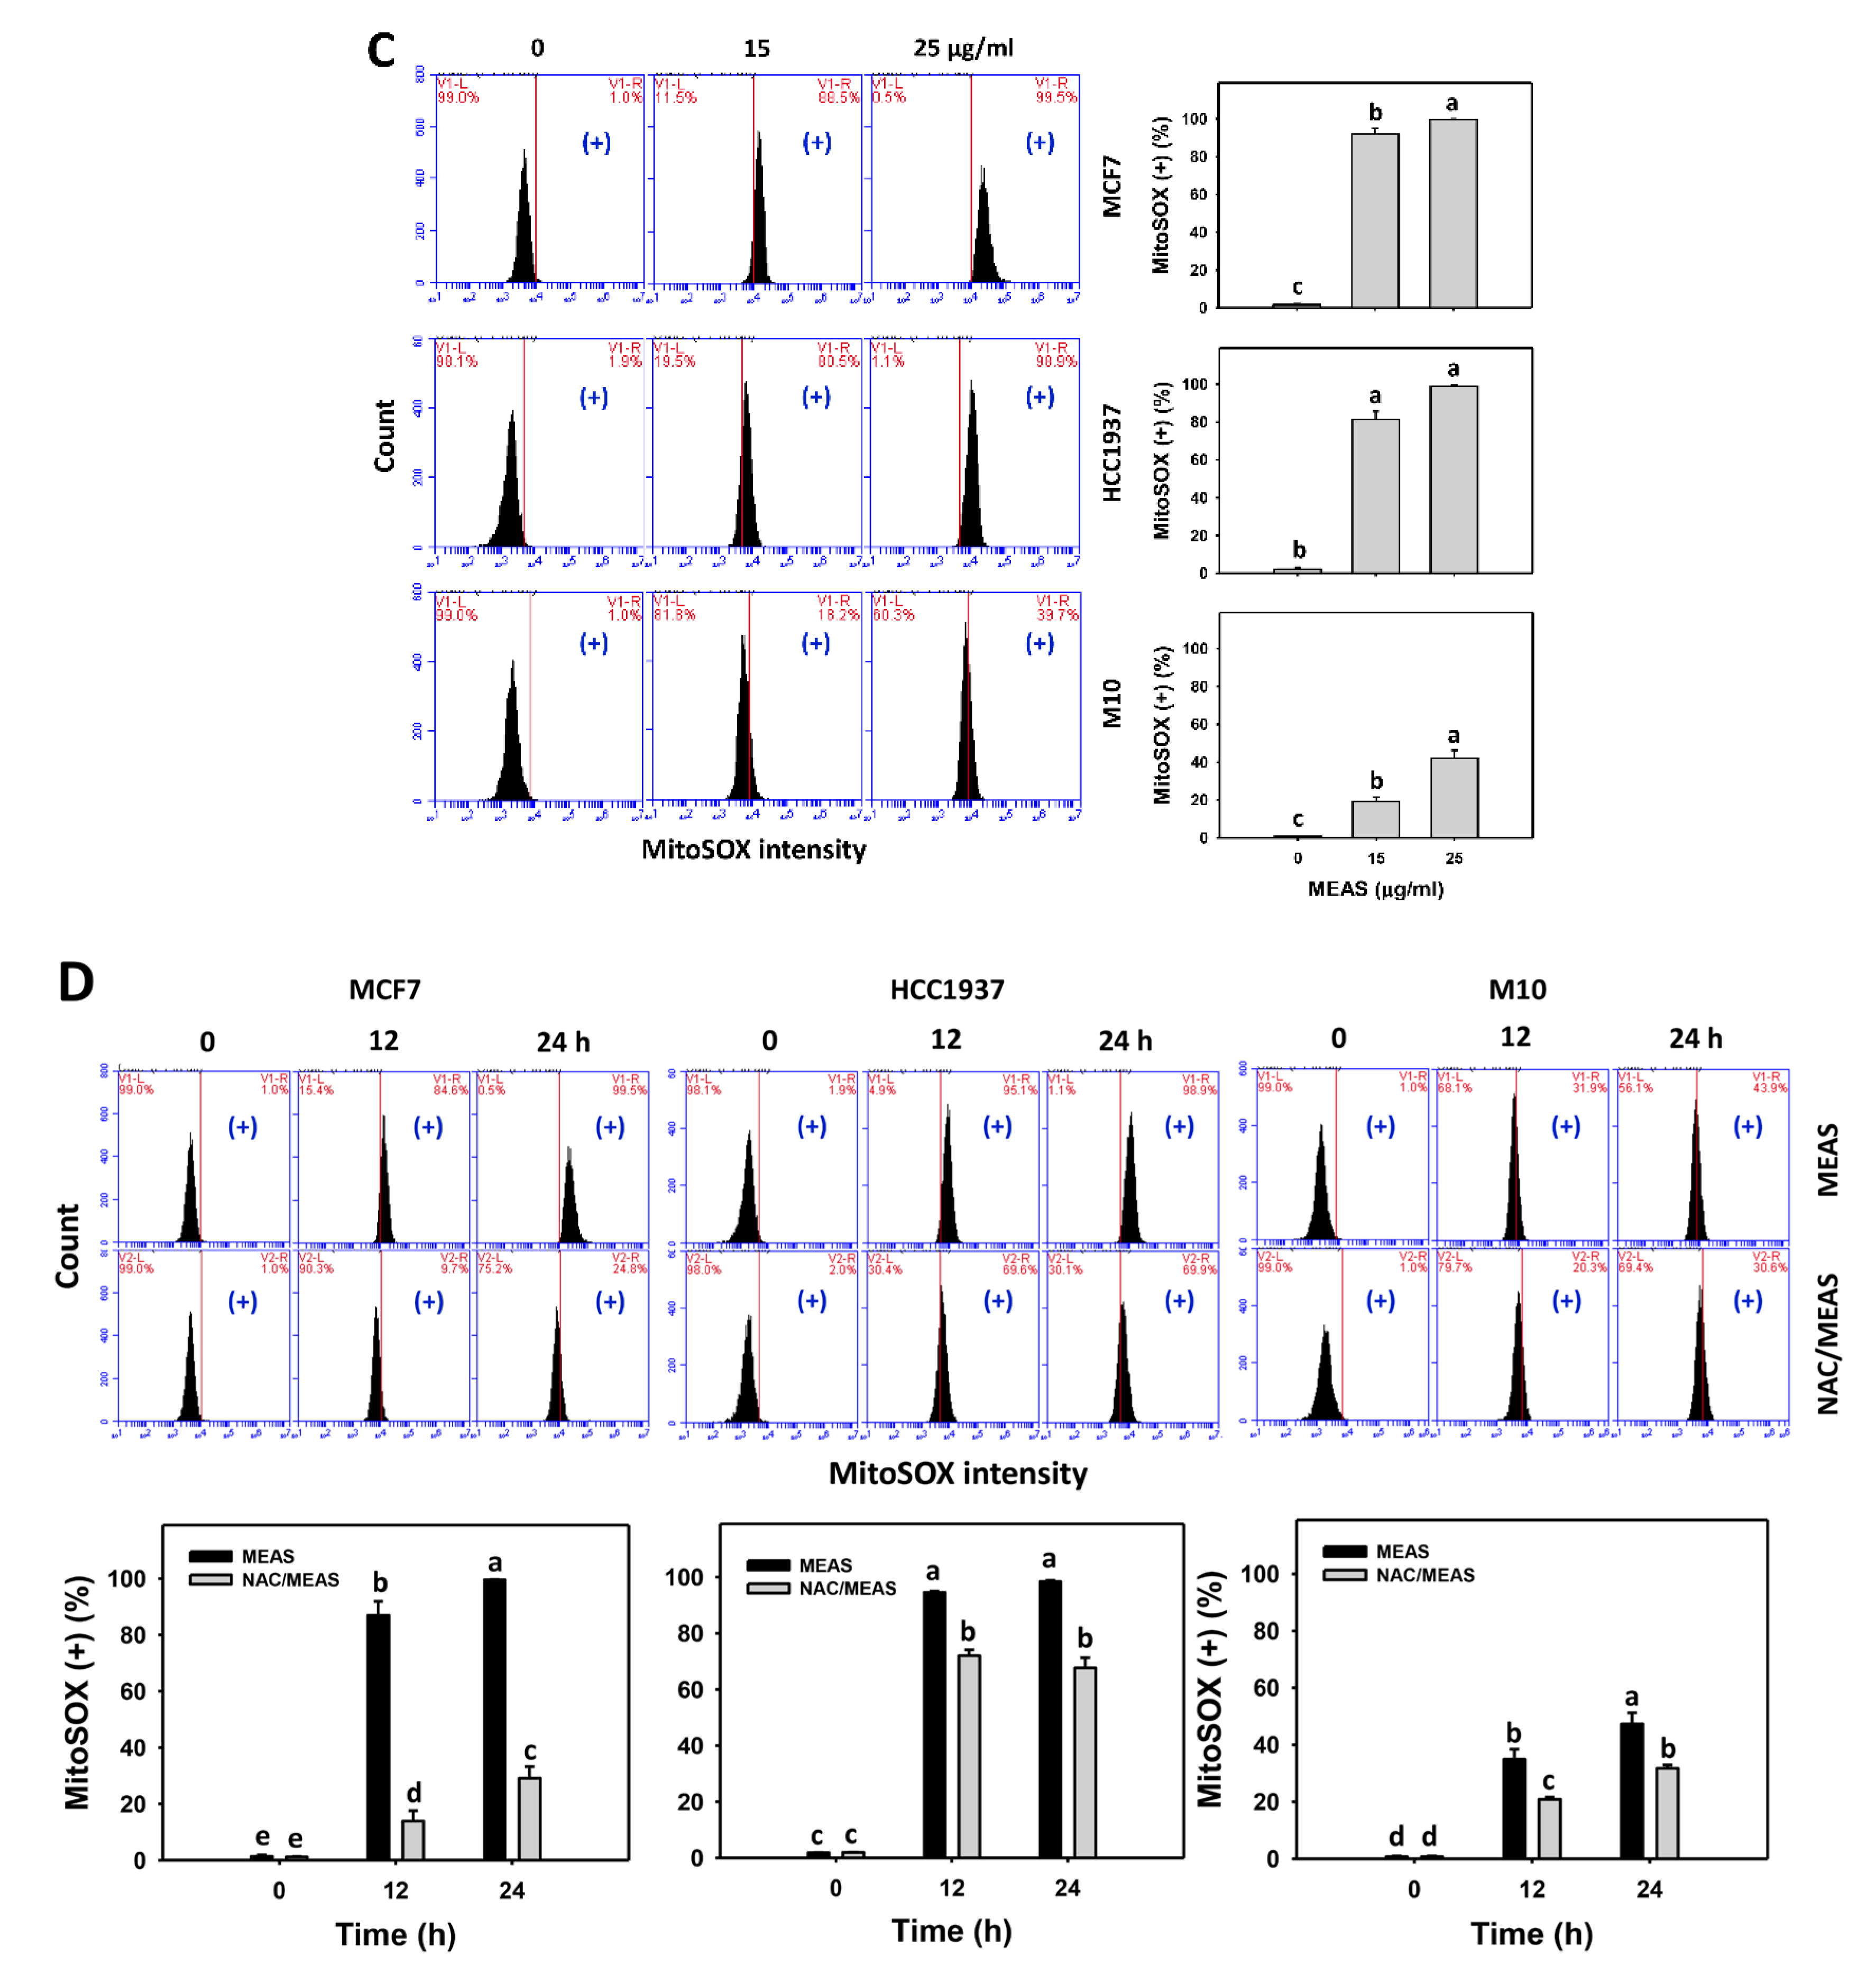
2.6. Reactive Oxygen Species (ROS) and Mitochondrial Superoxide (MitoSOX) Status of MEAS-Treated Breast Cancer and Normal Cells
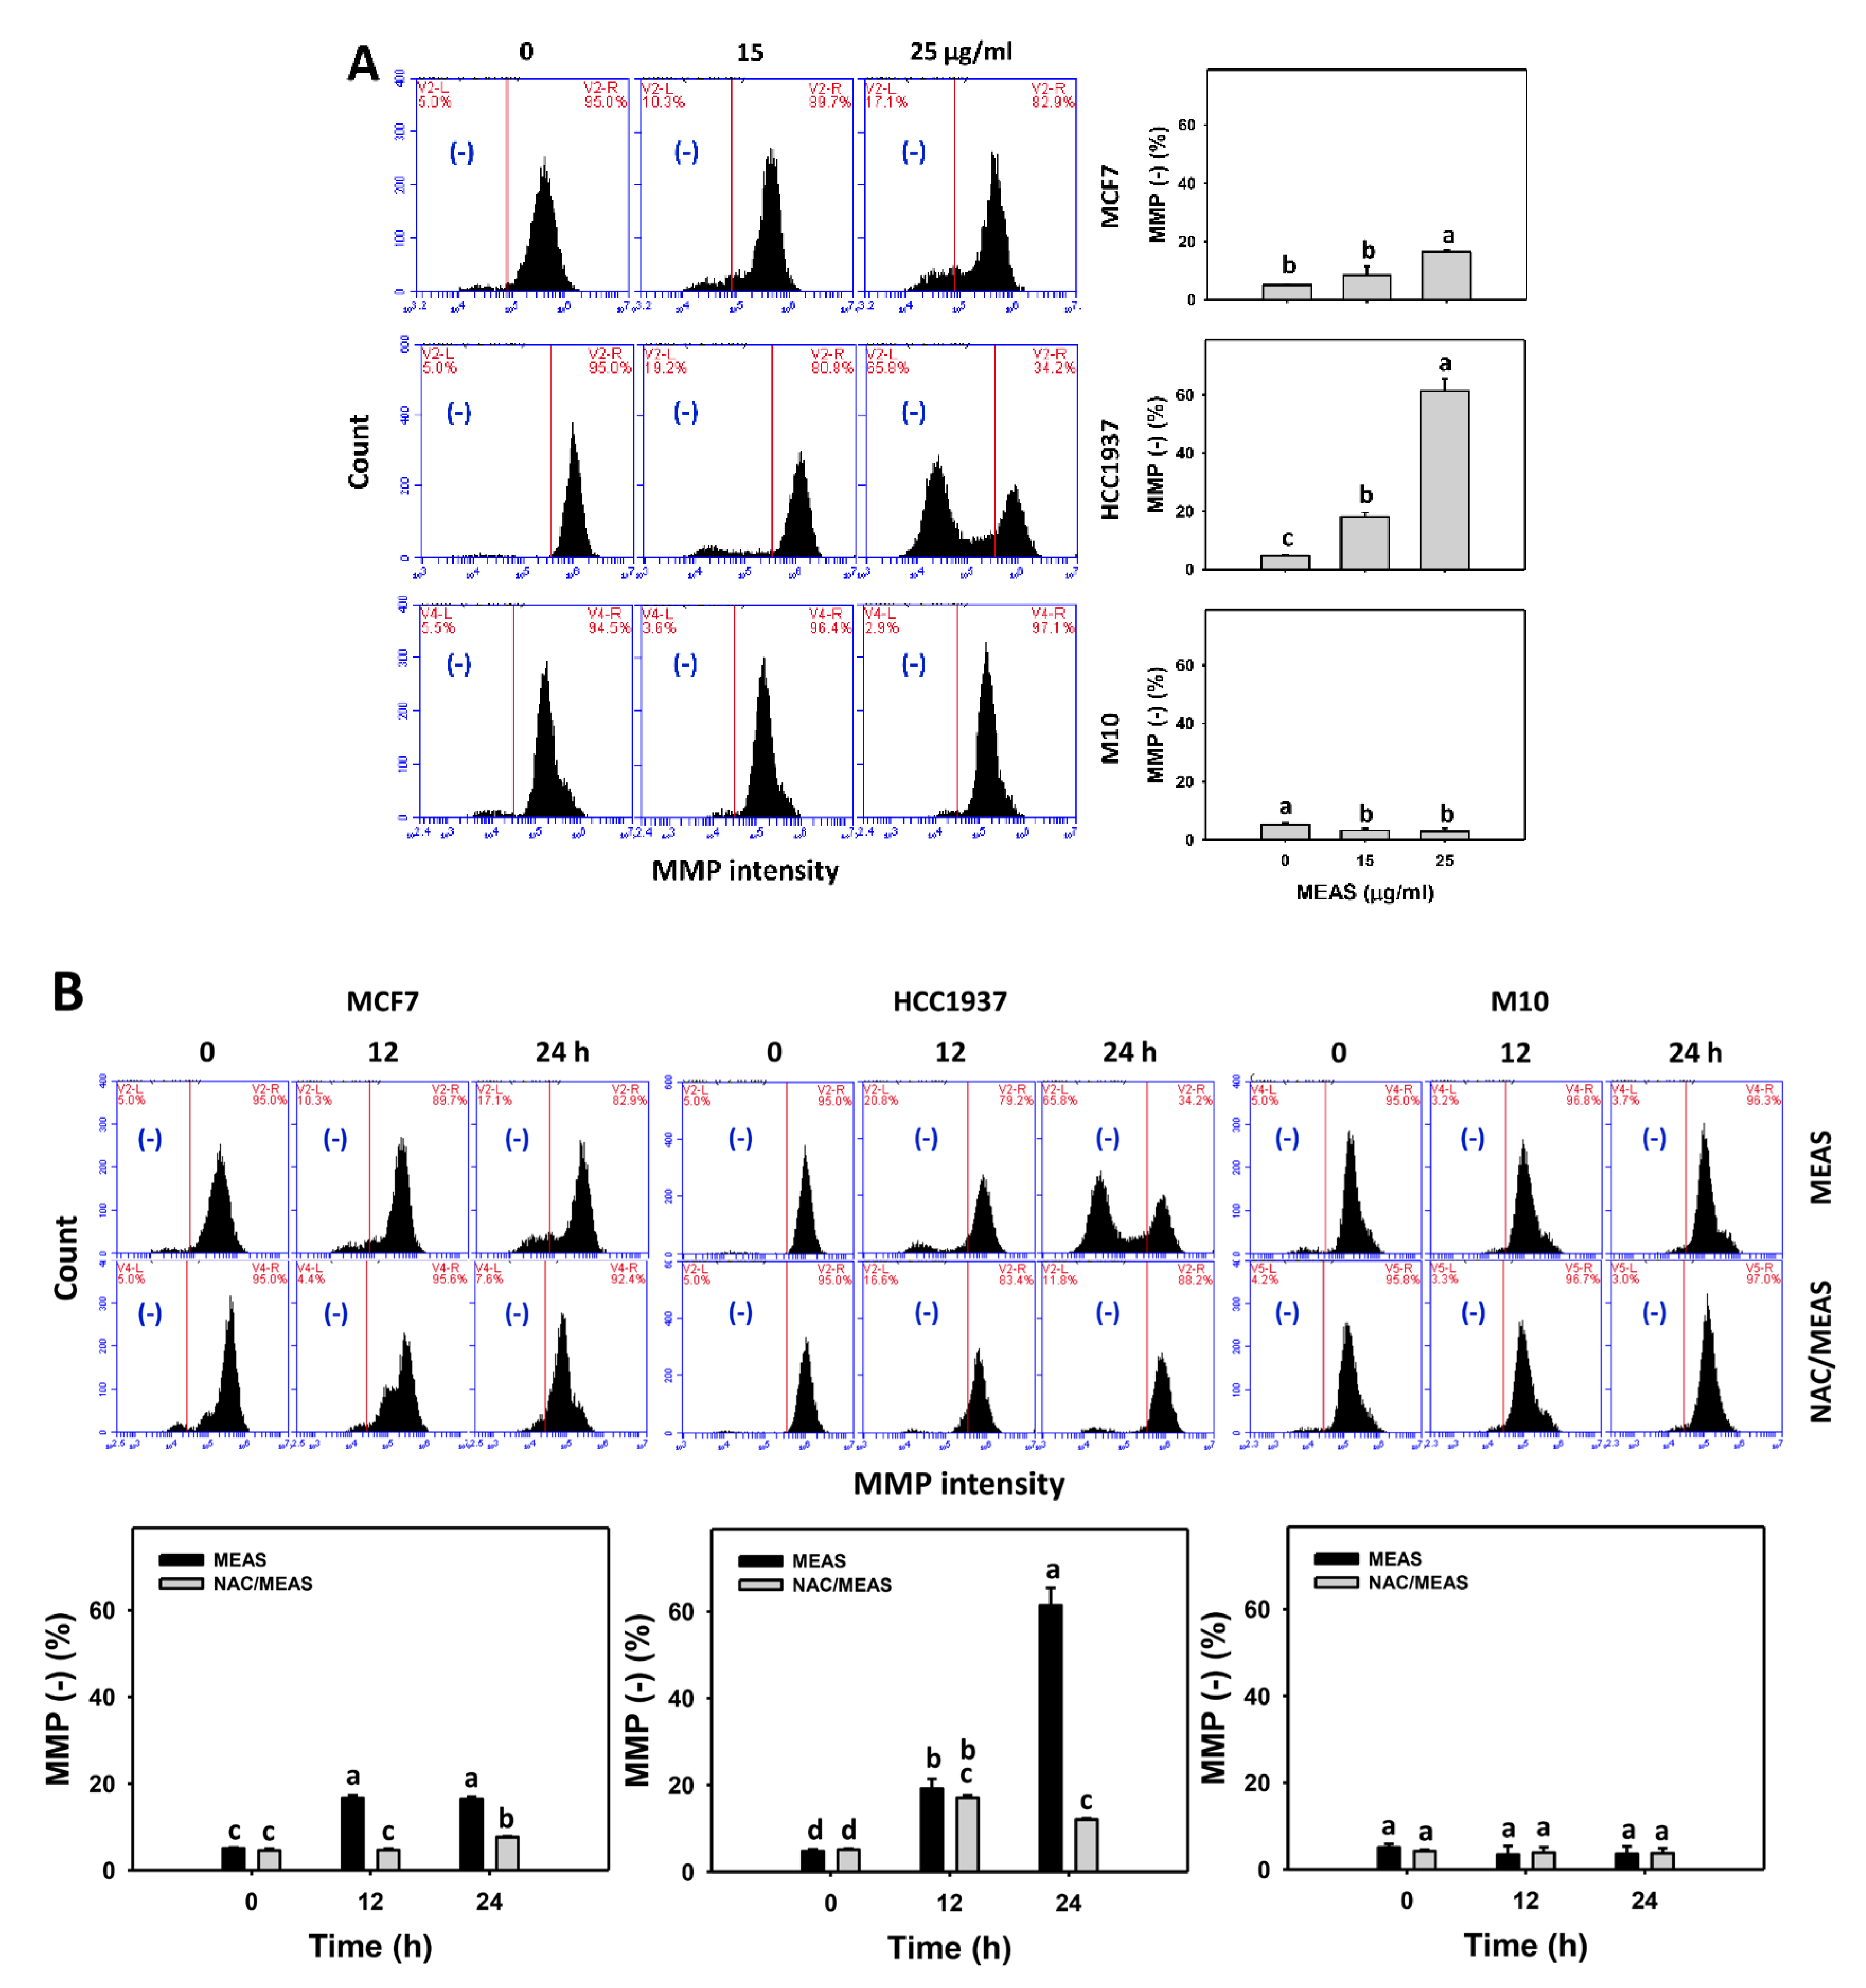
2.7. Mitochondrial Membrane Potential (MMP) Status of MEAS-Treated Breast Cancer and Normal Cells
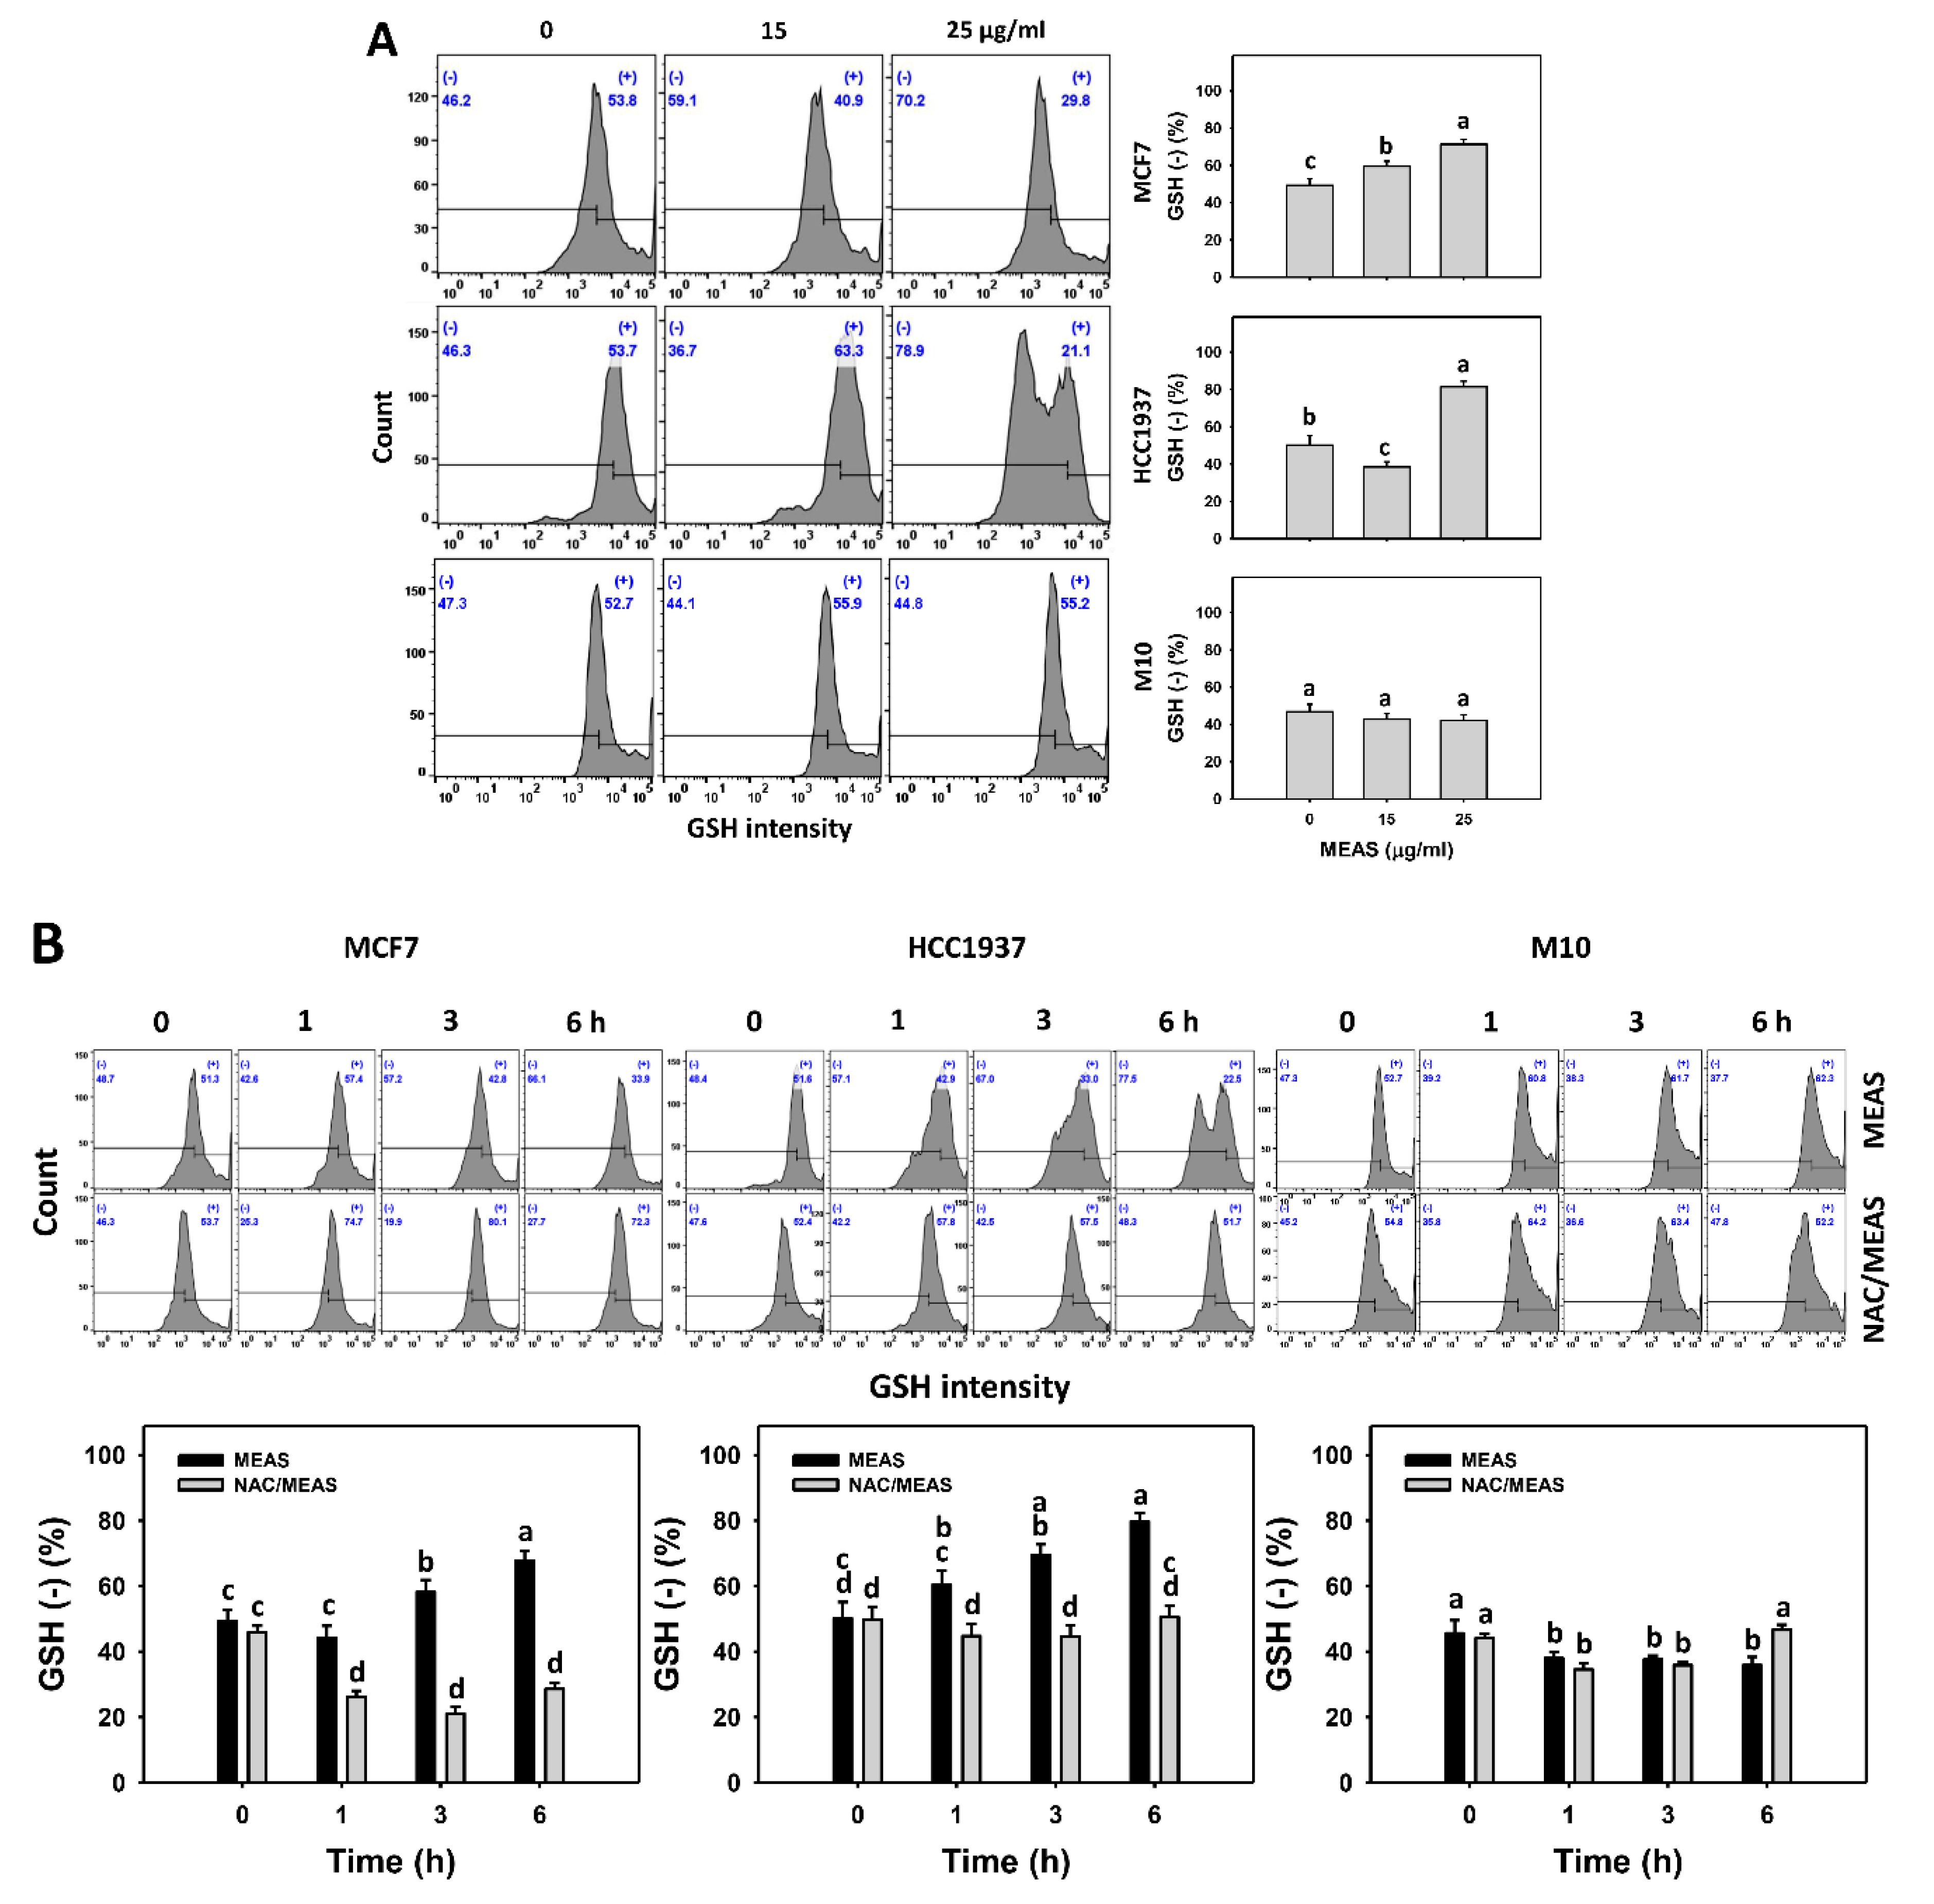
2.8. Glutathione (GSH) Status of MEAS-Treated Breast Cancer and Normal Cells
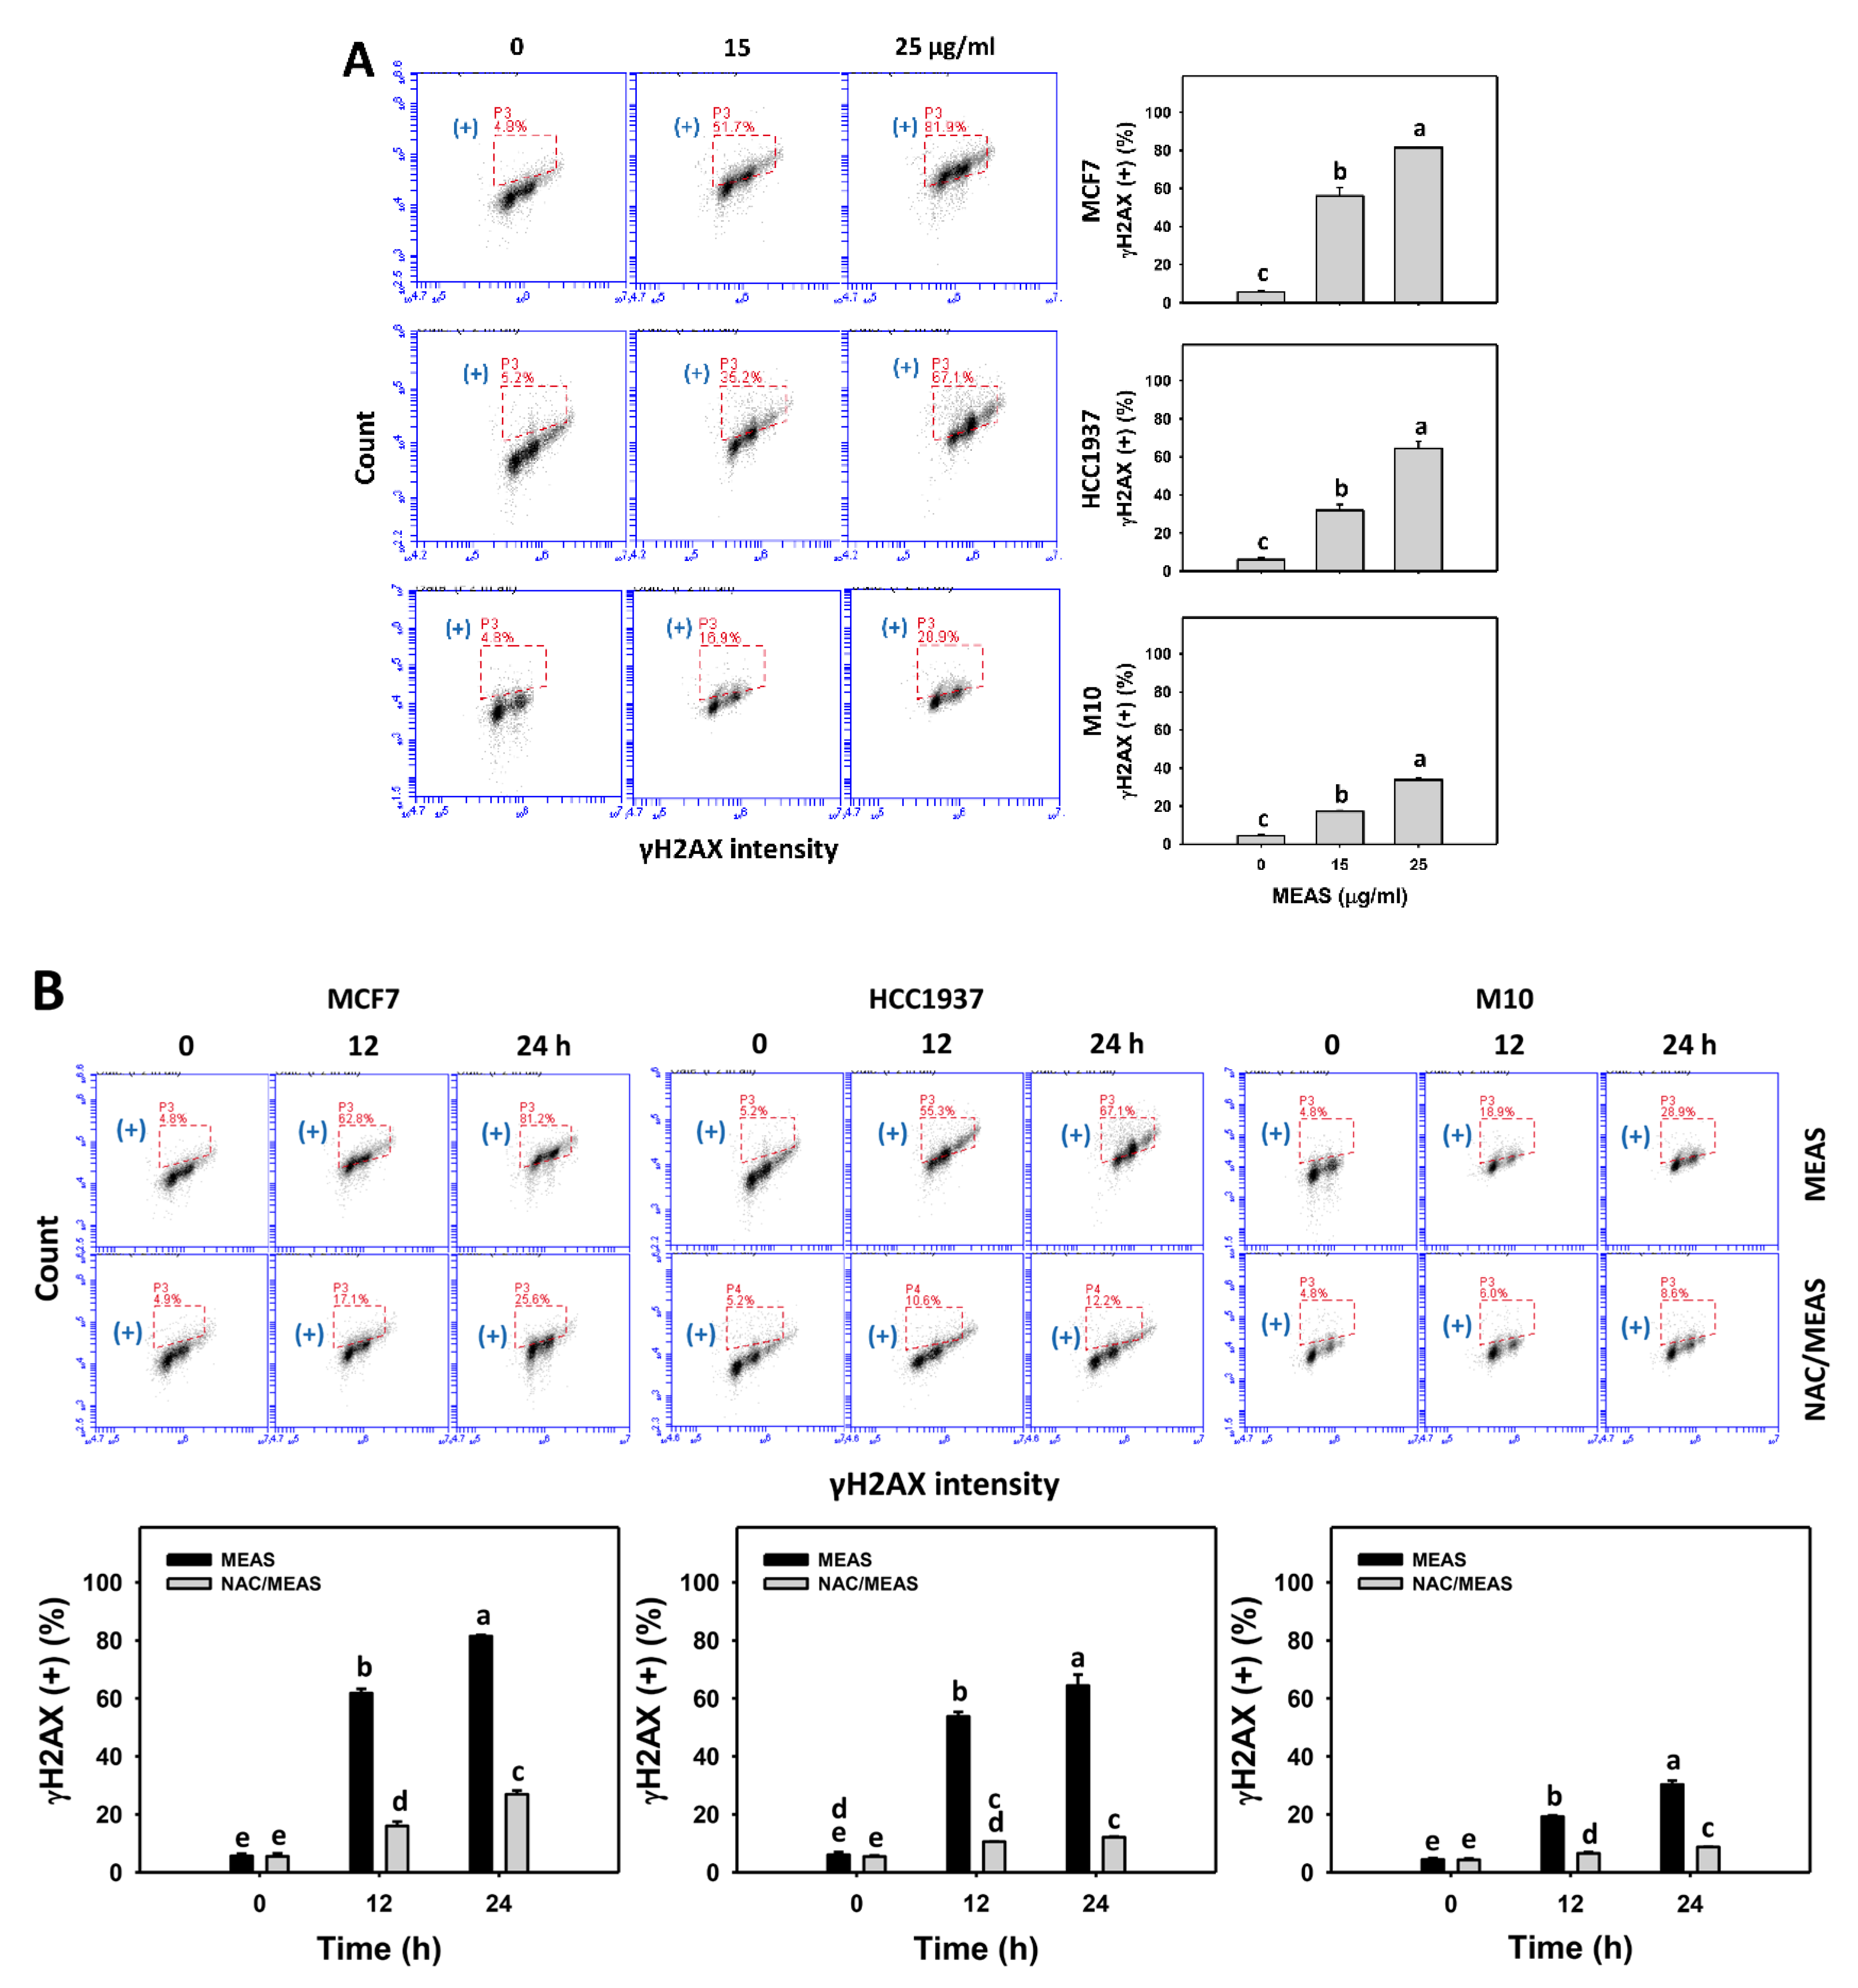
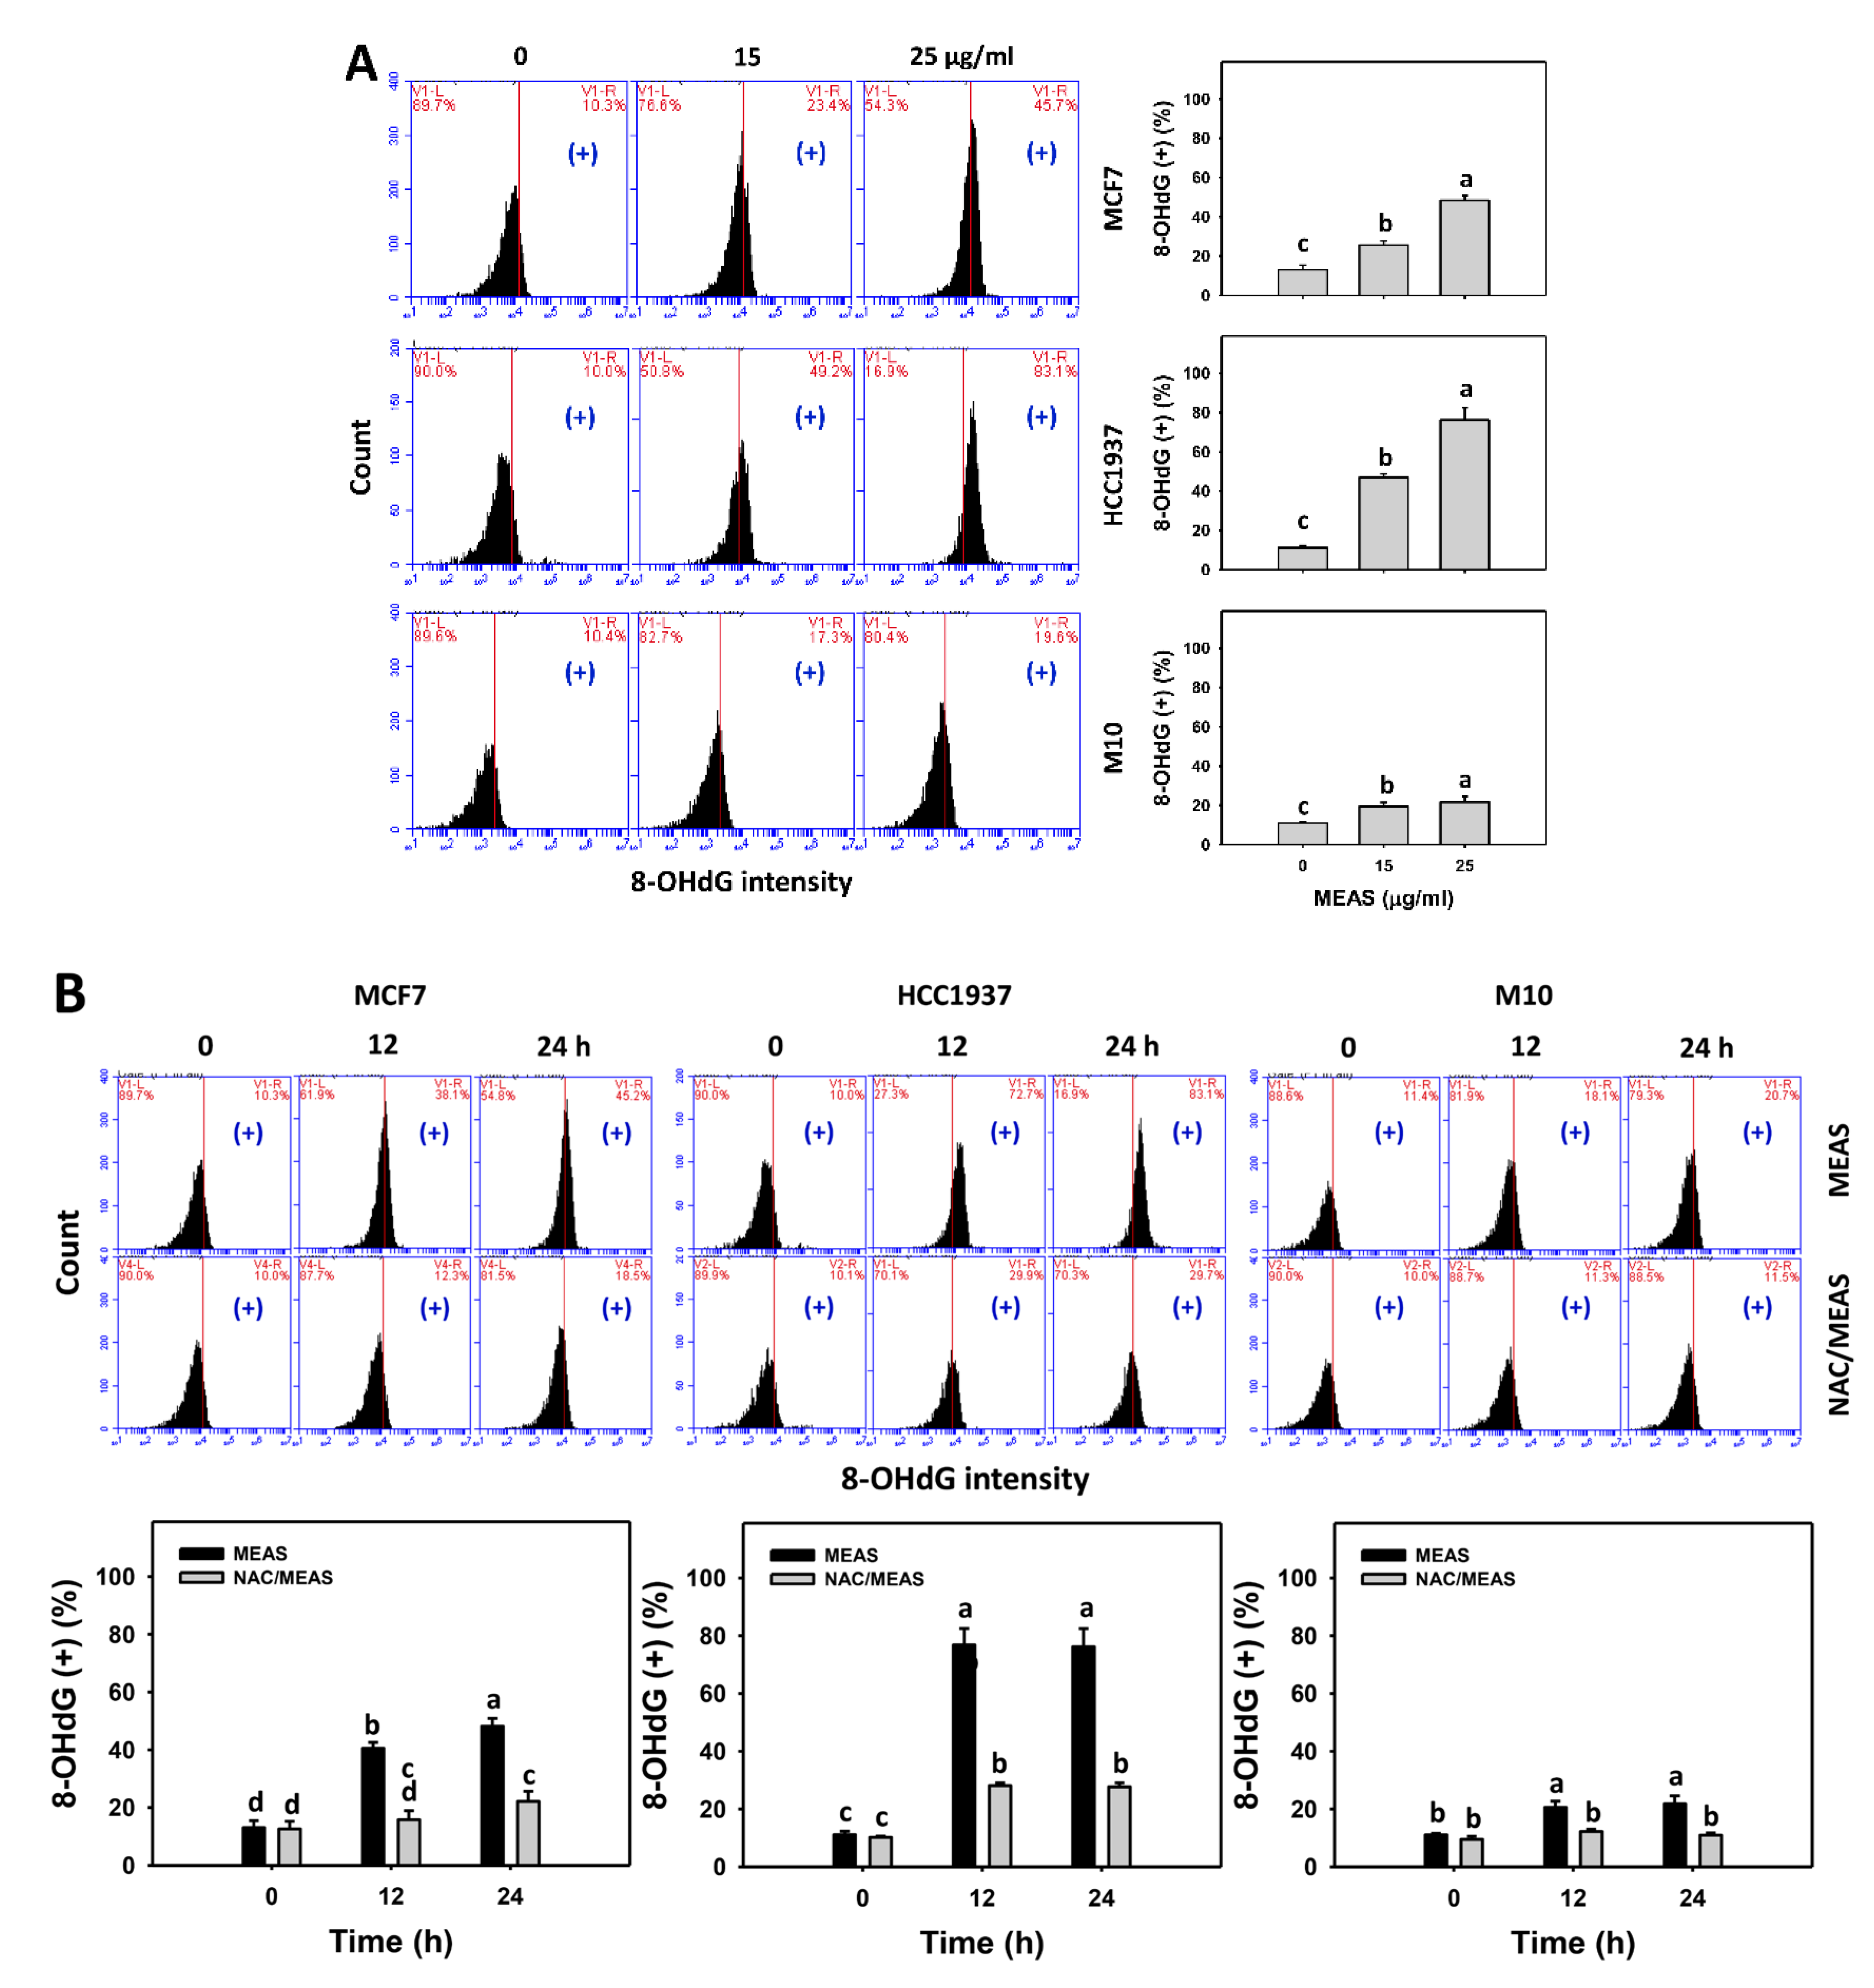
2.9. DNA Damages Status of MEAS-Treated Breast Cancer and Normal Cells
3. Discussion
4. Materials and Methods
4.1. Sample Collection and Identification
4.2. Sample Preparation
4.3. Isolation of Aaptamine
4.4. HPLC Analysis of A. suberitoides
4.5. Cell Cultures and Inhibitors
4.6. Cell Viability
4.7. Cell Cycle
4.8. Apoptosis
4.9. Oxidative Stress
4.10. DNA Damages
4.11. Statistical Analysis
5. Conclusions
Supplementary Materials
Author Contributions
Funding
Institutional Review Board Statement
Informed Consent Statement
Data Availability Statement
Conflicts of Interest
References
- Siegel, R.L.; Miller, K.D.; Fuchs, H.E.; Jemal, A. Cancer statistics, 2021. CA Cancer J. Clin. 2021, 71, 7–33. [Google Scholar] [CrossRef]
- Waks, A.G.; Winer, E.P. Breast cancer treatment: A review. JAMA 2019, 321, 288–300. [Google Scholar] [CrossRef]
- McCann, K.E.; Hurvitz, S.A.; McAndrew, N. Advances in targeted therapies for triple-negative breast cancer. Drugs 2019, 79, 1217–1230. [Google Scholar] [CrossRef]
- Mehbub, M.F.; Lei, J.; Franco, C.; Zhang, W. Marine sponge derived natural products between 2001 and 2010: Trends and opportunities for discovery of bioactives. Mar. Drugs 2014, 12, 4539–4577. [Google Scholar] [CrossRef] [Green Version]
- Mehbub, M.F.; Perkins, M.V.; Zhang, W.; Franco, C.M.M. New marine natural products from sponges (Porifera) of the order Dictyoceratida (2001 to 2012); A promising source for drug discovery, exploration and future prospects. Biotechnol. Adv. 2016, 34, 473–491. [Google Scholar] [CrossRef]
- Calcabrini, C.; Catanzaro, E.; Bishayee, A.; Turrini, E.; Fimognari, C. Marine sponge natural products with anticancer potential: An updated review. Mar. Drugs 2017, 15, 310. [Google Scholar] [CrossRef] [Green Version]
- Varijakzhan, D.; Loh, J.Y.; Yap, W.S.; Yusoff, K.; Seboussi, R.; Lim, S.E.; Lai, K.S.; Chong, C.M. Bioactive compounds from marine sponges: Fundamentals and applications. Mar. Drugs 2021, 19, 246. [Google Scholar] [CrossRef]
- Perdicaris, S.; Vlachogianni, T.; Valavanidis, A. Bioactive natural substances from marine sponges: New developments and prospects for future pharmaceuticals. Nat. Prod. Chem. Res. 2013, 1, 114. [Google Scholar] [CrossRef]
- El-Damhougy, K.; El-Naggar, H.A.; Ibrahim, H.; Bashar, M.A.; Abou-Senna, F.M. Biological activities of some marine sponge extracts from Aqaba Gulf, Red Sea, Egypt. Int. J. Fish. Aquat. Stud. 2017, 5, 652–659. [Google Scholar]
- Ottinger, S.; Kloppel, A.; Rausch, V.; Liu, L.; Kallifatidis, G.; Gross, W.; Gebhard, M.M.; Brummer, F.; Herr, I. Targeting of pancreatic and prostate cancer stem cell characteristics by Crambe crambe marine sponge extract. Int. J. Cancer 2012, 130, 1671–1681. [Google Scholar] [CrossRef]
- Choi, K.; Lim, H.K.; Oh, S.R.; Chung, W.H.; Jung, J. Anticancer effects of the marine sponge Lipastrotethya sp. extract on wild-type and p53 knockout HCT116 cells. Evid. Based Complement. Altern. Med. 2017, 2017, 7174858. [Google Scholar] [CrossRef] [PubMed]
- Bashari, M.H.; Fadhil, M.; Aulia, Y.; Sari, A.K.; Putri, T.; Qomarilla, N.; Atmaja, H.; Sudji, I.R.; Ariyanto, E.F.; Indrati, A.R.; et al. The ethyl acetate fraction of marine sponge Stylissa carteri induces breast cancer cell death via upregulation of Mcl-1S: An in vitro study. Asian Pac. J. Cancer Prev. 2022, 23, 1653–1660. [Google Scholar] [CrossRef] [PubMed]
- Han, N.; Li, J.; Li, X. Natural marine products: Anti-colorectal cancer in vitro and in vivo. Mar. Drugs 2022, 20, 349. [Google Scholar] [CrossRef] [PubMed]
- Yu, H.B.; Yang, F.; Sun, F.; Ma, G.Y.; Gan, J.H.; Hu, W.Z.; Han, B.N.; Jiao, W.H.; Lin, H.W. Cytotoxic aaptamine derivatives from the South China Sea sponge Aaptos aaptos. J. Nat. Prod. 2014, 77, 2124–2129. [Google Scholar] [CrossRef]
- Bashari, M.H.; Arsydinilhuda, F.Z.; Ilhamsyah, R.S.; Nugrahani, A.D.; Nurdin, R.A.; Kartika, A.; Huda, F.; Abdurahman, M.; Putri, T.; Qomarilla, N.; et al. The ethanol extract of marine sponge Aaptos suberitoides suppress cell viability, cell proliferation and cell migration in HER2-positive breast cancer cell line. Asian Pac. J. Cancer Prev. 2021, 22, 25–32. [Google Scholar] [CrossRef]
- Farooq Khan, M.; Nasr, F.A.; Baabbad, A.A.; Alqahtani, A.S.; Wadaan, M.A. Investigating the anticancer activity and characterization of bioactive constituents of Moricandia sinaica (Boiss.) Boiss through in vitro and in silico approaches in triple-negative breast cancer cell line. Appl. Sci. 2021, 11, 1244. [Google Scholar] [CrossRef]
- Mioso, R.; Marante, F.J.; Bezerra, R.S.; Borges, F.V.; Santos, B.V.; Laguna, I.H. Cytotoxic compounds derived from marine sponges. A review (2010–2012). Molecules 2017, 22, 208. [Google Scholar] [CrossRef] [Green Version]
- Calcul, L.; Longeon, A.; Al Mourabit, A.; Guyot, M.; Bourguet-Kondracki, M.-L. Novel alkaloids of the aaptamine class from an Indonesian marine sponge of the genus Xestospongia. Tetrahedron 2003, 59, 6539–6544. [Google Scholar] [CrossRef]
- Wang, N.; Ren, D.; Deng, S.; Yang, X. Differential effects of baicalein and its sulfated derivatives in inhibiting proliferation of human breast cancer MCF-7 cells. Chem. Biol. Interact. 2014, 221, 99–108. [Google Scholar] [CrossRef]
- Yen, M.C.; Chou, S.K.; Kan, J.Y.; Kuo, P.L.; Hou, M.F.; Hsu, Y.L. New insight on solute carrier family 27 member 6 (SLC27A6) in tumoral and non-tumoral breast cells. Int. J. Med. Sci. 2019, 16, 366–375. [Google Scholar] [CrossRef] [Green Version]
- Jao, H.Y.; Chang, F.R.; Cheng, C.W.; Liang, H.W.; Wang, C.J.; Lee, H.J. Silybum marianum seed disrupts mitosis by reducing polo-like kinase 1 in breast cancer cells. Phytomed. Plus 2022, 2, 100164. [Google Scholar] [CrossRef]
- Kim, G.Y.; Kim, W.J.; Choi, Y.H. Pectenotoxin-2 from marine sponges: A potential anti-cancer agent—A review. Mar. Drugs 2011, 9, 2176–2187. [Google Scholar] [CrossRef] [PubMed] [Green Version]
- Dyshlovoy, S.A.; Honecker, F. Marine compounds and cancer: Updates 2020. Mar. Drugs 2020, 18, 643. [Google Scholar] [CrossRef]
- Kumar, M.S.; Adki, K.M. Marine natural products for multi-targeted cancer treatment: A future insight. Biomed. Pharm. 2018, 105, 233–245. [Google Scholar] [CrossRef] [PubMed]
- Ciftci, H.I.; Can, M.; Ellakwa, D.E.; Suner, S.C.; Ibrahim, M.A.; Oral, A.; Sekeroglu, N.; Ozalp, B.; Otsuka, M.; Fujita, M.; et al. Anticancer activity of Turkish marine extracts: A purple sponge extract induces apoptosis with multitarget kinase inhibition activity. Invest. New Drugs 2020, 38, 1326–1333. [Google Scholar] [CrossRef] [PubMed]
- He, L.; He, T.; Farrar, S.; Ji, L.; Liu, T.; Ma, X. Antioxidants maintain cellular redox homeostasis by elimination of reactive oxygen species. Cell. Physiol. Biochem. 2017, 44, 532–553. [Google Scholar] [CrossRef] [PubMed]
- Snezhkina, A.V.; Kudryavtseva, A.V.; Kardymon, O.L.; Savvateeva, M.V.; Melnikova, N.V.; Krasnov, G.S.; Dmitriev, A.A. ROS generation and antioxidant defense systems in normal and malignant cells. Oxid. Med. Cell. Longev. 2019, 2019, 6175804. [Google Scholar] [CrossRef] [Green Version]
- Khan, M.; Yi, F.; Rasul, A.; Li, T.; Wang, N.; Gao, H.; Gao, R.; Ma, T. Alantolactone induces apoptosis in glioblastoma cells via GSH depletion, ROS generation, and mitochondrial dysfunction. IUBMB Life 2012, 64, 783–794. [Google Scholar] [CrossRef]
- Shiau, J.P.; Chuang, Y.T.; Yang, K.H.; Chang, F.R.; Sheu, J.H.; Hou, M.F.; Jeng, J.H.; Tang, J.Y.; Chang, H.W. Brown algae-derived fucoidan exerts oxidative stress-dependent antiproliferation on oral cancer cells. Antioxidants 2022, 11, 841. [Google Scholar] [CrossRef]
- Rady, H.M.; Hassan, A.Z.; Salem, S.M.; Mohamed, T.K.; Esmaiel, N.N.; Ez-El-Arab, M.A.; Ibrahim, M.A.; Fouda, F.K. Induction of apoptosis and cell cycle arrest by Negombata magnifica sponge in hepatocellular carcinoma. Med. Chem. Res. 2016, 25, 456–465. [Google Scholar] [CrossRef]
- Bae, W.; Lim, H.K.; Kim, K.M.; Cho, H.; Lee, S.Y.; Jeong, C.S.; Lee, H.S.; Jung, J. Apoptosis-inducing activity of marine sponge Haliclona sp. Extracts collected from kosrae in nonsmall cell lung cancer A549 cells. Evid. Based Complement. Altern. Med. 2015, 2015, 717959. [Google Scholar] [CrossRef] [PubMed]
- Annamalai, P.; Thayman, M.; Rajan, S.; Raman, L.S.; Ramasubbu, S.; Perumal, P. Ethyl acetate extract from marine sponge Hyattella cribriformis exhibit potent anticancer activity by promoting tubulin polymerization as evidenced mitotic arrest and induction of apoptosis. Pharmacogn. Mag. 2015, 11, 345. [Google Scholar] [PubMed] [Green Version]
- Muthiyan, R.; Nambikkairaj, B.; Mahanta, N.; Immanuel, T.; Mandal, R.S.; Kumaran, K.; De, A.K. Antiproliferative and proapoptotic activities of marine sponge Hyrtios erectus extract on breast carcinoma cell line (MCF-7). Pharmacogn. Mag. 2017, 13, S41–S47. [Google Scholar] [PubMed]
- Kajstura, M.; Halicka, H.D.; Pryjma, J.; Darzynkiewicz, Z. Discontinuous fragmentation of nuclear DNA during apoptosis revealed by discrete “sub-G1” peaks on DNA content histograms. Cytom. A 2007, 71, 125–131. [Google Scholar] [CrossRef]
- Chen, B.H.; Chang, H.W.; Huang, H.M.; Chong, I.W.; Chen, J.S.; Chen, C.Y.; Wang, H.M. (−)-Anonaine induces DNA damage and inhibits growth and migration of human lung carcinoma h1299 cells. J. Agric. Food Chem. 2011, 59, 2284–2290. [Google Scholar] [CrossRef]
- Yang, F.; Gao, Y.; Chang, Y.T.; Zou, Y.K.; Houk, K.N.; Lu, J.R.; He, J.; Tang, W.Z.; Liao, H.Z.; Han, H.; et al. Aromatic ring substituted aaptamine analogues as potential cytotoxic agents against extranodal natural killer/T-cell lymphoma. J. Nat. Prod. 2020, 83, 3758–3763. [Google Scholar] [CrossRef]
- Holliday, D.L.; Speirs, V. Choosing the right cell line for breast cancer research. Breast Cancer Res. 2011, 13, 215. [Google Scholar] [CrossRef] [Green Version]
- Chavez, K.J.; Garimella, S.V.; Lipkowitz, S. Triple negative breast cancer cell lines: One tool in the search for better treatment of triple negative breast cancer. Breast Dis. 2010, 32, 35–48. [Google Scholar] [CrossRef] [Green Version]
- Lee, H.Z.; Liu, W.Z.; Hsieh, W.T.; Tang, F.Y.; Chung, J.G.; Leung, H.W. Oxidative stress involvement in Physalis angulata-induced apoptosis in human oral cancer cells. Food Chem. Toxicol. 2009, 47, 561–570. [Google Scholar] [CrossRef]
- Wang, T.S.; Lin, C.P.; Chen, Y.P.; Chao, M.R.; Li, C.C.; Liu, K.L. CYP450-mediated mitochondrial ROS production involved in arecoline N-oxide-induced oxidative damage in liver cell lines. Environ. Toxicol. 2018, 33, 1029–1038. [Google Scholar] [CrossRef]
- Liu, Y.C.; Peng, B.R.; Hsu, K.C.; El-Shazly, M.; Shih, S.P.; Lin, T.E.; Kuo, F.W.; Chou, Y.C.; Lin, H.Y.; Lu, M.C. 13-Acetoxysarcocrassolide exhibits cytotoxic activity against oral cancer cells through the interruption of the Keap1/Nrf2/p62/SQSTM1 pathway: The need to move beyond classical concepts. Mar. Drugs 2020, 18, 382. [Google Scholar] [CrossRef] [PubMed]
- Chang, C.C.; Kuan, C.P.; Lin, J.Y.; Lai, J.S.; Ho, T.F. Tanshinone IIA facilitates TRAIL sensitization by up-regulating DR5 through the ROS-JNK-CHOP signaling axis in human ovarian carcinoma cell lines. Chem. Res. Toxicol. 2015, 28, 1574–1583. [Google Scholar] [CrossRef] [PubMed]
- Vignon, C.; Debeissat, C.; Georget, M.T.; Bouscary, D.; Gyan, E.; Rosset, P.; Herault, O. Flow cytometric quantification of all phases of the cell cycle and apoptosis in a two-color fluorescence plot. PLoS ONE 2013, 8, e68425. [Google Scholar] [CrossRef] [Green Version]
- Carbonari, M. New use for an old reagent: Cell cycle analysis of DNA content using flow cytometry in formamide treated cells. Cytom. Part A 2016, 89, 498–503. [Google Scholar] [CrossRef] [Green Version]
- Huang, H.W.; Tang, J.Y.; Ou-Yang, F.; Wang, H.R.; Guan, P.Y.; Huang, C.Y.; Chen, C.Y.; Hou, M.F.; Sheu, J.H.; Chang, H.W. Sinularin selectively kills breast cancer cells showing G2/M arrest, apoptosis, and oxidative DNA damage. Molecules 2018, 23, 849. [Google Scholar] [CrossRef] [PubMed] [Green Version]
- Wang, M.; Wang, J.; Liu, M.; Chen, G. Fluvastatin protects neuronal cells from hydrogen peroxide-induced toxicity with decreasing oxidative damage and increasing PI3K/Akt/mTOR signalling. J. Pharm. Pharmacol. 2021, 73, 515–521. [Google Scholar] [CrossRef] [PubMed]
- Lin, C.H.; Chan, H.S.; Tsay, H.S.; Funayama, S.; Kuo, C.L.; Chung, J.G. Ethyl acetate fraction from methanol extraction of Vitis thunbergii var. taiwaniana induced G0 /G1 phase arrest via inhibition of cyclins D and E and induction of apoptosis through caspase-dependent and -independent pathways in human prostate carcinoma DU145 cells. Environ. Toxicol. 2018, 33, 41–51. [Google Scholar]
- Fan, H.C.; Hsieh, Y.C.; Li, L.H.; Chang, C.C.; Janouskova, K.; Ramani, M.V.; Subbaraju, G.V.; Cheng, K.T.; Chang, C.C. Dehydroxyhispolon methyl ether, a hispolon derivative, inhibits WNT/beta-catenin signaling to elicit human colorectal carcinoma cell apoptosis. Int. J. Mol. Sci. 2020, 21, 8839. [Google Scholar] [CrossRef]
- Liu, S.L.; Yang, K.H.; Yang, C.W.; Lee, M.Y.; Chuang, Y.T.; Chen, Y.N.; Chang, F.R.; Chen, C.Y.; Chang, H.W. Burmannic acid inhibits proliferation and induces oxidative stress response of oral cancer cells. Antioxidants 2021, 10, 1588. [Google Scholar] [CrossRef]
- Wu, C.F.; Lee, M.G.; El-Shazly, M.; Lai, K.H.; Ke, S.C.; Su, C.W.; Shih, S.P.; Sung, P.J.; Hong, M.C.; Wen, Z.H.; et al. Isoaaptamine induces T-47D cells apoptosis and autophagy via oxidative stress. Mar. Drugs 2018, 16, 18. [Google Scholar] [CrossRef] [Green Version]
- Yeh, C.C.; Tseng, C.N.; Yang, J.I.; Huang, H.W.; Fang, Y.; Tang, J.Y.; Chang, F.R.; Chang, H.W. Antiproliferation and induction of apoptosis in Ca9-22 oral cancer cells by ethanolic extract of Gracilaria tenuistipitata. Molecules 2012, 17, 10916–10927. [Google Scholar] [CrossRef] [PubMed] [Green Version]
- Yang, K.H.; Lin, Y.S.; Wang, S.C.; Lee, M.Y.; Tang, J.Y.; Chang, F.R.; Chuang, Y.T.; Sheu, J.H.; Chang, H.W. Soft coral-derived dihydrosinularin exhibits antiproliferative effects associated with apoptosis and DNA damage in oral cancer cells. Pharmaceuticals 2021, 14, 994. [Google Scholar] [CrossRef] [PubMed]
- Tanaka, T.; Halicka, D.; Traganos, F.; Darzynkiewicz, Z. Cytometric analysis of DNA damage: Phosphorylation of histone H2AX as a marker of DNA double-strand breaks (DSBs). Methods Mol. Biol. 2009, 523, 161–168. [Google Scholar] [PubMed] [Green Version]
- Shih, S.P.; Lu, M.C.; El-Shazly, M.; Lin, Y.H.; Chen, C.L.; Yu, S.S.F.; Liu, Y.C. The antileukemic and anti-prostatic effect of aeroplysinin-1 is mediated through ROS-induced apoptosis via NOX activation and inhibition of HIF-1a activity. Life 2022, 12, 687. [Google Scholar] [CrossRef] [PubMed]


Publisher’s Note: MDPI stays neutral with regard to jurisdictional claims in published maps and institutional affiliations. |
© 2022 by the authors. Licensee MDPI, Basel, Switzerland. This article is an open access article distributed under the terms and conditions of the Creative Commons Attribution (CC BY) license (https://creativecommons.org/licenses/by/4.0/).
Share and Cite
Shiau, J.-P.; Lee, M.-Y.; Tang, J.-Y.; Huang, H.; Lin, Z.-Y.; Su, J.-H.; Hou, M.-F.; Cheng, Y.-B.; Chang, H.-W. Marine Sponge Aaptos suberitoides Extract Improves Antiproliferation and Apoptosis of Breast Cancer Cells without Cytotoxicity to Normal Cells In Vitro. Pharmaceuticals 2022, 15, 1575. https://doi.org/10.3390/ph15121575
Shiau J-P, Lee M-Y, Tang J-Y, Huang H, Lin Z-Y, Su J-H, Hou M-F, Cheng Y-B, Chang H-W. Marine Sponge Aaptos suberitoides Extract Improves Antiproliferation and Apoptosis of Breast Cancer Cells without Cytotoxicity to Normal Cells In Vitro. Pharmaceuticals. 2022; 15(12):1575. https://doi.org/10.3390/ph15121575
Chicago/Turabian StyleShiau, Jun-Ping, Min-Yu Lee, Jen-Yang Tang, Hsin Huang, Zheng-Yu Lin, Jui-Hsin Su, Ming-Feng Hou, Yuan-Bin Cheng, and Hsueh-Wei Chang. 2022. "Marine Sponge Aaptos suberitoides Extract Improves Antiproliferation and Apoptosis of Breast Cancer Cells without Cytotoxicity to Normal Cells In Vitro" Pharmaceuticals 15, no. 12: 1575. https://doi.org/10.3390/ph15121575