Citrulline Supplementation Improves Organ Perfusion and Arginine Availability under Conditions with Enhanced Arginase Activity

Abstract
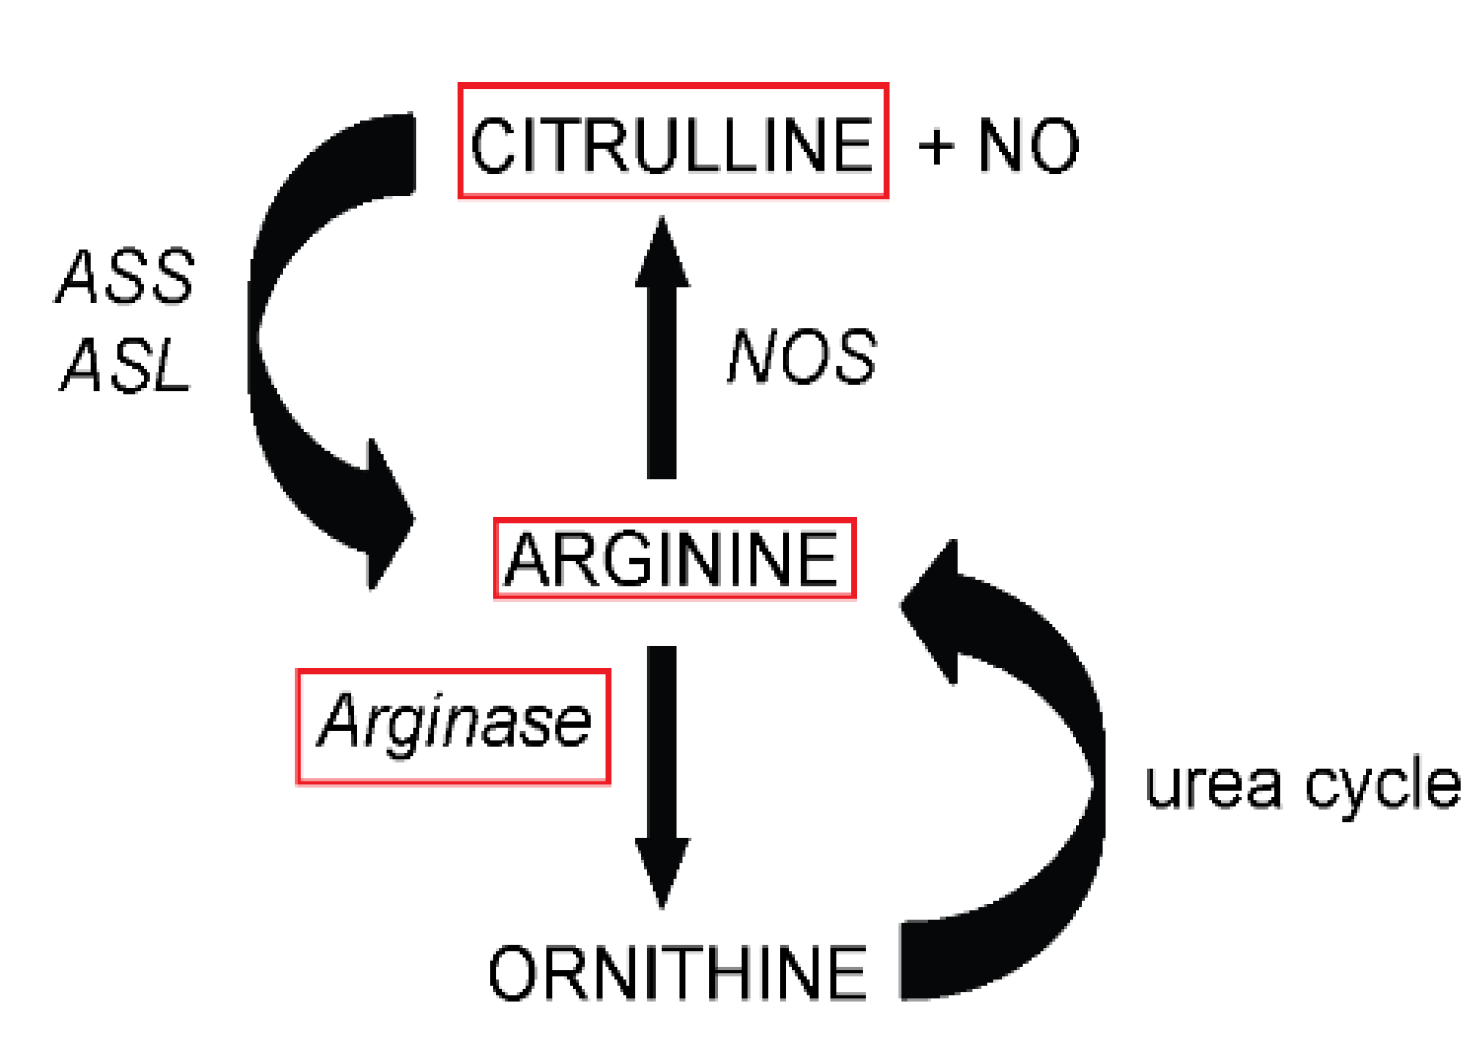
:1. Introduction
2. Material and Methods
2.1. Animals
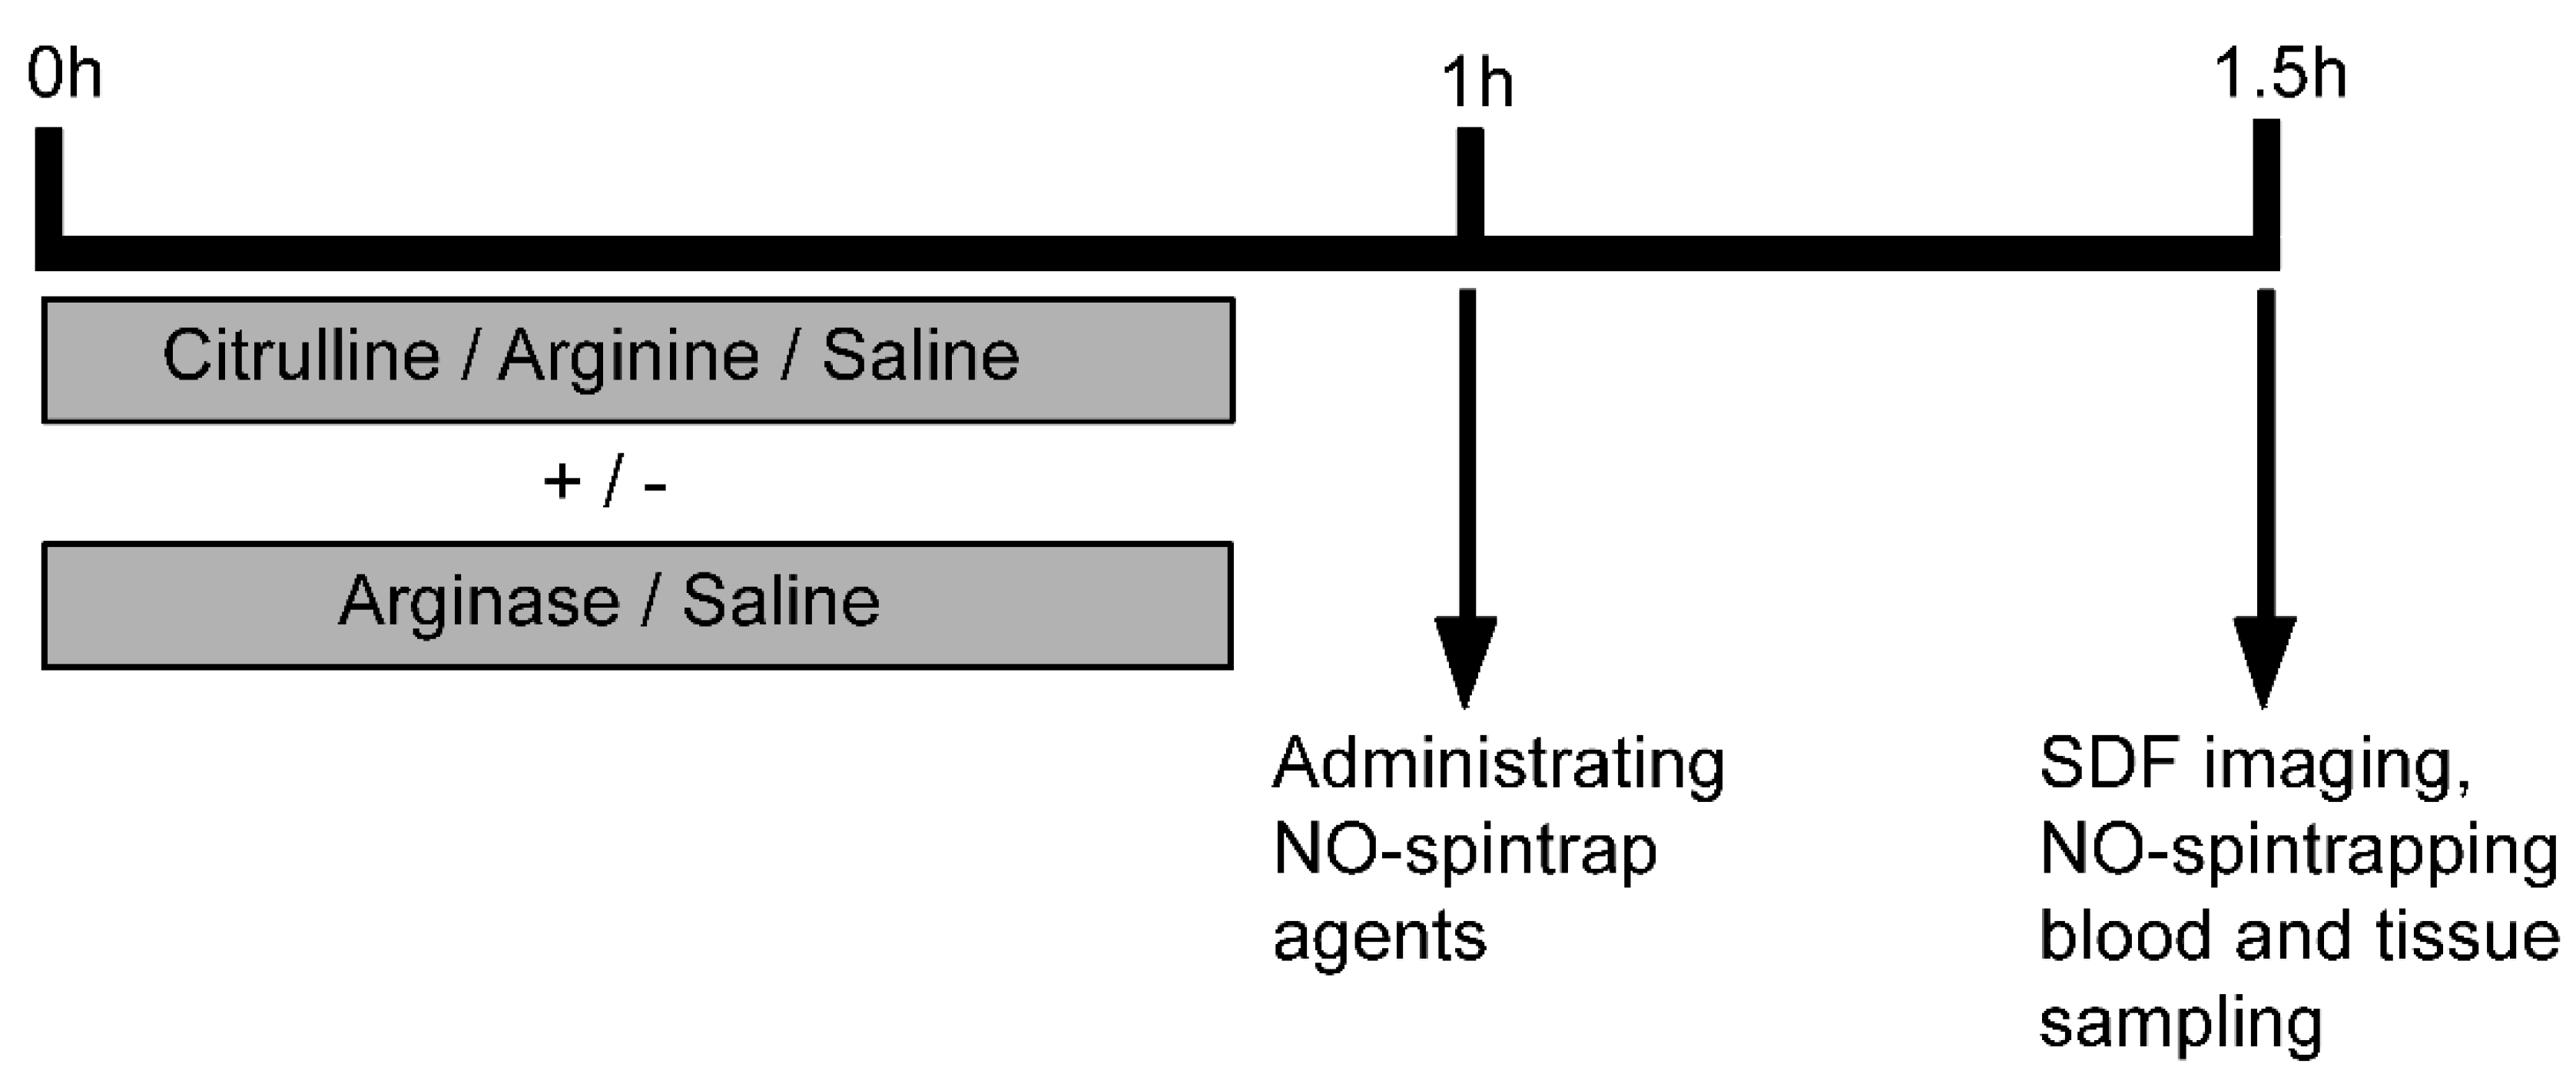
2.2. Experimental Protocol

2.3. Amino Acid Analysis

2.4. In Vivo Tissue NO Measurements
2.5. Jejunal Microcirculation Measurements with SDF Imaging
2.6. Statistical Analysis
3. Results
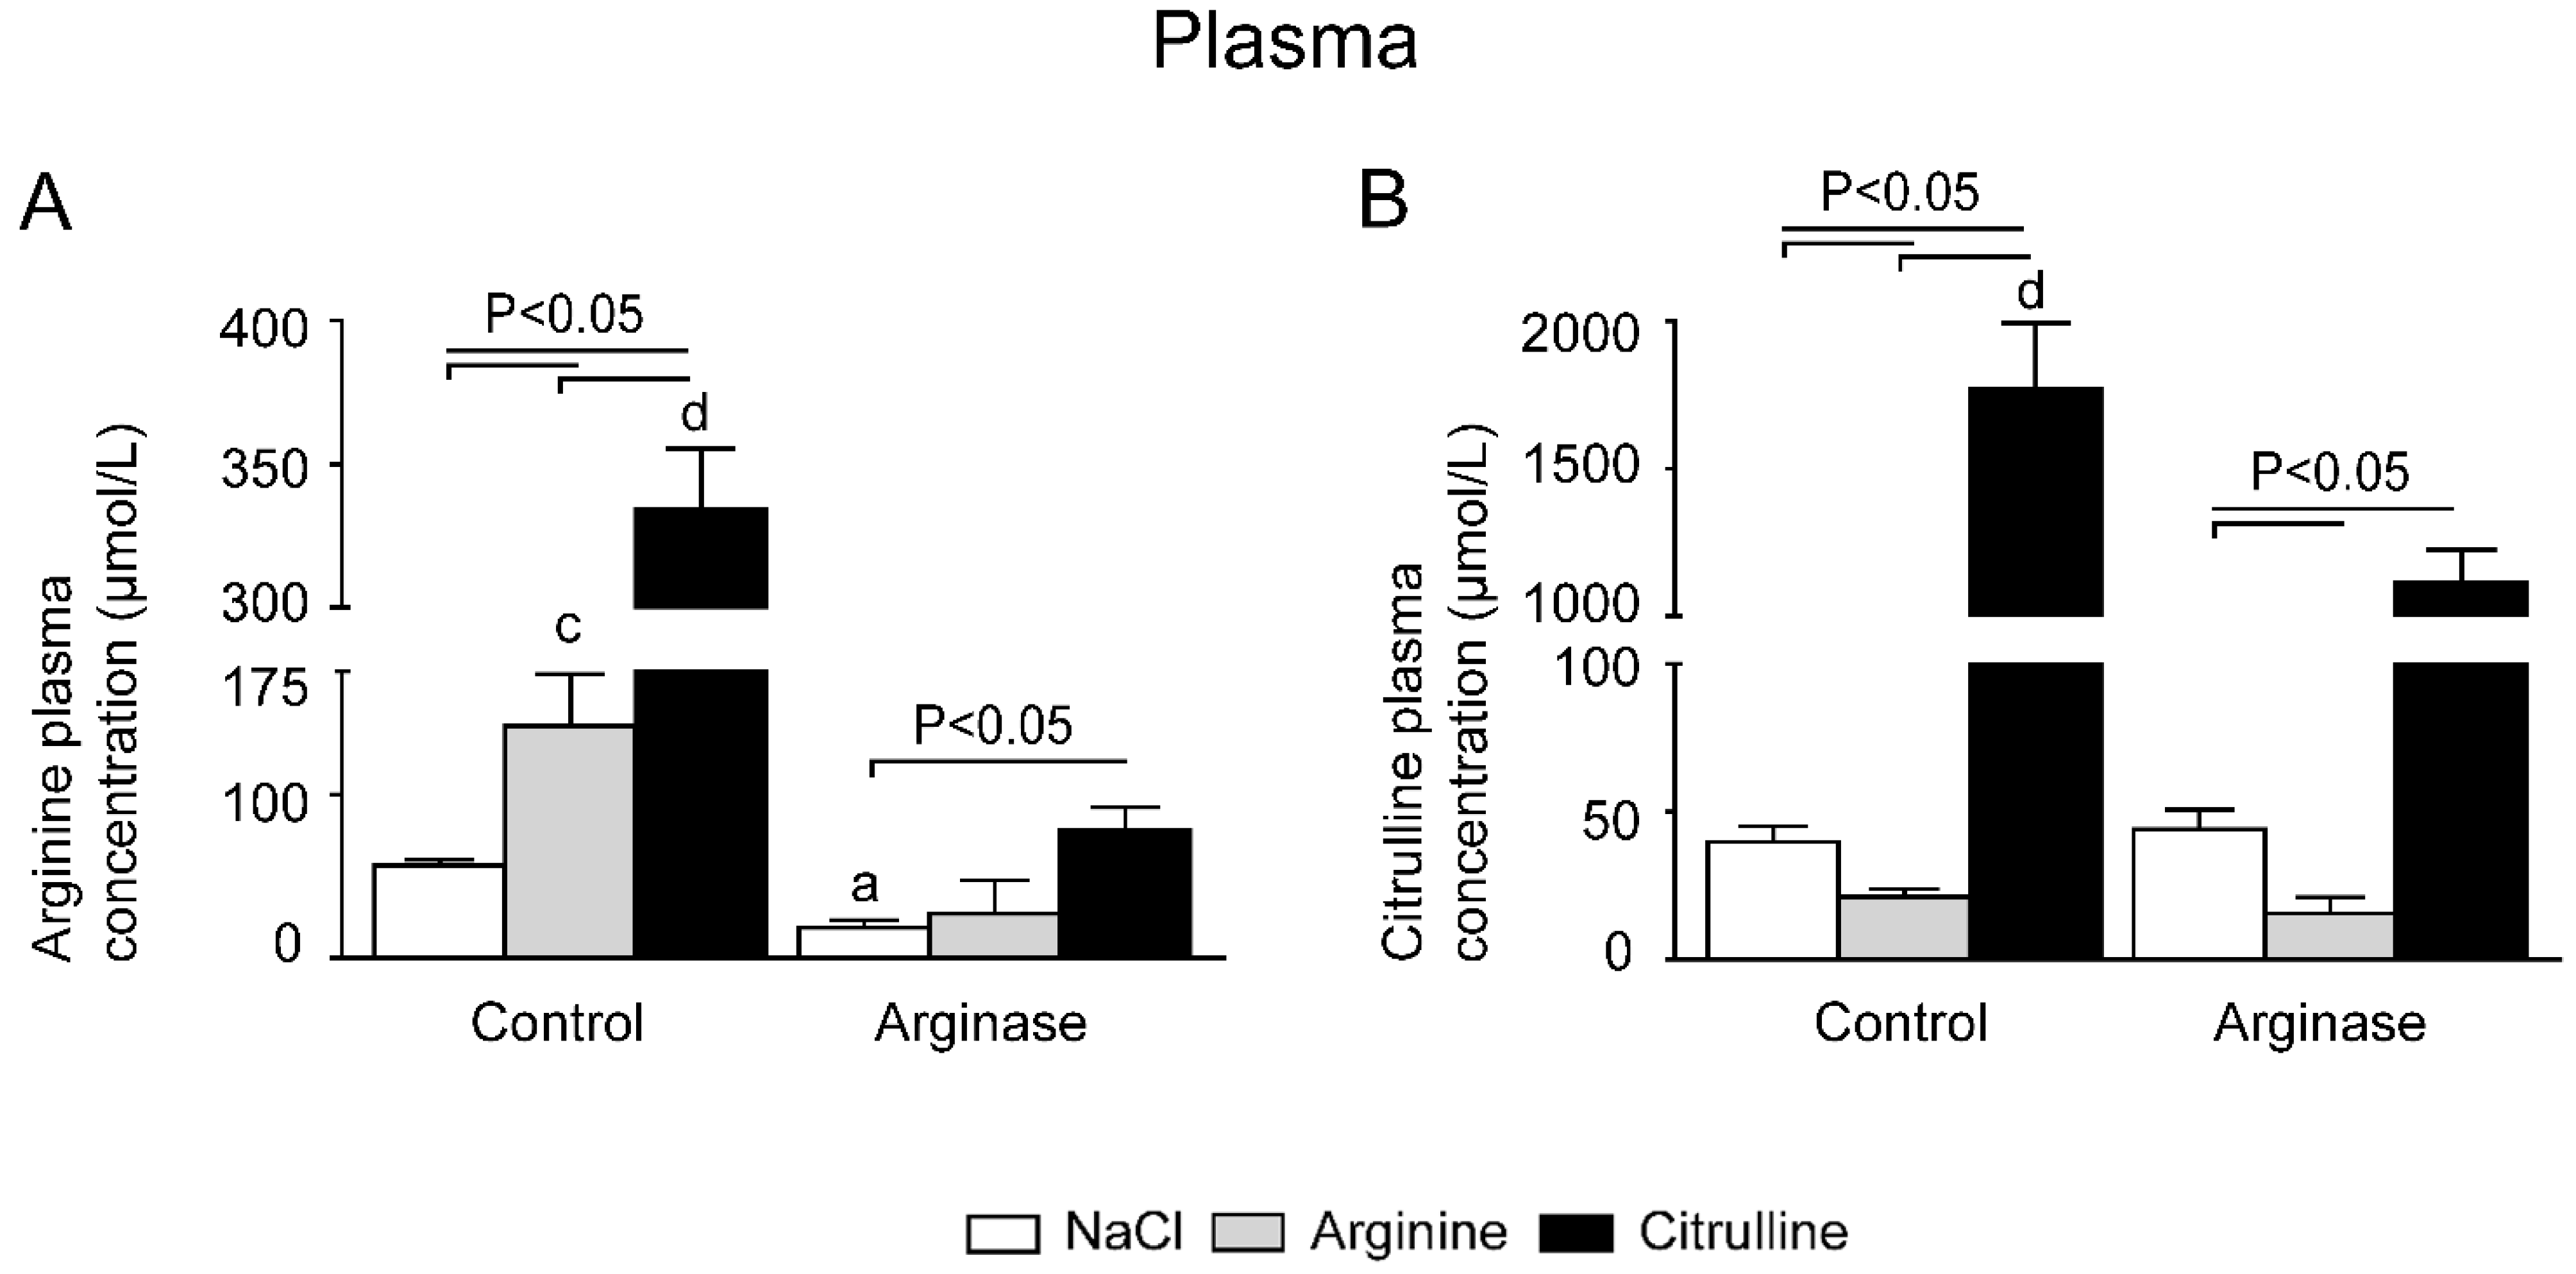
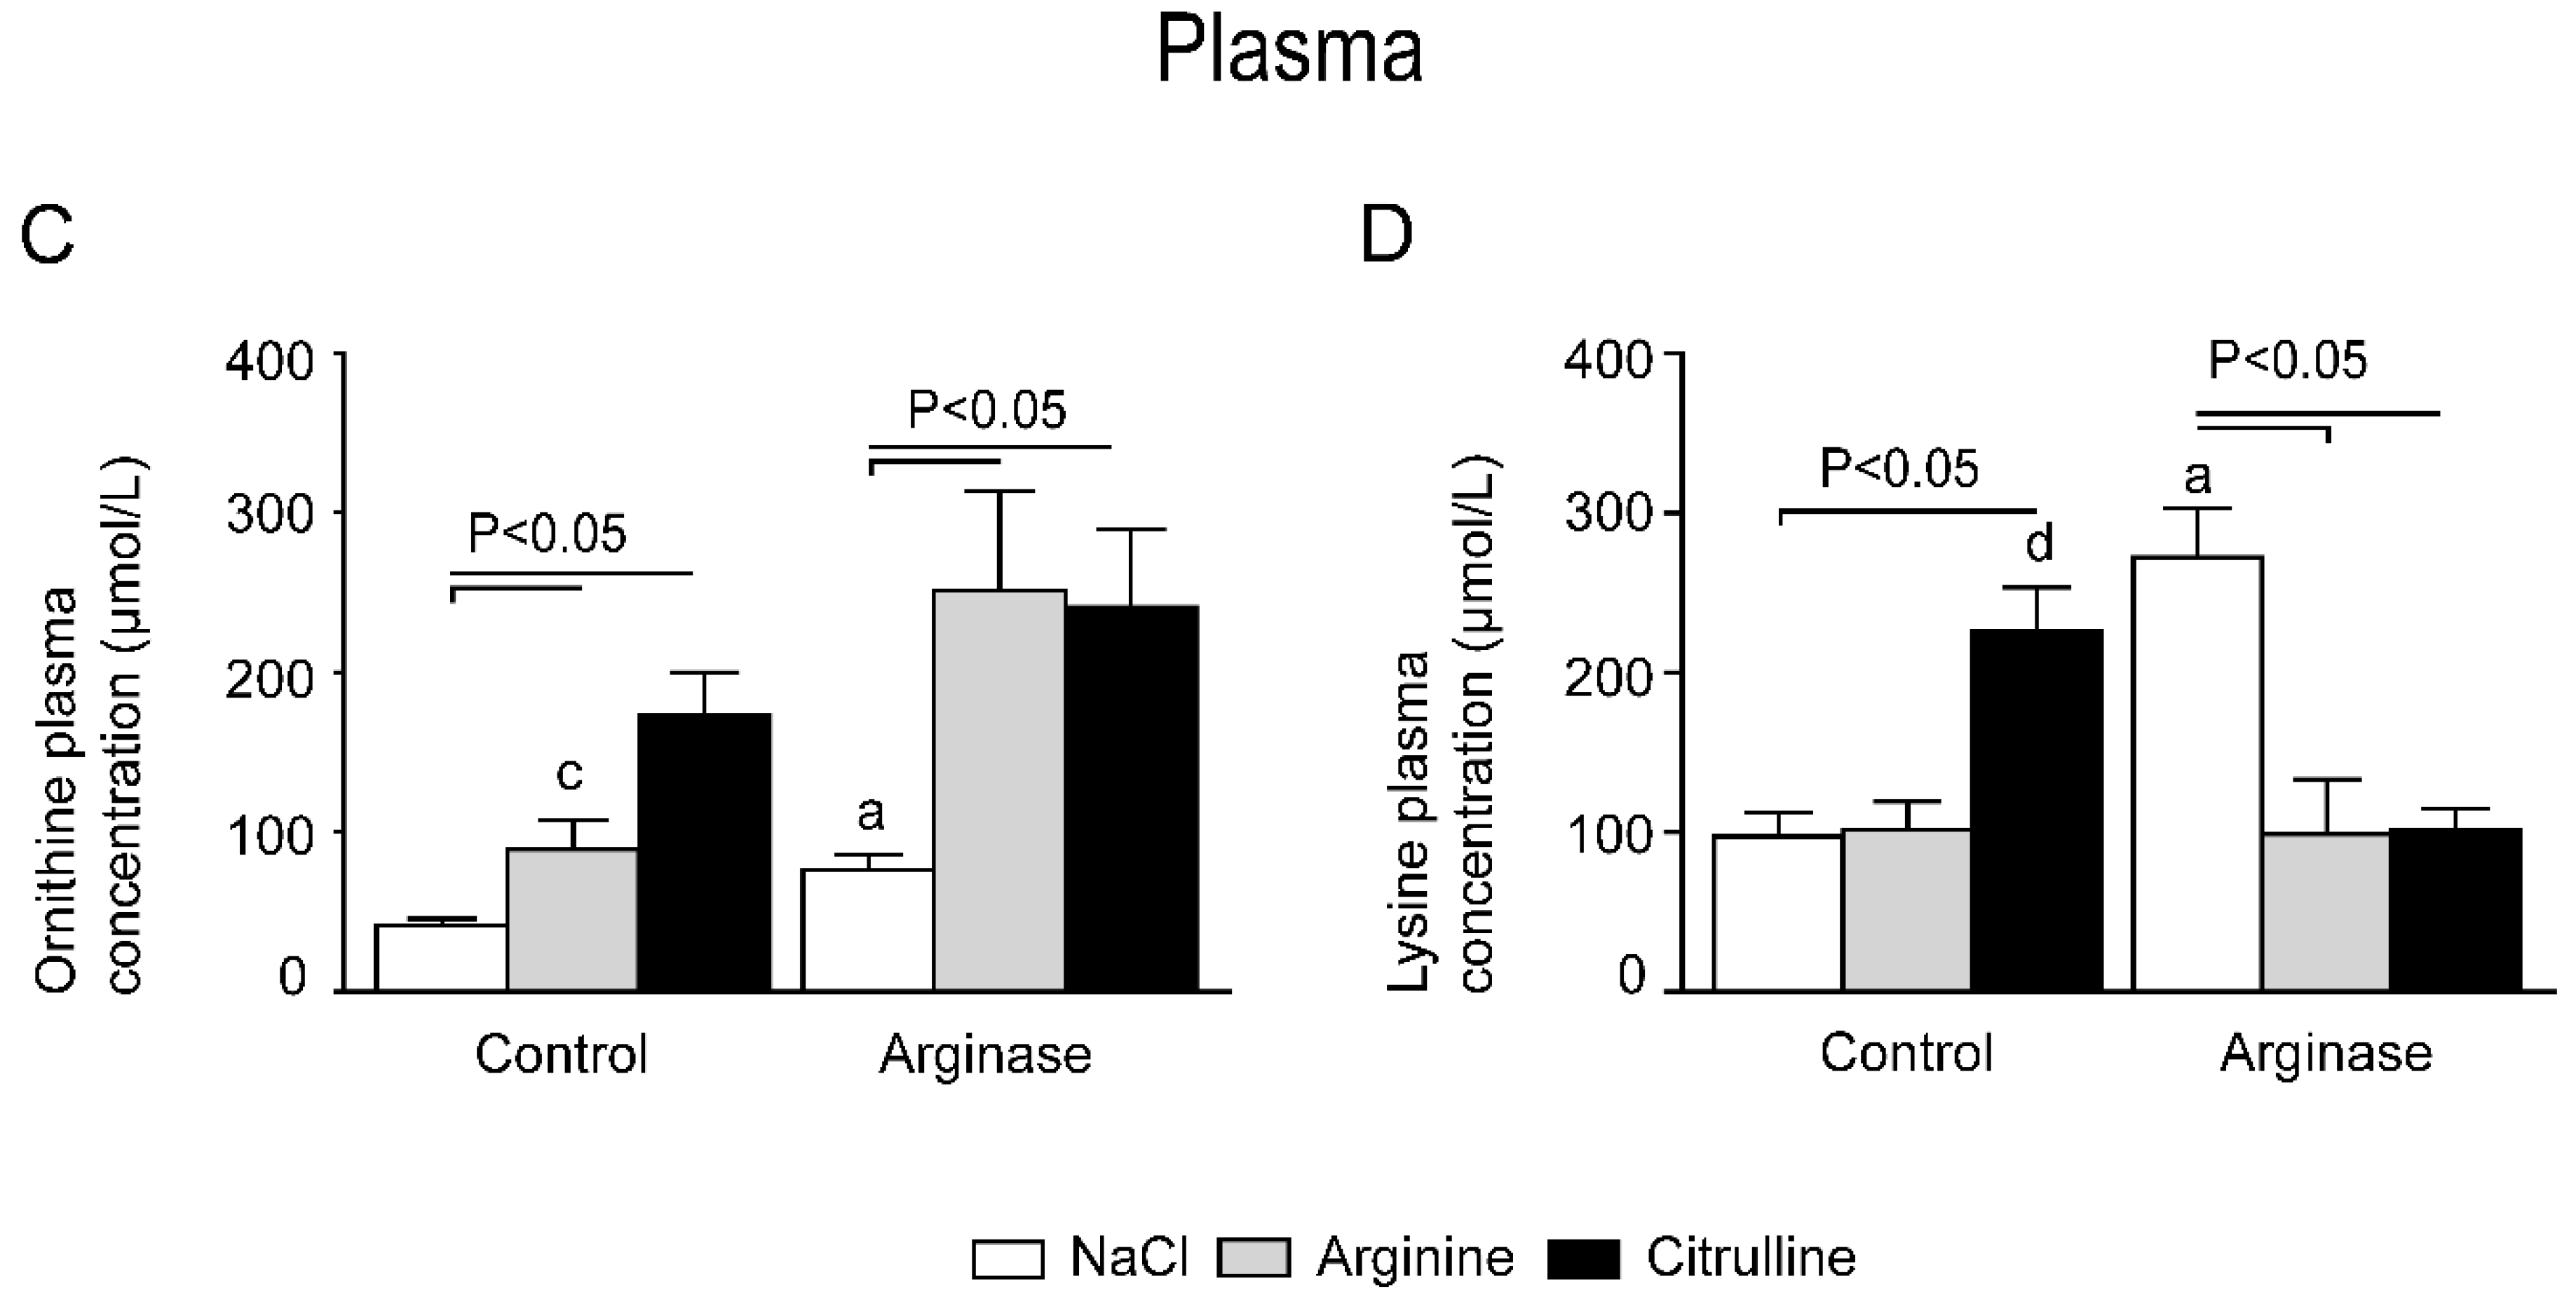
3.1. Improved Plasma Amino Acid Concentrations after Citrulline Supplementation in Arginase-Treated Animals


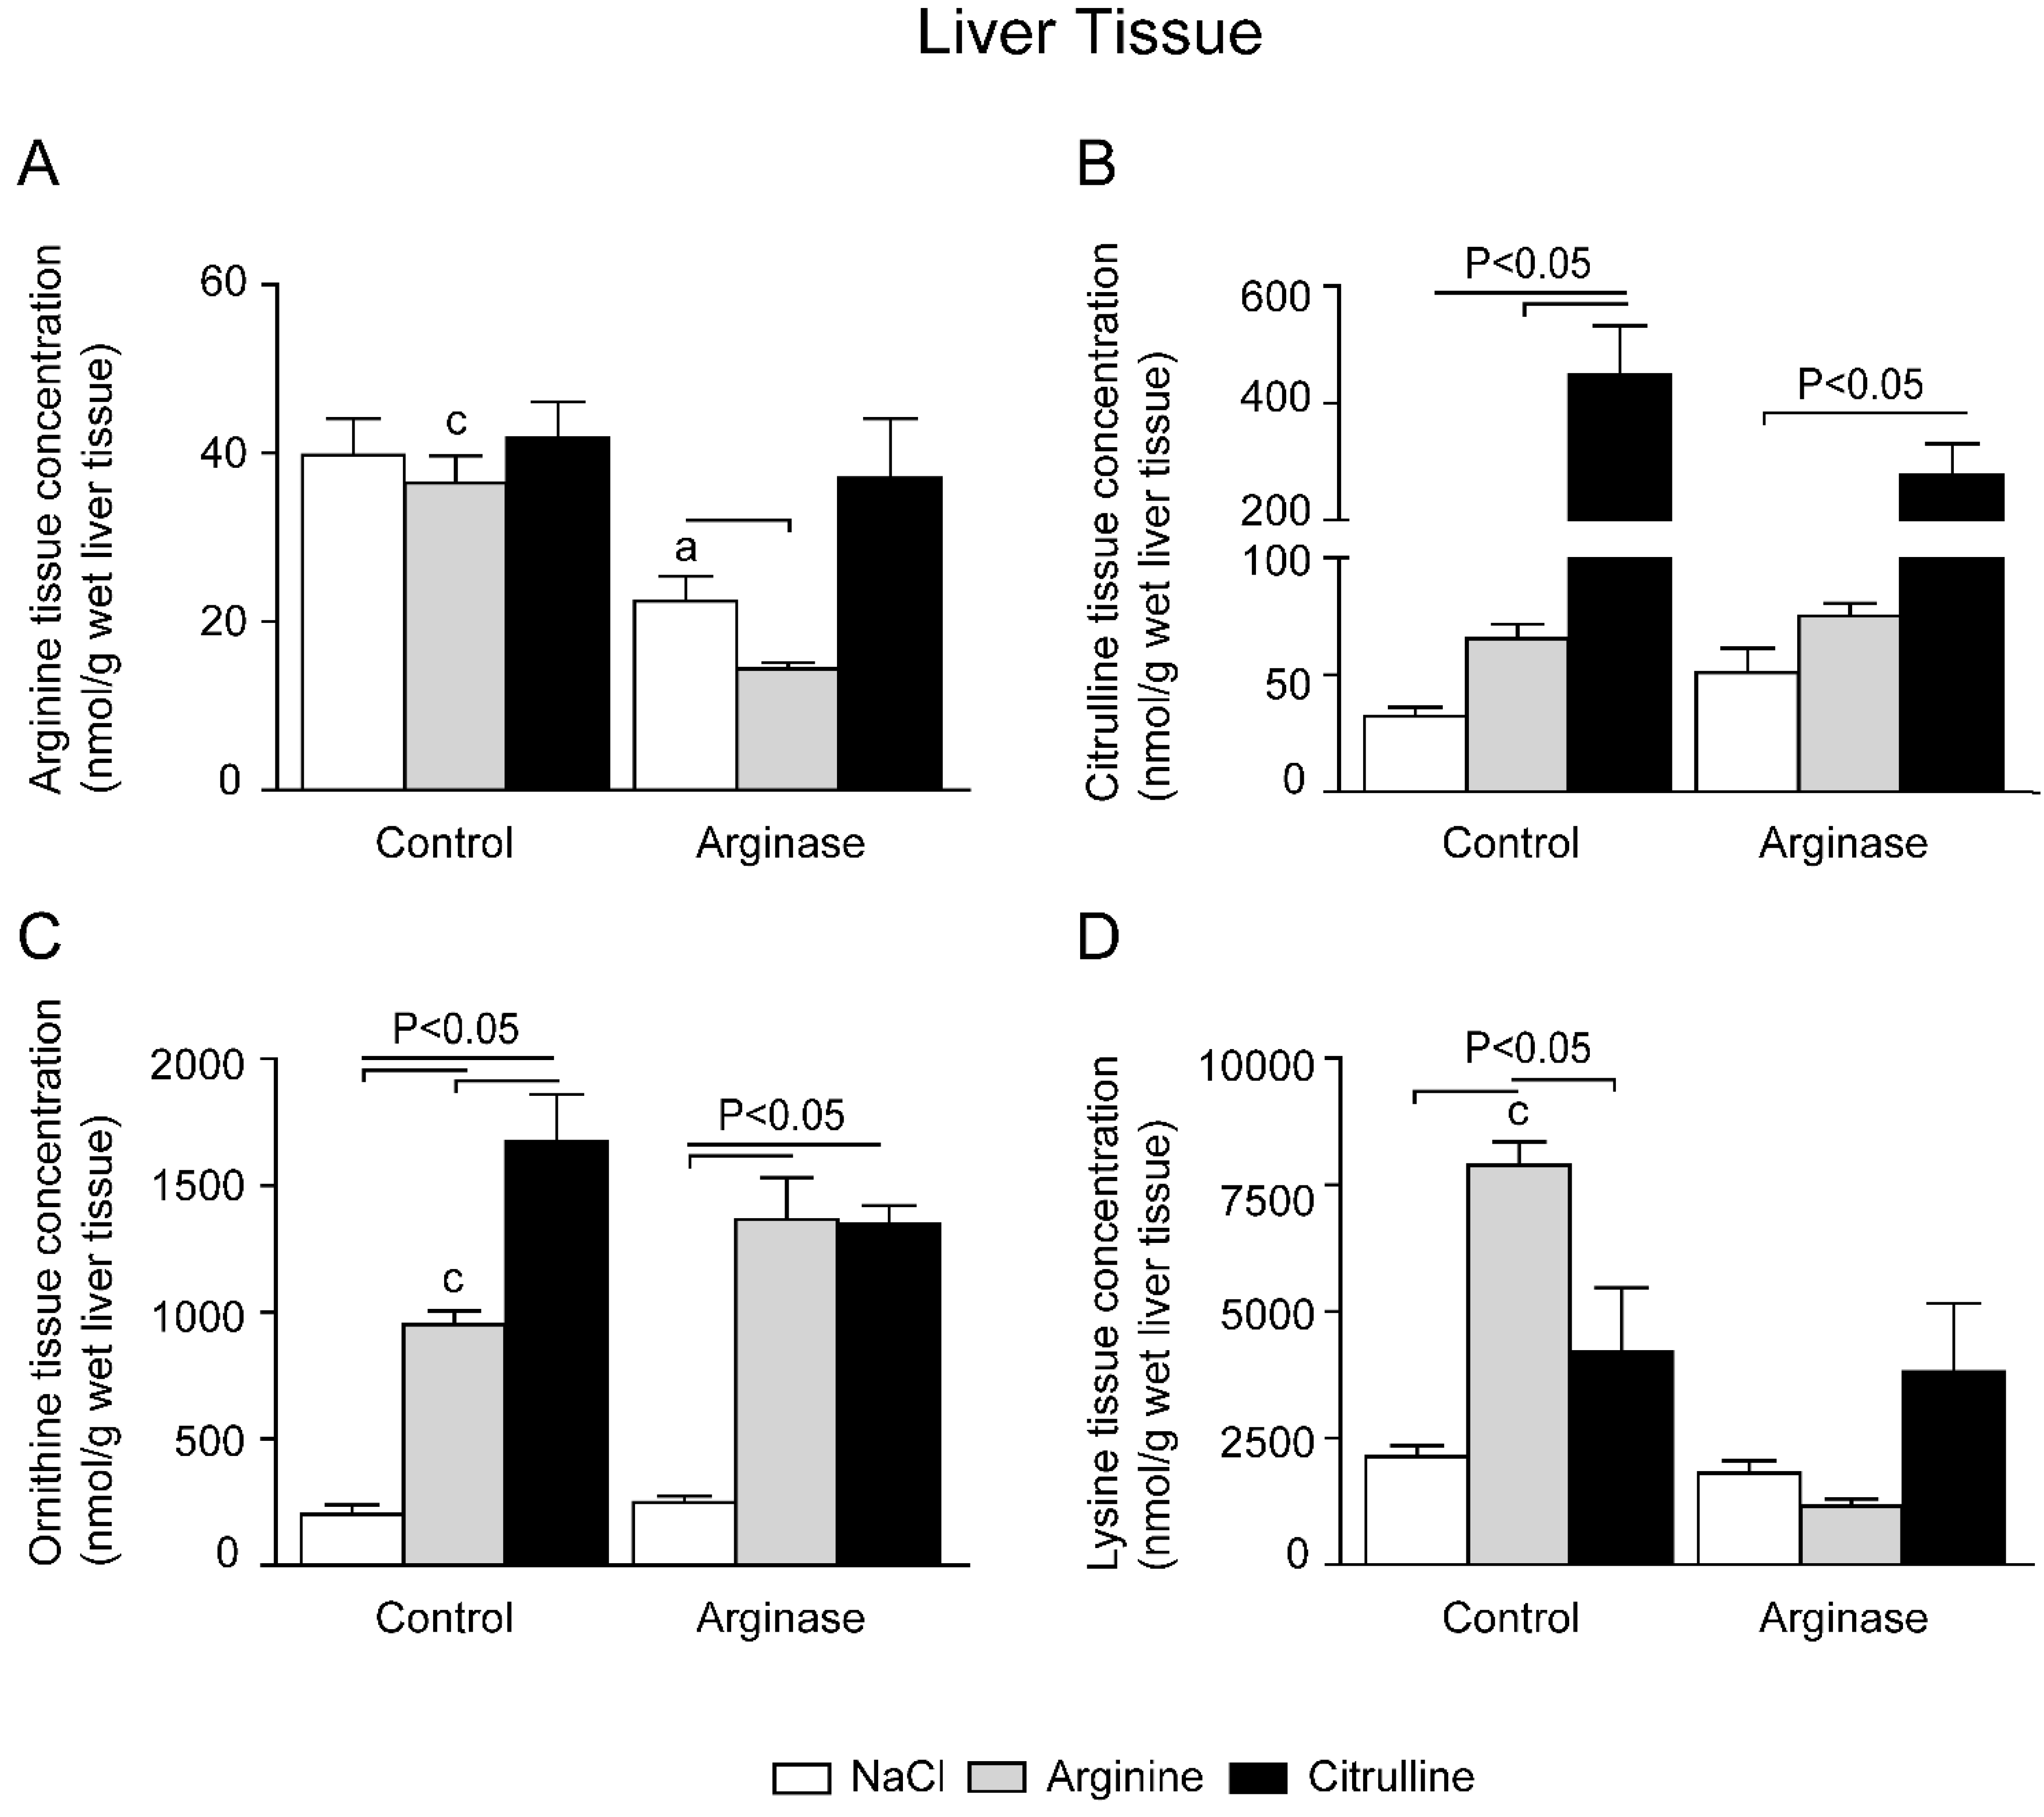
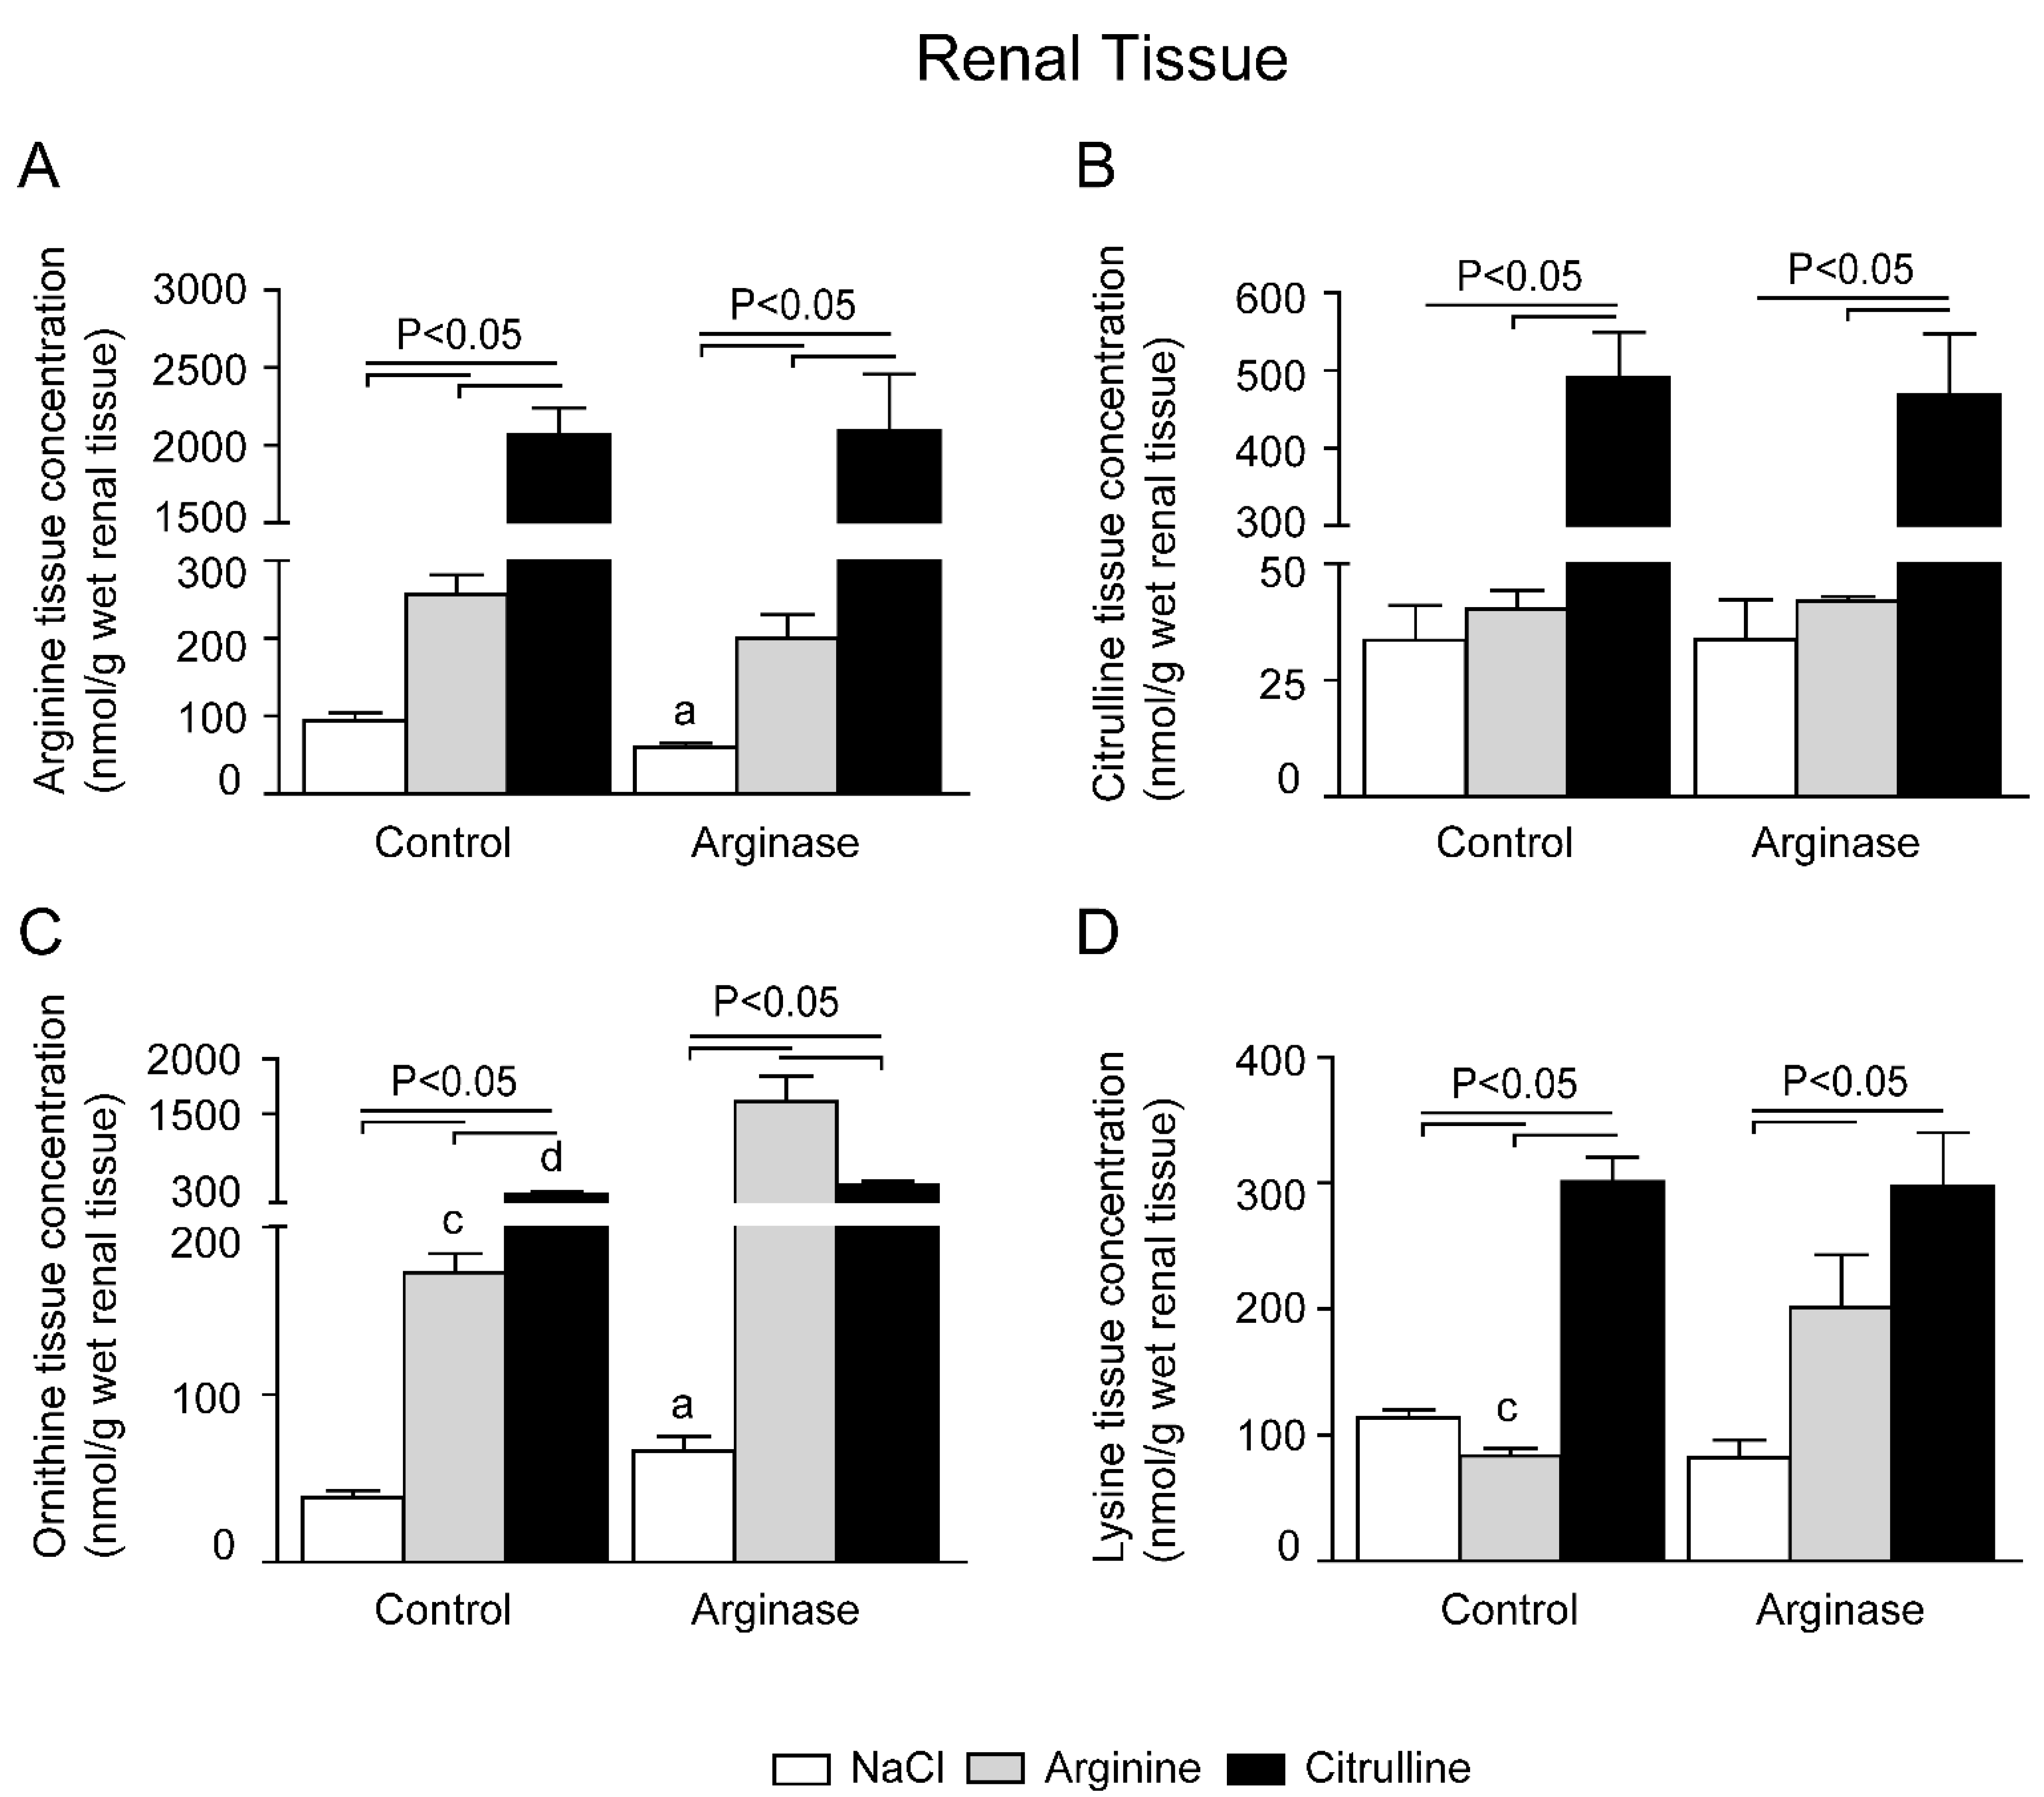
3.2. Depleted Tissue Amino Acid Concentrations Were Restored by Citrulline and Arginine Supplementation


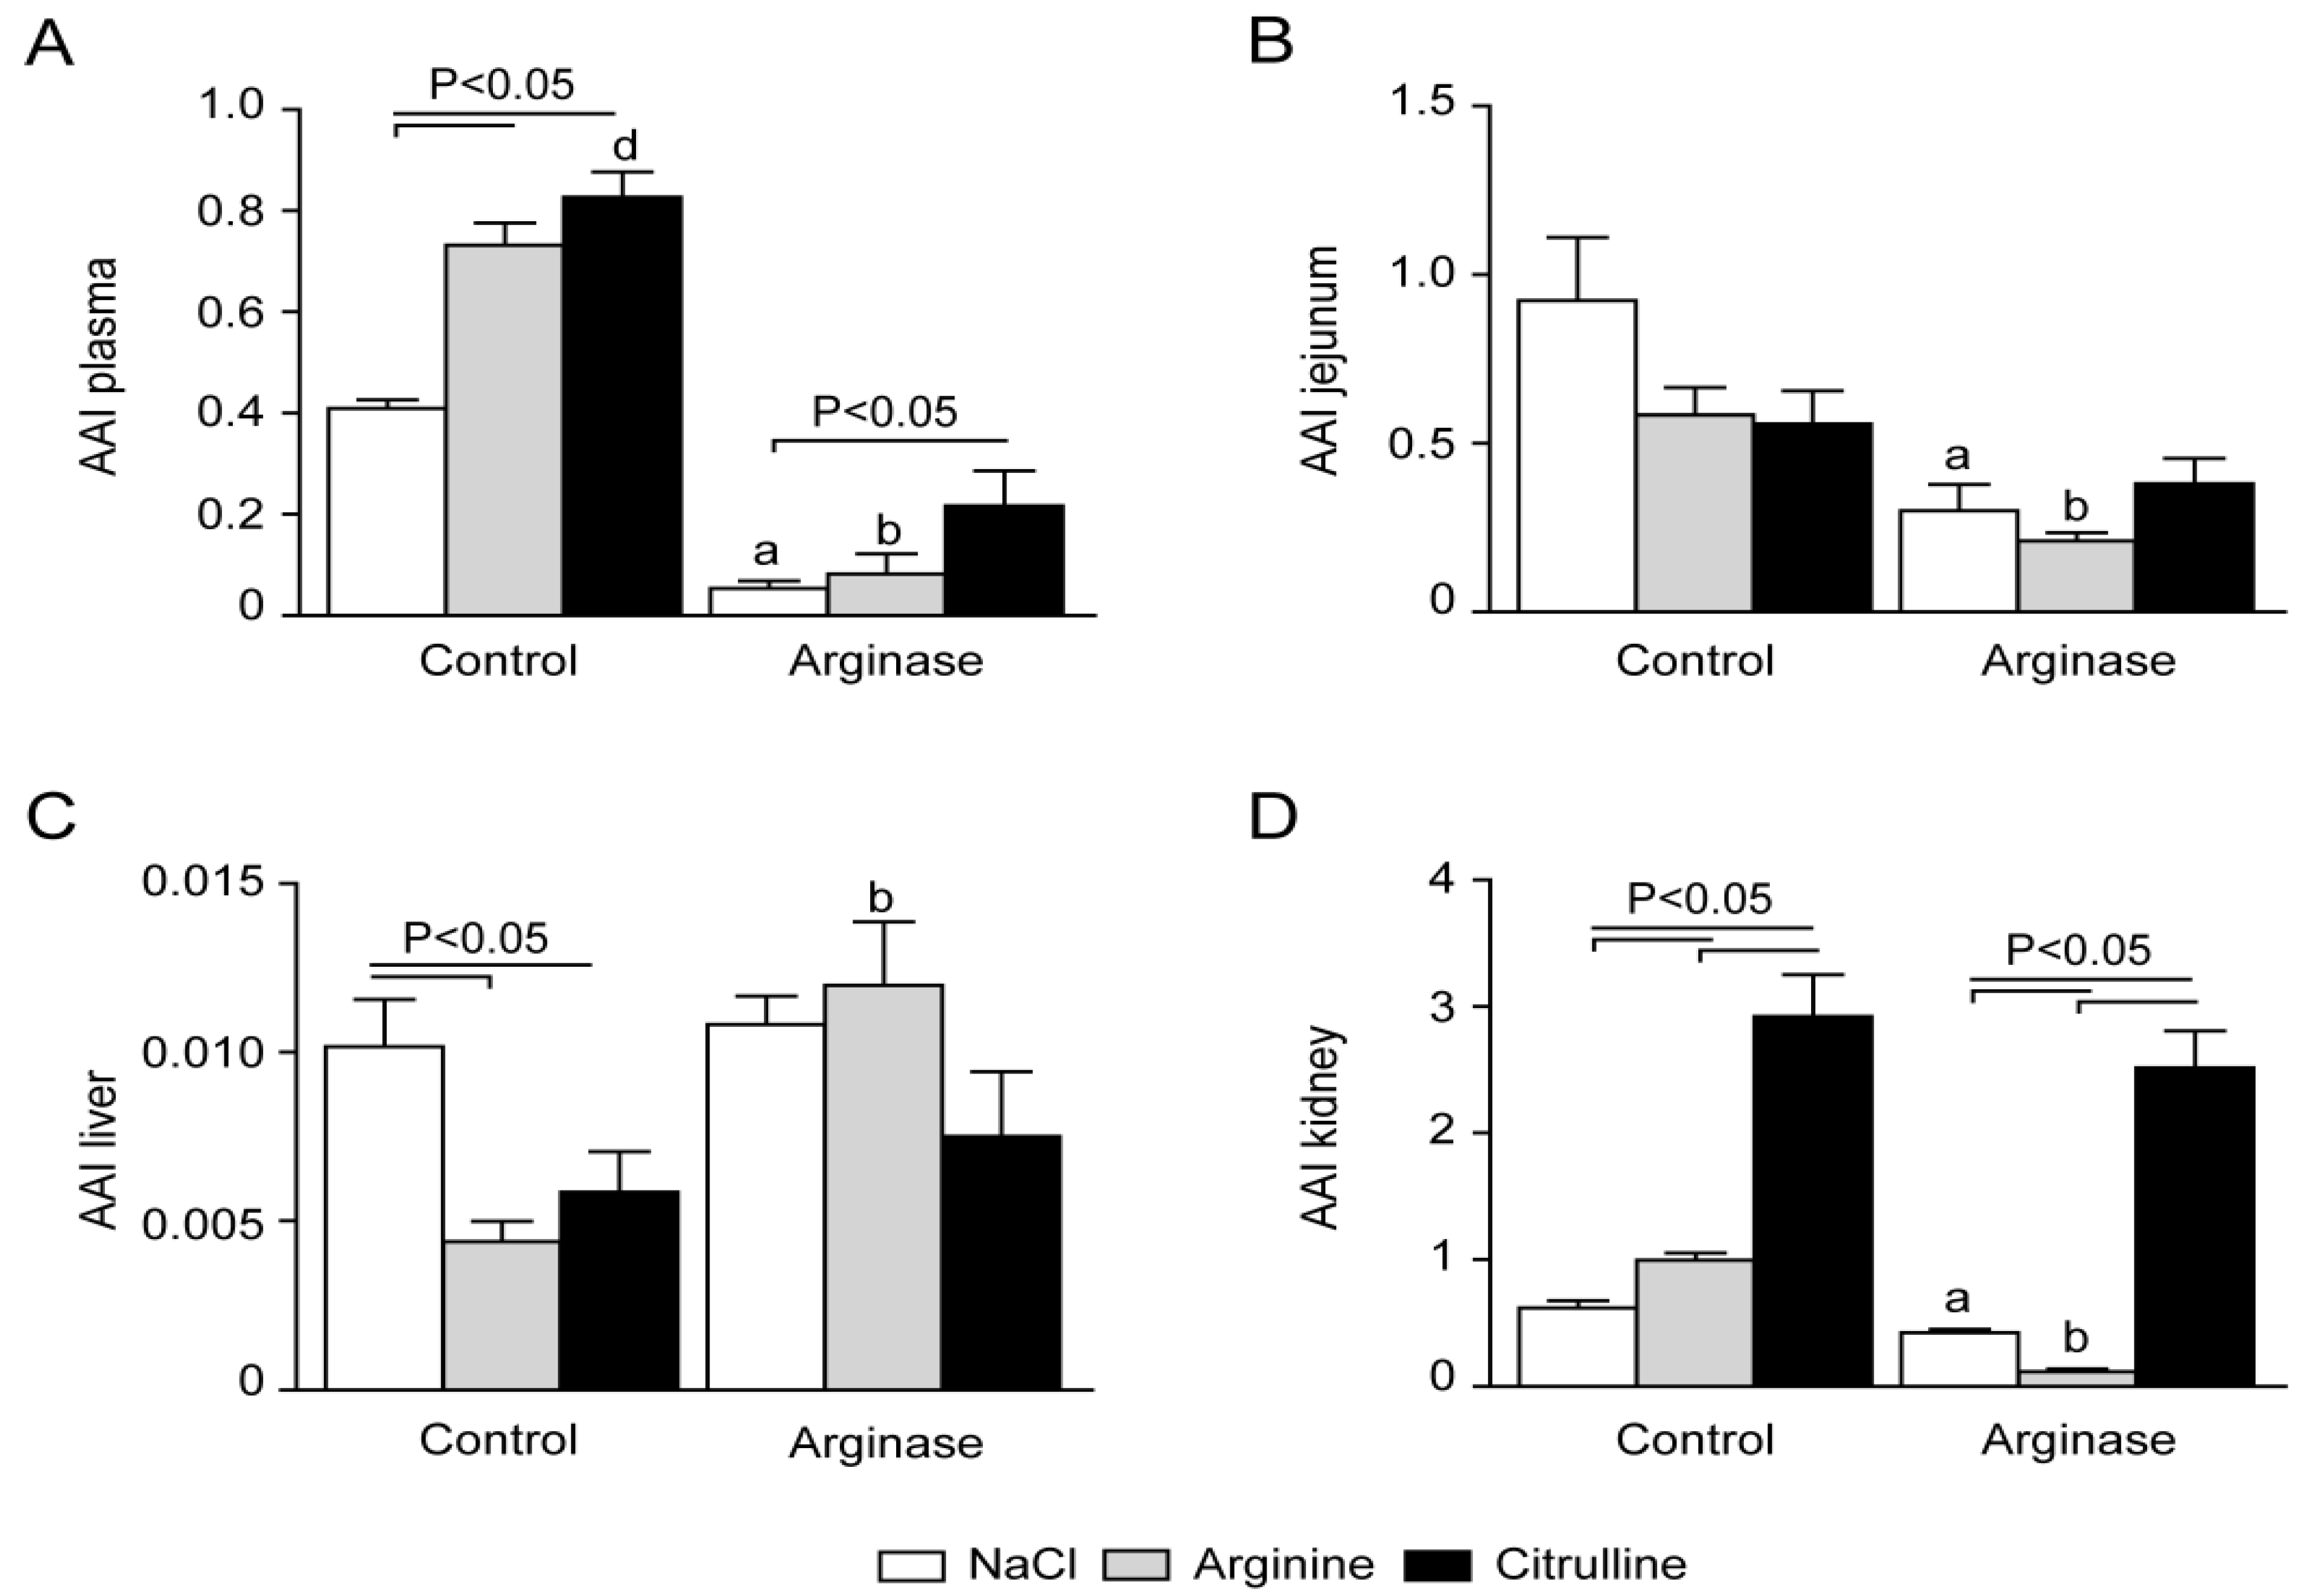
3.3. Arginine Availability in Plasma and Tissues of Arginase-Treated Animals
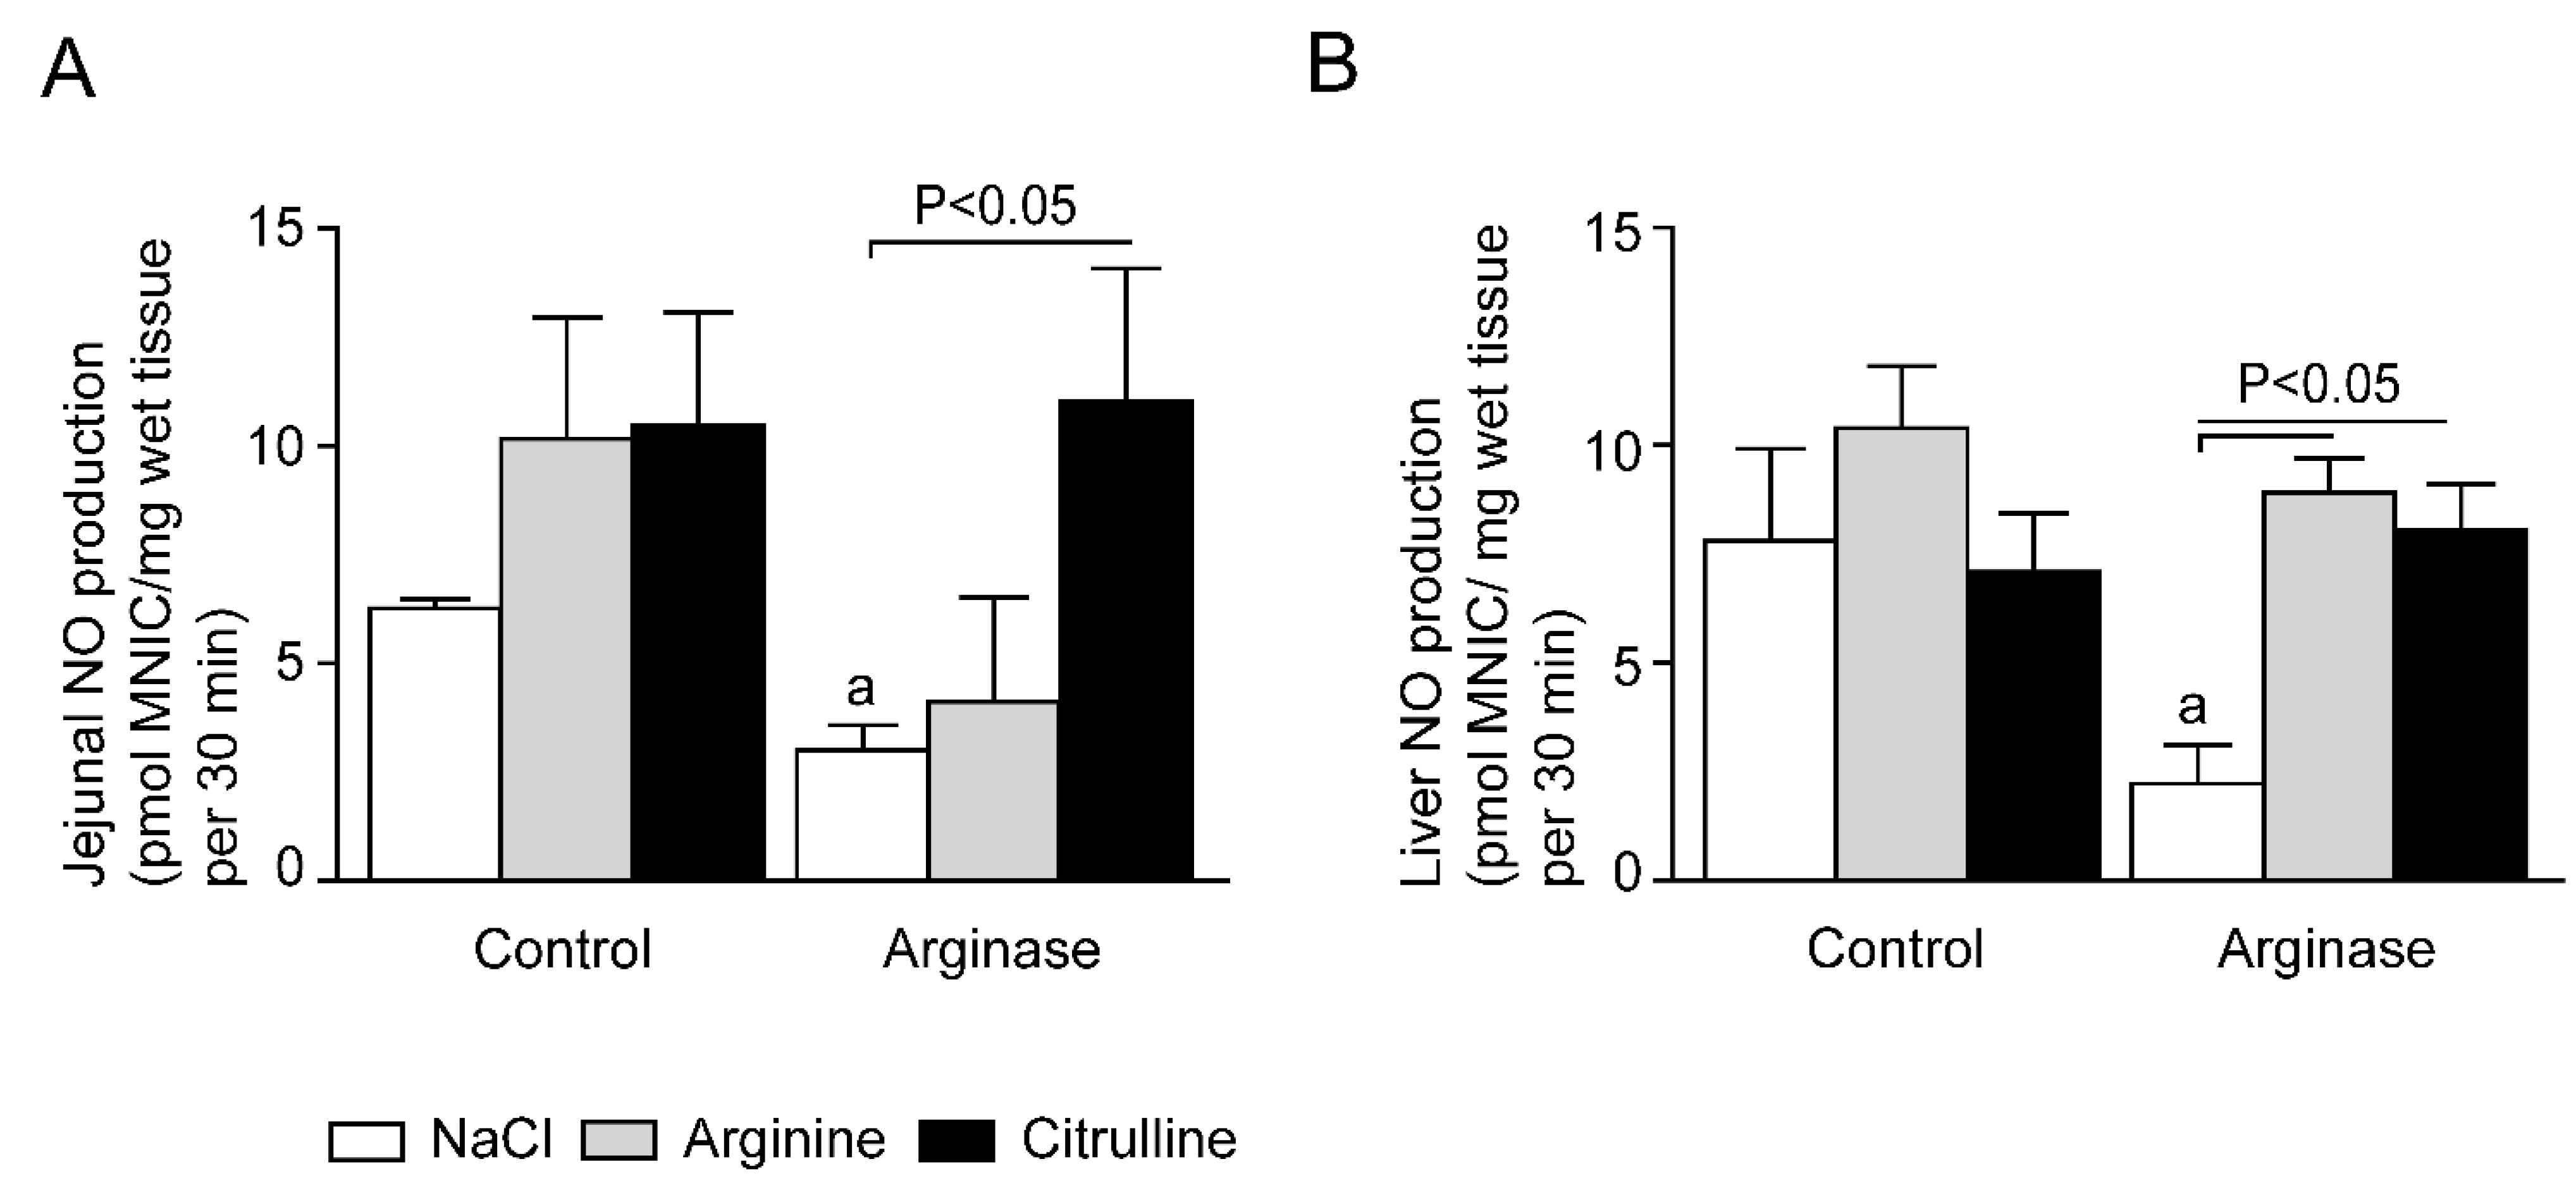
3.4. Impaired Tissue NO Production during Acute Arginine Deficiency


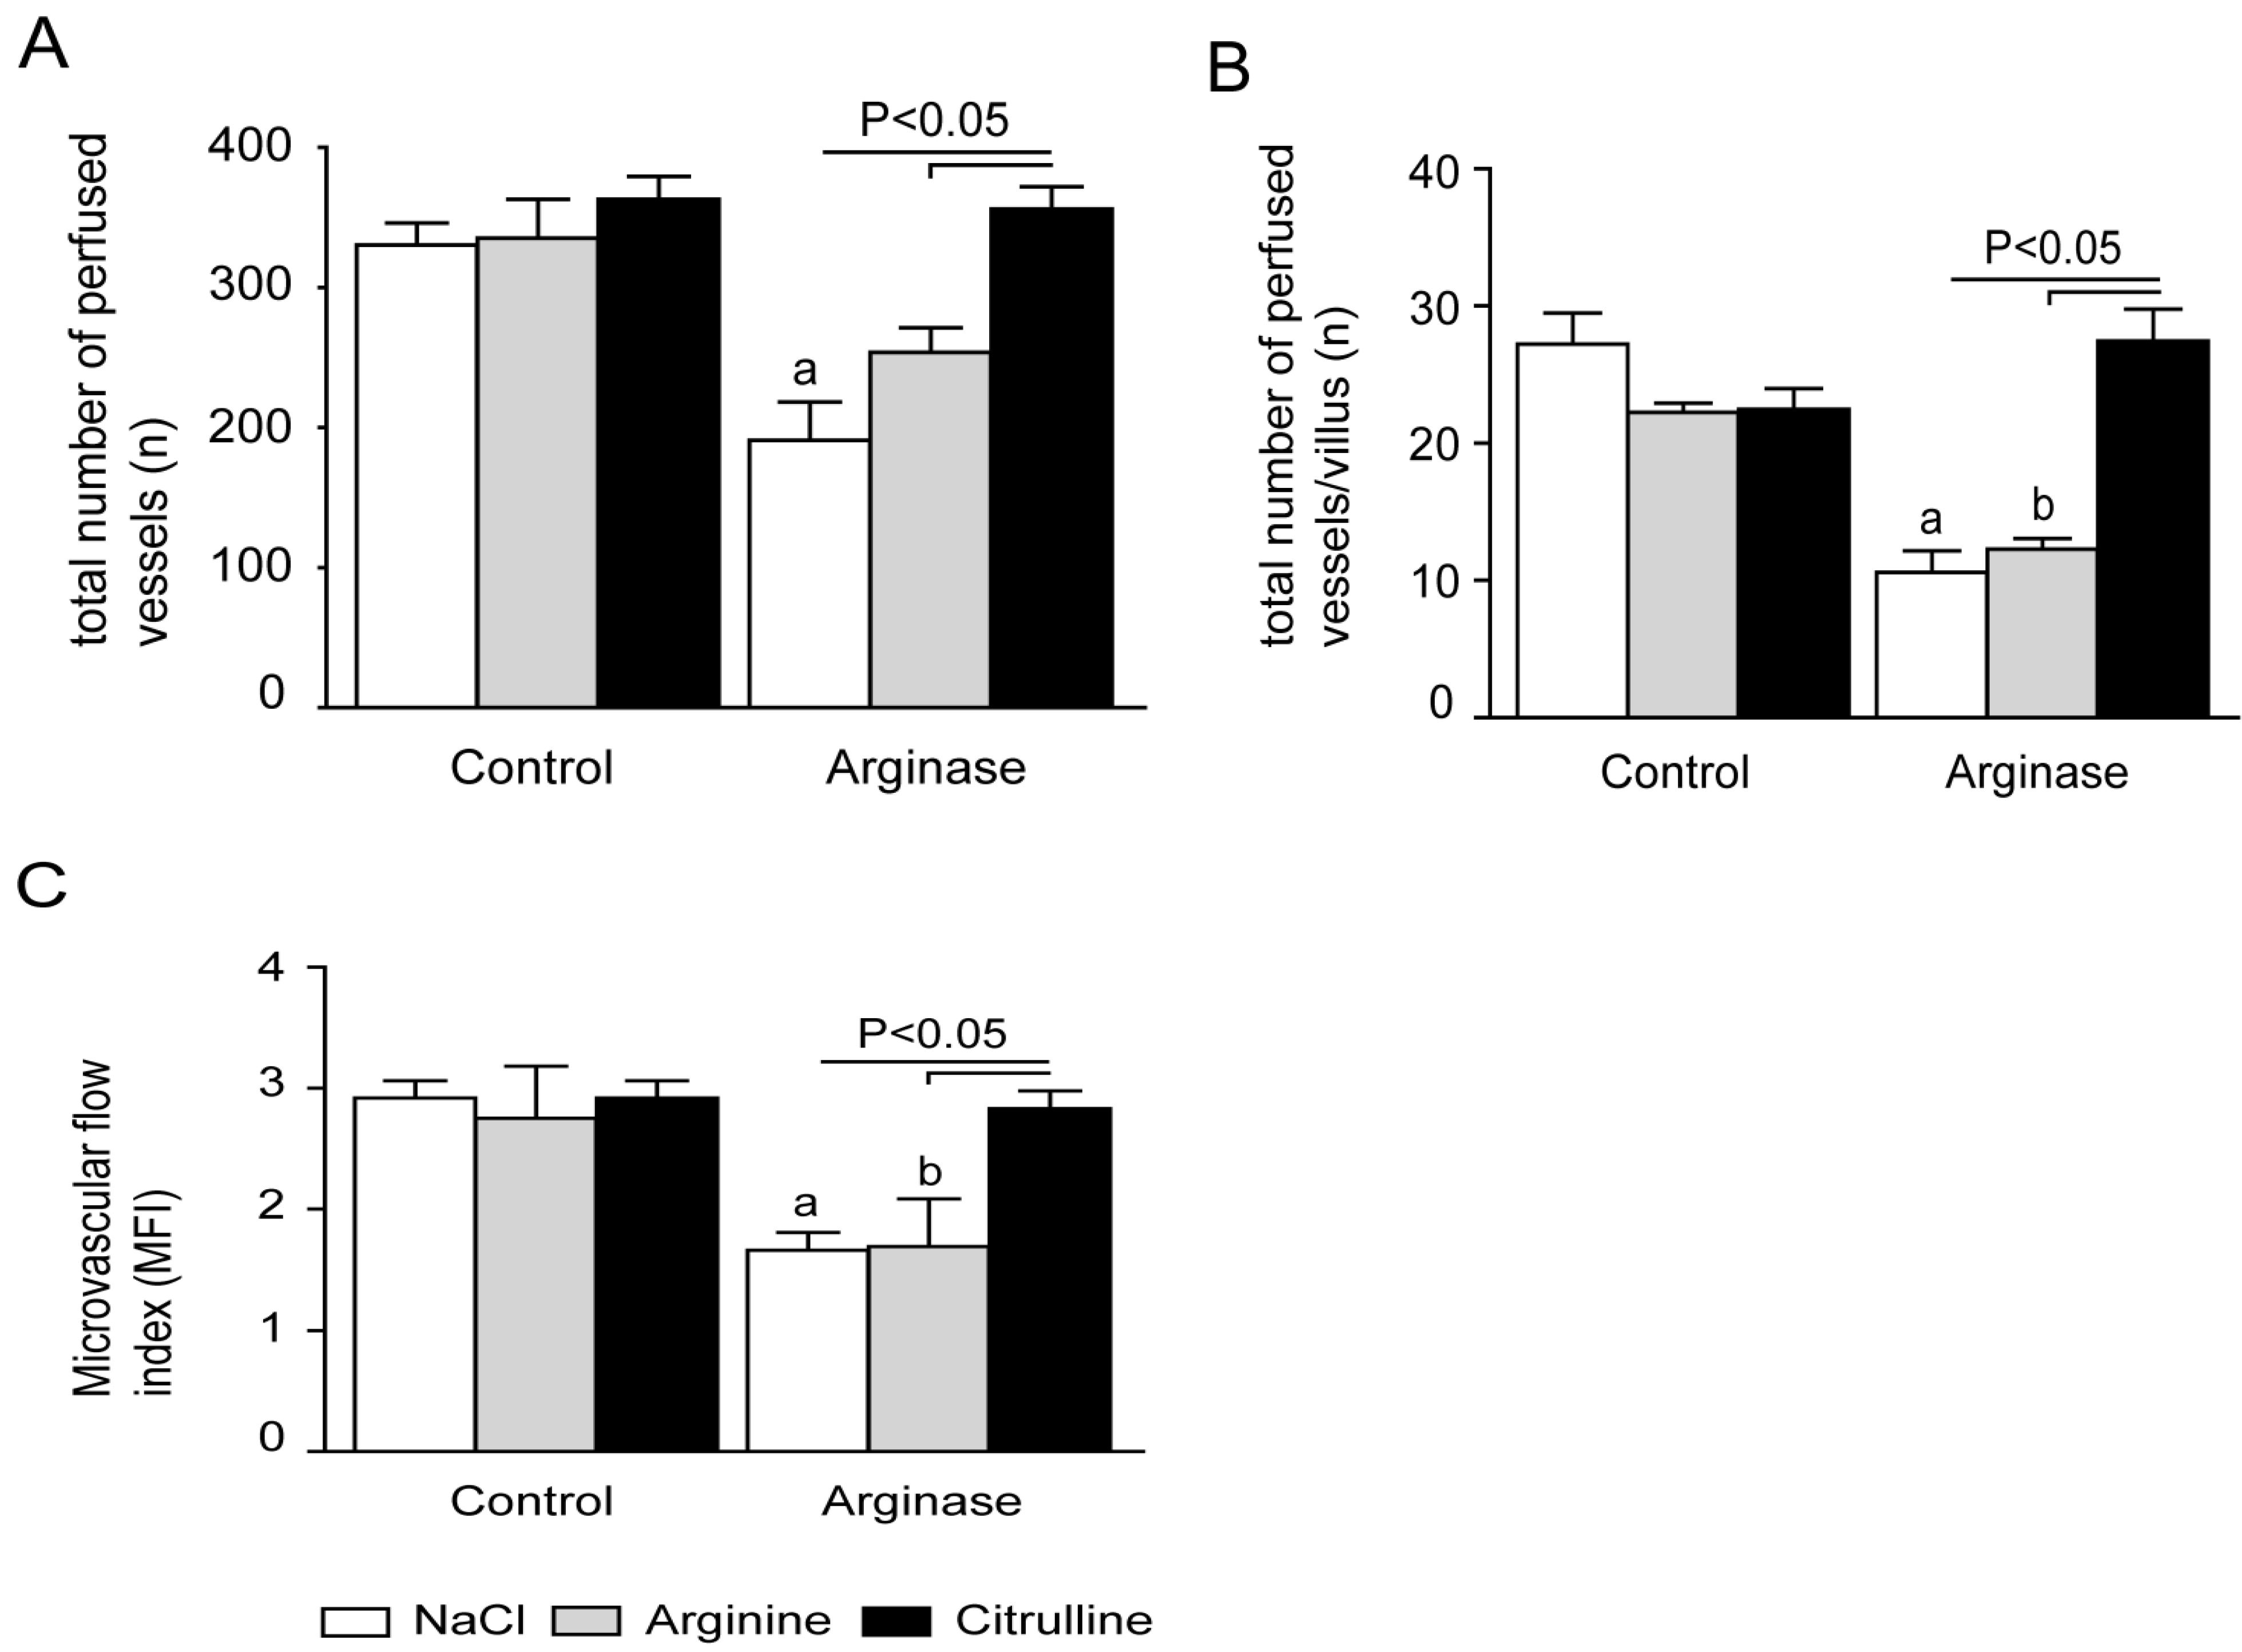
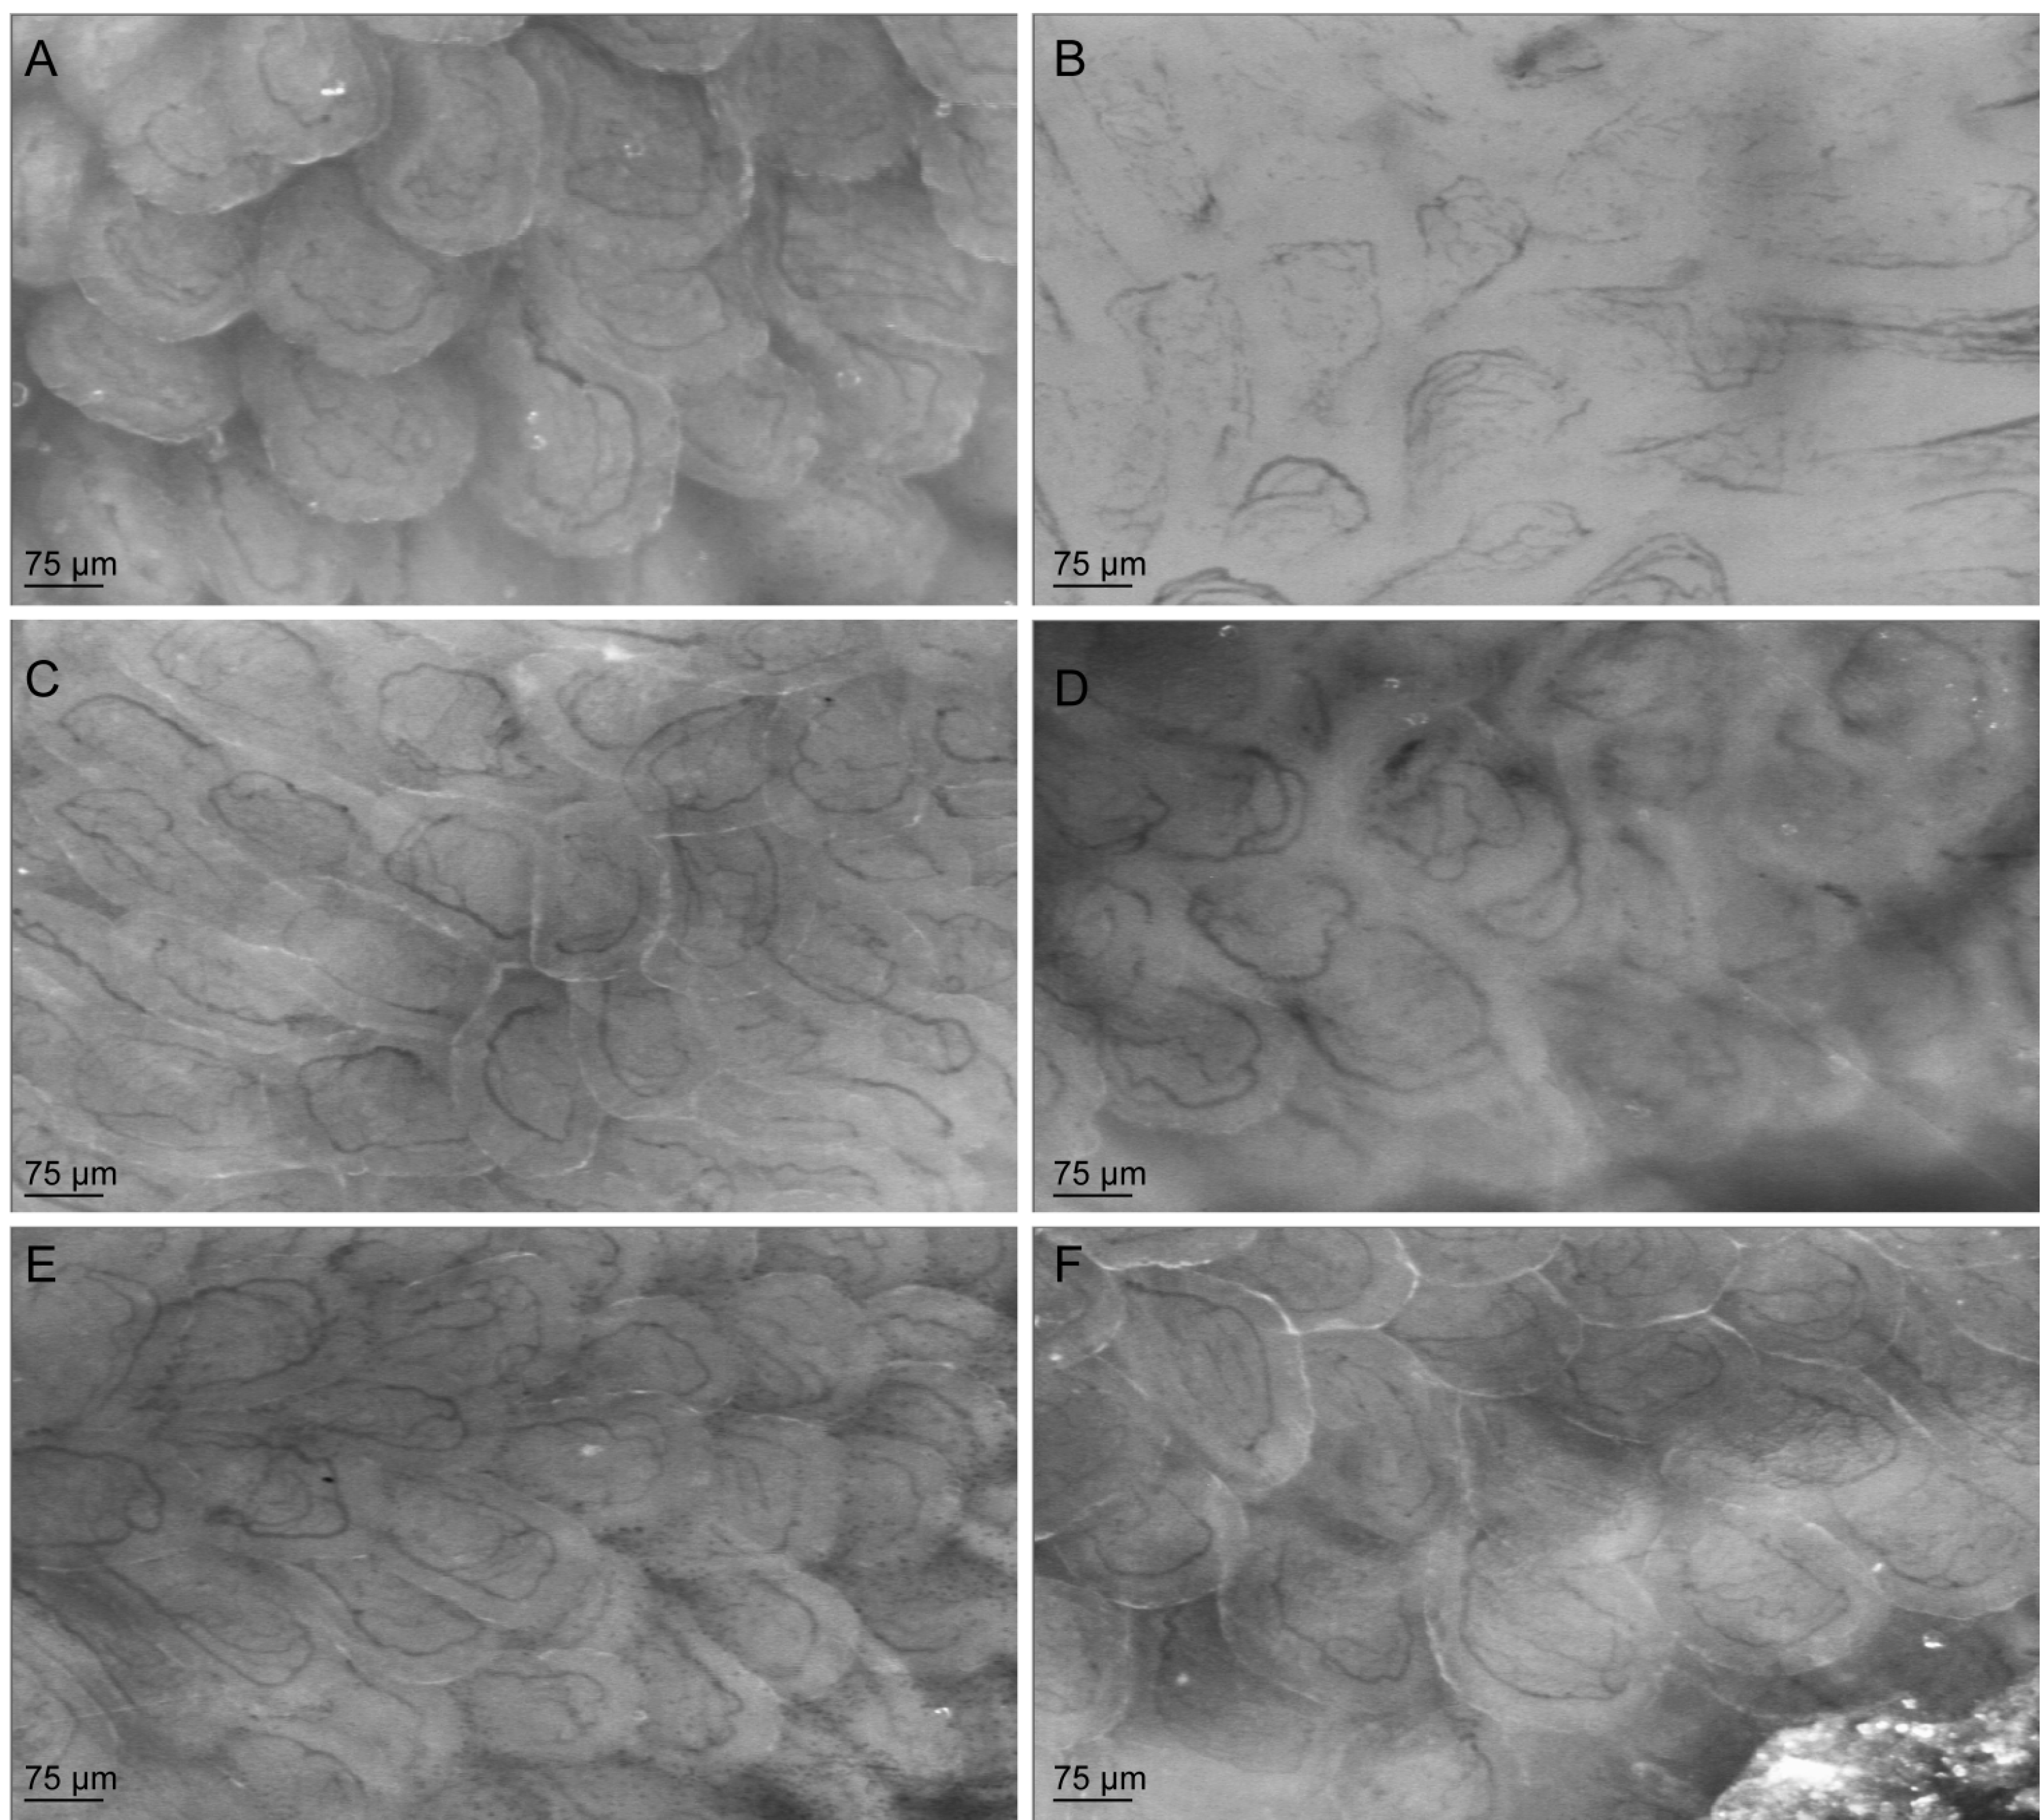
3.5. Citrulline Supplementation in Arginase-Treated Animals Restored Jejunal Microcirculation


4. Discussion
5. Conclusions
Supplementary Files
Supplementary File 1Acknowledgments
Author Contributions
Conflicts of Interest
References
- Waugh, W.H.; Daeschner, C.W.; Files, B.A.; Gordon, D.W. Evidence that l-arginine is key amino acid in sickle cell anemia—A preliminary report. Nutr. Res. 1999, 19, 501–518. [Google Scholar] [CrossRef]
- Gladwin, M.T.; Kato, G.J. Cardiopulmonary complications of sickle cell disease: Role of nitric oxide and hemolytic anemia. Hematol. Am. Soc. Hematol. Educ. Program 2005, 2005, 51–57. [Google Scholar] [CrossRef] [PubMed]
- Reiter, C.D.; Gladwin, M.T. An emerging role for nitric oxide in sickle cell disease vascular homeostasis and therapy. Curr. Opin. Hematol. 2003, 10, 99–107. [Google Scholar] [CrossRef] [PubMed]
- Morris, C.R.; Kato, G.J.; Poljakovic, M.; Wang, X.; Blackwelder, W.C.; Sachdev, V.; Vichinsky, E.P.; Hazen, S.L.; Morris, S.M.; Gladwin, M.T. Dysregulated arginine metabolism, hemolysis-associated pulmonary hypertension, and mortality in sickle cell disease. JAMA 2005, 294, 81–90. [Google Scholar] [CrossRef] [PubMed]
- Morris, C.R.; Morris, S.M.; Hagar, W.; van Warmerdam, J.; Claster, S.; Kepka-Lenhart, D.; Machado, L.; Kuypers, F.A.; Vichinsky, E.P. Arginine therapy: A new treatment for pulmonary hypertension in sickle cell disease? Am. J. Respir. Crit. Care Med. 2003, 168, 63–69. [Google Scholar] [CrossRef] [PubMed]
- Trzeciak, S.; Cinel, I.; Phillip Dellinger, R.; Shapiro, N.I.; Arnold, R.C.; Parrillo, J.E.; Hollenberg, S.M. Resuscitating the microcirculation in sepsis: The central role of nitric oxide, emerging concepts for novel therapies, and challenges for clinical trials. Acad. Emerg. Med. 2008, 15, 399–413. [Google Scholar] [CrossRef] [PubMed]
- Morris, C.R.; Kuypers, F.A.; Larkin, S.; Sweeters, N.; Simon, J.; Vichinsky, E.P.; Styles, L.A. Arginine therapy: A novel strategy to induce nitric oxide production in sickle cell disease. Br. J. Haematol. 2000, 111, 498–500. [Google Scholar] [CrossRef] [PubMed]
- Morris, S.M. Arginases and arginine deficiency syndromes. Curr. Opin. Clin. Nutr. Metab. Care 2012, 15, 64–70. [Google Scholar] [CrossRef] [PubMed]
- Darghouth, D.; Koehl, B.; Madalinski, G.; Heilier, J.F.; Bovee, P.; Xu, Y.; Olivier, M.F.; Bartolucci, P.; Benkerrou, M.; Pissard, S.; et al. Pathophysiology of sickle cell disease is mirrored by the red blood cell metabolome. Blood 2011, 117, e57–e66. [Google Scholar] [CrossRef] [PubMed]
- Dasgupta, T.; Hebbel, R.P.; Kaul, D.K. Protective effect of arginine on oxidative stress in transgenic sickle mouse models. Free Radic. Biol. Med. 2006, 41, 1771–1780. [Google Scholar] [CrossRef] [PubMed]
- Kaul, D.K.; Zhang, X.; Dasgupta, T.; Fabry, M.E. Arginine therapy of transgenic-knockout sickle mice improves microvascular function by reducing non-nitric oxide vasodilators, hemolysis, and oxidative stress. Am. J. Physiol. 2008, 295, H39–H47. [Google Scholar] [CrossRef] [PubMed]
- Sullivan, K.J.; Kissoon, N.; Sandler, E.; Gauger, C.; Froyen, M.; Duckworth, L.; Brown, M.; Murphy, S. Effect of oral arginine supplementation on exhaled nitric oxide concentration in sickle cell anemia and acute chest syndrome. J. Pediatr. Hematol. Oncol. 2010, 32, e249–e258. [Google Scholar] [CrossRef] [PubMed]
- Little, J.A.; Hauser, K.P.; Martyr, S.E.; Harris, A.; Maric, I.; Morris, C.R.; Suh, J.H.; Taylor, J.; Castro, O.; Machado, R.; et al. Hematologic, biochemical, and cardiopulmonary effects of l-arginine supplementation or phosphodiesterase 5 inhibition in patients with sickle cell disease who are on hydroxyurea therapy. Eur. J. Haematol. 2009, 82, 315–321. [Google Scholar] [CrossRef] [PubMed]
- Windmueller, H.G.; Spaeth, A.E. Source and fate of circulating citrulline. Am. J. Physiol. 1981, 241, E473–E480. [Google Scholar] [PubMed]
- Ratner, S.; Petrack, B. The mechanism of arginine synthesis from citrulline in kidney. J. Biol. Chem. 1953, 200, 175–185. [Google Scholar] [PubMed]
- Waugh, W.H.; Daeschner, C.W.; Files, B.A.; McConnell, M.E.; Strandjord, S.E. Oral citrulline as arginine precursor may be beneficial in sickle cell disease: Early phase two results. J. Natl. Med. Assoc. 2001, 93, 363–371. [Google Scholar] [PubMed]
- Wijnands, K.A.P.; Vink, H.; Briedé, J.J.; van Faassen, E.E.; Lamers, W.H.; Buurman, W.A.; Poeze, M. Citrulline a more suitable substrate than arginine to restore no production and the microcirculation during endotoxemia. PLoS ONE 2012, 7, e37439. [Google Scholar] [CrossRef] [PubMed]
- Schwedhelm, E.; Maas, R.; Freese, R.; Jung, D.; Lukacs, Z.; Jambrecina, A.; Spickler, W.; Schulze, F.; Boger, R.H. Pharmacokinetic and pharmacodynamic properties of oral l-citrulline and l-arginine: Impact on nitric oxide metabolism. Br. J. Clin. Pharmacol. 2008, 65, 51–59. [Google Scholar] [CrossRef] [PubMed]
- Bruins, M.J. l-arginine Treatment during Acute and Longterm Endotoxemia in the Pig: Effects on Jejunal Motility and Interorgan Protein, Arginine and Nitric Oxide Metabolism. Ph.D. Thesis, Maastricht University, Maastricht, The Netherlands, 2001; pp. 1–243. [Google Scholar]
- Scavella, A.; Leiva, L.; Monjure, H.; Zea, A.H.; Gardner, R.V. Effect of l-arginine supplementation on immune responsiveness in patients with sickle cell disease. Pediatr. Blood Cancer 2010, 55, 318–323. [Google Scholar] [CrossRef] [PubMed]
- Van Eijk, H.M.; Rooyakkers, D.R.; Deutz, N.E. Rapid routine determination of amino acids in plasma by high-performance liquid chromatography with a 2–3 microns spherisorb ods ii column. J. Chromatogr. 1993, 620, 143–148. [Google Scholar] [CrossRef]
- Morris, C.R.; Poljakovic, M.; Lavrisha, L.; Machado, L.; Kuypers, F.A.; Morris, S.M., Jr. Decreased arginine bioavailability and increased serum arginase activity in asthma. Am. J. Respir. Crit. Care Med. 2004, 170, 148–153. [Google Scholar] [CrossRef] [PubMed]
- Verrey, F.; Closs, E.I.; Wagner, C.A.; Palacin, M.; Endou, H.; Kanai, Y. Cats and hats: The SLC7 family of amino acid transporters. Pflug. Arch. 2004, 447, 532–542. [Google Scholar] [CrossRef] [PubMed]
- Fotiadis, D.; Kanai, Y.; Palacin, M. The SLC3 and SLC7 families of amino acid transporters. Mol. Asp. Med. 2013, 34, 139–158. [Google Scholar] [CrossRef] [PubMed]
- Closs, E.I.; Boissel, J.P.; Habermeier, A.; Rotmann, A. Structure and function of cationic amino acid transporters (cats). J. Membr. Biol. 2006, 213, 67–77. [Google Scholar] [CrossRef] [PubMed]
- Yeramian, A.; Martin, L.; Serrat, N.; Arpa, L.; Soler, C.; Bertran, J.; McLeod, C.; Palacin, M.; Modolell, M.; Lloberas, J.; et al. Arginine transport via cationic amino acid transporter 2 plays a critical regulatory role in classical or alternative activation of macrophages. J. Immunol. 2006, 176, 5918–5924. [Google Scholar] [CrossRef] [PubMed]
- Van Faassen, E.E.; Koeners, M.P.; Joles, J.A.; Vanin, A.F. Detection of basal no production in rat tissues using iron-dithiocarbamate complexes. Nitric Oxide 2008, 18, 279–286. [Google Scholar] [CrossRef] [PubMed]
- Groner, W.; Winkelman, J.W.; Harris, A.G.; Ince, C.; Bouma, G.J.; Messmer, K.; Nadeau, R.G. Orthogonal polarization spectral imaging: A new method for study of the microcirculation. Nat. Med. 1999, 5, 1209–1212. [Google Scholar] [PubMed]
- Spronk, P.E.; Ince, C.; Gardien, M.J.; Mathura, K.R.; Oudemans-van Straaten, H.M.; Zandstra, D.F. Nitroglycerin in septic shock after intravascular volume resuscitation. Lancet 2002, 360, 1395–1396. [Google Scholar] [CrossRef]
- Dhiman, R.; Yusif, R.; Nabar, U.; Albaqali, A. Images of interest. Gastrointestinal: Ischemic enteritis and sickle cell disease. J. Gastroenterol. Hepatol. 2004, 19, 1318. [Google Scholar] [CrossRef] [PubMed]
- De Backer, D.; Hollenberg, S.; Boerma, C.; Goedhart, P.; Buchele, G.; Ospina-Tascon, G.; Dobbe, I.; Ince, C. How to evaluate the microcirculation: Report of a round table conference. Crit. Care 2007, 11, R101. [Google Scholar] [CrossRef] [PubMed]
- Boerma, E.C.; Mathura, K.R.; van der Voort, P.H.; Spronk, P.E.; Ince, C. Quantifying bedside-derived imaging of microcirculatory abnormalities in septic patients: A prospective validation study. Crit. Care 2005, 9, R601–R606. [Google Scholar] [CrossRef] [PubMed]
- Verdant, C.L.; de Backer, D.; Bruhn, A.; Clausi, C.M.; Su, F.; Wang, Z.; Rodriguez, H.; Pries, A.R.; Vincent, J.L. Evaluation of sublingual and gut mucosal microcirculation in sepsis: A quantitative analysis. Crit. Care Med. 2009, 37, 2875–2881. [Google Scholar] [CrossRef] [PubMed]
- Schnog, J.J.; Jager, E.H.; van der Dijs, F.P.; Duits, A.J.; Moshage, H.; Muskiet, F.D.; Muskiet, F.A. Evidence for a metabolic shift of arginine metabolism in sickle cell disease. Ann. Hematol. 2004, 83, 371–375. [Google Scholar] [CrossRef] [PubMed]
- Kaul, D.K.; Liu, X.D.; Fabry, M.E.; Nagel, R.L. Impaired nitric oxide-mediated vasodilation in transgenic sickle mouse. Am. J. Physiol. 2000, 278, H1799–H1806. [Google Scholar]
- Coman, D.; Yaplito-Lee, J.; Boneh, A. New indications and controversies in arginine therapy. Clin. Nutr. 2008, 27, 489–496. [Google Scholar] [CrossRef] [PubMed]
- Mack, A.K.; Kato, G.J. Sickle cell disease and nitric oxide: A paradigm shift? Int. J. Biochem. Cell Biol. 2006, 38, 1237–1243. [Google Scholar] [CrossRef] [PubMed]
- Luiking, Y.C.; Poeze, M.; Ramsay, G.; Deutz, N.E. Reduced citrulline production in sepsis is related to diminished de novo arginine and nitric oxide production. Am. J. Clin. Nutr. 2009, 89, 142–152. [Google Scholar] [CrossRef] [PubMed]
- Luiking, Y.C.; Poeze, M.; Ramsay, G.; Deutz, N.E. The role of arginine in infection and sepsis. JPEN J. Parenter. Enter. Nutr. 2005, 29, S70–S74. [Google Scholar] [CrossRef]
- Jeyabalan, G.; Klune, J.R.; Nakao, A.; Martik, N.; Wu, G.; Tsung, A.; Geller, D.A. Arginase blockade protects against hepatic damage in warm ischemia-reperfusion. Nitric Oxide 2008, 19, 29–35. [Google Scholar] [CrossRef] [PubMed]
- Goodwin, B.L.; Solomonson, L.P.; Eichler, D.C. Argininosuccinate synthase expression is required to maintain nitric oxide production and cell viability in aortic endothelial cells. J. Biol. Chem. 2004, 279, 18353–18360. [Google Scholar] [CrossRef] [PubMed]
- Durante, W.; Johnson, F.K.; Johnson, R.A. Arginase: A critical regulator of nitric oxide synthesis and vascular function. Clin. Exp. Pharmacol. Physiol. 2007, 34, 906–911. [Google Scholar] [CrossRef] [PubMed]
- Curis, E.; Nicolis, I.; Moinard, C.; Osowska, S.; Zerrouk, N.; Benazeth, S.; Cynober, L. Almost all about citrulline in mammals. Amino Acids 2005, 29, 177–205. [Google Scholar] [CrossRef] [PubMed]
- McCarty, M.F. Potential utility of full-spectrum antioxidant therapy, citrulline, and dietary nitrate in the management of sickle cell disease. Med. Hypotheses 2010, 74, 1055–1058. [Google Scholar] [CrossRef] [PubMed]
- Marini, J.C. Arginine and ornithine are the main precursors for citrulline synthesis in mice. J. Nutr. 2012, 142, 572–580. [Google Scholar] [CrossRef] [PubMed]
- Marini, J.C.; Didelija, I.C.; Castillo, L.; Lee, B. Plasma arginine and ornithine are the main citrulline precursors in mice infused with arginine-free diets. J. Nutr. 2010, 140, 1432–1437. [Google Scholar] [CrossRef] [PubMed]
- Flam, B.R.; Eichler, D.C.; Solomonson, L.P. Endothelial nitric oxide production is tightly coupled to the citrulline-no cycle. Nitric Oxide 2007, 17, 115–121. [Google Scholar] [CrossRef] [PubMed]
- Shen, L.J.; Beloussow, K.; Shen, W.C. Accessibility of endothelial and inducible nitric oxide synthase to the intracellular citrulline-arginine regeneration pathway. Biochem. Pharmacol. 2005, 69, 97–104. [Google Scholar] [CrossRef] [PubMed]
- Luiking, Y.C.; Hallemeesch, M.M.; de Jonge, W.J.; Lamers, W.H.; Deutz, N.E. Reduced citrulline availability by OTC-deficiency in mice is related to reduced nitric oxide production. Am. J. Physiol. Endocrinol. Metab. 2008, 295, E1315–E1322. [Google Scholar] [CrossRef] [PubMed]
- Ruiz, E.; Tejerina, T. Relaxant effects of l-citrulline in rabbit vascular smooth muscle. Br. J. Pharmacol. 1998, 125, 186–192. [Google Scholar] [CrossRef] [PubMed]
- Hartman, W.J.; Torre, P.M.; Prior, R.L. Dietary citrulline but not ornithine counteracts dietary arginine deficiency in rats by increasing splanchnic release of citrulline. J. Nutr. 1994, 124, 1950–1960. [Google Scholar] [PubMed]
- Luiking, Y.C.; Engelen, M.P.; Deutz, N.E. Regulation of nitric oxide production in health and disease. Curr. Opin. Clin. Nutr. Metab. Care 2010, 13, 97–104. [Google Scholar] [CrossRef] [PubMed]
- Grimble, G.K. Adverse gastrointestinal effects of arginine and related amino acids. J. Nutr. 2007, 137, 1693S–1701S. [Google Scholar] [PubMed]
- </i>Moinard, C.; Nicolis, I.; Neveux, N.; Darquy, S.; Benazeth, S.; Cynober, L. Dose-ranging effects of citrulline administration on plasma amino acids and hormonal patterns in healthy subjects: The citrudose pharmacokinetic study. Bri. J. Nutr. 2008, 99, 855–862. [Google Scholar]
- Vissers, Y.L.; Debats, I.B.; Luiking, Y.C.; Jalan, R.; van der Hulst, R.R.; Dejong, C.H.; Deutz, N.E. Pros and cons of l-arginine supplementation in disease. Nutr. Res. Rev. 2004, 17, 193–210. [Google Scholar] [CrossRef] [PubMed]
- Van Wijck, K.; Wijnands, K.A.; Meesters, D.M.; Boonen, B.; van Loon, L.J.; Buurman, W.A.; Dejong, C.H.; Lenaerts, K.; Poeze, M. l-citrulline improves splanchnic perfusion and reduces gut injury during exercise. Med. Sci. Sports Exerc. 2014, 46, 2039–2046. [Google Scholar] [CrossRef] [PubMed]
- Elbers, P.W.; Ince, C. Mechanisms of critical illness--classifying microcirculatory flow abnormalities in distributive shock. Crit. Care Lond. Engl. 2006, 10, 221. [Google Scholar] [CrossRef] [PubMed]
- Cerny, V.; Turek, Z.; Parizkova, R. In situ assessment of the liver microcirculation in mechanically ventilated rats using sidestream dark-field imaging. Physiol. Res. 2009, 58, 49–55. [Google Scholar] [PubMed]
- Liberatore, A.M.A.; Vieira, J.C.; Almeida-Filho, J.; Tedesco, R.C.; Koh, I.H.J. Evaluation by videomicroscopy (SDF) of the renal cortex microcirculation and convoluted tubules in acute renal failure during severe sepsis. Experimental study. Intensiv. Care Med. Exp. 2014, 2, 8. [Google Scholar] [CrossRef]
- Derikx, J.P.; Poeze, M.; van Bijnen, A.A.; Buurman, W.A.; Heineman, E. Evidence for intestinal and liver epithelial cell injury in the early phase of sepsis. Shock Augusta Ga 2007, 28, 544–548. [Google Scholar] [CrossRef] [PubMed]
- Stechmiller, J.K.; Treloar, D.; Allen, N. Gut dysfunction in critically ill patients: A review of the literature. Am. J. Crit. Care 1997, 6, 204–209. [Google Scholar] [PubMed]
- McCuskey, R.S. Hepatic and splanchnic microvascular responses to inflammation and shock. Hepatogastroenterology 1999, 46, 1464–1467. [Google Scholar] [PubMed]
© 2015 by the authors; licensee MDPI, Basel, Switzerland. This article is an open access article distributed under the terms and conditions of the Creative Commons Attribution license (http://creativecommons.org/licenses/by/4.0/).
Share and Cite
Wijnands, K.A.P.; Meesters, D.M.; Van Barneveld, K.W.Y.; Visschers, R.G.J.; Briedé, J.J.; Vandendriessche, B.; Van Eijk, H.M.H.; Bessems, B.A.F.M.; Hoven, N.V.d.; Von Wintersdorff, C.J.H.; et al. Citrulline Supplementation Improves Organ Perfusion and Arginine Availability under Conditions with Enhanced Arginase Activity. Nutrients 2015, 7, 5217-5238. https://doi.org/10.3390/nu7075217
Wijnands KAP, Meesters DM, Van Barneveld KWY, Visschers RGJ, Briedé JJ, Vandendriessche B, Van Eijk HMH, Bessems BAFM, Hoven NVd, Von Wintersdorff CJH, et al. Citrulline Supplementation Improves Organ Perfusion and Arginine Availability under Conditions with Enhanced Arginase Activity. Nutrients. 2015; 7(7):5217-5238. https://doi.org/10.3390/nu7075217
Chicago/Turabian StyleWijnands, Karolina A.P., Dennis M. Meesters, Kevin W.Y. Van Barneveld, Ruben G.J. Visschers, Jacob J. Briedé, Benjamin Vandendriessche, Hans M.H. Van Eijk, Babs A.F.M. Bessems, Nadine Van den Hoven, Christian J.H. Von Wintersdorff, and et al. 2015. "Citrulline Supplementation Improves Organ Perfusion and Arginine Availability under Conditions with Enhanced Arginase Activity" Nutrients 7, no. 7: 5217-5238. https://doi.org/10.3390/nu7075217