I Eat Healthier Than You: Differences in Healthy and Unhealthy Food Choices for Oneself and for Others


Abstract
:1. Introduction
1.1. Self-Other Biases
1.2. Measuring Self-Other Biases in Actual Eating Behaviors: Probing Behavioral Standards for the Self and an Average Peer
1.3. The Present Study
2. Method
2.1. Participants
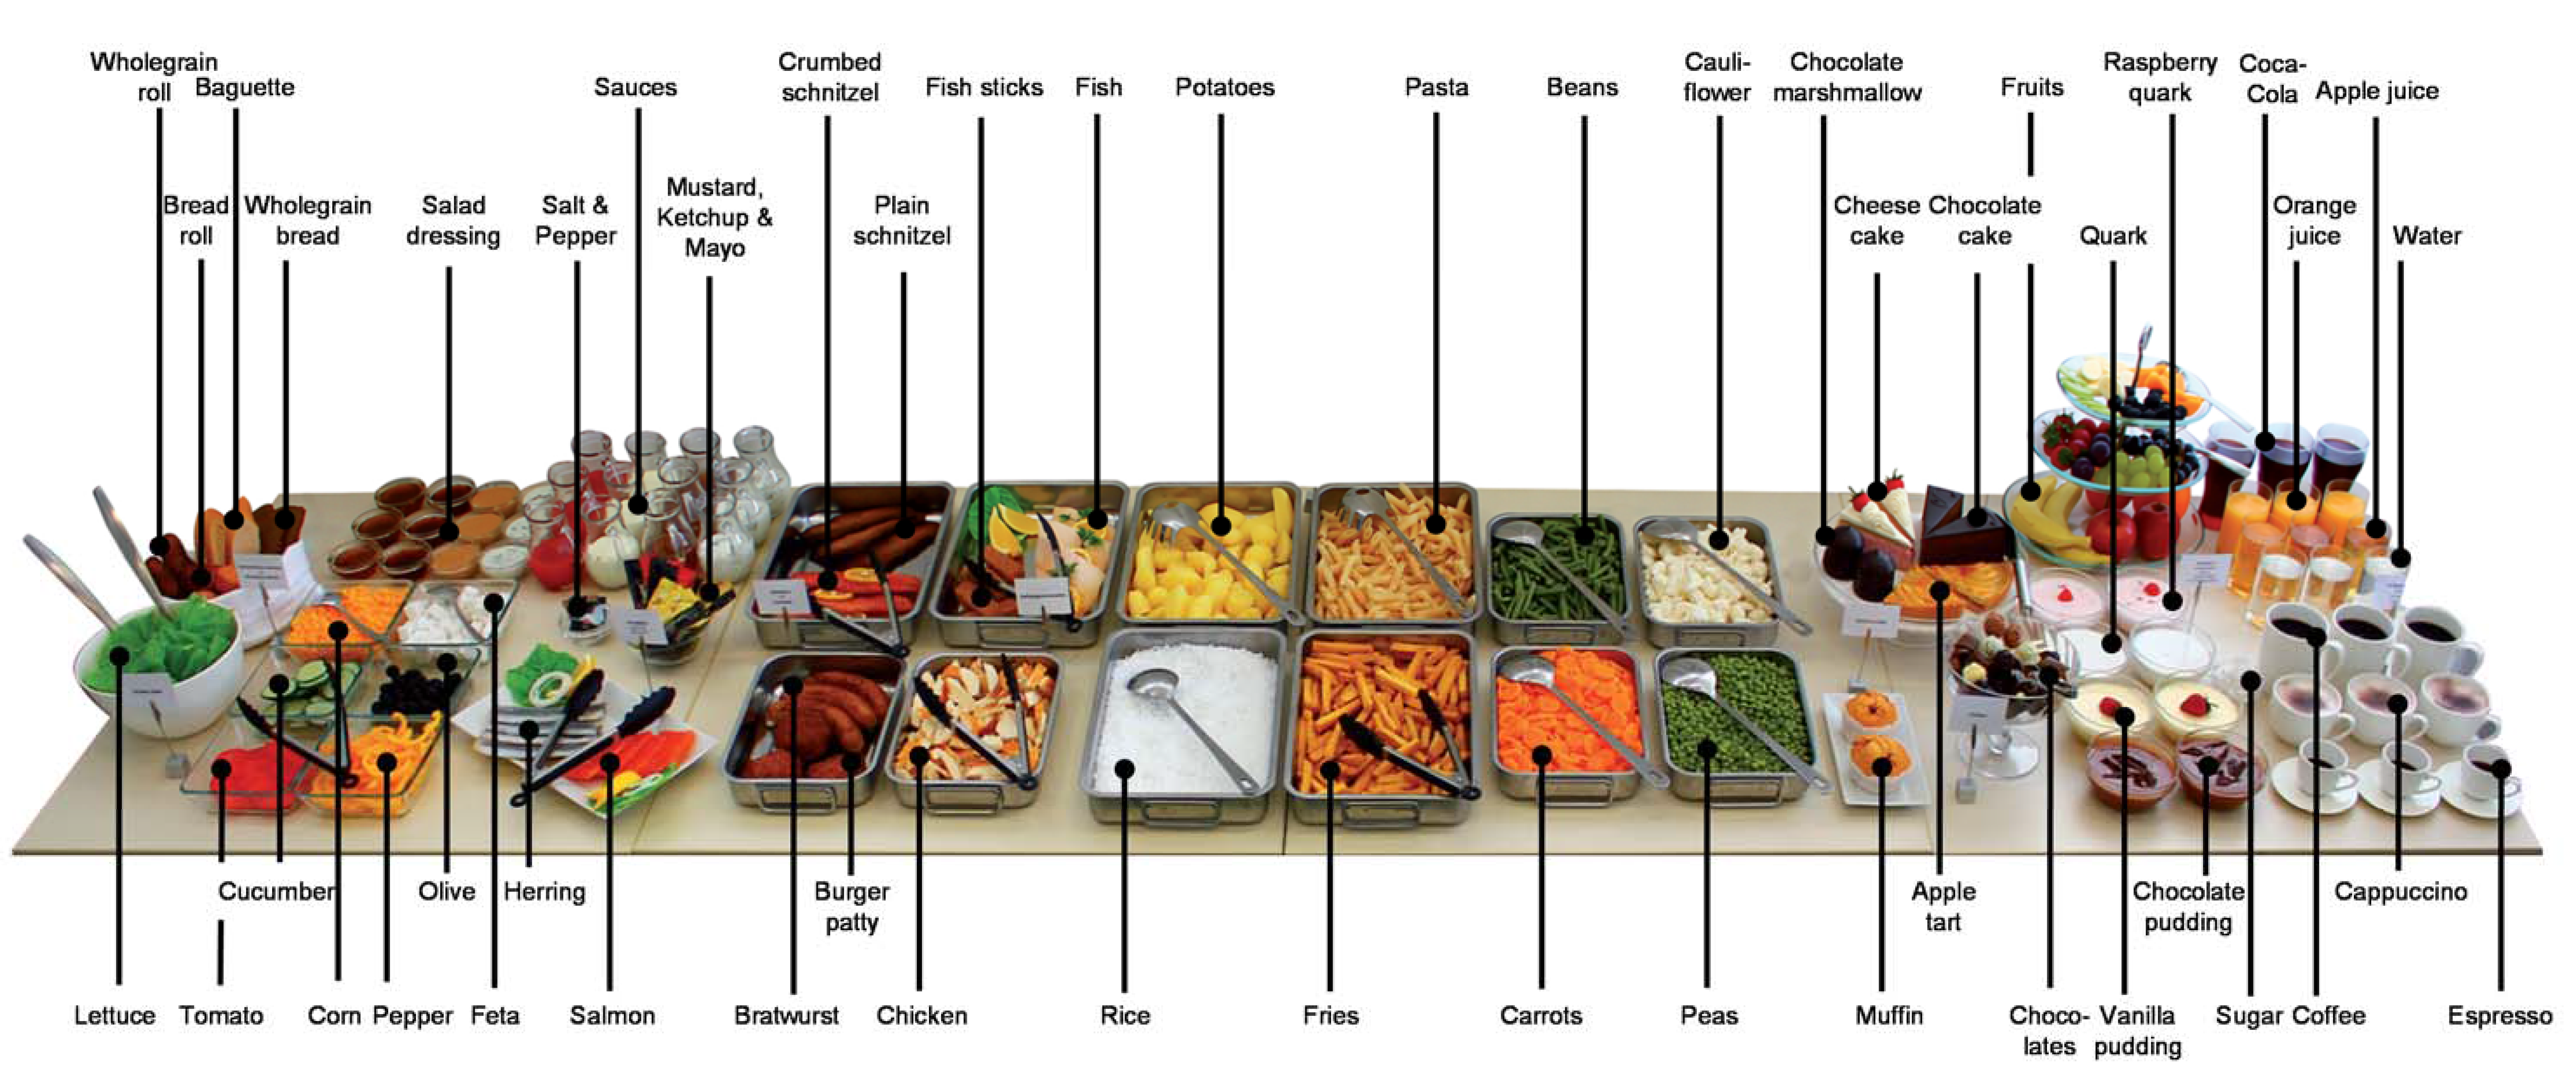
2.2. Material

2.3. Procedure
2.4. Statistical Analysis
3. Results
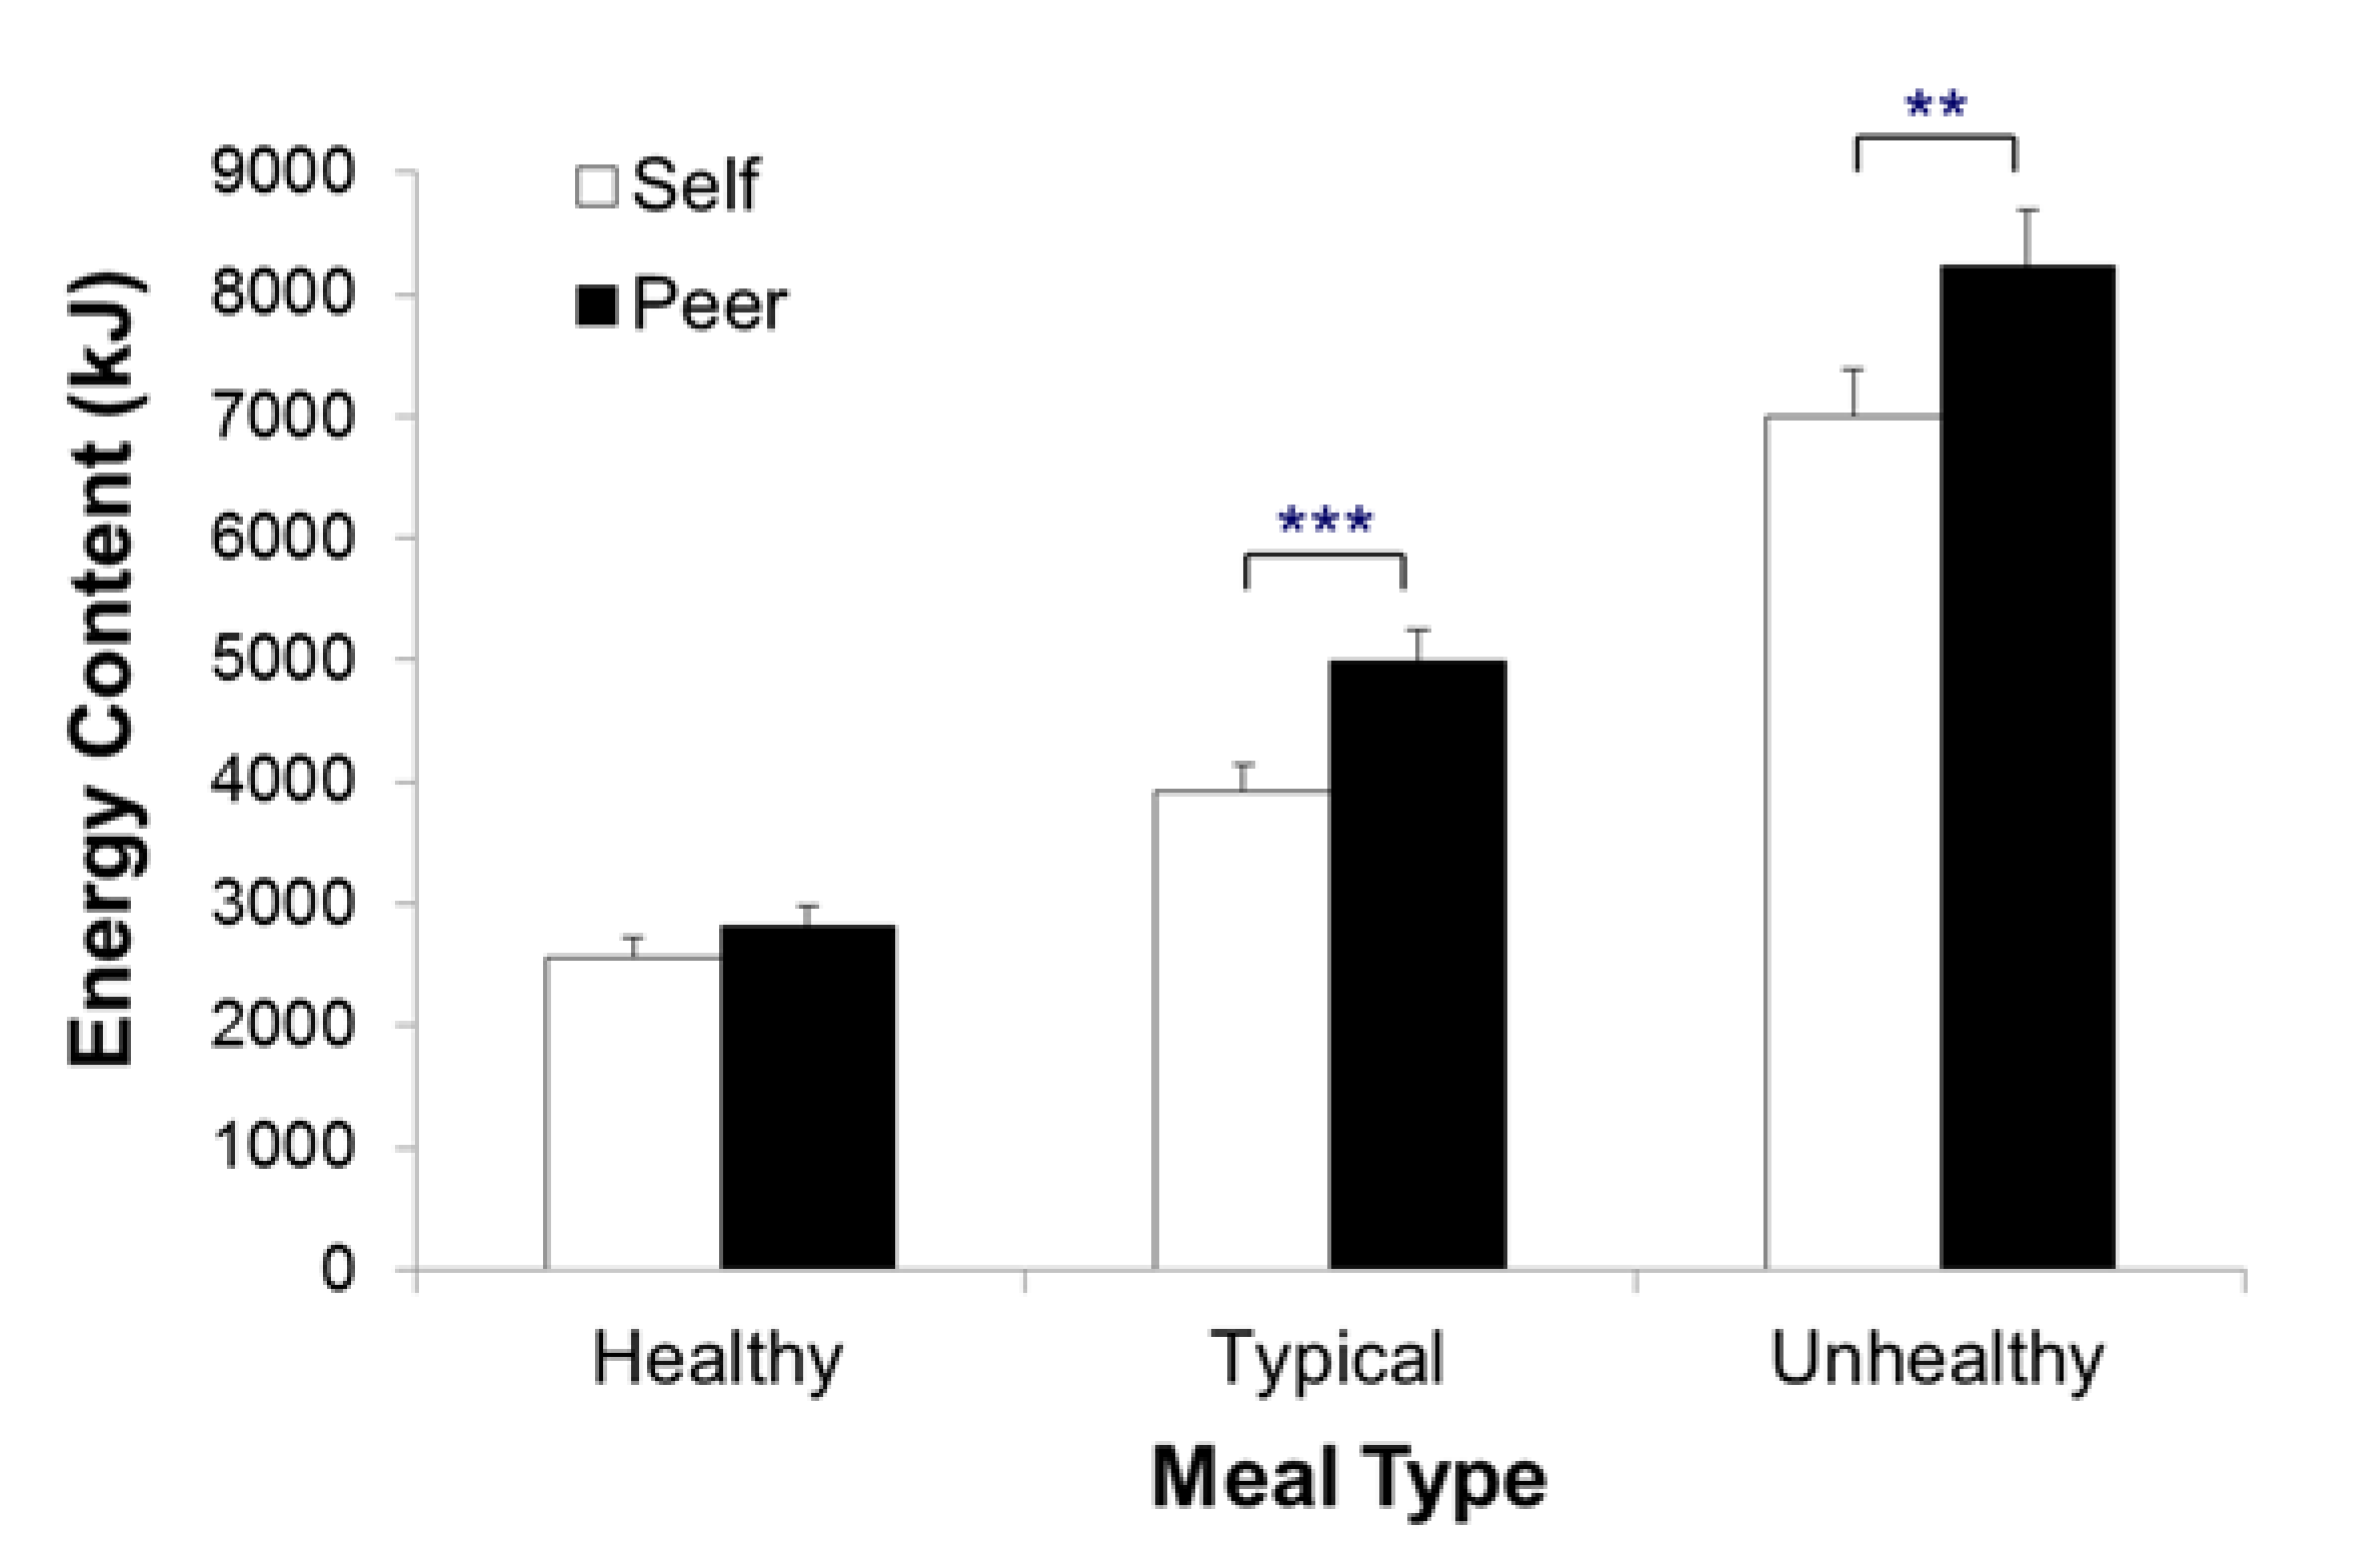
3.1. Behavioral Standards for the Self and Others: How Much Did Participants Choose?


| Effect | df Effect | df Error | F | p | η2p |
|---|---|---|---|---|---|
| 3 × 2 ANOVA with the factors meal type (healthy vs. typical vs. unhealthy) and target (self vs. peer) | |||||
| Main effect meal type | 1.38 | 81.34 | 181.36 | < 0.001 | 0.76 |
| Main effect target | 1 | 59 | 28.28 | < 0.001 | 0.32 |
| Meal type × target interaction | 1.59 | 93.87 | 3.85 | 0.034 | 0.06 |
| Simple contrasts within self | |||||
| Healthy vs. typical meal | 1 | 59 | 68.63 | < 0.001 | 0.54 |
| Typical vs. unhealthy meal | 1 | 59 | 88.69 | < 0.001 | 0.60 |
| Healthy vs. unhealthy meal | 1 | 59 | 170.25 | < 0.001 | 0.74 |
| Simple contrasts within peer | |||||
| Healthy vs. typical meal | 1 | 59 | 88.53 | < 0.001 | 0.60 |
| Typical vs. unhealthy meal | 1 | 59 | 67.49 | < 0.001 | 0.53 |
| Healthy vs. unhealthy meal | 1 | 59 | 183.90 | < 0.001 | 0.76 |
| Simple main effects target | |||||
| Healthy meal | 1 | 59 | 2.35 | 0.131 | - |
| Typical meal | 1 | 59 | 24.65 | < 0.001 | 0.30 |
| Unhealthy meal | 1 | 59 | 10.95 | 0.002 | 0.16 |
| 2 × 2 ANOVA with the factors meal discrepancy (typical-healthy vs. unhealthy-typical) and target (self vs. peer) | |||||
| Main effect meal discrepancy | 1 | 59 | 15.87 | < 0.001 | 0.21 |
| Main effect target | 1 | 59 | 5.66 | 0.021 | 0.09 |
| Meal discrepancy × target interaction | 1 | 59 | 1.12 | 0.294 | - |
| Simple main effects meal discrepancy | |||||
| Self | 1 | 59 | 19.14 | < 0.001 | 0.25 |
| Peer | 1 | 59 | 4.64 | 0.035 | 0.07 |
| Simple main effects target | |||||
| Typical-healthy meal | 1 | 59 | 9.01 | 0.004 | 0.13 |
| Unhealthy-typical meal | 1 | 59 | 0.18 | 0.672 | - |
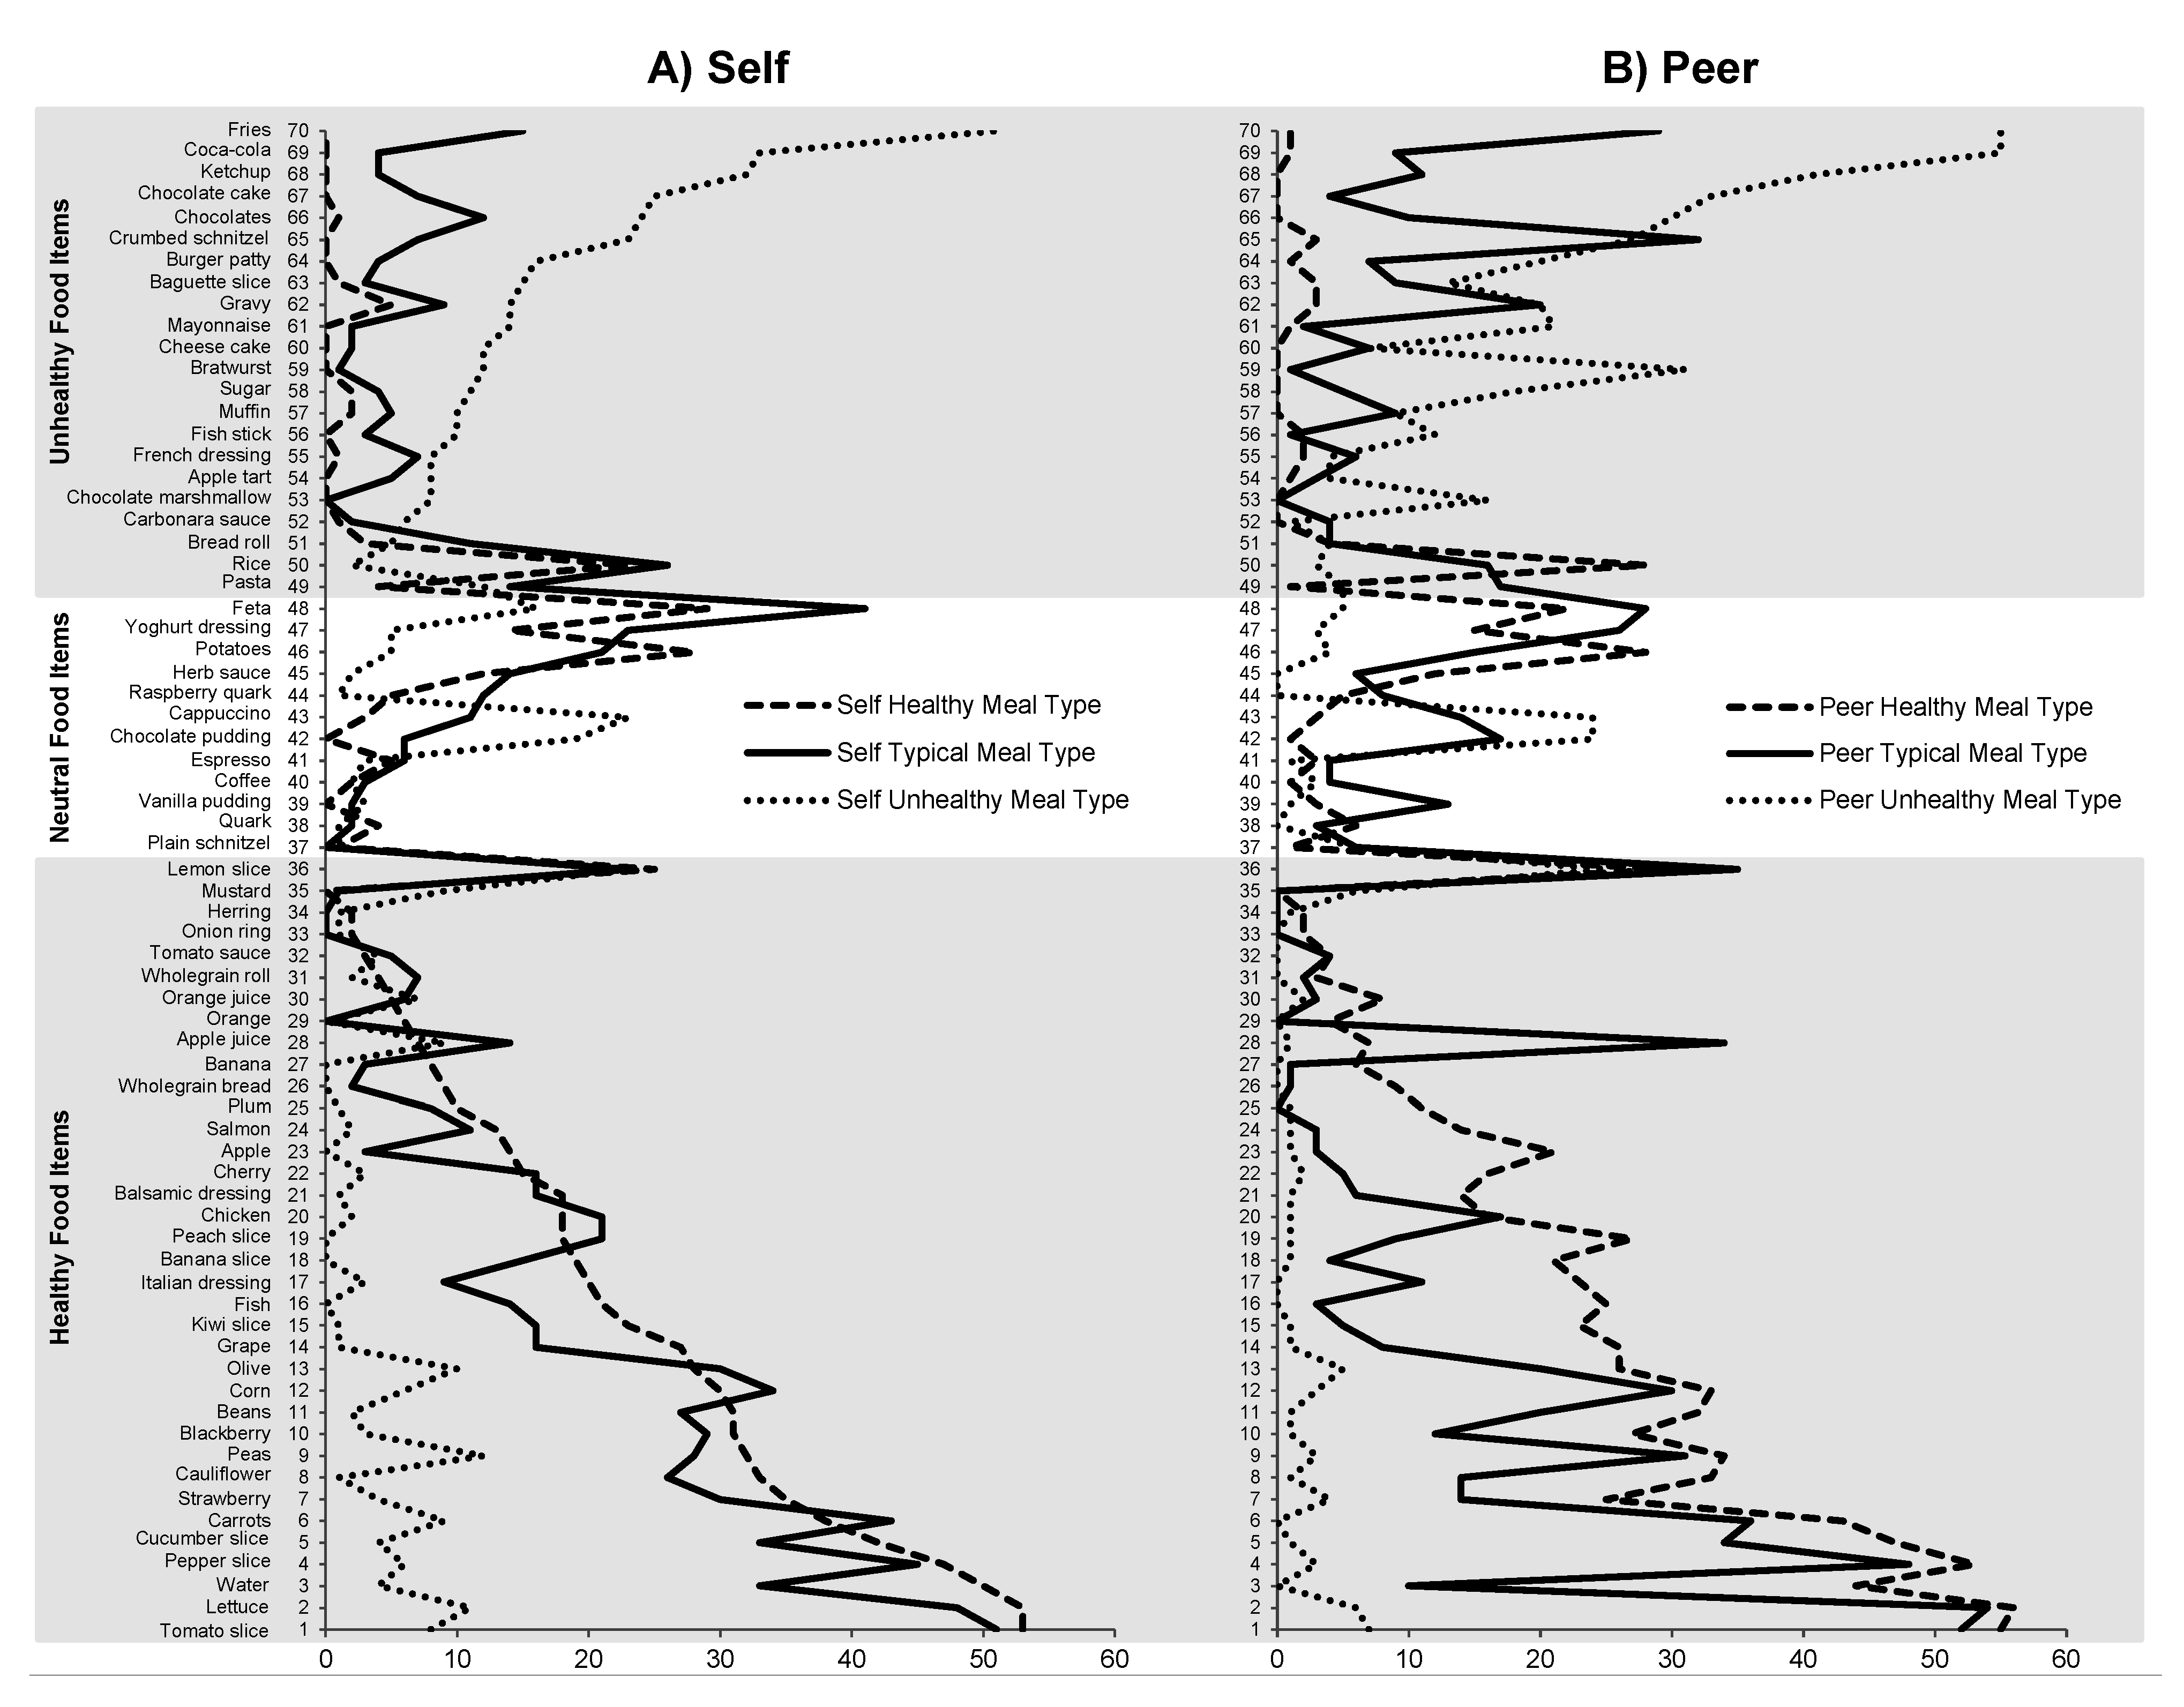
3.2. Behavioral Standards for the Self and Others: What Did Participants Choose?

| Effect | df Effect | df Error | F | p | η2p | |
|---|---|---|---|---|---|---|
| 3 × 2 × 3 ANOVA with the factors meal type (healthy vs. typical vs. unhealthy), target (self vs. peer), and food category (healthy vs. neutral vs. unhealthy) | ||||||
| Main effects and meal type × target interaction | - | - | < 2.90 | > 0.062 | - | |
| Meal type × food category interaction | 2.60 | 86.93 | 30.48 | < 0.001 | 0.48 | |
| Target × food category interaction | 2 | 67 | 8.49 | 0.001 | 0.20 | |
| Three-way interaction | 3.13 | 104.99 | 4.35 | 0.006 | 0.12 | |
| Simple contrasts within self | ||||||
| Healthy food category | ||||||
| Healthy vs. typical meal | 1 | 67 | 13.54 | < 0.001 | 0.17 | |
| Typical vs. unhealthy meal | 1 | 67 | 49.02 | < 0.001 | 0.42 | |
| Healthy vs. unhealthy meal | 1 | 67 | 58.45 | < 0.001 | 0.47 | |
| Neutral food category | 1 | 67 | < 5.22 | > 0.075 | - | |
| Unhealthy food category | ||||||
| Healthy vs. typical meal | 1 | 67 | 21.33 | < 0.001 | 0.24 | |
| Typical vs. unhealthy meal | 1 | 67 | 11.71 | 0.003 | 0.15 | |
| Healthy vs. unhealthy meal | 1 | 67 | 22.15 | < 0.001 | 0.25 | |
| Simple contrasts within peer | ||||||
| Healthy food category | ||||||
| Healthy vs. typical meal | 1 | 67 | 26.19 | < 0.001 | 0.28 | |
| Typical vs. unhealthy meal | 1 | 67 | 27.20 | < 0.001 | 0.29 | |
| Healthy vs. unhealthy meal | 1 | 67 | 57.61 | < 0.001 | 0.46 | |
| Neutral food category | 1 | 67 | < 2.17 | > 0.146 | - | |
| Unhealthy food category | ||||||
| Healthy vs. typical meal | 1 | 67 | 12.16 | 0.003 | 0.15 | |
| Typical vs. unhealthy meal | 1 | 67 | 11.03 | 0.003 | 0.14 | |
| Healthy vs. unhealthy meal | 1 | 67 | 24.66 | < 0.001 | 0.27 | |
| Simple main effects target | ||||||
| Healthy food category | ||||||
| Healthy meal | 1 | 67 | 2.75 | 0.102 | - | |
| Typical meal | 1 | 67 | 11.01 | 0.001 | 0.14 | |
| Unhealthy meal | 1 | 67 | 5.58 | 0.021 | 0.08 | |
| Neutral food category | < 0.35 | > 0.555 | - | |||
| Unhealthy food category | ||||||
| Healthy meal | 1 | 67 | 0.32 | 0.573 | - | |
| Typical meal | 1 | 67 | 2.61 | 0.111 | - | |
| Unhealthy meal | 1 | 67 | 11.67 | 0.001 | 0.15 | |
| 2 × 2 × 3 ANOVA with the factor meal discrepancy (typical-healthy vs. typical-unhealthy), target (self vs. peer), and food category (healthy vs. neutral vs. unhealthy) | ||||||
| Main effect meal discrepancy | 1 | 67 | 6.42 | 0.014 | 0.09 | |
| Main effect target | 1 | 67 | 7.58 | 0.008 | 0.10 | |
| Main effect food category and all interactions | < 2.21 | > 0.118 | - | |||
| Simple main effects meal discrepancy within self | ||||||
| Healthy food category | 1 | 67 | 30.04 | < 0.001 | 0.31 | |
| Neutral and unhealthy food category | 1 | 67 | < 2.68 | > 0.106 | - | |
| Simple main effects meal discrepancy within peer | ||||||
| Healthy, neutral and unhealthy food category | 1 | 67 | < 2.05 | > 0.157 | - | |
| Simple main effects target | ||||||
| Healthy food category | ||||||
| Typical-healthy meal | 1 | 67 | 17.91 | < 0.001 | 0.21 | |
| Unhealthy-typical meal | 1 | 67 | 2.54 | 0.115 | - | |
| Neutral and unhealthy food category | 1 | 67 | < 2.23 | > 0.140 | - | |
4. Discussion
4.1. Behavioral Standards for Different Eating Situations
4.2. Behavioral Standards for the Self as Compared to for Others
4.3. Limitations
5. Conclusions
Acknowledgments
Author Contributions
Appendix
| Food Item | Real Food (g) | Fake Food | Fake Food Unit | Energy Content | Estimation Method a | Food Category b | |
|---|---|---|---|---|---|---|---|
| kJ/100 g | kcal/100 g | ||||||
| Tomato slice | 142 | 100 | g | 75 | 18 | 1 | 1 |
| Lettuce | 69 | 100 | g | 50 | 12 | 1 | 1 |
| Water | 200 | 1 | 200 mL Portion | 0 | 0 | 1 | 1 |
| Cucumber slice | 92 | 100 | g | 50 | 12 | 1 | 1 |
| Pepper slice | 143 | 100 | g | 126 | 30 | 1 | 1 |
| Carrots | 130 | 100 | g | 138 | 33 | 1 | 1 |
| Strawberry | 18 | 1 | Piece | 134 | 32 | 1 | 1 |
| Cauliflower | 82 | 100 | g | 88 | 21 | 1 | 1 |
| Peas | 88 | 100 | g | 364 | 87 | 1 | 1 |
| Blackberry | 5 | 1 | Piece | 167 | 40 | 1 | 1 |
| Beans | 76 | 100 | g | 142 | 34 | 1 | 1 |
| Corn | 108 | 100 | g | 318 | 76 | 1 | 1 |
| Olive | 72 | 100 | g | 464 | 111 | 1 | 1 |
| Grape | 10 | 1 | Piece | 293 | 70 | 2 | 1 |
| Kiwi slice | 6 | 1 | Piece | 226 | 54 | 2 | 1 |
| Fish | 140 | 1 | Piece | 331 | 79 | 2 | 1 |
| Italian dressing | 44 | 1 | 50 ml Portion | 1247 | 298 | 1 | 1 |
| Banana slice | 11 | 1 | Piece | 377 | 90 | 2 | 1 |
| Peach slice | 14 | 1 | Piece | 172 | 41 | 1 | 1 |
| Chicken | 82 | 100 | g | 481 | 115 | 1 | 1 |
| Balsamic dressing | 44 | 1 | 50 ml Portion | 347 | 83 | 1 | 1 |
| Cherry | 13 | 1 | Pair | 251 | 60 | 1 | 1 |
| Apple | 140 | 1 | Piece | 255 | 61 | 2 | 1 |
| Salmon | 32 | 1 | Slice | 728 | 174 | 2 | 1 |
| Plum | 38 | 1 | Piece | 180 | 43 | 1 | 1 |
| Wholegrain bread | 31 | 1 | Slice | 828 | 198 | 2 | 1 |
| Banana | 126 | 1 | Piece | 377 | 90 | 2 | 1 |
| Apple juice | 200 | 1 | 200 ml Portion | 197 | 47 | 1 | 1 |
| Orange | 168 | 1 | Piece | 180 | 43 | 2 | 1 |
| Orange juice | 200 | 1 | 200 mL Portion | 180 | 43 | 1 | 1 |
| Wholegrain roll | 35 | 1 | Piece | 941 | 225 | 1 | 1 |
| Tomato sauce | 148 | 1 | 150 mL Portion | 184 | 44 | 1 | 1 |
| Onion ring | 2 | 1 | Piece | 117 | 28 | 2 | 1 |
| Herring | 70 | 1 | Slice | 929 | 222 | 2 | 1 |
| Mustard | 10 | 1 | 10 mL Portion | 360 | 86 | 1 | 1 |
| Lemon slice | 18 | 1 | Piece | 151 | 36 | 1 | 1 |
| Plain schnitzel | 125 | 1 | Piece | 849 | 203 | 2 | 2 |
| Quark | 250 | 1 | 250 mL Portion | 305 | 73 | 1 | 2 |
| Vanilla pudding | 285 | 1 | 250 mL Portion | 519 | 124 | 1 | 2 |
| Coffee | 300 | 1 | 300 mL Portion | 8 | 2 | 1 | 2 |
| Espresso | 37 | 1 | 35 mL Portion | 8 | 2 | 1 | 2 |
| Chocolate pudding | 285 | 1 | 250 mL Portion | 397 | 95 | 1 | 2 |
| Cappuccino | 220 | 1 | 220 mL Portion | 138 | 33 | 1 | 2 |
| Raspberry quark | 250 | 1 | Piece | 544 | 130 | 1 | 2 |
| Herb sauce | 150 | 1 | 150 mL Portion | 406 | 97 | 1 | 2 |
| Potatoes | 113 | 100 | g | 297 | 71 | 1 | 2 |
| Yoghurt dressing | 50 | 1 | 50 mL Portion | 607 | 145 | 1 | 2 |
| Feta | 110 | 100 | g | 1188 | 284 | 1 | 2 |
| Pasta | 87 | 100 | g | 582 | 139 | 1 | 3 |
| Rice | 110 | 100 | g | 527 | 126 | 1 | 3 |
| Bread roll | 22 | 1 | Piece | 1130 | 270 | 1 | 3 |
| Carbonara sauce | 150 | 1 | 150 mL Portion | 1402 | 335 | 1 | 3 |
| Chocolate marshmallow | 23 | 1 | Piece | 1485 | 355 | 2 | 3 |
| Apple tart | 132 | 1 | Piece | 891 | 213 | 2 | 3 |
| French dressing | 50 | 1 | 50 mL Portion | 1548 | 370 | 1 | 3 |
| Fish stick | 32 | 1 | Piece | 841 | 201 | 1 | 3 |
| Muffin | 37 | 1 | Piece | 1180 | 282 | 2 | 3 |
| Sugar | 4 | 1 | Piece | 1695 | 405 | 2 | 3 |
| Bratwurst | 140 | 1 | Piece | 1377 | 329 | 2 | 3 |
| Cheese cake | 100 | 1 | Piece | 1176 | 281 | 2 | 3 |
| Mayonnaise | 20 | 1 | 20 mL Portion | 3109 | 743 | 1 | 3 |
| Gravy | 137 | 1 | 150 mL Portion | 218 | 52 | 1 | 3 |
| Baguette slice | 24 | 1 | Piece | 1188 | 284 | 1 | 3 |
| Burger patty | 90 | 1 | Piece | 950 | 227 | 2 | 3 |
| Crumbed schnitzel | 120 | 1 | Piece | 950 | 227 | 2 | 3 |
| Chocolate | 10 | 1 | Piece | 1695 | 405 | 2 | 3 |
| Chocolate cake | 104 | 1 | Piece | 1611 | 385 | 2 | 3 |
| Ketchup | 20 | 1 | 20 mL Portion | 460 | 110 | 1 | 3 |
| Coca-Cola | 200 | 1 | 200 mL Portion | 197 | 47 | 1 | 3 |
| Fries | 82 | 100 | g | 1222 | 292 | 1 | 3 |
| Salt, Pepper | - | 1 | Portion | - | - | - | - |
Conflicts of Interest
References
- Filipovic, J. The Way America Eats Is Killing Us, Something Has to Change. Available online: http://www.theguardian.com/commentisfree/2013/sep/26/american-diet-report-card-unhealty (accessed on 15 April 2015).
- Sparks, P.; Shepherd, R.; Wieringa, N.; Zimmermanns, N. Perceived behavioral control, unrealistic optimism and dietary change: An exploratory study. Appetite 1995, 24, 243–255. [Google Scholar] [CrossRef]
- Paisley, C.M.; Sparks, P. Expectations of reducing fat intake: The role of perceived need within the theory of planned behaviour. Psychol. Health 1998, 13, 341–353. [Google Scholar] [CrossRef]
- Sproesser, G.; Klusmann, V.; Schupp, H.T.; Renner, B. Comparative optimism about healthy eating. Appetite 2015, 90, 212–218. [Google Scholar] [CrossRef] [PubMed]
- Dunning, D.; Heath, C.; Suls, J.M. Flawed self-assessment implications for health, education, and the workplace. Psychol. Sci. Public Interest. 2004, 5, 69–106. [Google Scholar] [CrossRef]
- Miles, S.; Scaife, V. Optimistic bias and food. Nutr. Res. Rev. 2003, 16, 3–19. [Google Scholar] [CrossRef] [PubMed]
- Renner, B.; Schupp, H. The Perception of health risks. In Handbook of Health Psychology; Friedman, H.S., Ed.; Oxford University Press: New York, NY, USA, 2011; pp. 637–665. [Google Scholar]
- Shepperd, J.A.; Klein, W.M.P.; Waters, E.A.; Weinstein, N.D. Taking stock of unrealistic optimism. Perspect Psychol. Sci. 2013, 8, 395–411. [Google Scholar] [CrossRef] [PubMed]
- Weinstein, N.D. Unrealistic optimism about future life events. J. Pers. Soc. Psychol. 1980, 39, 806–820. [Google Scholar] [CrossRef]
- Goethals, G.R. Constructing and ignoring social reality: positive self-appraisal consistent estimates of consensus. In Relative Deprivation and Social Comparison: The Ontario Symposium; Olson, J., Herman, C.P., Zanna, M.P., Eds.; Lawrence Erlbaum Associates: Hillsdale, NJ, USA, 1986; Volume 4, pp. 135–158. [Google Scholar]
- Epley, N.; Dunning, D. Feeling “holier than thou”: Are self-serving assessments produced by errors in self- or social prediction? J. Pers. Soc. Psychol. 2000, 79, 861–875. [Google Scholar] [CrossRef] [PubMed]
- Perloff, L.S.; Fetzer, B.K. Self-other judgments and perceived vulnerability to victimization. J. Pers Soc. Psychol 1986, 50, 502–510. [Google Scholar] [CrossRef]
- Hevey, D.; French, D.P.; Marteau, T.M.; Sutton, S. Assessing unrealistic optimism impact of different approaches to measuring susceptibility to diabetes. J. Health Psychol. 2009, 14, 372–377. [Google Scholar] [CrossRef] [PubMed]
- Balcetis, E.; Dunning, D. Considering the situation: Why people are better social psychologists than self-psychologists. Self Identit. 2013, 12, 1–15. [Google Scholar] [CrossRef]
- Dunning, D. Self-image motives and consumer behavior: How sacrosanct self-beliefs sway preferences in the marketplace. J. Consum. Psychol. 2007, 17, 237–249. [Google Scholar] [CrossRef]
- Poon, C.S.K.; Koehler, D.J.; Buehler, R. On the psychology of self-prediction: Consideration of situational barriers to intended actions. Judgm. Decis. Mak. 2014, 9, 207–225. [Google Scholar]
- Gigerenzer, G. On narrow norms and vague heuristics: Reply. Psychol. Rev. 1996, 103, 592–596. [Google Scholar] [CrossRef]
- Wansink, B.; van Ittersum, K. Fast food restaurant lighting and music can reduce calorie intake and increase satisfaction. Psychol. Rep. 2012, 111, 228–232. [Google Scholar] [CrossRef] [PubMed]
- Wansink, B. Environmental factors that increase the food intake and consumption volume of unknowing consumers. Annu. Rev. Nutr. 2004, 24, 455–479. [Google Scholar] [CrossRef] [PubMed]
- Hagger, M.S.; Panetta, G.; Leung, C.M.; Wong, G.G.; Wang, J.C.K.; Chan, D.K.C.; Keatley, D.A.; Chatzisarantis, N.L.D. Chronic inhibition, self-control and eating behavior: Test of a “resource depletion” model. PLoS ONE 2013, 8, e76888. [Google Scholar] [CrossRef] [PubMed] [Green Version]
- Brunswik, E. Representative design and probabilistic theory in a functional psychology. Psychol. Rev. 1955, 62, 193–217. [Google Scholar] [CrossRef] [PubMed]
- Dhami, M.K.; Hertwig, R.; Hoffrage, U. The role of representative design in an ecological approach to cognition. Psychol. Bull. 2004, 130, 959–988. [Google Scholar] [CrossRef] [PubMed]
- Bucher, T.; van der Horst, K.; Siegrist, M. The fake food buffet—A new method in nutrition behaviour research. Br. J. Nutr. 2012, 107, 1553–1560. [Google Scholar] [CrossRef] [PubMed]
- Kirkwood, L.; Aldujaili, E.; Drummond, S. Effects of advice on dietary intake and/or physical activity on body composition, blood lipids and insulin resistance following a low-fat, sucrose-containing, high-carbohydrate, energy-restricted diet. Int. J. Food Sci. Nutr. 2007, 58, 383–397. [Google Scholar] [CrossRef] [PubMed]
- Ethische Richtlinien der DGPs und des BDP. Available online: http://www.dgps.de/index.php?id=96422 (accessed on 9 May 2014).
- Bucher, T.; van der Horst, K.; Siegrist, M. Fruit for dessert. How people compose healthier meals. Appetite 2013, 60, 74–80. [Google Scholar] [CrossRef] [PubMed]
- Gesellschaft für optimierte Ernährung. Optidiet Basic. Available online: http://www.goe-software.de/WordPress/?page_id =1278 (accessed on 21 April 2015).
- Stehle, P.; Oberritter, H.; Büning-Fesel, M.; Heseker, H. Grafische Umsetzung von Ernährungsrichtlinien-traditionelle und neue Ansätze. Ernährungs-Umschau 2005, 52, 128–135. [Google Scholar]
- Oberritter, H.; Schäbethal, K.; von Ruesten, A.; Boeing, H. The DGE nutrition circle—Presentation and basis of the food-related recommendations from the German Nutrition Society (DGE). Ernährungs-Umschau Int. 2013, 2, 24–29. [Google Scholar]
- Curran, P.J.; West, S.G.; Finch, J.F. The robustness of test statistics to nonnormality and specification error in confirmatory factor analysis. Psychol. Methods 1996, 1, 16–29. [Google Scholar] [CrossRef]
- Coppinger, T.; Jeanes, Y.M.; Dabinett, J.; Vogele, C.; Reeves, S. Physical activity and dietary intake of children aged 9–11 years and the influence of peers on these behaviours: A 1-year follow-up. Eur. J. Clin. Nutr. 2010, 64, 776–781. [Google Scholar] [CrossRef] [PubMed]
- Krebs-Smith, S.M.; Guenther, P.M.; Subar, A.F.; Kirkpatrick, S.I.; Dodd, K.W. Americans do not meet federal dietary recommendations. J. Nutr. 2010, 140, 1832–1838. [Google Scholar] [CrossRef] [PubMed]
- De Graaf, C. Effects of snacks on energy intake: An evolutionary perspective. Appetite 2006, 47, 18–23. [Google Scholar] [CrossRef] [PubMed]
- Wegner, D.M. Ironic processes of mental control. Psychol. Rev. 1994, 101, 34–52. [Google Scholar] [CrossRef] [PubMed]
- Adriaanse, M.A.; van Oosten, J.M.; de Ridder, D.T.; de Wit, J.B.; Evers, C. Planning what not to eat: Ironic effects of implementation intentions negating unhealthy habits. Pers. Soc. Psychol. Bull. 2011, 37, 69–81. [Google Scholar] [CrossRef] [PubMed]
- Lake, A.A.; Hyland, R.M.; Rugg-Gunn, A.J.; Wood, C.E.; Mathers, J.C.; Adamson, A.J. Healthy eating: Perceptions and practice (the ash 30 study). Appetite 2007, 48, 176–182. [Google Scholar] [CrossRef] [PubMed]
- Lynch, E.B.; Holmes, S.; Keim, K.; Koneman, S.A. Concepts of healthful food among low-income African American women. J. Nutr. Educ. Behav. 2012, 44, 154–159. [Google Scholar] [CrossRef] [PubMed]
- Margetts, B.M.; Martinez, J.A.; Saba, A.; Holm, L.; Kearney, M. Definitions of “healthy” eating: A pan-EU survey of consumer attitudes to food, nutrition and health. Eur. J. Clin. Nutr. 1997, 51, 23–29. [Google Scholar]
- Paquette, M.C. Perceptions of healthy eating—State of knowledge and research gaps. Can. J. Public Health 2005, 96, 15–19. [Google Scholar]
- Oakes, M.E.; Slotterback, C.S. Manipulations that influence stereotypes of the weight-gain potential of foods. Food Qual. Prefer. 2007, 18, 548–554. [Google Scholar] [CrossRef]
- Rothman, A.J.; Klein, W.M.; Weinstein, N.D. Absolute and relative biases in estimations of personal risk. J. Appl. Soc. Psychol. 1996, 26, 1213–1236. [Google Scholar] [CrossRef]
- Patel, K.A.; Schlundt, D. Impact of moods and social context on eating behavior. Appetite 2001, 36, 111–118. [Google Scholar] [CrossRef] [PubMed]
- Armor, D.A.; Taylor, S.E. Situated optimism: Specific outcome expectancies and self-regulation. Adv. Exp. Soc. Psychol. 1998, 30, 309–379. [Google Scholar]
- Harris, P.R.; Griffin, D.W.; Murray, S. Testing the limits of optimistic bias: Event and person moderators in a multilevel framework. J. Pers. Soc. Psychol. 2008, 95, 1225–1237. [Google Scholar] [CrossRef] [PubMed]
- Statistisches Bundesamt. Available online: https://www.gbe-bund.de/stichworte/BMI.html (accessed on 11 May 2015).
- USDA Choosemyplate. Available online: http://www.choosemyplate.gov/index.html (accessed on 15 April 2015).
© 2015 by the authors; licensee MDPI, Basel, Switzerland. This article is an open access article distributed under the terms and conditions of the Creative Commons Attribution license (http://creativecommons.org/licenses/by/4.0/).
Share and Cite
Sproesser, G.; Kohlbrenner, V.; Schupp, H.; Renner, B. I Eat Healthier Than You: Differences in Healthy and Unhealthy Food Choices for Oneself and for Others. Nutrients 2015, 7, 4638-4660. https://doi.org/10.3390/nu7064638
Sproesser G, Kohlbrenner V, Schupp H, Renner B. I Eat Healthier Than You: Differences in Healthy and Unhealthy Food Choices for Oneself and for Others. Nutrients. 2015; 7(6):4638-4660. https://doi.org/10.3390/nu7064638
Chicago/Turabian StyleSproesser, Gudrun, Verena Kohlbrenner, Harald Schupp, and Britta Renner. 2015. "I Eat Healthier Than You: Differences in Healthy and Unhealthy Food Choices for Oneself and for Others" Nutrients 7, no. 6: 4638-4660. https://doi.org/10.3390/nu7064638