
Dietary Flavonoid Intake and Cancer Mortality: A Population-Based Cohort Study
1
Department of Radiotherapy and Oncology, The Affiliated Hospital of Jiangnan University, Wuxi 214062, China
2
Department of Breast Diseases, Wuxi Maternal and Child Health Hospital, Women’s Hospital of Jiangnan University, Jiangnan University, Wuxi 214000, China
*
Author to whom correspondence should be addressed.
Nutrients 2023, 15(4), 976; https://doi.org/10.3390/nu15040976
Submission received: 17 December 2022
/
Revised: 8 February 2023
/
Accepted: 13 February 2023
/
Published: 15 February 2023
(This article belongs to the Section Nutritional Epidemiology)
Abstract
:Cancer is a leading cause of death worldwide, posing a huge burden upon society and individuals. The adequate intake of fruit and vegetables is reported to be an effective strategy for primary cancer prevention. Fruits and vegetables are rich in nutrients, such as vitamins and flavonoids, which may reduce the occurrence and progression of cancers. However, the importance of each flavonoid and the sub-classes remains controversial regarding cancer mortality. The population benefiting from increased flavonoid intake has not been determined. An estimation of cancer mortality by flavonoid intake is not established. We explored the association between the intake of flavonoids and cancer mortality amongst 14,029 participants in the National Health and Nutrition Examination Survey. During a median follow-up of 117 months, 405 cancer deaths were confirmed. Being in the second, third, and fourth quartiles of flavonol intake, the cancer mortality was inversely associated with the intake of flavonols (multivariate analysis HR (95% CI] 0.58 [0.36, 0.91], p = 0.02, Q1 vs. Q2; 0.55 [0.31, 0.96], p = 0.04, Q1 vs. Q3; 0.54 [0.30, 0.99], p = 0.05, Q1 vs. Q4, respectively). Potential effects of dietary flavonol intake against cancer death was observed especially in participants aged 50 or above, males, whites, former smokers, people who used to drink or drink alcohol mildly, people without hyperlipidemia, and people with hypertension. Moreover, the dietary intakes of peonidin, naringenin, and catechin were inversely associated with cancer mortality (multivariate HR [95% CI] 0.93 [0.88,0.98], p = 0.01; 0.97 (0.95,1.00), p = 0.03; 0.98 (0.96,1.00), p = 0.05, respectively). Furthermore, a nomogram based on flavonol intake is feasible for assessing cancer mortality for each participant. Taken together, our results could improve personalized nutrition amongst cancer patients.
1. Introduction
Cancer is a disease resulting from the uncontrolled growth and division of abnormal cells in the body and is the leading cause of death and an important obstacle to extending life expectancy worldwide [1]. It was estimated that cancer ranked as the first or second leading cause of death in the population aged below 70 years in more than 60% of countries and ranked third or fourth in the remaining countries in 2019 [1]. There were an estimated 19.3 million new cases and 10 million cancer deaths in 2020 [1]. Primary prevention is a pivotal strategy with which to decrease the growing burden of cancer. However, establishing high-quality cancer prevention remains a challenge [1]. Nearly one-third of cancer-related deaths could be prevented using balanced dietary improvements in the US [2]. The adequate consumption of fruit and vegetables presented the considerable potential to reduce the occurrence and progression of cancer [3,4]. Dietary flavonoids are a group of natural polyphenols, present in fruit, cereal, vegetables, tea, and red wine [2]. Two benzene rings connected by a heterocyclic pyran ring consist of the basic—structure of flavonoids [5]. Flavonoids are subcategorized into six subclasses based on the linking arrangement and the saturation of the double bond on the pyran structure, including anthocyanins, flavan-3-ols, flavanones, flavones, flavonols, and isoflavones [5]. Studies in vitro demonstrated that flavonoids could induce apoptosis and inhibit cell proliferation and metastasis by targeting the key molecules and signaling pathways in various tumor cells [6,7,8,9]. However, the results of epidemiological studies on the association between dietary flavonoid intake and cancer mortality remain inconsistent. Some previous studies on total flavonoid intake and all-cause cancer mortality did not reveal the inverse association [10,11]. More recent research demonstrated a beneficial association between total dietary flavonoid intake and cancer mortality [12,13]. Moreover, whether people with an unhealthy lifestyle could benefit from increased dietary flavonoid intake needs to be elucidated.
To explore the association between dietary flavonoid intake and cancer-related mortality, we downloaded all the publicly available data in the Database of Flavonoid Values for USDA Food Codes and Flavonoid Intake Data Files from What We Eat in America (WWEIA), National Health, and Nutrition Examination Survey (NHANES) [14]. Until 16 December 2022, only the data in 2007-2010 and 2017-2018 were released by the USDA [14]. Therefore, our study explored the association between dietary flavonoid intake and cancer-related mortality in 2007-2010 and 2017-2018, which included all the publicly accessible data [14]. We revealed that in comparison to being in the first quartile of dietary flavonol intake, being in the second, third, and fourth quartile was inversely associated with cancer-related mortality. Furthermore, potential protective effects of dietary flavonol intake against cancer death was observed, especially in former smokers, mild drinkers, and people who used to drink, which suggests that changing an unhealthy lifestyle is also important. A nomogram based on dietary flavonol intake is clinically adaptable to assessing cancer mortality among individuals.
2. Materials and Methods
NHANES is a program of studies designed to evaluate the health and nutritional status of adults and children in the US. NHANES is a program of the National Center for Health Statistics, which is part of the Centers for Disease Control and Prevention [15]. The NHANES directors can be accessed at [16]. The protocols for NHANES surveys were approved by the NCHS Ethics Review Board. The approval number for the survey year cycles 2007-2008 and 2009-2010 was the Continuation of Protocol #2005-06. The approval numbers for the survey year cycle 2017–2018 were the Continuation of Protocol #2011-17 (Effective through 26 October 2017) and Protocol #2018-01 (Effective beginning 26 October 2017) [17]. All participants signed a written informed consent form.
All data in our study are publicly available and without personally identifiable information. All analyses were conducted following the relevant guidelines and regulations [18]. The survey process consisted of two steps. Demographic and health-related information was collected in the homes of participants during the first interview. After that, a standardized physical examination was carried out in a mobile examination center two weeks later, as well as a blood draw,24-h dietary recall, and other investigations, such as laboratory analysis of urine, microbiome sampling of the oral cavity, and so on. We obtained 18,538 participants aged 18 years or above in the continuous NHANES cycles of 2007–2010 and 2017–2018 with complete mortality information: among them were 14,490 participants with complete data from the dietary flavonoid intake assessment.
2.1. Dietary Flavonoid Intake Assessment
The dietary flavonoid values in our study were obtained from the database of flavonoid values for USDA Survey Foods and Beverages (flavonoid database for short), which was established in 2003–2004 [19]. The flavonoid database provides the flavonoid values in foods and beverages in the USDA Food and Nutrient Database for Dietary Studies (FNDDS) [20] and corresponding dietary data from WWEIA [21] and NHANES. The amounts of 29 flavonoids (mg/100 g) in each food/beverage were determined by the USDA Nutrient Data Laboratory [22]. The dietary intake of flavonoids was calculated on days 1 and 2, including the six main flavonoid subclasses commonly consumed in the US diet, namely total anthocyanins (cyanidin, delphinidin, malvidin, pelargonidin, peonidin, and petunidin), total flavan-3-ols ((-)-epicatechin, (-)-epicatechin 3-gallate, (-)-epigallocatechin, (-)-epigallocatechin 3-gallate, (+)-catechin, (+)-gallocatechin, theaflavin, theaflavin-3,3′-digallate, theaflavin-3′-gallate, theaflavin-3-gallate, and thearubigins), total flavanones (eriodictyol, hesperetin, and naringenin), total flavones (apigenin and luteolin), total flavonols (isohamnetin, kaempferol, myricetin, and quercetin), total isoflavones (diadzein, genistein, and glycitein), and subtotal catechins ((-)-epicatechin, (-)-epicatechin 3-gallate, (-)-epigallocatechin, (-)-epigallocatechin 3-gallate, (+)-catechin, and (+)-gallocatechin). The retention factors for cooked foods were introduced in the estimation of the flavonoid amounts. For moist-heat cooking, a loss of 50% was applied to anthocyanidins, as well as one reduction of 15% to flavonols, flavan-3-ols, flavanones, and flavones. No retention factors were implemented for isoflavones and dry heat cooking [20]. The association between individual flavonoid intake grouped by flavonoid subclasses was analyzed using the Pearson correlation method.
Based on the stratified and multistage probability sampling designed in the NHANES, we used the mean of the two-day intake of each flavonoid, as well as the weights “wtdr2d” constructed for participants who completed two days of dietary recall in making estimates representative of the US non-hospitalized population [18].
2.2. Mortality Ascertainment
The updated follow-up date was 31st December 2019. A total of 14,092 participants with an available survival status were included in our study. The time in months from the household interview to mortality was assessed as the follow-up time. A death caused by cancer was ascertained by the National Death Index and International Classification of Diseases-10 C00-C97 as a malignant neoplasm. A potential nonlinear association between total flavonol intake and cancer mortality was evaluated using restricted cubic splines. The association between flavonoid intake and cancer mortality was assessed using Cox proportional hazards analysis.
2.3. Covariate Assessment
Covariates, i.e., age, ethnicity, education, marital status, poverty income ratio (PIR), smoking status, alcohol use, and physical activity (PA), were collected via questionnaires. Educational status was classified according to the number of years of education as <9 years, 9–12 years, and >12 years. Marital status was divided into partnered and unpartnered. The body mass index (BMI) was calculated as weight (kg)/height squared (m2). The term “never” regarding the smoking status was defined as fewer than 100 cigarettes during life; “former” as more than 100 cigarettes during life and not at all currently smoking; and “now” as more than 100 cigarettes during life and smoking some days or every day. The classification of alcohol usage was as described in [23]. The healthy eating index (HEI) was calculated based on the 2015 version using the sum of food intake on days 1 and 2 for each participant [24]. The dietary inflammatory index (DII) was calculated as described in [25]. We used the total time and the total metabolic equivalent (MET) of PA for one week.
Regarding the perspectives of disease diagnosis, hyperlipidemia was defined as meeting one of the following conditions: triglyceride ≧ 150 mg/dL, low-density lipoprotein ≧ 130 mg/dL, high-density lipoprotein < 140 ng/dL, or usage of lipid-lowering drugs. Cardiovascular disease was defined as having ever had a heart attack or stroke. Participants were diagnosed as having the chronic obstructive pulmonary disease (COPD) when meeting one of the following conditions: the value of forced expiratory volume at first second/forced vital capacity (FEV1/FVC) < 0.7 after the application of a bronchodilator; having been told you had emphysema; using COPD drugs selective phos-phodiesterase-4 inhibitors, mast cell stabilizers leukotriene modifiers, and inhaled corticosteroids. Participants were diagnosed as having asthma when meeting one of the following conditions: having been told you had asthma; had an asthma attack; the application of selective phos-phodiesterase-4 inhibitors, or mast cell stabilizers leukotriene modifiers and inhaled corticosteroids. Participants with both COPD and asthma were coded as ACO. Stroke history was defined as having ever had a stroke. Cancer history was defined as having ever had cancer. Average blood pressure was calculated as [26], and participants were diagnosed as having hypertension when meeting one of the following conditions: systolic pressure≧ 140 mmHg or diastolic pressure ≧ 90 mmHg on three occasions. Participants were diagnosed as having type 2 diabetes mellitus (DM) when meeting one of the following conditions: having been told you had diabetes; HbA1c ≧ 6.5%, fasting glucose ≧ 7.0 mmol/L, glucose ≧ 11.1 mmol/L, oral glucose tolerance test ≧ 11.1 mmol/L; or usage of antidiabetic drugs. Missing covariates were imputed by the R package “mice”.
2.4. Flavonoid Supplement Identification
All dietary flavonoid supplement names and ingredients from the NHANES database were text-mined for key phrases to identify the products. Search terms used to identify flavonoid supplements and relevant results are shown in Supplementary Table S1.
2.5. Urinary Isoflavone Metabolite Assessment
The levels of isoflavone metabolites, including daidzein (ng/mL), equol (ng/mL), genistein (ng/mL), and O-desmethylangolensin (O-DMA, ng/mL) in the urine, were obtained from the NHANES, which were measured by high-performance liquid chromatography-atmospheric pressure photoionization-tandem mass spectrometry. Only the data in the year 2007–2010 were publicly accessible in the survey years of our study. The association between urinary isoflavone metabolite levels and cancer-related mortality was analyzed using Cox proportional hazards analysis. Meanwhile, the special weights “wtsb2yr” or “wtsa2yr” for special urine examination were employed in the Cox analysis.
2.6. Statistical Analysis
The R packages “NHANESR” and “survey” were employed for data preparation and statistical analysis. Continuous variables are demonstrated as the mean ± standard deviation, median, and percentile range, and categorical variables are presented as percentages. The potential nonlinear association was evaluated using restricted cubic splines with the R package “rms”. Cox proportional hazards models were used to calculate hazard ratios (HRs) and 95% confidence intervals (95% CIs). A p value < 0.05 was used as a cut-off for statistical significance. A weighted survey nomogram with the intake of flavonols was established and validated via a calibration curve for predicting the 10-year survival probability amongst participants using the R packages “rms” and “SvyNom” [27]. All analyses were conducted using R software (version 4.1.3, the R Foundation for Statistical Computing).
3. Results
3.1. Characteristics of Flavonoid Intake
A total of 14,029 participants with complete survival information, intake of flavonoids, and relevant survey weights were included in our study. The minimum, 25th percentile, median, mean, 75th percentile, and maximum of each flavonoid intake were listed in Table 1.
In addition, the associations between individual flavonoids were assessed based on the main subclasses of flavonoid. The intakes of individual flavan-3-ol, catechins, isoflavones, and flavones were strongly associated with each other (p < 0.001, Figure 1a,b,e,g). Except for the intake of pelargonidin, the individual anthocyanidin was significantly associated with each other (p < 0.05, Figure 1c). The intakes of hesperetin and naringenin were strongly associated with each other (p < 0.001, Figure 1d). The intake of eriodictyol showed a significant association with the intake of hesperetin and showed no correlation to naringenin (Figure 1d). Except for the intake of isorhamnetin, the intake of the rest of the flavonols was strongly associated with each other (Figure 1f). The results above might suggest that the intake of pelargonidin, eriodictyol, and isorhamnetin may have a different dietary origin from the subclasses to which they belong. For example, fruits are divided into groups based on the types of anthocyanin aglycones, i.e., pelargonidin group, cyanidin/peonidin group, and multiple anthocyanins group. The pelargonidin group mainly contains strawberries [28].
3.2. Baseline Characteristics of the Cohort
A total of 405 (2.97%) cancer-related deaths were ascertained over the follow-up period by 31st December 2019. The characteristics of death cases caused by cancer are summarized in Table 1. Compared to those who were alive, participants who died of cancer were older (65.93 ± 0.89, p < 0.0001); more frequently male (57.30%, p < 0.001); more frequently white (77.71%, p = 0.002); with less than 12 years of education (p < 0.0001); poorer (with lower PIR, 2.65 ± 0.15, p < 0.0001); with less daily energy intake (3828.29 ± 112.64 kcal, p = 0.01); with a higher DII (1.77 ± 0.12, p = 0.02); less so non-smokers (p < 0.0001); and more so former alcoholics (p < 0.0001) (Table 1). In addition, deceased participants had a higher prevalence of DM (38.79%, p < 0.0001), hypertension (73.80%, p < 0.0001), CVD (34.16%, p < 0.0001), cancer (19.47%, p < 0.001), and respiratory diseases (32.40%, p < 0.0001). Most of those who died of cancer depicted a low dietary intake of daidzein, genistein, glycitein, petunidin, delphinidin, malvidin, peonidin, epicatechin, naringenin, luteolin, kaempferol, myricetin, total isoflavones, total anthocyanidins, total flavones, and total flavonols (Table 2).
Due to the seven-year gap in the data available, the baseline characteristics of the study population are compared according to the survey year cycles in Table 3. There was an increase in the dietary intake of genistein, glycitein, petunidin, peonidin, and total isoflavones, and total anthocyanidins during the 2007–2008, 2009–2010, and 2017–2018 year cycles. Dietary flavonoid intake first increased in 2009–2010 and then decreased in 2017–2018 compared to 2007–2008, e.g., cyanidin, delphinidin, eriodictyol, hesperetin, apigenin, quercetin, and total flavanones. Dietary intake of the remaining flavonoids stayed the same across the different year cycles (Table 3). Moreover, there was an increase in the frequency of participants with more than 12 years of education, the frequency of non-smokers, the frequency of participants without respiratory diseases, and BMI during the different year cycles (Table 3). The highest total score regarding the HEI occurred in 2009–2010, while the lowest DII, total time of PA, and total MET of PA were present in 2009–2010 (Table 3). The incidence of hyperlipemia and the frequency of non-alcoholics decreased during the three-year cycles (Table 3).
3.3. Dietary Flavonoid Intake
In addition, we compared the age-adjusted and gender-adjusted mean dietary intake of flavonoid subclasses across the ethnic groups using linear regression. Relative to white participants, black participants had a lower mean catechin intake (mean difference 30.28 mg/day, p < 0.0001), lower mean isoflavone intake (0.72 mg/day, p = 0.01), lower mean anthocyanidin intake (7.14 mg/day, p < 0.0001), lower mean flavan-3-ol intake (72.57 mg/day, p < 0.0001), higher mean flavanone intake (3.40 mg/day, p < 0.0001), lower mean flavone intake (0.37 mg/day, p < 0.0001), lower mean flavonol intake (4.62 mg/day, p < 0.0001), and lower mean flavonoid intake (82.02 mg/day, p < 0.0001) (Table 4). Similarly, Mexican-American participants had a lower mean catechin intake (35.20 mg/day; p < 0.0001), lower mean anthocyanidin intake (6.09 mg/day, p < 0.001), lower mean flavan-3-ol intake (98.11 mg/day, p < 0.0001), higher mean flavanone intake (5.55 mg/day, p < 0.0001), and lower mean flavonol intake (3.70 mg/day, p < 0.0001), and lower mean flavonoid intake (102.34-mg/day, p < 0.0001), in comparison to white participants (Table 4). Other ethnic participants had a lower mean flavan-3-ol intake (34.54 mg/day, p = 0.02), higher mean flavanone intake (4.00 mg/day, p < 0.001), and lower mean flavonoid intake (32.55 mg/day, p = 0.03), in comparison to white participants (Table 4). In addition, the intake of flavonoid subclasses was stratified by age, gender, and ethnicity (Table 4).
3.4. Associations between Dietary Flavonoid Intake and Cancer-Related Mortality
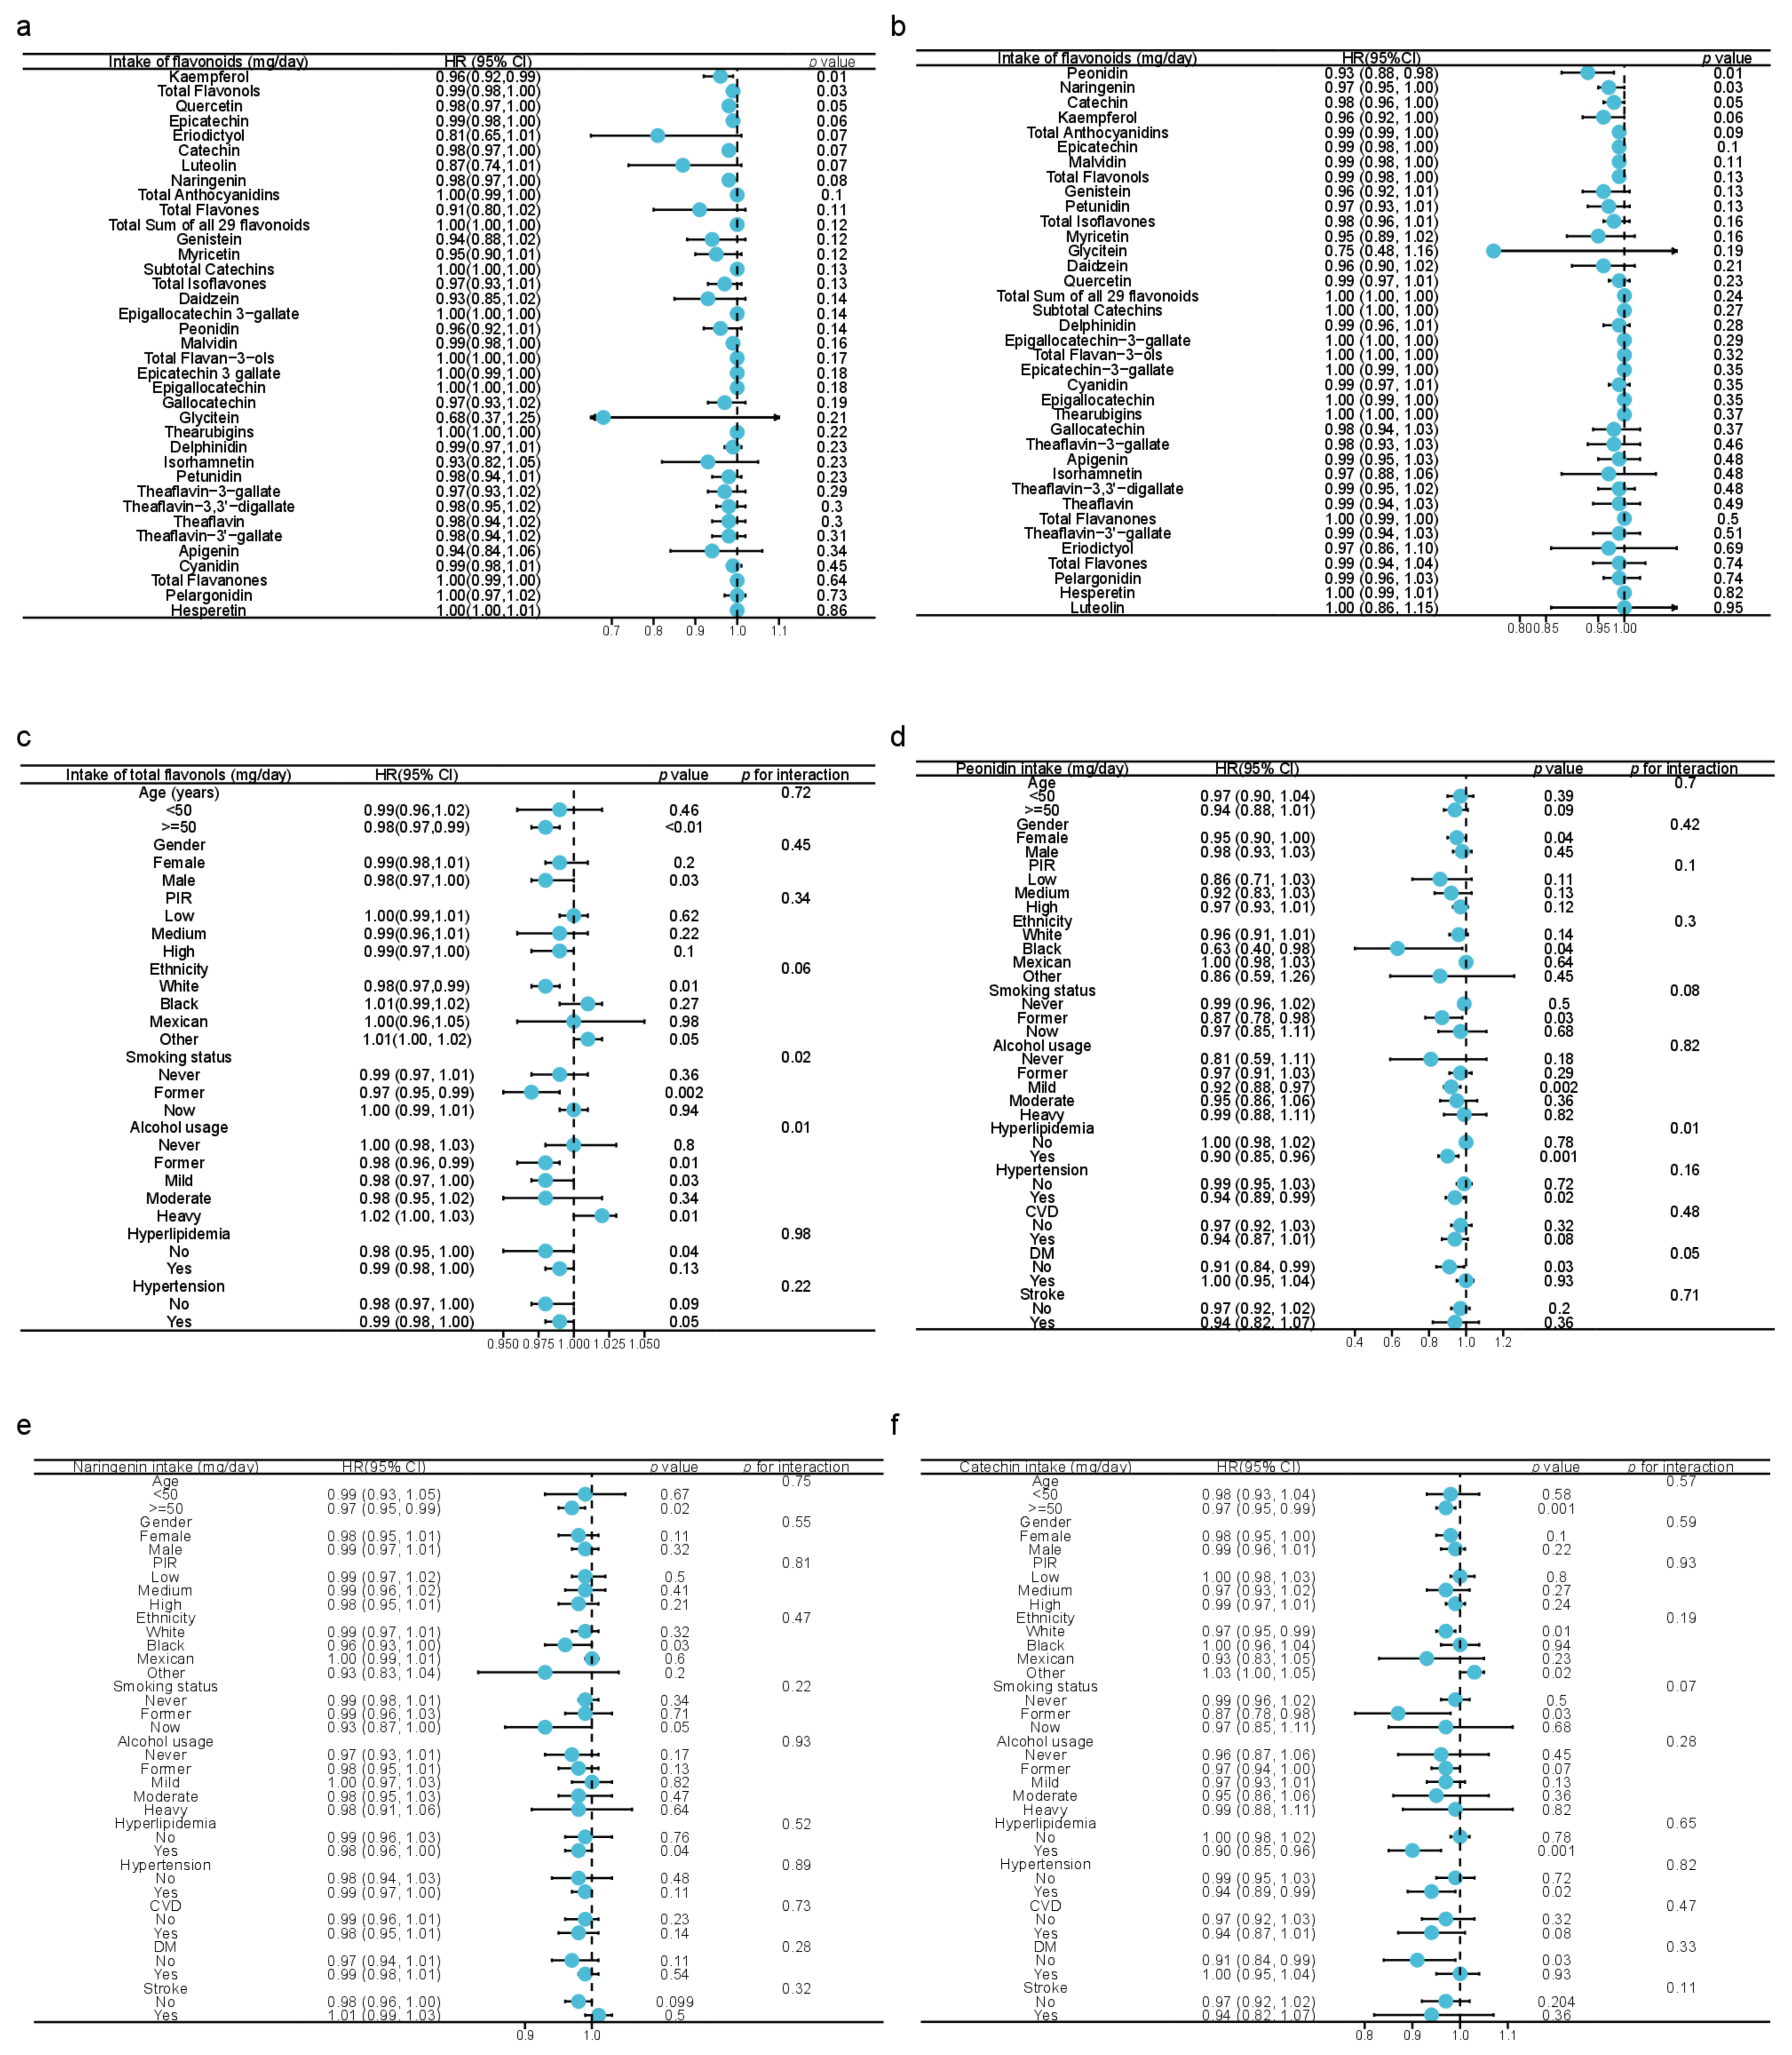
To identify whether dietary flavonoid intake was independently associated with cancer-related mortality, univariate and multivariate Cox analyses were employed in Figure 1a,b. As a result, the univariate Cox model demonstrated that the dietary intake of kaempferol, quercetin, and total flavonols was inversely associated with cancer mortality (Figure 2a). The dietary intakes of peonidin, naringenin, and catechin were inversely associated with cancer mortality after adjustment for age, ethnicity, gender, PIR, educational status, marital status, daily energy intake, alcohol consumption, smoking status, cancer history, total score of HEI, DII, and a total time of PA (Figure 2b). The analysis using restricted cubic splines revealed a monotonically decreasing association between dietary intakes of peonidin, naringenin, and catechin and cancer mortality (Supplementary Figure S1b–d). Because of the heterogeneity of the population, we further stratified the population by different characteristics and calculated the interactions, including age, gender, PIR, ethnicity, smoking status, alcohol usage, hyperlipidemia, and hypertension. In the stratified analysis, the inverse association of flavonol intake against cancer death was observed, especially in participants aged 50 or above, males, whites, former smokers, ex-drinkers, mild drinkers, people without hyperlipidemia, and people with hypertension, while the positive correlation was observed in heavy drinkers and other races (Figure 2c). Notably, flavonols might have the best benefits for former smokers (p for interaction = 0.02), as well as mild-alcoholics and former alcoholics (p for interaction = 0.01) against cancer death. Besides, the intake of flavonols tended to influence cancer mortality differently amongst different ethnicities (p for interaction = 0.06), which might explain the observation that the intake of flavonols turned out to be a risk factor for cancer death in other minority races [1.01(1.00, 1.02), p = 0.05] (Figure 2c). Moreover, the benefits of the increased intake of peonidin against cancer mortality might occur amongst females, blacks, past-smokers, mild-alcoholics, people with hyperlipidemia, people with hypertension, and people without DM (Figure 2d). The effect of peonidin on cancer mortality differs in people with and without hyperlipidemia (p = 0.01, Figure 2d). Similarly, the potential protective effects of naringenin against cancer mortality were observed in people aged 50 or above, blacks, and participants with hyperlipidemia (Figure 2e). The inverse association between the intake of catechin and cancer mortality was shown in people aged 50 or above, ex-smokers, people with hyperlipidemia or hypertension, and people without DM (Figure 2f).
The dietary intake of flavonoid subclasses was divided by quartiles to further analyze the relationship between cancer mortality and the dietary intake of flavonoid subclasses (Table 5). Notably, the increased dietary intake of flavonols tended to be inversely associated with cancer-related mortality (multivariate analysis HR (95% CI] 0.82 (0.67, 1.02), p for trend = 0.08). Being in the second, third, and fourth quartiles of flavonol intake, the cancer mortality was inversely reduced compared with that in the first quartile (multivariate analysis HR (95% CI] 0.58 [0.36, 0.91], p = 0.02, Q1 vs. Q2; 0.55 [0.31, 0.96], p = 0.04, Q1 vs. Q3; 0.54 [0.30, 0.99], p = 0.05, Q1 vs. Q4, respectively) (Table 5). Participants in the second and fourth quartiles of dietary flavonol intake had a higher survival probability than those in the lowest quartile (Q1 vs. Q2 p = 0.01, Figure 3a; Q1 vs. Q4 p = 0.01, Figure 3c). Participants in the third quartile tended to have a higher survival probability than those in the first quartile (p = 0.08, Figure 3b). The analysis using restricted cubic splines revealed a monotonically decreasing association between dietary flavonol intake and cancer mortality (Supplementary Figure S1a). Moreover, the survival probability was significantly higher for participants with a peonidin intake greater than the 60th percentile than for those with an intake below the 60th percentile (Figure 3d). Similarly, the survival probability was significantly higher for participants with a naringenin intake greater than the 90th percentile than for those with intake below the 90th percentile (Figure 3e). The survival probability was significantly higher for participants with a catechin intake greater than the 90th percentile than for those with intake below the 90th percentile (Figure 3f). In addition, being in the second quartile of dietary flavone intake was inversely associated with cancer-related mortality in comparison to being in the first quartile (0.48 [0.26, 0.87], p = 0.02) (Table 5). As 37.92% of participants had no dietary isoflavone intake, the cohort was divided into two groups based on the median dietary intake of isoflavones (Table 5).
3.5. Establishment of Nomogram with Total Dietary Flavonol Intake
We then built an easy-to-use and clinically adaptable risk nomogram for predicting the survival probability at ten years (Figure 3g). A higher total score was associated with a lower 10-year survival rate. The predictions made by the nomogram model were close to the observed outcomes of 10-year survival (Figure 3h).
3.6. Associations between Isoflavone Metabolites in Urine and Cancer-Related Mortality
Since the bioavailability of flavonoids is low, the flavonoid intake might not accurately reflect the effect of flavonoids utilized by the body on cancer mortality. We considered using urinary flavonoid and their metabolite levels to explore the correlation with cancer mortality. Due to data access privileges, we were only able to obtain urinary levels of isoflavones and relevant metabolites in 2007–2010 during our study period. As shown in Table 6, there was no association between the levels of daidzein, ODMA, equol, and genistein and cancer mortality.
4. Discussion
The global cancer burden is expected to increase by 47% to 28.4 million cases by 2040 in comparison with 2020 [1]. Primary prevention prioritizes reducing the personal, clinical, and socioeconomic burden of cancer. It is estimated that approximately one-third of cancers can be attributed to diet, nutrition, and physical activity in developed countries [29]. The adequate intake of fruit and vegetables, enriched in flavonoids, has been recommended to prevent cancers [29]. Recent epidemiological studies have indicated that the intake of flavonoids is inversely associated with cancer mortality [12,13]. Flavonoids can be categorized into six main subclasses, namely anthocyanidins, flavan-3-ols, flavanones, flavones, flavonols, and isoflavones. Among them, flavonols, mainly including quercetin, kaempferol, myricetin, and isorhamnetin, are present in tea, onions, and berries.
Our results demonstrated that the inverse association between flavonol intake and cancer mortality is coincidental with Danish results [13]. Interestingly, differing from the result that the intake of flavonols was inversely associated with the risk of lung cancer amongst male smokers [30], the potential protective effects of flavonol were observed amongst former smokers, former drinkers, and mild-drinkers in our study, which may suggest that quitting smoking and alcohol consumption might have priority in reducing cancer death. It is well-documented that flavonols play an important role in the carcinogenesis and progression of cancer in vitro. Kaempferol can inhibit the epithelial-mesenchymal transition and induce apoptosis and cell cycle arrest in the G2/M phase by targeting phosphoinositide 3-kinase/protein kinase B signaling pathways [31]. Quercetin is accountable for suppressing proliferation by causing cell cycle arrest in the G1 phase through targeting cyclins [32,33]. Moreover, quercetin at a high concentration can inhibit cell cycle progression from G0/G1 to G2/M [25,26]. Besides influencing the cell cycle, quercetin can induce apoptosis through pro-apoptotic PI3K/Akt and mitogen-activated protein kinase signaling pathways [34,35]. Similar to other flavonols, myricetin can induce apoptosis, interfere with the cell cycle, and inhibit cell proliferation in cancer cells [36]. As an antioxidant, myricetin can scavenge the elevated free radicals and reactive oxygen species in cancer cells [36,37,38]. Myricetin can restrain cancer progression by downregulating the levels of various inflammatory markers [39]. However, what should be paid attention to is that flavonoids could exert pro-oxidant properties at high doses [5,40,41]. Flavonoids containing phenolic rings, when oxidized by oxidases, produce cytotoxic phenoxy radicals; co-oxidize unsaturated lipids, nucleic acids, ascorbic acid, nicotinamide adenine dinucleotide, and glutathione; and lead to the formation of reactive oxygen species and mitochondrial toxicity. Quercetin and other flavonoids were reported to induce significant frequencies of sister chromatid exchange and micronuclei, as well as inhibit cell proliferation due to the pro-oxidant effects in special conditions [42,43]. In our study, we found numerous supplements were taken by people, which may not be regulated by the Food and Drug Administration and therefore the potential toxicity has not been fully assessed (Supplementary Table S1). A study on the effect of flavonoid dietary supplements on cancer survival is warranted.
A comprehensive understanding of the mechanisms of flavonoids in cancer could help define new strategies for cancer management and prevention. The bioavailability of flavonoids is affected by dietary patterns, interaction with the food matrix, host genetics, intestinal microbiota, and the phase I and II metabolism in the liver [44,45,46], which may explain the inconsistent epidemiological findings. Our observation that the intake of flavonols tended to influence cancer mortality differently amongst different ethnicities may be caused by host genetics and dietary patterns. In our study, we found a distinct flavonoid intake pattern among ethnicities. Except for the increased intake of flavanones, the intake of the remaining flavonoids was lower amongst black people than white people. The low intake of flavonoids in our study may reflect a high consumption of the Southern dietary pattern, constituted by a high consumption of added fats, fried food, organ meats, processed meats, and sugar-sweetened beverages in the US black population [47]. The focus of primary prevention should be on those groups.
Moreover, although the flavonoids have low solubility and low bioavailability [48,49], certain intestinal bacteria can degrade flavonoids or their glycosides into smaller and more bioavailable metabolites which, when absorbed, can exert their physiological effects in vivo [45]. For example, physiological effects of isoflavones are mainly due to their metabolites, such as equol and O-DMA, produced by intestinal microbiota [50]. In comparison to daidzein, equol has a stronger estrogenic effect, antioxidant property, and anti-androgenic effect [51,52]. However, neither the intake of isoflavone nor the urinary levels of equol and O-DMA were associated with cancer mortality in our study. It would be interesting to study their association in estrogen-related diseases.
Notably, we found that the intakes of peonidin, naringenin, and catechin are inversely associated with cancer mortality. Peonidin, present in red wine and berries, can inhibit lung cancer metastasis [53]. Naringenin, present in citrus, decreases proliferation and induces apoptosis in various cancer types [54]. Catechin, abundant in green tea, can inhibit cancer growth and progression through its anti-oxidant property, cell cycle modulation, receptor tyrosine kinase pathway downregulation, immune response regulation, and epigenetic modification control [55].
The estimated amounts of individual flavonoids in plants and foods were reported to be influenced by nonrepresentative sampling, different cultivars, different growing, and processing conditions, and analytical bias [22]. To generate the qualified data for the flavonoid database, five criteria were implemented in the flavonoid database of USDA, including the sampling plan, the number of samples, sample handling, analytical method, and analytical quality control [22]. For instance, multiple samples and multiple detections were employed in the flavonoid database. Moreover, the flavonoid amounts by cultivars of each food/beverage were well documented in the flavonoid database [22]. Furthermore, the retention factors were introduced to assess the loss of flavonoids during cooking, as described in the materials and methods section.
In addition, the effects of seasonal variation on amounts of flavonoids in plants or on total flavonoid intake may be not as significant as other factors [56,57]. It is reported that only blueberries demonstrated a seasonality [22]. Since most foods/beverages are available the whole year for consumers, the seasonal variation might be due to the different cultivars or storage methods [22].
Considering that an individual’s dietary structure may change over a lifetime, we compared changes in flavonoid intake across a study population spanning ten years. We found that the flavonoid consumption remained relatively stable, although there were significant differences in the intake of some flavonoids. We employed the mean of the two-day intake of each flavonoid as well as the weights “wtdr2d” constructed for participants who completed two days of dietary recall in making estimates representative of the US non-hospitalized population. Our results could reflect the change in flavonoid consumptions in population. Our study had several limitations. The observational analysis only revealed an association (rather than causality). Notably, dietary flavonoid intake did not include the intake of flavonoid supplements, contributing to the limitations of our results. As discussed above, there are possible health risks associated with excess flavonoid intake. Future studies should include dietary and supplemental flavonoid intakes.
5. Conclusions
In summary, in comparison to being in the first quartile of dietary flavonol intake, being in the second, third, and fourth quartile was inversely associated with cancer-related mortality. Potential protective effects of dietary flavonol intake against cancer death was observed, especially in participants aged 50 or above, males, whites, former smokers, people who used to drink, mild drinkers, people without hyperlipidemia, and people with hypertension. Total dietary intakes of peonidin, naringenin, and catechin were inversely associated with the mortality of cancer. The nomogram based on the dietary intake of flavonols was clinically applicable to estimating the possibility of cancer-related death. Regarding the perspective of public health, our results may provide new insight into assessing cancer mortality risk based on dietary flavonol intake and establishing future personalized dietary recommendations amongst people with unhealthy lifestyles. However, further evidence from randomized controlled trials is still needed to assess the health benefits of flavonoids.
Supplementary Materials
The following supporting information can be downloaded at: https://www.mdpi.com/article/10.3390/nu15040976/s1, Figure S1: The association between the intakes of flavonol, peonidin, naringenin, and catechin and log10 (hazard ratio of cancer mortality) by restricted cubic splines. Supplementary Table T1: The flavonoid supplements consumed by participants in NHANES [58].
Author Contributions
Conceptualization, Y.Z.; methodology, Y.Z. and F.Z.; validation, Y.Z., F.Z. and K.G.; formal analysis, Y.Z.; writing—original draft preparation, Y.Z. and F.Z.; writing—review and editing, Y.Z.; visualization, Y.Z.; supervision, Y.Z.; project administration, Y.Z., F.Z. and K.G.; funding acquisition, K.G. All authors have read and agreed to the published version of the manuscript.
Funding
This project was supported by the Wuxi Taihu Lake Talent Plan, Supports for Leading Talents in Medical and Health Profession, Project Plan of Wuxi Institute of Translational Medicine [LCYJ202210], Scientific Research Project of Wuxi Commission of Health [M202041], Maternal and Child Health Research Project of Jiangsu Commission of Health [F202009], and Scientific Research Project of Jiangsu Maternal and Child Health Association [FYX202016].
Institutional Review Board Statement
The study was conducted in accordance with the Declaration of Helsinki, and approved by the Institutional Review Board (or Ethics Committee) of the institutional review board of the National Center for Health Statistics, CDC (protocol #2005-06, #2011-17, #2018-01).
Informed Consent Statement
Informed consent was obtained from all subjects involved in the study.
Data Availability Statement
Data described in the manuscript, code book, and analytic code will be made publicly and freely available without restriction at [https://www.cdc.gov/nchs/nhanes (accessed on 4 July 2022)].
Acknowledgments
We thank Zhang Jing (Shanghai Tongren Hospital) for his work with the NHANES database. His outstanding work, the nhanesR Package, and web page made it easier to explore the NHANES database.
Conflicts of Interest
The authors declare no conflict of interest.
References
- Sung, H.; Ferlay, J.; Siegel, R.L.; Laversanne, M.; Soerjomataram, I.; Jemal, A.; Bray, F. Global Cancer Statistics 2020: GLOBOCAN Estimates of Incidence and Mortality Worldwide for 36 Cancers in 185 Countries. CA Cancer J. Clin. 2021, 71, 209–249. [Google Scholar] [CrossRef] [PubMed]
- Hosseinzadeh, E.; Hassanzadeh, A.; Marofi, F.; Alivand, M.R.; Solali, S. Flavonoid-Based Cancer Therapy: An Updated Review. Anticancer Agents Med. Chem. 2020, 20, 1398–1414. [Google Scholar] [CrossRef] [PubMed]
- Rothwell, J.A.; Knaze, V.; Zamora-Ros, R. Polyphenols: Dietary assessment and role in the prevention of cancers. Curr. Opin. Clin. Nutr. Metab. Care 2017, 20, 512–521. [Google Scholar] [CrossRef] [PubMed]
- Le Marchand, L. Cancer preventive effects of flavonoids—A review. BioMed. Pharmacother. 2002, 56, 296–301. [Google Scholar] [CrossRef]
- Kuo, S.M. Dietary flavonoid and cancer prevention: Evidence and potential mechanism. Crit. Rev. Oncog. 1997, 8, 47–69. [Google Scholar] [CrossRef]
- Davatgaran-Taghipour, Y.; Masoomzadeh, S.; Farzaei, M.H.; Bahramsoltani, R.; Karimi-Soureh, Z.; Rahimi, R.; Abdollahi, M. Polyphenol nanoformulations for cancer therapy: Experimental evidence and clinical perspective. Int. J. Nanomed. 2017, 12, 2689–2702. [Google Scholar] [CrossRef] [Green Version]
- Abotaleb, M.; Samuel, S.M.; Varghese, E.; Varghese, S.; Kubatka, P.; Liskova, A.; Busselberg, D. Flavonoids in Cancer and Apoptosis. Cancers 2018, 11, 28. [Google Scholar] [CrossRef] [Green Version]
- Zhang, H.W.; Hu, J.J.; Fu, R.Q.; Liu, X.; Zhang, Y.H.; Li, J.; Liu, L.; Li, Y.N.; Deng, Q.; Luo, Q.S.; et al. Flavonoids inhibit cell proliferation and induce apoptosis and autophagy through downregulation of PI3Kgamma mediated PI3K/AKT/mTOR/p70S6K/ULK signaling pathway in human breast cancer cells. Sci. Rep. 2018, 8, 11255. [Google Scholar] [CrossRef] [Green Version]
- Masuelli, L.; Benvenuto, M.; Mattera, R.; Di Stefano, E.; Zago, E.; Taffera, G.; Tresoldi, I.; Giganti, M.G.; Frajese, G.V.; Berardi, G.; et al. In Vitro and In Vivo Anti-tumoral Effects of the Flavonoid Apigenin in Malignant Mesothelioma. Front. Pharmacol. 2017, 8, 373. [Google Scholar] [CrossRef] [Green Version]
- Hertog, M.G.; Feskens, E.J.; Hollman, P.C.; Katan, M.B.; Kromhout, D. Dietary flavonoids and cancer risk in the Zutphen Elderly Study. Nutr. Cancer 1994, 22, 175–184. [Google Scholar] [CrossRef] [Green Version]
- Hertog, M.G.; Kromhout, D.; Aravanis, C.; Blackburn, H.; Buzina, R.; Fidanza, F.; Giampaoli, S.; Jansen, A.; Menotti, A.; Nedeljkovic, S.; et al. Flavonoid intake and long-term risk of coronary heart disease and cancer in the seven countries study. Arch. Intern. Med. 1995, 155, 381–386. [Google Scholar] [CrossRef]
- Ivey, K.L.; Hodgson, J.M.; Croft, K.D.; Lewis, J.R.; Prince, R.L. Flavonoid intake and all-cause mortality. Am. J. Clin. Nutr. 2015, 101, 1012–1020. [Google Scholar] [CrossRef] [Green Version]
- Bondonno, N.P.; Dalgaard, F.; Kyro, C.; Murray, K.; Bondonno, C.P.; Lewis, J.R.; Croft, K.D.; Gislason, G.; Scalbert, A.; Cassidy, A.; et al. Flavonoid intake is associated with lower mortality in the Danish Diet Cancer and Health Cohort. Nat. Commun. 2019, 10, 3651. [Google Scholar] [CrossRef] [Green Version]
- Flavonoid Values for USDA Survey Foods and Beverages. Available online: https://www.ars.usda.gov/northeast-area/beltsville-md-bhnrc/beltsville-human-nutrition-research-center/food-surveys-research-group/docs/fndds-flavonoid-database/ (accessed on 16 December 2022).
- About the National Health and Nutrition Examination Survey. Available online: https://www.cdc.gov/nchs/nhanes/about_nhanes.htm (accessed on 23 November 2022).
- NHANES Directors. Available online: https://www.cdc.gov/nchs/nhanes/directors.htm (accessed on 23 November 2022).
- NCHS Ethics Review Board (ERB) Approval. Available online: https://www.cdc.gov/nchs/nhanes/irba98.htm (accessed on 23 November 2022).
- NHANES Tutorials. Available online: https://wwwn.cdc.gov/nchs/nhanes/tutorials/default.aspx (accessed on 23 November 2022).
- USDA Special Interest Databases on Flavonoids. Available online: https://www.ars.usda.gov/northeast-area/beltsville-md-bhnrc/beltsville-human-nutrition-research-center/methods-and-application-of-food-composition-laboratory/mafcl-site-pages/flavonoids/ (accessed on 23 November 2022).
- FNDDS Documentation and Databases. Available online: https://www.ars.usda.gov/northeast-area/beltsville-md-bhnrc/beltsville-human-nutrition-research-center/food-surveys-research-group/docs/fndds-download-databases/ (accessed on 23 November 2022).
- WWEIA Documentation and Data Sets. Available online: https://www.ars.usda.gov/northeast-area/beltsville-md-bhnrc/beltsville-human-nutrition-research-center/food-surveys-research-group/docs/wweia-documentation-and-data-sets/ (accessed on 23 November 2022).
- Harnly, J.M.; Doherty, R.F.; Beecher, G.R.; Holden, J.M.; Haytowitz, D.B.; Bhagwat, S.; Gebhardt, S. Flavonoid content of U.S. fruits, vegetables, and nuts. J. Agric. Food Chem. 2006, 54, 9966–9977. [Google Scholar] [CrossRef]
- Rattan, P.; Penrice, D.D.; Ahn, J.C.; Ferrer, A.; Patnaik, M.; Shah, V.H.; Kamath, P.S.; Mangaonkar, A.A.; Simonetto, D.A. Inverse Association of Telomere Length With Liver Disease and Mortality in the US Population. Hepatol. Commun. 2022, 6, 399–410. [Google Scholar] [CrossRef]
- Krebs-Smith, S.M.; Pannucci, T.E.; Subar, A.F.; Kirkpatrick, S.I.; Lerman, J.L.; Tooze, J.A.; Wilson, M.M.; Reedy, J. Update of the Healthy Eating Index: HEI-2015. J. Acad. Nutr. Diet. 2018, 118, 1591–1602. [Google Scholar] [CrossRef] [Green Version]
- Shivappa, N.; Steck, S.E.; Hurley, T.G.; Hussey, J.R.; Hebert, J.R. Designing and developing a literature-derived, population-based dietary inflammatory index. Public Health Nutr. 2014, 17, 1689–1696. [Google Scholar] [CrossRef] [Green Version]
- National Health and Nutrition Examination Survey 2007–2008 Data Documentation, Codebook, and Frequencies Blood Pressure (BPX_E). Available online: https://wwwn.cdc.gov/Nchs/Nhanes/2007-2008/BPX_E.htm (accessed on 23 November 2022).
- Zhang, Z.; Kattan, M.W. Drawing Nomograms with R: Applications to categorical outcome and survival data. Ann. Transl. Med. 2017, 5, 211. [Google Scholar] [CrossRef] [Green Version]
- Fang, J. Classification of fruits based on anthocyanin types and relevance to their health effects. Nutrition 2015, 31, 1301–1306. [Google Scholar] [CrossRef]
- Wiseman, M. The second World Cancer Research Fund/American Institute for Cancer Research expert report. Food, nutrition, physical activity, and the prevention of cancer: A global perspective. Proc. Nutr. Soc. 2008, 67, 253–256. [Google Scholar] [CrossRef] [Green Version]
- Hirvonen, T.; Virtamo, J.; Korhonen, P.; Albanes, D.; Pietinen, P. Flavonol and flavone intake and the risk of cancer in male smokers (Finland). Cancer Causes Control. 2001, 12, 789–796. [Google Scholar] [CrossRef] [PubMed]
- Imran, M.; Salehi, B.; Sharifi-Rad, J.; Aslam Gondal, T.; Saeed, F.; Imran, A.; Shahbaz, M.; Tsouh Fokou, P.V.; Umair Arshad, M.; Khan, H.; et al. Kaempferol: A Key Emphasis to Its Anticancer Potential. Molecules 2019, 24, 2277. [Google Scholar] [CrossRef] [PubMed] [Green Version]
- Jeong, J.H.; An, J.Y.; Kwon, Y.T.; Rhee, J.G.; Lee, Y.J. Effects of low dose quercetin: Cancer cell-specific inhibition of cell cycle progression. J. Cell BioChem. 2009, 106, 73–82. [Google Scholar] [CrossRef] [PubMed] [Green Version]
- Reyes-Farias, M.; Carrasco-Pozo, C. The Anti-Cancer Effect of Quercetin: Molecular Implications in Cancer Metabolism. Int. J. Mol. Sci. 2019, 20, 3177. [Google Scholar] [CrossRef] [Green Version]
- Ren, M.X.; Deng, X.H.; Ai, F.; Yuan, G.Y.; Song, H.Y. Effect of quercetin on the proliferation of the human ovarian cancer cell line SKOV-3 in vitro. Exp. Ther. Med. 2015, 10, 579–583. [Google Scholar] [CrossRef] [Green Version]
- Deng, X.H.; Song, H.Y.; Zhou, Y.F.; Yuan, G.Y.; Zheng, F.J. Effects of quercetin on the proliferation of breast cancer cells and expression of survivin in vitro. Exp. Ther. Med. 2013, 6, 1155–1158. [Google Scholar] [CrossRef] [Green Version]
- Afroze, N.; Pramodh, S.; Hussain, A.; Waleed, M.; Vakharia, K. A review on myricetin as a potential therapeutic candidate for cancer prevention. 3 Biotech 2020, 10, 211. [Google Scholar] [CrossRef]
- Barzegar, A. Antioxidant activity of polyphenolic myricetin in vitro cell- free and cell-based systems. Mol. Biol. Res. Commun. 2016, 5, 87–95. [Google Scholar]
- Zhang, C.; Zhang, G.; Liao, Y.; Gong, D. Myricetin inhibits the generation of superoxide anion by reduced form of xanthine oxidase. Food Chem. 2017, 221, 1569–1577. [Google Scholar] [CrossRef]
- Chen, H.; Lin, H.; Xie, S.; Huang, B.; Qian, Y.; Chen, K.; Niu, Y.; Shen, H.M.; Cai, J.; Li, P.; et al. Myricetin inhibits NLRP3 inflammasome activation via reduction of ROS-dependent ubiquitination of ASC and promotion of ROS-independent NLRP3 ubiquitination. Toxicol. Appl. Pharmacol. 2019, 365, 19–29. [Google Scholar] [CrossRef]
- Galati, G.; O’Brien, P.J. Potential toxicity of flavonoids and other dietary phenolics: Significance for their chemopreventive and anticancer properties. Free Radic. Biol. Med. 2004, 37, 287–303. [Google Scholar] [CrossRef]
- Skibola, C.F.; Smith, M.T. Potential health impacts of excessive flavonoid intake. Free Radic. Biol. Med. 2000, 29, 375–383. [Google Scholar] [CrossRef]
- Engen, A.; Maeda, J.; Wozniak, D.E.; Brents, C.A.; Bell, J.J.; Uesaka, M.; Aizawa, Y.; Kato, T.A. Induction of cytotoxic and genotoxic responses by natural and novel quercetin glycosides. Mutat. Res. Genet. Toxicol. Environ. Mutagen. 2015, 784–785, 15–22. [Google Scholar] [CrossRef]
- Gliszczynska-Swiglo, A.; van der Woude, H.; de Haan, L.; Tyrakowska, B.; Aarts, J.M.; Rietjens, I.M. The role of quinone reductase (NQO1) and quinone chemistry in quercetin cytotoxicity. Toxicol. Vitr. 2003, 17, 423–431. [Google Scholar] [CrossRef]
- Di Lorenzo, C.; Colombo, F.; Biella, S.; Stockley, C.; Restani, P. Polyphenols and Human Health: The Role of Bioavailability. Nutrients 2021, 13, 273. [Google Scholar] [CrossRef]
- Murota, K.; Nakamura, Y.; Uehara, M. Flavonoid metabolism: The interaction of metabolites and gut microbiota. BioSci. Biotechnol. BioChem. 2018, 82, 600–610. [Google Scholar] [CrossRef] [Green Version]
- Shabbir, U.; Rubab, M.; Daliri, E.B.; Chelliah, R.; Javed, A.; Oh, D.H. Curcumin, Quercetin, Catechins and Metabolic Diseases: The Role of Gut Microbiota. Nutrients 2021, 13, 206. [Google Scholar] [CrossRef]
- Couch, C.A.; Gray, M.S.; Shikany, J.M.; Howard, V.J.; Howard, G.; Long, D.L.; McClure, L.A.; Manly, J.J.; Cushman, M.; Zakai, N.A.; et al. Correlates of a southern diet pattern in a national cohort study of blacks and whites: The REasons for Geographic And Racial Differences in Stroke (REGARDS) study. Br. J. Nutr. 2021, 126, 1904–1910. [Google Scholar] [CrossRef]
- Li, B.; Robinson, D.H.; Birt, D.F. Evaluation of properties of apigenin and [G-3H] apigenin and analytic method development. J. Pharm. Sci. 1997, 86, 721–725. [Google Scholar] [CrossRef]
- Tang, D.; Chen, K.; Huang, L.; Li, J. Pharmacokinetic properties and drug interactions of apigenin, a natural flavone. Expert Opin. Drug Metab. Toxicol. 2017, 13, 323–330. [Google Scholar] [CrossRef]
- Heinonen, S.; Wahala, K.; Adlercreutz, H. Identification of isoflavone metabolites dihydrodaidzein, dihydrogenistein, 6′-OH-O-dma, and cis-4-OH-equol in human urine by gas chromatography-mass spectroscopy using authentic reference compounds. Anal. BioChem. 1999, 274, 211–219. [Google Scholar] [CrossRef] [PubMed]
- Setchell, K.D.; Brown, N.M.; Lydeking-Olsen, E. The clinical importance of the metabolite equol-a clue to the effectiveness of soy and its isoflavones. J. Nutr. 2002, 132, 3577–3584. [Google Scholar] [CrossRef] [PubMed] [Green Version]
- Atkinson, C.; Frankenfeld, C.L.; Lampe, J.W. Gut bacterial metabolism of the soy isoflavone daidzein: Exploring the relevance to human health. Exp. Biol. Med. 2005, 230, 155–170. [Google Scholar] [CrossRef] [PubMed]
- Ho, M.L.; Chen, P.N.; Chu, S.C.; Kuo, D.Y.; Kuo, W.H.; Chen, J.Y.; Hsieh, Y.S. Peonidin 3-glucoside inhibits lung cancer metastasis by downregulation of proteinases activities and MAPK pathway. Nutr. Cancer 2010, 62, 505–516. [Google Scholar] [CrossRef]
- Zeng, W.; Jin, L.; Zhang, F.; Zhang, C.; Liang, W. Naringenin as a potential immunomodulator in therapeutics. Pharmacol. Res. 2018, 135, 122–126. [Google Scholar] [CrossRef]
- Shirakami, Y.; Shimizu, M. Possible Mechanisms of Green Tea and Its Constituents against Cancer. Molecules 2018, 23, 2284. [Google Scholar] [CrossRef] [Green Version]
- Kent, K.; Charlton, K.E.; Lee, S.; Mond, J.; Russell, J.; Mitchell, P.; Flood, V.M. Dietary flavonoid intake in older adults: How many days of dietary assessment are required and what is the impact of seasonality? Nutr. J. 2018, 17, 7. [Google Scholar] [CrossRef] [Green Version]
- Jiang, C.K.; Ni, D.J.; Yao, M.Z. Metabolic and transcriptome analysis reveals metabolite variation and flavonoid regulatory networks in fresh shoots of tea (Camellia sinensis) over three seasons. Front. Agr. Sci. Eng. 2021, 8, 215–230. [Google Scholar] [CrossRef]
- National Health and Nutrition Examination Survey 1999–2020 Data Documentation, Codebook, and Frequencies Dietary Supplement Database - Product Information (DSPI). Available online: https://wwwn.cdc.gov/Nchs/Nhanes/1999-2000/DSPI.htm#Appendix_1:_Rules_for_Classifying_Ingredients (accessed on 17 December 2022).
Figure 1.
The association between individual flavonoids by the main subclasses. The association between individual flavan-3-ols (a), catechins (b), anthocyanidins (c), flavanones (d), isoflavones (e), flavonols (f), and flavones (g) are shown in heatmaps. Correlation was examined by Pearson’s correlation. The Pearson’s correlation coefficients are represented by the color bar. The p values of the correlation are represented by the size of the circle and the asterisks. *** p < 0.001, ** 0.001 ≦ p < 0.01, * 0.01 ≦ p < 0.05.

Figure 2.
Forest plots in the upper panel display the association between dietary flavonoid intake and cancer-related mortality using univariate (a) and multivariate (b) analyses adjusted for age, ethnicity, gender, PIR, educational status, marital status, daily energy intake, alcohol consumption, smoking status, cancer history, a total score of HEI, DII, and a total time of PA. (c) Forest plot showing the association between cancer-related mortality and total dietary flavonol intake using unadjusted Cox analysis stratified by age, gender, PIR, ethnicity, smoking status, alcohol usage, and disease history. Forest plot showing the association between cancer-related mortality and the dietary intake of peonidin (d), naringenin (e), and catechin (f) using unadjusted Cox analysis stratified by age, gender, smoking status, alcohol usage, and disease history. HR: hazard ratio; PIR: poverty income ratio; HEI: healthy eating index, 2015 version; DII: dietary inflammatory index; PA: physical activity.

Figure 3.
The survival curves of participants and the related nomogram. Comparison of survival probabilities for participants with dietary flavonol intake in the first quartile and second quartile (a); in the first quartile and third quartile (b); in the first quartile and fourth quartile (c). Kaplan–Meier analyses of survival probabilities based on the 60th percentage value of dietary peonidin intake (d). Kaplan–Meier analyses of survival probabilities based on the 90th percentage value of dietary naringenin intake (e). Kaplan–Meier analyses of survival probabilities based on the 90th percentage value of dietary catechin intake (f). Nomogram established with a total dietary intake of flavonols (g). Calibration curve to assess the consistency of the predicted survival possibility at ten years via the nomogram with total dietary flavonol intake (h). BMI: body mass index; COPD: chronic obstructive pulmonary disease; DM: type 2 diabetes mellitus. Regarding the disease prevalence, 0 indicates “no” and 1 indicates “yes”. Participants with less than 12 years of education were coded as 0; those with 12 years of education or above were coded as 1. As for marital status, participants with a partner were coded as 1; participants without a partner were coded as 0. PIR: poverty income ratio.


Table 1.
Statistical description of flavonoid intakes.
| Intake of Flavonoids (mg/day) | Minimum | 25th Percentile | Median | Mean | 75th Percentile | Maximum |
|---|---|---|---|---|---|---|
| Daidzein | 0 | 0 | 0 | 0.6919 | 0.025 | 151 |
| Genistein | 0 | 0 | 0.01 | 0.9426 | 0.045 | 204.32 |
| Glycitein | 0 | 0 | 0 | 0.1341 | 0 | 35.28 |
| Cyanidin | 0 | 0.045 | 0.515 | 2.447 | 1.885 | 639.96 |
| Petunidin | 0 | 0 | 0 | 0.9845 | 0.37 | 144.4 |
| Delphinidin | 0 | 0 | 0.01 | 1.4 | 0.66 | 187.14 |
| Malvidin | 0 | 0 | 0 | 4.258 | 1.81 | 309.485 |
| Pelargonidin | 0 | 0 | 0.01 | 1.427 | 0.35 | 91.135 |
| Peonidin | 0 | 0 | 0.095 | 1.705 | 0.66 | 636.765 |
| Catechin | 0 | 1.825 | 5.025 | 7.224 | 9.8 | 166.845 |
| Epigallocatechin | 0 | 0.105 | 0.485 | 14.408 | 13.825 | 1083.675 |
| Epicatechin | 0 | 1.375 | 5.68 | 9.232 | 12.71 | 316.94 |
| Epicatechin 3-gallate | 0 | 0 | 0.02 | 9.294 | 8.895 | 666.03 |
| Epigallocatechin 3-gallate | 0 | 0 | 0.14 | 24.98 | 21.93 | 2606.33 |
| Theaflavin | 0 | 0 | 0 | 1.354 | 0.845 | 75.87 |
| Thearubigins | 0 | 0 | 0 | 78.11 | 73.62 | 3891 |
| Eriodictyol | 0 | 0 | 0 | 0.196 | 0.095 | 47 |
| Hesperetin | 0 | 0 | 0.135 | 9.818 | 12.695 | 509.42 |
| Naringenin | 0 | 0.035 | 0.305 | 3.708 | 3.49 | 224.35 |
| Apigenin | 0 | 0.015 | 0.065 | 0.1953 | 0.21 | 70.01 |
| Luteolin | 0 | 0.115 | 0.355 | 0.6633 | 0.85 | 43.305 |
| Isorhamnetin | 0 | 0.13 | 0.46 | 0.8339 | 1.045 | 75.155 |
| Kaempferol | 0 | 0.895 | 2.325 | 4.207 | 5.485 | 152.885 |
| Myricetin | 0 | 0.245 | 0.6 | 1.373 | 1.625 | 39.645 |
| Quercetin | 0 | 4.32 | 8.09 | 10.65 | 13.9 | 202.75 |
| Theaflavin-3,3’-digallate | 0 | 0 | 0 | 1.493 | 0.94 | 83.66 |
| Theaflavin-3’-gallate | 0 | 0 | 0 | 1.264 | 0.605 | 72.18 |
| Theaflavin-3-gallate | 0 | 0 | 0 | 1.074 | 0.74 | 59.67 |
| Gallocatechin | 0 | 0 | 0.02 | 1.466 | 1.42 | 73.66 |
| Subtotal Catechins | 0 | 4.78 | 14.49 | 66.6 | 63.83 | 4897.1 |
| Total Isoflavones | 0 | 0 | 0.01 | 1.768 | 0.08 | 390.6 |
| Total Anthocyanidins | 0 | 0.11 | 2.02 | 12.22 | 10.78 | 756.1 |
| Total Flavan-3-ols | 0 | 4.915 | 15.425 | 149.891 | 154.295 | 6724.88 |
| Total Flavanones | 0 | 0.055 | 0.61 | 13.722 | 18.925 | 590.625 |
| Total Flavones | 0 | 0.18 | 0.505 | 0.8586 | 1.085 | 87.245 |
| Total Flavonols | 0 | 6.815 | 12.555 | 17.064 | 22.105 | 332.035 |
| Total Sum of all 29 flavonoids | 0 | 24.31 | 64.05 | 195.53 | 217.38 | 6974.47 |
Table 2.
Characteristics of participant by living status, NHANES 2007-2010, 2017-2018 until 31 December 2019.
Table 2.
Characteristics of participant by living status, NHANES 2007-2010, 2017-2018 until 31 December 2019.
| Variable | Alive (n = 13,624) | Death Caused by Cancer (n = 405) | p Value |
|---|---|---|---|
| Baseline sociodemographic, lifestyle, and health-related variables | |||
| Age, years | 46.67 ± 0.32 | 65.93 ± 0.89 | <0.0001 |
| Gender, % | 0.01 | ||
| Female | 52.86% (51.76%, 53.96%) | 42.70% (36.11%, 49.29%) | |
| Male | 47.14% (46.04%, 48.24%) | 57.30% (50.71%, 63.89%) | |
| Ethnicity, % | 0.002 | ||
| Black | 11.41% (9.61%, 13.21%) | 12.15% (8.61%, 15.69%) | |
| Mexican | 8.74% (6.73%, 10.74%) | 3.32% (1.03%, 5.60%) | |
| Other | 13.14% (11.21%, 15.08%) | 6.82% (2.37%, 11.27%) | |
| White | 66.71% (63.01%, 70.40%) | 77.71% (70.94%, 84.48%) | |
| Education, % | <0.0001 | ||
| <9 years | 4.89% (4.16%, 5.61%) | 10.18% (6.45%, 13.92%) | |
| 9−12 years | 35.37% (33.30%, 37.44%) | 45.38% (39.66%, 51.10%) | |
| >12 years | 59.74% (57.48%, 62.00%) | 44.44% (37.76%, 51.11%) | |
| Marital status, % | 0.67 | ||
| Without partner | 37.08% (35.23%, 38.93%) | 38.69% (31.22%, 46.15%) | |
| With partner | 62.92% (61.07%, 64.77%) | 61.31% (53.85%, 68.78%) | |
| PIR | 3.02 ± 0.04 | 2.65 ± 0.15 | 0.02 |
| BMI (kg/m2) | 29.14 ± 0.13 | 29.04 ± 0.52 | 0.84 |
| Daily energy intake (kcal) | 4161.93 ± 27.93 | 3828.29 ± 112.64 | 0.01 |
| Total score of HEI | 53.25 ± 0.36 | 54.40 ± 0.97 | 0.23 |
| DII | 1.47 ± 0.05 | 1.77 ± 0.12 | 0.02 |
| Total time of PA (mins/week) | 1288.52 ± 29.66 | 1244.04 ± 166.92 | 0.79 |
| Total MET of PA (/week) | 5124.83 ± 137.52 | 4375.36 ± 681.03 | 0.28 |
| Smoking status, % | <0.0001 | ||
| Never | 56.97% (54.88%, 59.05%) | 35.95% (27.82%, 44.09%) | |
| Former | 24.20% (22.87%, 25.53%) | 36.55% (28.37%, 44.73%) | |
| Now | 18.8%3 (17.43%, 20.23%) | 27.50% (19.33%, 35.66%) | |
| Alcohol consumption, % | <0.0001 | ||
| Never | 10.72% (9.76%, 11.68%) | 9.02% (4.87%, 13.17%) | |
| Former | 10.65% (9.35%, 11.94%) | 36.13% (28.06%, 44.20%) | |
| Mild | 38.38% (36.43%, 40.33%) | 31.86% (23.67%, 40.06%) | |
| Moderate | 18.17% (17.08%, 19.26%) | 12.68% (8.19%, 17.17%) | |
| Heavy | 22.08% (20.72%, 23.44%) | 10.31% (4.79%, 15.84%) | |
| Dietary intake of flavonoids (mg/day) | |||
| Daidzein | 0.80 ± 0.06 | 0.37 ± 0.12 | <0.001 |
| Genistein | 1.13 ± 0.08 | 0.46 ± 0.15 | <0.001 |
| Glycitein | 0.16 ± 0.01 | 0.06 ± 0.02 | <0.001 |
| Cyanidin | 2.69 ± 0.19 | 2.17 ± 0.32 | 0.2 |
| Petunidin | 1.20 ± 0.09 | 0.83 ± 0.16 | 0.03 |
| Delphinidin | 1.72 ± 0.14 | 1.22 ± 0.21 | 0.03 |
| Malvidin | 4.92 ± 0.31 | 3.59 ± 0.60 | 0.04 |
| Pelargonidin | 1.64 ± 0.12 | 1.53 ± 0.36 | 0.72 |
| Peonidin | 2.12 ± 0.16 | 0.87 ± 0.21 | <0.0001 |
| Catechin | 7.83 ± 0.18 | 6.95 ± 0.50 | 0.07 |
| Epigallocatechin | 16.76 ± 0.81 | 13.72 ± 1.89 | 0.13 |
| Epicatechin | 10.13 ± 0.24 | 8.73 ± 0.66 | 0.04 |
| Epicatechin 3-gallate | 10.81 ± 0.53 | 8.88 ± 1.28 | 0.15 |
| Epigallocatechin 3-gallate | 28.90 ± 1.65 | 23.03 ± 3.19 | 0.09 |
| Theaflavin | 1.59 ± 0.08 | 1.39 ± 0.22 | 0.39 |
| Thearubigins | 90.86 ± 4.36 | 79.31 ± 11.27 | 0.32 |
| Eriodictyol | 0.17 ± 0.01 | 0.14 ± 0.02 | 0.12 |
| Hesperetin | 8.86 ± 0.26 | 9.77 ± 1.08 | 0.42 |
| Naringenin | 3.40 ± 0.16 | 2.62 ± 0.36 | 0.04 |
| Apigenin | 0.24 ± 0.03 | 0.21 ± 0.02 | 0.34 |
| Luteolin | 0.71 ± 0.02 | 0.59 ± 0.05 | 0.02 |
| Isorhamnetin | 0.86 ± 0.02 | 0.77 ± 0.07 | 0.17 |
| Kaempferol | 4.67 ± 0.10 | 3.59 ± 0.33 | 0.002 |
| Myricetin | 1.54 ± 0.04 | 1.31 ± 0.11 | 0.04 |
| Quercetin | 11.38 ± 0.19 | 10.31 ± 0.65 | 0.09 |
| Theaflavin-3,3′-digallate | 1.75 ± 0.09 | 1.54 ± 0.24 | 0.39 |
| Theaflavin-3′-gallate | 1.48 ± 0.08 | 1.30 ± 0.21 | 0.4 |
| Theaflavin-3-gallate | 1.26 ± 0.06 | 1.11 ± 0.17 | 0.41 |
| Gallocatechin | 1.71 ± 0.07 | 1.43 ± 0.22 | 0.21 |
| Subtotal Catechins | 76.14 ± 3.36 | 62.75 ± 7.34 | 0.09 |
| Total Isoflavones | 2.09 ± 0.15 | 0.89 ± 0.29 | <0.001 |
| Total Anthocyanidins | 14.30 ± 0.74 | 10.21 ± 1.40 | 0.01 |
| Total Flavan-3-ols | 173.08 ± 7.19 | 147.41 ± 19.38 | 0.2 |
| Total Flavanones | 12.43 ± 0.39 | 12.53 ± 1.34 | 0.95 |
| Total Flavones | 0.95 ± 0.04 | 0.80 ± 0.06 | 0.03 |
| Total Flavonols | 18.45 ± 0.32 | 15.97 ± 1.07 | 0.02 |
| Total Sum of all 29 flavonoids | 221.30 ± 7.48 | 187.80 ± 20.34 | 0.11 |
| Disease history at interview | |||
| DM, % | <0.0001 | ||
| No | 79.30% (77.90%, 80.70%) | 61.21% (54.12%, 68.31%) | |
| Yes | 20.70% (19.30%, 22.10%) | 38.79% (31.69%, 45.88%) | |
| Hyperlipidemia, % | 0.12 | ||
| No | 31.43% (29.70%, 33.17%) | 25.08% (17.66%, 32.50%) | |
| Yes | 68.57% (66.83%, 70.30%) | 74.92% (67.50%, 82.34%) | |
| CVD, % | <0.0001 | ||
| No | 91.48% (90.62%, 92.34%) | 65.84% (59.01%, 72.66%) | |
| Yes | 8.52% (7.66%, 9.38%) | 34.16% (27.34%, 40.99%) | |
| Respiratory system disease, % | <0.0001 | ||
| ACO | 2.06% (1.70%, 2.42%) | 8.06% (1.88%, 14.23%) | |
| Asthma | 11.70% (10.75%, 12.64%) | 7.62% (4.20%, 11.03%) | |
| COPD | 2.83% (2.33%, 3.32%) | 15.46% (9.30%, 21.63%) | |
| No | 83.42% (82.16%, 84.68%) | 68.86% (61.16%, 76.56%) | |
| Stroke, % | <0.0001 | ||
| No | 96.86% (96.50%, 97.21%) | 84.35% (78.74%, 89.97%) | |
| Yes | 3.14% (2.79%, 3.50%) | 15.65% (10.03%, 21.26%) | |
| Cancer, % | <0.001 | ||
| No | 90.33% (89.67%, 90.98%) | 80.53% (74.37%, 86.68%) | |
| Yes | 9.67% (9.02%, 10.33%) | 19.47% (13.32%, 25.63%) | |
| Hypertension, % | <0.0001 | ||
| No | 63.80% (62.09%, 65.51%) | 26.20% (19.40%, 32.99%) | |
| Yes | 36.20% (34.49%, 37.91%) | 73.80% (67.01%, 80.60%) | |
Continuous variables are presented as mean ± standard deviation and categorical variables are presented as percentage (95% CIs).
Table 3.
Characteristics of participant by survey year cycle 2007–2008, 2009–2010, and 2017–2018.
| 2007–2008 | 2009–2010 | 2017–2018 | p-Value | |
|---|---|---|---|---|
| Dietary intake of flavonoids (mg/day) | ||||
| Daidzein | 0.62 ± 0.08 | 0.79 ± 0.05 | 0.93 ± 0.13 | 0.09 |
| Genistein | 0.84 ± 0.10 | 1.12 ± 0.07 | 1.36 ± 0.19 | 0.02 |
| Glycitein | 0.11 ± 0.01 | 0.16 ± 0.01 | 0.21 ± 0.03 | 0.01 |
| Cyanidin | 2.22 ± 0.19 | 2.99 ± 0.25 | 2.82 ± 0.42 | 0.04 |
| Petunidin | 0.77 ± 0.10 | 1.38 ± 0.18 | 1.40 ± 0.17 | 0.001 |
| Delphinidin | 1.04 ± 0.13 | 2.10 ± 0.29 | 1.96 ± 0.24 | <0.001 |
| Malvidin | 4.05 ± 0.46 | 5.23 ± 0.47 | 5.36 ± 0.56 | 0.11 |
| Pelargonidin | 1.44 ± 0.21 | 1.88 ± 0.25 | 1.60 ± 0.16 | 0.36 |
| Peonidin | 1.23 ± 0.12 | 2.11 ± 0.30 | 2.85 ± 0.32 | <0.0001 |
| Catechin | 7.71 ± 0.32 | 8.18 ± 0.24 | 7.58 ± 0.33 | 0.26 |
| Epigallocatechin | 17.41 ± 1.11 | 15.93 ± 1.30 | 16.76 ± 1.57 | 0.66 |
| Epicatechin | 10.24 ± 0.41 | 10.13 ± 0.37 | 9.97 ± 0.41 | 0.9 |
| Epicatechin 3-gallate | 11.50 ± 0.74 | 10.44 ± 0.88 | 10.41 ± 0.98 | 0.53 |
| Epigallocatechin 3-gallate | 30.12 ± 1.90 | 27.50 ± 2.25 | 28.75 ± 3.60 | 0.64 |
| Theaflavin | 1.77 ± 0.12 | 1.59 ± 0.14 | 1.41 ± 0.15 | 0.22 |
| Thearubigins | 101.89 ± 6.79 | 91.63 ± 8.00 | 79.87 ± 7.67 | 0.14 |
| Eriodictyol | 0.19 ± 0.01 | 0.20 ± 0.01 | 0.14 ± 0.01 | 0.004 |
| Hesperetin | 9.55 ± 0.61 | 10.05 ± 0.35 | 7.24 ± 0.35 | <0.0001 |
| Naringenin | 3.52 ± 0.29 | 3.40 ± 0.20 | 3.26 ± 0.30 | 0.82 |
| Apigenin | 0.23 ± 0.03 | 0.31 ± 0.07 | 0.17 ± 0.01 | 0.03 |
| Luteolin | 0.64 ± 0.04 | 0.74 ± 0.03 | 0.74 ± 0.04 | 0.11 |
| Isorhamnetin | 0.80 ± 0.04 | 0.90 ± 0.03 | 0.87 ± 0.03 | 0.08 |
| Kaempferol | 4.55 ± 0.19 | 4.64 ± 0.16 | 4.74 ± 0.12 | 0.7 |
| Myricetin | 1.51 ± 0.07 | 1.46 ± 0.08 | 1.64 ± 0.07 | 0.23 |
| Quercetin | 11.70 ± 0.41 | 11.91 ± 0.30 | 10.58 ± 0.24 | 0.004 |
| Theaflavin-3,3′-digallate | 1.96 ± 0.14 | 1.76 ± 0.16 | 1.55 ± 0.17 | 0.2 |
| Theaflavin-3′-gallate | 1.66 ± 0.12 | 1.49 ± 0.13 | 1.32 ± 0.14 | 0.23 |
| Theaflavin-3-gallate | 1.42 ± 0.10 | 1.27 ± 0.12 | 1.10 ± 0.12 | 0.17 |
| Gallocatechin | 1.87 ± 0.12 | 1.71 ± 0.14 | 1.55 ± 0.12 | 0.23 |
| Subtotal Catechins | 78.85 ± 4.38 | 73.90 ± 5.11 | 75.03 ± 6.76 | 0.72 |
| Total Isoflavones | 1.58 ± 0.19 | 2.06 ± 0.13 | 2.50 ± 0.34 | 0.04 |
| Total Anthocyanidins | 10.74 ± 0.91 | 15.68 ± 1.09 | 15.99 ± 1.48 | <0.001 |
| Total Flavan-3-ols | 187.55 ± 11.60 | 171.63 ± 13.66 | 160.28 ± 11.43 | 0.27 |
| Total Flavanones | 13.26 ± 0.87 | 13.65 ± 0.52 | 10.64 ± 0.58 | 0.001 |
| Total Flavones | 0.87 ± 0.05 | 1.05 ± 0.08 | 0.91 ± 0.04 | 0.18 |
| Total Flavonols | 18.56 ± 0.68 | 18.92 ± 0.52 | 17.82 ± 0.40 | 0.26 |
| Total Sum of all 29 flavonoids | 232.55 ± 12.43 | 222.98 ± 14.09 | 208.13 ± 11.66 | 0.39 |
| Baseline sociodemographic, lifestyle, and health-related variables | ||||
| Age, years | 46.85 ± 0.47 | 46.96 ± 0.51 | 47.29 ± 0.55 | 0.82 |
| Gender, % | 0.41 | |||
| Female | 53.69% (51.99%, 55.40%) | 52.22% (51.03%, 53.40%) | 52.15% (49.83%, 54.47%) | |
| Male | 46.31% (44.60%, 48.01%) | 47.78% (46.60%, 48.97%) | 47.85% (45.53%, 50.17%) | |
| Ethnicity, % | 0.16 | |||
| Black | 11.15% (7.55%, 14.75%) | 11.49% (9.76%, 13.23%) | 11.61% (8.35%, 14.87%) | |
| Mexican | 8.39% (5.63%, 11.16%) | 8.32% (4.51%, 12.13%) | 9.12% (5.80%, 12.44%) | |
| Other | 9.91% (6.71%, 13.10%) | 11.56% (8.05%, 15.08%) | 17.06% (14.12%, 19.99%) | |
| White | 70.55% (64.29%, 76.80%) | 68.62% (62.27%, 74.97%) | 62.22% (56.62%, 67.82%) | |
| Education, % | 0.002 | |||
| <9 years | 6.29% (4.87%, 7.71%) | 5.84% (4.53%, 7.15%) | 3.03% (2.14%, 3.92%) | |
| 9–12 years | 38.37% (34.35%, 42.38%) | 34.87% (32.08%, 37.67%) | 33.65% (30.25%, 37.04%) | |
| >12 years | 55.34% (50.57%, 60.11%) | 59.29% (56.52%, 62.05%) | 63.32% (59.82%, 66.83%) | |
| Marital status, % | 0.81 | |||
| Without partner | 37.71% (33.75%, 41.68%) | 36.42% (34.30%, 38.54%) | 37.20% (34.42%, 39.98%) | |
| With partner | 62.29% (58.32%, 66.25%) | 63.58% (61.46%, 65.70%) | 62.80% (60.02%, 65.58%) | |
| PIR | 3.01 ± 0.09 | 2.96 ± 0.05 | 3.06 ± 0.06 | 0.47 |
| BMI (kg/m2) | 28.74 ± 0.20 | 28.83 ± 0.13 | 29.77 ± 0.28 | 0.01 |
| Daily energy intake (kcal) | 4120.26 ± 52.88 | 4207.67 ± 44.41 | 4140.31 ± 43.02 | 0.36 |
| Total Score of HEI | 53.09 ± 0.65 | 54.30 ± 0.36 | 52.52 ± 0.71 | 0.04 |
| DII | 1.65 ± 0.10 | 1.33 ± 0.04 | 1.45 ± 0.09 | 0.004 |
| Total time of PA (mins/week) | 1274.92 ± 50.84 | 1102.61 ± 33.04 | 1463.02 ± 60.66 | <0.0001 |
| Total MET of PA (/week) | 5094.71 ± 230.20 | 4243.83 ± 171.63 | 5870.06 ± 274.40 | <0.0001 |
| Smoking status, % | 0.01 | |||
| Never | 53.62% (50.24%, 57.00%) | 55.61% (51.57%, 59.66%) | 59.99% (56.97%, 63.01%) | |
| Former | 24.11% (22.33%, 25.89%) | 25.11% (22.18%, 28.04%) | 24.13% (22.21%, 26.05%) | |
| Now | 22.27% (19.75%, 24.79%) | 19.27% (17.31%, 21.24%) | 15.88% (13.51%, 18.25%) | |
| Alcohol usage, % | <0.0001 | |||
| Never | 11.56% (9.94%, 13.17%) | 10.87% (9.09%, 12.65%) | 9.62% (8.28%, 10.96%) | |
| Former | 17.53% (14.56, 20.50) | 15.21% (13.27%, 17.15%) | 0.65% (0.33%, 0.98%) | |
| Mild | 34.23% (30.60, 37.85) | 35.69% (32.90%, 38.47%) | 44.89% (41.47%, 48.31%) | |
| Moderate | 15.60% (13.66, 17.54) | 16.65% (14.58%, 18.72%) | 21.97% (20.55%, 23.39%) | |
| Heavy | 21.09% (19.46, 22.71) | 21.59% (19.12%, 24.05%) | 22.87% (20.11%, 25.63%) | |
| Disease history at interview | ||||
| DM, % | 0.45 | |||
| No | 78.14% (75.37%, 80.90%) | 80.15% (78.17%, 82.13%) | 78.61% (76.44%, 80.79%) | |
| Yes | 21.86% (19.10%, 24.63%) | 19.85% (17.87%, 21.83%) | 21.39% (19.21%, 23.56%) | |
| Hyperlipidemia, % | 0.002 | |||
| No | 28.37% (25.98%, 30.76%) | 29.88% (28.12%, 31.64%) | 35.17% (31.50%, 38.83%) | |
| Yes | 71.63% (69.24%, 74.02%) | 70.12% (68.36%, 71.88%) | 64.83% (61.17%, 68.50%) | |
| CVD, % | 0.96 | |||
| No | 91.06% (90.00%, 92.12%) | 91.06% (89.71%, 92.41%) | 90.84% (89.16%, 92.53%) | |
| Yes | 8.94% (7.88%, 10.00%) | 8.94% (7.59%, 10.29%) | 9.16% (7.47%, 10.84%) | |
| Respiratory system disease, % | <0.0001 | |||
| ACO | 2.58% (2.05%, 3.11%) | 2.11% (1.57%, 2.65%) | 1.87% (1.07%, 2.66%) | |
| Asthma | 11.83% (9.90%, 13.75%) | 10.14% (9.25%, 11.04%) | 12.78% (11.05%, 14.51%) | |
| COPD | 4.39% (3.46%, 5.33%) | 3.81% (2.65%, 4.98%) | 1.19% (0.80%, 1.58%) | |
| No | 81.20% (78.58%, 83.82%) | 83.94% (82.45%, 85.42%) | 84.16% (81.87%, 86.44%) | |
| Stroke, % | 0.49 | |||
| No | 96.30% (95.59%, 97.00%) | 96.83% (96.33%, 97.34%) | 96.70% (95.99%, 97.40%) | |
| Yes | 3.70% (3.00%, 4.41%) | 3.17% (2.66%, 3.67%) | 3.30% (2.60%, 4.01%) | |
| Cancer, % | 0.46 | |||
| No | 90.69% (89.63%, 91.75%) | 90.06% (88.86%, 91.26%) | 89.70% (88.56%, 90.83%) | |
| Yes | 9.31% (8.25%, 10.37%) | 9.94% (8.74%, 11.14%) | 10.30% (9.17%, 11.44%) | |
| Hypertension, % | 0.18 | |||
| No | 63.63% (61.50%, 65.76%) | 64.67% (61.79%, 67.55%) | 61.19% (58.00%, 64.38%) | |
| Yes | 36.37% (34.24%, 38.50%) | 35.33% (32.45%, 38.21%) | 38.81% (35.62%, 42.00%) | |
Continuous variables are presented as mean ± standard deviation and categorical variables are presented as percentage (95% CIs).
Table 4.
Mean dietary intake of flavonoid subclass by age, gender, and ethnic group.
| Age and Gender Group | Case, n | Subtotal Catechins (mg/day) | Total Isoflavones(mg/day) | Total Anthocyanidins (mg/day) | Total Flavan-3-ols (mg/day) | Total Flavanones (mg/day) | Total Flavones (mg/day) | Total Flavonols (mg/day) | Total Sum of All 29 Flavonoids (mg/day) |
|---|---|---|---|---|---|---|---|---|---|
| White | |||||||||
| All | 6361 | 84.12 (74.74, 93.50) | 2.05 (1.66, 2.45) | 16.12 (13.98, 18.25) | 195.74 (176.20, 215.28) | 11.21 (10.38, 12.04) | 0.99 (0.89, 1.09) | 19.45 (18.51, 20.39) | 245.56 (225.09, 266.04) |
| male < 50 | 1299 | 82.42 (66.25, 98.60) | 2.56 (1.94, 3.19) | 11.28 (8.22, 14.34) | 186.79 (154.01, 219.57) | 11.03 (9.01, 13.06) | 1.02 (0.78, 1.26) | 20.55 (18.87, 22.23) | 233.23 (199.48, 266.98) |
| female < 50 | 1458 | 76.74 (63.04, 90.44) | 1.91 (1.13, 2.68) | 14.93 (12.46, 17.40) | 179.59 (151.12, 208.05) | 7.68 (6.53, 8.83) | 0.82 (0.72, 0.91) | 17.06 (15.66, 18.45) | 221.98 (191.88, 252.07) |
| male ≧ 50 | 1825 | 82.98 (71.91, 94.04) | 1.77 (0.97, 2.56) | 18.09 (14.71, 21.47) | 200.97 (171.61, 230.34) | 14.05 (12.33, 15.77) | 1.10 (0.95, 1.25) | 20.89 (19.63, 22.15) | 256.88 (226.01, 287.74) |
| female ≧ 50 | 1779 | 94.01 (71.62, 116.40) | 1.98 (1.42, 2.53) | 20.05 (17.08, 23.01) | 215.48 (184.48, 246.49) | 12.41 (10.83, 13.99) | 1.05 (0.82, 1.27) | 19.54 (18.15, 20.94) | 270.51 (238.49, 302.52) |
| Black | |||||||||
| All | 2904 | 51.92 (46.67, 57.17) | 1.43 (1.00, 1.86) | 8.27 (7.07, 9.48) | 118.85 (105.57, 132.13) | 14.17 (12.79, 15.54) | 0.60 (0.56, 0.64) | 14.53 (13.83, 15.23) | 157.85 (144.43, 171.26) |
| male < 50 | 618 | 52.30 (44.65, 59.94) *** | 2.24 (0.79, 3.69) | 8.16 (6.15, 10.17) *** | 118.94 (100.24, 137.64) *** | 15.47 (12.65, 18.30) *** | 0.54 (0.49, 0.60) *** | 15.78 (14.40, 17.17) *** | 161.14 (140.57, 181.70) *** |
| female < 50 | 767 | 46.39 (38.01, 54.77) *** | 1.14 (0.52, 1.76) * | 7.40 (6.21, 8.58) *** | 102.25 (80.69, 123.82) *** | 14.12 (11.87, 16.37) *** | 0.61 (0.52, 0.69) *** | 12.78 (11.78, 13.78) *** | 138.30 (115.47, 161.12) *** |
| male ≧ 50 | 745 | 56.95 (44.95, 68.96) *** | 0.98 (0.51, 1.44) | 8.19 (6.37, 10.00) *** | 140.29 (107.30, 173.28) *** | 14.44 (12.08, 16.80) | 0.63 (0.54, 0.71) *** | 16.81 (15.31, 18.32) *** | 181.34 (147.20, 215.48) *** |
| female ≧ 50 | 774 | 56.46 (47.39, 65.54) *** | 1.19 (0.53, 1.85) *** | 9.92 (6.79, 13.05) *** | 128.77 (112.63, 144.91) *** | 12.30 (10.07, 14.53) * | 0.64 (0.57, 0.72) *** | 13.91 (12.84, 14.99) *** | 166.74 (148.28, 185.20) *** |
| Mexican | |||||||||
| All | 2222 | 45.48 (38.26, 52.70) | 2.23 (0.83, 3.63) | 8.60 (6.74, 10.47) | 89.90 (72.66, 107.13) | 16.16 (14.43, 17.89) | 0.97 (0.88, 1.06) | 15.41 (14.55, 16.27) | 133.27 (115.85, 150.69) |
| male < 50 | 596 | 48.62 (40.34, 56.90) *** | 1.97 (0.30, 3.64) | 7.18 (4.50, 9.87) *** | 85.23 (67.11, 103.35) *** | 17.85 (15.02, 20.68) *** | 0.98 (0.86, 1.11) | 16.94 (15.57, 18.32) *** | 130.16 (110.49, 149.84) *** |
| female < 50 | 681 | 41.91 (31.21, 52.61) *** | 3.47 (−0.12, 7.06) | 8.01 (6.01, 10.02) *** | 89.48 (65.06, 113.89) *** | 14.05 (11.88, 16.23) *** | 0.90 (0.76, 1.05) | 13.93 (12.63, 15.24) *** | 129.85 (104.53, 155.16) ** |
| male ≧ 50 | 442 | 48.55 (30.97, 66.12) *** | 0.96 (0.37, 1.54) | 10.73 (5.95, 15.52) *** | 102.11 (57.99, 146.24) *** | 18.10 (14.21, 22.00) *** | 1.18 (0.62, 1.74) | 16.92 (14.44, 19.41) *** | 150.01 (104.08, 195.94) *** |
| female ≧ 50 | 503 | 43.60 (35.53, 51.67) *** | 0.83 (0.45, 1.22) | 12.13 (5.69, 18.56) *** | 92.77 (71.66, 113.88) *** | 15.39 (12.96, 17.81) *** | 0.92 (0.81, 1.03) | 13.74 (12.32, 15.16) *** | 135.78 (114.28, 157.28) *** |
| Other | |||||||||
| All | 2542 | 74.72 (61.57, 87.88) | 2.58 (2.02, 3.13) | 13.42 (10.99, 15.84) | 155.55 (133.35, 177.75) | 14.73 (12.86, 16.60) | 0.97 (0.90, 1.05) | 18.45 (17.40, 19.50) | 205.69 (182.44, 228.95) |
| male < 50 | 617 | 65.64 (35.89, 95.39) | 2.64 (1.80, 3.48) | 11.23 (7.18, 15.27) | 129.79 (90.52, 169.05) ** | 16.52 (13.11, 19.93) *** | 0.96 (0.84, 1.08) | 19.01 (17.12, 20.89) | 180.14 (138.41, 221.88) ** |
| female < 50 | 744 | 55.10 (45.61, 64.59) | 2.53 (1.55, 3.51) | 13.05 (10.26, 15.84) | 121.23 (97.05, 145.41) ** | 13.90 (11.47, 16.33) *** | 0.90 (0.77, 1.03) | 16.11 (14.66, 17.56) | 167.73 (141.56, 193.89) ** |
| male ≧ 50 | 555 | 99.23 (73.52, 124.94) | 2.48 (1.43, 3.52) | 16.35 (10.81, 21.89) | 213.04 (160.48, 265.60) | 14.26 (11.18, 17.33) * | 1.15 (0.98, 1.32) | 21.66 (19.33, 23.99) | 268.93 (215.27, 322.59) |
| female ≧ 50 | 626 | 104.70 (76.67, 132.72) | 2.62 (1.68, 3.56) | 15.43 (11.42, 19.45) | 213.06 (167.17, 258.95) * | 13.51 (11.05, 15.97) * | 0.99 (0.82, 1.15) | 18.98 (16.79, 21.18) | 264.59 (216.78, 312.40) * |
Means (95% CIs) are given from a weighted analysis. *** p < 0.001 compared with white participants. ** 0.001 ≦ p < 0.01 compared with white participants. * 0.01 ≦ p < 0.05 compared with white participants.
Table 5.
Hazard ratios of cancer mortality by quartiles of dietary flavonoid intake.
| Flavonoid Intake Quartiles | |||||||||
|---|---|---|---|---|---|---|---|---|---|
| 1Q | 2Q | p for 1Q vs. 2Q | 3Q | p for 1Q vs. 3Q | 4Q | p for 1Q vs. 4Q | HR (95%CI) | p for Trend | |
| Total flavonoid (mg/day) | ≦24.31 | 24.31–64.05 | 64.05–217.38 | >217.38 | |||||
| Model 1 (unadjusted) | 1 | 1.15 (0.71, 1.88) | 0.57 | 0.76 (0.47, 1.22) | 0.26 | 0.74 (0.49, 1.11) | 0.14 | 0.88 (0.78, 0.99) | 0.03 |
| Model 2 (adjusted for age, ethnicity, and gender) | 1 | 0.97 (0.61, 1.55) | 0.91 | 0.54 (0.33, 0.89) | 0.02 | 0.60 (0.40, 0.91) | 0.03 | 0.81 (0.71, 0.92) | <0.01 |
| Model 3 (multivariate) | 1 | 1.16 (0.74, 1.81) | 0.52 | 0.73 (0.45, 1.17) | 0.19 | 0.76 (0.48, 1.20) | 0.24 | 0.88 (0.76, 1.02) | 0.10 |
| Total flavones (mg/day) | ≦0.18 | 0.18–0.51 | 0.51–1.09 | >1.09 | |||||
| Model 1 (unadjusted) | 1 | 0.52 (0.33, 0.82) | 0.01 | 0.67 (0.45, 0.97) | 0.04 | 0.79 (0.52, 1.21) | 0.28 | 0.95 (0.81, 1.11) | 0.52 |
| Model 2 (adjusted for age, ethnicity, and gender) | 1 | 0.46 (0.28, 0.74) | 0.001 | 0.58 (0.39, 0.86) | 0.01 | 0.69 (0.46, 1.05) | 0.08 | 0.91 (0.78, 1.07) | 0.26 |
| Model 3 (multivariate) | 1 | 0.48 (0.26, 0.87) | 0.02 | 0.72 (0.47, 1.10) | 0.12 | 1.02 (0.62, 1.67) | 0.94 | 1.04 (0.88, 1.24) | 0.63 |
| Total anthocyanidins (mg/day) | ≦0.11 | 0.11–2.02 | 2.02–10.78 | >10.78 | |||||
| Model 1 (unadjusted) | 1 | 0.89 (0.57, 1.39) | 0.60 | 0.91 (0.60, 1.37) | 0.64 | 0.72 (0.44, 1.19) | 0.20 | 0.91 (0.78, 1.06) | 0.22 |
| Model 2 (adjusted for age, ethnicity, and gender) | 1 | 0.74 (0.47, 1.18) | 0.21 | 0.65 (0.42, 1.02) | 0.06 | 0.46 (0.27, 0.79) | <0.01 | 0.78 (0.66, 0.92) | <0.01 |
| Model 3 (multivariate) | 1 | 0.86 (0.49, 1.50) | 0.60 | 0.82 (0.48, 1.39) | 0.46 | 0.63 (0.32, 1.23) | 0.18 | 0.87 (0.71, 1.06) | 0.17 |
| Total flavanones (mg/day) | ≦0.06 | 0.06–0.61 | 0.61–18.93 | >18.93 | |||||
| Model 1 (unadjusted) | 1 | 0.90 (0.59, 1.36) | 0.61 | 0.79 (0.50, 1.25) | 0.319 | 1.01 (0.68, 1.50) | 0.97 | 0.99 (0.86, 1.14) | 0.90 |
| Model 2 (adjusted for age, ethnicity, and gender) | 1 | 0.89 (0.58, 1.36) | 0.58 | 0.72 (0.46, 1.14) | 0.16 | 0.74 (0.48, 1.12) | 0.16 | 0.89 (0.78, 1.03) | 0.13 |
| Model 3 (multivariate) | 1 | 1.23 (0.73, 2.07) | 0.44 | 1.06 (0.66, 1.73) | 0.80 | 1.02 (0.65, 1.59) | 0.93 | 0.99 (0.86, 1.13) | 0.88 |
| Total flavonol (mg/day) | ≦6.82 | 6.82–12.56 | 12.56–22.11 | >22.11 | |||||
| Model 1 (unadjusted) | 1 | 0.60 (0.41, 0.88) | 0.01 | 0.63 (0.39, 1.05) | 0.08 | 0.53 (0.34, 0.83) | 0.01 | 0.83 (0.70, 0.97) | 0.02 |
| Model 2 (adjusted for age, ethnicity, and gender) | 1 | 0.56 (0.39, 0.79) | 0.001 | 0.59 (0.37, 0.93) | 0.03 | 0.51 (0.33, 0.81) | <0.01 | 0.82 (0.69, 0.96) | 0.02 |
| Model 3 (multivariate) | 1 | 0.58 (0.36, 0.91) | 0.02 | 0.55 (0.31, 0.96) | 0.04 | 0.54 (0.30, 0.99) | 0.05 | 0.82 (0.67, 1.02) | 0.08 |
| Total Flavan–3–ols (mg/day) | ≦4.92 | 4.92–15.43 | 15.43–154.30 | >154.30 | |||||
| Model 1 (unadjusted) | 1 | 0.88 (0.60, 1.30) | 0.53 | 0.90 (0.56, 1.46) | 0.68 | 0.71 (0.47, 1.08) | 0.11 | 0.90 (0.79, 1.03) | 0.13 |
| Model 2 (adjusted for age, ethnicity, and gender) | 1 | 0.71 (0.48, 1.05) | 0.09 | 0.66 (0.42, 1.03) | 0.07 | 0.57 (0.38, 0.86) | 0.01 | 0.84 (0.73, 0.96) | 0.01 |
| Model 3 (multivariate) | 1 | 0.82 (0.53, 1.27) | 0.38 | 0.79 (0.48, 1.31) | 0.36 | 0.68 (0.42, 1.12) | 0.13 | 0.89 (0.76, 1.04) | 0.15 |
| Subtotal Catechins (mg/day) | ≦4.78 | 4.78–14.49 | 14.49–63.83 | >63.83 | |||||
| Model 1 (unadjusted) | 1 | 0.89 (0.60, 1.32) | 0.55 | 0.83 (0.51, 1.36) | 0.46 | 0.74 (0.49, 1.11) | 0.14 | 0.91 (0.80, 1.03) | 0.14 |
| Model 2 (adjusted for age, ethnicity, and gender) | 1 | 0.71 (0.47, 1.07) | 0.10 | 0.61 (0.39, 0.97) | 0.04 | 0.59 (0.39, 0.88) | 0.011 | 0.84 (0.74, 0.96) | 0.01 |
| Model 3 (multivariate) | 1 | 0.81 (0.51, 1.28) | 0.36 | 0.72 (0.43, 1.21) | 0.21 | 0.71 (0.44, 1.16) | 0.18 | 0.90 (0.76, 1.06) | 0.19 |
| Total isoflavones (mg/day) | ≦0.01 | >0.01 | |||||||
| Model 1 (unadjusted) | 1 | 0.74 (0.57, 0.97) | 0.03 | ||||||
| Model 2 (adjusted for age, ethnicity, and gender) | 1 | 0.81 (0.61, 1.09) | 0.16 | ||||||
| Model 3 (multivariate) | 1 | 0.93 (0.64, 1.35) | 0.70 | ||||||
Table 6.
Hazard ratios of cancer mortality by quartiles of urinary isoflavones and their metabolites.
Table 6.
Hazard ratios of cancer mortality by quartiles of urinary isoflavones and their metabolites.
| Quartile of Isoflavone Metabolites | |||||||||
|---|---|---|---|---|---|---|---|---|---|
| HR (95%CI) | 1Q | 2Q | 3Q | 4Q | HR (95%CI) | p for Trend | |||
| Daidzein (ng/mL) | <16.6 | 16.6–48.8 | 48.8–195.0 | ≧195.0 | |||||
| model 1 (unadjusted) | 1 | 1.31 (0.72, 2.37) | 0.38 | 0.99 (0.53, 1.85) | 0.97 | 1.22 (0.58, 2.55) | 0.60 | 1.03 (0.82, 1.30) | 0.56 |
| model 2 (adjusted for age, race, and sex) | 1 | 1.27 (0.69, 2.31) | 0.44 | 0.88 (0.48, 1.61) | 0.68 | 1.22 (0.60, 2.49) | 0.59 | 1.02 (0.81, 1.29) | 0.84 |
| model 3 (multivariate) | 1 | 1.41 (0.91, 2.19) | 0.12 | 0.96 (0.53, 1.72) | 0.89 | 1.38 (0.73, 2.62) | 0.32 | 1.06 (0.87, 1.29) | 0.78 |
| ODMA (ng/mL) | <0.60 | 0.60–2.70 | 2.70–19.15 | ≧19.15 | |||||
| model 1 (unadjusted) | 1 | 1.21 (0.68, 2.14) | 0.51 | 0.90 (0.53, 1.52) | 0.70 | 0.78 (0.46, 1.33) | 0.36 | 0.90 (0.77, 1.06) | 0.20 |
| model 2 (adjusted for age, race, and sex) | 1 | 0.93 (0.55, 1.58) | 0.79 | 0.62 (0.38, 1.02) | 0.06 | 0.63 (0.38, 1.05) | 0.08 | 0.83 (0.71, 0.98) | 0.03 |
| model 3 (multivariate) | 1 | 0.97 (0.49, 1.94) | 0.94 | 0.63 (0.32, 1.22) | 0.17 | 0.66 (0.31, 1.40) | 0.27 | 0.84 (0.66, 1.06) | 0.14 |
| Equol (ng/mL) | <2.70 | 2.70–6.18 | 6.18–13.70 | ≧13.70 | |||||
| model 1 (unadjusted) | 1 | 0.87 (0.47, 1.62) | 0.67 | 1.04 (0.62, 1.76) | 0.88 | 0.95 (0.54, 1.68) | 0.87 | 1.00 (0.83, 1.22) | 0.97 |
| model 2 (adjusted for age, race, and sex) | 1 | 0.85 (0.47, 1.54) | 0.59 | 0.81 (0.50, 1.32) | 0.40 | 0.83 (0.49, 1.40) | 0.48 | 0.94 (0.79, 1.13) | 0.53 |
| model 3 (multivariate) | 1 | 0.99 (0.54, 1.82) | 0.97 | 0.88 (0.56, 1.38) | 0.57 | 0.95 (0.60, 1.50) | 0.82 | 0.97 (0.84, 1.13) | 0.71 |
| Genistein (ng/mL) | <8.35 | 8.35–24.90 | 24.90–88.60 | ≧88.60 | |||||
| model 1 (unadjusted) | 1 | 1.12 (0.66, 1.90) | 0.69 | 1.23 (0.75, 2.03) | 0.41 | 1.14 (0.57, 2.29) | 0.72 | 1.05 (0.86, 1.28) | 0.65 |
| model 2 (adjusted for age, race, and sex) | 1 | 1.15 (0.68, 1.96) | 0.60 | 1.13 (0.69, 1.86) | 0.62 | 1.09 (0.53, 2.24) | 0.82 | 1.02 (0.83, 1.26) | 0.84 |
| model 3 (multivariate) | 1 | 1.20 (0.59, 2.40) | 0.62 | 1.20 (0.65, 2.23) | 0.55 | 1.18 (0.61, 2.30) | 0.63 | 1.05 (0.87, 1.27) | 0.63 |
Disclaimer/Publisher’s Note: The statements, opinions and data contained in all publications are solely those of the individual author(s) and contributor(s) and not of MDPI and/or the editor(s). MDPI and/or the editor(s) disclaim responsibility for any injury to people or property resulting from any ideas, methods, instructions or products referred to in the content. |
© 2023 by the authors. Licensee MDPI, Basel, Switzerland. This article is an open access article distributed under the terms and conditions of the Creative Commons Attribution (CC BY) license (https://creativecommons.org/licenses/by/4.0/).
Share and Cite
MDPI and ACS Style
Zhou, Y.; Gu, K.; Zhou, F. Dietary Flavonoid Intake and Cancer Mortality: A Population-Based Cohort Study. Nutrients 2023, 15, 976. https://doi.org/10.3390/nu15040976
AMA Style
Zhou Y, Gu K, Zhou F. Dietary Flavonoid Intake and Cancer Mortality: A Population-Based Cohort Study. Nutrients. 2023; 15(4):976. https://doi.org/10.3390/nu15040976
Chicago/Turabian StyleZhou, Yanjun, Ke Gu, and Fengying Zhou. 2023. "Dietary Flavonoid Intake and Cancer Mortality: A Population-Based Cohort Study" Nutrients 15, no. 4: 976. https://doi.org/10.3390/nu15040976
Note that from the first issue of 2016, this journal uses article numbers instead of page numbers. See further details here.