Multivitamin and Mineral Supplementation Containing Phytonutrients Scavenges Reactive Oxygen Species in Healthy Subjects: A Randomized, Double-Blinded, Placebo-Controlled Trial

 , ,
, ,  , ,
, ,
Abstract
:1. Introduction
2. Materials and Methods
2.1. Study Product
2.2. Subjects
2.3. Study Design
2.4. Oxidative Stress-Related Biochemical Analysis
2.5. Western Blot
2.6. Vitamin and Phytonutrient Analysis
2.7. Quantitative PCR Array on Peripheral Blood Mononuclear Cells (PBMC)
2.8. Core Interaction Network of qPCR Analysis
2.9. Statistical Analysis
3. Results
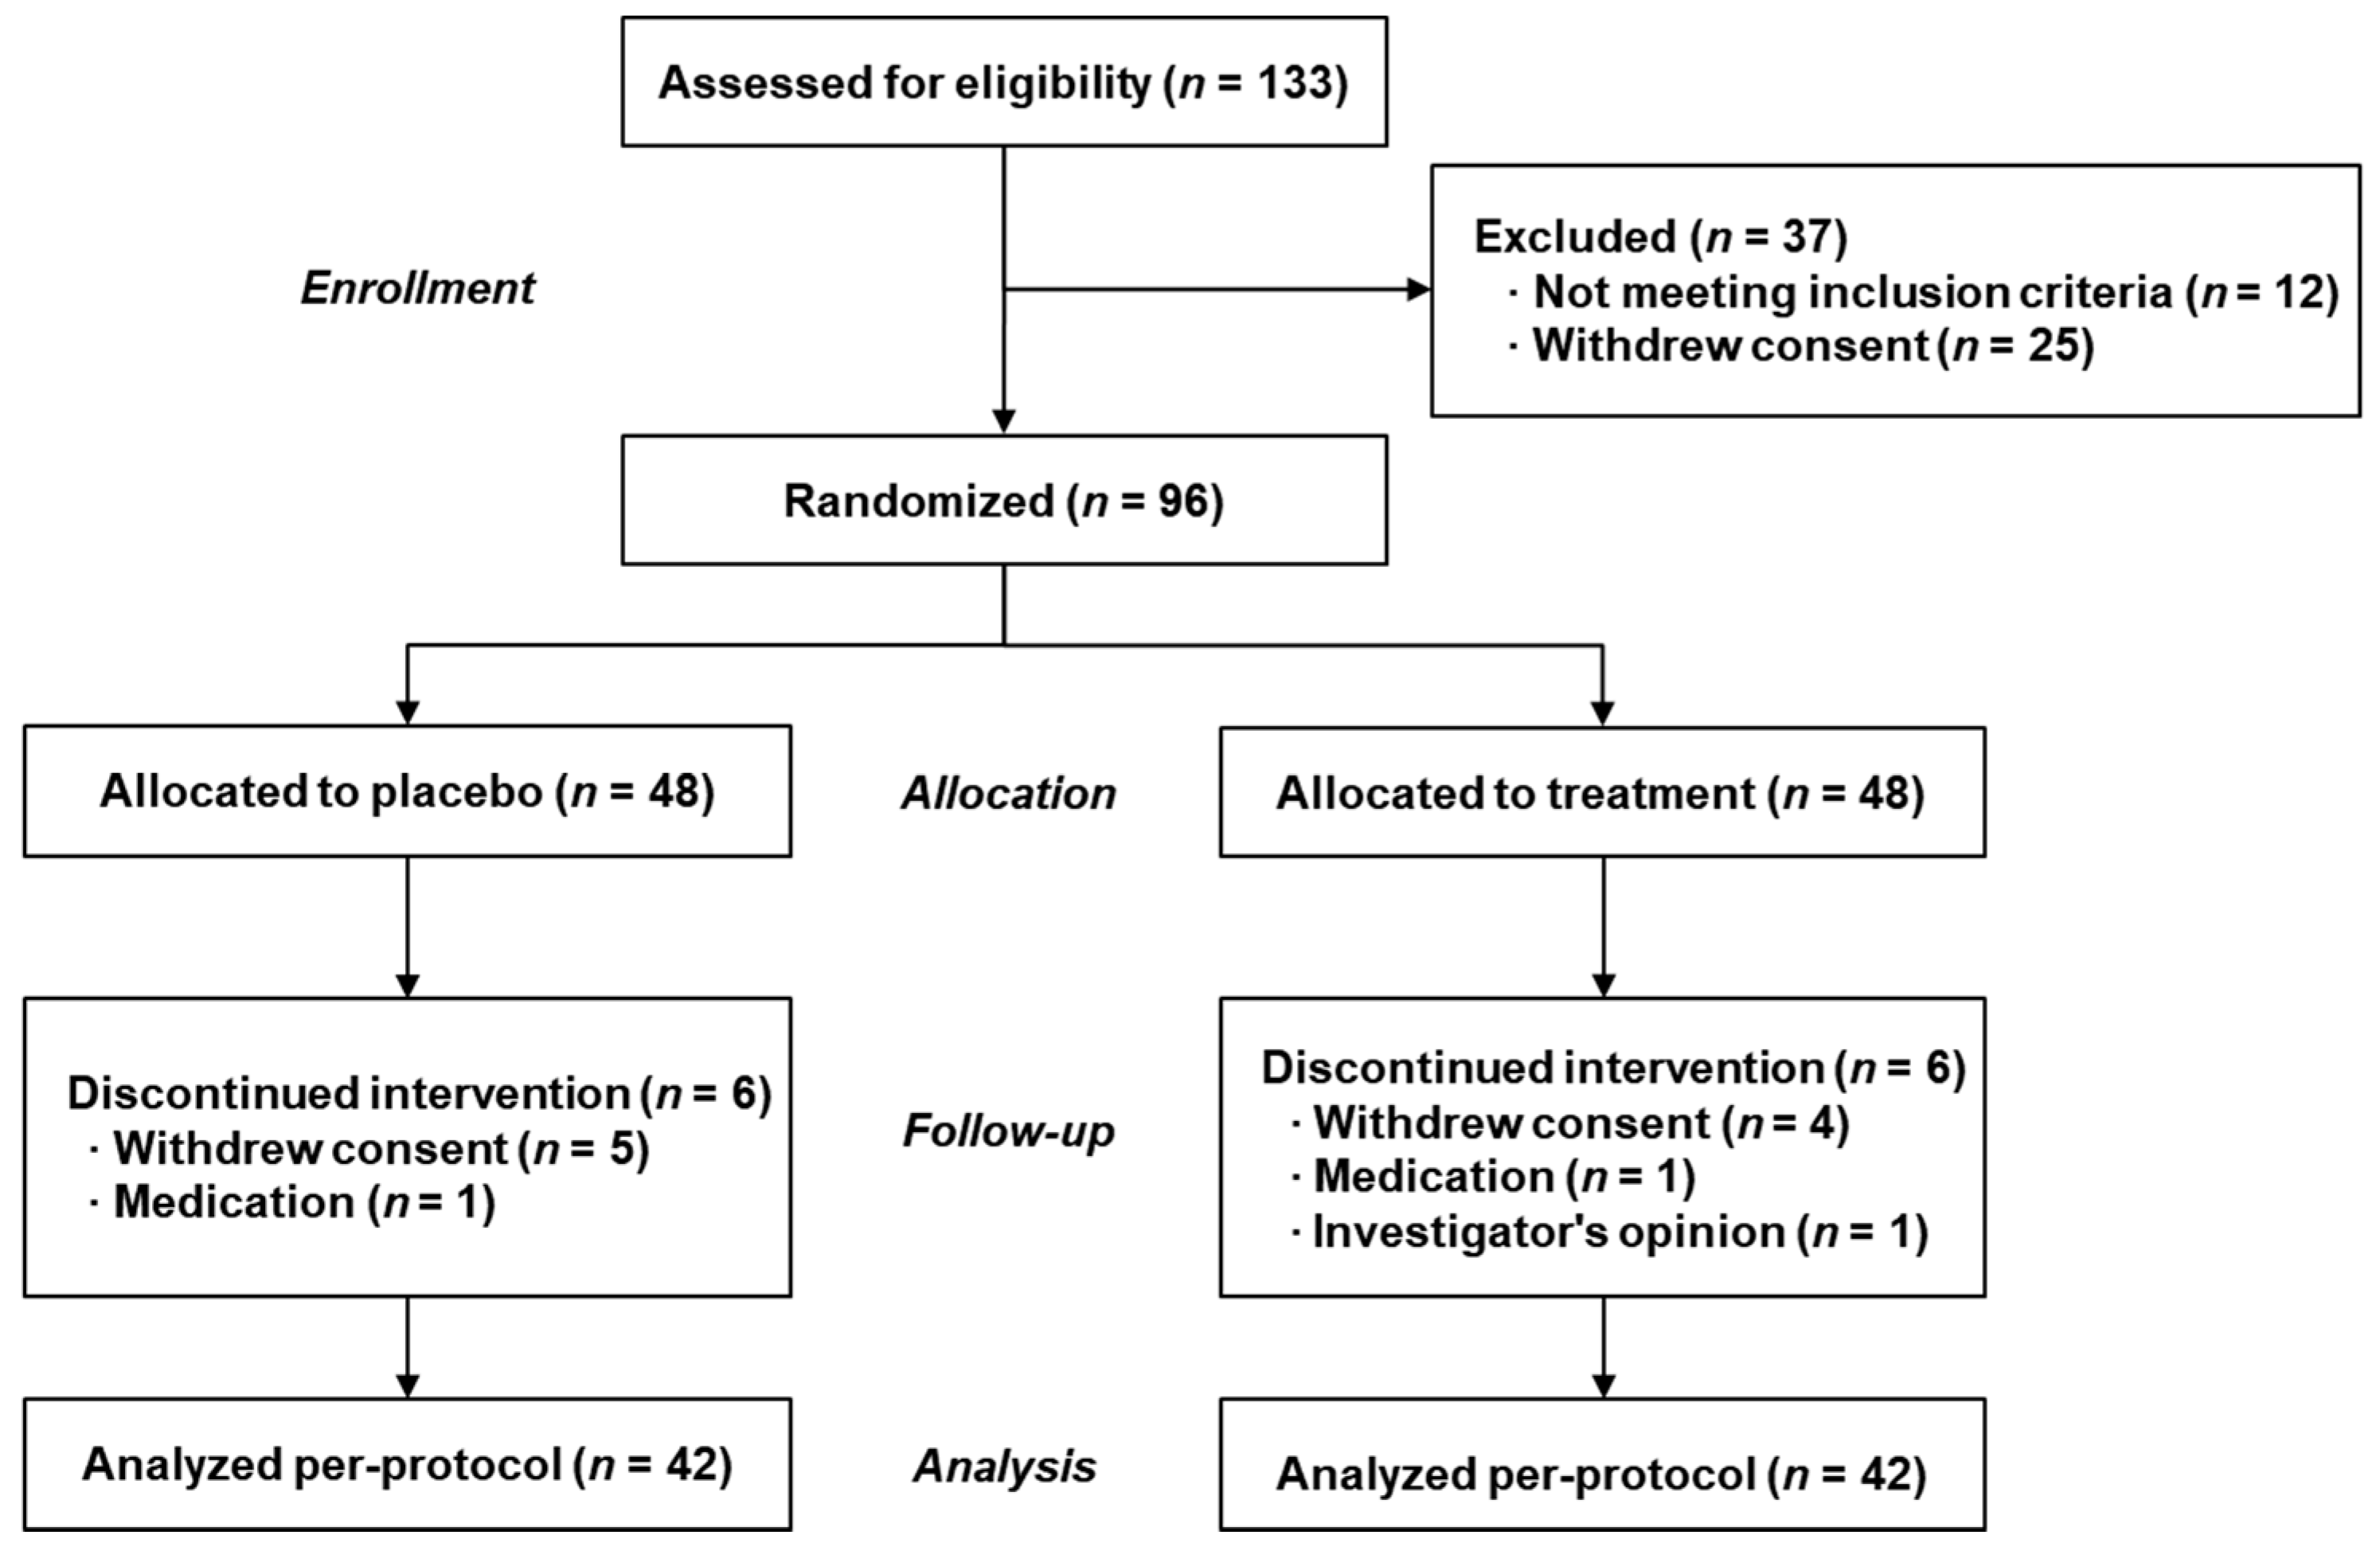
3.1. Subject Characteristics throughout the Study
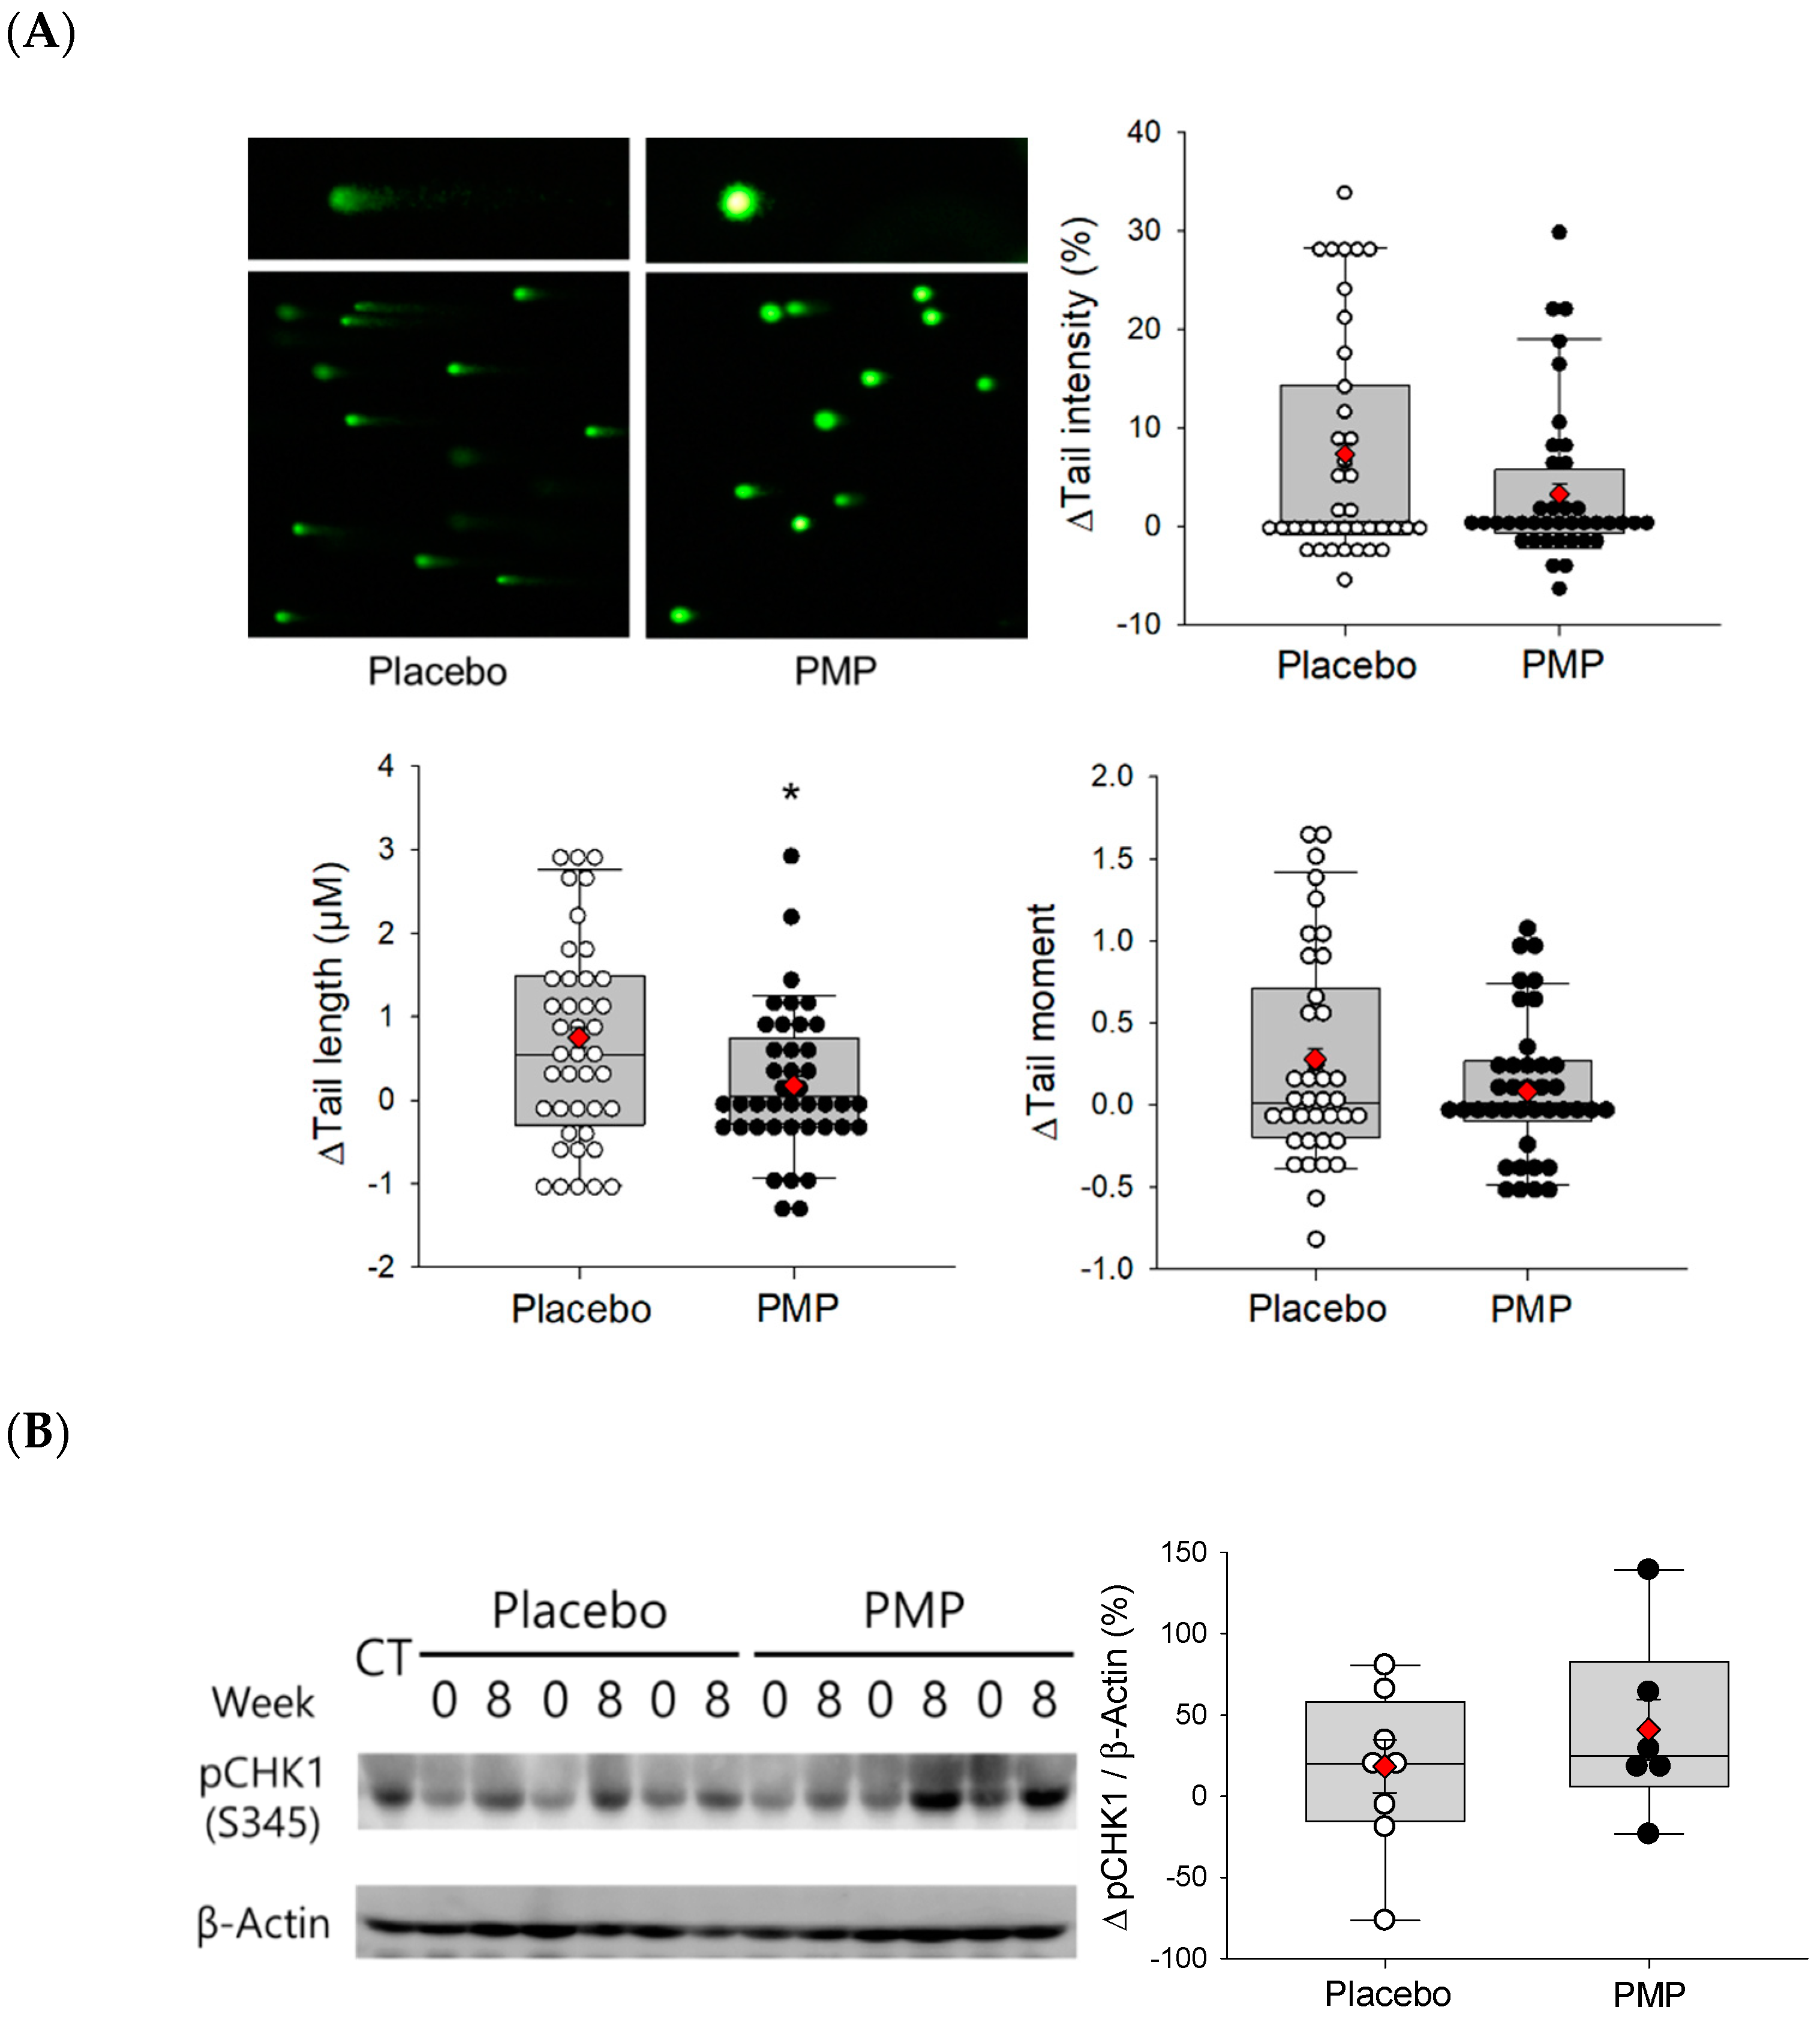
3.2. DNA Oxidative Damage
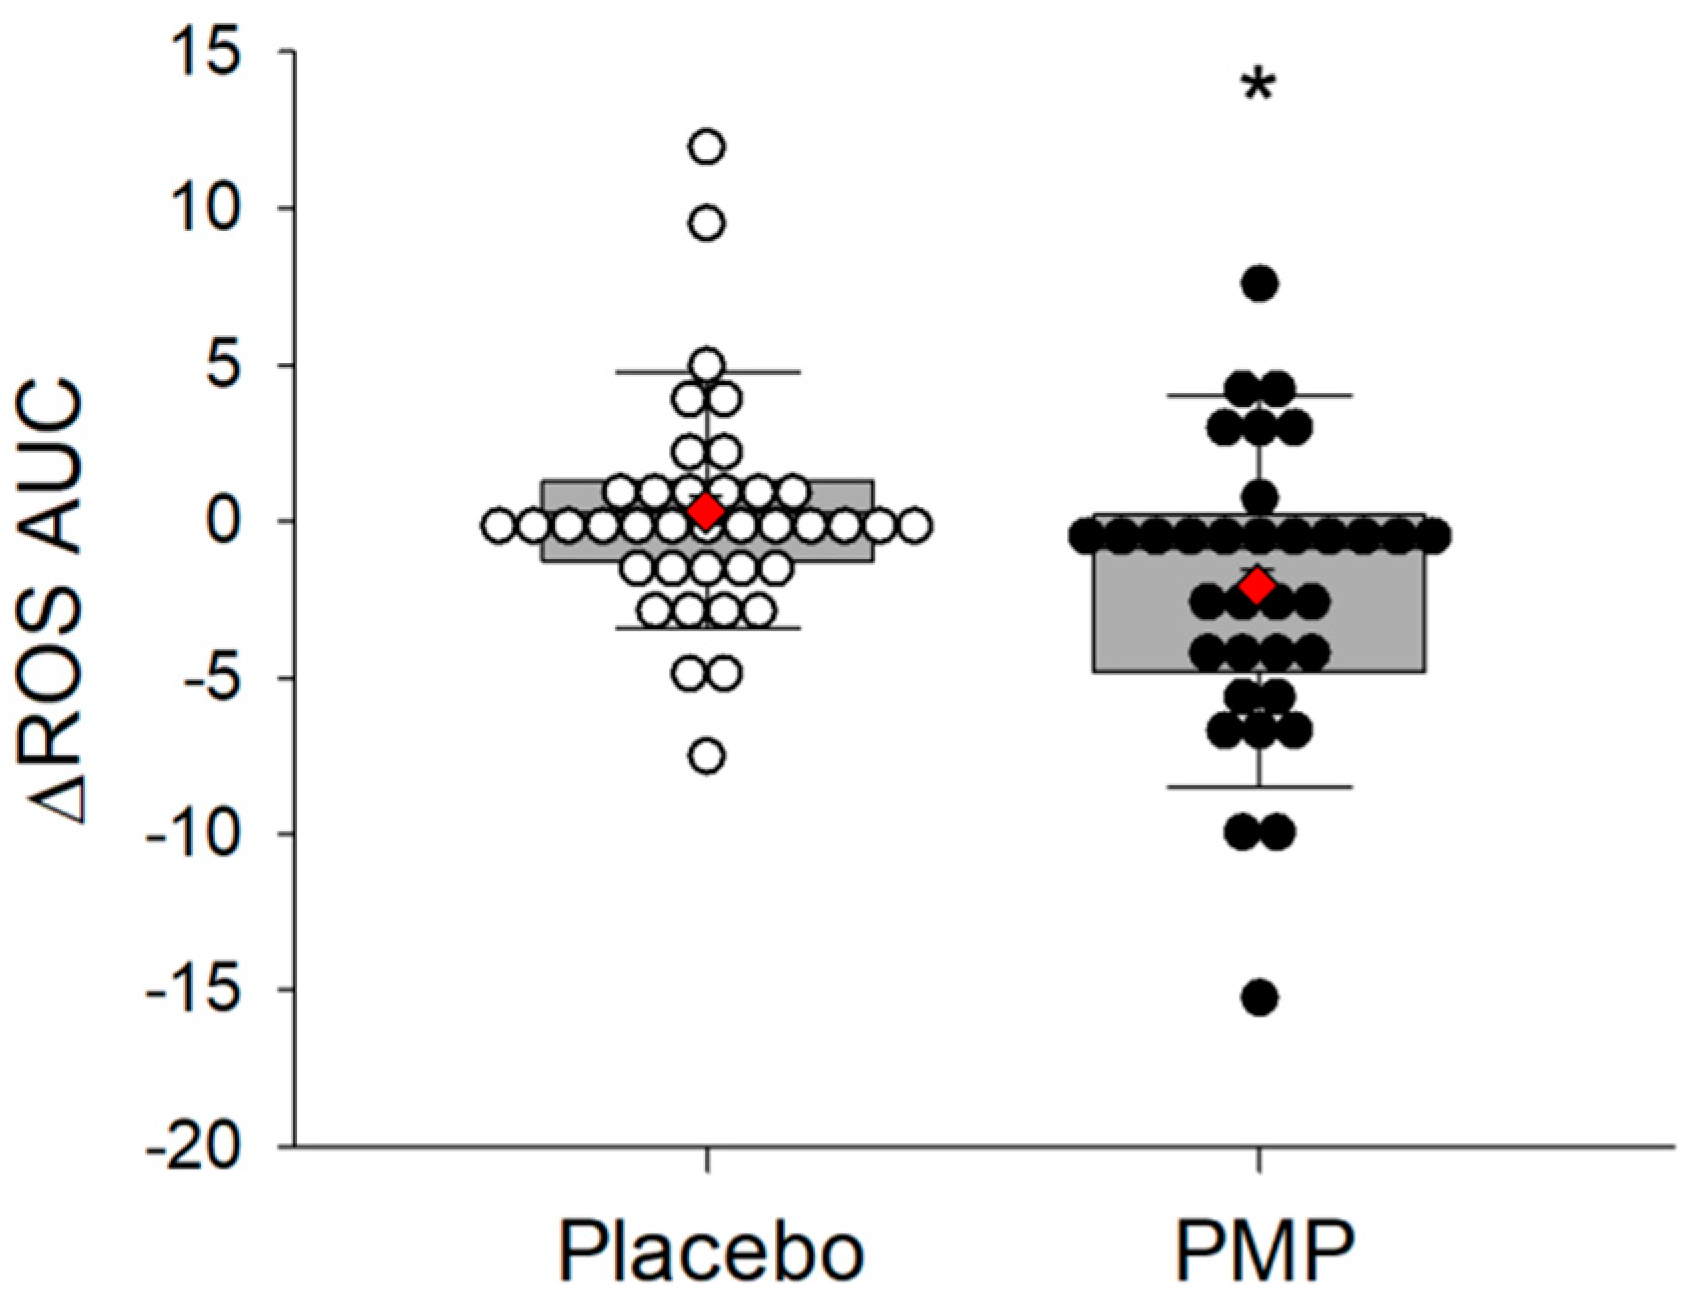
3.3. ROS Scavenging
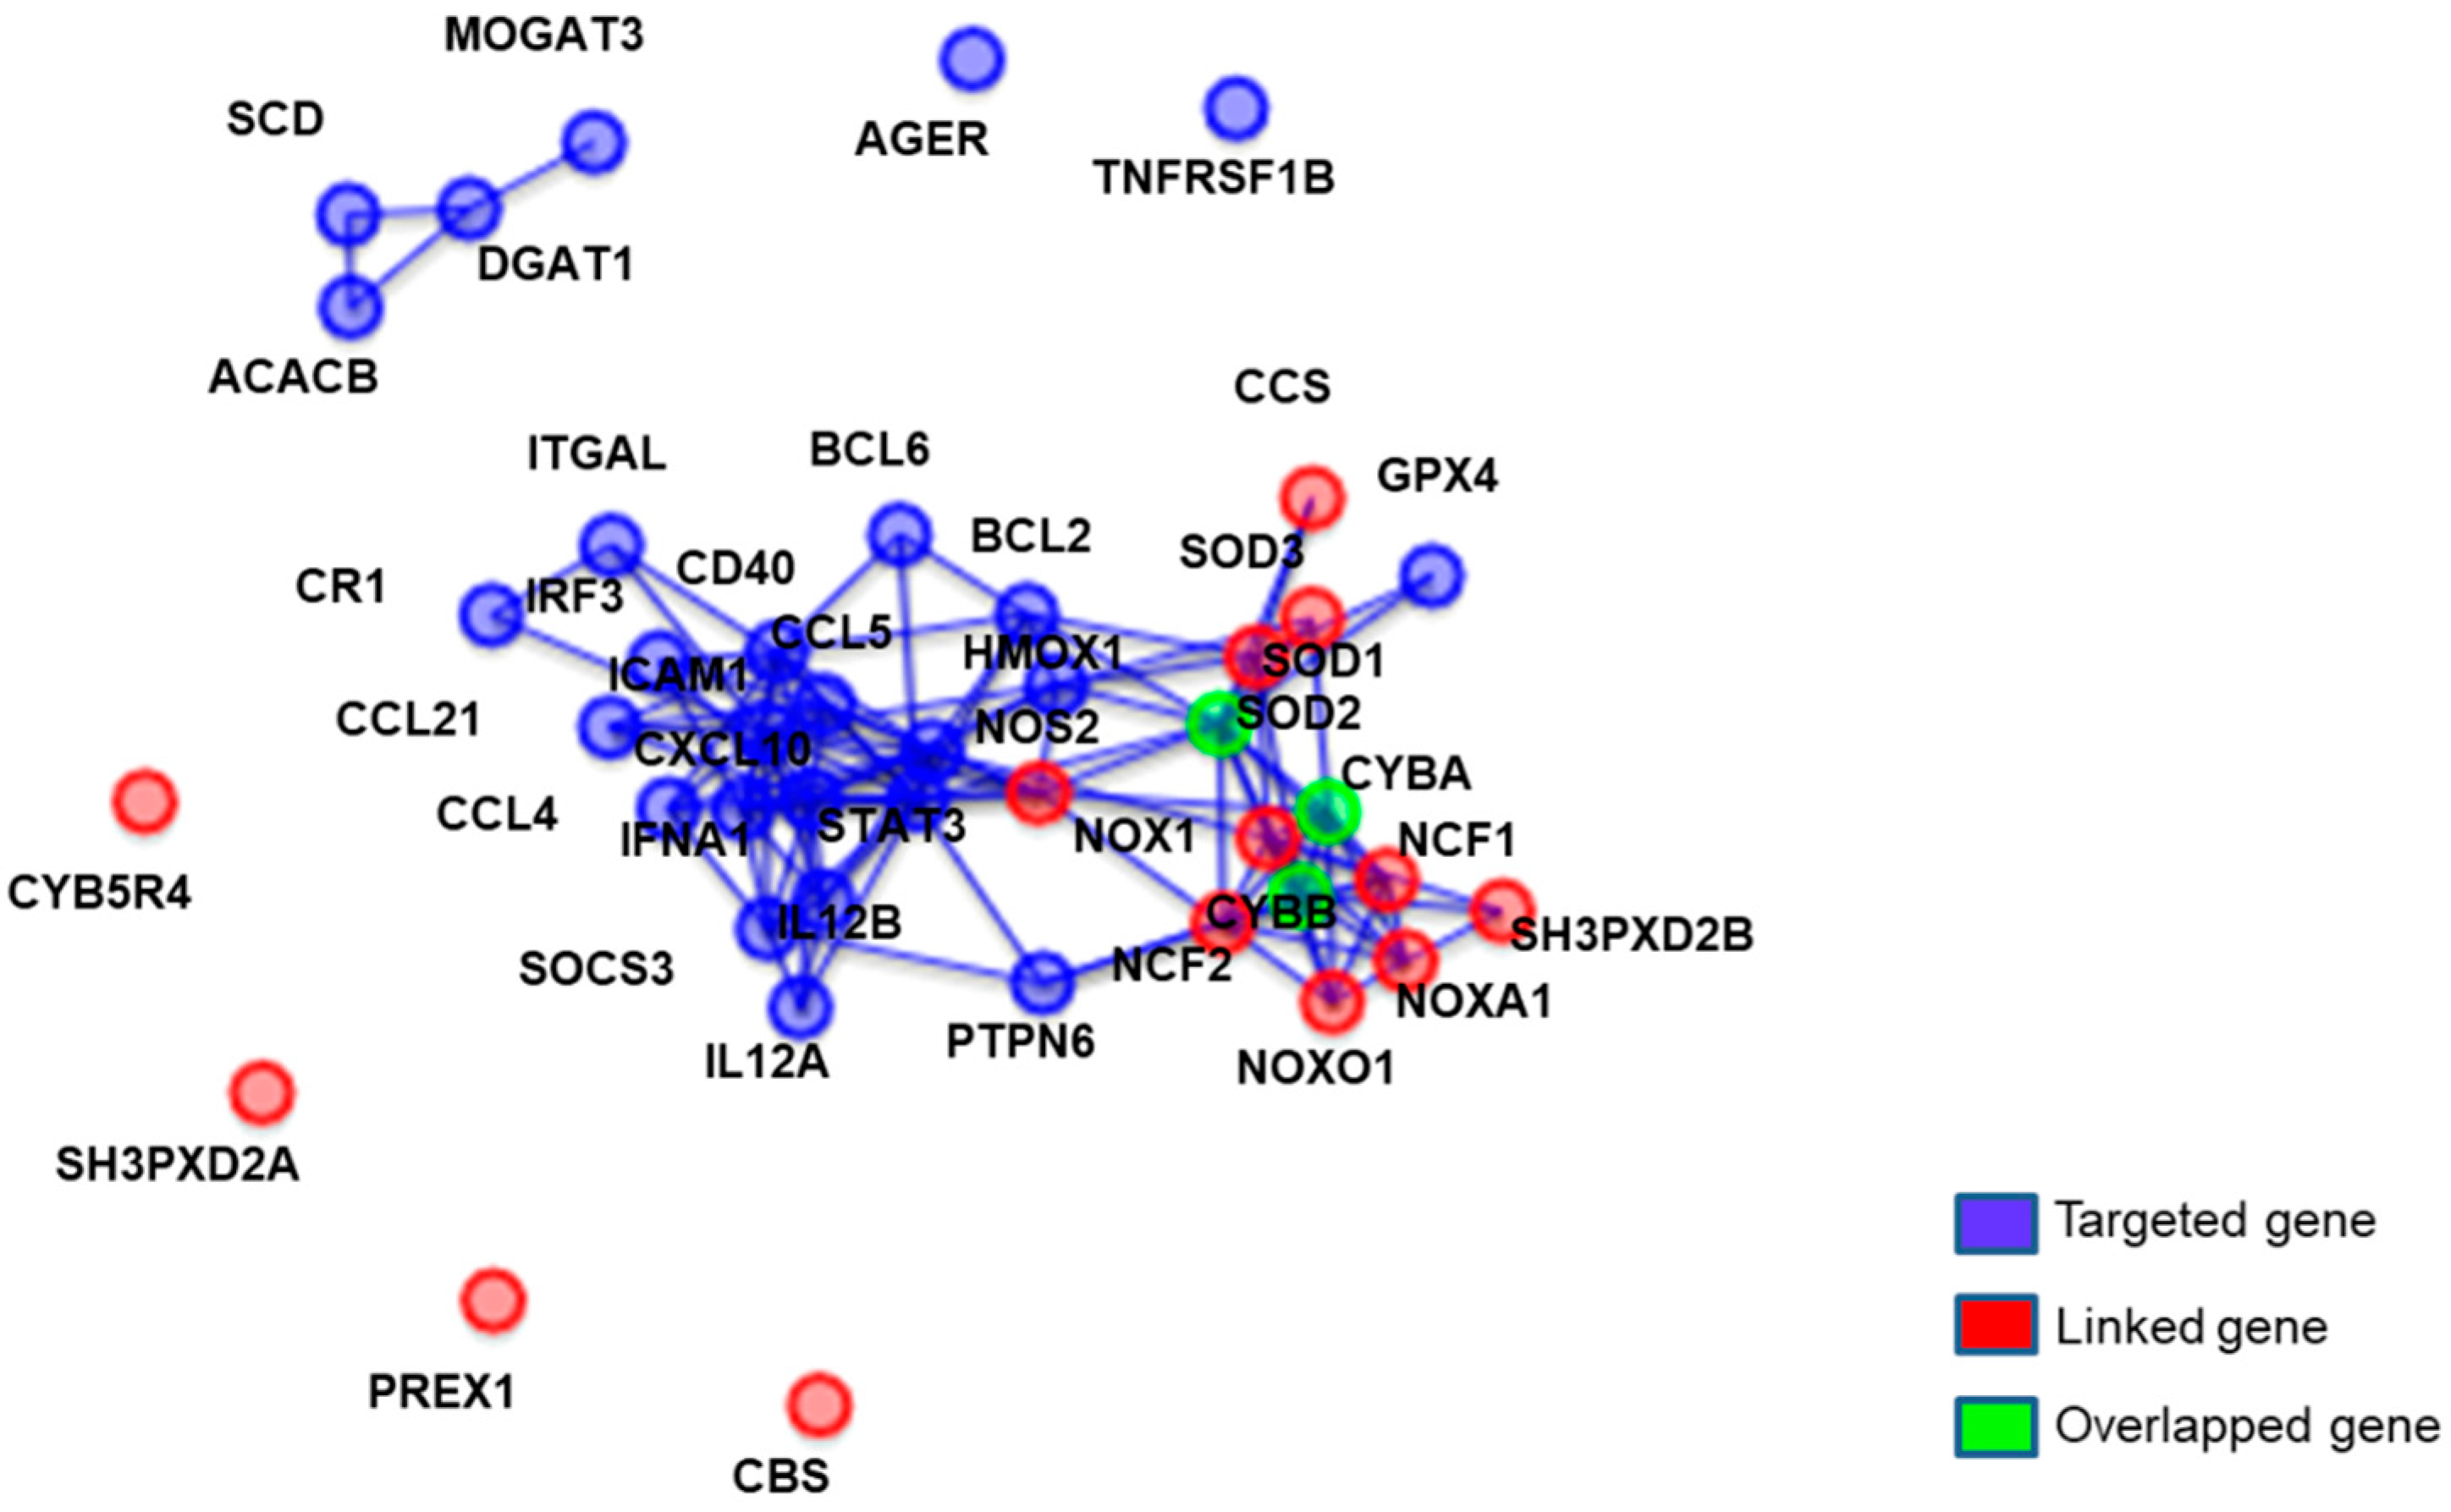
3.4. qPCR RNA Array Analysis
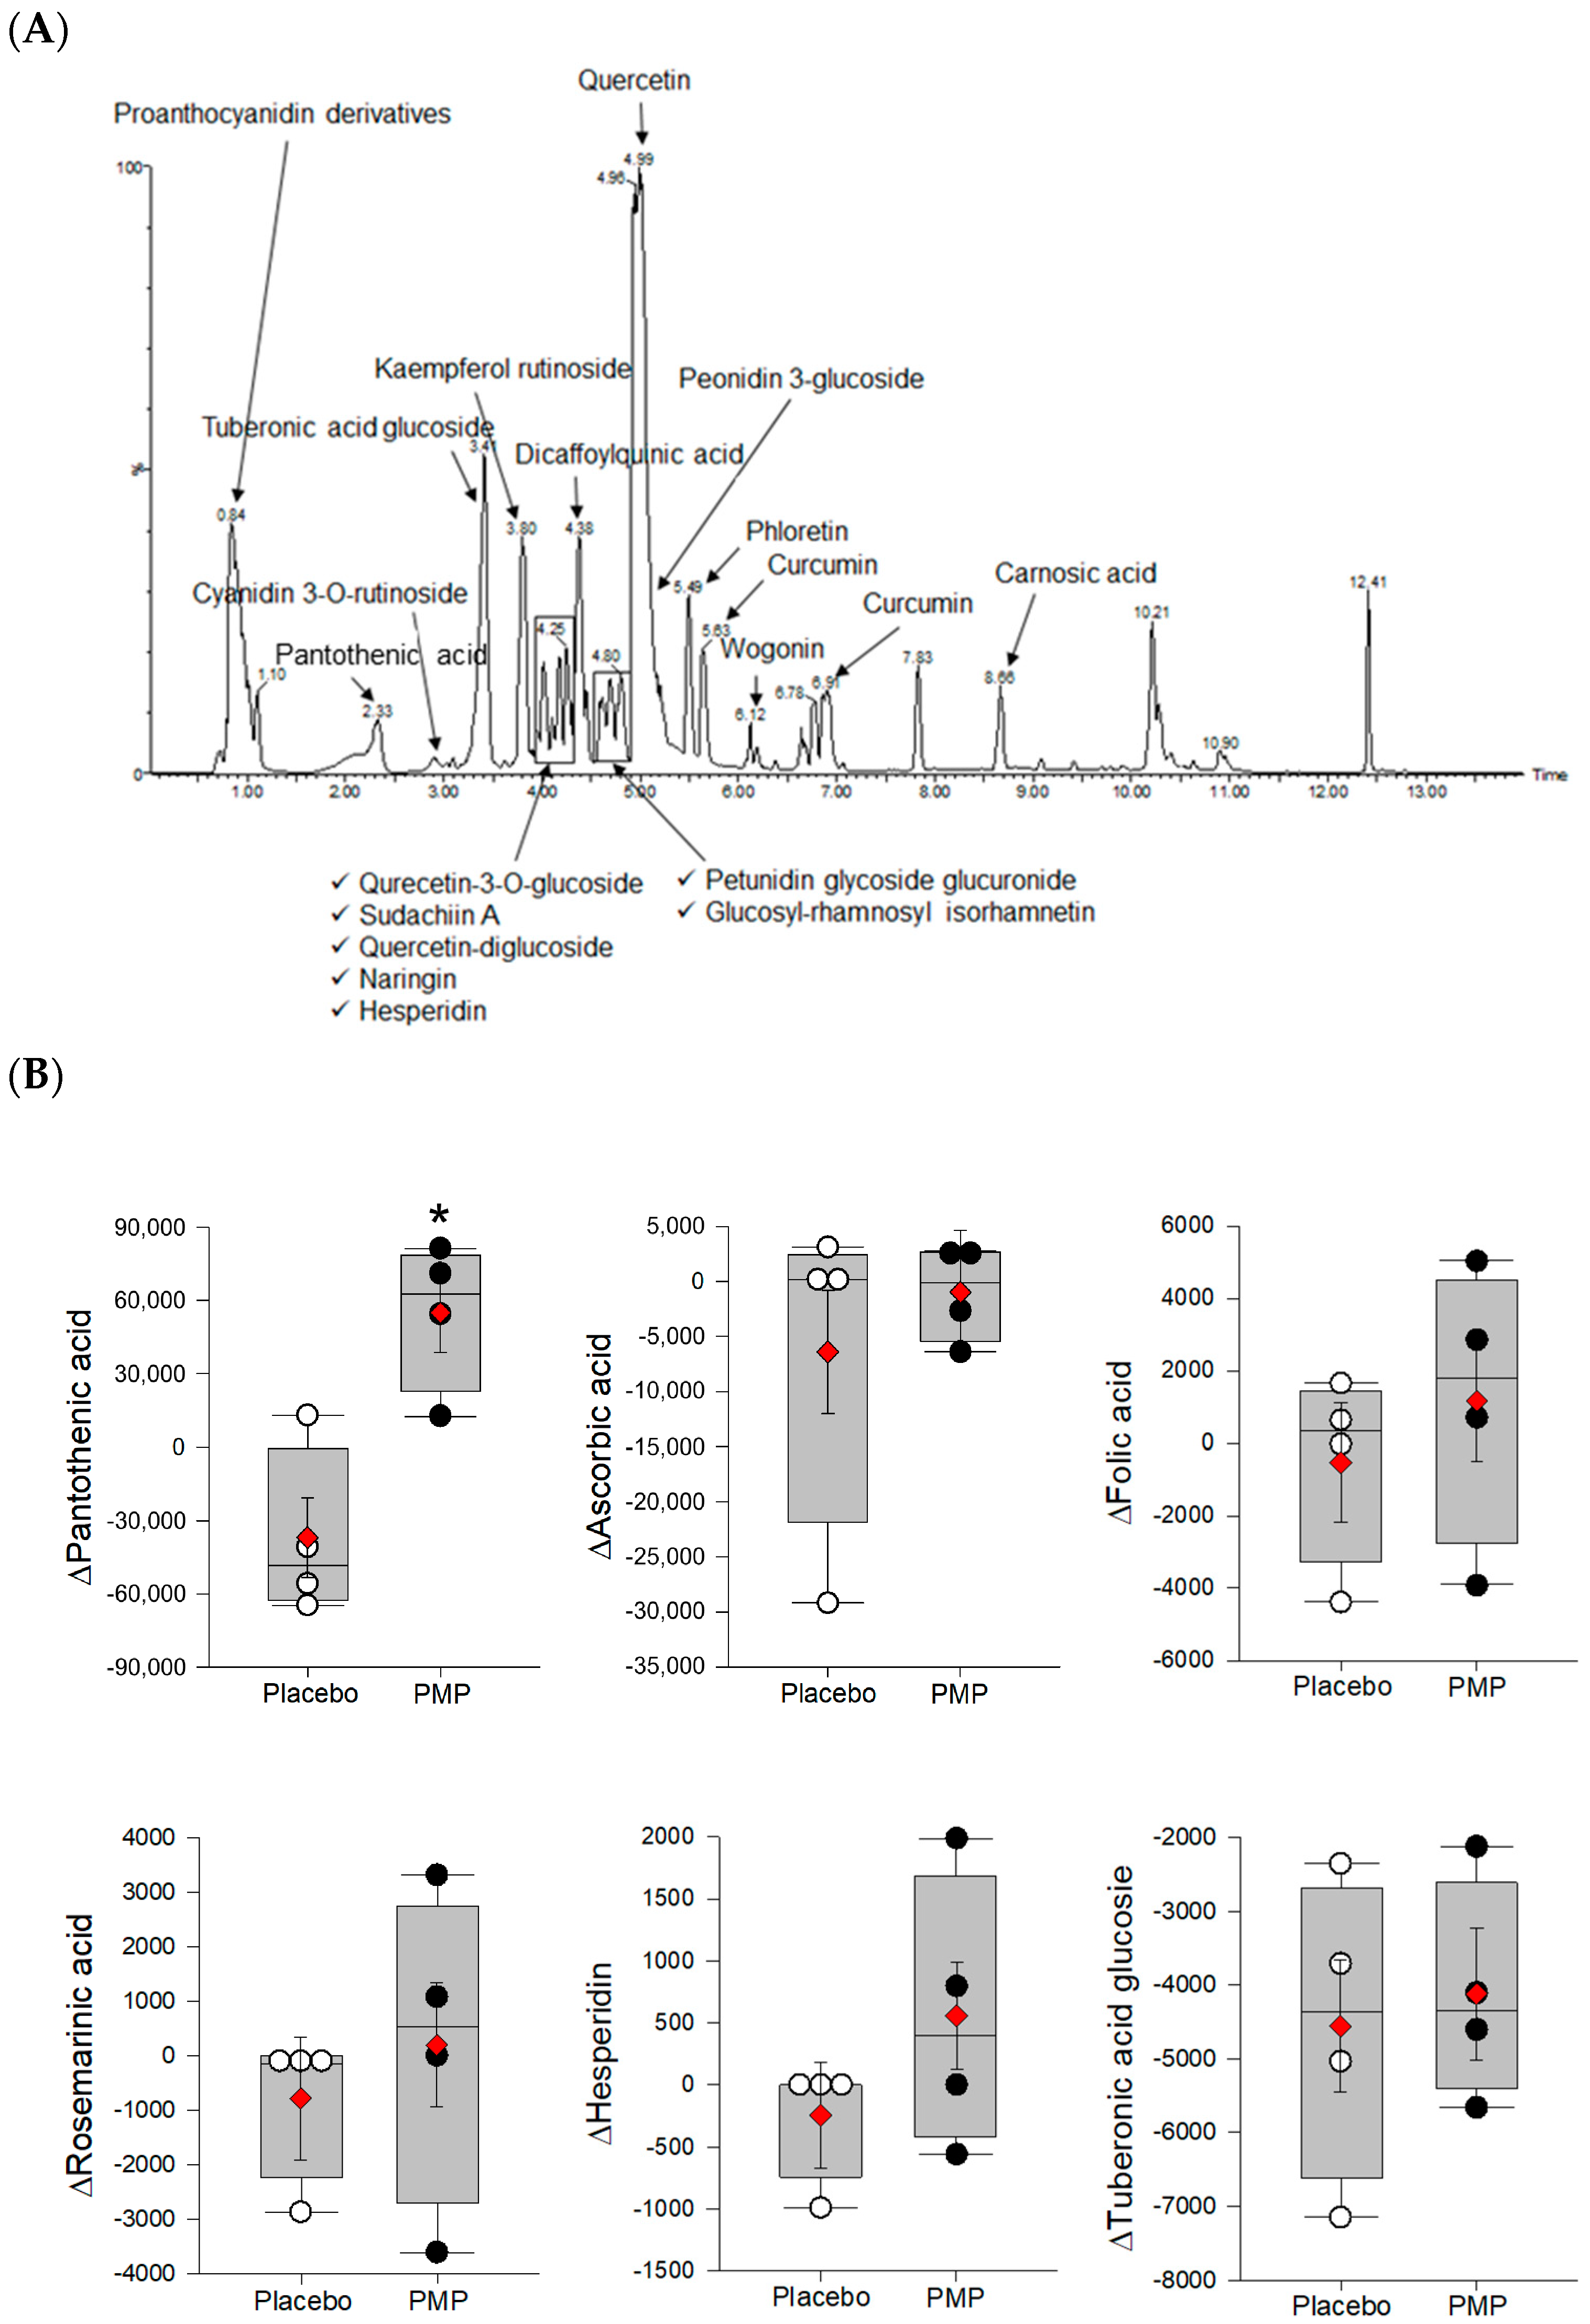
3.5. Vitamin and Phytonutrient Measurement
4. Discussion
5. Conclusions
Supplementary Materials
Author Contributions
Funding
Acknowledgments
Conflicts of Interest
References
- Burton-Freeman, B. Postprandial metabolic events and fruit-derived phenolics: A review of the science. Br. J. Nutr. 2010, 104 (Suppl. 3), S1–S14. [Google Scholar] [CrossRef]
- Bray, G.A.; Ryan, D.H.; Harsha, D.W. Diet, Weight Loss, and Cardiovascular Disease Prevention. Curr. Treat. Options Cardiovasc. Med. 2003, 5, 259–269. [Google Scholar] [CrossRef] [PubMed]
- Morris, C.D.; Carson, S. Routine vitamin supplementation to prevent cardiovascular disease: A summary of the evidence for the US Preventive Services Task Force. Ann. Intern. Med. 2003, 139, 56–70. [Google Scholar] [CrossRef]
- Murphy, S.P.; White, K.K.; Park, S.Y.; Sharma, S. Multivitamin-multimineral supplements’ effect on total nutrient intake. Am. J. Clin. Nutr. 2007, 85, 280S–284S. [Google Scholar] [CrossRef]
- Burnett-Hartman, A.N.; Fitzpatrick, A.L.; Gao, K.; Jackson, S.A.; Schreiner, P.J. Supplement Use Contributes to Meeting Recommended Dietary Intakes for Calcium, Magnesium, and Vitamin C in Four Ethnicities of Middle-Aged and Older Americans: The Multi-Ethnic Study of Atherosclerosis. J. Am. Diet. Assoc. 2009, 109, 422–429. [Google Scholar] [CrossRef] [PubMed] [Green Version]
- Dickinson, A.; Boyon, N.; Shao, A. Physicians and nurses use and recommend dietary supplements: Report of a survey. Nutr. J. 2009, 8, 29. [Google Scholar] [CrossRef] [PubMed]
- McGinnis, J.M.; Birt, D.F.; Brannon, P.M.; Carroll, R.J.; Gibbons, R.D.; Hazzard, W.R.; Kamerow, D.B.; Levin, B.; Ntambi, J.M.; Paneth, N.; et al. National Institutes of Health state-of-the-science conference statement: Multivitamin/mineral supplements and chronic disease prevention. Ann. Intern. Med. 2006, 145, 364–371. [Google Scholar] [CrossRef]
- Fairfield, K.M.; Fletcher, R.H. Vitamins for chronic disease prevention in adults: Scientific review. JAMA 2002, 287, 3116–3126. [Google Scholar] [CrossRef]
- Han, X.; Eggett, D.L.; Parker, T.L. Evaluation of the Health Benefits of a Multivitamin, Multimineral, Herbal, Essential Oil-Infused Supplement: A Pilot Trial. J. Diet. Suppl. 2018, 15, 153–160. [Google Scholar] [CrossRef]
- Jenkins, D.J.A.; Spence, J.D.; Giovannucci, E.L.; Kim, Y.I.; Josse, R.; Vieth, R.; Blanco Mejia, S.; Viguiliouk, E.; Nishi, S.; Sahye-Pudaruth, S.; et al. Supplemental Vitamins and Minerals for CVD Prevention and Treatment. J. Am. Coll. Cardiol. 2018, 71, 2570–2584. [Google Scholar] [CrossRef]
- Ristow, M.; Zarse, K.; Oberbach, A.; Kloting, N.; Birringer, M.; Kiehntopf, M.; Stumvoll, M.; Kahn, C.R.; Bluher, M. Antioxidants prevent health-promoting effects of physical exercise in humans. Proc. Natl. Acad. Sci. USA 2009, 106, 8665–8670. [Google Scholar] [CrossRef] [PubMed] [Green Version]
- Miller, E.R.; Pastor-Barriuso, R.; Dalal, D.; Riemersma, R.A.; Appel, L.J.; Guallar, E. Meta-analysis: High-dosage vitamin E supplementation may increase all-cause mortality. Ann. Intern. Med. 2005, 142, 37–46. [Google Scholar] [CrossRef] [PubMed]
- Omenn, G.S.; Goodman, G.E.; Thornquist, M.D.; Balmes, J.; Cullen, M.R.; Glass, A.; Keogh, J.P.; Meyskens, F.L., Jr.; Valanis, B.; Williams, J.H., Jr.; et al. Risk factors for lung cancer and for intervention effects in CARET, the Beta-Carotene and Retinol Efficacy Trial. J. Natl. Cancer Inst. 1996, 88, 1550–1559. [Google Scholar] [CrossRef] [PubMed]
- Zhang, Y.J.; Gan, R.Y.; Li, S.; Zhou, Y.; Li, A.N.; Xu, D.P.; Li, H.B. Antioxidant Phytochemicals for the Prevention and Treatment of Chronic Diseases. Molecules 2015, 20, 21138–21156. [Google Scholar] [CrossRef] [PubMed] [Green Version]
- Marin, L.; Miguelez, E.M.; Villar, C.J.; Lombo, F. Bioavailability of Dietary Polyphenols and Gut Microbiota Metabolism: Antimicrobial Properties. BioMed Res. Int. 2015, 2015, 905215. [Google Scholar] [CrossRef] [PubMed]
- Zamora-Ros, R.; Touillaud, M.; Rothwell, J.A.; Romieu, I.; Scalbert, A. Measuring exposure to the polyphenol metabolome in observational epidemiologic studies: Current tools and applications and their limits. Am. J. Clin. Nutr. 2014, 100, 11–26. [Google Scholar] [CrossRef]
- Lim, Y.; Ahn, Y.H.; Yoo, J.K.; Park, K.S.; Kwon, O. Verifying Identities of Plant-Based Multivitamins Using Phytochemical Fingerprinting in Combination with Multiple Bioassays. Plant Foods Hum. Nutr. 2017, 72, 288–293. [Google Scholar] [CrossRef]
- Jang, H.J.; Kim, J.W.; Ryu, S.H.; Kim, Y.J.; Kwon, O.; Kim, S.; Kim, S.; Kim, K.B. Metabolic profiling of antioxidant supplement with phytochemicals using plasma 1H NMR-based metabolomics in humans. J. Funct. Foods 2016, 24, 112–121. [Google Scholar] [CrossRef]
- Kim, Y.J.; Ahn, Y.H.; Lim, Y.; Kim, J.Y.; Kim, J.; Kwon, O. Daily nutritional dose supplementation with antioxidant nutrients and phytochemicals improves DNA and LDL stability: A double-blind, randomized, and placebo-controlled trial. Nutrients 2013, 5, 5218–5232. [Google Scholar] [CrossRef]
- Kim, J.Y.; Yang, Y.J.; Yang, Y.K.; Oh, S.Y.; Hong, Y.C.; Lee, E.K.; Kwon, O. Diet quality scores and oxidative stress in Korean adults. Eur. J. Clin. Nutr. 2011, 65, 1271–1278. [Google Scholar] [CrossRef] [Green Version]
- Schulz, K.F.; Altman, D.G.; Moher, D. CONSORT 2010 Statement: updated guidelines for reporting parallel group randomised trials. BMJ 2010, 340, c332. [Google Scholar] [CrossRef] [PubMed]
- Ninomiya, M.; Kajiguchi, T.; Yamamoto, K.; Kinoshita, T.; Emi, N.; Naoe, T. Increased oxidative DNA products in patients with acute promyelocytic leukemia during arsenic therapy. Haematologica 2006, 91, 1571–1572. [Google Scholar] [PubMed]
- Olive, P.L.; Banath, J.P. The comet assay: A method to measure DNA damage in individual cells. Nat. Protoc. 2006, 1, 23–29. [Google Scholar] [CrossRef] [PubMed]
- Choi, Y.E.; Park, E. Curcumin enhances poly (ADP-ribose) polymerase inhibitor sensitivity to chemotherapy in breast cancer cells. J. Nutr. Biochem. 2015, 26, 1442–1447. [Google Scholar] [CrossRef] [PubMed]
- Rhee, S.Y.; Jung, E.S.; Park, H.M.; Jeong, S.J.; Kim, K.; Chon, S.; Yu, S.Y.; Woo, J.T.; Lee, C.H. Plasma glutamine and glutamic acid are potential biomarkers for predicting diabetic retinopathy. Metabolomics 2018, 14, 89. [Google Scholar] [CrossRef] [PubMed]
- Suh, D.H.; Jung, E.S.; Lee, G.M.; Lee, C.H. Distinguishing Six Edible Berries Based on Metabolic Pathway and Bioactivity Correlations by Non-targeted Metabolite Profiling. Front. Plant Sci. 2018, 9, 1462. [Google Scholar] [CrossRef] [PubMed]
- Choi, B.R.; Kim, H.K.; Soni, K.K.; Karna, K.K.; Lee, S.W.; So, I.; Park, J.K. Additive effect of oral LDD175 to tamsulosin and finasteride in a benign prostate hyperplasia rat model. Drug Des. Dev. Ther. 2018, 12, 1855–1863. [Google Scholar] [CrossRef]
- Glaab, E.; Baudot, A.; Krasnogor, N.; Schneider, R.; Valencia, A. EnrichNet: Network-based gene set enrichment analysis. Bioinformatics 2012, 28, i451–i457. [Google Scholar] [CrossRef]
- Kurutas, E.B. The importance of antioxidants which play the role in cellular response against oxidative/nitrosative stress: Current state. Nutr. J. 2015, 15, 71. [Google Scholar] [CrossRef]
- Salganik, R.I. The benefits and hazards of antioxidants: Controlling apoptosis and other protective mechanisms in cancer patients and the human population. J. Am. Coll. Nutr. 2001, 20, 464S–472S. [Google Scholar] [CrossRef]
- Collins, A.R. The comet assay for DNA damage and repair: Principles, applications, and limitations. Mol. Biotechnol. 2004, 26, 249–261. [Google Scholar] [CrossRef]
- Torbergsen, A.C.; Collins, A.R. Recovery of human lymphocytes from oxidative DNA damage; the apparent enhancement of DNA repair by carotenoids is probably simply an antioxidant effect. Eur. J. Nutr. 2000, 39, 80–85. [Google Scholar] [CrossRef]
- Brevik, A.; Gaivão, I.; Medin, T.; Jørgenesen, A.; Piasek, A.; Elilasson, J.; Karlsen, A.; Blomhoff, R.; Veggan, T.; Duttaroy, A.K.; et al. Supplementation of a western diet with golden kiwifruits (Actinidia chinensis var.’Hort 16a’:) effects on biomarkers of oxidation damage and antioxidant protection. Nutr. J. 2011, 10, 54. [Google Scholar] [CrossRef] [PubMed]
- Chang, J.-L.; Chen, G.; Ulrich, C.M.; Bigler, J.; King, I.B.; Schwarz, Y.; Li, S.; Li, L.; Potter, J.D.; Lampe, J.W. DNA damage and repair: Fruit and vegetable effects in a feeding trial. Nutr. Cancer 2010, 62, 329–335. [Google Scholar] [CrossRef] [PubMed]
- Smith, J.; Tho, L.M.; Xu, N.; Gillespie, D.A. Chapter 3—The ATM–Chk2 and ATR–Chk1 Pathways in DNA Damage Signaling and Cancer. In Advances in Cancer Research; Vande Woude, G.F., Klein, G., Eds.; Academic Press: Cambridge, MA, USA, 2010; Volume 108, pp. 73–112. [Google Scholar]
- Cortez, D.; Guntuku, S.; Qin, J.; Elledge, S.J. ATR and ATRIP: Partners in checkpoint signaling. Science 2001, 294, 1713–1716. [Google Scholar] [CrossRef] [PubMed]
- Flynn, R.L.; Zou, L. ATR: A master conductor of cellular responses to DNA replication stress. Trends Biochem. Sci. 2011, 36, 133–140. [Google Scholar] [CrossRef]
- Kim, B.-M.; Choi, J.Y.; Kim, Y.-J.; Woo, H.-D.; Chung, H.W. Reoxygenation following hypoxia activates DNA-damage checkpoint signaling pathways that suppress cell-cycle progression in cultured human lymphocytes. FEBS Lett. 2007, 581, 3005–3012. [Google Scholar] [CrossRef] [Green Version]
- Kigawa, Y.; Miyazaki, T.; Lei, X.F.; Kim-Kaneyama, J.R.; Miyazaki, A. Functional Heterogeneity of Nadph Oxidases in Atherosclerotic and Aneurysmal Diseases. J. Atheroscler. Thromb. 2017, 24, 1–13. [Google Scholar] [CrossRef] [Green Version]
- Scalbert, A.; Morand, C.; Manach, C.; Remesy, C. Absorption and metabolism of polyphenols in the gut and impact on health. Biomed. Pharmacother. 2002, 56, 276–282. [Google Scholar] [CrossRef]
- Adomako-Bonsu, A.G.; Chan, S.L.; Pratten, M.; Fry, J.R. Antioxidant activity of rosmarinic acid and its principal metabolites in chemical and cellular systems: Importance of physico-chemical characteristics. Toxicol. In Vitro 2017, 40, 248–255. [Google Scholar] [CrossRef]
- Takumi, H.; Nakamura, H.; Simizu, T.; Harada, R.; Kometani, T.; Nadamoto, T.; Mukai, R.; Murota, K.; Kawai, Y.; Terao, J. Bioavailability of orally administered water-dispersible hesperetin and its effect on peripheral vasodilatation in human subjects: Implication of endothelial functions of plasma conjugated metabolites. Food Funct. 2012, 3, 389–398. [Google Scholar] [CrossRef] [PubMed]
- Baba, S.; Osakabe, N.; Natsume, M.; Terao, J. Orally administered rosmarinic acid is present as the conjugated and/or methylated forms in plasma, and is degraded and metabolized to conjugated forms of caffeic acid, ferulic acid and m-coumaric acid. Life Sci. 2004, 75, 165–178. [Google Scholar] [CrossRef] [PubMed]
- Baba, S.; Osakabe, N.; Natsume, M.; Yasuda, A.; Muto, Y.; Hiyoshi, K.; Takano, H.; Yoshikawa, T.; Terao, J. Absorption, metabolism, degradation and urinary excretion of rosmarinic acid after intake of Perilla frutescens extract in humans. Eur. J. Nutr. 2005, 44, 1–9. [Google Scholar] [CrossRef]
- Coelho, V.R.; Viau, C.M.; Staub, R.B.; De Souza, M.S.; Pfluger, P.; Regner, G.G.; Pereira, P.; Saffi, J. Rosmarinic Acid Attenuates the Activation of Murine Microglial N9 Cells through the Downregulation of Inflammatory Cytokines and Cleaved Caspase-3. Neuroimmunomodulation 2017, 24, 171–181. [Google Scholar] [CrossRef] [PubMed]
- Perez-Sanchez, A.; Barrajon-Catalan, E.; Herranz-Lopez, M.; Castillo, J.; Micol, V. Lemon balm extract (Melissa officinalis, L.) promotes melanogenesis and prevents UVB-induced oxidative stress and DNA damage in a skin cell model. J. Dermatolog. Sci. 2016, 84, 169–177. [Google Scholar] [CrossRef] [PubMed]
- Wu, C.F.; Hong, C.; Klauck, S.M.; Lin, Y.L.; Efferth, T. Molecular mechanisms of rosmarinic acid from Salvia miltiorrhiza in acute lymphoblastic leukemia cells. J. Ethnopharmacol. 2015, 176, 55–68. [Google Scholar] [CrossRef] [PubMed]
- Sivagami, G.; Vinothkumar, R.; Bernini, R.; Preethy, C.P.; Riyasdeen, A.; Akbarsha, M.A.; Menon, V.P.; Nalini, N. Role of hesperetin (a natural flavonoid) and its analogue on apoptosis in HT-29 human colon adenocarcinoma cell line—A comparative study. Food Chem. Toxicol. 2012, 50, 660–671. [Google Scholar] [CrossRef]
- Sivagami, G.; Vinothkumar, R.; Bernini, R.; Preethy, C.P.; Riyasdeen, A.; Akbarsha, M.A.; Menon, V.P.; Nalini, N. Corrigendum to “Role of hesperetin (a natural flavonoid) and its analogue on apoptosis in HT-29 human colon adenocarcinoma cell line—A comparative study” [Food Chem. Toxicol. 50 (2012) 660–671]. Food Chem. Toxicol. 2013, 58, 552–553. [Google Scholar] [CrossRef]
- Kalpana, K.B.; Devipriya, N.; Srinivasan, M.; Menon, V.P. Investigation of the radioprotective efficacy of hesperidin against gamma-radiation induced cellular damage in cultured human peripheral blood lymphocytes. Mutat. Res. 2009, 676, 54–61. [Google Scholar] [CrossRef]


| Variable | Placebo | PMP | p-Value 2 |
|---|---|---|---|
| (n = 42) | (n = 42) | ||
| Age (year) | 41.6 ± 1.7 | 38.2 ± 1.7 | 0.169 |
| Gender (male/female, n) | 13/29 | 13/29 | 1.000 |
| Recommended food score | 19.5 ± 1.3 | 19.1 ± 1.5 | 0.830 |
| Body weight (kg) | 67.4 ± 2.1 | 65.1 ± 2.2 | 0.462 |
| Body mass index (kg/m2) | 24.8 ± 0.6 | 23.7 ± 0.6 | 0.202 |
| Percent of body fat (%) | 31.7 ± 0.9 | 30.1 ± 1.0 | 0.258 |
| Smoker, n (%) | 3 (7.1) | 4 (9.5) | 0.693 |
| Alcohol drinker, n (%) | 22 (52.4) | 24 (57.1) | 0.661 |
| Blood pressure (mmHg) | |||
| Systolic blood pressure | 119.1 ± 2.1 | 116.7 ± 2.0 | 0.414 |
| Diastolic blood pressure | 79.5 ± 1.6 | 79.0 ± 1.5 | 0.786 |
| Blood lipid profiles (mg/dL) | |||
| Total triglyceride | 142.2 ± 18.1 | 121.4 ± 9.2 | 0.311 |
| Total cholesterol | 189.5 ± 5.7 | 187.0 ± 4.3 | 0.729 |
| LDL cholesterol | 119.4 ± 5.7 | 120.6 ± 4.2 | 0.856 |
| HDL cholesterol | 53.2 ± 2.2 | 54.1 ± 1.8 | 0.752 |
| Variable | Placebo (n = 42) | PMP (n = 42) | Estimate 2 | p-Value | ||
|---|---|---|---|---|---|---|
| Week 0 | Week 8 | Week 0 | Week 8 | |||
| Erythrocyte | ||||||
| SOD activity (U/mL) | 200.25 ± 4.32 | 192.76 ± 3.63 | 205.87 ± 4.32 | 206.02 ± 3.63 | 7.637 | 0.250 |
| GPx activity (µmol/min/mL) | 1.12 ± 0.04 | 1.10 ± 0.04 | 1.11 ± 0.04 | 1.11 ± 0.04 | 0.017 | 0.559 |
| Plasma | ||||||
| MDA (µmol/L) | 2.97 ± 0.14 | 2.99 ± 0.14 | 2.96 ± 0.14 | 3.02 ± 0.14 | 0.040 | 0.774 |
| Oxidized LDL (U/L) | 41.18 ± 1.84 | 39.89 ± 1.73 | 43.25 ± 1.84 | 41.78 ± 1.73 | −0.176 | 0.914 |
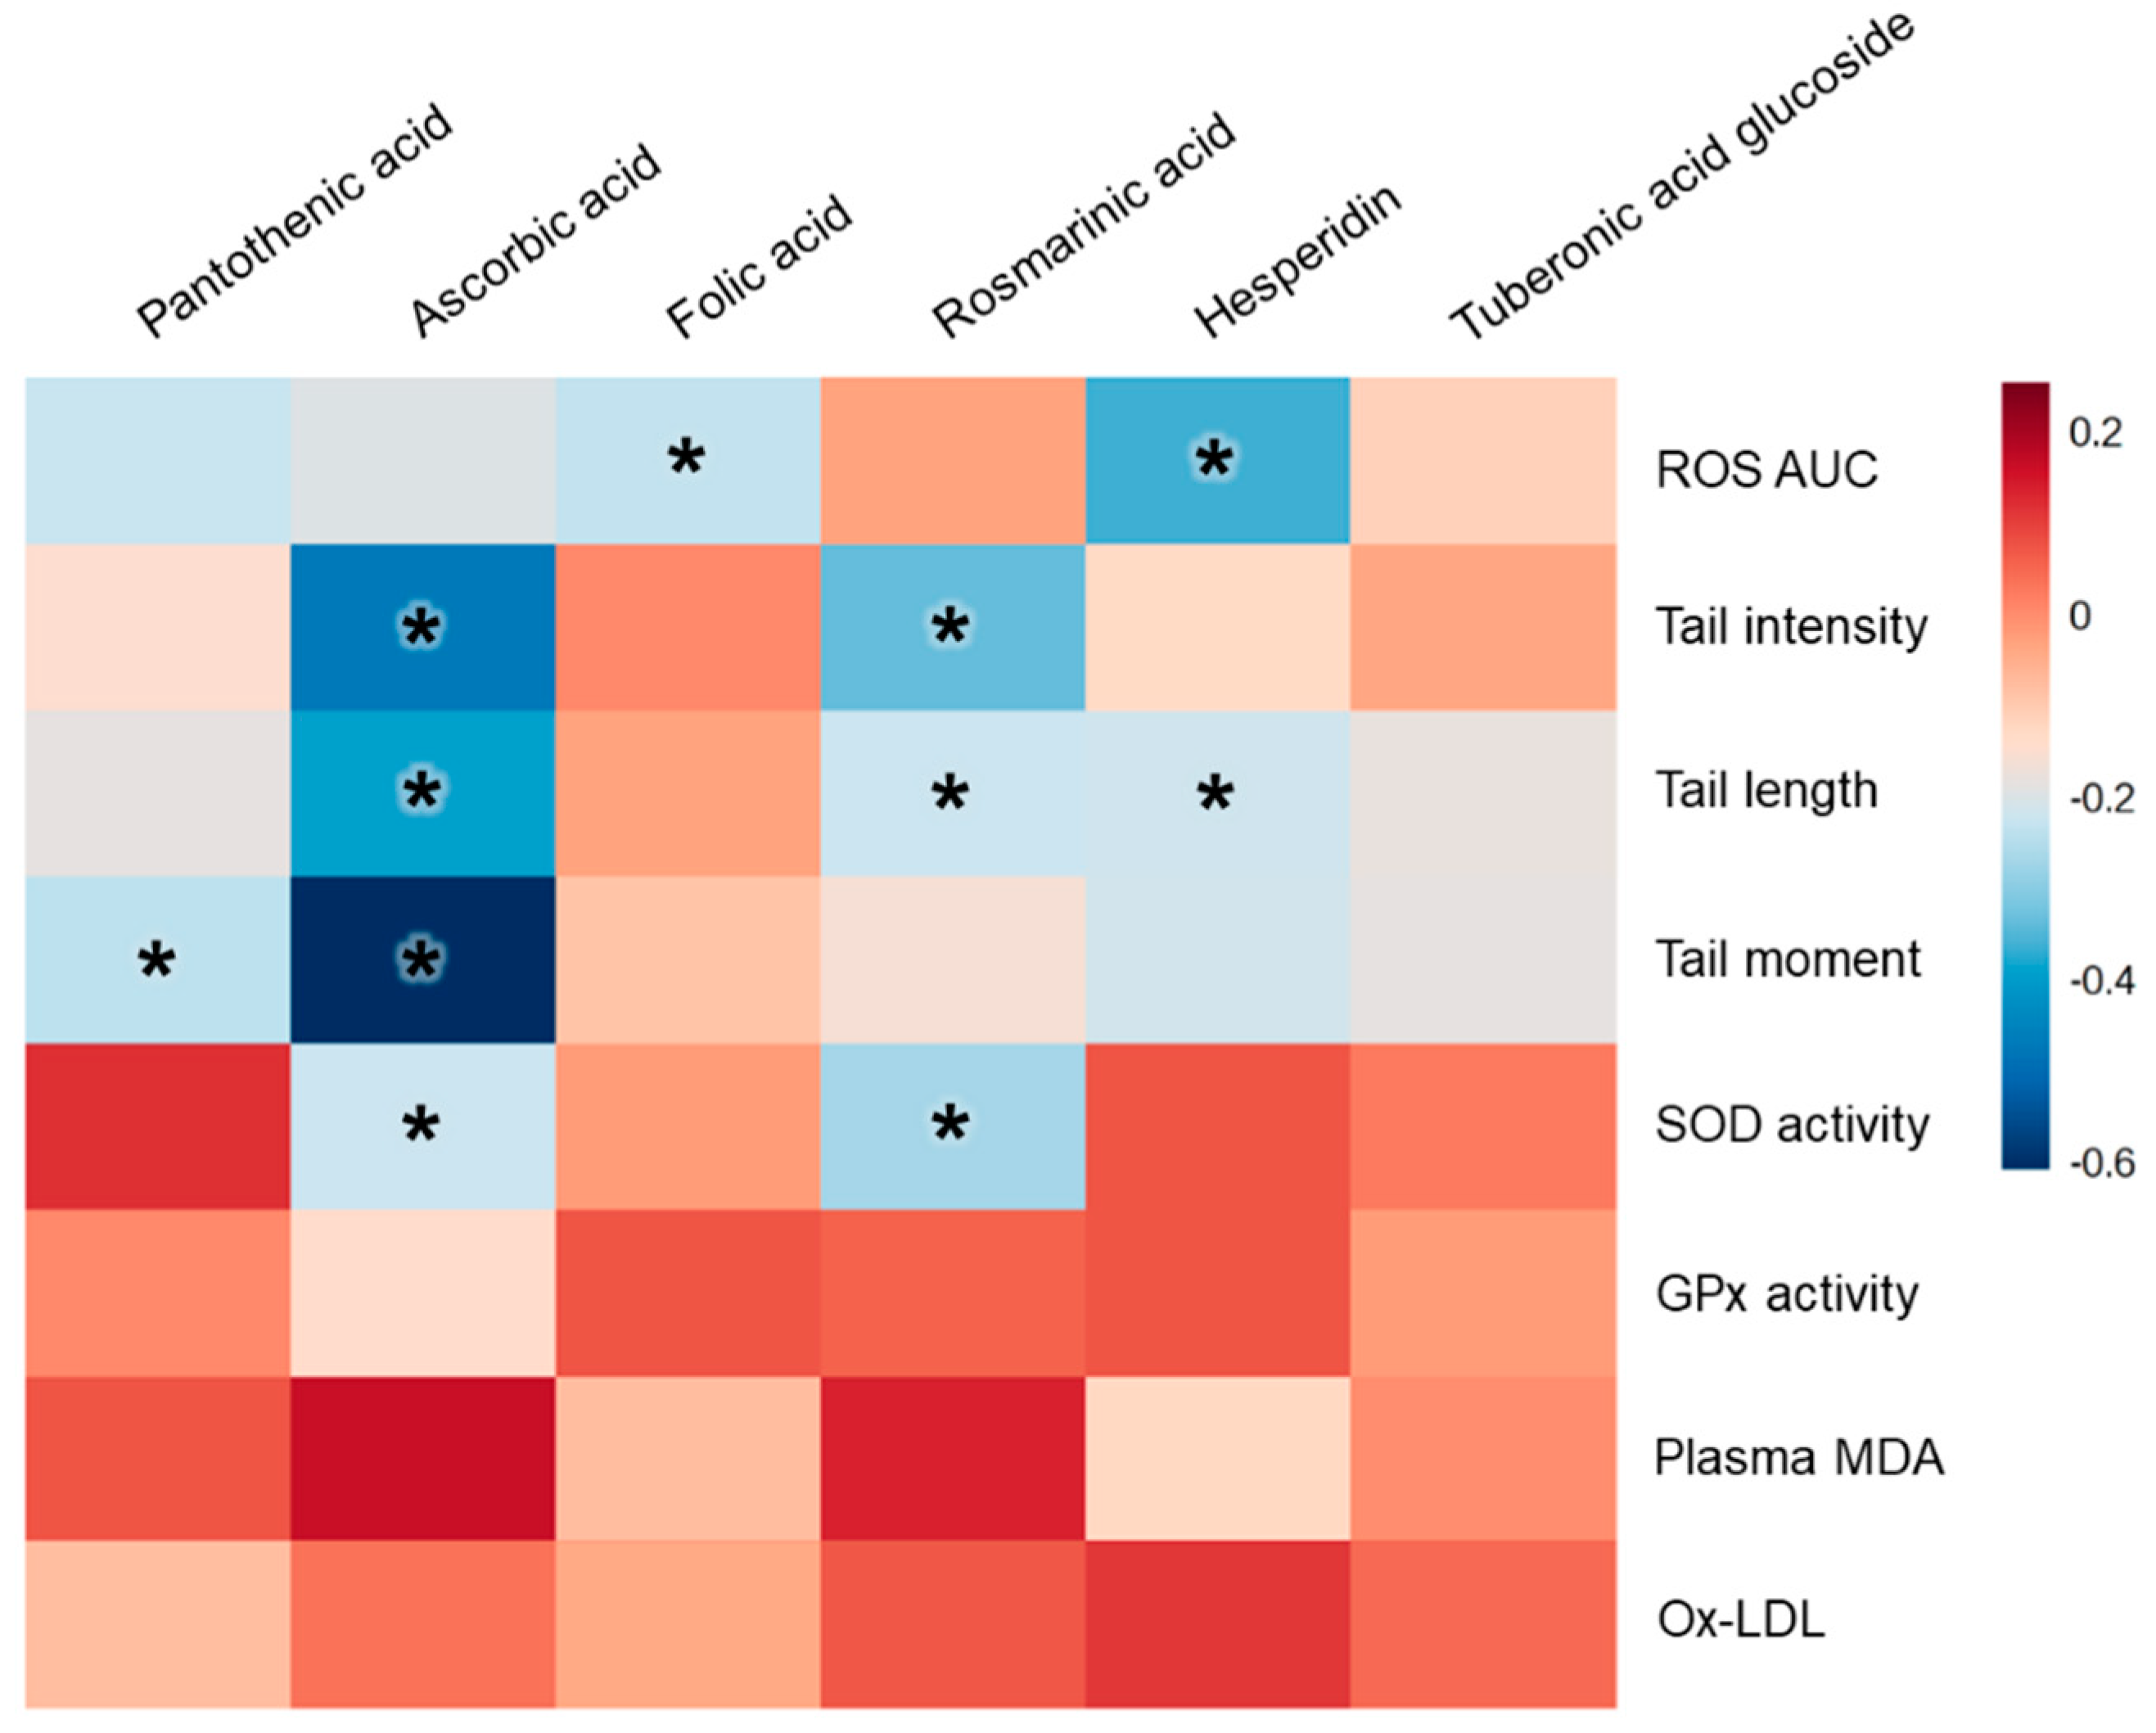
| Pantothenic Acid | Ascorbic Acid | Folic Acid | Rosmarinic Acid | Hesperidin | Tuberonic Acid Glucoside | |||||||
|---|---|---|---|---|---|---|---|---|---|---|---|---|
| r | p2 | r | p | r | p | r | p | r | p | r | p | |
| ROS AUC | −0.227 | 0.0549 | −0.194 | 0.1022 | −0.233 | 0.0485 | −0.029 | 0.8070 | −0.365 | 0.0016 | −0.113 | 0.3431 |
| Tail intensity | −0.148 | 0.1969 | −0.471 | <0.0001 | 0.006 | 0.9618 | −0.338 | 0.0025 | −0.127 | 0.2680 | −0.038 | 0.7397 |
| Tail length | −0.187 | 0.0921 | −0.390 | 0.0003 | −0.032 | 0.7777 | −0.221 | 0.0464 | −0.217 | 0.0497 | −0.178 | 0.1100 |
| Tail moment | −0.238 | 0.0367 | −0.608 | <0.0001 | −0.087 | 0.4529 | −0.158 | 0.1713 | −0.211 | 0.0659 | −0.186 | 0.1061 |
| SOD activity | 0.121 | 0.2730 | −0.222 | 0.0420 | −0.019 | 0.8667 | −0.268 | 0.0139 | 0.073 | 0.5088 | 0.026 | 0.8170 |
| GPx activity | 0.008 | 0.9417 | −0.138 | 0.2109 | 0.074 | 0.5013 | 0.058 | 0.6020 | 0.073 | 0.5081 | −0.021 | 0.8484 |
| Plasma MDA | 0.075 | 0.4964 | 0.165 | 0.1329 | −0.073 | 0.5102 | 0.138 | 0.2118 | −0.125 | 0.2578 | −0.001 | 0.9919 |
| Ox-LDL | −0.078 | 0.4786 | 0.036 | 0.7422 | −0.039 | 0.7261 | 0.069 | 0.5358 | 0.111 | 0.3150 | 0.046 | 0.6794 |
© 2019 by the authors. Licensee MDPI, Basel, Switzerland. This article is an open access article distributed under the terms and conditions of the Creative Commons Attribution (CC BY) license (http://creativecommons.org/licenses/by/4.0/).
Share and Cite
Kang, S.; Lim, Y.; Kim, Y.J.; Jung, E.S.; Suh, D.H.; Lee, C.H.; Park, E.; Hong, J.; Velliquette, R.A.; Kwon, O.; et al. Multivitamin and Mineral Supplementation Containing Phytonutrients Scavenges Reactive Oxygen Species in Healthy Subjects: A Randomized, Double-Blinded, Placebo-Controlled Trial. Nutrients 2019, 11, 101. https://doi.org/10.3390/nu11010101
Kang S, Lim Y, Kim YJ, Jung ES, Suh DH, Lee CH, Park E, Hong J, Velliquette RA, Kwon O, et al. Multivitamin and Mineral Supplementation Containing Phytonutrients Scavenges Reactive Oxygen Species in Healthy Subjects: A Randomized, Double-Blinded, Placebo-Controlled Trial. Nutrients. 2019; 11(1):101. https://doi.org/10.3390/nu11010101
Chicago/Turabian StyleKang, Seunghee, Yeni Lim, You Jin Kim, Eun Sung Jung, Dong Ho Suh, Choong Hwan Lee, Eunmi Park, Jina Hong, Rodney A. Velliquette, Oran Kwon, and et al. 2019. "Multivitamin and Mineral Supplementation Containing Phytonutrients Scavenges Reactive Oxygen Species in Healthy Subjects: A Randomized, Double-Blinded, Placebo-Controlled Trial" Nutrients 11, no. 1: 101. https://doi.org/10.3390/nu11010101