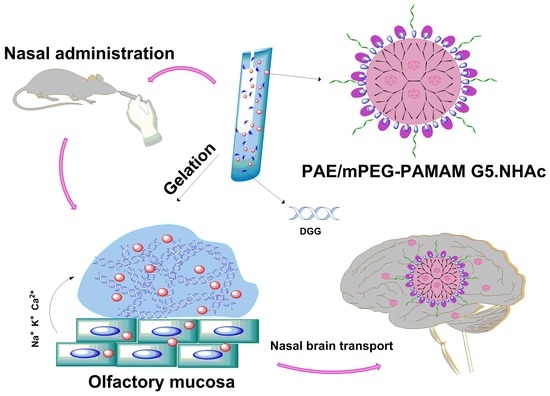
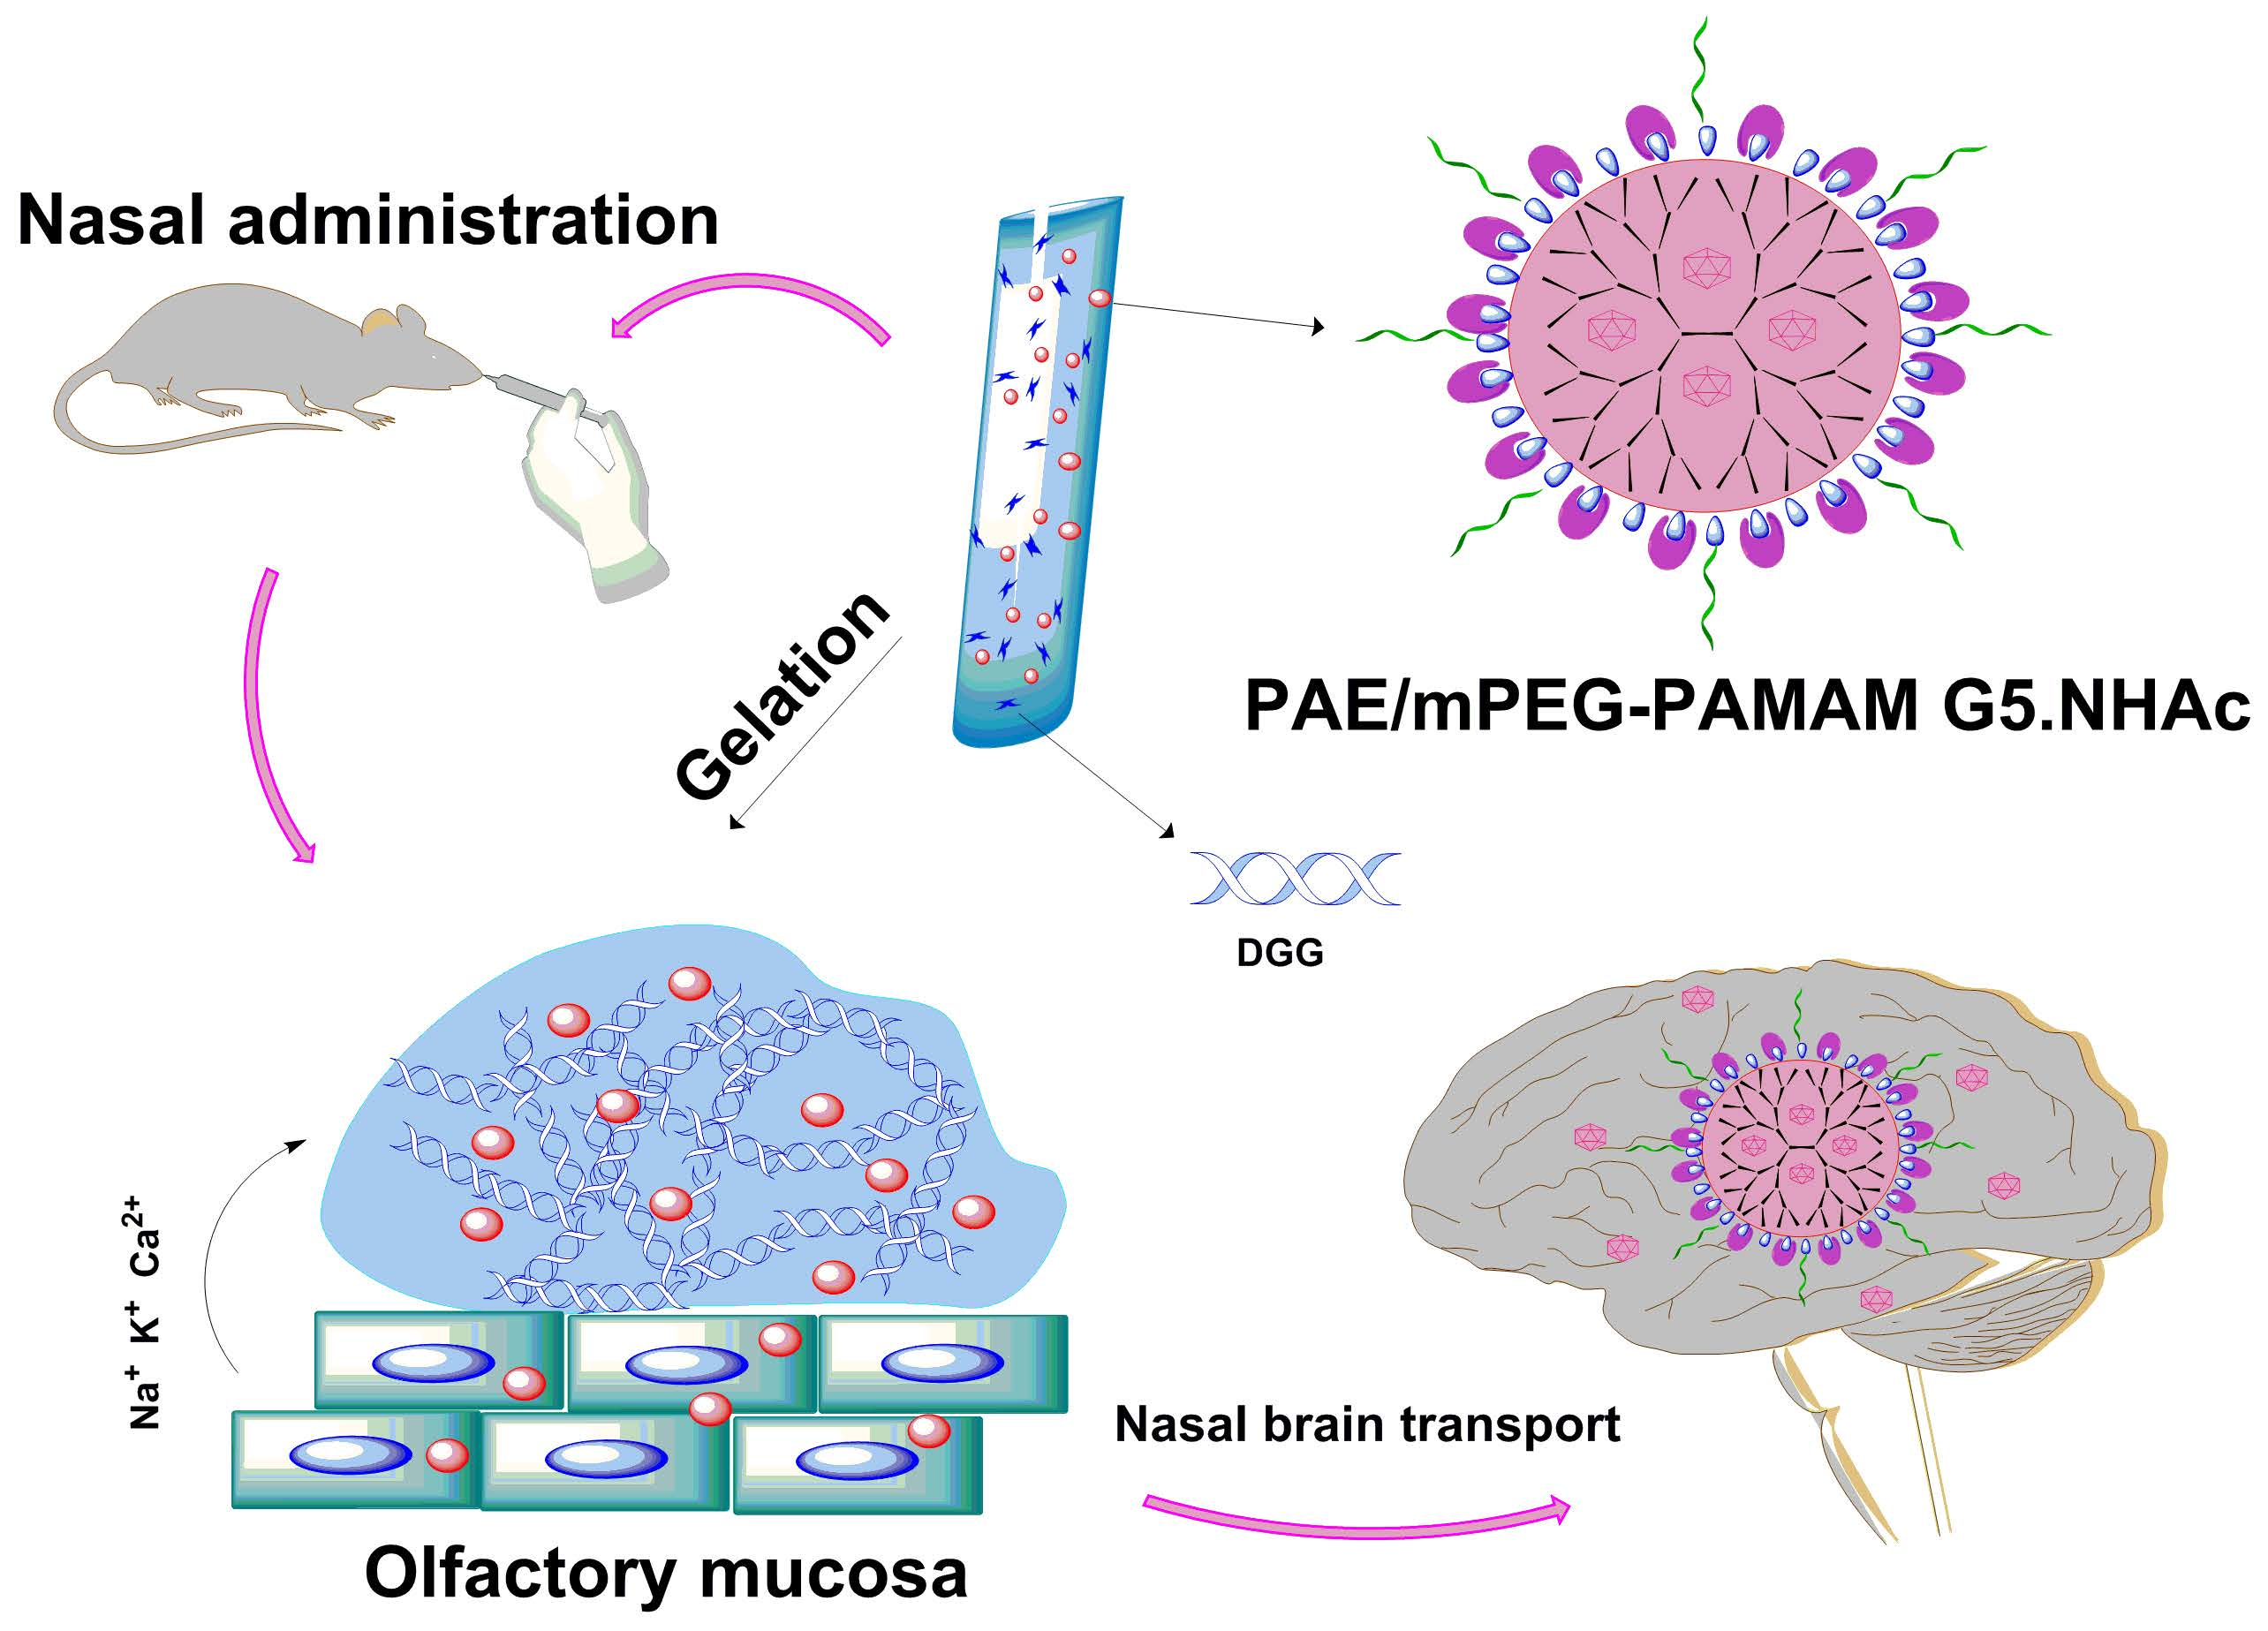
An Available Strategy for Nasal Brain Transport of Nanocomposite Based on PAMAM Dendrimers via In Situ Gel

 ,
,
Abstract
:
1. Introduction
2. Materials and Methods
2.1. Materials
2.2. Synthesis and Characterization of the PAMAM Dendrimer Nanocomposite
2.2.1. Synthesis of the PAMAM Dendrimer Nanocomposites
Synthesis of mPEG-PAMAM G5.NH2
Synthesis of mPEG-PAMAM G5.NHAc
Synthesis of mPEG-PAMAM G5.NH2-FITC
2.2.2. Encapsulation of Paeonol into mPEG-PAMAM G5.NHAc
Preparation of PAE/mPEG-PAMAM G5.NHAc
Drug Loading Efficiency and Encapsulation Efficiency
2.2.3. Characterization of PAMAM Dendrimer Nanocomposites
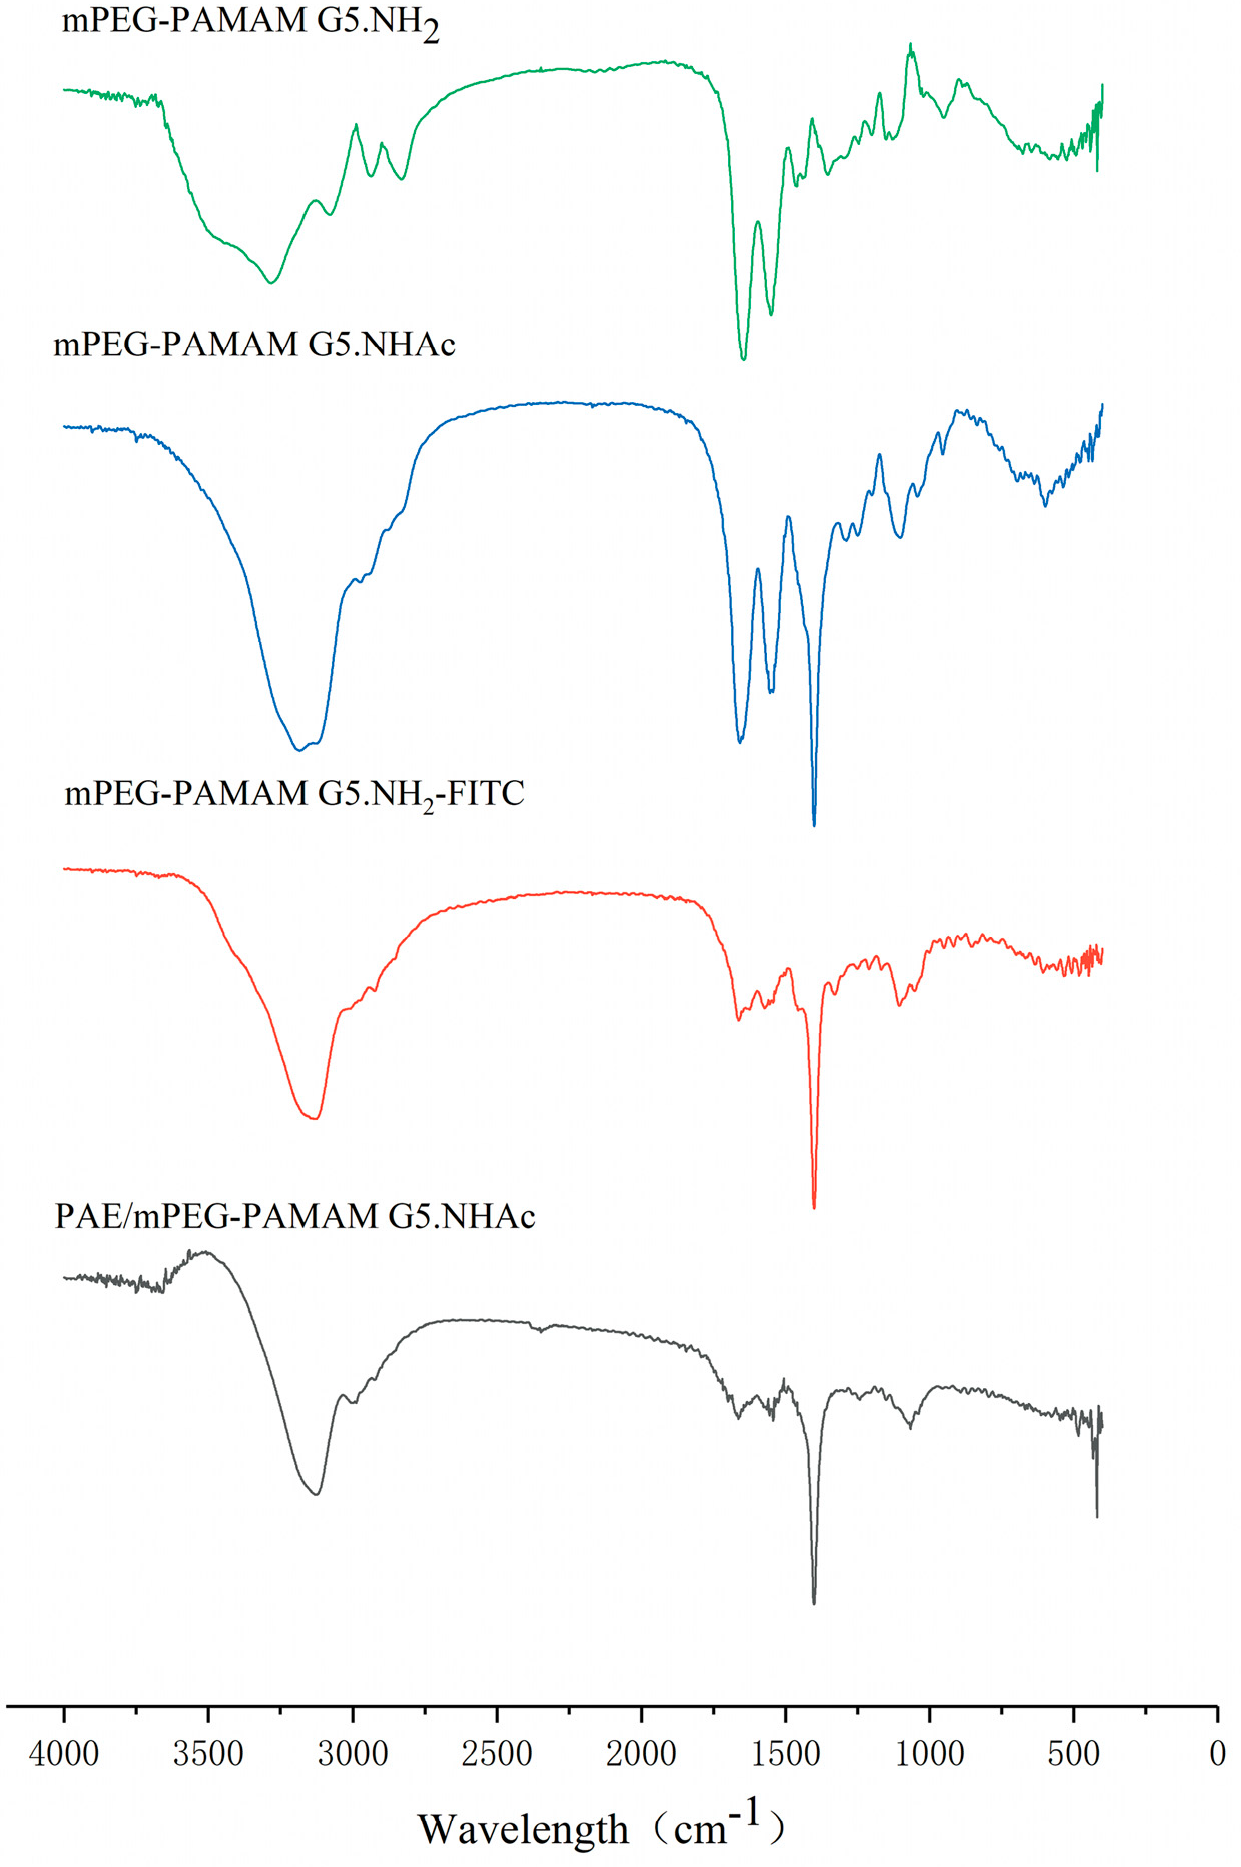
FTIR
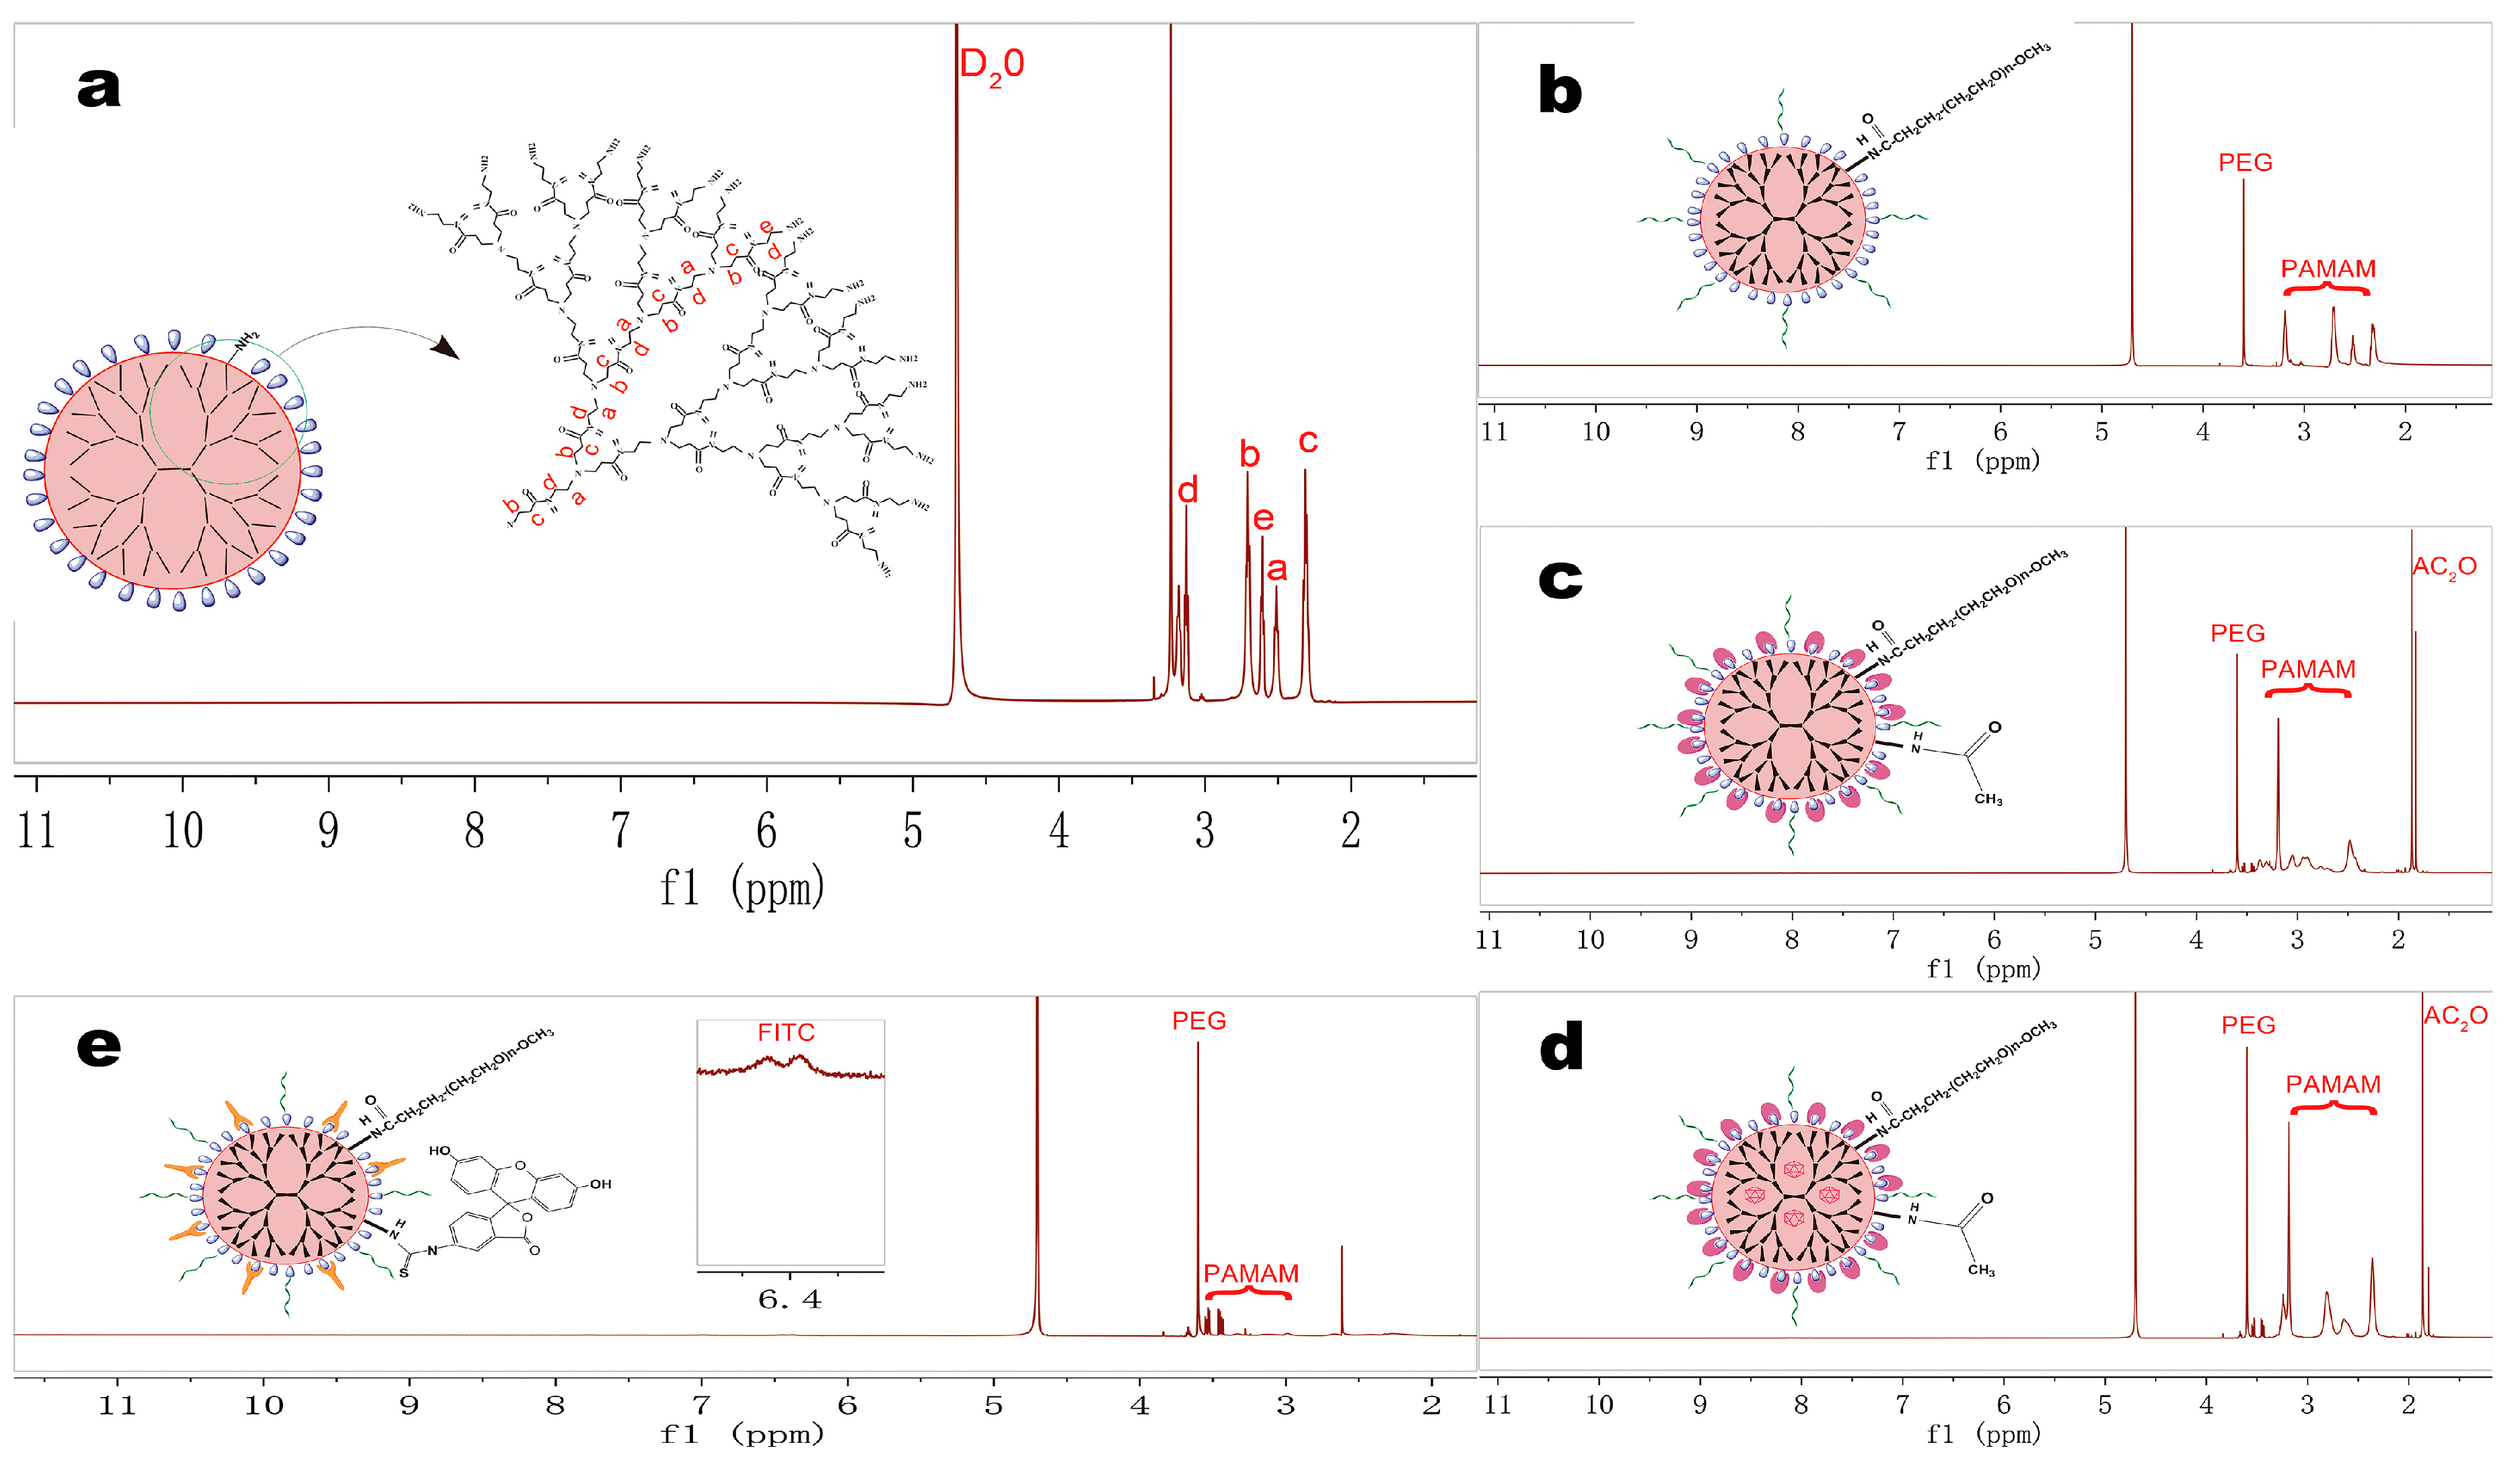
1H-NMR
Particle Size and Zeta Potential
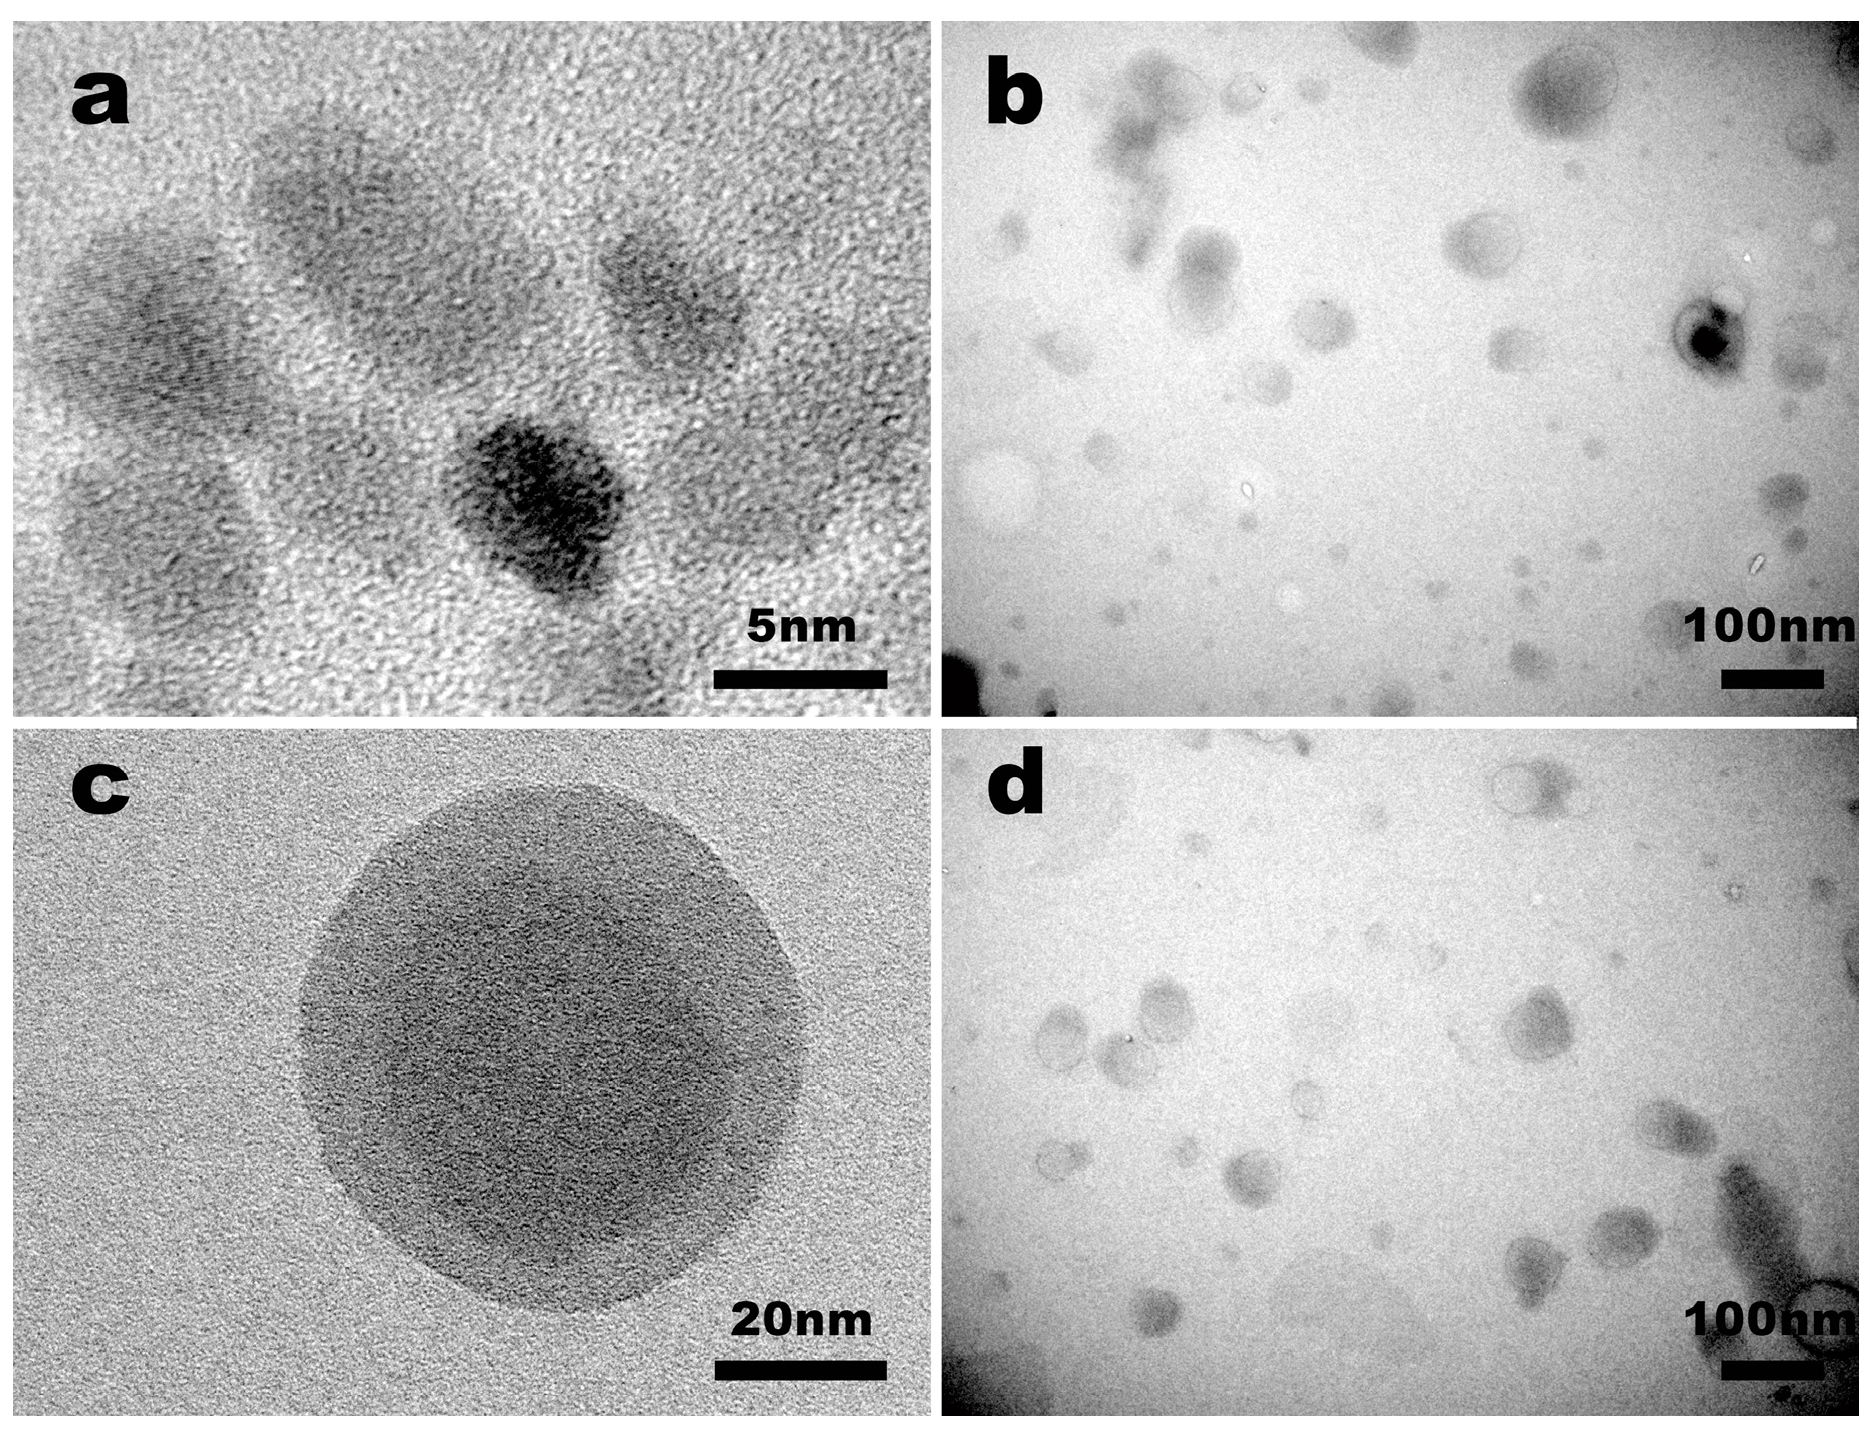
Transmission Electron Microscope (TEM) and Scanning Electron Microscope (SEM)
2.3. Preparation and Characterization of In Situ Gel
2.3.1. Preparation of In Situ Gel
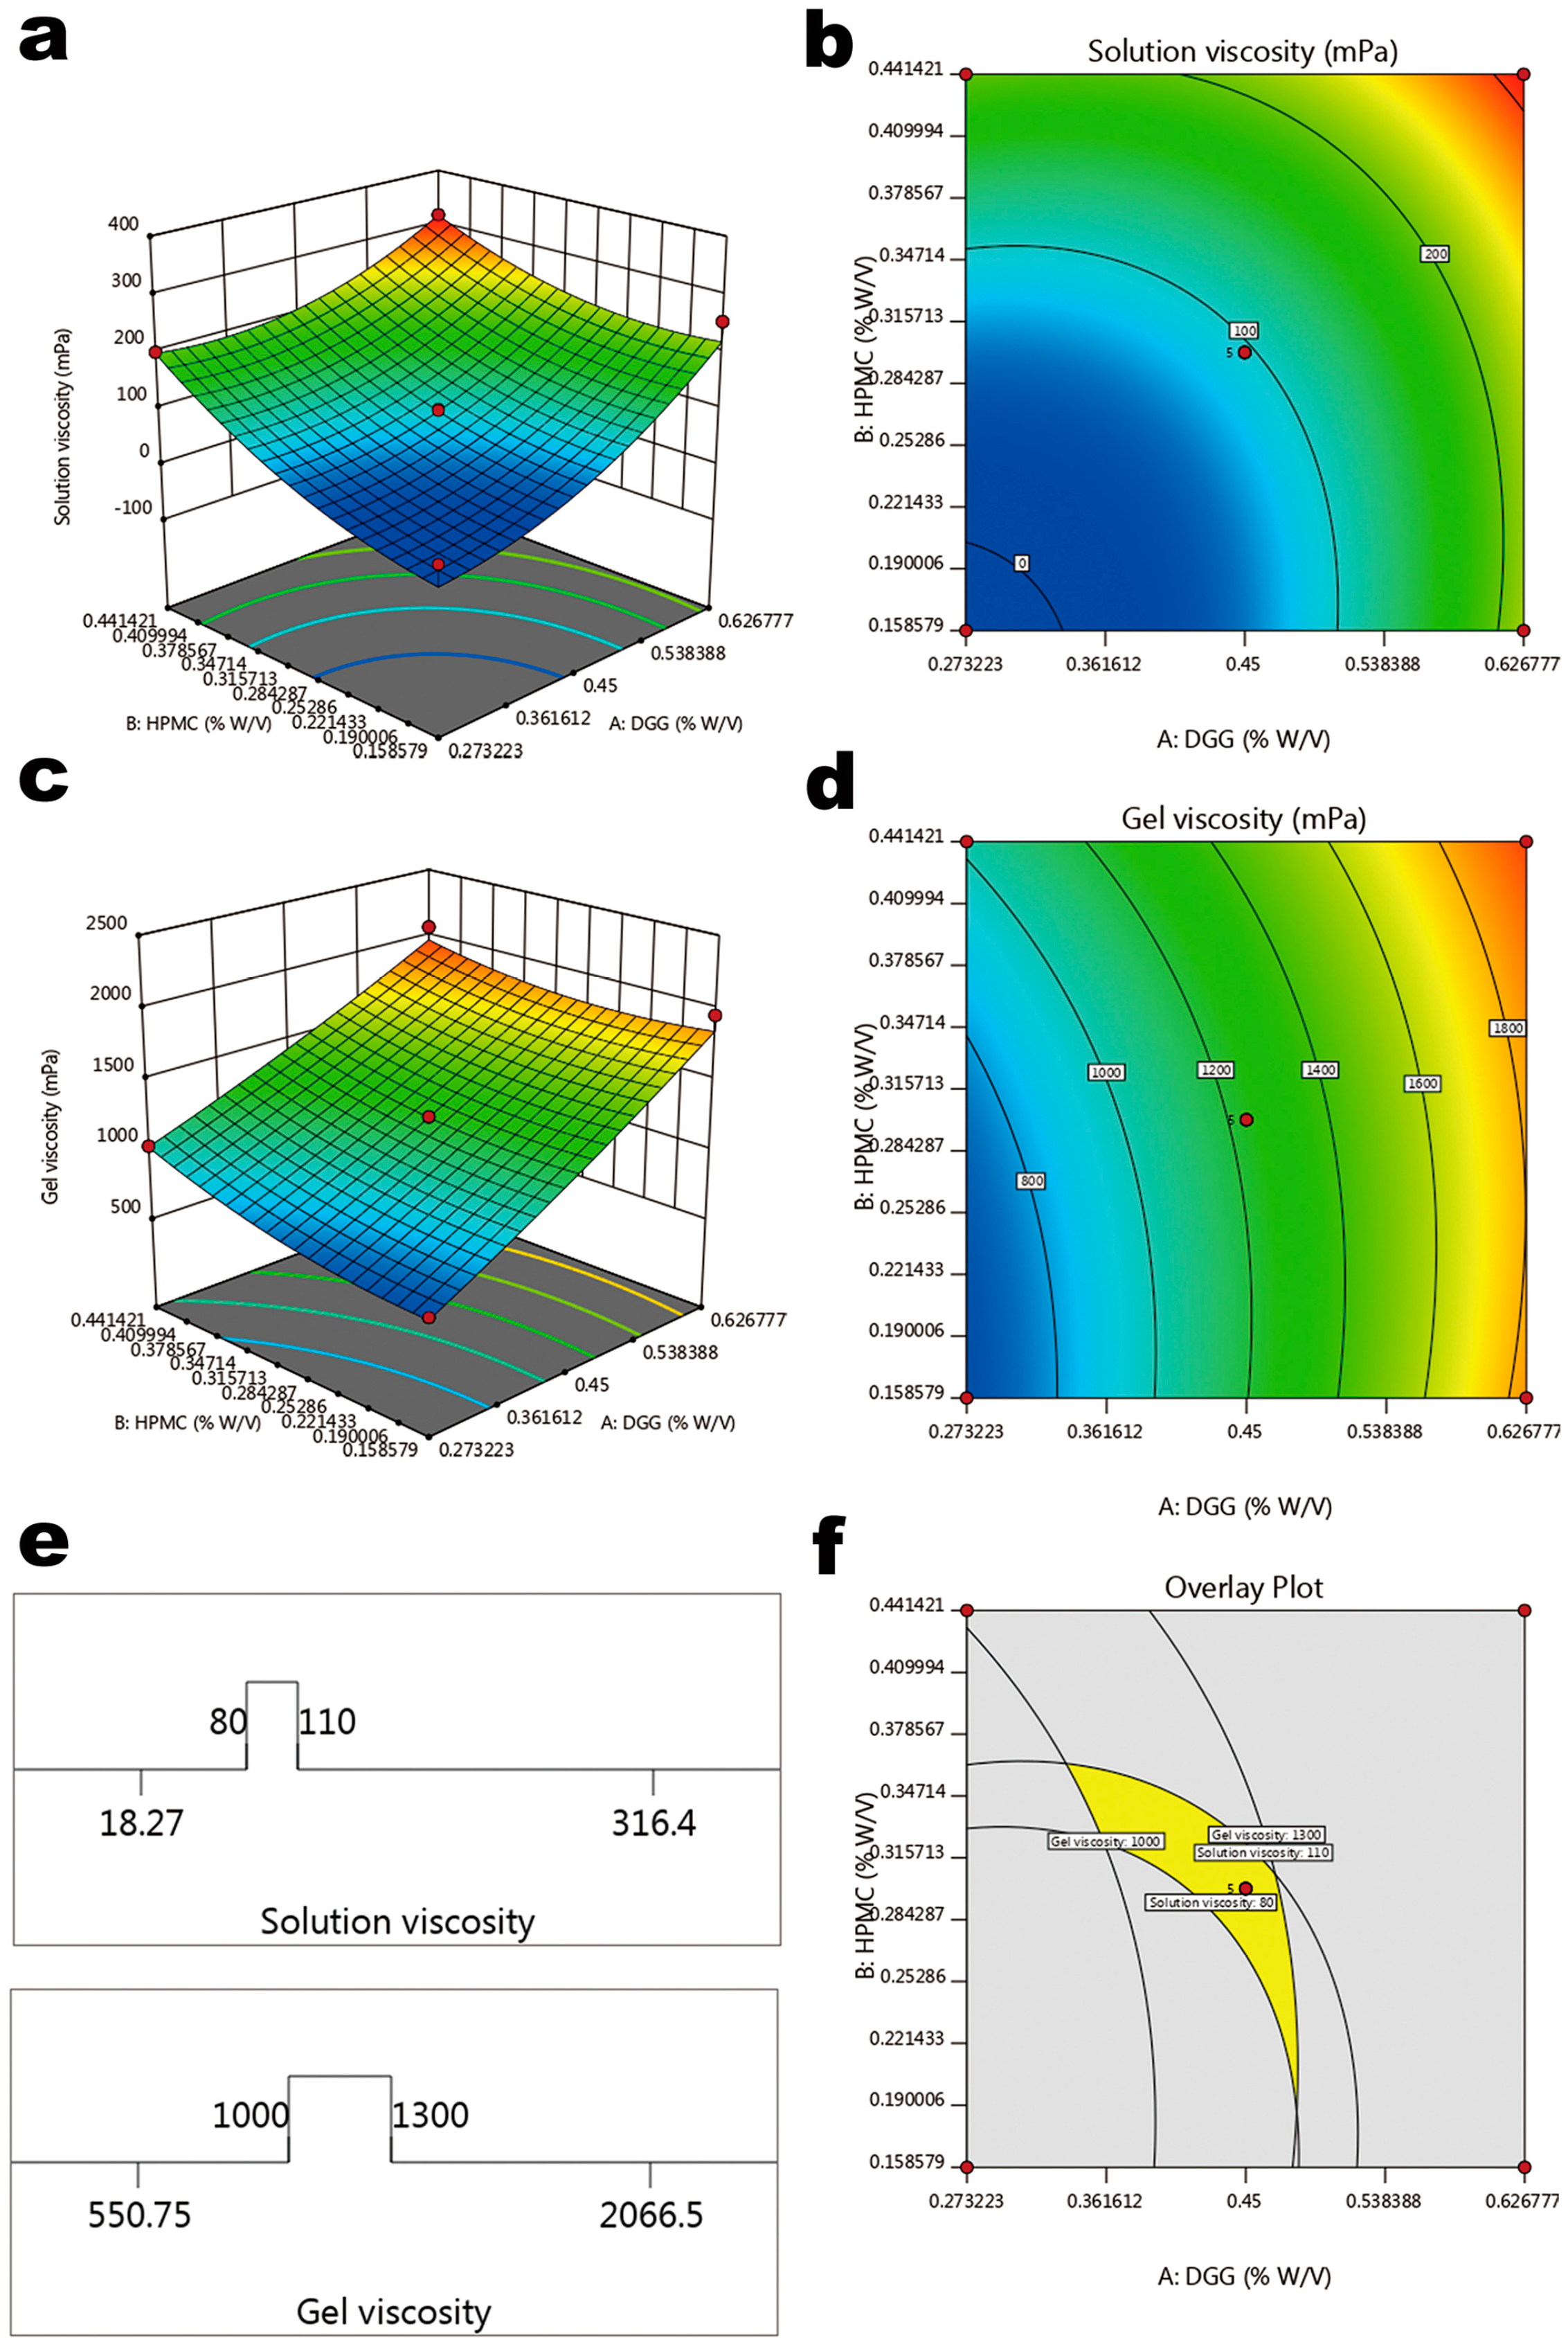
2.3.2. Response Surface Methodology
2.3.3. Characterization of In Situ Gel
Viscosity
Critical Ionic Concentration (CIC)
Gel Strength
Water Holding Capacity
Volume Expansion Coefficient
pH
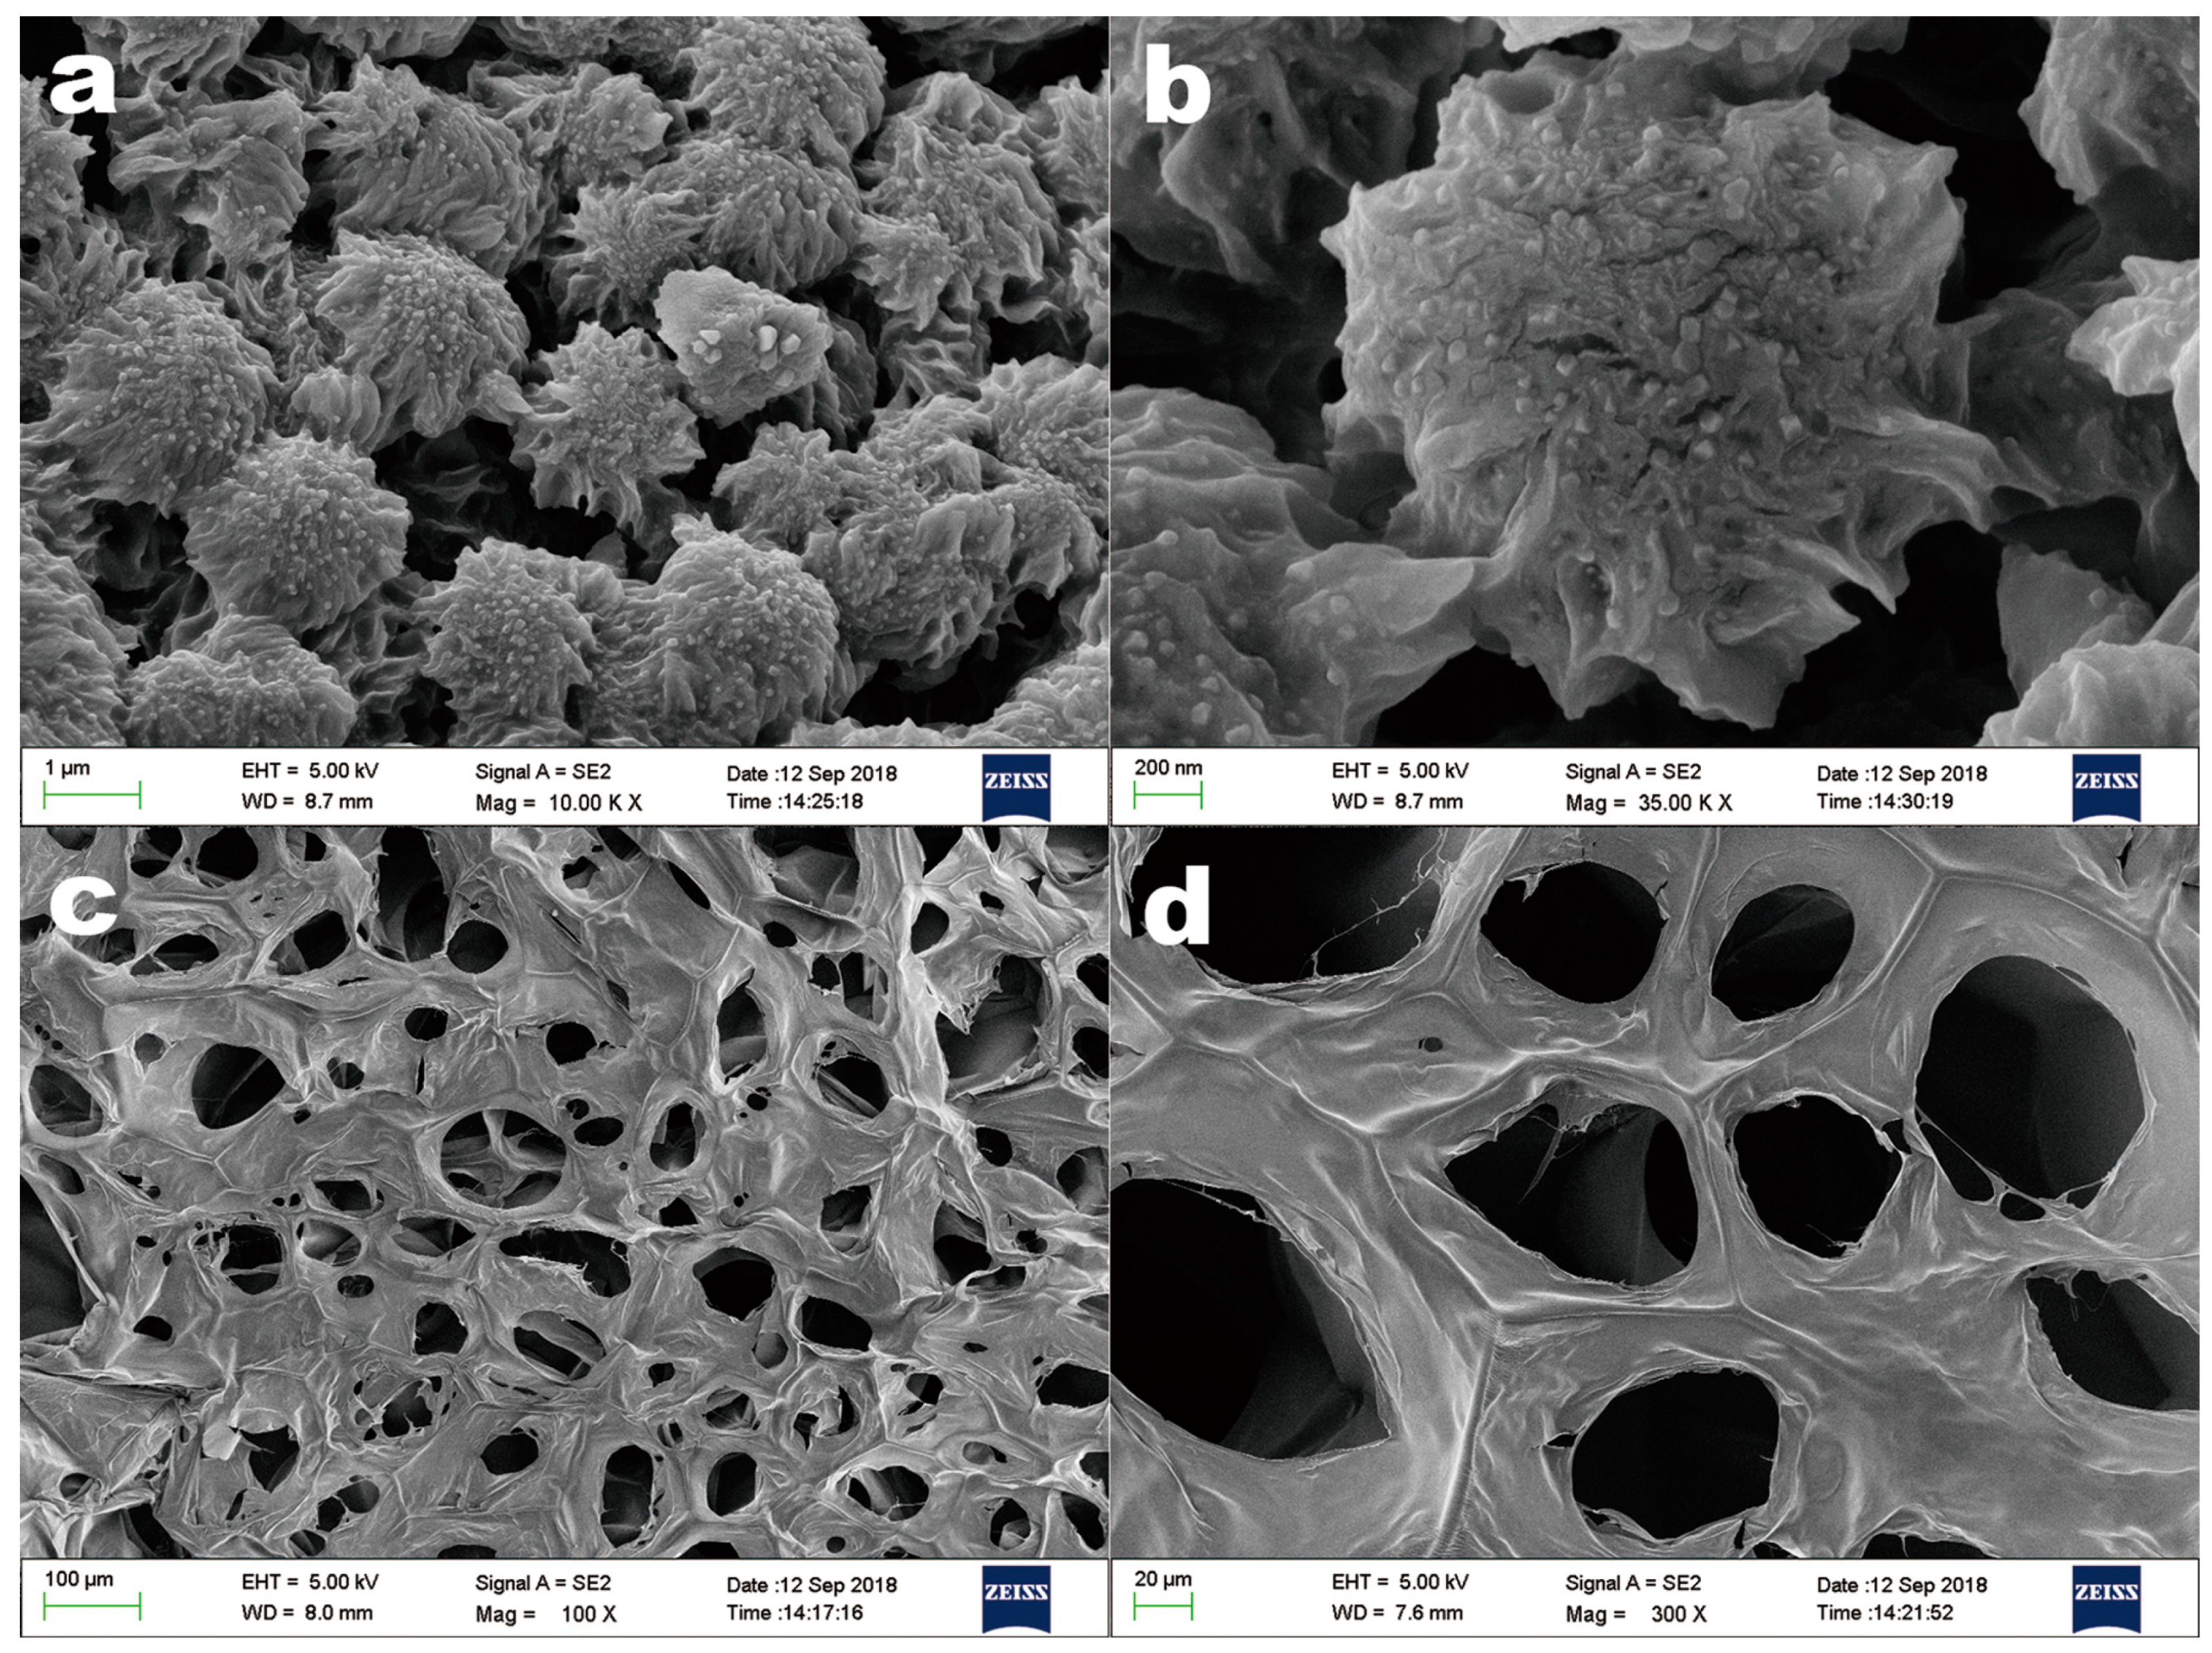
TEM and SEM
Rheology Analysis
Nasal Mucociliary Transport Time
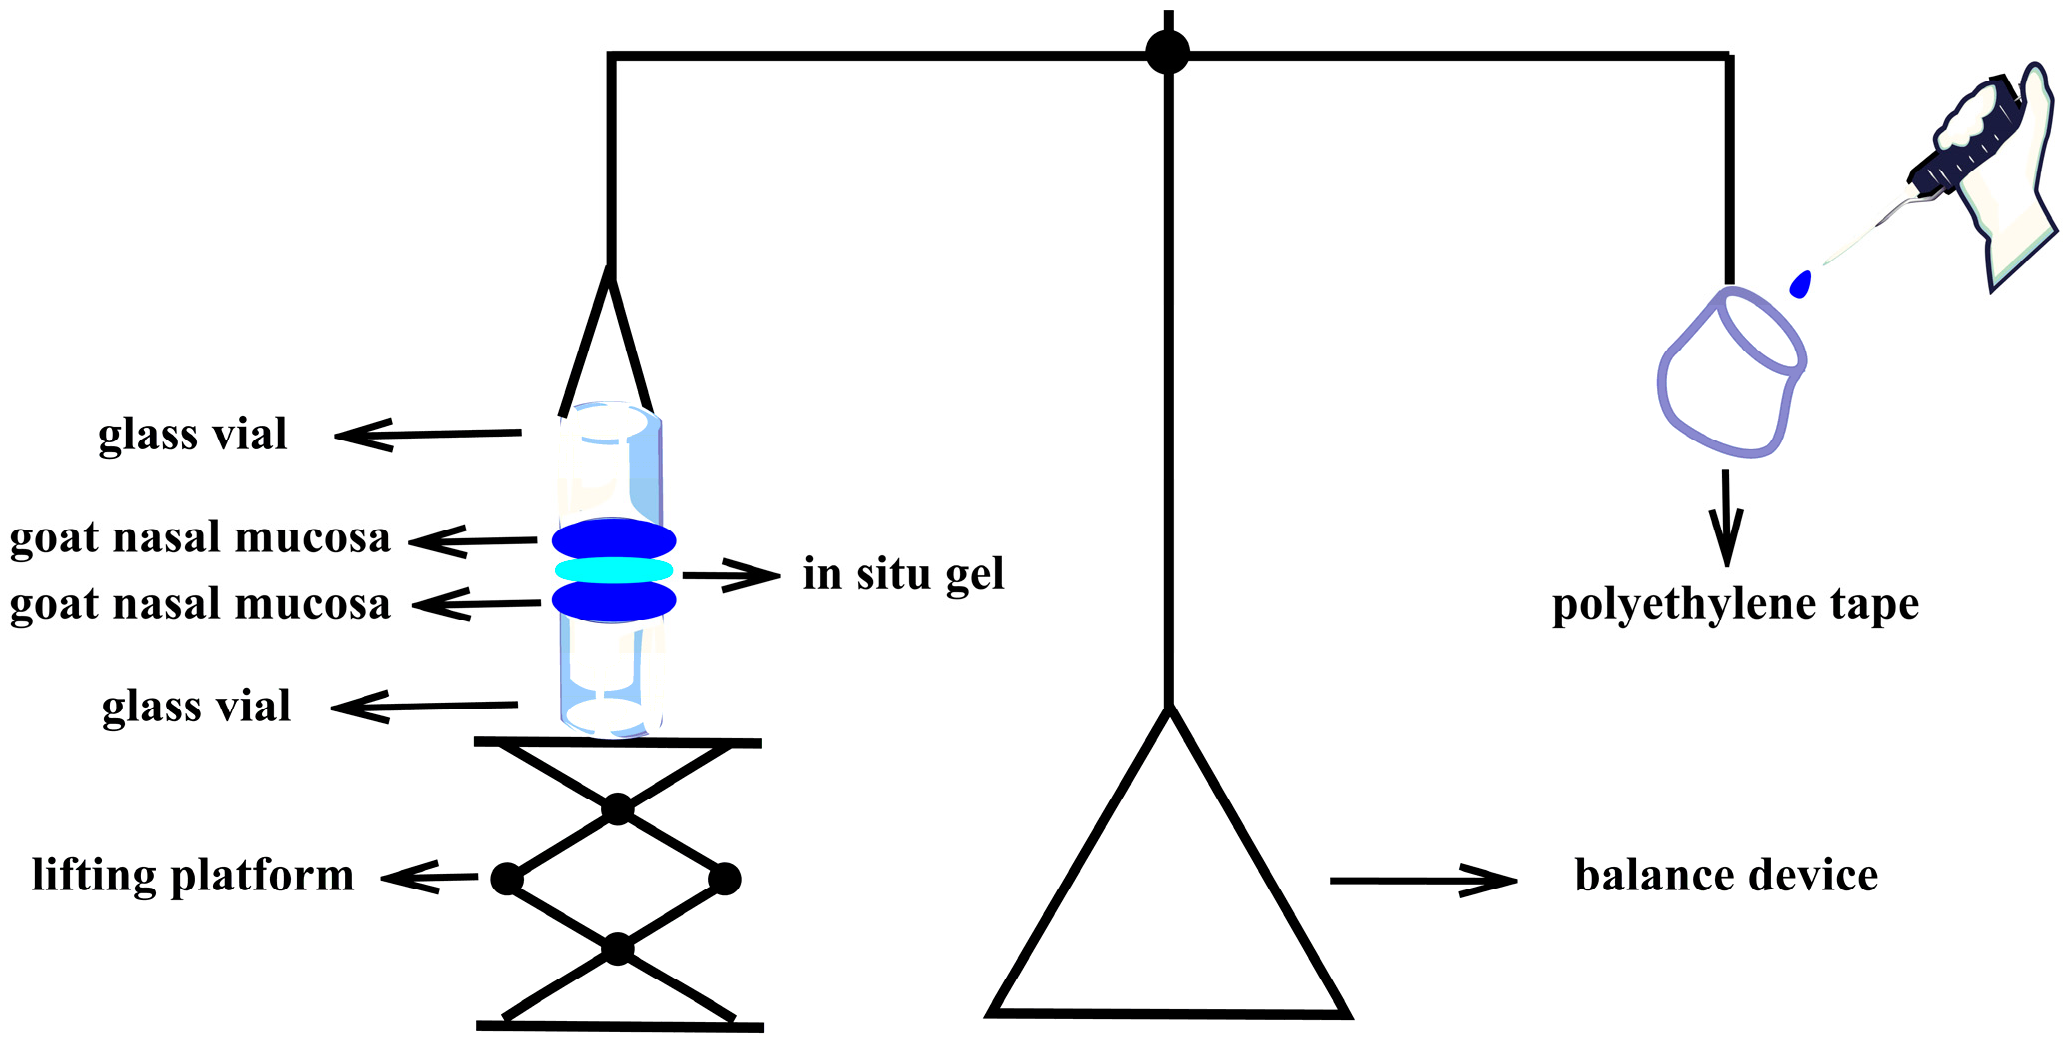
In Vitro Mucoadsorption Strength
2.4. In Vitro Release
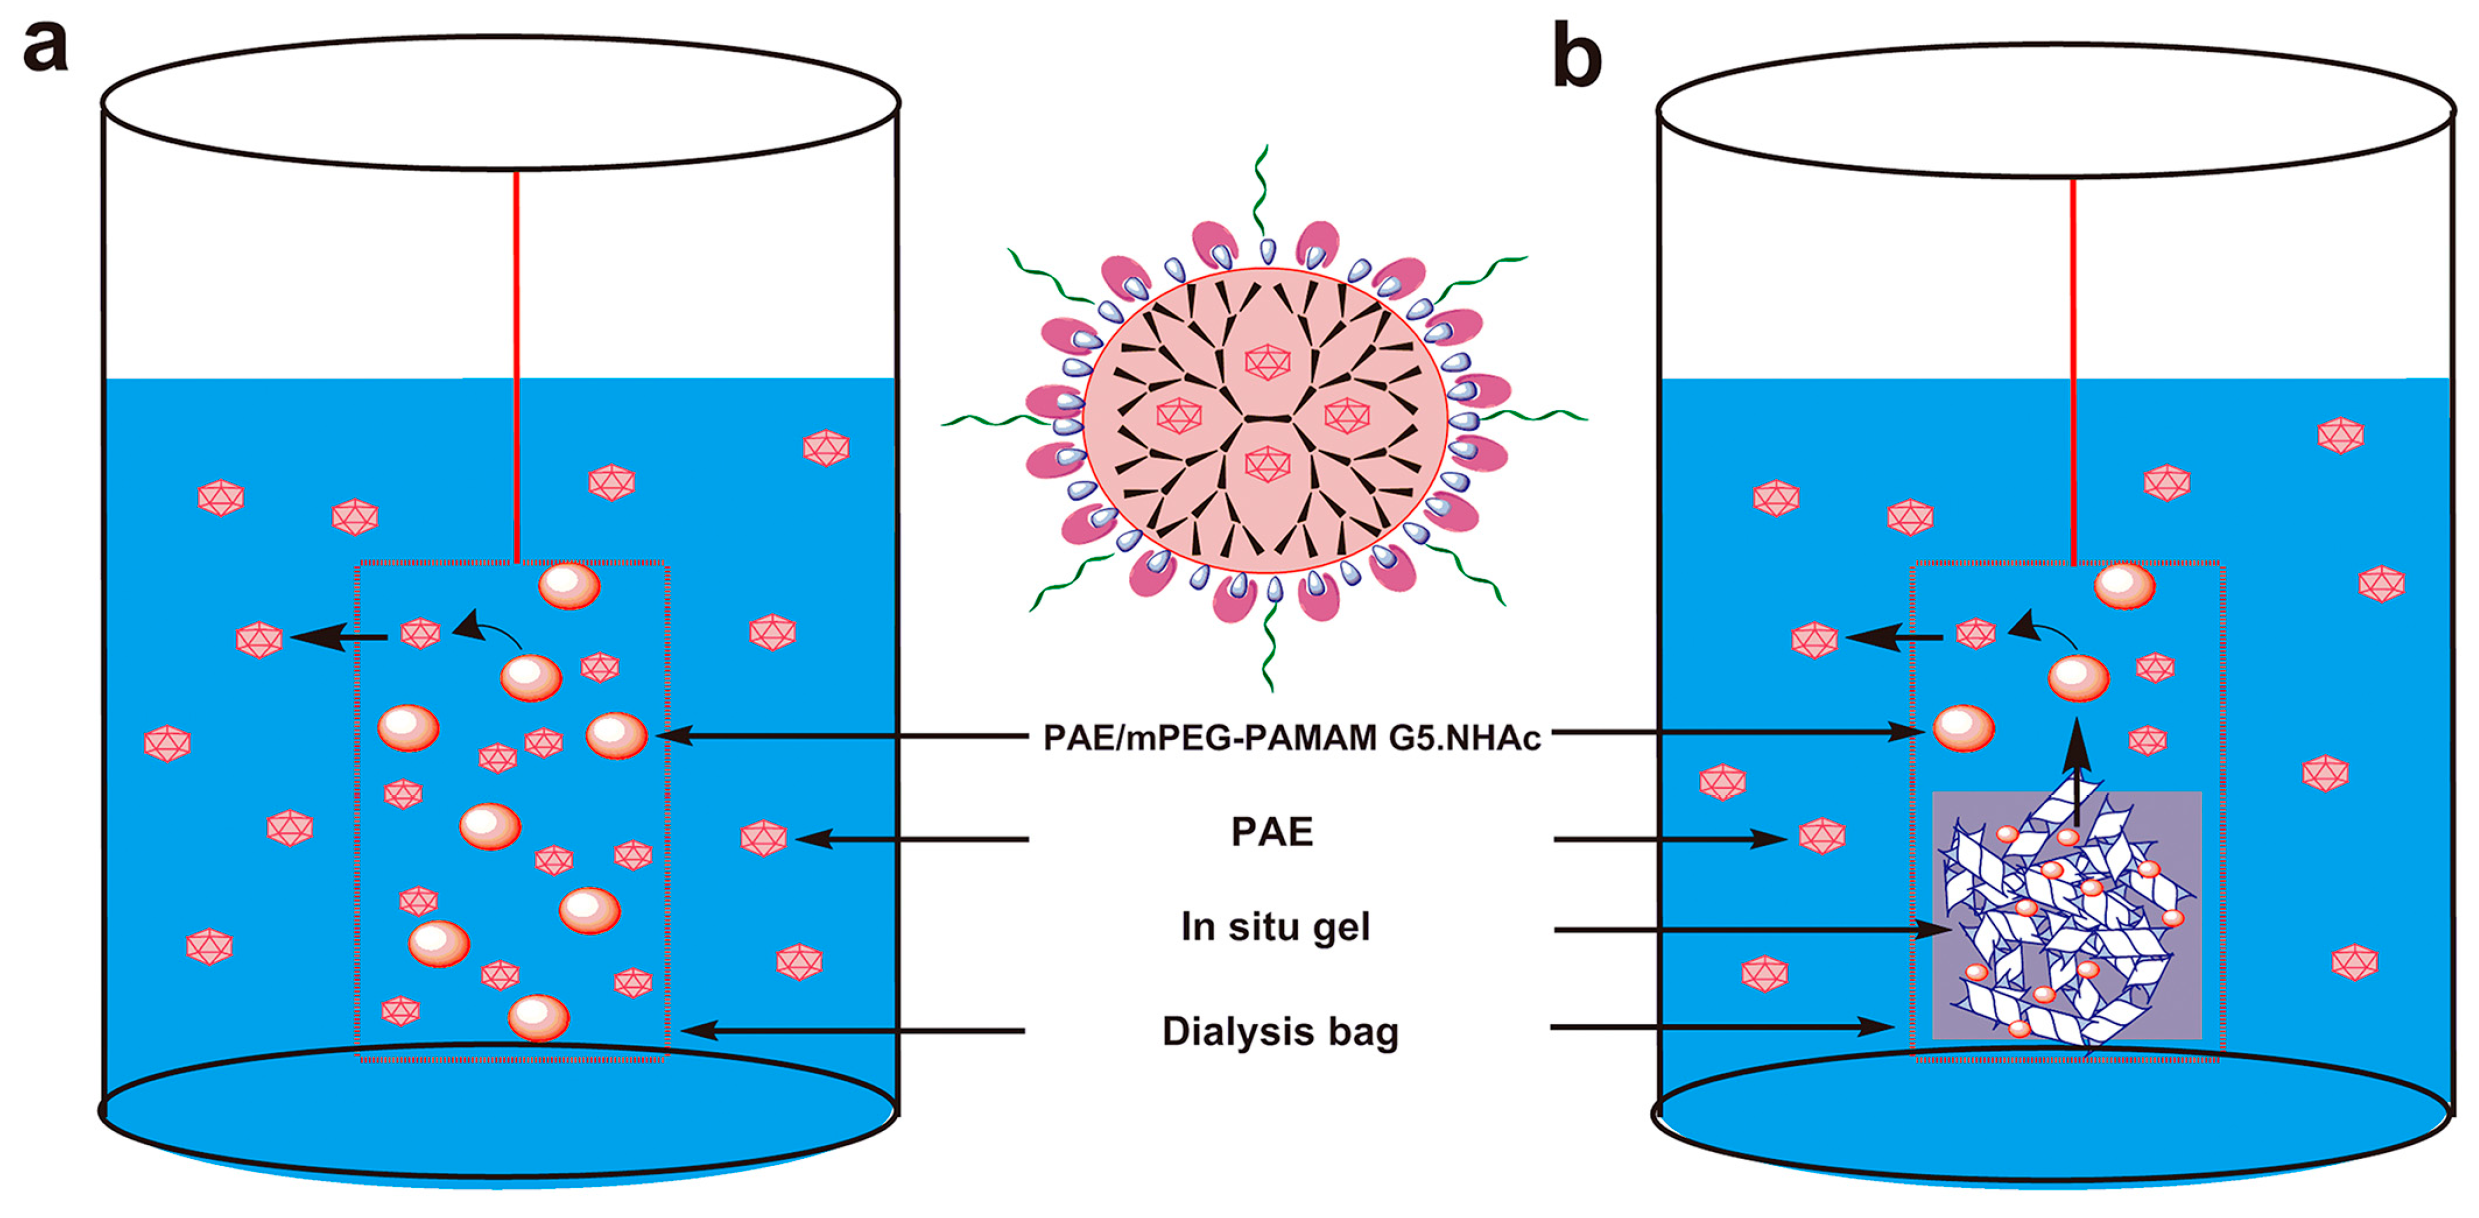
2.4.1. Release of PAE from PAE/mPEG-PAMAM G5.NHAc Nanocomposite
2.4.2. Release of PAE from PAE/mPEG-PAMAM G5.NHAc/DGG In Situ Gel
2.4.3. Release Kinetics
2.5. Cell Evaluation
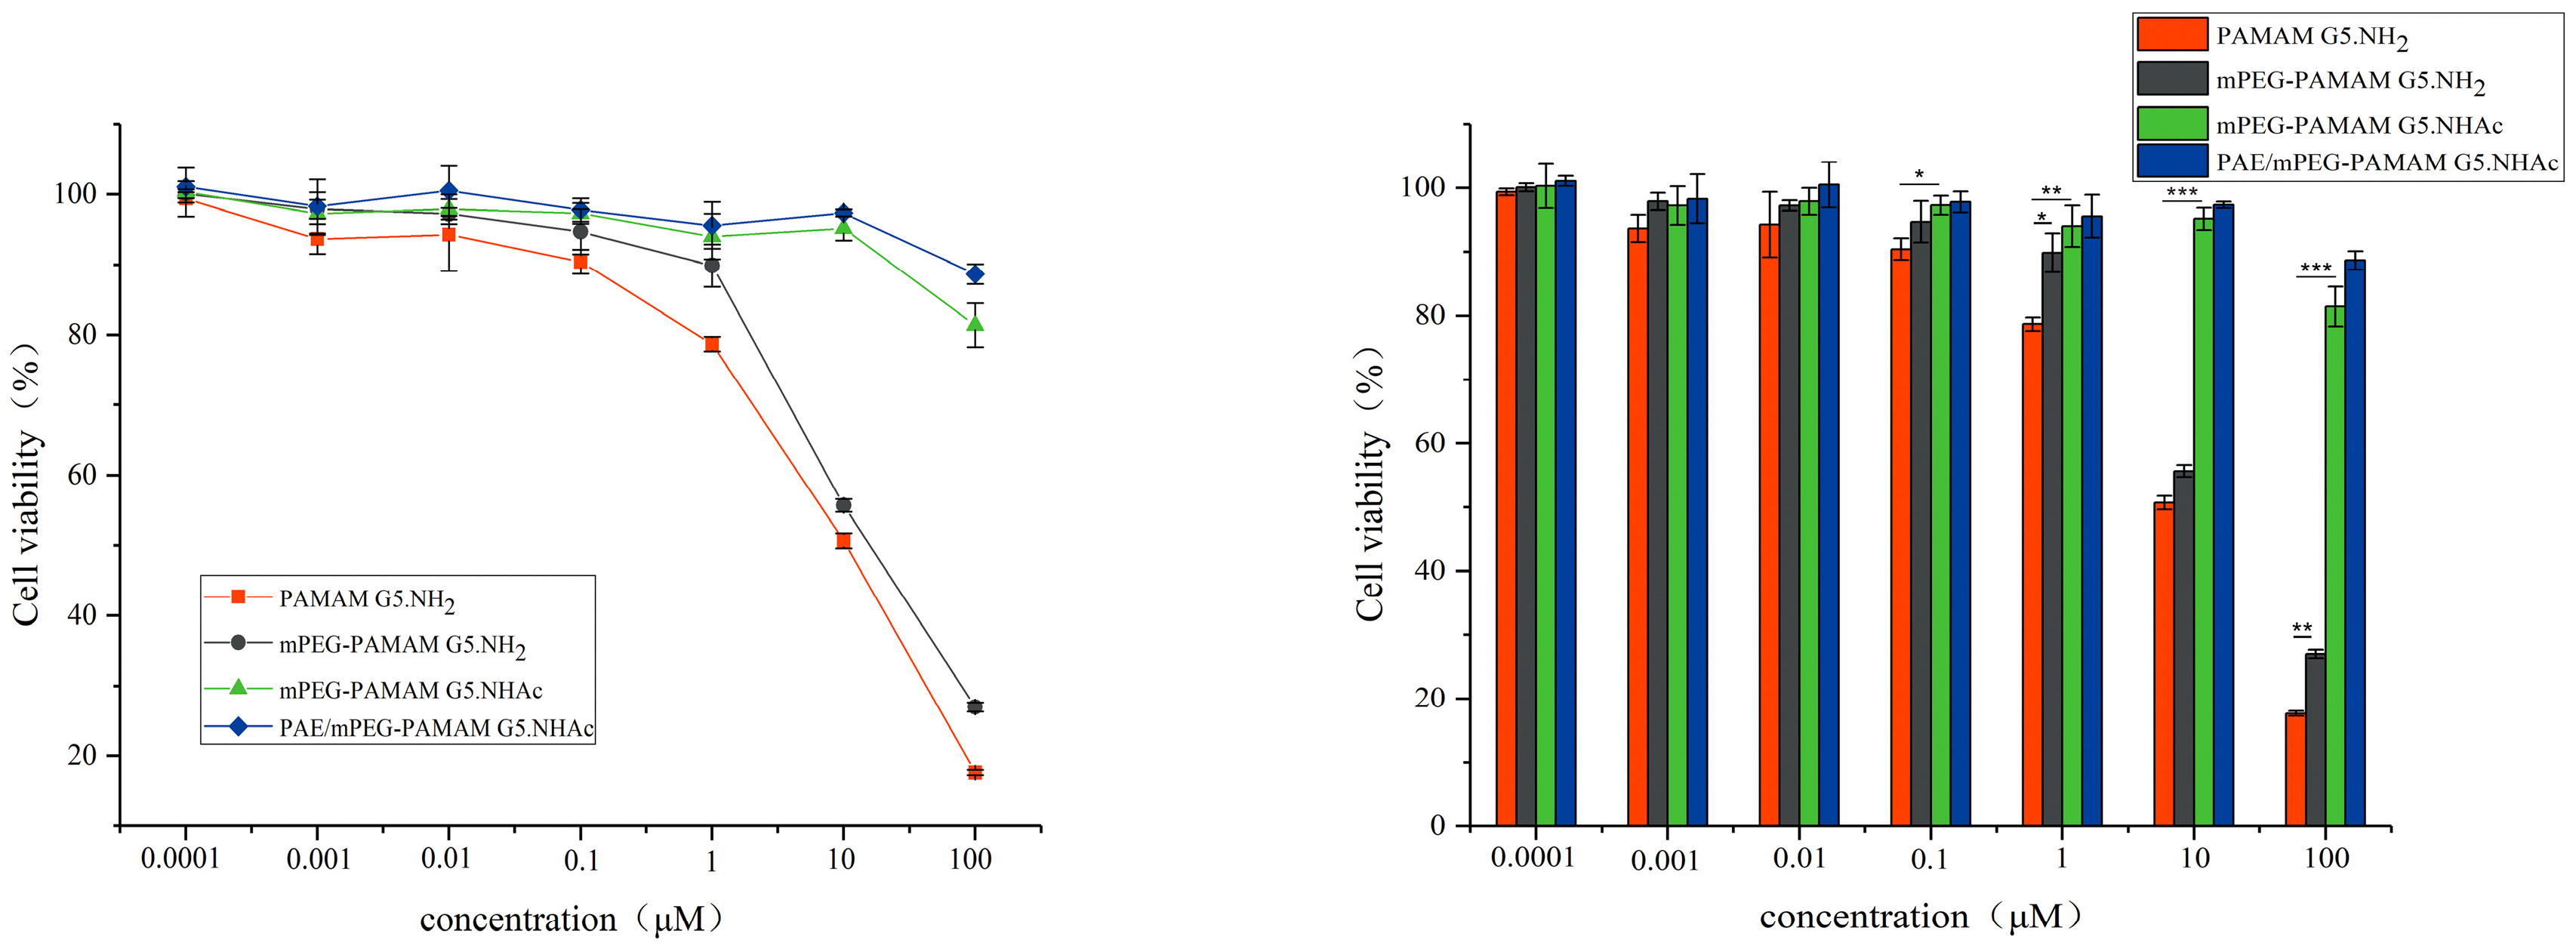
2.5.1. In Vitro Cytotoxicity of PAMAM Dendrimer Nanocomposites
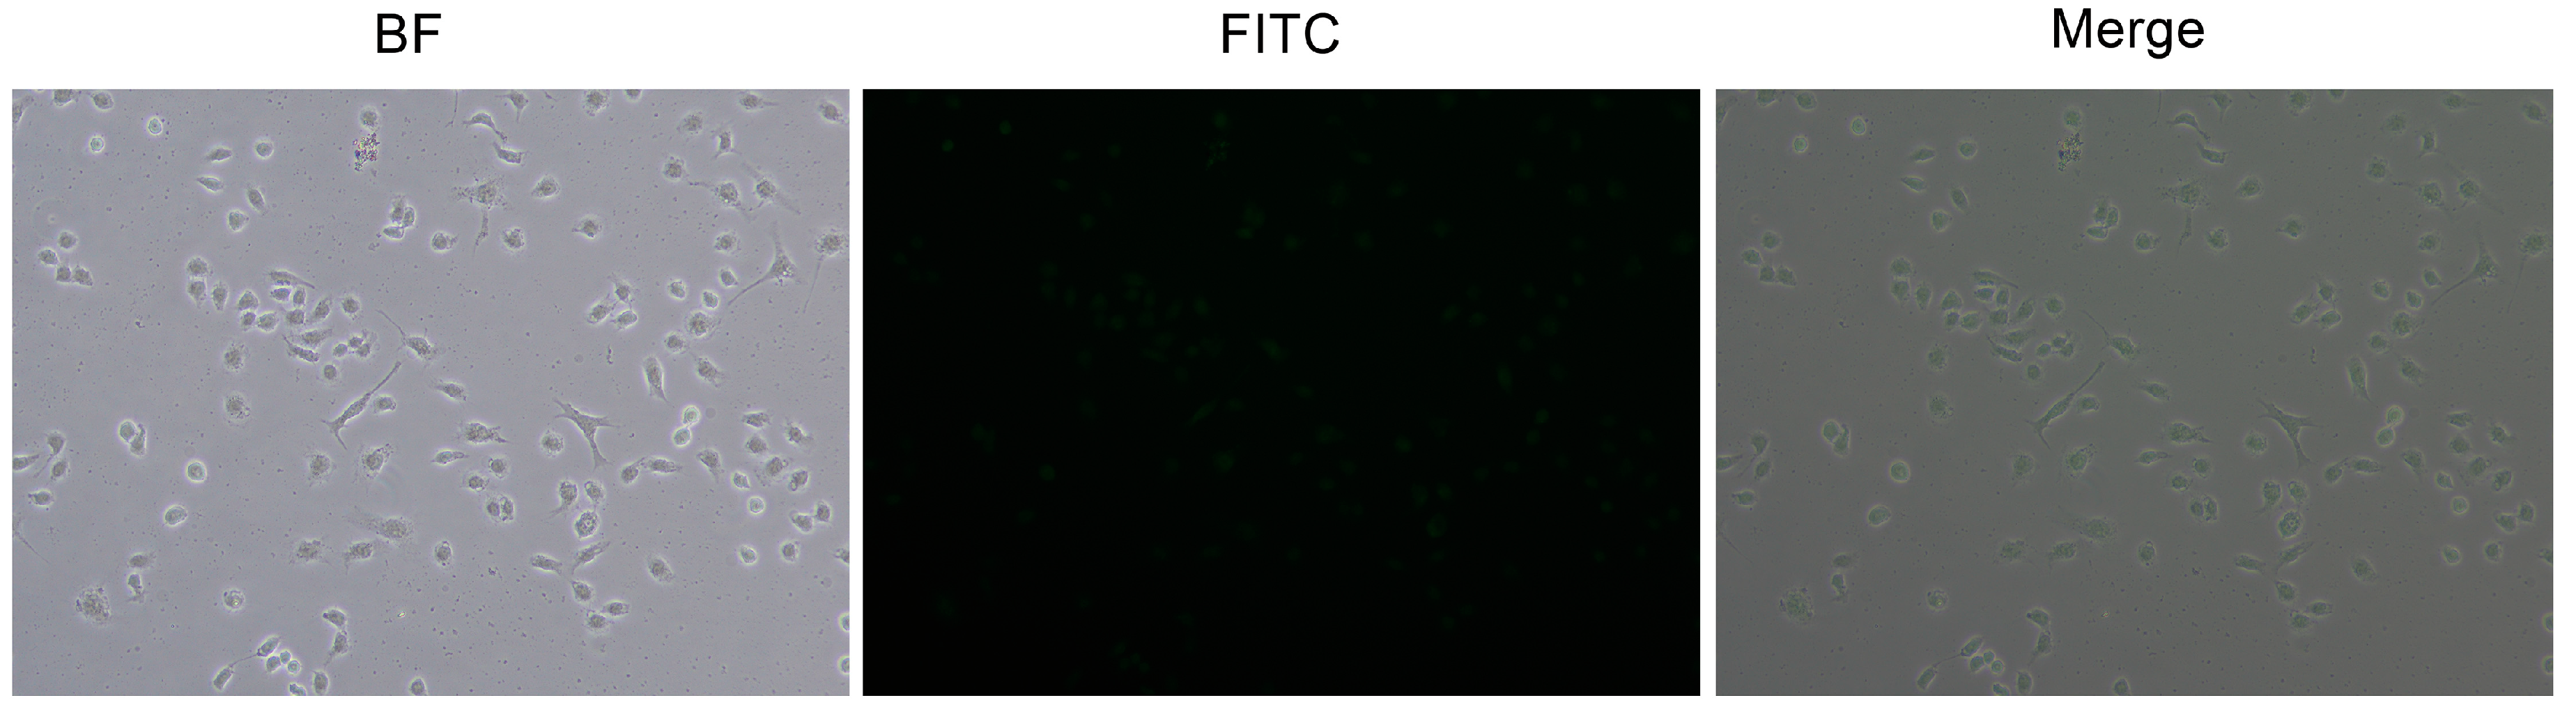
2.5.2. In Vitro Cellular Uptake
2.6. Fluorescence Evaluation of Nasal Brain Transport
2.7. Statistics Analysis
3. Results and Discussion
3.1. Synthesis and Characterization of PAMAM Dendrimer Nanocomposites
3.1.1. Characterization of Synthesis by Spectrum
3.1.2. Particle size, Zeta Potential, and Morphology
3.1.3. EE% and DL%
3.2. Preparation and Characterization of In Situ Gel
3.2.1. Response Surface Methodology
3.2.2. Characterization of In Situ Gel
3.2.3. Rheology Analysis
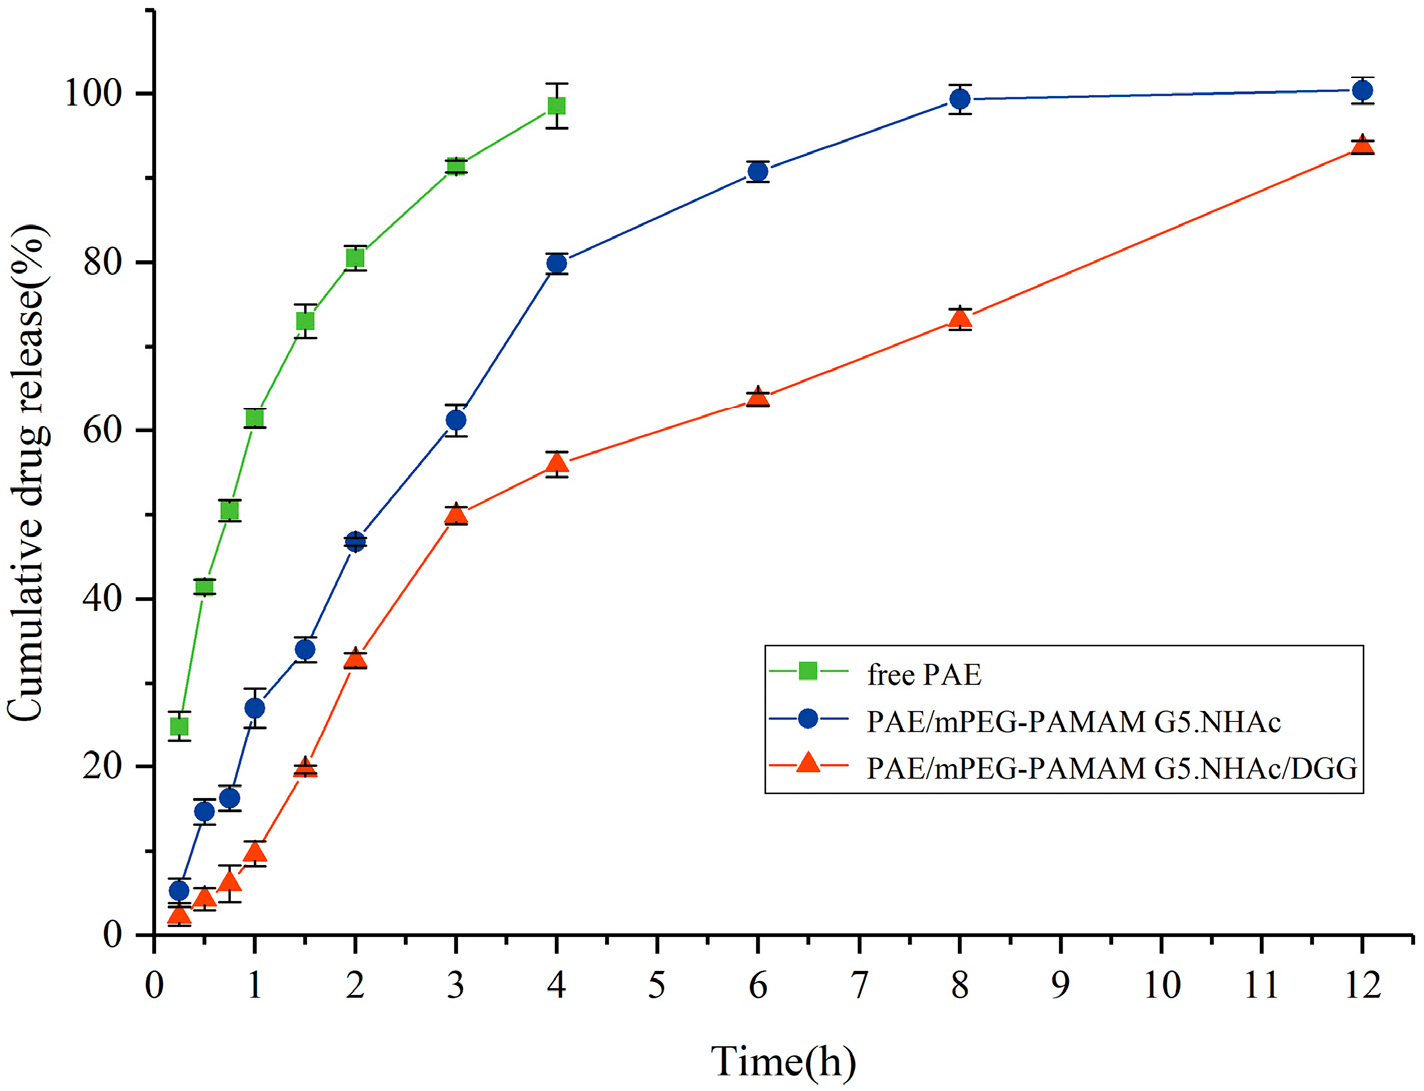
3.3. In Vitro Release
3.4. Cell Evaluation
3.4.1. In Vitro Cytotoxicity of PAMAM Dendrimer Nanocomposites
3.4.2. In Vitro Cellular Uptake
3.5. Fluorescence Evaluation of Nasal Brain Transport
4. Conclusions
Author Contributions
Funding
Acknowledgments
Conflicts of Interest
References
- Pashirova, T.N.; Zueva, I.V.; Petrov, K.A.; Babaev, V.M.; Lukashenko, S.S.; Rizvanov, I.K.; Souto, E.B.; Nikolsky, E.E.; Zakharova, L.Y.; Masson, P.; et al. Nanoparticle-Delivered 2-PAM for Rat Brain Protection against Paraoxon Central Toxicity. ACS Appl. Mater. Interfaces 2017, 9, 16922–16932. [Google Scholar] [CrossRef] [PubMed]
- Santos, S.D.; Xavier, M.; Leite, D.M.; Moreira, D.A.; Custódio, B.; Torrado, M.; Castro, R.; Leiro, V.; Rodrigues, J.; Tomás, H. PAMAM dendrimers: Blood-brain barrier transport and neuronal uptake after focal brain ischemia. J. Control. Release 2018, 18, 30577–30583. [Google Scholar] [CrossRef] [PubMed]
- Ma, Y.; Sha, M.; Cheng, S.; Yao, W.; Li, Z.; Qi, X. Construction of Hyaluronic Tetrasaccharide Clusters Modified Polyamidoamine siRNA Delivery System. Nanomaterials 2018, 8, 433. [Google Scholar] [CrossRef] [PubMed]
- Qiu, J.; Kong, L.; Cao, X.; Li, A.; Wei, P.; Wang, L.; Mignani, S.; Caminade, A.; Majoral, J.; Shi, X. Enhanced Delivery of Therapeutic siRNA into Glioblastoma Cells Using Dendrimer-Entrapped Gold Nanoparticles Conjugated with β-Cyclodextrin. Nanomaterials 2018, 8, 131. [Google Scholar] [CrossRef] [PubMed]
- Vidal, F.; Vásquez, P.; Cayumán, F.R.; Díaz, C.; Fuentealba, J.; Aguayo, L.G.; Yévenes, G.E.; Alderete, J.; Guzmán, L. Prevention of Synaptic Alterations and Neurotoxic Effects of PAMAM Dendrimers by Surface Functionalization. Nanomaterials 2018, 7, 7. [Google Scholar] [CrossRef] [PubMed]
- Wang, B.; Liao, M.; Hong, G.; Chang, W.; Chu, C. Near-Infrared-Triggered Photodynamic Therapy toward Breast Cancer Cells Using Dendrimer-Functionalized Upconversion Nanoparticles. Nanomaterials 2017, 7, 269. [Google Scholar] [CrossRef]
- Li, Y.; He, H.; Jia, X.; Lu, W.L.; Lou, J.; Wei, Y. A dual-targeting nanocarrier based on poly (amidoamine) dendrimers conjugated with transferrin and tamoxifen for treating brain gliomas. Biomaterials 2012, 33, 3899–3908. [Google Scholar] [CrossRef] [PubMed]
- Zarebkohan, A.; Najafi, F.; Moghimi, H.R.; Hemmati, M.; Deevband, M.R.; Kazemi, B. Synthesis and characterization of a PAMAM dendrimer nanocarrier functionalized by SRL peptide for targeted gene delivery to the brain. Eur. J. Pharm. Sci. 2015, 78, 19–30. [Google Scholar] [CrossRef]
- Ayatollahi, S.; Salmasi, Z.; Hashemi, M.; Askarian, S.; Oskuee, R.K.; Abnous, K.; Ramezani, M. Aptamer-targeted delivery of Bcl-xL shRNA using alkyl modified PAMAM dendrimers into lung cancer cells. Int. J. Biochem. Cell Biol. 2017, 92, 210–217. [Google Scholar] [CrossRef]
- Jain, D.S.; Bajaj, A.N.; Athawale, R.B.; Shikhande, S.S.; Pandey, A.; Goel, P.N.; Gude, R.P.; Patil, S.; Raut, P. Thermosensitive PLA based nanodispersion for targeting brain tumor via intranasal route. Mater. Sci. Eng. Proc. Conf. 2016, 63, 411–421. [Google Scholar] [CrossRef]
- Kim, I.-D.; Shin, J.-H.; Kim, S.-W.; Choi, S.; Ahn, J.; Han, P.-L.; Park, J.-S.; Lee, J.-K. Intranasal Delivery of HMGB1 siRNA Confers Target Gene Knockdown and Robust Neuroprotection in the Postischemic Brain. Mol. Ther. 2012, 20, 829–839. [Google Scholar] [CrossRef] [PubMed]
- Katare, Y.K.; Daya, R.P.; Sookram Gray, C.; Luckham, R.E.; Bhandari, J.; Chauhan, A.S.; Mishra, R.K. Brain Targeting of a Water Insoluble Antipsychotic Drug Haloperidol via the Intranasal Route Using PAMAM Dendrimer. Mol. Pharm. 2015, 9, 3380–3388. [Google Scholar] [CrossRef] [PubMed]
- Yasir, M.; Sara, U.V.S. Solid lipid nanoparticles for nose to brain delivery of haloperidol: In vitro drug release and pharmacokinetics evaluation. Acta Pharm. Sin. B 2014, 4, 454–463. [Google Scholar] [CrossRef] [PubMed]
- Singh, R.M.; Kumar, A.; Pathak, K. Mucoadhesivein situnasal gelling drug delivery systems for modulated drug delivery. Expert Opin. Drug Deliv. 2012, 10, 115–130. [Google Scholar] [CrossRef] [PubMed]
- Chu, K.D.; Chen, L.D.; Xu, W.; Li, H.; Zhang, Y.Q.; Xie, W.R.; Zheng, J. Preparation of a Paeonol-Containing Temperature-Sensitive In Situ Gel and Its Preliminary Efficacy on Allergic Rhinitis. Int. J. Mol. Sci. 2013, 14, 6499–6515. [Google Scholar] [CrossRef] [PubMed] [Green Version]
- Youssef, N.; Kassem, A.A.; Farid, R.M.; Ismail, F.A.; El-Massik, M.A.E.; Boraie, N.A. A novel nasal almotriptan loaded solid lipid nanoparticles in mucoadhesive in situ gelformulation for brain targeting: Preparation, characterization and in vivo evaluation. Int. J. Pharm. 2018, 548, 609–624. [Google Scholar] [CrossRef] [PubMed]
- Mura, P.; Mennini, N.; Nativi, C.; Richichi, B. In situ mucoadhesive-thermosensitive liposomal gel as a novel vehicle for nasal extended delivery of opiorphin. Eur. J. Pharm. Biopharm. 2018, 122, 54–61. [Google Scholar] [CrossRef] [PubMed]
- Wu, J.; Song, N.; Wei, X.; Guan, H.; Zhang, X. Protective effects of paeonol on cultured rat hippocampal neurons against oxygen-glucose deprivation-induced injury. J. Neurol. Sci. 2008, 264, 50–55. [Google Scholar] [CrossRef]
- Zhao, Y.; Fu, B.; Zhang, X.; Zhao, T.; Chen, L.; Zhang, J.; Wang, X. Paeonol pretreatment attenuates cerebral ischemic injury viaupregulating expression of pAkt, Nrf2, HO-1 and ameliorating BBBpermeability in mice. Brain Res. Bull. 2014, 109, 61–67. [Google Scholar] [CrossRef] [PubMed]
- Shi, X.; Chen, Y.; Liu, H.; Qu, H. Therapeutic effects of paeonol on methyl-4-phenyl-1,2,3,6- tetrahydropyridine/probenecid-induced Parkinson’s disease in mice. Mol. Med. Rep. 2016, 14, 2397–2404. [Google Scholar] [CrossRef] [PubMed]
- Lin, C.; Lin, H.Y.; Chen, J.H.; Tseng, W.P.; Ko, P.Y.; Liu, Y.S.; Yeh, W.L.; Lu, D.Y. Effects of Paeonol on Anti-Neuroinflammatory Responses in Microglial Cells. Int. J. Mol. Sci. 2015, 16, 8844–8860. [Google Scholar] [CrossRef] [PubMed] [Green Version]
- He, L.; Tong, X.; Zeng, J.; Tu, Y.; Wu, S.; Li, M.; Deng, H.; Zhu, M.; Li, X.; Nie, H.; et al. Paeonol Suppresses Neuroinflammatory Responses in LPS-Activated Microglia Cells. Inflammation 2016, 39, 1904–1917. [Google Scholar] [CrossRef] [PubMed]
- Li, H.; Wang, S.; Zhang, B.; Xie, Y.; Wang, J.; Yang, Q.; Cao, W.; Hu, J.; Duan, L. Influence of Co-Administered Danshensu on Pharmacokinetic Fate and Tissue Distribution of Paeonol in Rats. Planta Med. 2011, 78, 135–140. [Google Scholar] [CrossRef] [PubMed]
- Xie, Y.; Zhou, H.; Wong, Y.F.; Xu, H.X.; Jiang, Z.H.; Liu, L. Study on the pharmacokinetics and metabolism of paeonol in rats treated with pure paeonol and an herbal preparation containing paeonol by using HPLC–DAD-MS method. J. Pharm. Biomed. Anal. 2008, 46, 748–756. [Google Scholar] [CrossRef] [PubMed]
- Ding, L.Q.; Qiu, T.Y.; Liu, Z.X.; Chen, L.X.; Oppong, M.B.; Zhang, D.Q.; Zhang, B.L.; Bai, G.; Qiu, F. Systematic characterization of the metabolites of paeonol in rats using ultra performance liquid chromatography coupled with electrospray ionization quadrupole time-of-flight tandem mass spectrometry with an integrative strategy. J. Chromatogr. Biomed. Appl. 2017, 1065–1066, 70–78. [Google Scholar] [CrossRef] [PubMed]
- Hao, J.F.; Zhao, J.; Zhang, S.; Tong, T.T.; Zhuang, Q.N.; Jin, K.; Chen, W.; Tang, H. Fabrication of an ionic-sensitive in situ gel loaded with resveratrol nanosuspensions intended for direct nose-to-brain delivery. Colloids Surf. B 2016, 147, 376–386. [Google Scholar] [CrossRef] [PubMed]
- Salunke, S.R.; Patil, S.B. Ion activated in situ gel of gellan gum containing salbutamol sulphate for nasal administration. Int. J. Biol. Macromol. 2016, 87, 41–47. [Google Scholar] [CrossRef] [PubMed]
- Mahajan, H.S.; Tyagi, V.; Lohiya, G.; Nerkar, P. Thermally reversible xyloglucan gels as vehicles for nasal drug delivery. Drug Deliv. 2012, 19, 270–275. [Google Scholar] [CrossRef]
- Hosny, K.M.; Hassan, A.H. Intranasal in situ gel loaded with saquinavir mesylate nanosized microemulsion: Preparation, characterization, and in vivo evaluation. Int. J. Pharm. 2014, 475, 191–197. [Google Scholar] [CrossRef]
- Shah, V.; Sharma, M.; Pandya, R.; Parikh, R.K.; Bharatiya, B.; Shukla, A.; Tsai, H.C. Quality by Design approach for an in situ gelling microemulsion of Lorazepam via intranasal route. Mater. Sci. Eng. C Mater. Biol. Appl. 2017, 75, 1231–1241. [Google Scholar] [CrossRef]
- Fatouh, A.M.; Elshafeey, A.H.; Abdelbary, A. Agomelatine-based in situ gels for brain targeting via the nasal route: Statistical optimization, in vitro, and in vivo evaluation. Drug Deliv. 2017, 24, 1077–1085. [Google Scholar] [CrossRef] [PubMed]
- Mahajan, H.S.; Gattani, S. In situ gels of Metoclopramide Hydrochloride for intranasal delivery: In vitro evaluation and in vivo pharmacokinetic study in rabbits. Drug Deliv. 2010, 17, 19–27. [Google Scholar] [CrossRef] [PubMed]
- Liu, Y.; Huang, R.; Han, L.; Ke, W.; Shao, K.; Ye, L.; Lou, J.; Jiang, C. Brain-targeting gene delivery and cellular internalization mechanisms for modified rabies virus glycoprotein RVG29 nanoparticles. Biomaterials 2009, 30, 4195–4202. [Google Scholar] [CrossRef] [PubMed]
- Li, Y.; Zhu, H.; Wang, S.; Qian, X.; Fan, J.; Wang, Z.; Song, P.; Zhang, X.; Lu, W.; Ju, D. Interplay of Oxidative Stress and Autophagy in PAMAM Dendrimers-Induced Neuronal Cell Death. Theranostics 2015, 5, 1363–1377. [Google Scholar] [CrossRef] [PubMed] [Green Version]
- Janaszewska, A.; Gorzkiewicz, M.; Ficker, M.; Petersen, J.F.; Paolucci, V.; Christensen, J.B.; Klajnert, M.B. Pyrrolidone Modification Prevents PAMAM Dendrimers from Activation of Pro-Inflammatory Signaling Pathways in Human Monocytes. Mol. Pharm. 2018, 15, 12–20. [Google Scholar] [CrossRef] [PubMed]
- Cao, S.L.; Zhang, Q.Z.; Jiang, X.G. Preparation of ion-activated in situ gel systems of scopolamine hydrobromide and evaluation of its antimotion sickness efficacy. Acta Pharmacol. Sin. 2007, 28, 584–590. [Google Scholar] [CrossRef] [PubMed] [Green Version]
- Dewan, M.; Sarkar, G.; Bhowmik, M.; Das, B.; Chattoapadhyay, A.K.; Rana, D.; Chattopadhyay, D. Effect of gellan gum on the thermogelation property and drug release profile of Poloxamer 407 based ophthalmic formulation. Int. J. Biol. Macromol. 2017, 102, 258–265. [Google Scholar] [CrossRef] [PubMed]
- Zaki, N.M.; Awad, G.A.; Mortada, N.D.; Abd Elhady, S.S. Enhanced bioavailability of metoclopramide HCl by intranasal administration of a mucoadhesive in situ gel with modulated rheological and mucociliary transport properties. Eur. J. Pharm. Sci. 2007, 32, 296–307. [Google Scholar] [CrossRef]
- Cao, S.L.; Ren, X.W.; Zhang, Q.Z.; Chen, E.; Xu, F.; Chen, J.; Liu, L.C.; Jiang, X.G. In situ gel based on gellan gum as new carrier for nasal administration of mometasone furoate. Int. J. Pharm. 2009, 365, 109–115. [Google Scholar] [CrossRef]
- Chen, M.H.; Wang, L.L.; Chung, J.J.; Kim, Y.H.; Atluri, P.; Burdick, J.A. Methods to Assess Shear-Thinning Hydrogels for Application as Injectable Biomaterials. ACS Biomater. Sci. Eng. 2017, 3, 3146–3160. [Google Scholar] [CrossRef] [PubMed]
- Ozbılgın, N.D.; Saka, O.M.; Bozkır, A. Preparation and in vitro/in vivo evaluation of mucosal adjuvant in situ forming gels with diphtheria toxoid. Drug Deliv. 2014, 21, 140–147. [Google Scholar] [CrossRef] [PubMed] [Green Version]
- JianYang, P.; YiYu, C. Identification and analysis of absorbed and metabolic components in rat plasma after oral administration of ‘Shuangdan’ granule by HPLC–DAD–ESI-MS/MS. J. Pharm. Biomed. Anal. 2006, 42, 565–572. [Google Scholar] [CrossRef]
- Lv, T.; Yu, T.; Fang, Y.; Zhang, S.; Jiang, M.; Zhang, H.; Zhang, Y.; Li, Z.; Chen, H.; Gao, Y. Role of generation on folic acid-modified poly (amidoamine)dendrimers for targeted delivery of baicalin to cancer cells. Mater. Sci. Eng. C Mater. Biol. Appl. 2017, 75, 182–190. [Google Scholar] [CrossRef] [PubMed]
- Xu, X.; Li, J.; Han, S.; Tao, C.; Fang, L.; Sun, Y.; Zhu, J.; Liang, Z.; Li, F. A novel doxorubicin loaded folic acid conjugated PAMAM modified with borneol, a nature dual-functional product of reducing PAMAM toxicity and boosting BBB penetration. Eur. J. Pharm. Sci. 2016, 88, 178–190. [Google Scholar] [CrossRef] [PubMed]
- Win-Shwe, TT.; Sone, H.; Kurokawa, Y.; Zeng, Y.; Zeng, Q.; Nitta, H.; Hirano, S. Effects of PAMAM dendrimers in the mouse brain after a single intranasal instillation. Toxicol. Lett. 2014, 228, 207–221. [Google Scholar] [CrossRef] [PubMed]
- Qian, S.; Wong, Y.C.; Zuo, Z. Development, characterization and application of in situ gel systems for intranasal delivery of tacrine. Int. J. Pharm. 2014, 468, 272–282. [Google Scholar] [CrossRef] [PubMed]
- Gabal, Y.M.; Kamel, A.O.; Sammour, O.A.; Elshafeey, A.H. Sammour a Effect of surface charge on the brain delivery of nanostructured lipid carriers in situ gels via the nasal route. Int. J. Pharm. 2014, 473, 442–457. [Google Scholar] [CrossRef] [PubMed]
- Sharma, R.; Kim, S.Y.; Sharma, A.; Zhang, Z.; Kambhampati, S.P.; Kannan, S.; Kannan, R.M. Activated Microglia Targeting Dendrimer−Minocycline Conjugate as Therapeutics for Neuroinflammation. Bioconjug. Chem. 2017, 28, 2874–2886. [Google Scholar] [CrossRef] [PubMed]
- Cui, Y.; Liang, B.; Wang, L.; Zhu, L.; Kang, J.; Sun, H.; Chen, S. Enhanced biocompatibility of PAMAM dendrimers benefiting from tuning their surface charges. Mater. Sci. Eng. C Mater. Biol. Appl. 2018, 93, 332–340. [Google Scholar] [CrossRef]
- Reshadmanesh, A.; Rahbarizadeh, F.; Ahmadvand, D.; Jafari, I.S.F. Evaluation of cellular and transcriptional targeting of breast cancer stem cells via anti-HER2 nanobody conjugated PAMAM dendrimers. Artif. Cells Nanomed. Biotechnol. 2018. [Google Scholar] [CrossRef]


| Factor | Minimum −1.414 | Coded Low −1 | Mean 0 | Coded High +1 | Maximum +1.414 |
|---|---|---|---|---|---|
| A: DGG (% w/v) | 0.2 | 0.2732 | 0.45 | 0.6278 | 0.7 |
| B: HPMC (% w/v) | 0.1 | 0.1586 | 0.3 | 0.4414 | 0.5 |
| Compound | Particle Size (nm) | Zeta Potential (mv) |
|---|---|---|
| PAMAM G5.NH2 | 5.41 ± 0.24 | +8.23 ± 0.55 |
| mPEG-PAMAM G5.NH2 | 11.55 ± 0.14 | +4.81 ± 0.17 |
| mPEG-PAMAM G5.NHAc | 70.91 ± 11.59 | +2.60 ± 0.02 |
| PAE/mPEG-PAMAM G5.NHAc | 72.41 ± 11.58 | +0.57 ± 0.11 |
| mPEG-PAMAM G5.NH2-FITC | 96.51 ± 7.77 | +9.60 ± 0.41 |
| Runs | Factor1 A:DGG (% w/v) | Factor2 B:HPMC (% w/v) | Factor1 A:DGG (% w/v) | Factor2 B:HPMC (% w/v) | Reponse 1 Solution viscosity mPa | Reponse 2 Gel viscosity mPa |
|---|---|---|---|---|---|---|
| 1 | −1 | −1 | 0.2732 | 0.1586 | 22.83 ± 0.17 | 639.35 ± 3.89 |
| 2 | −1 | −1 | 0.6278 | 0.1586 | 254.21 ± 0.52 | 1955.02 ± 11.56 |
| 3 | 1 | 1 | 0.2732 | 0.4414 | 200.92 ± 0.58 | 1029.63 ± 10.35 |
| 4 | 1 | 1 | 0.6278 | 0.4414 | 316.43 ± 0.88 | 2066.50 ± 22.59 |
| 5 | −1.414 | 0 | 0.2000 | 0.3000 | 45.67 ± 0.04 | 550.75 ± 8.67 |
| 6 | 1.414 | 0 | 0.7000 | 0.3000 | 294.50 ± 0.94 | 1945.54 ± 19.36 |
| 7 | 0 | −1.414 | 0.4500 | 0.1000 | 18.27 ± 0.08 | 1167.21 ± 9.83 |
| 8 | 0 | 1.414 | 0.4500 | 0.5000 | 286.24 ± 0.77 | 1554.32 ± 9.93 |
| 9 | 0 | 0 | 0.4500 | 0.3000 | 100.50 ± 0.67 | 1243.51 ± 9.30 |
| 10 | 0 | 0 | 0.4500 | 0.3000 | 95.96 ± 0.82 | 1214.59 ± 7.82 |
| 11 | 0 | 0 | 0.4500 | 0.3000 | 97.92 ± 0.31 | 1240.45 ± 11.05 |
| 12 | 0 | 0 | 0.4500 | 0.3000 | 91.34 ± 0.53 | 1233.56 ± 9.39 |
| 13 | 0 | 0 | 0.4500 | 0.3000 | 96.01 ± 0.66 | 1250.27 ± 12.83 |
| Reponse Y | Model | Regression Equation | F-Value | P-Value | R2 |
|---|---|---|---|---|---|
| Y1:Solution Viscosity (34 °C) | Quadratic | Y1 = +96.33 + 87.35 × A + 77.40 × B − 28.97 × A × B + 46.23 × A2 + 37.31 × B2 | 35.75 | <0.0001 | 0.9623 |
| Y2:Gel Viscosity (34 °C) | Quadratic | Y2 = +1235.90 + 540.63 × A + 131.13 × B − 69.69 × A × B + 35.69 × A2 + 91.87 × B2 | 76.38 | <0.0001 | 0.9820 |
| Ingredients | Formulation Compositions (% w/v) |
|---|---|
| PAE/mPEG-PAMAM G5.NHAc | 1 |
| DGG | 0.45 |
| HPMC | 0.3 |
| Mannitol | 1 |
| Chlorine acetate | 0.01 |
| Vitamin E | 0.01 |
| Distilled water | 100 |
| Compound | Model | Regression Equation | R2 |
|---|---|---|---|
| PAE/mPEG-PAMAM G5.NHAc | Higuchi | Qt = 0.43459t1/2 − 0.16452 | 0.98 |
| PAE/mPEG-PAMAM G5.NHAc/DGG | Korsmeyer-Peppas | Qt = 0.18095t0.68301 | 0.95 |
© 2019 by the authors. Licensee MDPI, Basel, Switzerland. This article is an open access article distributed under the terms and conditions of the Creative Commons Attribution (CC BY) license (http://creativecommons.org/licenses/by/4.0/).
Share and Cite
Xie, H.; Li, L.; Sun, Y.; Wang, Y.; Gao, S.; Tian, Y.; Ma, X.; Guo, C.; Bo, F.; Zhang, L. An Available Strategy for Nasal Brain Transport of Nanocomposite Based on PAMAM Dendrimers via In Situ Gel. Nanomaterials 2019, 9, 147. https://doi.org/10.3390/nano9020147
Xie H, Li L, Sun Y, Wang Y, Gao S, Tian Y, Ma X, Guo C, Bo F, Zhang L. An Available Strategy for Nasal Brain Transport of Nanocomposite Based on PAMAM Dendrimers via In Situ Gel. Nanomaterials. 2019; 9(2):147. https://doi.org/10.3390/nano9020147
Chicago/Turabian StyleXie, Huichao, Lingjun Li, Yue Sun, Yuzhen Wang, Shuang Gao, Yuan Tian, Xuemei Ma, Chengcheng Guo, Fumin Bo, and Li Zhang. 2019. "An Available Strategy for Nasal Brain Transport of Nanocomposite Based on PAMAM Dendrimers via In Situ Gel" Nanomaterials 9, no. 2: 147. https://doi.org/10.3390/nano9020147