Hexagonal and Monoclinic Phases of La2O2CO3 Nanoparticles and Their Phase-Related CO2 Behavior


1
School of Chemical Engineering, University of Ulsan, Daehakro 93, Nam-gu, Ulsan 44610, Korea
2
College of Chemistry and Chemical Engineering, Shanghai University of Engineering Science, Shanghai 201620, China
*
Author to whom correspondence should be addressed.
Nanomaterials 2020, 10(10), 2061; https://doi.org/10.3390/nano10102061
Submission received: 28 September 2020
/
Revised: 13 October 2020
/
Accepted: 15 October 2020
/
Published: 19 October 2020
(This article belongs to the Special Issue Nanotechnologies and Nanomaterials: Selected Papers from CCMR)
Abstract
:In this study, we prepared hexagonal and monoclinic phases of La2O2CO3 nanoparticles by different wet preparation methods and investigated their phase-related CO2 behavior through field-emission scanning microscopy, high-resolution transmission electron microscopy, Fourier transform infrared, thermogravimetric analysis, CO2-temperature programmed desorption, and linear sweeping voltammetry of CO2 electrochemical reduction. The monoclinic La2O2CO3 phase was synthesized by a conventional precipitation method via La(OH)CO3 when the precipitation time was longer than 12 h. In contrast, the hydrothermal method produced only the hexagonal La2O2CO3 phase, irrespective of the hydrothermal reaction time. The La(OH)3 phase was determined to be the initial phase in both preparation methods. During the precipitation, the La(OH)3 phase was transformed into La(OH)CO3 owing to the continuous supply of CO2 from air whereas the hydrothermal method of a closed system crystallized only the La(OH)3 phase. Based on the CO2-temperature programmed desorption and thermogravimetric analysis, the hexagonal La2O2CO3 nanoparticles (HL-12h) showed a higher surface CO2 adsorption and thermal stability than those of the monoclinic La2O2CO3 (PL-12h). The crystalline structures of both La2O2CO3 phases predicted by the density functional theory calculation explained the difference in the CO2 behavior on each phase. Consequently, HL-12h showed a higher current density and a more positive onset potential than PL-12h in CO2 electrochemical reduction.
1. Introduction
Recently, the synthesis of nanomaterials with controllable morphologies and phases has attracted considerable attention in the fields of materials science and inorganic chemistry because the physicochemical and structural properties of the nanomaterials strongly correlate with the types of crystal structures as well as the morphologies of nanoparticles [1,2,3,4,5,6]. The unique properties of nanomaterials can be properly tuned by controlling various factors, which results in potential applications of nanomaterials in catalysis, biological labeling, sensing, and optics [1,7,8,9]. Among the methods for synthesizing nanomaterials, wet chemical processes have been considered as the most effective and convenient approaches for the controllable phases of ceramic materials [10].
Lanthana (La2O3) has been widely used as a promoter or support in heterogeneous catalysis [11,12,13]. The basicity of La2O3 readily induces the adsorption of CO2 to form the lanthanum oxycarbonate (La2O2CO3) phase, which is an important species in the La2O3-containing catalytic reaction [4,13,14,15,16]. The crystalline structures of La2O2CO3 can be divided into three types of different polymorphs: a tetragonal La2O2CO3 (type I), a monoclinic La2O2CO3 (type Ia), and a hexagonal La2O2CO3 (type II) [16,17,18]. The hexagonal type II La2O2CO3 has a higher chemical stability to water and carbon dioxide than the monoclinic type Ia [4,19,20]. In addition, the different crystalline structures of the La2O2CO3 phases affect the interaction between La2O2CO3 and ZnO in the La2O2CO3/ZnO composite materials as well as the catalytic behavior of the composite materials on glycerol carbonation with CO2 [4,21]. Meanwhile, the monoclinic type Ia La2O2CO3 phase closely resembles the crystalline structure of lanthanum (La) oxysalts (e.g., oxysilicates, oxyhalides, and oxysulfates), whereas the hexagonal type II one is similar to A-type La sesquioxides. Thus, the type Ia La2O2CO3 phase has been readily prepared by the thermal decomposition of La compounds (e.g., oxalates and acetates); however, it is difficult to prepare type II La2O2CO3 in a single phase by the conventional wet preparation methods [20]. Accordingly, it is necessary to investigate i) the preparation conditions used to form type Ia and type II La2O2CO3 phases in the conventional methods and ii) the CO2 behavior on the La2O2CO3 structures, which is an essential step in the CO2-involving catalytic reactions, as well as the formation of the different La2O2CO3 phases.
In this study, we prepared the nanoparticles with type Ia and type II La2O2CO3 crystal structures by conventional wet preparation methods and investigated the formation of different La2O2CO3 phases with Fourier transform infrared (FT-IR), X-ray diffraction (XRD), field-emission scanning electron microscopy (FE-SEM), and high-resolution transmission electron microscopy (HR-TEM). Furthermore, the CO2 behavior on the different La2O2CO3 crystal structures was observed by CO2-temperature programmed desorption (TPD), thermogravimetric analysis (TGA), and linear sweeping voltammetry (LSV) of CO2 electrochemical reduction. The superior CO2 behavior of the hexagonal La2O2CO3 phase to the monoclinic phase was additionally explained by the crystalline structures of both La2O2CO3 phases, which was predicted by the density functional theory (DFT) calculation.
2. Materials and Methods
2.1. Materials
A total of 1.00 g of La(NO3)3·6H2O was added to 50.0 mL of deionized water, and the resultant solution was vigorously stirred to ensure complete dissolution. The pH of the solution was adjusted to 12 with a 10 wt% NaOH solution, which yielded a white precipitate after the mixture was stirred for approximately 10 min. The sample was continuously stirred for another 6, 12, or 24 h, and the obtained product was centrifuged. The separated precipitate was washed with distilled water and ethanol and then dried at 80 °C for 12 h, followed by the calcination step at 500 °C for 2 h. Depending on the precipitation time, the solid samples prepared by the precipitation method were denoted as PL-xh (x = 6, 12, or 24), where x represents the precipitation time.
For the hydrothermal method, the procedure was almost the same as that in the precipitation method, except using an autoclave for the hydrothermal treatment. The pH-adjusted solution containing the La precursor was transferred to an autoclave (200 mL), heated to 160 °C, and maintained at this temperature for 6, 12, or 24 h. The obtained product was centrifuged, and the remained steps were also the same as those in the precipitation method. The La2O2CO3 samples synthesized by the hydrothermal method were designated as HL-yh (y = 6, 12, or 24), where y represents the hydrothermal treatment time.
2.2. Characterizations
The morphologies of the samples were observed by a field-emission scanning electron microscope (JEOL, JSM-600F, Tokyo, Japan) instrument equipped with an energy-dispersive spectrometer. HR-TEM images were obtained using a JEOL JEM-2100F instrument (JEOL Ltd., Tokyo, Japan). The samples were prepared by suspending and grinding in an ethanol solution whose drops were placed on a carbon-film-coated copper grid. XRD patterns were measured at room temperature on a Rigaku D/MAX-2200 powder X-ray diffractometer (Rigaku Corporation, Tokyo, Japan) using a Cu Kα radiation source (λ = 0.15418 nm). The X-ray tube was operated at 35 kV and 20 mA, and the 2θ angle was scanned from 10° to 90° (with a step of 0.02°) at a speed of 2°/min. The FT-IR spectra of the samples were collected for the KBr powder-pressed pellets on a Nicolet 380 FT-IR spectrophotometer (Thermo Fisher Scientific, Waltham, MA, USA) under ambient conditions.
The CO2-TPD experiments were conducted in a quartz flow reactor. The calcined samples were preheated from room temperature up to 600 °C (with a ramping rate of 15 °C/min) for 1 h under He flow (100 mL/min). The CO2 gas (10 vol.% CO2/He) was fed into the reactor with a flow rate of 30 mL/min at 50 °C for CO2 adsorption before conducting the CO2-TPD measurements. Finally, the temperature was increased from 50 to 600 °C at the ramping rate of 1.5 °C/min in He flow (30 mL/min). The weight loss in the samples was determined by a thermogravimetric analyzer (TA Instruments Q50, New Castle, DE, USA). A total of 20 mg of the samples was charged into the sample pan and heated to 1000 °C at a rate of 5 °C/min in air flow. The CO2 electrochemical reduction was carried out via the LSV measurement with an Ag/AgCl electrode as a reference electrode and Pt wire as a counter electrode. The working electrode was prepared by dispersing 10 mg of the samples in a mixture of 2 mL of alcohol and 100 μL of 5% Nafion and then pipetting 10 μL of suspension on the GCE (0.07065 cm2). The working electrode was tested 20 times at a scan rate of 20 mV/s. The electrolyte was 0.1 M NaHCO3 saturated with CO2. Before each experiment, high-purity CO2 gas was bubbled at a flow rate of 30 mL/min for 30 min to remove all oxygen from the electrolyte. The gases in the measurement were analyzed by a GC instrument.
Using the Vienna Ab initio Simulation Package (VASP) [22,23], DFT calculations were conducted along with the GGA–PBE (Perdew–Burke–Ernzerhof) functional [24]. The cutoff energy of 600 eV was chosen in our calculations. The criteria of convergence of energies and forces for geometry optimization were 10−4 eV and 10−2 eV/Å, respectively. For the calculation of disordered hexagonal La2O2CO3, the lowest energy configuration among the other randomly selected 50 structures was used. The Monkhorst-Pack k-point meshes of 3 × 5 × 2 and 9 × 9 × 3 were used for the geometry optimization of monoclinic and hexagonal phase of La2O2CO3, respectively [25].
3. Results and Discussion
3.1. Synthesis of Monoclinic and Hexagonal La2O2CO3 Nanoparticles
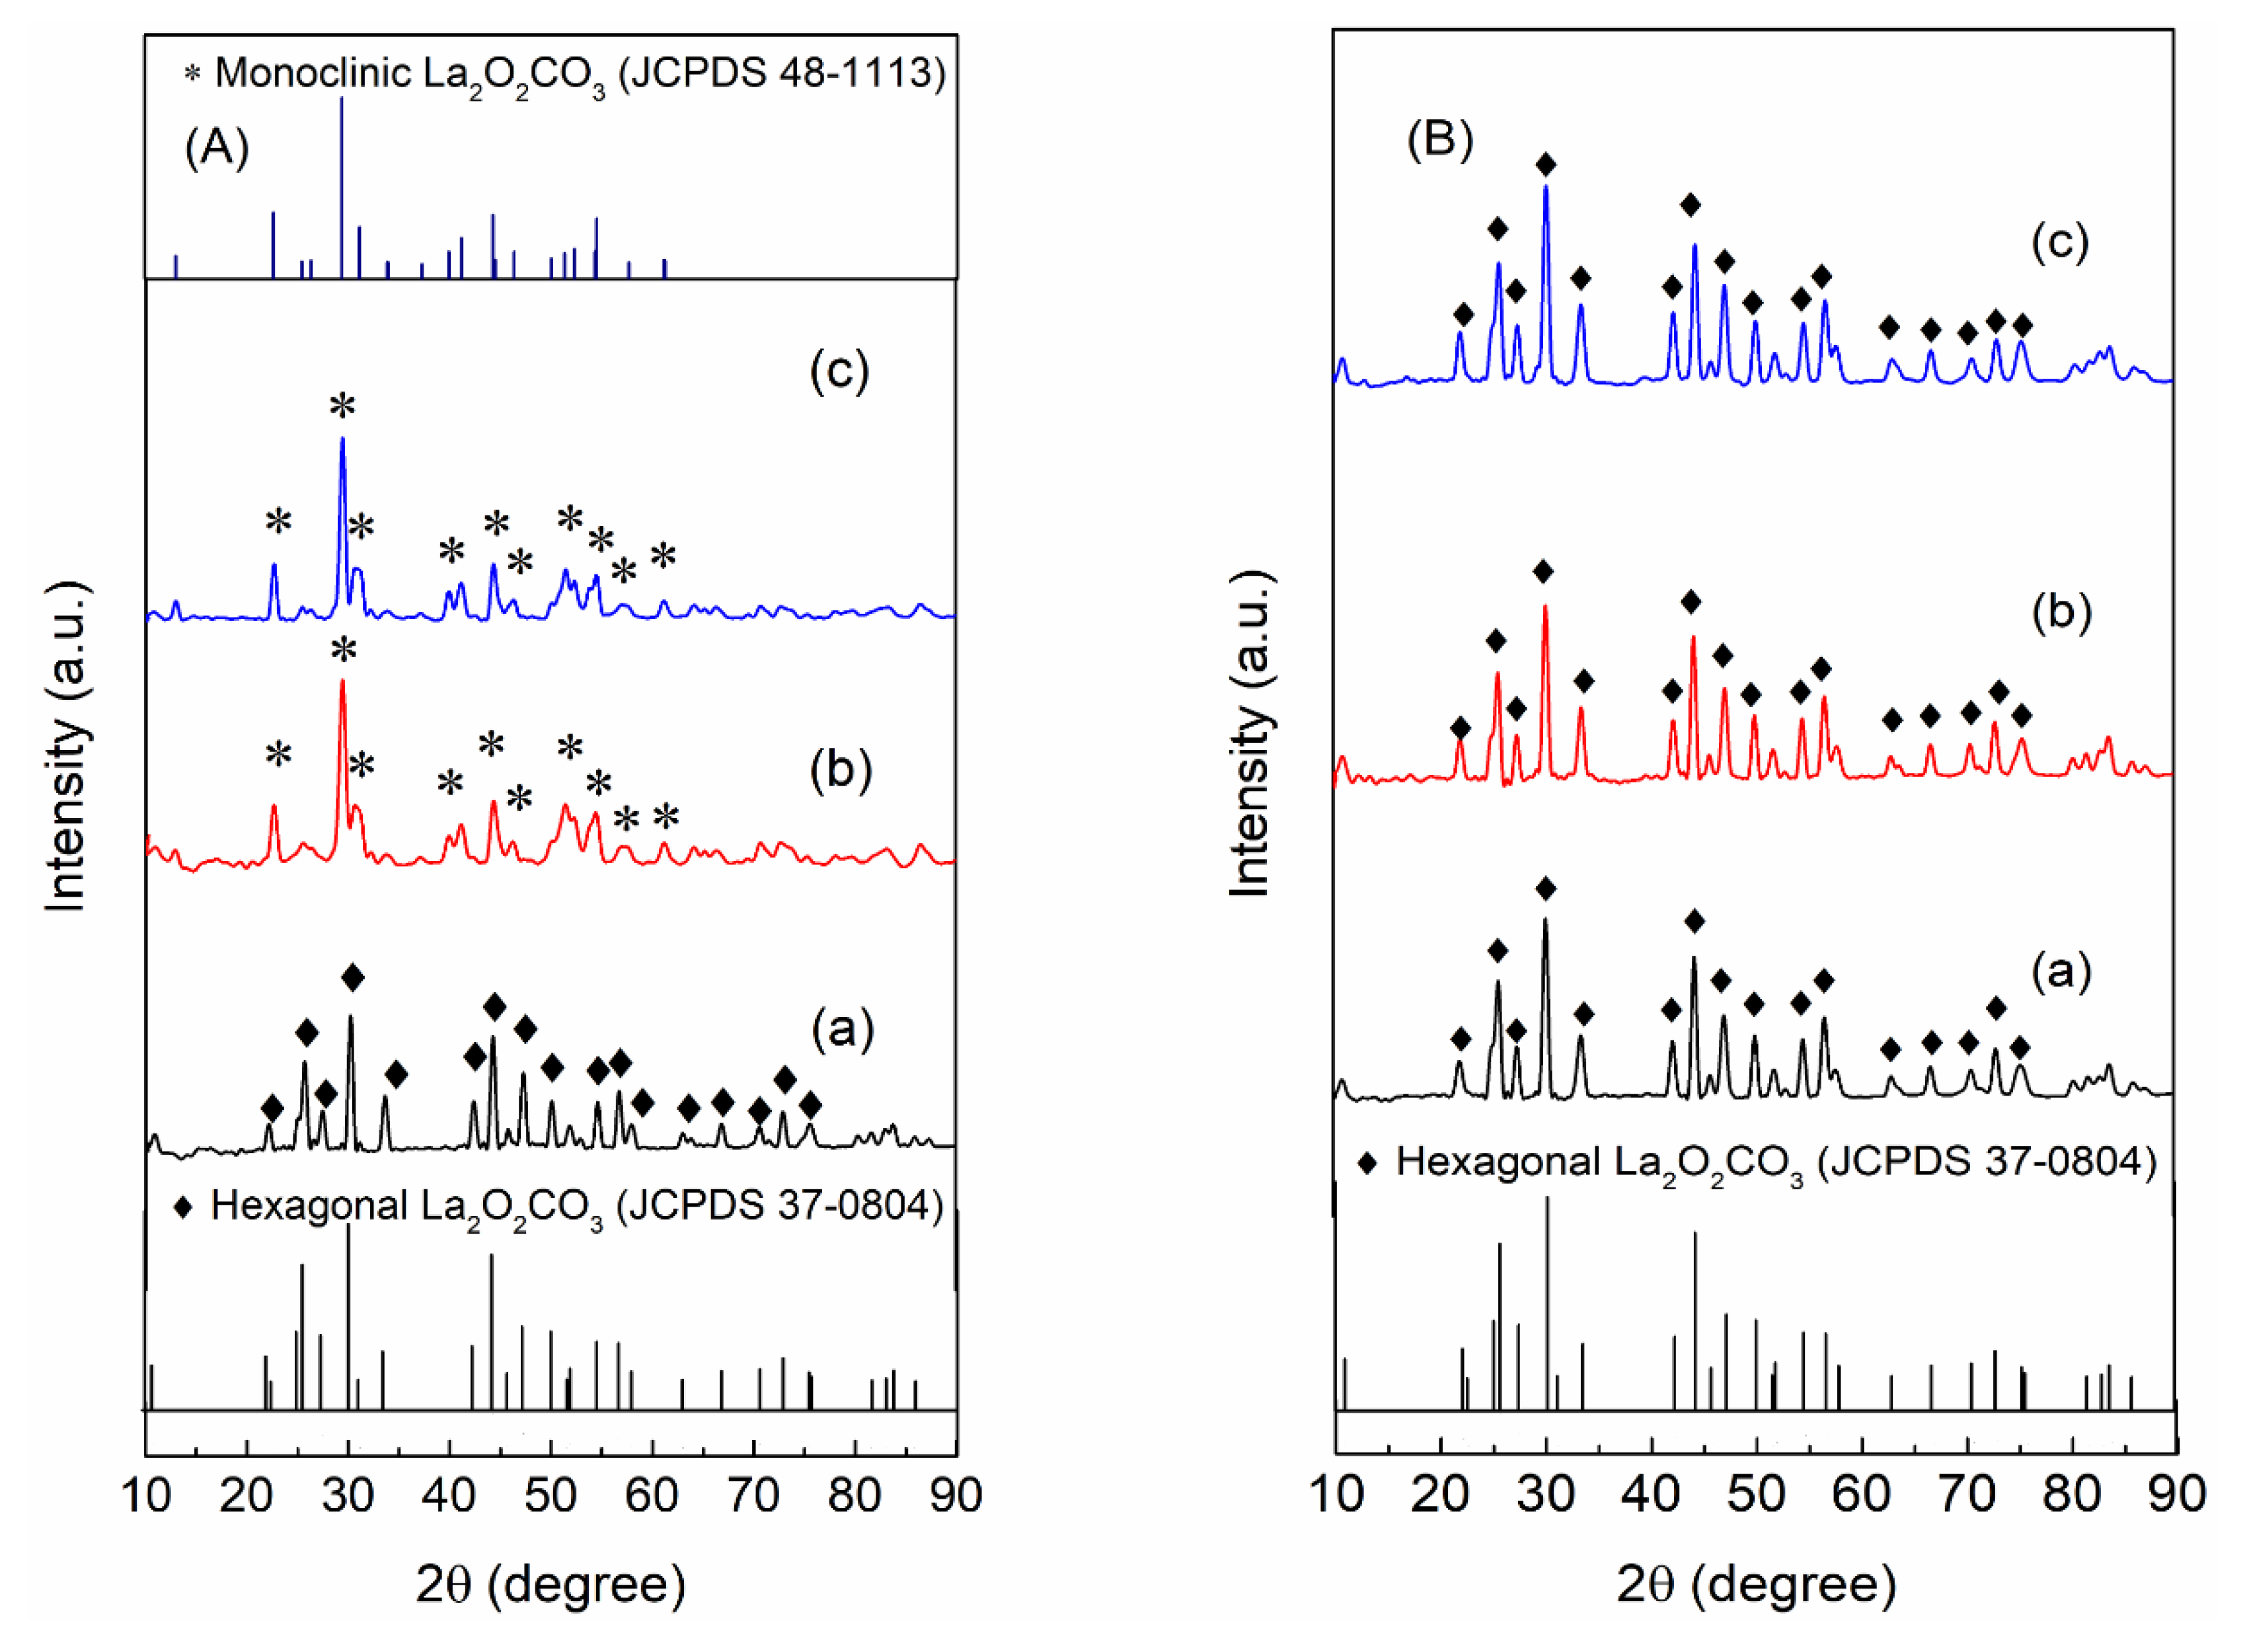
Figure 1 shows the XRD patterns of La2O2CO3 nanoparticle materials prepared at each reaction time. The two types of La2O2CO3 phases are primarily detected in the PL samples: the monoclinic type Ia and hexagonal type II La2O2CO3 phases. For 6 h of precipitation (PL-6h), the characteristic XRD peaks in the hexagonal La2O2CO3 crystal phase are clearly observed at 2θ = 25.7, 30.2, 47.2, and 56.6° (JCPDS 37-0804) (Figure 1(Aa)) [1,4,20,21,26,27]. However, when the precipitation time is increased to 12 and 24 h, the characteristic XRD peaks in the monoclinic La2O2CO3 phase clearly appear at 2θ = 22.8, 29.3, 31.0, 39.9, and 44.4° with a C12/c1 space group (JCPDS 48-1113) (Figure 1(Ab,Ac)), which indicates the prevalence of the hexagonal La2O2CO3 phase during the initial precipitation time, followed by the transformation into the monoclinic La2O2CO3 phase after 12 h of precipitation. In contrast, the HL samples show the XRD patterns that contain the characteristic peaks in only the hexagonal type II La2O2CO3 phase, regardless of the reaction time during the hydrothermal preparation, which demonstrates that there is no change in the La2O2CO3 phase during the preparation process (Figure 1(Ba–Bc)).
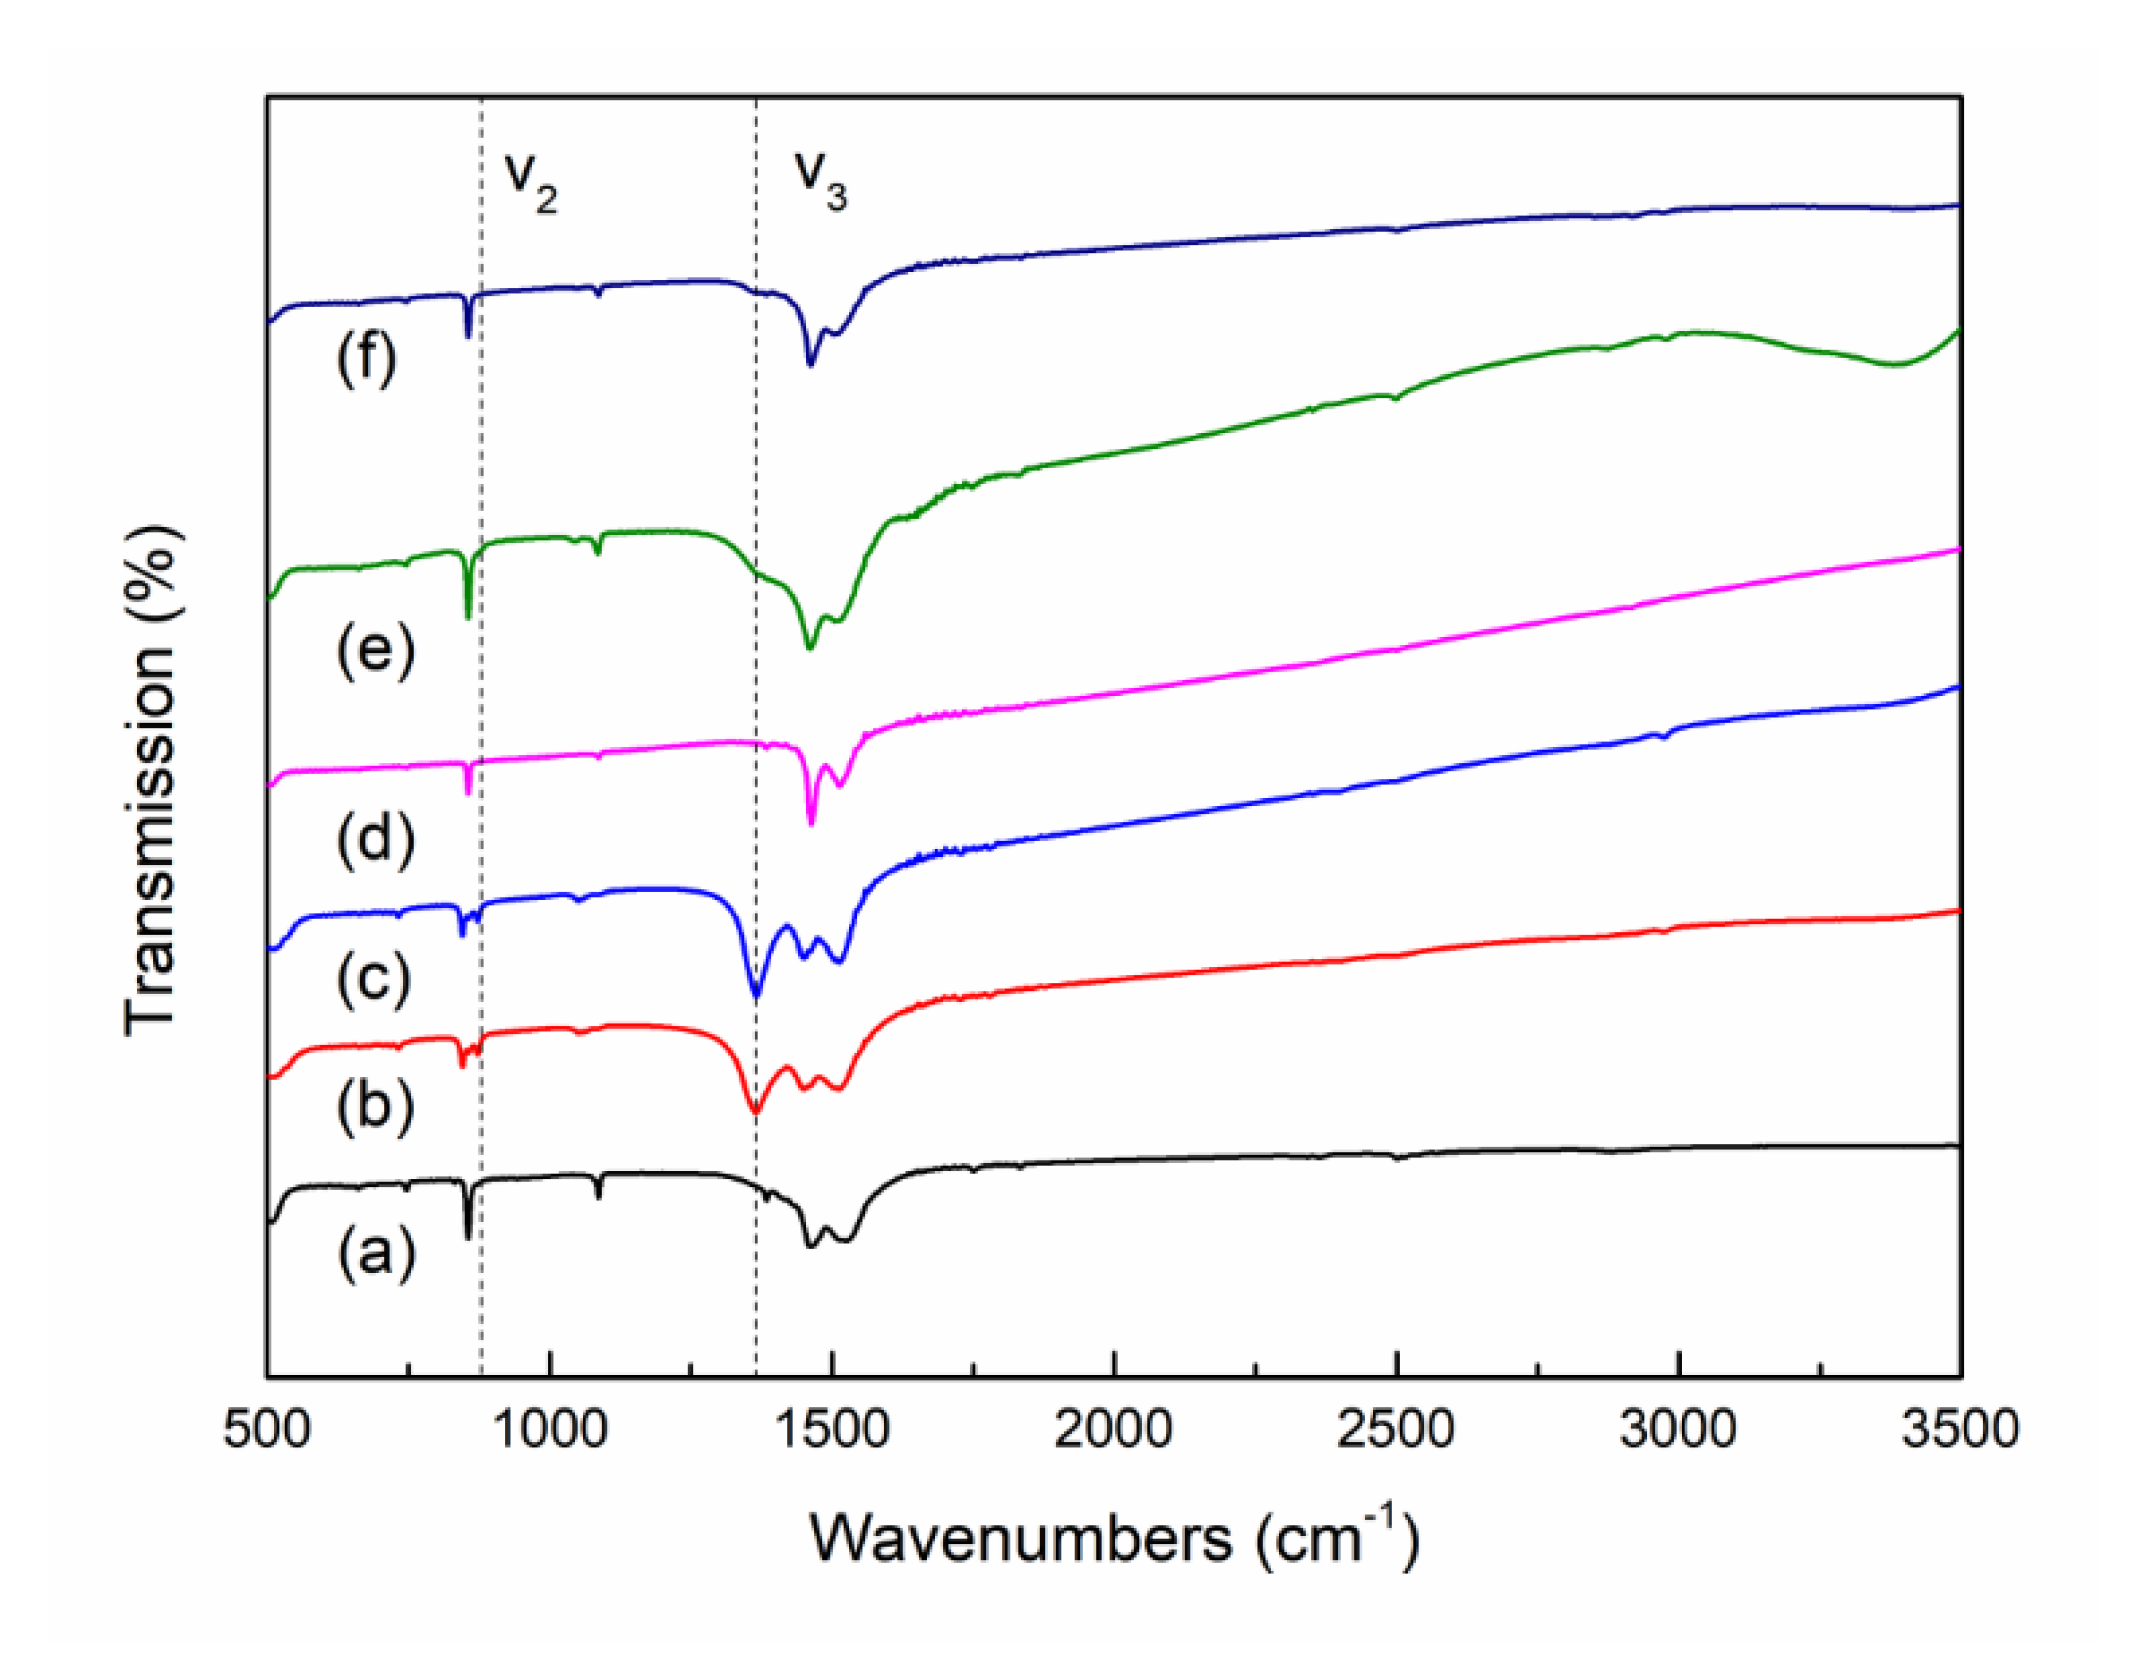
The FT-IR spectra of the PL and HL samples also confirm the formation of each La2O2CO3 crystal phase depending on the preparation methods, as shown in Figure 2. According to the assignments of typical FT-IR bands for carbonates in the La2O2CO3 phases, the bands at 745, 855, 1066, and 1518 cm−1 are interpreted as CO32− vibrations related to the La2O2CO3 phase [4,6,21,27]. The three-fold splitting bands at approximately 845 cm−1 (υ2) and a strong band at 1367 cm−1 (υ3) are assigned to the unique carbonate vibrational mode for the monoclinic type Ia La2O2CO3 phase. The FT-IR spectra in Figure 2b,c of only the PL-12h and PL-24h samples show the characteristic bands (υ2 and υ3) of type-Ia La2O2CO3, whereas the FT-IR spectra of the other samples show the typical bands of the La2O2CO3 phase, which further confirms that the formation of the type Ia and II La2O2CO3 phases depends on the preparation conditions. In the precipitation method, the monoclinic type Ia La2O2CO3 phase is mainly formed when the precipitation time is longer than 12 h, whereas the hydrothermal method produces only the hexagonal type II La2O2CO3 phase. This is consistent with the XRD results in this study.
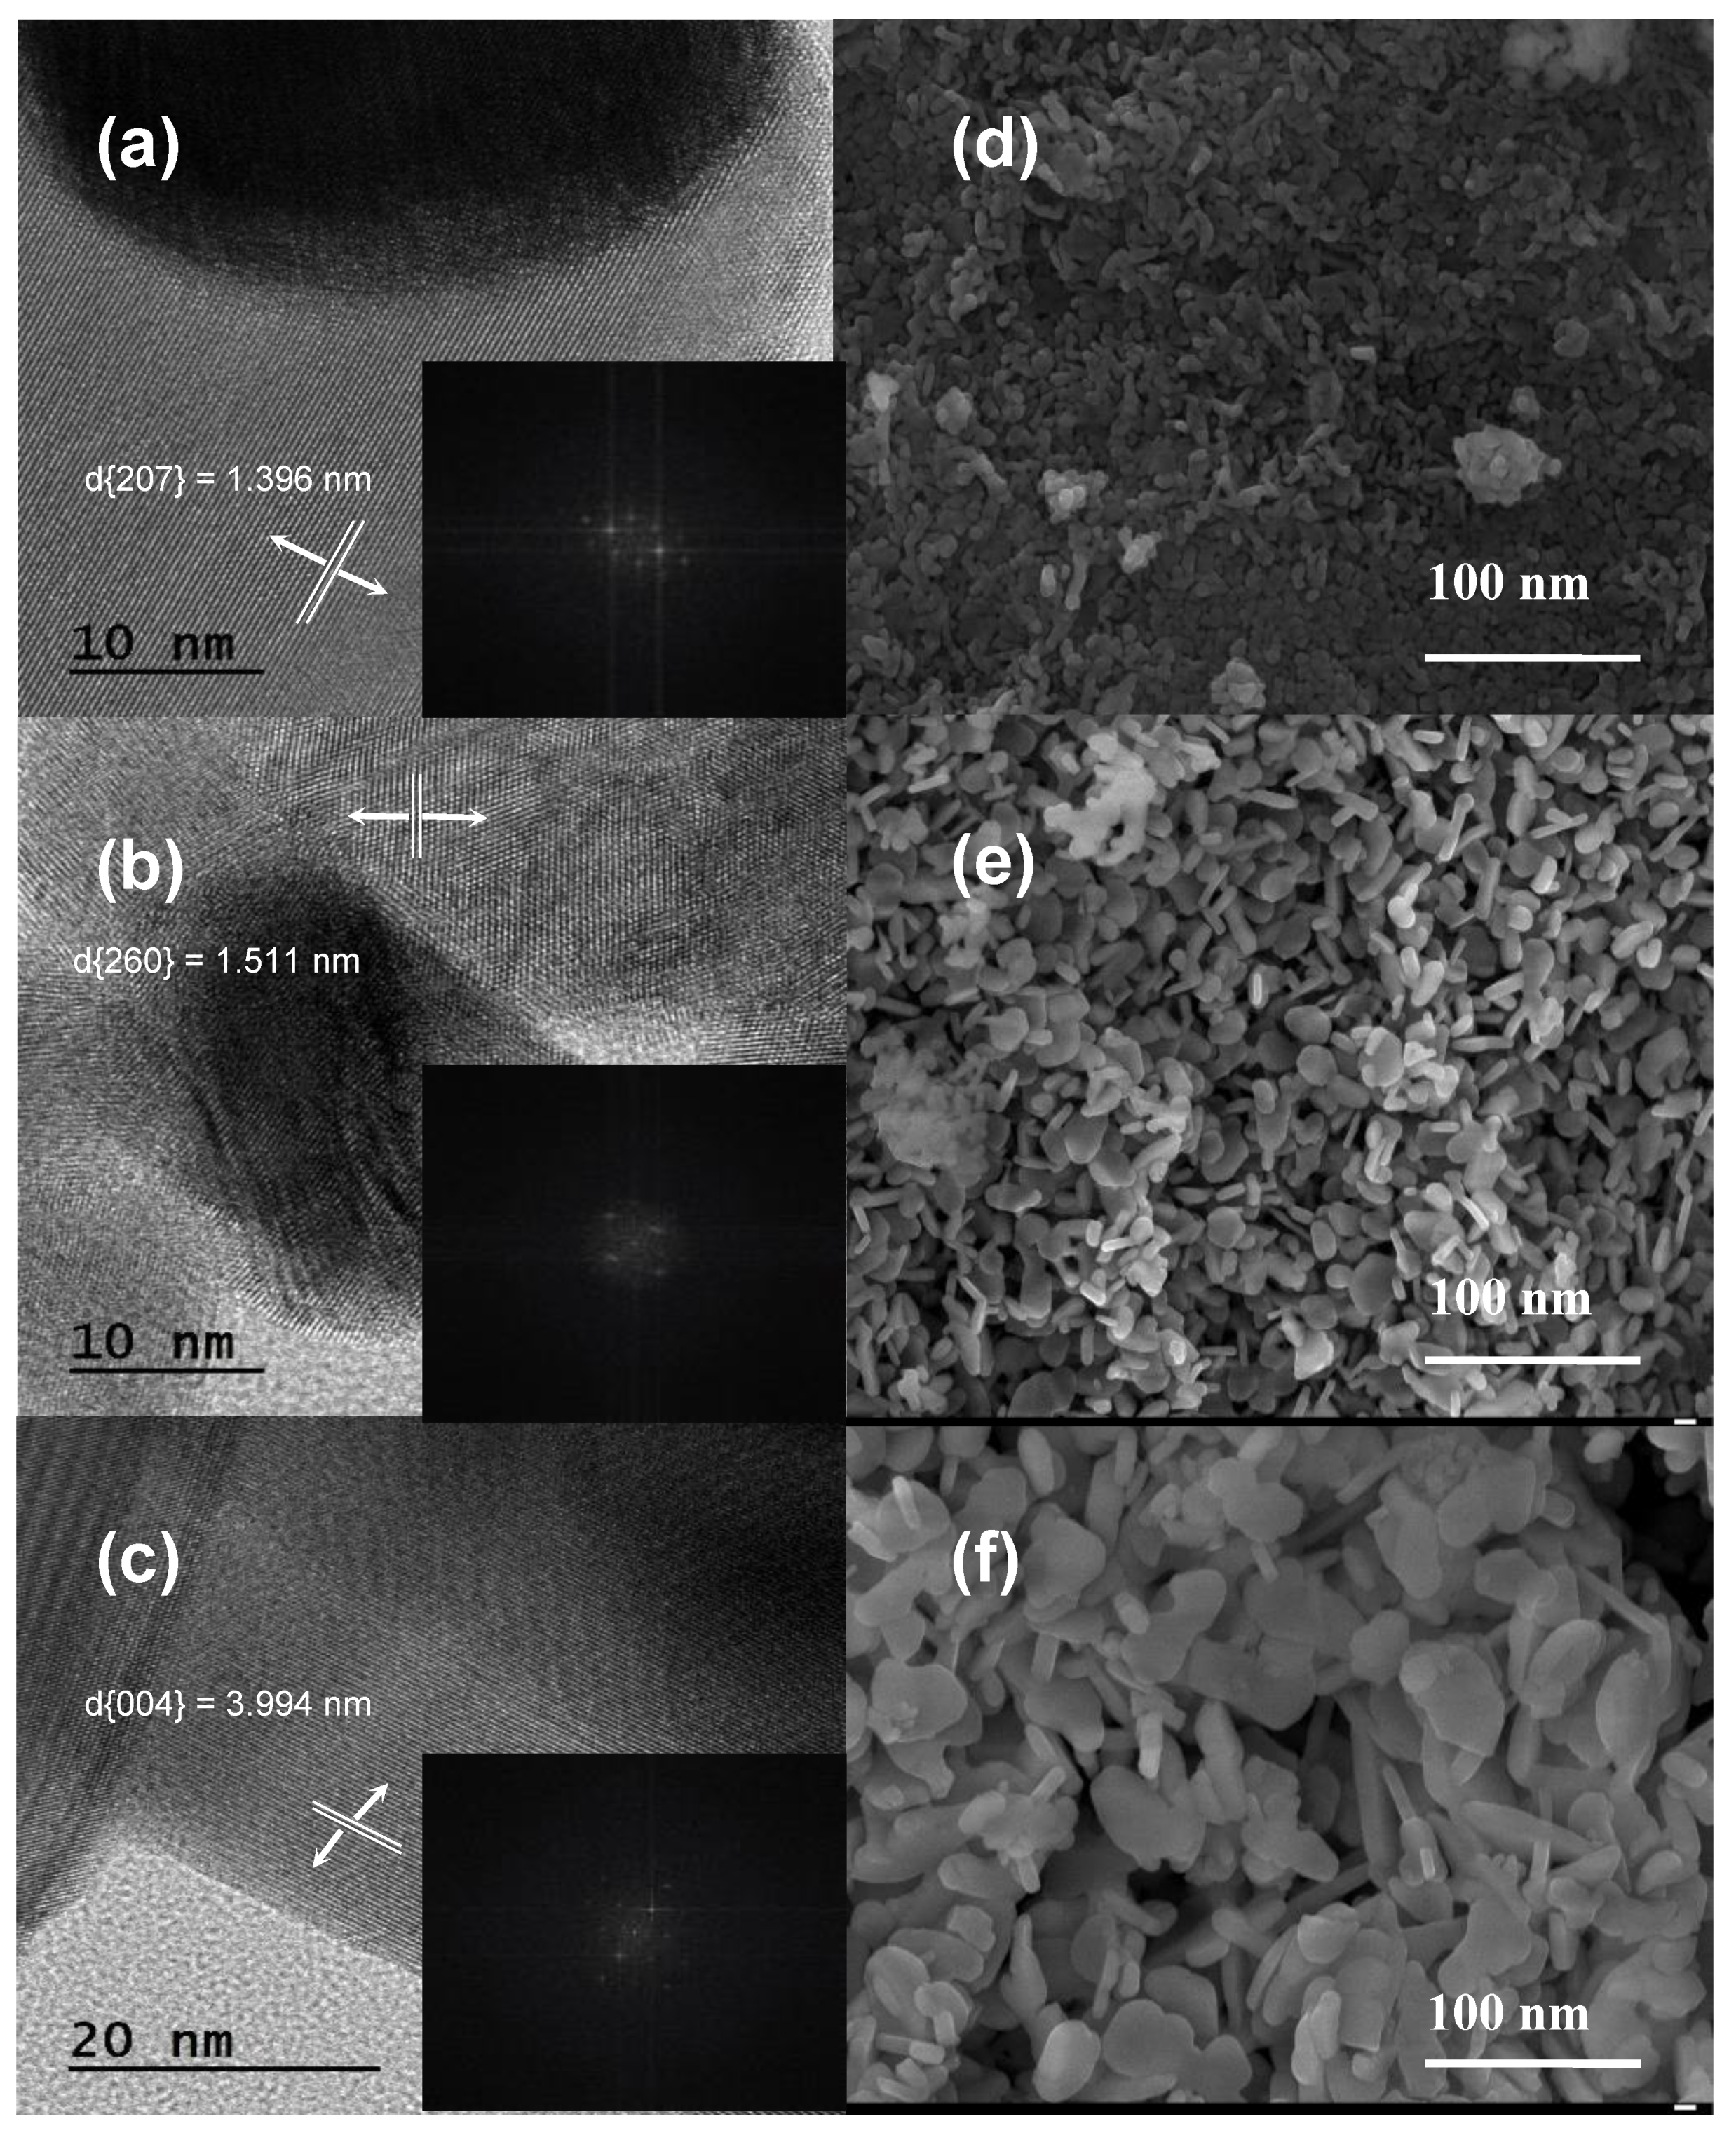
Moreover, TEM measurements also provide additional evidence for the existence of the monoclinic and hexagonal La2O2CO3 phases in the samples. Figure 3a–c shows the TEM images and fast Fourier transform patterns of PL-6h, PL-12h, and HL-12h. The (207) plane of the monoclinic type Ia La2O2CO3 phase is detected in the PL-12h sample, whereas the (260) plane of the hexagonal type II La2O2CO3 phase is observed in the HL-12h sample. Similarly, the PL-6h sample shows the (004) plane of the type II La2O2CO3 phase, which is in good agreement with the XRD and FT-IR data. However, the morphological structures of PL-12h, HL-12h, and PL-6h samples are similar, as shown by the FE-SEM images; the aggregates of nanoparticles have different sizes: smaller than 10 nm for PL-12h, 10–30 nm for HL-12h, and 30–60 nm for PL-6h (Figure 3d–f).
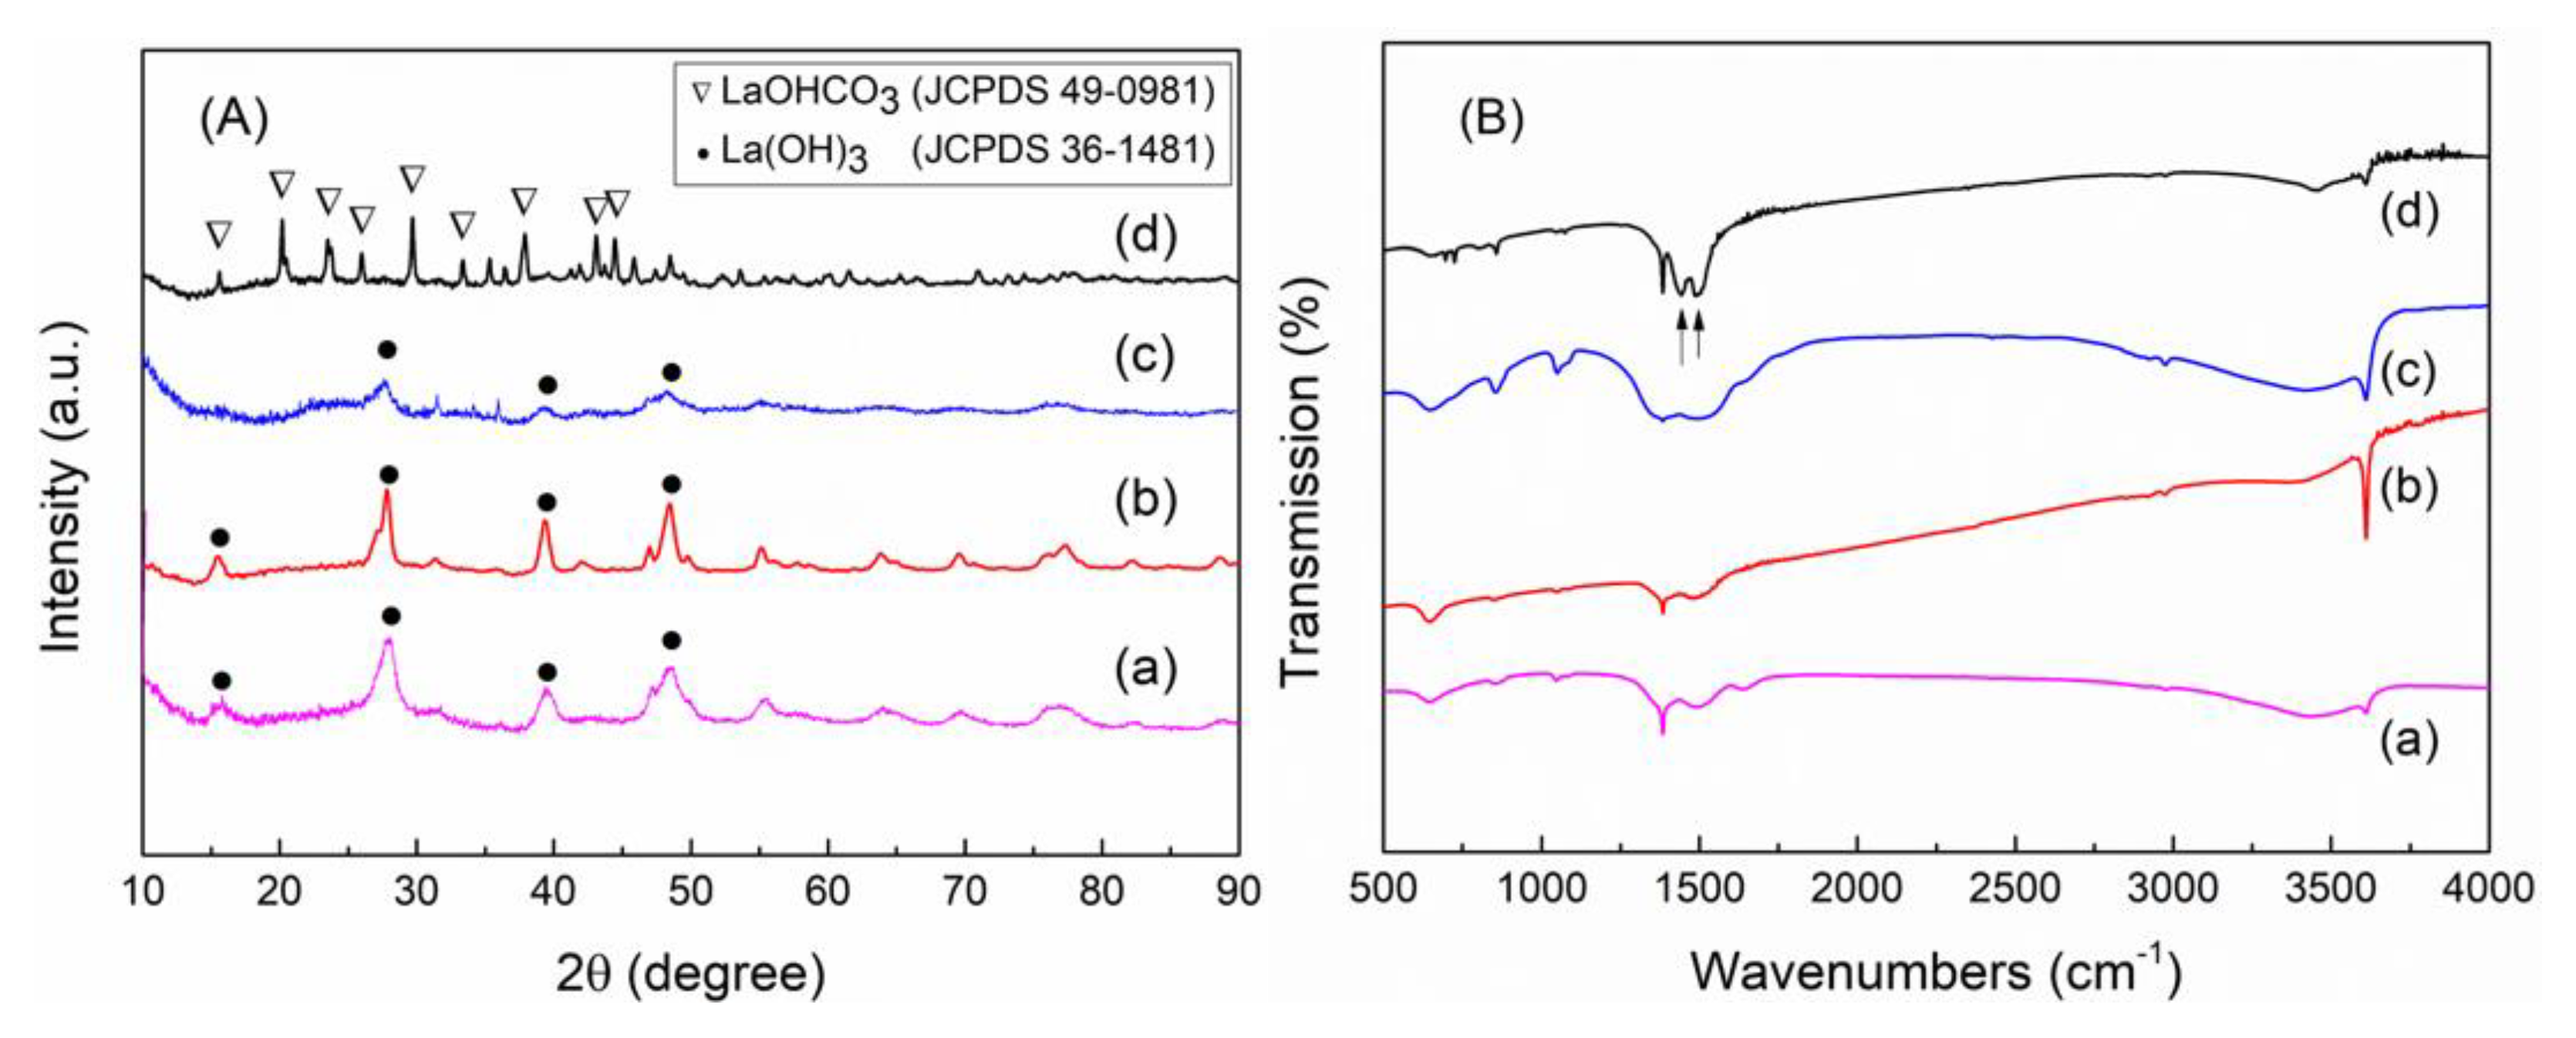
To further understand the formation mechanism of the monoclinic and hexagonal La2O2CO3 phases, uncalcined samples after precipitation or hydrothermal treatment were investigated. The XRD and FT-IR measurements indicate that different chemical products are also produced depending on the preparation conditions (Figure 4). The XRD peaks in Figure 4(Aa–Ac), shown as circles, are indexed to the pure hexagonal phase of La(OH)3 with a P63/m(176) space group (JCPDS 36-1481) [1,6,12,21,26,27,28], which clearly shows that the initial La(OH)3 phase remains unchanged in the hydrothermal method. With an increase in the preparation time during the hydrothermal method, the crystallinity of the La(OH)3 structure becomes stronger with sharper XRD characteristic peaks. Meanwhile, in the precipitation method, the La(OH)3 phase is produced with a very low crystallinity for PL-6h (weak and broad characteristic XRD peaks in Figure 4(Ac)). However, when the precipitation time is increased up to 12 h, the characteristic XRD peaks assigned to the orthorhombic La(OH)CO3 structure (JCPDS 49-0981) appear with the disappearance of the XRD peaks in the La(OH)3 structure (Figure 4(Ad)) [9,29]. Therefore, in the precipitation method, the dominant phase evolves from La(OH)3 to La(OH)CO3, with an increase in the precipitation time. However, the initial La(OH)3 phase in the hydrothermal method is more crystallized during the hydrothermal treatment.
The FT-IR spectra of the uncalcined samples are monitored to confirm the existence of La(OH)3 and La(OH)CO3. First, the strong bands at 1438 and 1491 cm−1 shown in Figure 4(Bd) can be assigned to the bending vibrations of CO32−, which confirms the presence of carbonate species in the intermediate [9]. A band at 3616 cm−1 and a broad band at 3410 cm−1 represent the O–H stretching mode in La–OH [6,9,27]. The bands at 850 and 1052 cm−1 correspond to the vibrational modes of carbon-related bonds, such as CH and CO, which remain before the calcination step. Thus, the FT-IR spectrum in Figure 4(Bd) clearly confirms the existence of La(OH)CO3 as an intermediate in the PL-12h sample, which is consistent with the XRD data shown in Figure 4A. For La(OH)3, the characteristic FT-IR bands for the O–H stretching and bending modes in La–OH are clearly observed at 3616, 3410, and 1640 cm−1, as shown in Figure 4(Ba–Bc) [6,9,27]. Other bands at approximately 2800–3000, 850, and 1052 cm−1 can also be assigned to the vibrational modes of carbon-related bonds. Interestingly, for the samples in the precipitation method, the characteristic IR bands for CO32− at approximately 1350–1500 cm−1 become sharp and strong with an increase in the reaction time (Figure 4(Bc,Bd)), whereas the characteristic IR band for OH at 3616 cm−1 is strongly intensified during the hydrothermal method (Figure 4(Ba,Bb)). Therefore, the precipitation method induces the transformation from La(OH)3 into La(OH)CO3 through the reaction with CO2. In the hydrothermal method, the crystallization of La(OH)3 goes further, which results in the high crystallinity of La(OH)3.
A critical difference between the two preparations is an open or closed reaction system, which is related to the supply of carbonate sources. For either the precipitation or hydrothermal method, the La precursor in the aqueous solution is dissociated into La cations and is then readily crystallized into the La(OH)3 phase, because the initial pH conditions are strongly basic (i.e., pH = 12). In the hydrothermal method, a Teflon-lined autoclave reactor is used as a closed reaction system. Because it is a closed system, there is no further transformation of the La intermediate, which only results in the strong crystallization of the La(OH)3 phase for the HL-12h and HL-24h samples. However, in the precipitation method, the precipitation is carried out in an open beaker; thus, the carbonate source (i.e., CO2 from the air) can be continuously dissolved into the aqueous solution. Therefore, the initial phase, La(OH)3, can be converted into the La(OH)CO3 phase by the reaction with CO2 at a time longer than 12 h, even though the 6-h precipitation produces only a weakly crystallized La(OH)3. Under the continuous CO2 supply condition, there is a transformation from La(OH)3 into La(OH)CO3. In the literature, it was reported that La(OH)3 changed into an La carbonate when it was exposed to air [6,27,28]. More importantly, the La(OH)CO3 phase is finally converted into the monoclinic type Ia La2O2CO3 phase in the precipitation, while La(OH)3 is transformed into the hexagonal type II structure in the hydrothermal method. The sufficient supply of CO2 into the aqueous solution produces the La(OH)CO3 that can be changed into the monoclinic La2O2CO3 phase.
3.2. CO2 Behavior on La2O2CO3 Nanoparticles
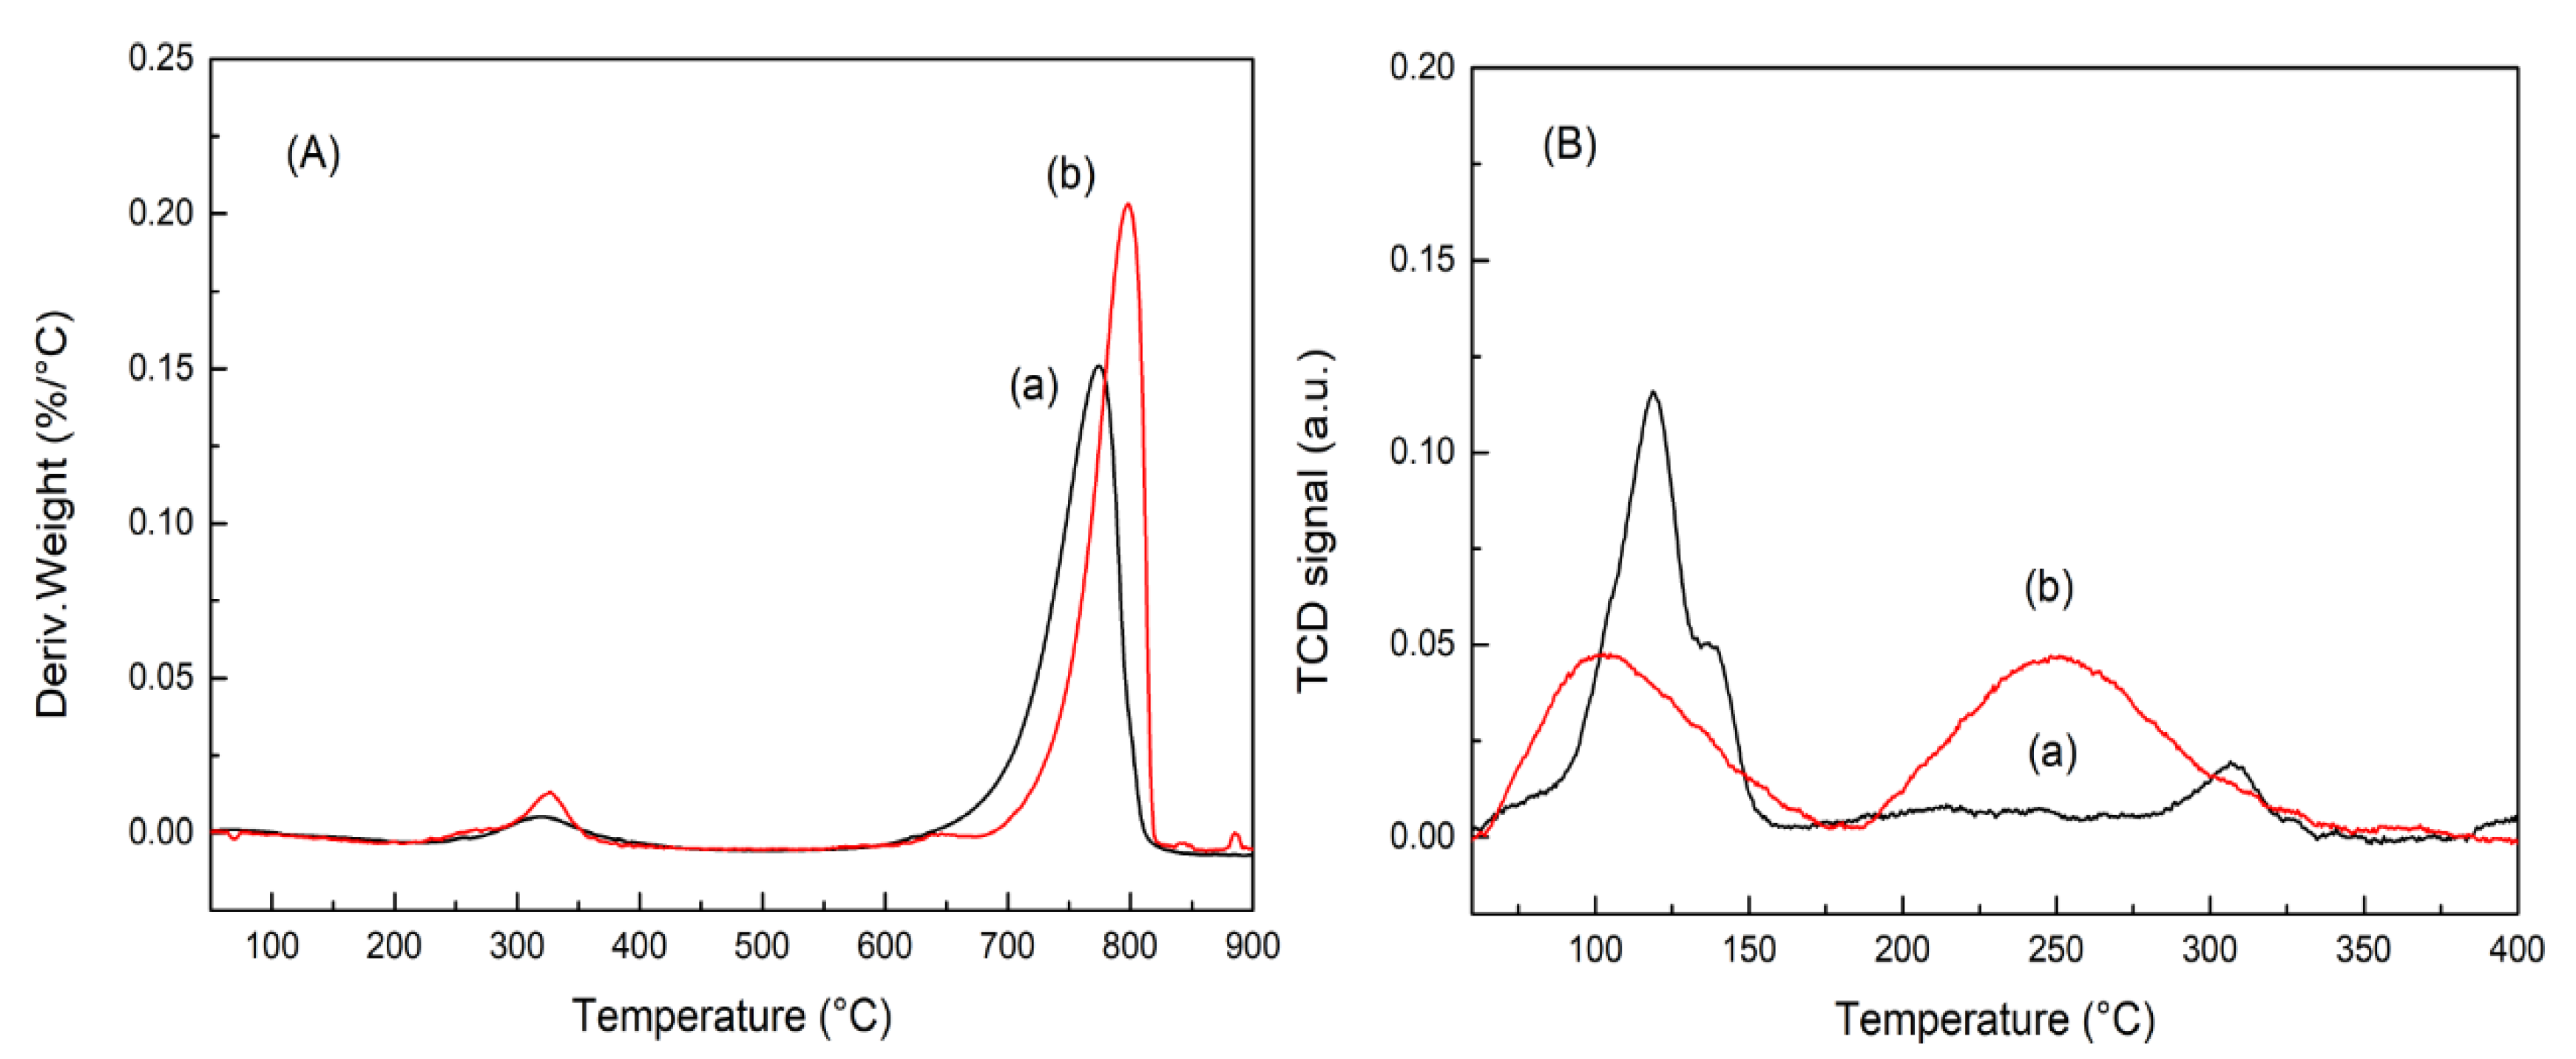
To investigate the CO2 behavior on each La2O2CO3 phase, TGA, CO2-TPD and CV of CO2 electrochemical reduction for PL-12h (monoclinic type Ia La2O2CO3 phase) and HL-12h (hexagonal type II La2O2CO3 phase) were conducted in this study. Figure 5A shows the derivative TGA (DTGA) profiles of PL-12h and HL-12h, where the decomposition peaks correspond to CO2 gases that leave from the La2O2CO3 phases. The weight loss due to the thermal decomposition occurs at 326 °C and in the temperature range of 770–800 °C. According to previous studies [4,30], the CO2 peak, which appears during the decomposition of La2O2CO3 above 600 °C, can be assigned to CO2 gases leaving from the bulk structure of the La2O2CO3 phases, which is then transformed into the La2O3 phase. The CO2 decomposition from the bulk structure of the hexagonal La2O2CO3 phase occurs at approximately 800 °C, which is higher than the temperature of CO2 production during the decomposition of the bulk structure of the monoclinic La2O2CO3 phase. This result shows that the thermal stability of the hexagonal La2O2CO3 phase is higher than that of the monoclinic phase [21]. The weight loss at approximately 326 °C is assumed to be due to the release of CO2 gas that is adsorbed on the surface of the La2O2CO3 phase. The decomposition peak at approximately 326 °C has a much smaller intensity than that at 650 °C, which indicates that a much lower amount of CO2 is adsorbed onto the surfaces of the La2O2CO3 phase than that released from the bulk structure. Furthermore, based on each peak’s intensity, shown in Figure 5A, the hexagonal type II La2O2CO3 phase contains more CO2 on the surface than that on the monoclinic type Ia phase.
To better understand the CO2 adsorption ability on the surface of each La2O2CO3 phase, the CO2-TPD profiles of PL-12h and HL-12h were acquired. Before conducting the CO2-TPD experiments, both samples were thermally treated at 600 °C for 1 h in He gas, and then CO2 was introduced into the reactor at 50 °C to perform the CO2 adsorption. Therefore, CO2 can be assumed to adsorb on the surface of La2O2CO3 phases and then desorb from the adsorption surface sites, which demonstrates the CO2 adsorption behavior on the monoclinic and hexagonal La2O2CO3 phases. In Figure 5B, the CO2 desorption peaks can be approximately categorized into three types. The peak at approximately 100 °C is related to a weak basic site, and the peaks in the range of 200–400 °C correspond to medium and strong basic sites [2,12,31,32]. The CO2 adsorption modes on each basic site have been studied by a combination of FT-IR spectroscopy and CO2-TPD measurements [31,32]. Manoilova et al. [30] investigated the CO2 adsorption onto La2O3 by IR spectroscopy, TPD, and DFT calculations. The DFT calculation for the CO2 adsorption on La2O3 predicted that CO2 gas adsorbed on the surface in the form of polydentate and monodentate species as a starting structure, and then La2O3 made a stable connection with polydentate and asymmetric CO2 adsorptions at the saturated coverage. The CO2 desorption peak at approximately 290 °C in the CO2-TPD profile of LaOCl was assigned to the decomposition of coupled bridged CO2 adsorbate species [31]. On the basis of the results from the FT-IR and CO2-TPD measurements of Mg–Al basic oxides, Di Cosimo et al. [32] suggested that the three types of CO2 adsorption modes (e.g., bicarbonate, bidentate carbonate, and unidentate carbonate) were low-strength, medium-strength, and high-strength basic sites, respectively. It was determined that bidentate and unidentate carbonates remained on the surface at approximately 300 °C; only unidentate carbonate was detected at 350 °C [32]. Therefore, in this study, the peak at 110 °C, peaks at approximately 240 °C, and shoulders at approximately 310 °C can be assigned to the desorption of CO2 species adsorbed on weak, medium and strong basic sites, respectively. Figure 5B and Table 1 shows that the HL-12h sample has a higher combined intensity of medium and strong basic sites than PL-12h, which suggests that the hexagonal type II La2O2CO3 phase provides more CO2 adsorption sites on the surface. This observation is in good agreement with the TGA results shown in Figure 5A.
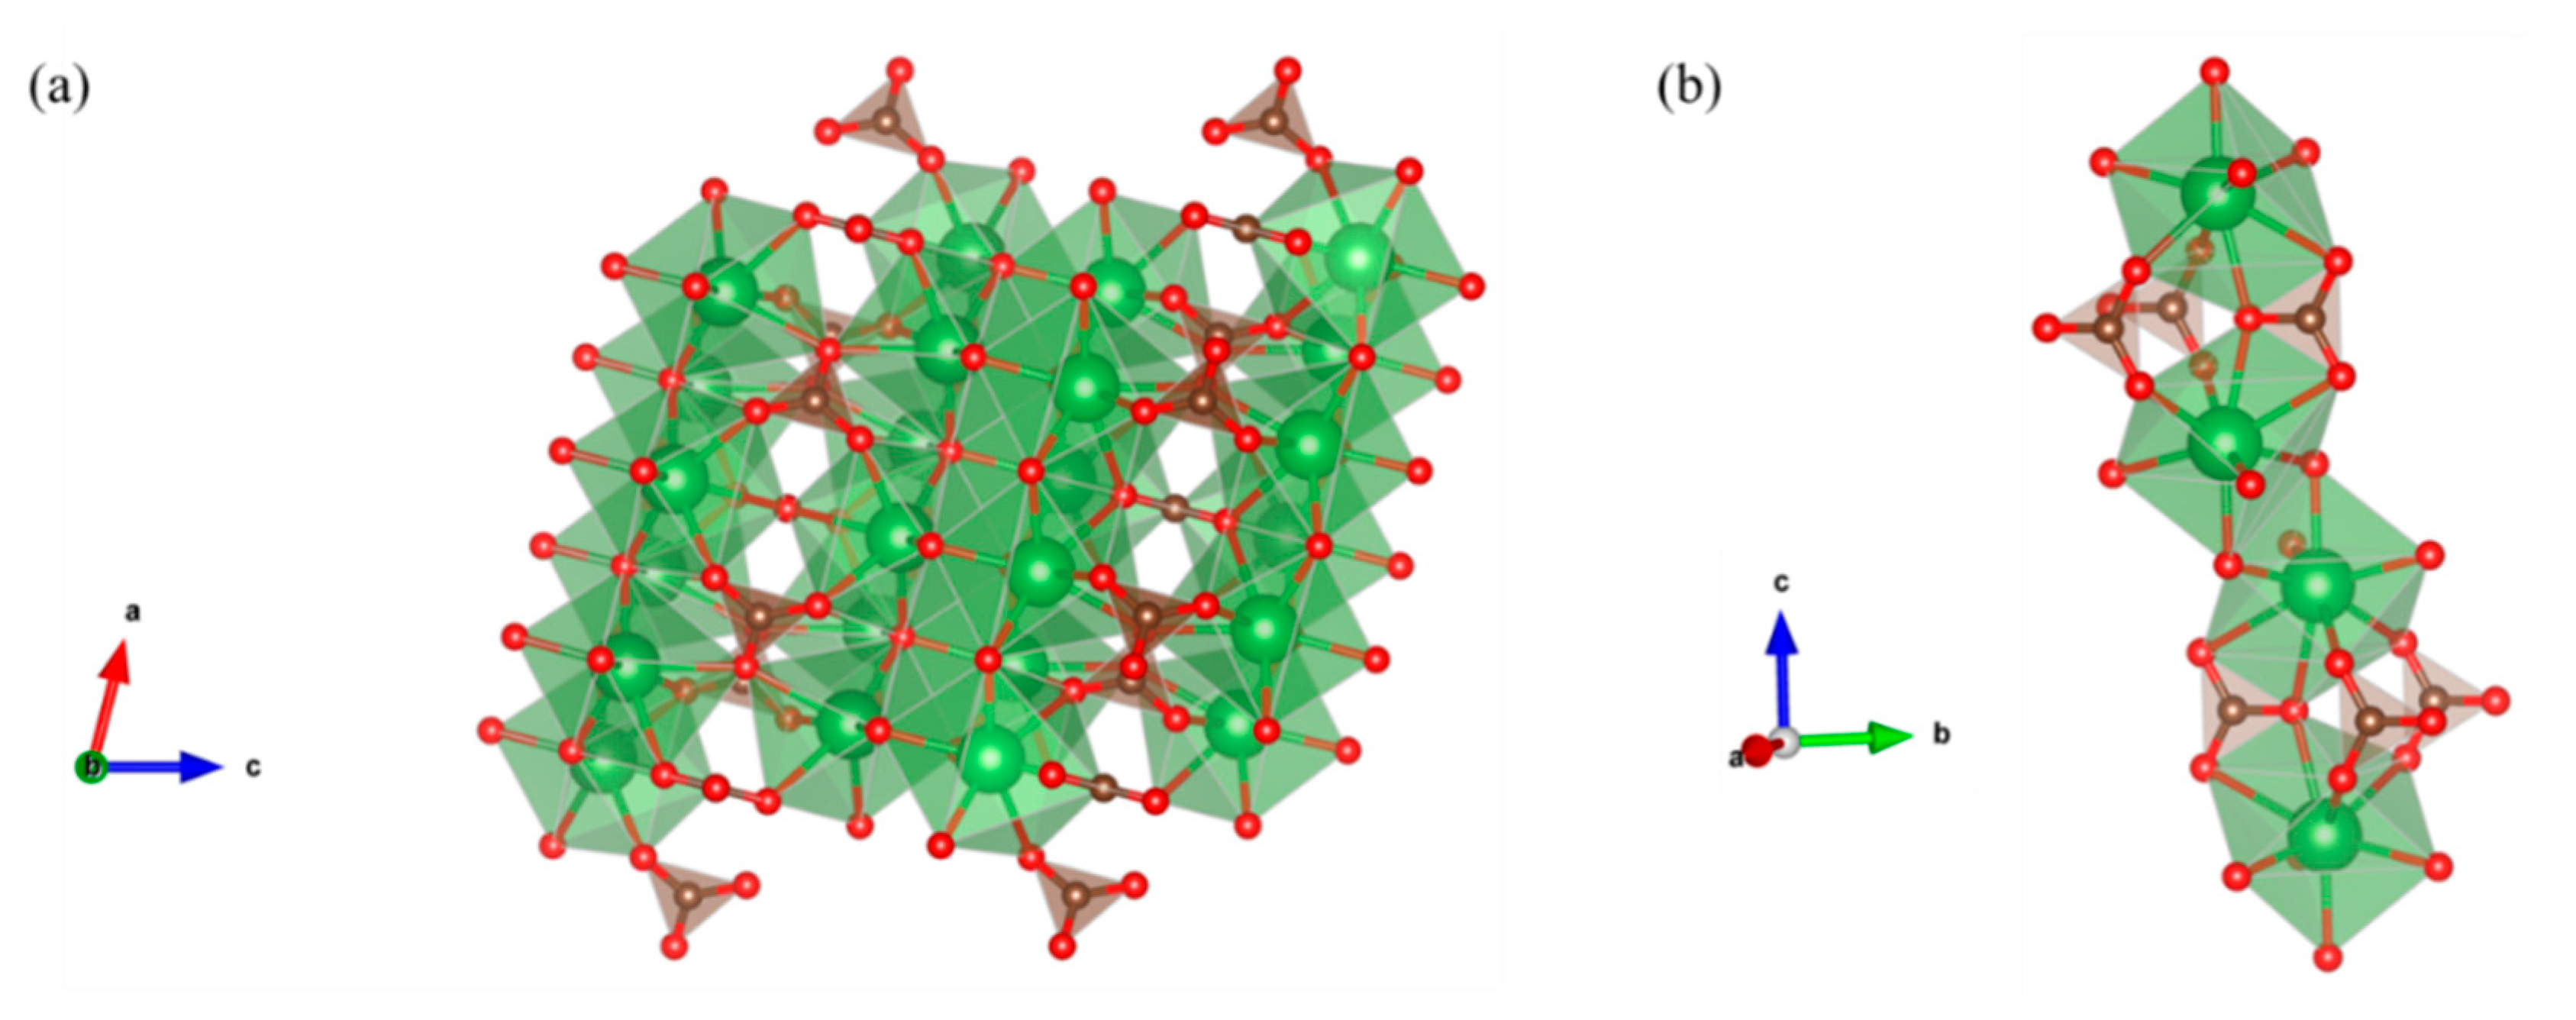
A DFT calculation was performed to optimize the bulk structures of both La2O2CO3 phases (Figure 6). The lattice constant of La2O2CO3 in the disordered hexagonal structure was predicted by considering the ratio (c/a) of lattice parameters (a and c) of the hexagonal structure [33]. Our DFT calculated lattice constants of La2O2CO3 nanoparticles in both monoclinic and hexagonal structures, similar to the available experimental data from the literature, which are shown in Table 2 [34,35]. On the basis of the DFT calculation, we can optimize the hexagonal type II and monoclinic type Ia La2O2CO3 nanopartilces, as shown in Figure 7. From the optimized structure of each phase, the La atom is determined to have seven and eight oxygen atoms as nearest neighbors in monoclinic and hexagonal structures, respectively. The eight coordination numbers of the La atom in the hexagonal type II La2O2CO3 nanoparticles can produce stronger bonding with carbonate species, which results in the higher stability of the hexagonal type II structure compared to that of the monoclinic type Ia La2O2CO3.
3.3. CO2 Electrochemical Reduction
Figure 8 shows LSV curves ranging from 0 to −0.6 V vs. Ag/AgCl for PL-12h and HL-12h in CO2-saturated 0.1 M NaHCO3 electrolyte. HL-12h exhibits a maximum total current density of −25.2 mA/cm2 at −1.26 V vs. Ag/AgCl ,whereas a maximum current density of −17.97 mA/cm2 for PL-12h is achieved at −1.438 V vs. Ag/AgCl. In addition, HL-12h shows a more positive onset potential toward CO2 electrochemical reduction than PL-12h in Figure 8. Both the higher current density and more positive onset potential apparently indicate a higher activity toward the CO2 electrochemical reduction in HL-12h compared to that of PL-12h.
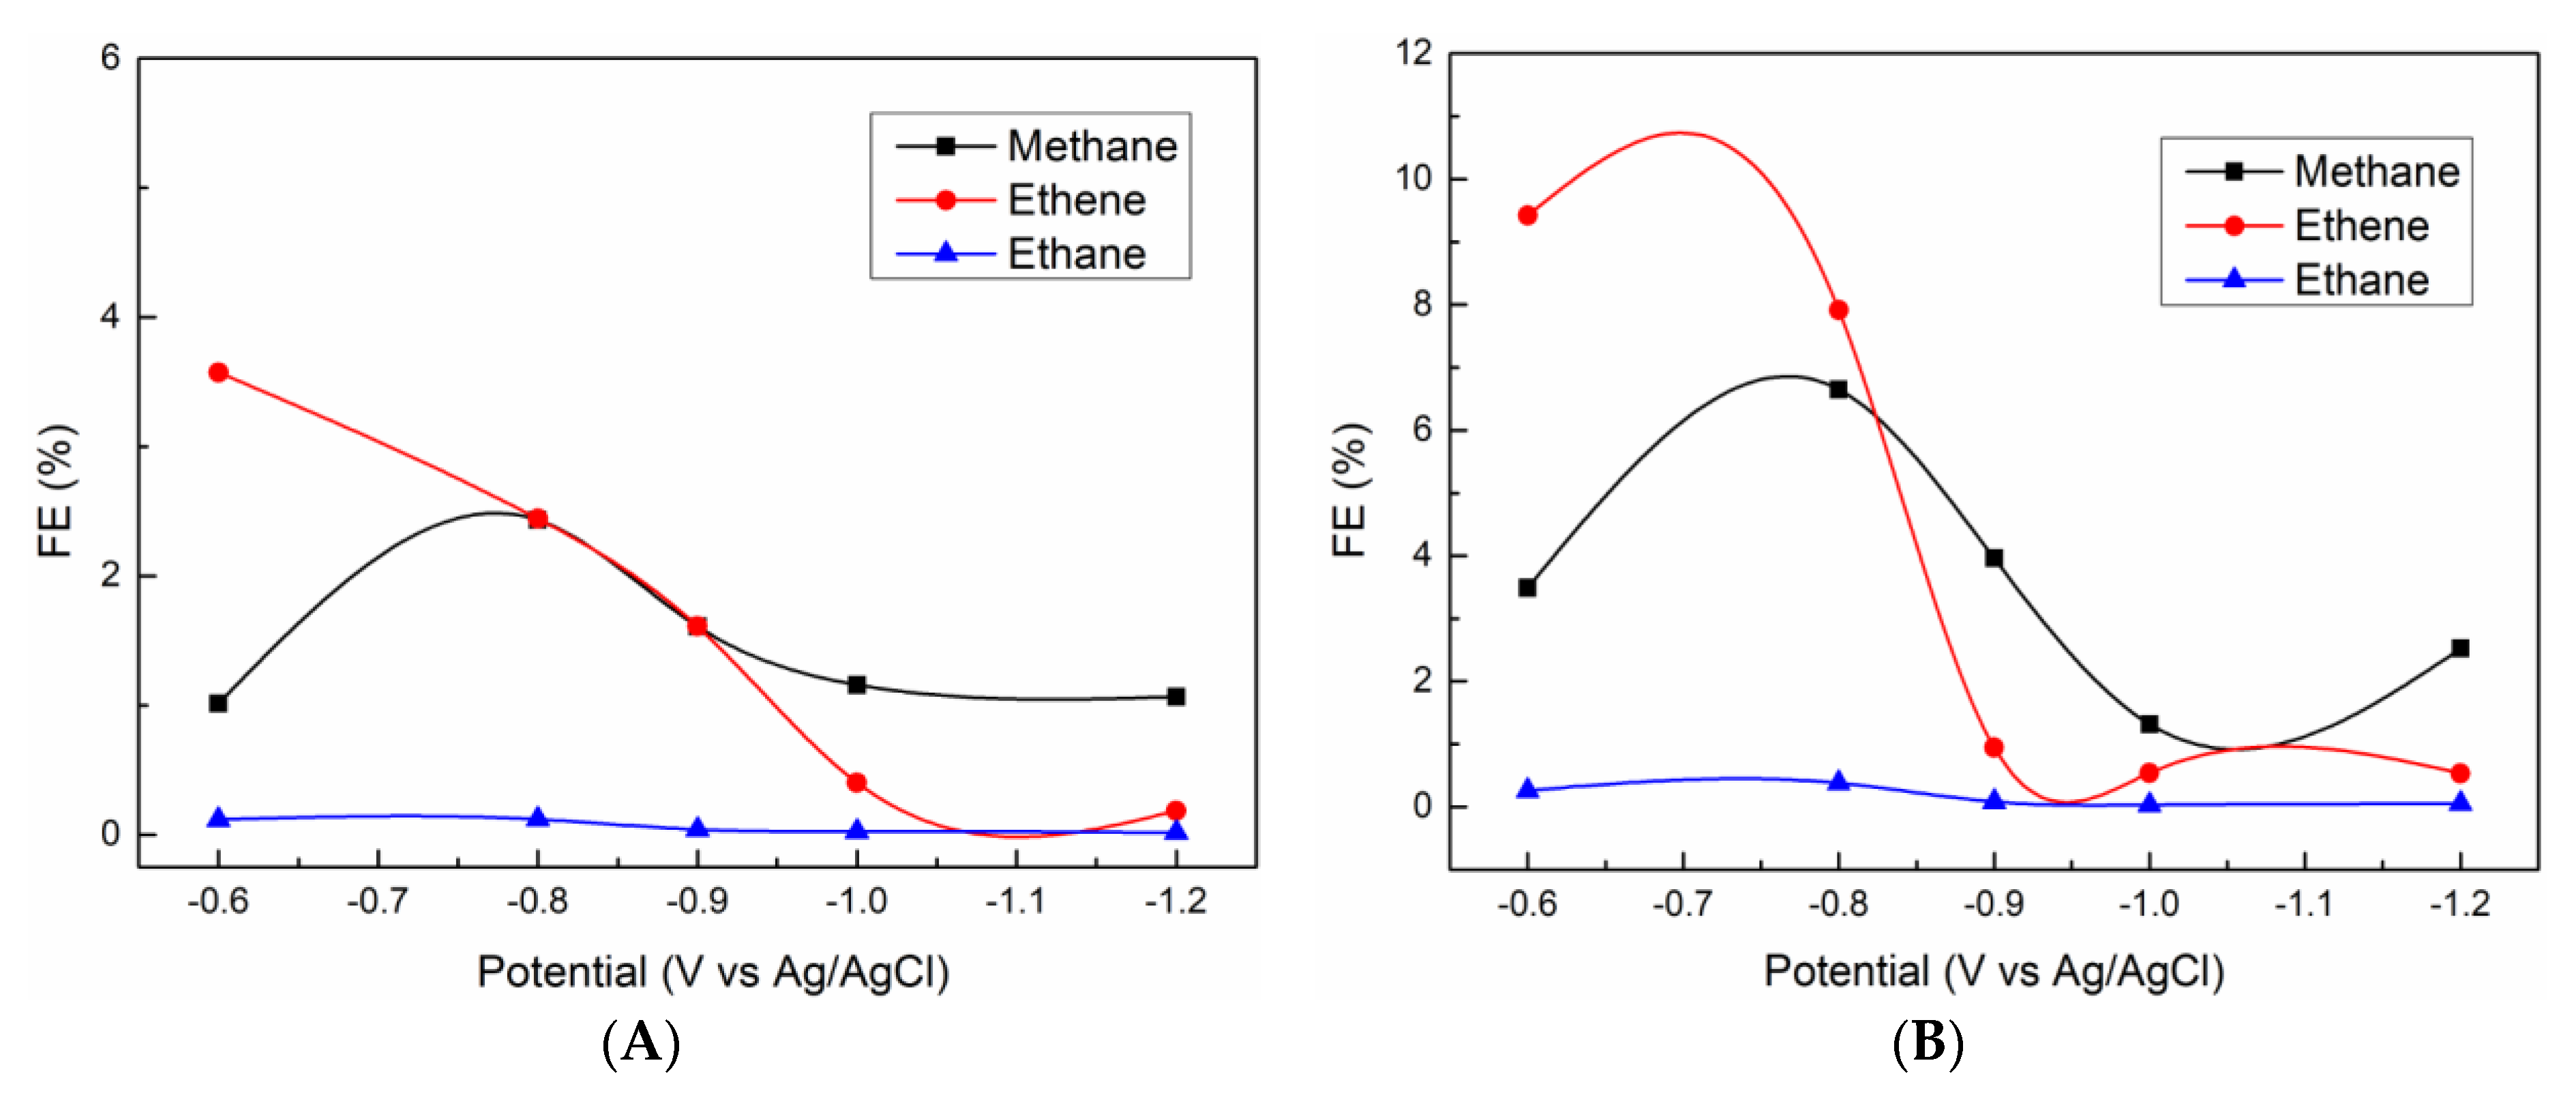
The chronoamperometry (CA) experiments were performed at different potentials for each 10 min, and gaseous products were determined by GC. For both PL-12h and HL-12h, the main gaseous products are CH4, C2H4, C2H6 and H2. Figure 9 shows the Faraday efficiency (FE) of carbon-containing products for PL-12h and HL-12h, resulting in a much higher FE for HL-12h than those for PL-12h. C2H4 is a dominant carbonaceous product at lower potential. A maximum of the ethene FE (9.4%) for HL-12h is achieved at −0.6 V (vs Ag/AgCl), while that for PL-12h is lower than 5%. Interestingly, CO gas was not detected in the potential range, even for the two La2O2CO3 samples. This indicates that La2O2CO3 catalysts are efficient for C-C coupling rather than desorption to form CO gas, since CO is an intermediate for CO2 transformation to ethene during CO2 reduction [36]. The superior electrocatalytic activity of HL-12h to PL-12h would result from the better CO2 adsorption ability which can optimize the first step involving electron and proton transfer to form a *COOH intermediate, which is then converted to other carbonaceous products [37]. The higher electronegativity of hexagonal La2O2CO3 of HL-12h leads to the better CO2 adsorption ability [38].
4. Conclusions
In this study, La2O2CO3 nanoparticles with hexagonal and monoclinic phases were prepared by different preparation methods, and the CO2 behavior on each crystalline structure was investigated by CO2-TPD, TGA measurements, and CO2 electrochemical reduction. The hydrothermal method produced the hexagonal type II La2O2CO3 phase, whereas the monoclinic type Ia phase was synthesized by the precipitation method (PL-12h and PL-24h). The initial La(OH)3 phase was transformed into the La(OH)CO3 phase by the reaction with CO2 supplied from air in the precipitation method. The hexagonal La2O2CO3 phase showed a higher CO2 adsorption ability on the surface and a higher stability in the bulk structure than the monoclinic phase, owing to the differences in optimized crystalline structures predicted by the DFT calculation. Consequently, the hexagonal La2O2CO3 phase of HL-12h had a higher current density and a more positive onset potential than the monoclinic La2O2CO3 of PL-12h in CO2 electrochemical reduction.
Author Contributions
H.Y. performed the experiments and wrote the paper; K.J., S.G.K. and Y.M. contributed data analysis; E.W.S. supervised the work and polished the paper. All authors have read and agreed to the published version of the manuscript.
Funding
This research was supported by the National Research Foundation of Korea (NRF) grant funded by the Korea government (MSIT) (No. 2018R1A2B6004219 and No. 2020R1A4A4079954).
Conflicts of Interest
The authors declare no conflict of interest.
References
- Ding, D.; Lu, W.; Xiong, Y.; Pan, X.; Zhang, J.; Ling, C.; Du, Y.; Xue, Q. Facile synthesis of La2O2CO3 nanoparticle films and its CO2 sensing properties and mechanisms. Appl. Surf. Sci. 2017, 426, 725–733. [Google Scholar] [CrossRef]
- Wang, F.; Zhang, Z.; Wei, X.; Fang, Q.; Jiang, X. The shape effect of La2O2CO3 in Pd/La2O2CO3 catalyst for selective hydrogenation of cinnamaldehyde. Appl. Catal. A Gen. 2017, 543, 196–200. [Google Scholar] [CrossRef]
- Li, X.; Li, D.; Tian, H.; Zeng, L.; Zhao, J.W.; Gong, J. Dry reforming of methane over Ni/La2O3 nanorod catalysts with stabilized Ni nanoparticles. Appl. Catal. B Environ. 2017, 202, 683–694. [Google Scholar] [CrossRef]
- Park, C.Y.; Nguyen, P.H.; Shin, E.W. Glycerol carbonation with CO2 and La2O2CO3/ZnO catalysts prepared by two different methods: Preferred reaction route depending on crystalline structure. Mol. Catal. 2017, 435, 99–109. [Google Scholar] [CrossRef]
- Bosch, C.E.; Copley, M.P.; Eralp, T.; Bilbé, E.; Thybaut, J.W.; Marin, G.B.; Collier, P. Tailoring the physical and catalytic properties of lanthanum oxycarbonate nanoparticles. Appl. Catal. A Gen. 2017, 536, 104–112. [Google Scholar] [CrossRef]
- Mu, Q.; Wang, Y. Synthesis, characterization, shape-preserved transformation, and optical properties of La(OH)3, La2O2CO3, and La2O3 nanorods. J. Alloys Compd. 2011, 509, 396–401. [Google Scholar] [CrossRef]
- Sun, C.; Sun, J.; Xiao, G.; Zhang, H.; Qiu, X.; Li, H.; Chen, L. Mesoscale organization of nearly monodisperse flowerlike ceria microspheres. J. Phys. Chem. B 2006, 110, 13445–13452. [Google Scholar] [CrossRef] [PubMed]
- Yi, G.; Lu, H.; Zhao, S.; Ge, Y.; Yang, W. Synthesis, characterization, and biological application of size-controlled nanocrystalline NaYF 4: Yb, Er phosphors. Nano Lett. 2004, 4, 2191–2196. [Google Scholar] [CrossRef]
- Li, G.; Peng, C.; Zhang, C.; Xu, Z.; Shang, M.; Yang, D.; Kang, X.; Wang, W.; Li, C.; Cheng, Z.; et al. Eu3+/Tb3+-Doped La2O2CO3/La2O3 nano/microcrystals with multiform morphologies: Facile synthesis, growth mechanism, and luminescence properties. Inorg. Chem. 2010, 49, 10522–10535. [Google Scholar] [CrossRef]
- Lin, J. Multiform oxide optical materials via the versatile pechini-type sol-gel process. Proc. Int. Meet. Inf. Disp. 2008, 8, 1247–1250. [Google Scholar] [CrossRef]
- Van Le, T.; Che, M.; Kermarec, M.; Louis, C.; Tatibouët, J.M. Structure sensitivity of the catalytic oxidative coupling of methane on lanthanum oxide. Catal. Lett. 1990, 6, 395–400. [Google Scholar] [CrossRef]
- Wang, F.; Ta, N.; Li, Y.; Shen, W. La(OH)3 and La2O2CO3 nanorod catalysts for Claisen-Schmidt condensation. Chin. J. Catal. 2014, 35, 437–443. [Google Scholar] [CrossRef]
- Lacombe, S.; Geantet, C.; Mirodatos, C. Oxidative coupling of methane over lanthana catalysts. I. Identification and role of specific active-sites. J. Catal. 1995, 151, 439–452. [Google Scholar] [CrossRef]
- Chen, H.; Yu, H.; Peng, F.; Wang, H.; Yang, J.; Pan, M. Efficient and stable oxidative steam reforming of ethanol for hydrogen production: Effect of in situ dispersion of Ir over Ir/La2O3. J. Catal. 2010, 269, 281–290. [Google Scholar] [CrossRef]
- Wang, H.; Fang, Y.; Liu, Y.; Bai, X. Perovskite LaFeO3 supported bi-metal catalyst for syngas methanation. J. Nat. Gas Chem. 2012, 21, 745–752. [Google Scholar] [CrossRef]
- Turcotte, R.P.; Sawyer, J.O.; Eyring, L. On the rare earth dioxymonocarbonates and their decomposition. Inorg. Chem. 1969, 8, 238–246. [Google Scholar] [CrossRef]
- Olafscn, A.; Fjcllvåg, H. Synthesis of rare earth oxide carbonates and thermal stability of Nd2O2CO3 II. J. Mater. Chem. 1999, 9, 2697–2702. [Google Scholar] [CrossRef]
- Hirsch, O.; Kvashnina, K.O.; Luo, L.; Süess, M.J.; Glatzel, P.; Koziej, D. High-energy resolution X-ray absorption and emission spectroscopy reveals insight into unique selectivity of La-based nanoparticles for CO2. Proc. Natl. Acad. Sci. USA 2015, 112, 15803–15808. [Google Scholar] [CrossRef] [Green Version]
- Hölsä, J.; Turkki, T. Preparation, thermal stability and luminescence properties of selected rare earth oxycarbonates. Thermochim. Acta 1991, 190, 335–343. [Google Scholar] [CrossRef]
- Koyabu, K.; Masui, T.; Tamura, S.; Imanaka, N. Synthesis of a new phosphor based on rare earth oxycarbonate. J. Alloys Compd. 2006, 408–412, 867–870. [Google Scholar] [CrossRef]
- Yu, H.; Men, Y.; Shin, E.W. Structural properties of disordered macroporous La2O2CO3/ZnO materials prepared by a solution combustion method. Korean J. Chem. Eng. 2019, 36, 522–528. [Google Scholar] [CrossRef]
- Kresse, G.; Furthmüller, J. Efficient iterative schemes for ab initio total-energy calculations using a plane-wave basis set. Phys. Rev. B 1996, 54, 11169–11186. [Google Scholar] [CrossRef] [PubMed]
- Kresse, G.; Furthmüller, J. Efficiency of ab-initio total energy calculations for metals and semiconductors using a plane-wave basis set. Comput. Mater. Sci. 1996, 6, 15–50. [Google Scholar] [CrossRef]
- Perdew, J.P.; Burke, K.; Ernzerhof, M. Generalized gradient approximation made simple. Phys. Rev. Lett. 1996, 77, 3865–3868. [Google Scholar] [CrossRef] [PubMed] [Green Version]
- Monkhorst, H.J.; Pack, J.D. Special points for Brillouin-zone integrations. Phys. Rev. B 1976, 13, 5188–5192. [Google Scholar] [CrossRef]
- Hou, Y.H.; Han, W.C.; Xia, W.S.; Wan, H.L. Structure sensitivity of La2O2CO3 catalysts in the oxidative coupling of methane. ACS Catal. 2015, 5, 1663–1674. [Google Scholar] [CrossRef]
- Fleming, P.; Farrell, R.A.; Holmes, J.D.; Morris, M.A. The rapid formation of La(OH)3 from La2O3 powders on exposure to water vapor. J. Am. Ceram. Soc. 2010, 93, 1187–1194. [Google Scholar] [CrossRef]
- Fedorov, P.P.; Nazarkin, M.V.; Zakalyukin, R.M. On polymorphism and morphotropism of rare earth sesquioxides. Crystallogr. Rep. 2002, 47, 281–286. [Google Scholar] [CrossRef]
- Bakiz, B.; Guinneton, F.; Arab, M.; Benlhachenu, A.; Gavarria, J.-R. Elaboration, characterization of LaOHCO3, La2O2CO3 and La2O3 phases and their gas solid interactions with CH4 and CO gases. Moroc. J. Condens. Matter Soc. 2010, 12, 60–67. [Google Scholar]
- Rémiás, R.; Kukovecz, Á.; Darányi, M.; Kozma, G.; Varga, S.; Kónya, Z.; Kiricsi, I. Synthesis of zinc glycerolate microstacks from a ZnO nanorod sacrificial template. Eur. J. Inorg. Chem. 2009, 2009, 3622–3627. [Google Scholar] [CrossRef] [Green Version]
- Manoilova, O.V.; Podkolzin, S.G.; Tope, B.; Lercher, J.; Stangland, E.E.; Goupil, J.M.; Weckhuysen, B.M. Surface acidity and basicity of La2O3, LaOCl, and LaCl3 characterized by IR spectroscopy, TPD, and DFT calculations. J. Phys. Chem. B 2004, 108, 15770–15781. [Google Scholar] [CrossRef]
- Di Cosimo, J.I.; Díez, V.K.; Xu, M.; Iglesia, E.; Apesteguía, C.R. Structure and surface and catalytic properties of Mg-Al basic oxides. J. Catal. 1998, 178, 499–510. [Google Scholar] [CrossRef] [Green Version]
- Sholl, D.S.; Steckel, J.A. Density Functional Theory: A Practical Introduction; John Wiley & Sons, Inc.: Hoboken, NJ, USA, 2009. [Google Scholar]
- Olafsen, A.; Larsson, A.K.; Fjellvåg, H.; Hauback, B.C. On the crystal structure of Ln2O2CO3 II (Ln=La and Nd). J. Solid State Chem. 2001, 158, 14–24. [Google Scholar] [CrossRef]
- Attfield, J.P. Structure determinations of La2O2CO3-II and the unusual disordered phase La2O2.52(CO3)0.74 Li0.52 using powder diffraction. J. Solid State Chem. 1989, 82, 132–138. [Google Scholar] [CrossRef]
- Zhang, B.; Zhang, J.; Hua, M.; Wan, Q.; Su, Z.; Tan, X.; Liu, L.; Zhang, F.; Chen, G.; Tan, D.; et al. Highly electrocatalytic ethylene production from CO2 on nanodefective Cu nanosheets. J. Am. Chem. Soc. 2020, 142, 13606–13613. [Google Scholar] [CrossRef] [PubMed]
- Zhang, J.; Yin, R.; Shao, Q.; Zhu, T.; Huang, X. Oxygen vacancies in amorphous InOx nanoribbons enhance CO2 adsorption and activation for CO2 electroreduction. Angew. Chem. Int. Ed. 2019, 58, 5609–5613. [Google Scholar] [CrossRef] [PubMed]
- Horiuchi, T.; Hidaka, H.; Fukui, T.; Kubo, Y.; Horio, M.; Suzuki, K.; Mori, T. Effect of added basic metal oxides on CO2 adsorption on alumina at elevated temperatures. Appl. Catal. A Gen. 1998, 167, 195–202. [Google Scholar] [CrossRef]
Figure 1.
XRD patterns of A(a–c) PL-6h, PL-12h, and PL-24h and B(a–c) HL-6h, HL-12h, and HL-24h.

Figure 2.
FT-IR spectra of (a) PL-6h, (b) PL-12h, (c) PL-24h, (d) HL-6h, (e) HL-12h, and (f) HL-24h.
Figure 2.
FT-IR spectra of (a) PL-6h, (b) PL-12h, (c) PL-24h, (d) HL-6h, (e) HL-12h, and (f) HL-24h.

Figure 3.
High-resolution transmission electon microscopy (HR-TEM) images of (a–c) PL-12h, HL-12h, and PL-6h, and FE-SEM images of (d–f) PL-12h, HL-12h, and PL-6h. The insets of (a–c) show their fast Fourier transform patterns.
Figure 3.
High-resolution transmission electon microscopy (HR-TEM) images of (a–c) PL-12h, HL-12h, and PL-6h, and FE-SEM images of (d–f) PL-12h, HL-12h, and PL-6h. The insets of (a–c) show their fast Fourier transform patterns.

Figure 4.
(A) XRD patterns and (B) FT-IR spectra of uncalcined samples. (a) HL-6h, (b) HL-12h, (c) PL-6h, and (d) PL-12h.
Figure 4.
(A) XRD patterns and (B) FT-IR spectra of uncalcined samples. (a) HL-6h, (b) HL-12h, (c) PL-6h, and (d) PL-12h.

Figure 5.
(A) Derivative thermogravimetric analysis (TGA) profiles and (B) CO2-tempurate-programmed desorption (TPD) patterns of (a) PL-12h and (b) HL-12h.
Figure 5.
(A) Derivative thermogravimetric analysis (TGA) profiles and (B) CO2-tempurate-programmed desorption (TPD) patterns of (a) PL-12h and (b) HL-12h.

Figure 6.
Density functional theory (DFT) total energy (per formula unit) of La2O2CO3 in the hexagonal structure for three c/a values.
Figure 6.
Density functional theory (DFT) total energy (per formula unit) of La2O2CO3 in the hexagonal structure for three c/a values.

Figure 7.
DFT-optimized structure of La2O2CO3 in (a) monoclinic and (b) hexagonal phases.

Figure 8.
Linear sweeping voltammetry (LSV) curves of electrodes at various reaction times in a 0.1M NaHCO3 solution at a scan rate of 20 mV/s: (a) PL-12h; (b) HL-12h.
Figure 8.
Linear sweeping voltammetry (LSV) curves of electrodes at various reaction times in a 0.1M NaHCO3 solution at a scan rate of 20 mV/s: (a) PL-12h; (b) HL-12h.

Figure 9.
FE values for the (A) PL-12h and (B) HL-12h as a function of the potential.


Table 1.
The peak intensities quantified in the CO2-TPD patterns.
| Samples | Temperature at Maximum (°C) | Quantity (cm3/g STP) |
|---|---|---|
| PL-12h | 119 | 31.7 |
| 306 | 3.38 | |
| HL-12h | 109 | 24.6 |
| 241 | 29.0 |
Table 2.
Lattice constants of La2O2CO3 in monoclinic and hexagonal structures. The experimental lattice data of monoclinic [34] and hexagonal [35] structures are available from the literature.
| La2O2CO3 | DFT Calculated Data | Experimental Data [33,34] |
|---|---|---|
| Monoclinic | a = 12.286 Å | a = 12.239 Å |
| b = 7.097 Å | b = 7.067 Å | |
| c = 16.531 Å | c = 16.465 Å | |
| β = 75.677 | β = 75.690 | |
| Hexagonal | a = 4.100 Å | a = 4.076 Å |
| b = 4.100 Å | b = 4.076 Å | |
| c = 16.053 Å | c = 16.465 Å | |
| γ = 120 | γ = 120 |
Publisher’s Note: MDPI stays neutral with regard to jurisdictional claims in published maps and institutional affiliations. |
© 2020 by the authors. Licensee MDPI, Basel, Switzerland. This article is an open access article distributed under the terms and conditions of the Creative Commons Attribution (CC BY) license (http://creativecommons.org/licenses/by/4.0/).
Share and Cite
MDPI and ACS Style
Yu, H.; Jiang, K.; Kang, S.G.; Men, Y.; Shin, E.W. Hexagonal and Monoclinic Phases of La2O2CO3 Nanoparticles and Their Phase-Related CO2 Behavior. Nanomaterials 2020, 10, 2061. https://doi.org/10.3390/nano10102061
AMA Style
Yu H, Jiang K, Kang SG, Men Y, Shin EW. Hexagonal and Monoclinic Phases of La2O2CO3 Nanoparticles and Their Phase-Related CO2 Behavior. Nanomaterials. 2020; 10(10):2061. https://doi.org/10.3390/nano10102061
Chicago/Turabian StyleYu, Hongyan, Kaiming Jiang, Sung Gu Kang, Yong Men, and Eun Woo Shin. 2020. "Hexagonal and Monoclinic Phases of La2O2CO3 Nanoparticles and Their Phase-Related CO2 Behavior" Nanomaterials 10, no. 10: 2061. https://doi.org/10.3390/nano10102061
Note that from the first issue of 2016, this journal uses article numbers instead of page numbers. See further details here.