Exploring the Power of Multimodal Features for Predicting the Popularity of Social Media Image in a Tourist Destination


1
Department of Pediatrics, University of Michigan; Ann Arbor, MI 48105, USA
2
Department of Educational Psychology and Leadership, Texas Tech University; Lubbock, TX 79409, USA
3
Division of Communication & Media, Ewha Womans University; Seoul 03760, Korea
*
Authors to whom correspondence should be addressed.
Multimodal Technol. Interact. 2020, 4(3), 64; https://doi.org/10.3390/mti4030064
Submission received: 29 June 2020
/
Revised: 28 August 2020
/
Accepted: 4 September 2020
/
Published: 5 September 2020
Abstract
:Social media platforms are widely used nowadays by various businesses to promote their products and services through multimedia content. Instagram is one of those platforms, which is used not only by companies to promote their products but also by local governments to promote tourist destinations. Predicting the popularity of the promotional tourist destination images helps marketers to plan strategically. However, given the abundance of images posted on Instagram daily, identifying the factors that determine the popularity of an image is a big challenge, due to informal and noisy visual content, frequent content evolution, a lack of explicit visual elements, and people’s informal behavior in liking, commenting on, and viewing the images. We present an approach to identify the factors most responsible for the popularity of tourist destinations-related images on Instagram. Our approach provides a proof of concept for an artificial intelligence (AI)-based real-time content management system, which will help to promote a tourist destination. The experiments on a collection of posts crawled from the official Instagram account of Jeju Island, which is one of the most popular tourist destinations in Korea, show that the recency of the post is the most important predictor of the number of likes and comments it will receive. Moreover, the combination of visual content and context features is an excellent predictor of popularity. The number of likes and comments are found to be complementary to each other for predicting image popularity.
1. Introduction
The reason why mass media used to be popular in marketing tourist destinations in the past is that mass media could reach a considerably broad target audience at a relatively low cost. Another advantage is that the advertiser could easily control their promotional message. Specifically, tourist marketers were efficient in delivering the intended message and obtaining the intended response from viewers who used to accept the messages unilaterally [1]. The problem is that outreach through mass media has now become complicated, and it is very hard to obtain the desired advertising outcomes through a ‘pushing’ method centered on forced exposure, as consumers are now using multiple media at the same time [1].
In this context, the application of digital media is rapidly increasing in the field of destination marketing. In particular, new attempts have been made in recent years to break the existing traditional methods of using text-oriented online media such as blogs and websites or mass-media articles for promoting tourist destinations. A marketing tool for tourist destinations that has recently attracted attention is a social media platform that utilizes interactive multimedia elements [2]. In particular, image-based social networking services (SNS), such as Instagram, have become a favorite source of tourism information, not only for teenage users, but for consumers of all ages who have become accustomed to multimedia technology [3]. Instagram is widely used in the tourism industry for several reasons. Firstly, it has a wide target audience, facilitating the rapid promotion of tourist destinations among a large set of people. Secondly, Instagram users can easily express their engagement with the promotional content posted by the tourism board by following their official pages, liking, and commenting on the posts. The number of likes and comments further helps in measuring the popularity of the uploaded images and identifying various factors that will lead to greater popularity. Thirdly, the use of hashtags for tagging the posted images helps in promoting a specific tourist destination and improves the retrieval of relevant content. Finally, the appealing photos, videos, and other booking features of Instagram further enhance the promotion of tourist destinations.
From the marketer’s point of view, if the visual images and related text information on social media are integrated, and the schedule to post messages are adjusted accordingly, higher communication effectiveness would be expected. Since popularity is related to people’s preferences [4], predicting the popularity of tourist destination images by utilizing the data-driven models (i.e., predictive models built on the automatic content analysis of uploaded images) will help marketers to plan strategically [5] and optimize their promotional content accordingly.
To set up a data-driven content management system, content analysis is quite useful. A traditional content analysis method employing rained researchers has been used widely in tourism literature [6]. The content analysis approach helps in identifying the factors responsible for the popularity of tourist destinations related to social media postings. However, given the abundance of images posted on Instagram daily, identifying the combination of visual content (i.e., objects in the image), visual context (i.e., day and time of posting) and metadata (i.e., hashtags, text) features most responsible for their popularity is a challenging problem, due to informal and complicated visual content, frequent content evolution, and a lack of explicit visual elements. The use of automated content analysis (ACA) has been proven to be useful in the tourism and hospitality (TH) field [7,8]. Unlike manual methods of content analysis, ACA is able to analyze high volumes of data at a substantially shorter time, while helping to mitigate human biases [9].
Overall, there has been little research efforts utilizing ACA to examine what factors are responsible for the popularity of specific brands and tourist destination image posts on visual social media such as Instagram, what individual and combination of features contribute the most for better audience engagement performance, and how artificial intelligence (AI) techniques can be utilized to automate tourism content management and improve the efficiency of it. Our research aims to exploit AI and machine learning techniques to identify the factors most responsible for the popularity of tourist destination images on Instagram. We have utilized the images posted on the official Instagram account (@visitjeju.kr) of a popular tourist destination in Korea, Jeju Island. Recently, AI-based techniques have been widely used in various areas such as image object recognition, speech recognition, automated disease detection, etc.; we have used the AI-based approach to automate tourism content management systems. In particular, given the collected Instagram images related to a tourist destination (Jeju Island), we have used an automated visual analysis tool (i.e., Microsoft Azure) first, that uses AI-based computer vision algorithms to categorize the image content into predefined categories. Then, with the given set of extracted features (image content, context, and metadata) and popularity measure (likes and comment counts), we tried to build the predictive model from the training set using machine learning techniques, utilize that model to automatically predict the popularity of the images in the test set, and provide a combination of features that maximize the popularity measures.
By employing this approach, marketers in the tourism industry will be able to improve their promotional posting’s popularity by adjusting various combinations of image content, day and time of posting as well as hashtags. Our extensive experimental evaluations on Jeju Island postings show that contextual and metadata features play an essential role in predicting the number of likes and comments of a tourist destination post.
The significant contributions of our work are as follows:
- We have provided a proof of concept for an AI-based real-time content management system that will help in tourist destination marketing.
- We have provided an in-depth analysis of the relative importance of specific tourist destination image content, context, and metadata features, along with various combinations of them, in predicting image popularity.
- We have introduced a new dataset related to the popularity prediction of tourist destinations-related images collected from Instagram.
2. Related Work
In recent years, there has been a large amount of work in the field of popularity prediction problems in social media platforms. Most of the existing research can be broadly categorized by the content—e.g., image, video, and text—popularity prediction approaches.
2.1. Image Popularity Prediction
Research on image popularity prediction utilizes different types of features—such as visual, social, and time features—extracted from the input images, builds a predictive model, and then applies it to test images to predict their popularity scores automatically. There is a large body of work using image content and context features, along with user social behavior features, for image popularity prediction. Lv et al. [4] presented an approach that focused on fusing multiple features, e.g., visual, user, and temporal features, for image popularity prediction using the Flickr image dataset. For visual features, they extracted global features (i.e., color, texture, shape) and local features using local maximal occurrence (LOMO) [4] which provides an invariant local feature descriptor and deep learning features using pre-trained models for feature extraction. Social features were divided into user, post, and time features, where user features constitute average views, group, and member count; post features include the image title and description length and hashtag count; and time features are divided into the scales of the month, weekday, days, and hour. They used linear regression, support vector regression, and matrix factorization models for the predictions. Their experimental evaluations are similar to ours, as they experimented with different models first to select the best predictive model and then utilized it for evaluating the effect of various features with their in-depth analysis. Khosla et al. [10] used features similar to those used by Lv et al. [4] but considered more visual content features, such as Gist, color patches, gradients, etc.; more visual objects in the image; and various groups, contacts, member duration, and additional social features. Khosla et al. [10] also evaluated their approach on three dataset settings, e.g., one-per-user, user-mix, and user-specific using support vector regression (SVR) and convolutional neural networks (CNN) models.
McParlane et al. [5] focused on image popularity prediction in a cold start scenario, i.e., when there exists no interaction data, and used image content (number of faces, indoor, food, etc.); image context (day, time, orientation, etc.); user context (account, gender); and textual features. Works in [11,12] utilized similar features but differed in the type of predictive models used; [11] used a stacked model while [12] used ridge regression and a gradient boosting regression tree. Gelli et al. [13] explored visual sentiment features along with image content and context features. They utilized the image descriptions to capture additional contextual features. Cappallo et. al [14] framed the image popularity prediction as a ranking problem where they used only the visual cues in images, predicted the number of likes, and then ranked the images in the decreasing order of likes received (highest to lowest popularity order).
Some previous works exploited various other features in addition to social and contextual features. Almgren et al. [15] considered the effect of temporal factors by continuously tracking the image’s popularity at different periods starting from one hour of upload to the next day, week, and month. Specifically, the number of likes received by the image within the first hour of image upload, the next day, the next week, and then the next month is measured and compared with the popularity threshold. A binary feature termed early popularity is defined and assigned a value of 1 if the number of likes exceeds the predefined popularity threshold; otherwise, the value is 0. In this way, the changes in popularity are captured over time and used to predict future popularity. A novel keyword vector feature is also used to capture the image semantics using natural language processing and clustering. Finally, the effects of various features are evaluated. The image semantics and early popularity act as strong predictors of future popularity in their work. Massip et al. [16] utilized category-specific information for image popularity prediction. In this work, authors first classified the collected Instagram images into their respective categories using a CNN. These images were compared in pairs with other similar category images to compute the initial popularity score. Finally, a support vector regression model determined image popularity by utilizing the initial likelihood scores and user’s features (number of posts, followers) for the specific category image. De et al. [17] utilized deep learning models to determine the popularity of Instagram image posts of a lifestyle magazine. Image context and metadata features were used primarily in this work and fed into a deep neural network to predict the image’s popularity.
Some works have focused on the popularity of specific brand-related posts on Instagram. Mazloom et al. [18] used various engagement parameters, such as the presence of brand logo, product, faces with their combinations (i.e., face and product), sentiment, image aesthetics, and followers, in the image to determine the popularity of brand-related posts in Instagram. The presence of a brand logo, product, faces, and combinations of all three are extracted using the Google Vision application programming interface. At the same time, the sentiments are determined by a combination of visual and textual sentiments extracted by SentiBank detectors from hashtags, captions, and comments. Finally, these extracted features are combined with the social features, and a support vector regression model is used to predict the image’s popularity. Vries et al. [19] developed a conceptual framework to identify the determinants of brand post popularity on brand fan pages. Many components such as vividness, interactivity, entertaining and informative content, position, and valence of comments are used to identify the association between popularity and these components. The significant findings of this research are that the position of a brand post at the top of a fan page, vivid and interactive posts, and positive comments are the significant determinants of increasing the number of likes on the posts.
Although all of the above works focused on predicting the popularity of images posted on Flickr or Instagram, few of them focused on the popularity of images related to a specific domain of interest (e.g., promoting tourist destinations). They also focused on visual content features more than other image context and metadata features, which play vital roles in predicting popularity. Another major limitation of existing works is that most of them are considered an implicit popularity metric (number of views) for measuring image popularity, which captures popularity well with online videos but not with images. Finally, most of these works used deep learning frameworks to extract visual content features, which is a time-consuming process.
In contrast to the above works, we focused on the specific domain of destination marketing to identify the factors most responsible for the popularity of tourist destinations-related images on Instagram using AI techniques. Along with the visual content, we performed an in-depth analysis of the contextual image features to identify the best days and times for posting images to maximize their popularity. We extracted the visual content features using an automated tool that simplifies this process and reduces the overall time for extraction.
2.2. Video Popularity Prediction
Past work on video popularity prediction [20,21,22,23,24,25,26] has used different types of features, such as video characteristics, video content, and temporal features, and machine learning models, such as recurrent neural networks, reinforcement learning, and regression models. The primary focus in most of these works is to efficiently capture the temporal evolution of video popularity over time and determine the features affecting popularity.
Borghol et al. [20] developed a framework to analyze the popularity evolution of user-generated videos over time and proposed a model that captures the characteristics of the evolution. Firstly, they explored the biases in data collection by using sampling techniques; they created two datasets based on recently uploaded videos and keyword searches. The authors found that the dataset collected using keyword searches was biased towards popular content. Moreover, video popularity was found to be highly non-stationary due to significant differences in the popularity peaks. Furthermore, to identify the evolution properties, the authors divided the data into three disjoint sets (before, at, and after peak), which produced several exciting features of video popularity dynamics. Finally, they developed a model using all the features extracted to capture the popularity evolution of newly uploaded videos. Pinto et al. [21] also investigated video popularity dynamics, but they exploited early popularity patterns to predict future popularity. In particular, they investigated whether the viewing patterns of a video up to a particular reference date would be helpful to predict the number of views (i.e., popularity) at some future date. For this purpose, two models—multivariate linear regression and multivariate linear radial basis functions—were used to identify the evolution patterns of videos efficiently along with improved popularity predictions.
Other studies [22,23] have focused on visual and social features along with temporal ones to predict video popularity. Work in [22] used video characteristics (video length, number of frames, resolution, etc.); video content (color, number of faces per frame, text, clutter); other metadata features (video thumbnails); and social interactions (aggregated number of likes, shares, and comments) to predict the number of views (popularity metric) on uploaded videos in YouTube and Facebook. The authors compared the prediction performance between various regression models and their proposed popularity SVR model in this work. They found that the early visual features and the combination of social features with early view counts produced the best prediction performance. Fontanini et al. [23] used video sentiment and content features to predict popularity. To extract the video sentiment and content features, the authors first extracted the frame samples for every two seconds, extracted the respective features using CNN, and then applied principal component analysis (PCA) to produce the final set of features for each frame. Then they combined all the individual frame features to form the whole video feature set. Finally, they applied an extended support vector regression model for the final predictions. The combination of video sentiment and content features was more effective due to better prediction performance as compared to individual feature performance.
Some research on video popularity prediction [24,25] has utilized deep learning models for popularity predictions. Jing et al. [24] used a micro-video dataset, extracted various features (visual, acoustic, textual, and social), and combined the extracted features to apply their novel transductive low-rank multi-view regression model to generate popularity scores. Their framework efficiently integrated heterogeneous features for the micro-video popularity prediction. The authors in [25] used recurrent neural networks to predict video popularity while in [26] proposed an online algorithm to forecast popularity in real-time.
However, these works predicted video popularity using various features and models, which is more challenging than the image popularity prediction problems. The features extracted are somewhat similar in both problems, but the extraction methods differ due to different content. In this work, we exploit an image’s content, context, and metadata features in the popularity prediction task.
2.3. Text Popularity Prediction
Research on text popularity prediction [27,28,29,30,31,32] utilizes different features, such as textual and social features, extracted from the input text messages posted on various social media platforms, such as Twitter and Facebook, to build a predictive model and then apply it to test messages to automatically predict whether the message will be reposted, liked, commented on, and shared in the future. The features in the text popularity prediction task are social features, which show the social interaction of the user (i.e., number of followers, friends, favorites, etc.) and text features (i.e., tweet features, due to extensive usage of Twitter), such as number of hashtags, mentions, URLs, etc.
Petrovic et al. [27] investigated the retweeting behavior of people to determine the popularity of the tweet using social features (number of followers, friends, statuses, favorites, verification status, and language) and tweet features (number of hashtags, URLs, trending words, length of a tweet, number of words, and content novelty). They first conducted a human experiment to explore the feasibility of retweet prediction and then utilized a passive-aggressive approach to predict retweeting behavior. Furthermore, they conducted a time-sensitive modeling experiment to identify retweet behavior evolution over time. Finally, they found that social features like a number of listings, followers, and friends play an essential role in predicting tweet popularity along with tweet content. Hong et al. [28] defined the text prediction problem as a classification task and utilized various features such as message content, temporal information, user and message metadata, and properties of user social graphs. The authors in [29] performed sentiment analysis of popular users and their audience’s tweets and found that the sentiments of users influence their audience’s sentiments. Li et al. [30] investigated the popularity of multimedia content embedded in microblog messages (i.e., images or videos in tweets). The features utilized in this task include information diffusion features containing user, message, and user-message interaction features and specific multimedia meta-information features containing upload time, media type, rating, number of responses, etc. They first predicted whether the social multimedia would be reshaped by framing the problem as a binary reshare classification problem and then predicted the popularity scores of respective multimedia using multiclass classifiers. Work by [31] utilized a deep learning model (long short term memory) to predict the popularity of news articles using their title information while [32] used a Bayesian approach for retweets prediction.
These works, however, predict text popularity using the user’s social and textual content features. Although social features are similar to image and video popularity predictions, the content differs a lot in this case. Moreover, extracting textual content features is not as difficult as compared to image and video content extraction.
3. Proposed Approach
This section provides a brief overview of our proposed approach for image popularity prediction along with the data collection details. Further sections provide detailed descriptions of the popularity measures, feature analysis, and predictive models used in the present research.
Given an input image posted on the official Instagram account of the tourist destination, we aim to predict the image’s popularity by utilizing the number of likes and comments that the image will receive. Figure 1 shows the overall process of our proposed framework. Starting with our data collection process, we first used a web crawler (i.e., Github Instagram-scraper (https://github.com/rarcega/instagram-scraper)) to collect a total of 1022 images posted on the official Instagram account of Jeju Island (@visitjeju.kr) [33], operated by the Jeju Tourism Board (JTB). These images were posted by the JTB’s communication staff. The postings may be produced directly by the person in charge of communication, but in some cases, the images created by the general public were used after obtaining consent from the creator. In this study, the reason for using the official Instagram account of the JTB was to test the effectiveness of postings within the more controlled setting. Moreover, the posted images were representative of Jeju Island showing the most scenic places, popular food items, and other events. The collected images include all Instagram postings from November 2015 to April 2019 in the JTB account. The other features such as date and time of posting, unique number, number of likes, number of comments, number of hashtags, etc., are extracted for each collected image.
After that, we used Microsoft Azure [34] to extract the image content features (more details are in Section 3.2). Five of the images were excluded as Azure did not analyze them due to the low-quality image issue. Each image was labeled with their unique ID, time, and date of posting and object category.
As shown in Figure 1, the extracted features were combined and preprocessed for modeling. Using all these features, we developed a popularity prediction model from the training set images using machine learning techniques. Finally, the built model was applied to the test set images to determine the popularity scores (more details are in later sections).
3.1. Popularity Measures
Popularity is the measure of how much a person, idea, item, or place is liked and accepted by other people [35]. Nowadays, digital content posted on various social media platforms is a new measure of being popular. In particular, the user’s popularity is measured by the number of followers, friends, and other social interactions. In contrast, the popularity of multimedia content is measured by the number of times people view, like, and comment on it. Different social media platforms use different metrics to define popularity, such as the number of likes and comments on Facebook and Instagram, the number of views on Flickr, the number of pins on Pinterest, and the number of Diggs on Digg.
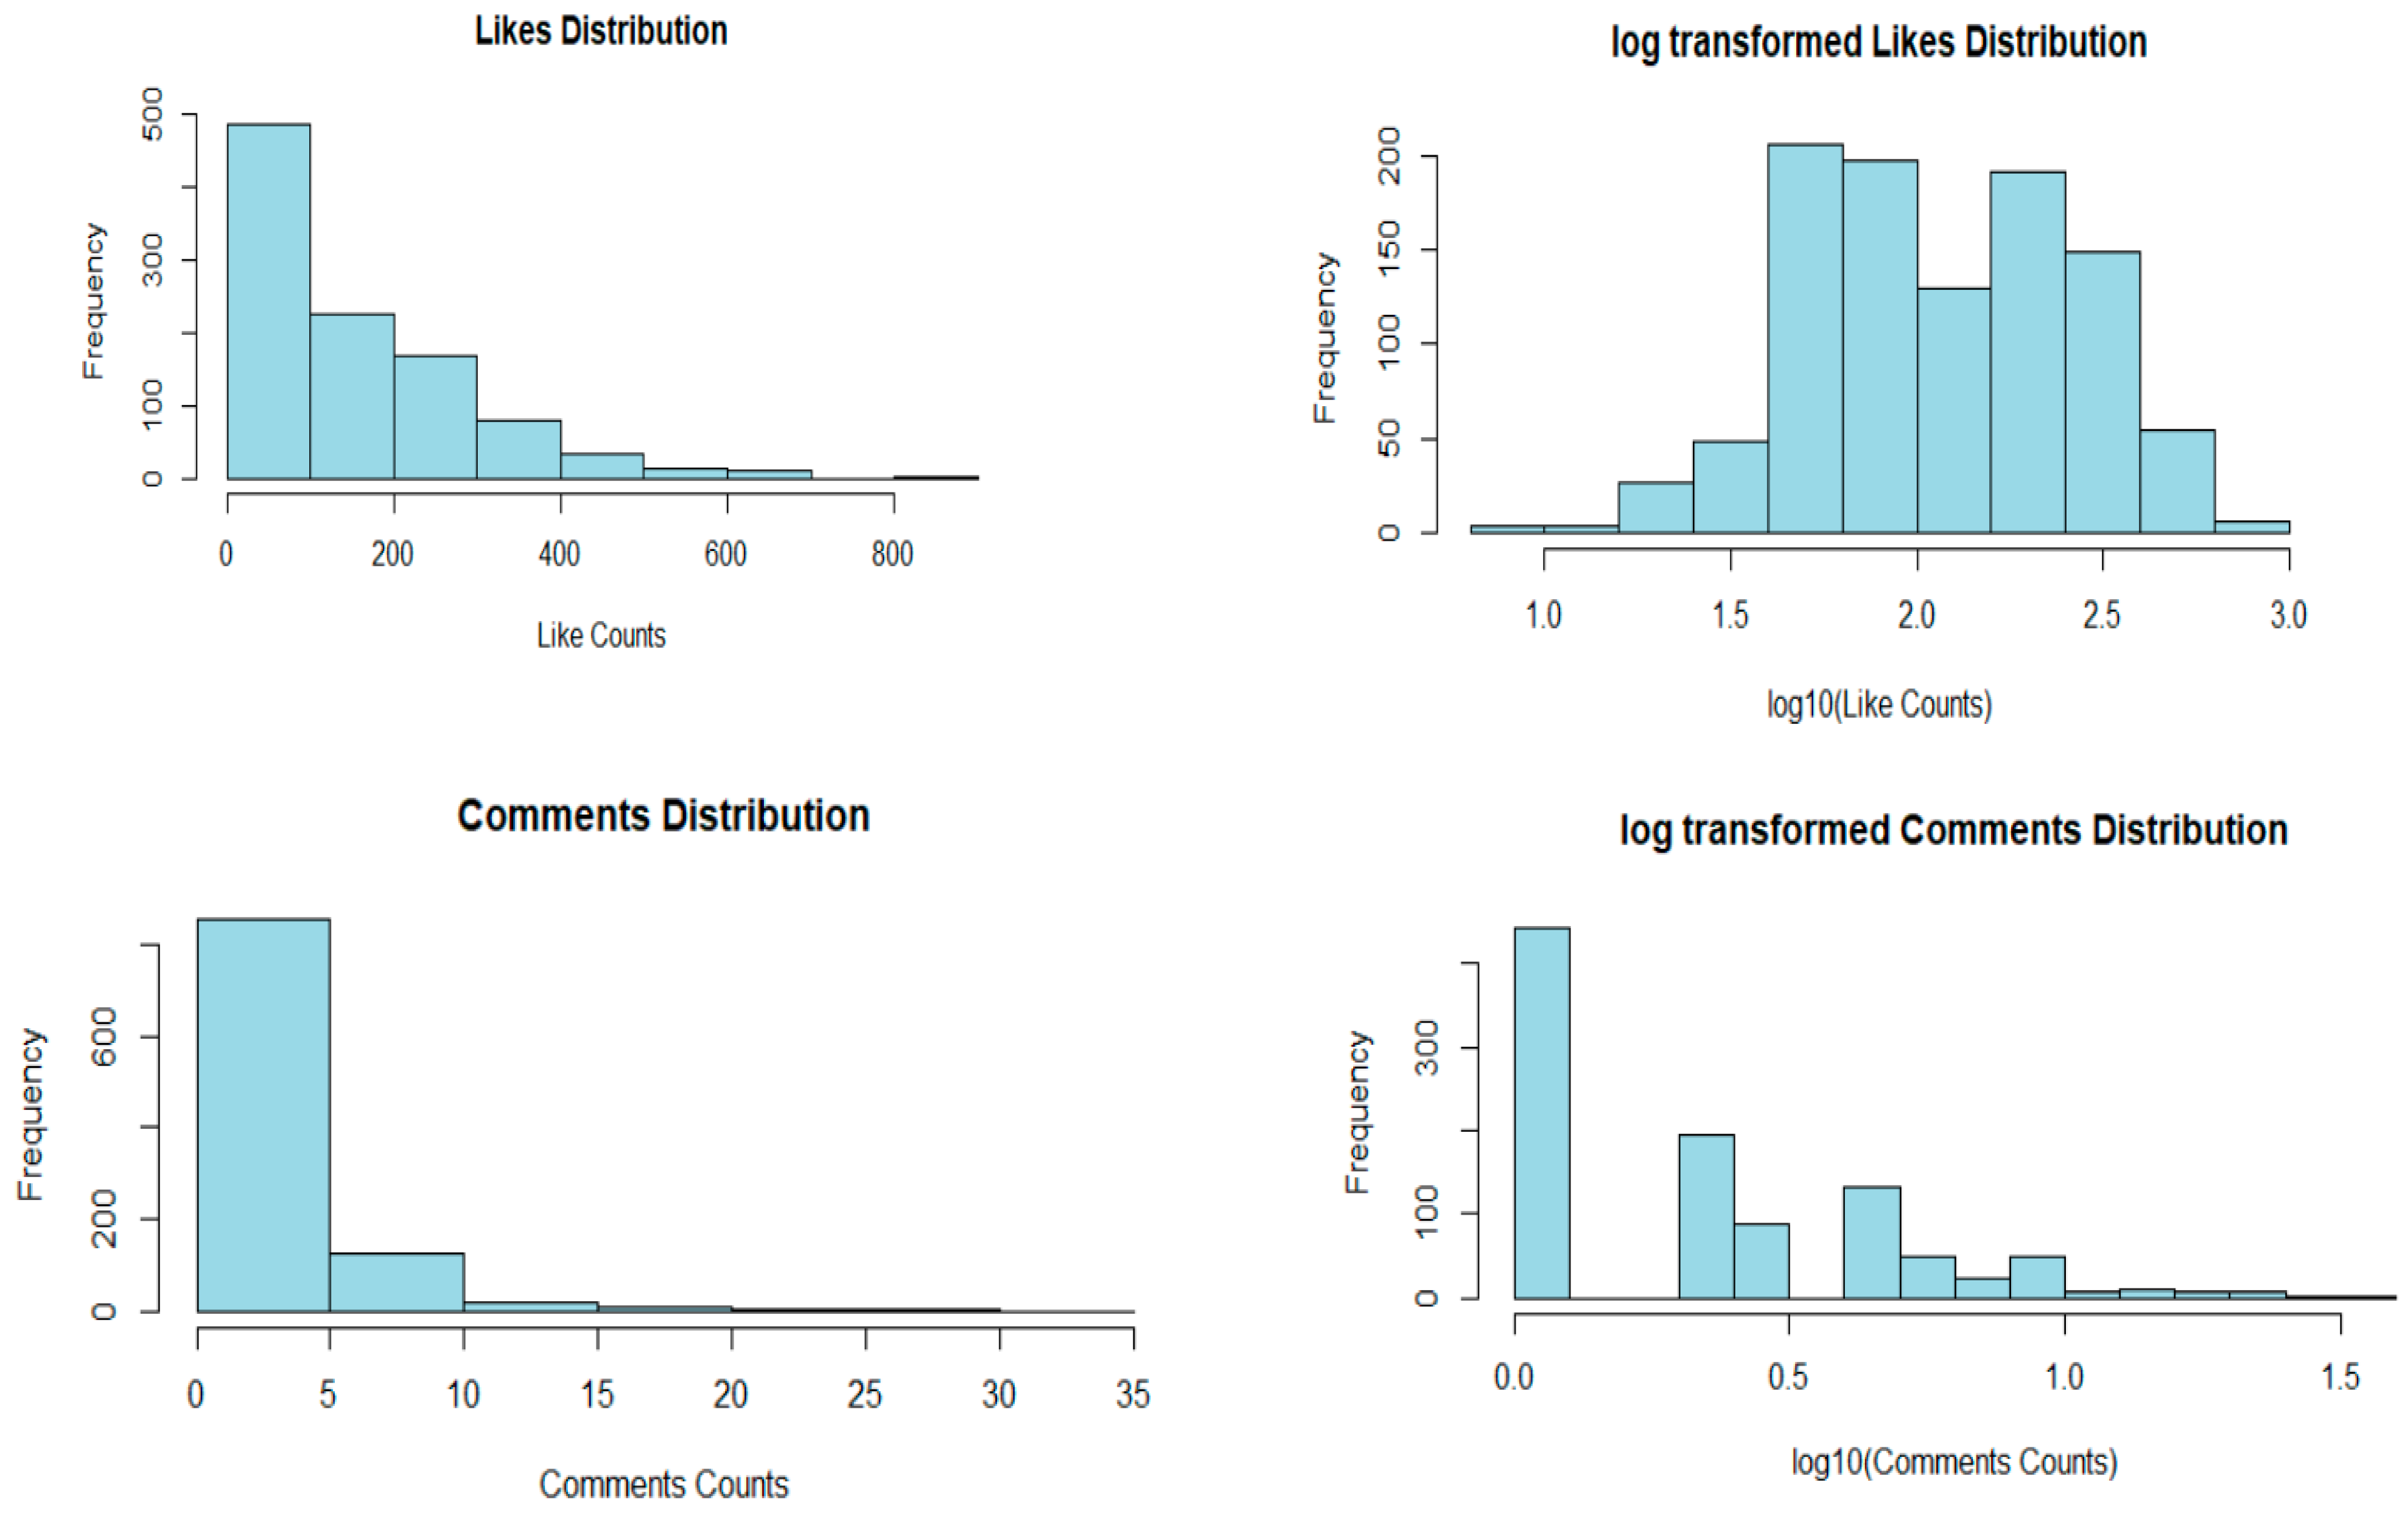
On Instagram, people usually show their interest in posted images by liking and commenting and in videos by viewing. Intuitively, we can say that the more likes and comments an image receives, the more popular it will be since more people are attracted to the images of interest, which leads them to like the images and then write short messages of admiration in the form of comments. Moreover, works in [15,16,17,36] used likes and comments as the popularity measure. Therefore, by following their work, we adopted the number of likes and comments as the popularity measure in our paper. On an initial exploration of the number of likes and comments in our data, we found that it follows the power–law distribution where the majority of images receive very little or no likes/comments, and a minority of them (the tail of the distribution) receive a high number of likes/comments, as shown in Figure 2. To deal with the considerable variation in the number of likes and comments, we applied the log function here to reduce the distribution’s skewness, as shown in Figure 2.
3.2. Features
The data collected on Instagram have various attributes, such as image content features, image context features, and other metadata-based features. We have considered several specific characteristics of each post, for which we provide the description below:
- Image Context Features: These features consist of various temporal characteristics (e.g., time of the event, day of the week, number of days), representing the day and time of upload of the image.
- Image Content Features: These features represent the contents of an image, such as the presence and absence of the various types of objects in the image.
- Metadata-based Features: These features represent other metadata associated with the image, such as the number of hashtags, number of likes, and number of comments.
3.2.1. Image Context Features
The image context features comprise various time-based features related to the posted image that represents the specific day and time that the image is captured, uploaded, and retrieved for analysis. We have considered the following context features:
- Day of the Week: This feature indicates the day of the week when the image was posted. It is categorized according to the seven days of the week (i.e., Monday–Friday are weekdays and Saturday and Sunday are weekends). Therefore, it is a categorical feature with seven categories. This feature is one-hot encoded for each day of the week to produce seven binary features in our dataset.
- Number of Days: This feature represents the total number of days elapsed from the date the image was uploaded on Instagram to the data retrieval date. This feature determines the age of the posted image. The images with the fewer number of days elapsed indicate the newly posted images while the larger number of days elapsed indicates the older images.
- Time Event: This feature shows at what time of the day the image was posted. It is classified into four categories: morning, afternoon, evening, and night. This feature is one-hot encoded to produce four features in our dataset.
3.2.2. Image Content Features
The image content feature contains the content shown by the posted image, such as what object is being shown in the image. These features are categorical with two categories “Yes” or “No” (i.e., “Yes” if a posted image contains the object, and “No” if the object is absent). We have considered the following content features. The chosen features were decided on the series of discussions of experts in tourism after looking into all the postings in the JTB’s account:
- Person: This feature indicates whether the image contains a person or not. This is a categorical feature, with “Yes” for the presence and “No” for the absence of a person in the image.
- Food: This feature indicates whether the image contains food or not. This is a categorical feature, with “Yes” for the presence and “No” for the absence of food in the image.
- Indoor: This feature indicates whether the image contains an indoor or outdoor setting. This is a categorical feature, with “Yes” for an indoor setting and “No” for an outdoor setting in the image.
3.2.3. Metadata-Based Features
The metadata-based features constitute other external features of the posted images, such as the number of hashtags, number of likes, and number of comments. These features pertain to the popularity of the posted image. We considered only the number of hashtags as the metadata feature, and the number of likes and comments as the outcome variables, whose details are in Section 3.1. However, we examined the number of likes and comments as features to show their effect on each other’s predictions. More details are in Section 4.3.
3.3. Feature Analysis
After collecting image context, image content, and metadata-based features and initial preprocessing, we had a total of eight attributes featured in 1017 posts. From the initial descriptive statistics of all the numerical predictors and outcomes, we found that most of them were skewed (as shown in Table 1). Besides, the number of “Likes” and “comments” had two outliers, where one post received 1639 likes and another 64 comments, while the normal range of “Likes” was between 9 and 816, and of “comments” was between 0 and 33. We excluded the posts with outliers and analyzed 1015 image posts.
We start with the image context features where the “number of days” feature is moderately skewed towards the left, as the mean days are less than the median, as shown in Table 1. Moreover, the variation in the days is quite high. Exploring this feature further, we categorized them according to the recency of the post and found that only 15% of the posts were uploaded in the past year or less, 63% were posted in the past 1–3 years, and 22% dated from 3–4 years ago. This shows that most of the posts are older during the collection date. For the “days of the week” feature, the highest number of images were posted on Tuesday, Thursday, and Friday (18%). Monday and Wednesday had 15% while Saturday and Sunday had 8% posted images. In terms of “time events”, 38% of images were posted during morning and afternoon, 15% during the evening, and 9% during night time.
The univariate exploration of image content features shows that 71% of the posted images contain “food”, 63% contain “person”, and 38% contain “indoor” (as shown in Table 2). However, the paired analysis of these features by considering two objects as “present” and the rest as “absent” produces different results. We found that 32% of images contained people with food in outdoor settings (i.e., a “person” with “food”), 17% contained people in indoor settings without any food (i.e., a “person” with “indoor”), and only 4% contained images of food in indoor settings without any people (i.e., “food” with “indoor”). Moreover, 10.5% of images contained “person”, “food”, and “indoor” all together, while 3.2% contained the images of outdoor without any food and people, that showed the scenic and natural places of Jeju island such as beaches, caves, gardens, and trees with roads. On further exploration, we found that 24% of images were of food only in outdoor settings, 2.4% were of people in outdoor settings (i.e., scenic places) and 6.1% images were indoors only.
Overall, this shows that the images containing people with food at outdoor settings and food only at outdoor environments are the most frequently posted images in our collected Instagram dataset. On exploring the metadata-based features we found that the number of hashtags, comments, and likes is highly skewed towards the right (as shown in Table 1), as the mean values are less than the median.
The number of comments is quite low for most of the posts, as 29% of posts have 0 comments, 55% have around 1–5 comments, and 16% have more than 5 comments. Moreover, 48% of posts have the likes in the range of 1–100, 39% in the range of 100-300 and 13% more than 300 likes, which shows that very few posts have more than 300 likes. Log-normalized "Like" and "Comment" values are used as outcome variables (as shown in Figure 2).
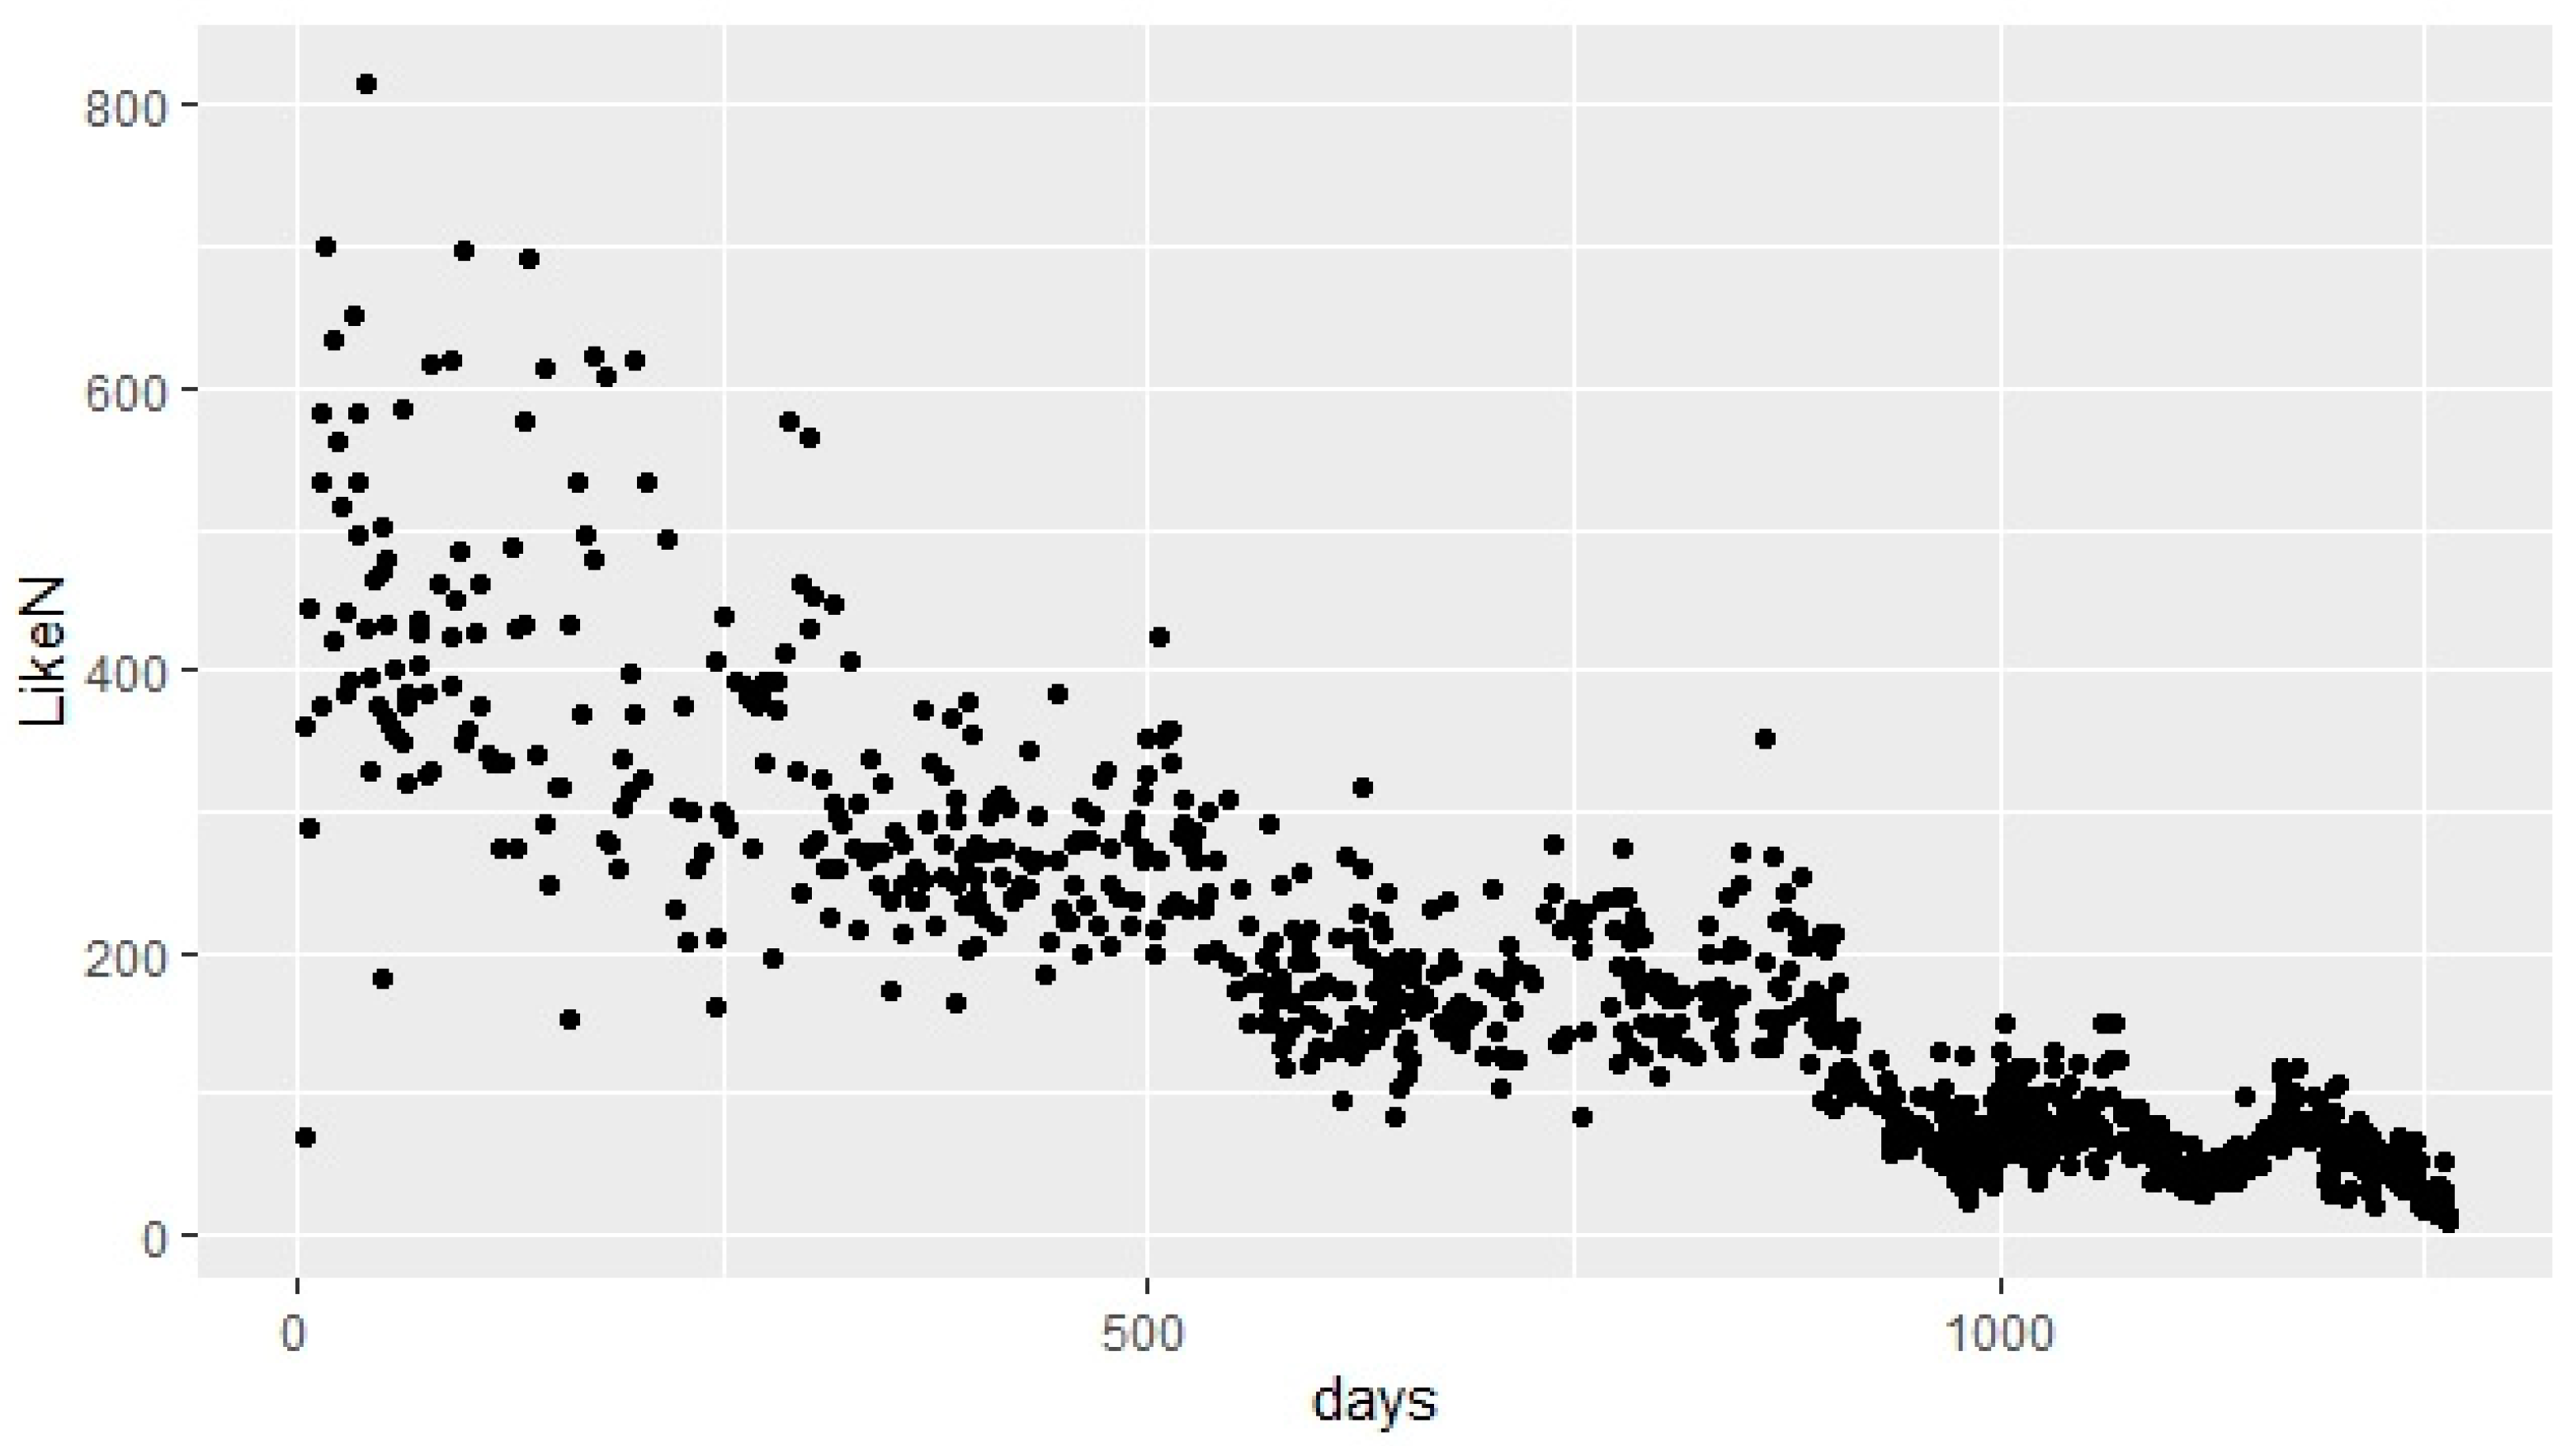
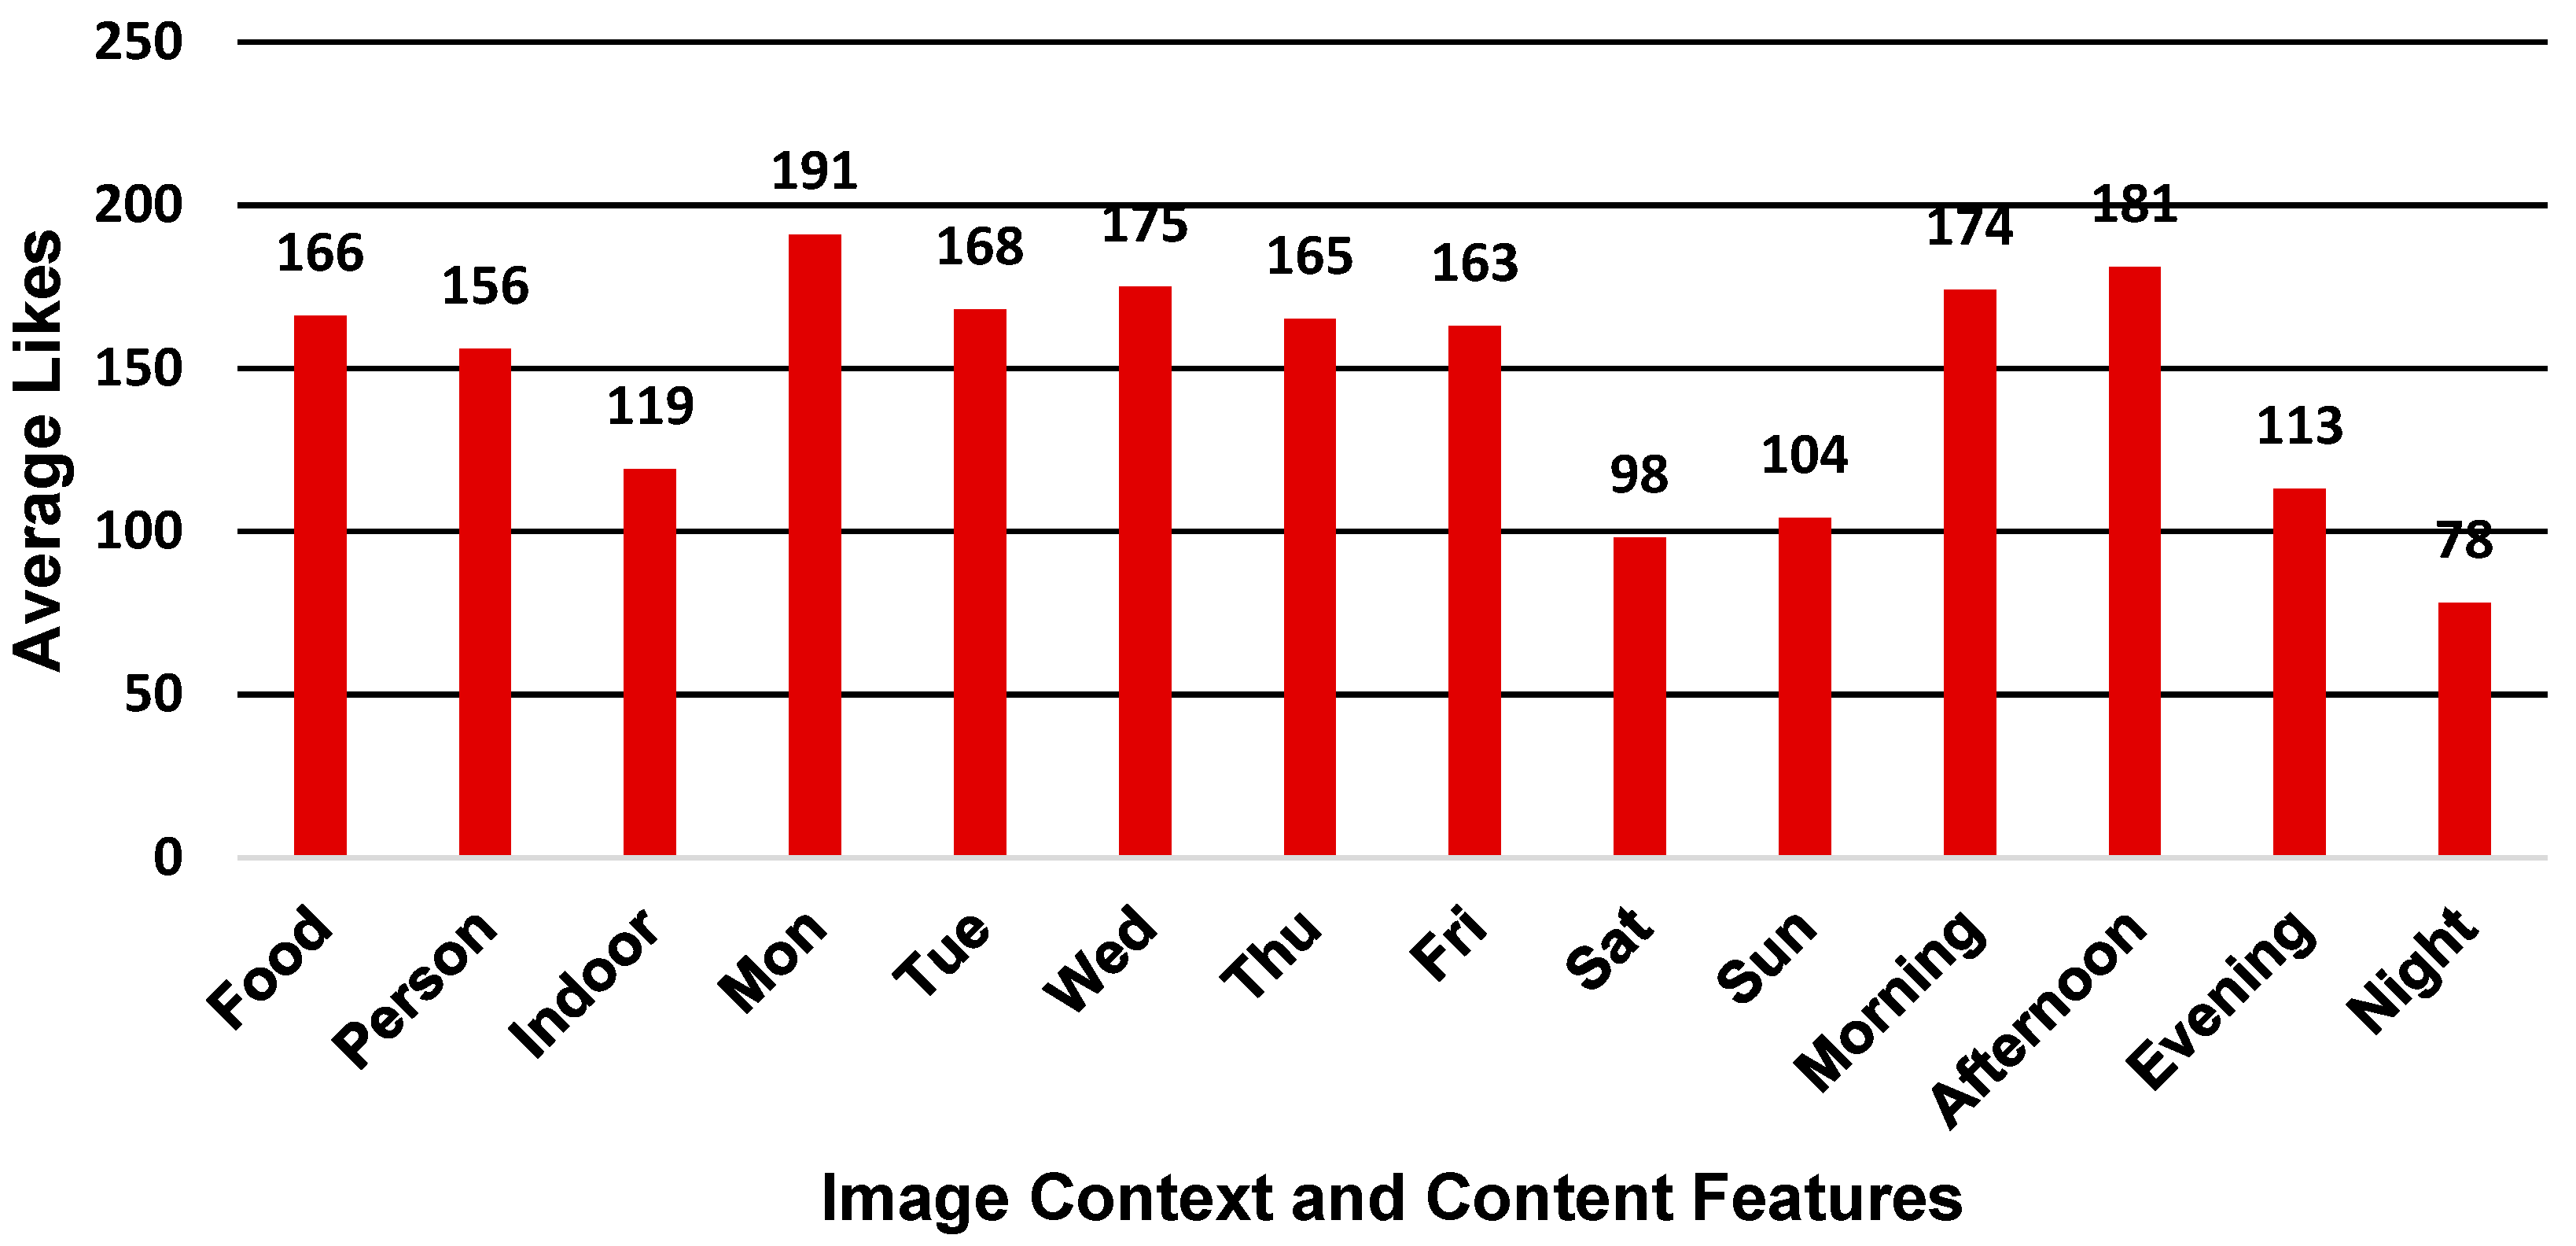
Furthermore, on exploring the association of image context features with “Likes” and “Comments”, we found that the number of likes was inversely related to the number of days (i.e., the more recent a post is, the more “Likes” it will get, which means that a smaller number of days will indicate a higher number of “Likes” and vice versa) due to a strong negative correlation, as shown in Figure 3. Posts made on weekdays during the morning or afternoon have a higher number of “Likes” as compared to the posts made on weekends and during the evening and night time intervals, as shown in Figure 4.
3.4. Learning Models
Our primary goal is to determine what combination of features are most responsible for predicting the number of likes and comments on a tourist destination image. Since the numbers of likes and comments are considered as the popularity measures, we cast this problem as a popularity prediction problem using different regression methods. The popularity measure is considered as a numerical value for the regression task. This section briefly discusses various state-of-the-art regression models used for popularity prediction.
3.4.1. Linear Regression Model
Linear regression models the linear relationship between the numerical outcome/dependent variables and independent/predictor variables [37]. This model is the simplest and most widely used model to fit numerical outcomes. We have considered this as our baseline model. For the popularity prediction, the linear regression model determines the relationship between the numerical “likes” and comments outcome variables with another image context, image content, and metadata features/predictor variables, as shown in [4]. A linear relationship is assumed between the outcomes and other features, which can be expressed mathematically as:
where x represents the feature vectors and y the outcome variable (i.e., likes and comments).
3.4.2. Support Vector Regression Model
Support vector regressions are widely used modeling techniques based on support vector machines (SVM) [38]. The basic idea of SVR is to transform the given input finite-dimensional space into a higher dimensional space (hyperplane) by using linear or non-linear transformations (kernels) [39]. SVR aims to find the regression function (hyperplane) that best fits the input data for prediction. This function can be mathematically expressed as:
where β0 and αi are the parameters, K(x, xi ) is the kernel, and S is the input sample space [40]. This model is widely used in popularity prediction problems [4,5] in online images and videos where the input popularity parameters or features are mapped in high dimensional feature space to predict or classify the popularity of posted images or videos.
3.4.3. Decision Tree Regression Model
The decision tree [41] is a learning model that is widely used for predictive modeling in a variety of diverse areas. This algorithm converts a given set of input data into a decision tree to extract rules that simplify the prediction. Decision trees are known as regression trees when the outcome is numerical. In particular, for regression trees, the input feature space is partitioned recursively to determine more homogeneous groups to predict the outcome variable. We utilized classification and regression trees to predict the popularity measures (i.e., likes and comments) as in [11], where different contextual and other image features are used to build the decision tree and determine the popularity scores.
3.4.4. Random Forest Regression Model
Random forest [42] is an ensemble learning model that fits multiple regression trees on random samples of the input data and makes predictions by combining the predictions from each regression tree. This model helps in making more accurate predictions and reduces variance and overfitting. Random forests are used for image popularity prediction in [43], where images from multiple social media platforms are used to build a predictive model to determine popularity. We have used the random forest model to predict the number of likes and comments for the Instagram data.
3.4.5. Gradient Boosting Tree Regression Model
The gradient boosting tree [44] based regression model is based on the concept of boosting, which is an ensemble learning technique that sequentially improves the predictive capability of the model by improving the existing weak learners to keen learners. This algorithm is used in image popularity prediction in [12], which uses multiple user and image contextual features to predict the number of views for a posted image in the social media dataset. We have used this technique to determine the number of likes and comments on the posted images on Instagram.
3.4.6. Extreme Gradient Boosting Tree Regression Model
The extreme gradient boosting tree [45] based regression model (XGBoost) is an improved version of the gradient boosting algorithm, with more features and distributed capabilities. This model is widely used in a variety of problems with better performances. We have applied this model to the image popularity prediction problem on the Instagram data and found that it outperforms other models and produces better results.
4. Experiments and Results
In this section, we describe the experimental setup, different experimental scenarios, results, and evaluation.
4.1. Experimental Setup
Our collected raw Instagram data contained 1017 posts with eight features after initial preprocessing, which, after removing two outlier instances and one-hot encoding of categorical features, contained 1015 posts with 16 features. We divided our dataset with 75% data in the training set and 25% in the testing set. Due to the small size of the dataset, we used the training set for model building and parameter tuning with 10-fold cross-validation and applied the tuned model to the testing set to evaluate the effectiveness. The whole dataset was randomly shuffled, and the same set of training and testing sets are used to report the model results. We experimented in a system with an Intel Core-i7-8550U CPU 2 GHz processor, 16 GB RAM 8 cores and 1TB of the hard disk. All our experiments were performed in R version 4.0.0 in RStudio version 1.2.5033.
Our experimental evaluation is divided into two parts, where the first part aims to fine-tune the model parameters and select the best predictive model for popularity prediction (i.e., estimating number of likes and comments), using all features combined. The second part aims to identify the most effective features responsible for predicting the popularity of Instagram posts (i.e., number of likes and comments) using various combinations of features.
4.2. Evaluation Metrics
This section briefly provides an overview of the evaluation metrics used in our experiments. In our following experiments, we utilized root mean square error (RMSE), mean absolute error (MAE), and Spearman’s rank correlation coefficient (SRC) as evaluation metrics similar to [4,11]. SRC measures the strength of the relationship between the predicted popularity values (likes and comments) and actual popularity values. The SRC between the actual popularity values (pactual) and predicted popularity values (ppredicted) can be computed by using equation 3, where n is the number of test instances while , , are the mean and standard deviations of values, respectively.
A higher SRC value indicates a better model. Root mean square error [46] is the square root of the average of squared errors (i.e., the difference between the actual and predicted popularity values). RMSE can be represented as shown in equation 4, where n is the number of test instances. A lower RMSE value leads to a better model.
The MAE [47] is the average of the absolute errors (i.e., the difference between the actual and predicted popularity values).
It can be represented, as shown in equation 5, where n is the number of test instances. A lower MAE value leads to a better model.
4.3. Results
This section provides the experimental results with both experimental evaluations. The first part of the experimental evaluation is described in Section 4.3.1, and the second part in Section 4.3.2. The results of different methods for selecting the best predictive model using all features combined for predicting likes and comments are listed in Table 3 and Table 4.
4.3.1. Results: Part 1
The first part of our experimental evaluation aims to select the best predictive model for popularity prediction (i.e., estimating the number of likes and comments) using all features combined. In this experiment, we applied various regression models (as listed in Section 3.4) by considering all the features combined on the training set, fine-tuned their parameters using 10-fold cross-validation, and then applied the model to the test set. The method with the best performance was chosen for further evaluations of features, as shown in Section 4.3.2. Table 3 and Table 4 show the performance comparison of different predictive models using all features combined for predicting likes and comments.
Firstly, we observed that the XGBoost tree model for likes prediction had the best performance as compared to other models. As we can see, the simplest linear regression model achieved an SRC of 0.89, which shows the effectiveness of the features extracted from our dataset, but it performs worse compared to all other models. On comparing XGBoost with linear regression, the SRC is improved by 3.6% while the RMSE and MAE are reduced by 31% and 27%, respectively. On comparing the RMSE values of linear regression with ensemble (i.e., random forest, gradient boosting machine (GBM), and XGBoost tree) models, there is a vast reduction of 30%, 28%, and 31% respectively. Overall, ensemble models outperform in terms of RMSE, MAE, and SRC values as compared to all other traditional predictive models (i.e., linear regression, SVM radial, and decision tree), which infers that ensemble models are good in predicting the number of likes as compared to other traditional models. Due to the averaging strategy of combining multiple predictions in ensemble models, the accuracy of these models is improved, and overfitting is reduced.
On comparing the number of comment predictions using different methods, as shown in Table 4, we observed that the GBM model outperformed other models. While comparing GBM with linear regression, we found that SRC got improved by 99% while RMSE and MAE were reduced by 3.4% and 3.8%, respectively. Here, there are large differences in SRC values if we compare traditional predictive models (i.e., linear regression, SVM radial, and decision tree) with ensemble models. On comparing SRC values of linear regression with ensemble (i.e., random forest, GBM, and XGBoost tree) models, there is a vast improvement of 35%, 99%, and 94%, respectively. Overall, ensemble models outperform traditional models. These results suggest that the XGBoost model for the likes and GBM model for the comments prediction can be selected as the final models in this experiment due to their superior performances, among other models.
Further on, comparing the prediction models for likes and comments as listed in Table 3 and Table 4, we found that the likes prediction models were much better than the comments prediction models in terms of RMSE, MAE, and SRC. As we can see, RMSE and MAE values of likes prediction models were much lower than the comments prediction models. In comparison, SRC values were much higher, which shows that the number of likes was highly correlated with the features as compared to the number of comments and further leads to better popularity predictions of posts.
4.3.2. Results: Part 2
The second part of our experiment aims to evaluate the effectiveness of our features for popularity prediction from our chosen models (XGBoost and GBM) as described in Section 4.3.1.
Table 5 shows the prediction results using XGBoost with different combinations of features for predicting likes. We have used the individual image context and metadata features, the combined image context and image content features, and a combination of all features (i.e., All) to determine the best features for popularity prediction.
Firstly, we will look into the performance by excluding comments as a feature and then including it to determine its effectiveness in predicting likes. On looking at the model performance, excluding comments as a feature, we can see that the image context features (i.e., all image context) comprising days, days of week and time event performs best with least RMSE value of 0.1221, which shows that the posting time affects the popularity of tourist destination images the most. Among other context features, the age of the posted image feature (days) affects the prediction most when considered individually, due to comparable performance with the best model, as shown in Table 5. This indicates that the number of days alone acts as a useful feature in predicting the number of likes on the posted images. On comparing individual features, days of the week have the least predictive power while hashtags perform well relative to other individual features. This indicates that the number of hashtags on the posts plays an essential role in determining the number of likes.
The image content features do not contribute much to predict the number of likes individually, but on combining them with the image context features, there is a drastic improvement, with a 65% reduction in RMSE and 286% improvement in SRC values, which indicates that the posting times along with the image content contributes to popularity prediction substantially. Further on, combining all the features (all), the performance improves and becomes the second-best performance model, as shown in Table 5.
Finally, on analyzing the model performance after including the number of comments as a feature, we found that it does not have much predictive power when used individually (as shown in Table 5) but improves the performance slightly when combined with all other features. We found that on including comments, there is a slight improvement in combined performance (all) with a decrease in RMSE value by 3.6% and an increase in SRC by 0.7%, and it becomes the best-performing model. This indicates that the number of comments can add to the predictive capability and help determine the number of likes when considered with all other features.
Table 6 shows the prediction results using the GBM model with different combinations of features for predicting comments. Firstly, we will investigate the performance before including likes as a feature, and then after including it, to determine its effectiveness in predicting comments. As we can see, the number of days achieved the best performance with RMSE and SRC values of 0.3279 and 0.3335, respectively. This shows that the age of the posted image is the most discriminative feature for both the number of likes and comments predictions. Moreover, this indicates the tendency of people to comment on posted images just after liking them. On comparing individual feature performance, the time event and hashtag features have better relative decreases of 1.3% and 0.7% over the days of week feature in terms of RMSE values. The image context and image content features have comparable performances individually but are better in combination, as shown in Table 6.
The number of hashtags does not play an important role in predicting comments, as shown in Table 6. However, posting times along with the image content are effective since the images containing interesting content and posted at specific times (i.e., morning or afternoon), and receive more comments compared to all other images posted at random times. Furthermore, image context with content features performs well with comparable performance with the best model. Overall, we can say that the number of days is the most important feature for determining the number of comments before considering the number of likes as a feature.
Furthermore, by including the number of likes as features, we found an interesting aspect that it is the most crucial feature in predicting comments both individually and combined. Table 6 shows that as an individual feature, the number of likes outperforms all others with the best performance in terms of RMSE and SRC values. On comparing it with the days feature performance, there is a decrease of 7% in RMSE and an increase of 21% in SRC values, which is quite high. Moreover, while comparing the overall performance (i.e., all with all + likes), we found that there is a sharp drop of 13% in RMSE and a drastic increase of 77% in SRC values, leading to the best-performing model. This indicates that the number of likes is the most powerful feature in predicting comments for tourist destination image posts on Instagram. Overall, these results suggest that the posts with more likes attract more comments due to their popularity.
Specific Feature Combination Results
This section provides the results for the specific feature combinations to identify the best set of visual content, visual context, and metadata features for optimized performance. We have tried many combinations of specific days of the week (e.g., Monday–Sunday), times (e.g., morning–night), and hashtags as features to determine an optimal combination to predict likes and comments using the XGBoost and GBM models.
Table 7 and Table 8 show the performance combinations for likes and comments prediction. We have used a forward sequential process of feature selection where we start with one feature, add a feature every time, and select the one whose combination provides the best performance until all the features are exhausted. As shown in Table 7 and Table 8, the days, hashtags, and indoor features are the best combinations initially, which indicates that the recently posted indoor images with more hashtags receive more likes and comments. On checking the individual days of the week, we found that the combination of Monday, Friday, and Saturday achieves the best performance for predicting likes and Wednesday, Friday, and Saturday for predicting comments.
Similarly, for weekdays, images posted on Monday and Wednesday received most likes and comments. For the visual content features, images of food and people in indoor settings perform best for both likes and comments. This shows that the images of specific foods at tourist destinations are mostly liked by people.
For the time event feature, combinations of the evening with night for likes and morning with afternoon for comments perform best. Finally, a combination of days, hashtags, indoor, Monday, Friday, Saturday, food, evening, and night specific feature combination achieves the best performance for likes prediction while a combination of days, hashtags, indoor, Wednesday, Friday, Saturday, food, afternoon and night performs best for comments.
Overall, the results suggest that recent images of food in indoor settings, posted on Friday and Saturday, receive more likes during the evening and night time and more comments during morning and afternoon time. Our experimental results provide a proof of concept for an AI-based system that, if implemented in a real-time dashboard and provided the combination of features that optimizes performance every time, will help not only in improving the marketing of the Jeju tourism industry but also in increasing its popularity in social media networks.
4.4. Parameter Analysis
We have adopted the XGBoost model for likes prediction and the GBM model for comments prediction. We have selected the parameters, a number of trees, and learning rate (i.e., shrinkage) for both models and evaluated how these parameters influence predicting the number of likes and comments.
4.4.1. Parameter Number of Trees
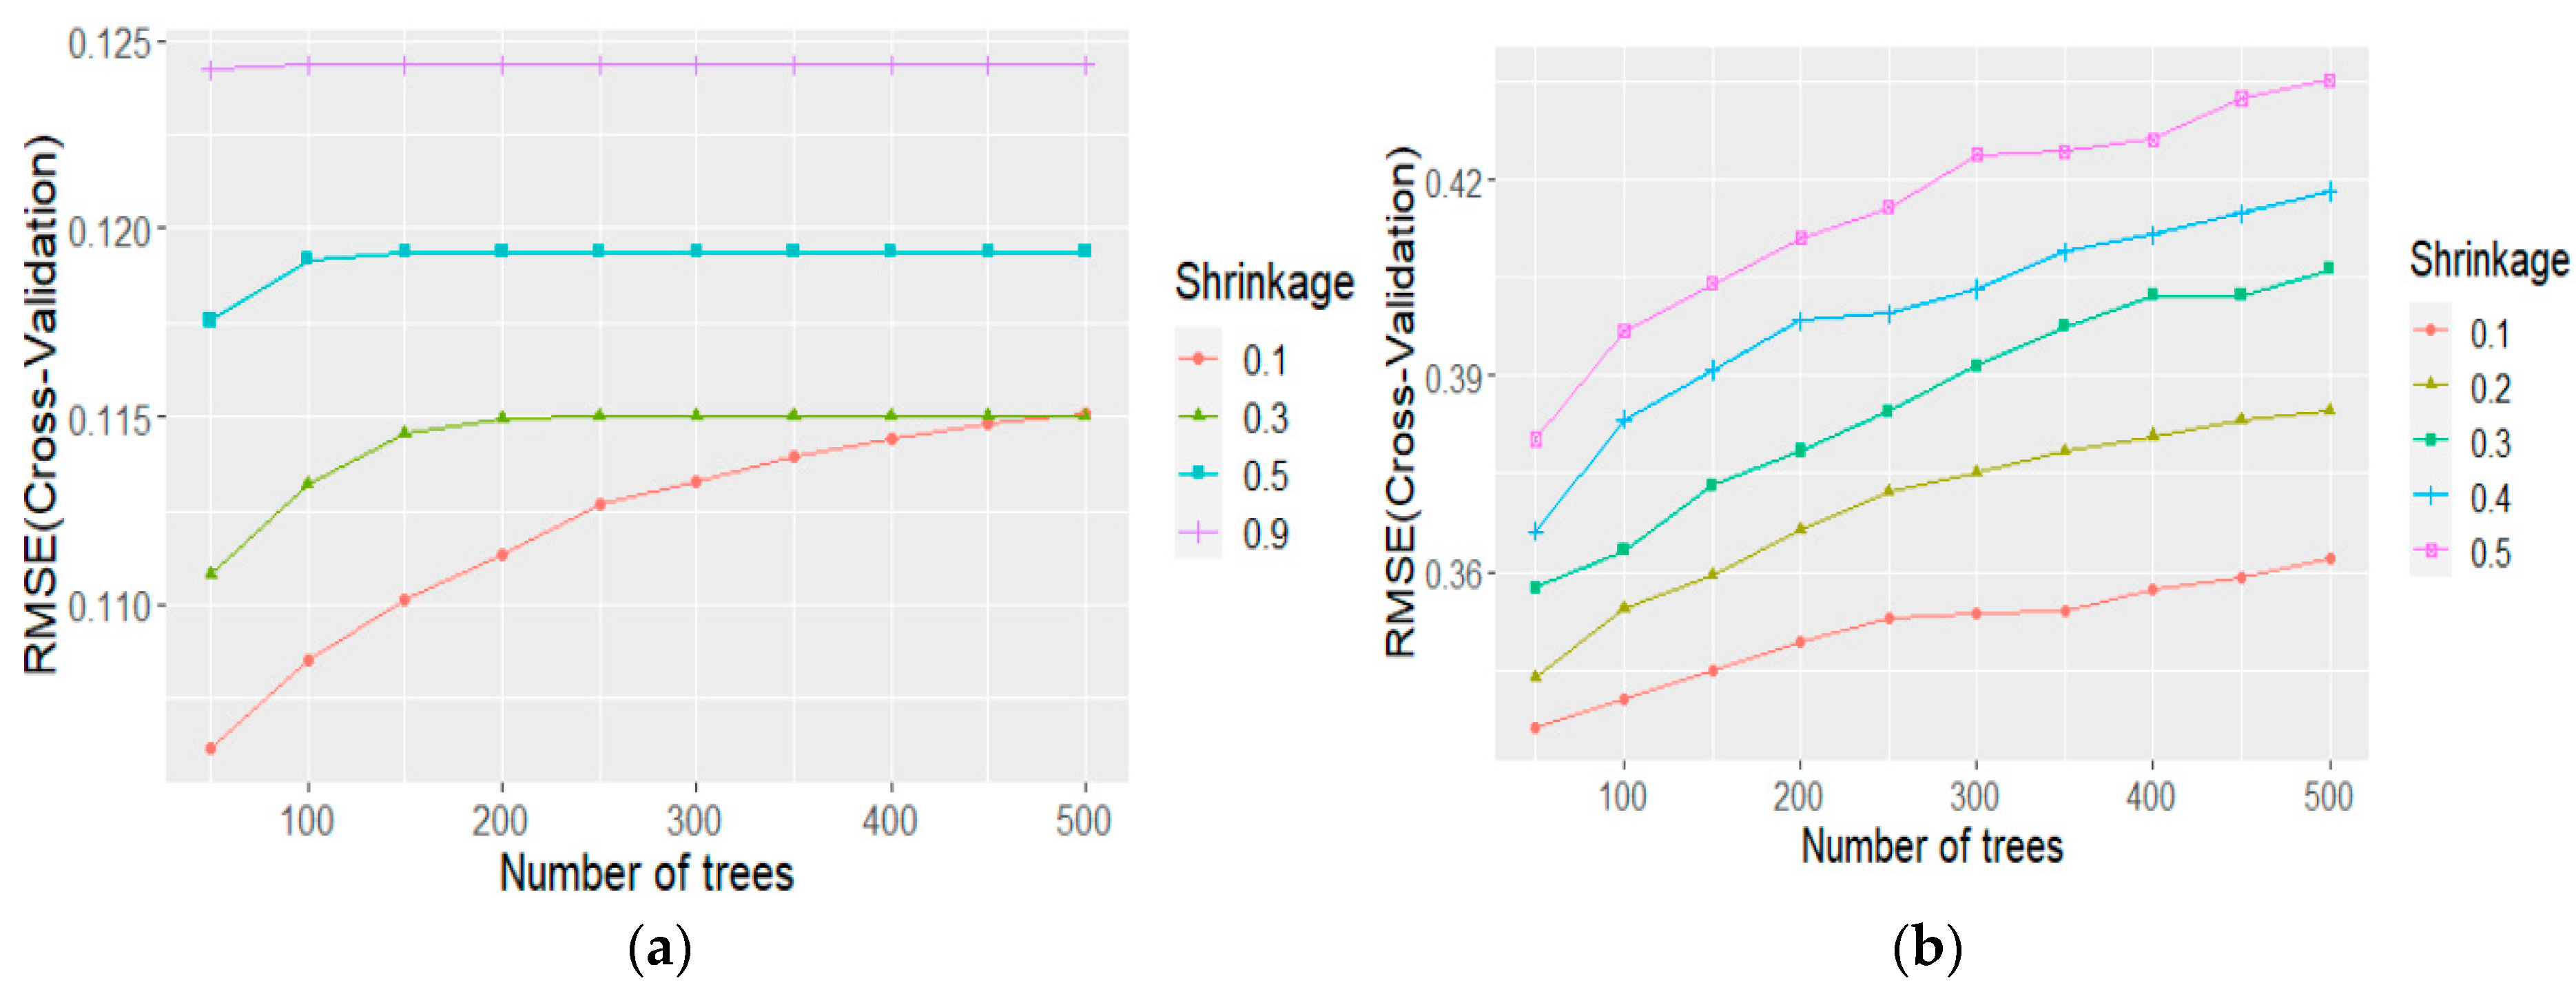
To study the effect of the number of trees on the performance, we have used different values of trees ranging from 50–500 and plotted them against 10-times cross-validated RMSE values for both the XGBoost and GBM models, as shown in Figure 5. As we can see, the RMSE value increases with an increasing number of trees, with the lowest value at 50 trees for both models, but for XGBoost, the RMSE values become constant around 100 trees, while for GBM it keeps increasing until it reaches 500 trees. Hence it requires multiple tests to determine the optimal number of trees for the GBM model.
4.4.2. Parameter Shrinkage
The parameter shrinkage (i.e., learning rate) determines how quickly the error is reduced and the model converges. We have tested different values of shrinkage ranging from 0.1–0.5 for both models, as shown in Figure 5. As we can see, the RMSE value increases with the increasing shrinkage value, with the least value at 0.1 for both models. The performance is worse for both models at shrinkage 0.5.
Thus, this parameter needs to be kept at smaller values to minimize the training error and generalize the model. Finally, we identified the optimized parameters for both final models:
XGBoost Model: Number of trees—150, shrinkage = 0.1
GBM Model: Number of trees—50, shrinkage = 0.1
The final tuned parameters for all other models are listed in Appendix A.
5. Conclusions and Discussion
We studied the different determinants responsible for the popularity of tourist destination-related images posted on their official Instagram accounts. We have provided a proof of concept for an AI-based real-time content management system, which, if implemented, will help in promoting different tourist places. Different from existing work, which identifies the factors responsible for the popularity of user-uploaded images, we focused on a specific domain of interest, tourist destination marketing, where the user’s liking behavior is different and less informal. Instead of using a time-consuming deep learning process of visual content feature extraction, we used an automated visual content analysis tool that reduces the extraction time, which will further help in real-time popularity predictions.
We evaluate the performance of our proposed framework by conducting experiments on a collection of data crawled from the official Instagram account of Jeju Island. The results of our experiments show that the XGBoost tree-based regression model outperforms all other models in predicting likes, and the GBM tree-based regression in predicting comments. The age of the posted image acts as the best feature for both likes and comments prediction, which is due to the fact that people usually prefer to like recently posted images instead of older ones. Hence, newly posted tourist destination images become popular quickly compared to the older images. One possible reason for this might be that most people usually plan their tourist destination for the vacations in a shorter period (i.e., within weeks or months) of time rather than a longer period (i.e., years). During this period they utilize various tourist destination related web platforms (including Instagram) to search the place and decide by considering various factors such as scenic beauty, food, travel time, accommodation, etc. This results in checking specific destination-related official Instagram accounts, where they look through the recently posted images, and like and comment on them instantly rather than scrolling through older images. Thus, the recency of the post acts as a crucial factor in predicting the popularity of tourist destination images.
Since people like recent images more, they prefer to comment on the same images, which is why the age of the image is also an essential predictor of comments. An exciting feature for predicting comments is the number of likes and vice versa, which shows that both are complementary to each other, due to the fact that people usually perform both of these operations together (i.e., if they like an image, most probably they also comment on it, which increases the predictability of commenting; and if they comment on an image, most probably they like it too, which increases the predictability of likes). Overall, all the features combined (i.e., visual content, context, and metadata) are good predictors of likes which shows that the people were attracted to the images with interesting visual content, posted on specific days and times with trending hashtags.
Furthermore, exploring the effect of the specific feature, we found that the combination of days, hashtags, and being indoors play a crucial role in predicting likes and comments, which might be because people tend to admire those images with trending hashtags that were posted recently and which contain a nice indoor selfie, which is prevalent in Instagram. Moreover, we found that people prefer to like images posted on Monday, Friday, and Saturday during the evening and night times. This might be since the people living near Jeju Island go there with family/friends on weekends or Friday evenings for relaxing/partying and post interesting images on Instagram. Some of those images are posted by the Jeju tourism board on their official Instagram account to show the liveliness at Jeju island. This also suggests that tourism marketers can upload images posted on weekends during the evening and night times to increase the marketing effect of Jeju island. For the number of comments, the trend is somewhat different. The images posted on Wednesday, Friday, and Saturday during the morning or afternoon received more comments. This might be because the images posted during morning or afternoon time on weekends are related to outdoor scenic beauty, natural places, and other interesting things at Jeju island, due to which people commented more in these times. Moreover, people usually comment only when they find the image content interesting enough, as it requires more effort and time as compared to liking.
Overall, we can say that the proposed framework has the potential to be implemented as a real-time content management system that will be helpful for advertisers/tourist marketers to improve the marketing effect of tourist destinations. A limitation of our work is the small size of our dataset, which we will improve in our future studies by collecting and experimenting on large datasets using big data analytics approaches. Furthermore, we will incorporate online algorithms that can capture the data changes frequently, update the ML models dynamically, and produce real-time popularity predictions of uploaded destination images on Instagram. Moreover, if the feature extraction part is coupled with the real-time analytics part, this system will act as an excellent tool for a fully automated content management system for businesses, including tourism.
Author Contributions
Conceptualization, V.G., S.-C.Y., and K.J.; Methodology, V.G., and K.J.; validation, S.C.Y, K.J., and V.G.; software, V.G.; formal analysis, V.G., S.-C.Y. and K.J.; resources, S.-C.Y.; data curation, V.G.; writing—original draft preparation, V.G.; writing—review and editing, S.-C.Y. and K.J.; supervision, S.-C.Y., and K.J. All authors have read and agreed to the published version of the manuscript.
Funding
This research received no external funding.
Conflicts of Interest
The authors declare no conflict of interest.
Appendix A
Final parameters used in our experiments

Table A1.
Final Parameters for Likes Prediction.
| Method | Parameters |
|---|---|
| Linear regression | - |
| SVM Radial regression | sigma = 0.0396 and C = 1 |
| Decision Tree | cp = 0.0634 |
| Random forest regression | mtry = 9 |
| GBM | n.trees = 150, interaction.depth = 3, shrinkage = 0.1 |
| XGBoost tree | nrounds = 100, max_depth = 2, eta = 0.3 |
Table A2.
Final Parameters for Comments Prediction.
| Method | Parameters |
|---|---|
| Linear regression | - |
| SVM Radial regression | sigma = 0.0376 and C = 0.25 |
| Decision Tree | cp = 0.0163 |
| Random forest regression | mtry= 2 |
| GBM | n.trees = 50, interaction.depth = 2, shrinkage = 0.1 |
| XGBoost tree | nrounds = 50, max_depth = 1, eta = 0.4 |
References
- Mulhern, F. Integrated marketing communications: From media channels to digital connectivity. J. Mark. Commun. 2009, 15, 85–101. [Google Scholar] [CrossRef]
- Özdemir, G.; Celebi, D. Reflections of destinations on social media. In Cultural Tourism in a Digital Era; Springer: Cham, Switzerland, 2015; pp. 243–249. [Google Scholar]
- Iglesias-Sánchez, P.P.; Correia, M.B.; Jambrino-Maldonado, C.; de las Heras-Pedrosa, C. Instagram as a Co-Creation Space for Tourist Destination Image-Building: Algarve and Costa del Sol Case Studies. Sustainability 2020, 12, 2793. [Google Scholar]
- Lv, J.; Liu, W.; Zhang, M.; Gong, H.; Wu, B.; Ma, H. Multi-feature fusion for predicting social media popularity. In Proceedings of the 25th ACM international conference on multimedia, Mountain View, CA, USA, 23–27 October 2017. [Google Scholar]
- McParlane, P.J.; Moshfeghi, Y.; Jose, J.M. “Nobody comes here anymore, it’s too crowded” Predicting Image Popularity on Flickr. In Proceedings of the International Conference on Multimedia Retrieval, Glasgow, UK, 1–4 April 2014. [Google Scholar]
- Camprubí, R.; Coromina, L. Content analysis in tourism research. Tour. Manag. Perspect. 2016, 18, 134–140. [Google Scholar] [CrossRef]
- Cheng, M.; Edwards, D. A comparative automated content analysis approach on the review of the sharing economy discourse in tourism and hospitality. Curr. Issues Tour. 2019, 22, 35–49. [Google Scholar] [CrossRef]
- Picazo, P.; Moreno-Gil, S. Analysis of the projected image of tourism destinations on photographs: A literature review to prepare for the future. J. Vacat. Mark. 2019, 25, 3–24. [Google Scholar] [CrossRef]
- Nunez-Mir, G.C.; Iannone III, B.V.; Pijanowski, B.C.; Kong, N.; Fei, S. Automated content analysis: Addressing the big literature challenge in ecology and evolution. Methods Ecol. Evol. 2016, 7, 1262–1272. [Google Scholar] [CrossRef] [Green Version]
- Khosla, A.; Das Sarma, A.; Hamid, R. What makes an image popular? In Proceedings of the 23rd international conference on World wide web, Seoul, Korea, 7–11 April 2014.
- Huang, X.; Gao, Y.; Fang, Q.; Sang, J.; Xu, C. Towards SMP challenge: stacking of diverse models for social image popularity prediction. In Proceedings of the 25th ACM international conference on multimedia, Mountain View, CA, USA, 23–27 October 2017. [Google Scholar]
- Wang, W.; Zhang, W. Combining multiple features for image popularity prediction in social media. In Proceedings of the 25th ACM international conference on multimedia, Mountain View, CA, USA, 23–27 October 2017. [Google Scholar]
- Gelli, F.; Uricchio, T.; Bertini, M.; Del Bimbo, A.; Chang, S.F. Image popularity prediction in social media using sentiment and context features. In Proceedings of the 23rd ACM international conference on multimedia, Brisbane, Australia, 26–30 October 2015. [Google Scholar]
- Cappallo, S.; Mensink, T.; Snoek, C.G. Latent factors of visual popularity prediction. In Proceedings of the 5th ACM on International Conference on Multimedia Retrieval, Shanghai, China, 23–26 June 2015. [Google Scholar]
- Almgren, K.; Lee, J.; Kim, M. Predicting the future popularity of images on social networks. In Proceedings of the 3rd Multidisciplinary International Social Networks Conference on SocialInformatics 2016, Data Science; Association for Computing Machinery: New York, NY, USA, 2016; pp. 1–6. [Google Scholar]
- Massip, E.; Hidayati, S.C.; Cheng, W.H.; Hua, K.L. Exploiting category-specific information for image popularity prediction in social media. In Proceedings of the 2018 IEEE International Conference on Multimedia and Expo Workshops (ICMEW), San Diego, CA, USA, 23–27 July 2018. [Google Scholar]
- De, S.; Maity, A.; Goel, V.; Shitole, S.; Bhattacharya, A. Predicting the popularity of Instagram posts for a lifestyle magazine using deep learning. In Proceedings of the 2017 2nd International Conference on Communication Systems, Computing and IT Applications (CSCITA), Coimbatore, India, 7–8 April 2017. [Google Scholar]
- Mazloom, M.; Rietveld, R.; Rudinac, S.; Worring, M.; Van Dolen, W. Multimodal popularity prediction of brand-related social media posts. In Proceedings of the 24th ACM international conference on multimedia, Amsterdam, The Netherlands, 15–19 October 2016. [Google Scholar]
- De Vries, L.; Gensler, S.; Leeflang, P.S. Popularity of brand posts on brand fan pages: An investigation of the effects of social media marketing. J. Interact. Mark. 2012, 26, 83–91. [Google Scholar] [CrossRef]
- Borghol, Y.; Mitra, S.; Ardon, S.; Carlsson, N.; Eager, D.; Mahanti, A. Characterizing and modelling popularity of user-generated videos. Perform. Eval. 2011, 68, 1037–1055. [Google Scholar] [CrossRef] [Green Version]
- Pinto, H.; Almeida, J.M.; Gonçalves, M.A. Using early view patterns to predict the popularity of youtube videos. In Proceedings of the 6th ACM international conference on Web search and data mining, Rome, Italy, 4–8 February 2013. [Google Scholar]
- Trzciński, T.; Rokita, P. Predicting popularity of online videos using support vector regression. IEEE Trans. Multimedia 2017, 19, 2561–2570. [Google Scholar] [CrossRef] [Green Version]
- Fontanini, G.; Bertini, M.; Del Bimbo, A. Web video popularity prediction using sentiment and content visual features. In Proceedings of the 2016 ACM on international conference on multimedia retrieval, New York, NY, USA, 6–9 June 2016. [Google Scholar]
- Jing, P.; Su, Y.; Nie, L.; Bai, X.; Liu, J.; Wang, M. Low-rank multi-view embedding learning for micro-video popularity prediction. IEEE Trans. Knowl. Data Eng. 2017, 30, 1519–1532. [Google Scholar] [CrossRef]
- Thar, K.; Tran, N.H.; Hong, C.S. Prediction Popularity of Video Contents with Deep Recurrent Neural Network. Available online: http://networking.khu.ac.kr/xe/layouts/net/publications/data/KCC2017/Prediction%20Popularity%20of%20Video%20Contents%20with%20Deep%20Recurrent%20Neural%20Network.pdf (accessed on 29 June 2020).
- Xu, J.; Van Der Schaar, M.; Liu, J.; Li, H. Forecasting popularity of videos using social media. IEEE J. Sel. Top. Signal Process. 2014, 9, 330–343. [Google Scholar] [CrossRef]
- Petrovic, S.; Osborne, M.; Lavrenko, V. Rt to win! predicting message propagation in twitter. In Proceedings of the Fifth International AAAI Conference on Weblogs and Social Media, Barcelona, Spain, 17–21 July 2011. [Google Scholar]
- Hong, L.; Dan, O.; Davison, B.D. Predicting popular messages in twitter. In Proceedings of the 20th international conference companion on World wide web, Hyderabad, India, 28 March–1 April 2011. [Google Scholar]
- Bae, Y.; Lee, H. Sentiment analysis of twitter audiences: Measuring the positive or negative influence of popular twitterers. J. Am. Soc. Inf. Sci. Technol. 2012, 63, 2521–2535. [Google Scholar] [CrossRef]
- Li, C.T.; Shan, M.K.; Jheng, S.H.; Chou, K.C. Exploiting concept drift to predict popularity of social multimedia in microblogs. Inf. Sci. 2016, 339, 310–331. [Google Scholar] [CrossRef]
- Stokowiec, W.; Trzciński, T.; Wołk, K.; Marasek, K.; Rokita, P. Shallow reading with deep learning: Predicting popularity of online content using only its title. In Proceedings of the 23th International Symposium on Methodologies for Intelligent Systems, Warsaw, Poland, 26–29 June 2017. [Google Scholar]
- Zaman, T.; Fox, E.B.; Bradlow, E.T. A bayesian approach for predicting the popularity of tweets. Ann. Appl. Stat. 2014, 8, 1583–1611. [Google Scholar] [CrossRef]
- Instagram Jeju Island Account. Available online: https://www.instagram.com/visitjeju.kr/?hl=en (accessed on 1 November 2015).
- Microsoft Azure. Available online: https://azure.microsoft.com/en-us/ (accessed on 1 May 2019).
- Popularity. Available online: https://dictionary.cambridge.org/us/dictionary/english/popularity (accessed on 25 June 2020).
- Zohourian, A.; Sajedi, H.; Yavary, A. Popularity prediction of images and videos on Instagram. In Proceedings of the 4th International Conference on Web Research (ICWR), Tehran, Iran, 25–26 April 2018. [Google Scholar]
- Linear Regression. Available online: https://www.cs.toronto.edu/~rgrosse/courses/csc321_2018/readings/L02%20Linear%20Regression.pdf (accessed on 25 June 2020).
- Linear Support Vector Regression. Available online: http://www.jmlr.org/papers/volume13/ho12a/ho12a.pdf (accessed on 25 June 2020).
- Support Vector Regression. Available online: http://papers.nips.cc/paper/1238-support-vector-regression-machines.pdf (accessed on 25 June 2020).
- An Introduction to Statistical Learning. Available online: http://faculty.marshall.usc.edu/gareth-james/ISL/ (accessed on 25 June 2020).
- Decision Trees. Available online: https://link.springer.com/content/pdf/10.1007/BF00116251.pdf (accessed on 25 June 2020).
- Breiman, L. Random forests. Mach. Learn. 2001, 45, 5–32. [Google Scholar] [CrossRef] [Green Version]
- Huang, F.; Chen, J.; Lin, Z.; Kang, P.; Yang, Z. Random forest exploiting post-related and user-related features for social media popularity prediction. In Proceedings of the 26th ACM International Conference on Multimedia, Seoul, Republic of Korea, 22–26 October 2018. [Google Scholar]
- Friedman, J.H. Stochastic gradient boosting. Comput. Stat. Data Anal. 2002, 38, 367–378. [Google Scholar] [CrossRef]
- Chen, T.; Guestrin, C. Xgboost: A scalable tree boosting system. In Proceedings of the 22nd ACM SIGKDD International Conference on Knowledge Discovery and Data Mining, San Francisco, CA, USA, 13–17 August 2016. [Google Scholar]
- Salkind, N.J. Encyclopedia of Research Design; SAGE Publications, Inc.: Thousand Oaks, CA, USA, 2010. [Google Scholar]
- Sammut, C.; Webb, G.I. Encyclopedia of Machine Learning; Springer: Boston, MA, USA, 2011. [Google Scholar]
Figure 1.
Our proposed framework for determining the popularity of tourist destinations related postings on Instagram (a) the data collection part which consists of the Jeju Tourism Board (JTB) official Instagram posts. (b) Feature extraction part, which consists of producing image content, image context, and metadata-based features (c) Machine Learning techniques are applied here to the training set to build popularity prediction model (d) Predictive model is applied here to predict the popularity of test set images.

Figure 2.
Distribution of the number of likes and comments with their log transformations.

Figure 3.
Correlation between days and the number of “Likes”.

Figure 4.
Likes Distribution with Image Context and Content Features.

Figure 5.
(a) Effect of various parameters on XGBoost model (b) Effect of various parameters on GBM model.
Figure 5.
(a) Effect of various parameters on XGBoost model (b) Effect of various parameters on GBM model.

Table 1.
Descriptive Statistics of Meta data-based features and outcome variables.
| Type | Days | Comments | Hashtags | Likes | Log-Likes | Log-Comments |
|---|---|---|---|---|---|---|
| Mean | 799 | 2.8 | 12 | 159 | 2.1 | 0.33 |
| Sd | 354 | 3.7 | 8.4 | 131 | 0.4 | 0.35 |
| Min | 6 | 0 | 0 | 9 | 0.95 | 0 |
| 25% | 543 | 0 | 5 | 60 | 1.8 | 0 |
| 50% | 933 | 2 | 11 | 116 | 2.1 | 0.3 |
| 75% | 799 | 4 | 19 | 226 | 2.4 | 0.6 |
| Max | 1263 | 33 | 30 | 816 | 2.9 | 1.5 |
Table 2.
Statistics of image content Features.
| Person | Food | Indoor | |
|---|---|---|---|
| Yes | 635 | 720 | 386 |
| No | 380 | 295 | 629 |
Table 3.
Performance of different machine learning methods for Likes Prediction. Bold shows the best performance results.
Table 3.
Performance of different machine learning methods for Likes Prediction. Bold shows the best performance results.
| Method | RMSE | MAE | SRC |
|---|---|---|---|
| Linear regression | 0.1787 | 0.1271 | 0.8954 |
| SVM Radial regression | 0.1676 | 0.1215 | 0.8928 |
| Decision Tree | 0.1770 | 0.1259 | 0.8894 |
| Random forest regression | 0.1255 | 0.0944 | 0.9198 |
| GBM | 0.1289 | 0.0931 | 0.9264 |
| XGBoost tree | 0.1231 | 0.0921 | 0.9285 |
Table 4.
Performance of different machine learning methods for Comments Prediction. Bold shows the best performance results.
Table 4.
Performance of different machine learning methods for Comments Prediction. Bold shows the best performance results.
| Method | RMSE | MAE | SRC |
|---|---|---|---|
| Linear regression | 0.3433 | 0.2919 | 0.1439 |
| SVM Radial regression | 0.3504 | 0.2854 | 0.1506 |
| Decision Tree | 0.3467 | 0.2915 | 0.0904 |
| Random forest regression | 0.3373 | 0.2885 | 0.1937 |
| GBM | 0.3316 | 0.2809 | 0.2866 |
| XGBoost tree | 0.3331 | 0.2817 | 0.2790 |
Table 5.
Comparison of Likes Prediction using XGBoost tree method with a different set of features.
| Feature | RMSE | MAE | SRC |
|---|---|---|---|
| Days of week | 0.3638 | 0.3046 | 0.1237 |
| Days | 0.1261 | 0.0953 | 0.9193 |
| Time-event | 0.3542 | 0.2898 | 0.2575 |
| Hashtags | 0.3349 | 0.2497 | 0.4277 |
| Comments | 0.3469 | 0.3008 | 0.3131 |
| All Image Context | 0.1221 | 0.0935 | 0.9226 |
| All Image Content | 0.3601 | 0.2991 | 0.239 |
| Image Context + Image Content | 0.1274 | 0.0944 | 0.9244 |
| All (Context + Content + Metadata) | 0.1231 | 0.0921 | 0.9285 |
| All + Comments | 0.1186 | 0.0877 | 0.9352 |
Table 6.
Comparison of Comments Prediction using the gradient boosting machine (GBM) tree method with a different set of features.
Table 6.
Comparison of Comments Prediction using the gradient boosting machine (GBM) tree method with a different set of features.
| Feature | RMSE | MAE | SRC |
|---|---|---|---|
| Days of week | 0.3425 | 0.2943 | 0.0224 |
| Days | 0.3279 | 0.2722 | 0.3335 |
| Time-event | 0.3379 | 0.2917 | 0.1278 |
| Hashtags | 0.3402 | 0.2925 | 0.1933 |
| Likes | 0.3050 | 0.2565 | 0.4055 |
| All Image Context | 0.3367 | 0.2832 | 0.2647 |
| All Image Content | 0.3420 | 0.2973 | 0.0339 |
| Image Context + Image Content | 0.3349 | 0.2818 | 0.2647 |
| All | 0.3316 | 0.2809 | 0.2866 |
| All + Likes | 0.2875 | 0.2368 | 0.5096 |
Table 7.
Comparison of Likes prediction using XGBoost tree method with specific feature combinations.
Table 7.
Comparison of Likes prediction using XGBoost tree method with specific feature combinations.
| Feature | RMSE | SRC |
|---|---|---|
| Days + hashtags + Indoor + Sat + Fri + food | 0.1200 | 0.9311 |
| Days + hashtags + Indoor + Sat + Fri + Mon | 0.1196 | 0.9314 |
| Days + hashtags + Indoor + Sat + Fri + Tue | 0.1213 | 0.9293 |
| Days + hashtags + Indoor + Sat + Fri + Wed | 0.1231 | 0.9269 |
| Days + hashtags + Indoor + Sat + Fri + Thu | 0.1221 | 0.9278 |
| Days + hashtags + Indoor + Sat + Fri + Sun | 0.1237 | 0.9242 |
| Days + hashtags + Indoor + Sat + Fri + Mon + food | 0.1202 | 0.9290 |
| Days + hashtags + Indoor + Sat + Fri + Mon + person | 0.1222 | 0.9278 |
| Days + hashtags + Indoor + Sat + Fri + Mon + food + Morning | 0.1246 | 0.9239 |
| Days + hashtags + Indoor + Sat + Fri + Mon + food + Afternoon | 0.1234 | 0.9276 |
| Days + hashtags + Indoor + Sat + Fri + Mon + food + Evening | 0.1207 | 0.9282 |
| Days + hashtags + Indoor + Sat + Fri + Mon + food + Night | 0.1231 | 0.9259 |
| Days + hashtags + Indoor + Sat + Fri + Mon + food + Evening + Morning | 0.1232 | 0.9257 |
| Days + hashtags + Indoor + Sat + Fri + Mon + food + Evening + Night | 0.1209 | 0.9293 |
| Days + hashtags + Indoor + Sat + Fri + Mon + food + Evening + Afternoon | 0.1220 | 0.9267 |
Table 8.
Comparison of Comments prediction using GBM tree method with specific feature combinations.
Table 8.
Comparison of Comments prediction using GBM tree method with specific feature combinations.
| Feature | RMSE | SRC |
|---|---|---|
| Days + hashtags + Indoor + Sat + Fri + food | 0.3327 | 0.3074 |
| Days + hashtags + Indoor + Sat + Fri + Mon | 0.3356 | 0.2748 |
| Days + hashtags + Indoor + Sat + Fri + Tue | 0.3309 | 0.3219 |
| Days + hashtags + Indoor + Sat + Fri + Wed | 0.3126 | 0.3285 |
| Days + hashtags + Indoor + Sat + Fri + Thu | 0.3337 | 0.2935 |
| Days + hashtags + Indoor + Sat + Fri + Sun | 0.3362 | 0.2528 |
| Days + hashtags + Indoor + Sat + Fri + Wed + food | 0.3353 | 0.2749 |
| Days + hashtags + Indoor + Sat + Fri + Wed + person | 0.3398 | 0.2416 |
| Days + hashtags + Indoor + Sat + Fri + Wed + food + Morning | 0.3351 | 0.2811 |
| Days + hashtags + Indoor + Sat+Fri + Wed + food + Afternoon | 0.3328 | 0.2991 |
| Days + hashtags + Indoor + Sat + Fri + Wed + food + Evening | 0.3346 | 0.2775 |
| Days + hashtags + Indoor + Sat + Fri + Wed + food + Night | 0.3329 | 0.2918 |
| Days + hashtags + Indoor + Sat + Fri + Wed + food + Afternoon + Morning | 0.3293 | 0.2990 |
| Days + hashtags + Indoor + Sat + Fri + Wed + food + Afternoon + Evening | 0.3343 | 0.2816 |
| Days + hashtags + Indoor + Sat + Fri + Wed + food + Afternoon + Night | 0.3382 | 0.2575 |
© 2020 by the authors. Licensee MDPI, Basel, Switzerland. This article is an open access article distributed under the terms and conditions of the Creative Commons Attribution (CC BY) license (http://creativecommons.org/licenses/by/4.0/).
Share and Cite
MDPI and ACS Style
Gupta, V.; Jung, K.; Yoo, S.-C. Exploring the Power of Multimodal Features for Predicting the Popularity of Social Media Image in a Tourist Destination. Multimodal Technol. Interact. 2020, 4, 64. https://doi.org/10.3390/mti4030064
AMA Style
Gupta V, Jung K, Yoo S-C. Exploring the Power of Multimodal Features for Predicting the Popularity of Social Media Image in a Tourist Destination. Multimodal Technologies and Interaction. 2020; 4(3):64. https://doi.org/10.3390/mti4030064
Chicago/Turabian StyleGupta, Vibhuti, Kwanghee Jung, and Seung-Chul Yoo. 2020. "Exploring the Power of Multimodal Features for Predicting the Popularity of Social Media Image in a Tourist Destination" Multimodal Technologies and Interaction 4, no. 3: 64. https://doi.org/10.3390/mti4030064