Augmented Reality: Advances in Diagnostic Imaging
by
 ,
,
David B. Douglas
1,* ,
,
Clifford A. Wilke
2,
J. David Gibson
3,
John M. Boone
4 and
Max Wintermark
1 1
Department of Radiology, Stanford University, Palo Alto, CA 94305, USA
2
CTO Federal Health Segment, DXC Technology, Herndon, VA 22102, USA
3
Chief Technologist, Digital Context Aware, DXC Technology, Austin, TX 78613, USA
4
Department of Radiology, University of California, Davis, CA 94720, USA
*
Author to whom correspondence should be addressed.
Multimodal Technol. Interact. 2017, 1(4), 29; https://doi.org/10.3390/mti1040029
Submission received: 29 August 2017
/
Revised: 3 November 2017
/
Accepted: 3 November 2017
/
Published: 8 November 2017
(This article belongs to the Special Issue Recent Advances in Augmented Reality)
Abstract
:In recent years, advances in medical imaging have provided opportunities for enhanced diagnosis and characterization of diseases including cancer. The improved spatial resolution provides outstanding detail of intricate anatomical structures, but has challenged physicians on how to effectively and efficiently review the extremely large datasets of over 1000 images. Standard volume rendering attempts to tackle this problem as it provides a display of 3D information on a flat 2D screen, but it lacks depth perception and has poor human–machine interface (HMI). Most recently, Augmented Reality/Virtual Reality (AR/VR) with depth 3-dimensional (D3D) imaging provides depth perception through binocular vision, head tracking for improved HMI and other key AR features. In this article, we will discuss current and future medical applications of AR including assessing breast cancer. We contend that leveraging AR technology may enhance diagnosis, save cost and improve patient care.
1. Introduction
Radiology is playing an ever increasing role in medical diagnosis. Many conditions are impossible to diagnose with a physical exam, and, as a result, radiological procedures such as computed tomography (CT) play an important role in healthcare today. Recent national trends document this increasing utilization of CT scans [1,2,3]. Estimates of the total annual costs of medical imaging have risen from almost 100 billion dollars in 2008 [4] to an estimated 200 billion today. Per capita imaging costs for women on Medicare were US$517. This portends increasing costs as America continues to age. An important question arises—how can we reduce these rising costs? We contend that a partial answer lies in combining Augmented Reality/Virtual Reality (AR/VR) with 3D medical imaging. Describing this combination and highlighting examples of potential utility is the purpose of this paper.
This paper will be organized into three sections. First, we will provide a background on cross-sectional imaging with a focus on CT and magnetic resonance imaging (MRI) and will include a discussion on the limitations of such viewing methods. Next, we will discuss advances in viewing methods including surface rendering, volume rendering, and depth-3-dimensional (D3D) imaging leveraging both AR and VR imaging capabilities. We will then discuss the current role of AR in diagnostic medical imaging and will highlight challenges that have been overcome through use of AR. We will conclude with a discussion of future roles of AR in diagnostic medical imaging.
1.1 Background on Cross-Sectional Diagnostic Imaging
Technical improvements in medical imaging have advanced the field of diagnostic imaging, yet have posed new challenges to the radiologist. In this section, we will provide a brief physics review of CT and MRI.
1.1.1. Computed Tomography (CT)
In a CT scan, the patient is placed in the horizontal position on a movable CT scanner table. The table is translated through a donut shaped device containing an X-ray tube and X-ray detector. Multiple projection images are acquired as the X-ray tube/detector assembly rotates around the patient. These data are used to reconstruct axial plane (x–y plane) images through processing techniques such as filtered back projection. Coronal plane (x–z plane) and sagittal plane (y–z plane) images are then reconstructed from the axial plane (x–y plane) images.
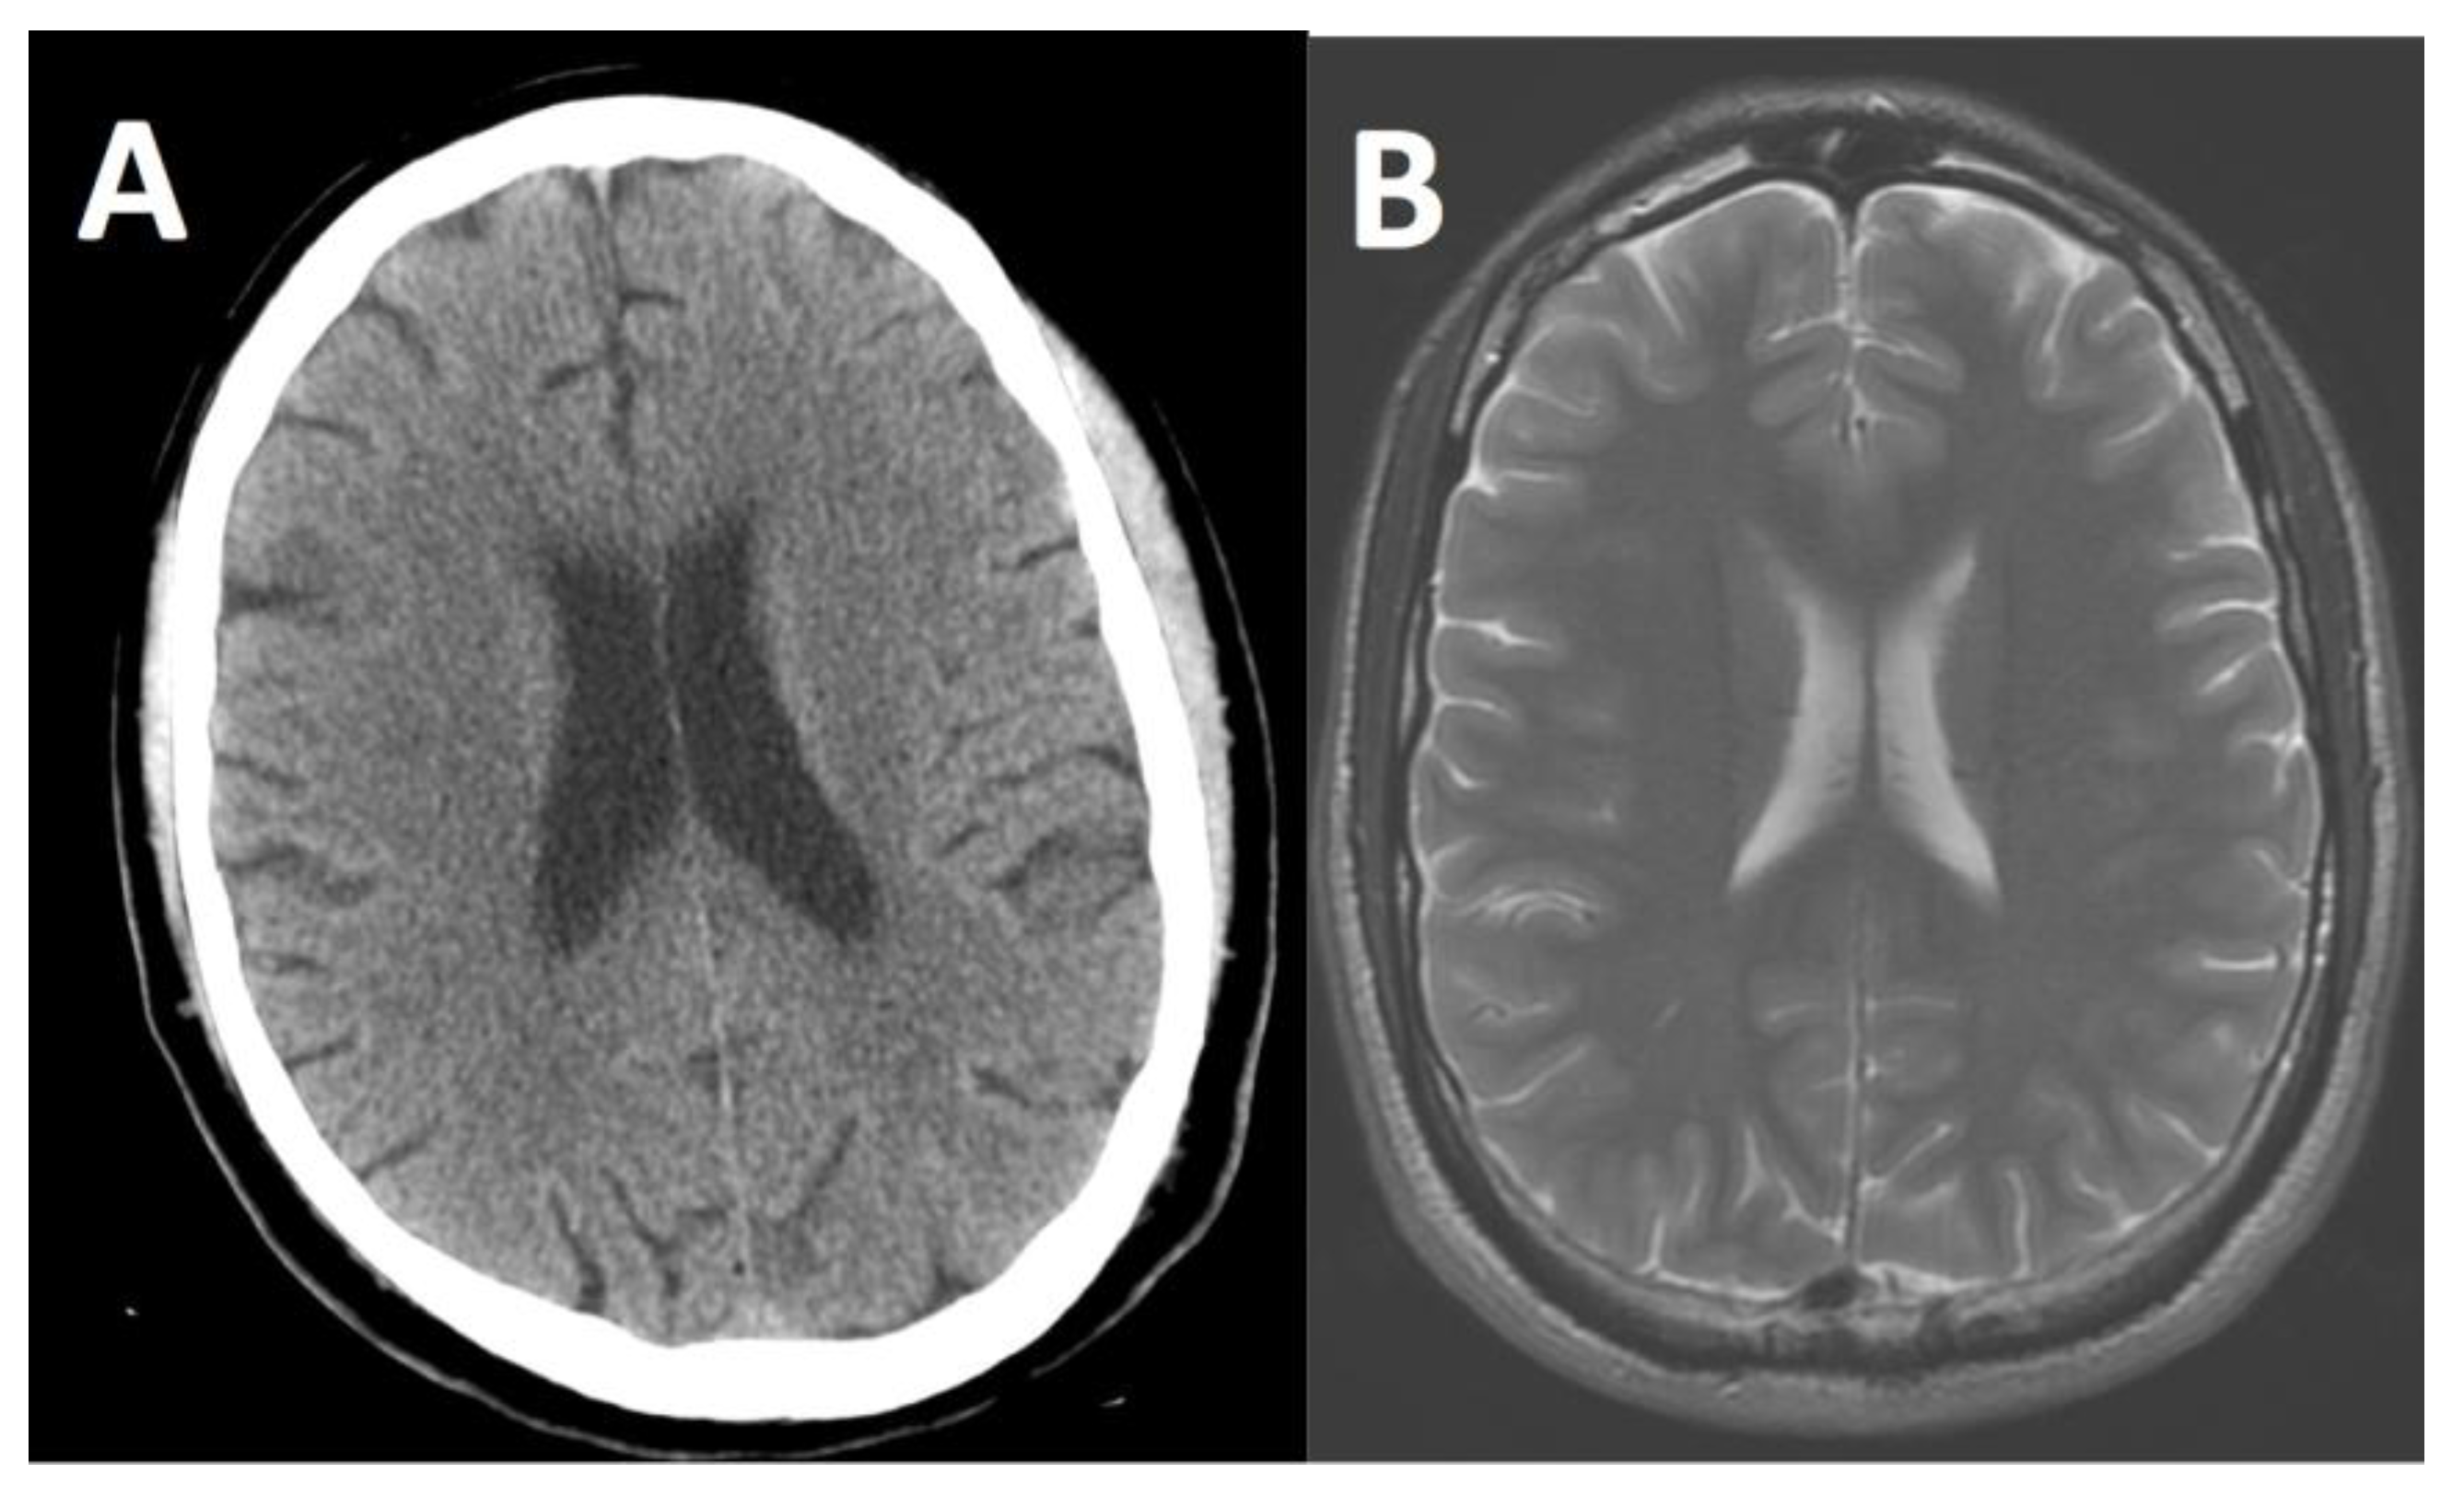
The matrix of an axial image is typically 512 × 512 pixels. A pixel in the axial plane is a 2D object with a discrete length in the x-direction and a discrete length in the y-direction. Each pixel in the CT scan image has an associated gray-scale value called a Hounsfeld Unit (HU), which is a function of the composition and density of the tissue. A voxel is a 3D object such as a cube created from the pixel, such as adding a third dimension to the axial plane pixel in the z-direction to create a volume. As a reference, extremely dense materials (e.g., compact bone) have a HU of approximately +1000 and very low-density materials (e.g., air) have a HU of −1000. Water has a HU of 0. Soft tissues in the body (e.g., brain, liver, kidneys, muscles, etc.) are slightly denser than water and have HUs on the order of 40. Fat is slightly less dense than water and has a HU of −100. See Figure 1.
Modern CT scans are acquired rapidly. As an example, a full body scan can be performed in about 15 s with spatial resolution of less than 1 mm. This offers incredible potential for assessing disease status and the assessment of trauma. In trauma centers, these head-to-toe “pan CT scans” are highly effective and efficient at surveying the internal organs, so the trauma surgeon can act quickly and in many cases save the patient’s life.
1.1.2. Magnetic Resonance Imaging (MRI)
In an MRI scan, the patient is placed in the horizontal position on an MRI scanner table, which is enclosed by a large cylindrical shaped device. The MRI utilizes a large main magnetic field directed through the long axis of the cylinder. Transmit coils send a radiofrequency (RF) pulse into the patient and receive coils process the returning electromagnetic signal from the body to create an image. The key advantage of an MRI scan over a CT scan is MRI’s ability to differentiate between many body tissues of similar density. MRI also does not employ ionizing radiation. MRI accomplishes this because different tissues in the body (e.g., brain tissue, water, fat, iron, etc.) behave differently in magnetic fields. As an example, different tissue types have different relaxation times from the RF stimulus, which provides differing levels of signal strength and high contrast in the images. MRI sequences can be optimized to distinguish between two tissues of similar density, such as the gray matter and white matter of the brain. Other MRI sequences have optimum imaging of the blood vessels.
The matrix of an MRI image is comparable to a CT image. MRI stores images in a similar fashion with each pixel of an image having a numerical value to correspond to its shade of gray.
Modern MRI scans require considerably more acquisition time than CT scans. For example, a brain MRI typically takes approximately 1 h. However, MRI does have superior contrast resolution of certain soft tissues, such as the gray matter and white matter in the brain as shown in Figure 1, and can enable diagnoses that are not possible with CT.
1.1.3. Conventional Viewing Methods and Challenges Thereof
The dramatic improvements in spatial resolution (commonly smaller than 1 mm) in both CT and MRI have challenged radiologists with information overload. As an example, a chest CT has over 500 axial plane images. A slice of the torso with a matrix of 512 (X-direction) by 512 (Y-direction) would have 262,144 pixels on a single slice. With 500 axial slices (Z-direction), the data set would include 131 million pixels. Each point has a unique gray level, which correlates to the density of the tissue at that point in the body. These points are standardly projected on the 2D display monitor.
In addition to axial plane images, the radiologist must review coronal plane and sagittal plane images, which can total over 1000 images for a single chest CT examination. The radiologist must go through each 2D slice and mentally build a 3D volume construct, which can be extremely challenging depending on the complexity of the anatomy [4].
A further challenge for radiologists to overcome is ensuring a very thorough look at each of these pixels. An example is in detecting tumors in an early stage. Catching tumors in an early stage is extremely important for patient survival and reduced cost of treatment as well. However, early stage tumors can span only a few pixels in each direction and may be only a few shades of gray different from surrounding tissue. They are easy to miss and the consequences can be severe for the patients, such as an initial presentation in an advanced stage of cancer. A very deliberate viewing process—slice by slice—takes considerable time.
As a result of the large, complex datasets, innovative viewing methods have emerged. In this paper, we will focus on the imaging techniques that can improve the visualization of the human body’s complex 3D anatomy.
2. Recent Advances in Viewing Methods
2.1. Surface Rendering
Surface rendering, also known as shaded surface display, was the first 3D rendering technique to display the human body’s 3D anatomy. In this technique, apparent surfaces within the body are determined through segmentation techniques including thresholding to limit the display to only a prescribed set of pixels. Then, a virtual light source is computed to provide surface shading. Since only a single surface is selected, this technique is not limited by overlapping of multiple structures within the human body. However, surface rendering is limited due to the fact that only a small percentage of the data is displayed at a single time. Many anatomical structures within the human body do not have well-defined surfaces and would not be effectively imaged with surface rendering techniques. Furthermore, while surface rendering images have a 3D appearance due to the virtual light source, surface rendering does not provide true depth perception.
2.2. Volume Rendering
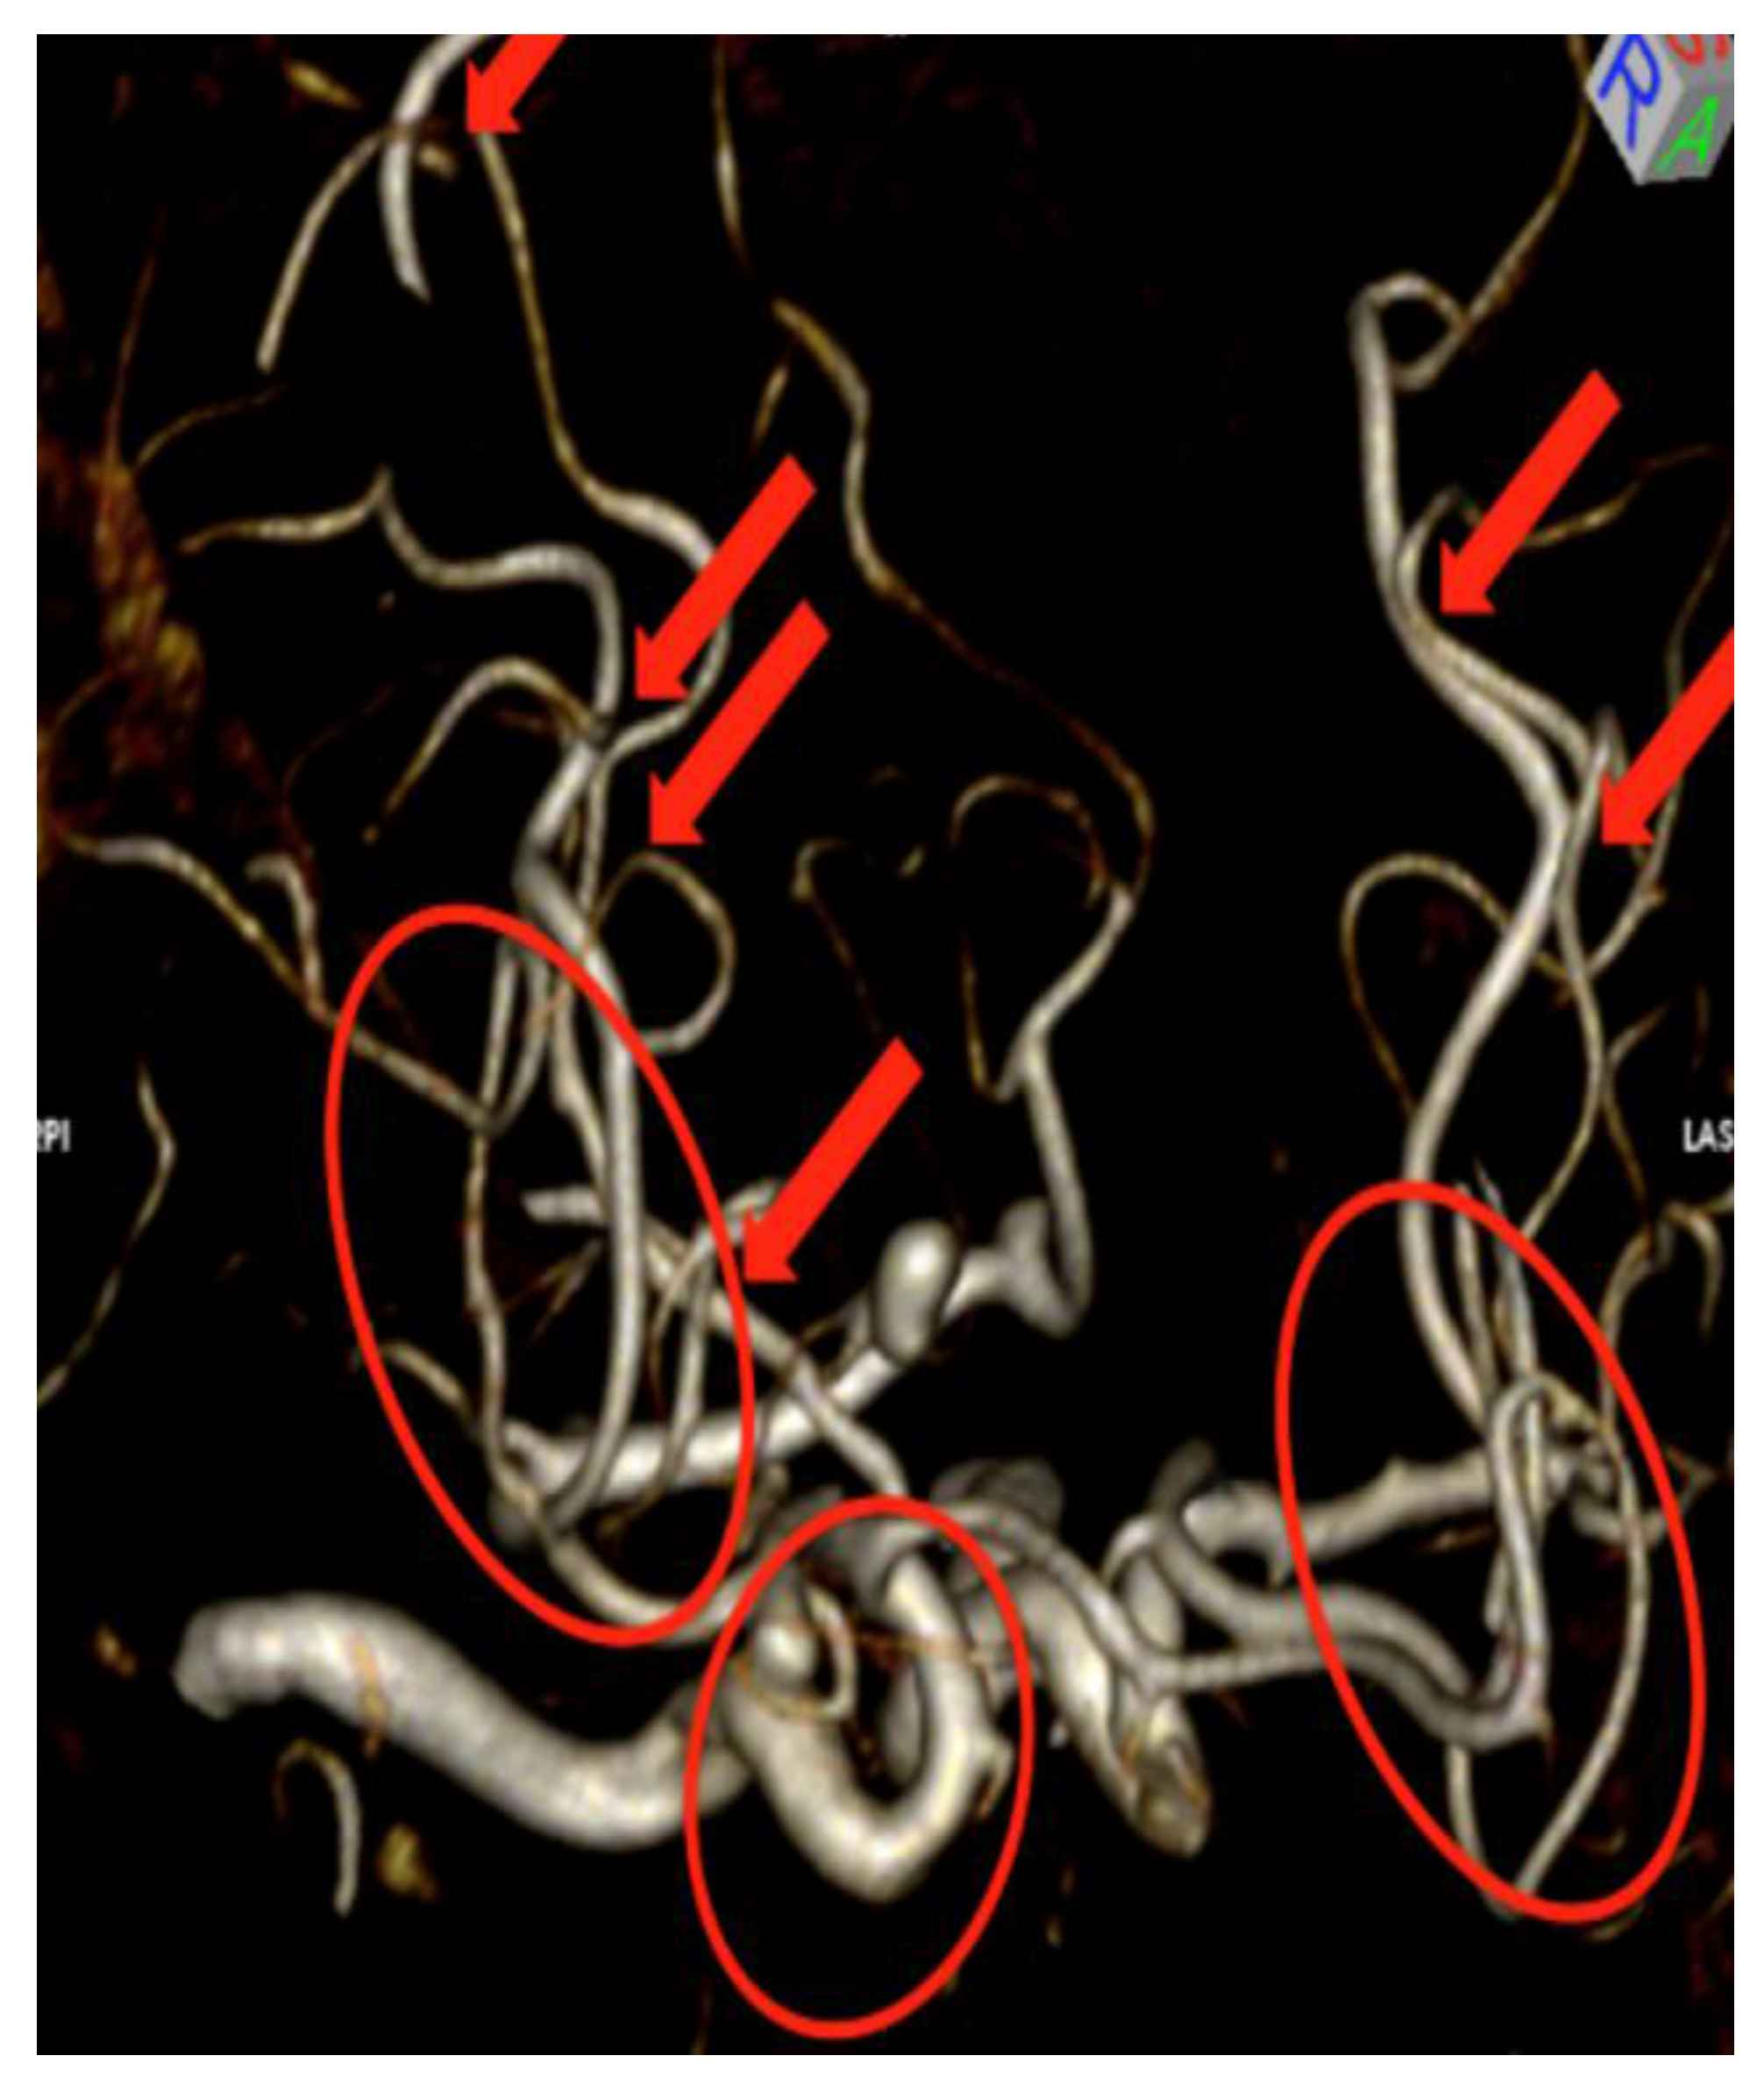
Volume rendering is a technique that has also been researched for many years in the computer graphics and visualization community and has recently been applied to diagnostic medical imaging [5]. In contrast to surface rendering which requires segmentation, volume rendering does not typically require segmentation. However, if segmentation is performed during volume rendering, the entire volume or subset of the volume can be retained [5]. Values of interest are typically defined by using a transfer function (assigning color and opacity to each intensity value). While this technology is more computationally demanding than surface rendering, it has several advantages. The primary advantage is that it enables the radiologist to view the volume contiguously. Which points on slice N are connected to which points in slice N + 1? When the volume is created for 3D rendering, the slices are stacked up in the proper sequence and a non-overlapping volume of voxels is created. Looking at volume rendering is much easier than keeping track of over/underlaps as viewed by individual slices. This has significantly helped radiologists visualize complex 3D structures to include vasculature [6]. There are several image processing tools that are common to both volume rendering and AR/VR including rotating the volume (up/down, clockwise/counter clockwise); zooming into the image and back out; and adding a virtual light source. A key limitation of volume rendering is overlap, as shown in Figure 2 and Figure 3 below.
Fishman et al. and Johnson et al. have both documented advantages in displaying certain complex anatomical structures by volume rendering, but acknowledged the limitations due to overlapping anatomy [7,8]. There have been considerable efforts to overcome this limitation including importance-driven volume rendering [9], smart visibility [10] and curved planar reformation [11]. As one radiologist put it—“This is like looking at a bowl of spaghetti”. This radiologist prefers standard axial, sagittal and coronal plane imaging rather than volume rendering imaging for interpretation. The conclusion of many radiologists is that overlapping structures are difficult to visualize and leave an uneasy feeling among many radiologists as if they may be missing something that lies behind other structures. Typical displays for conventional volume rendering include high definition computer monitors.
2.3. Depth 3-Dimensional (D3D) Imaging
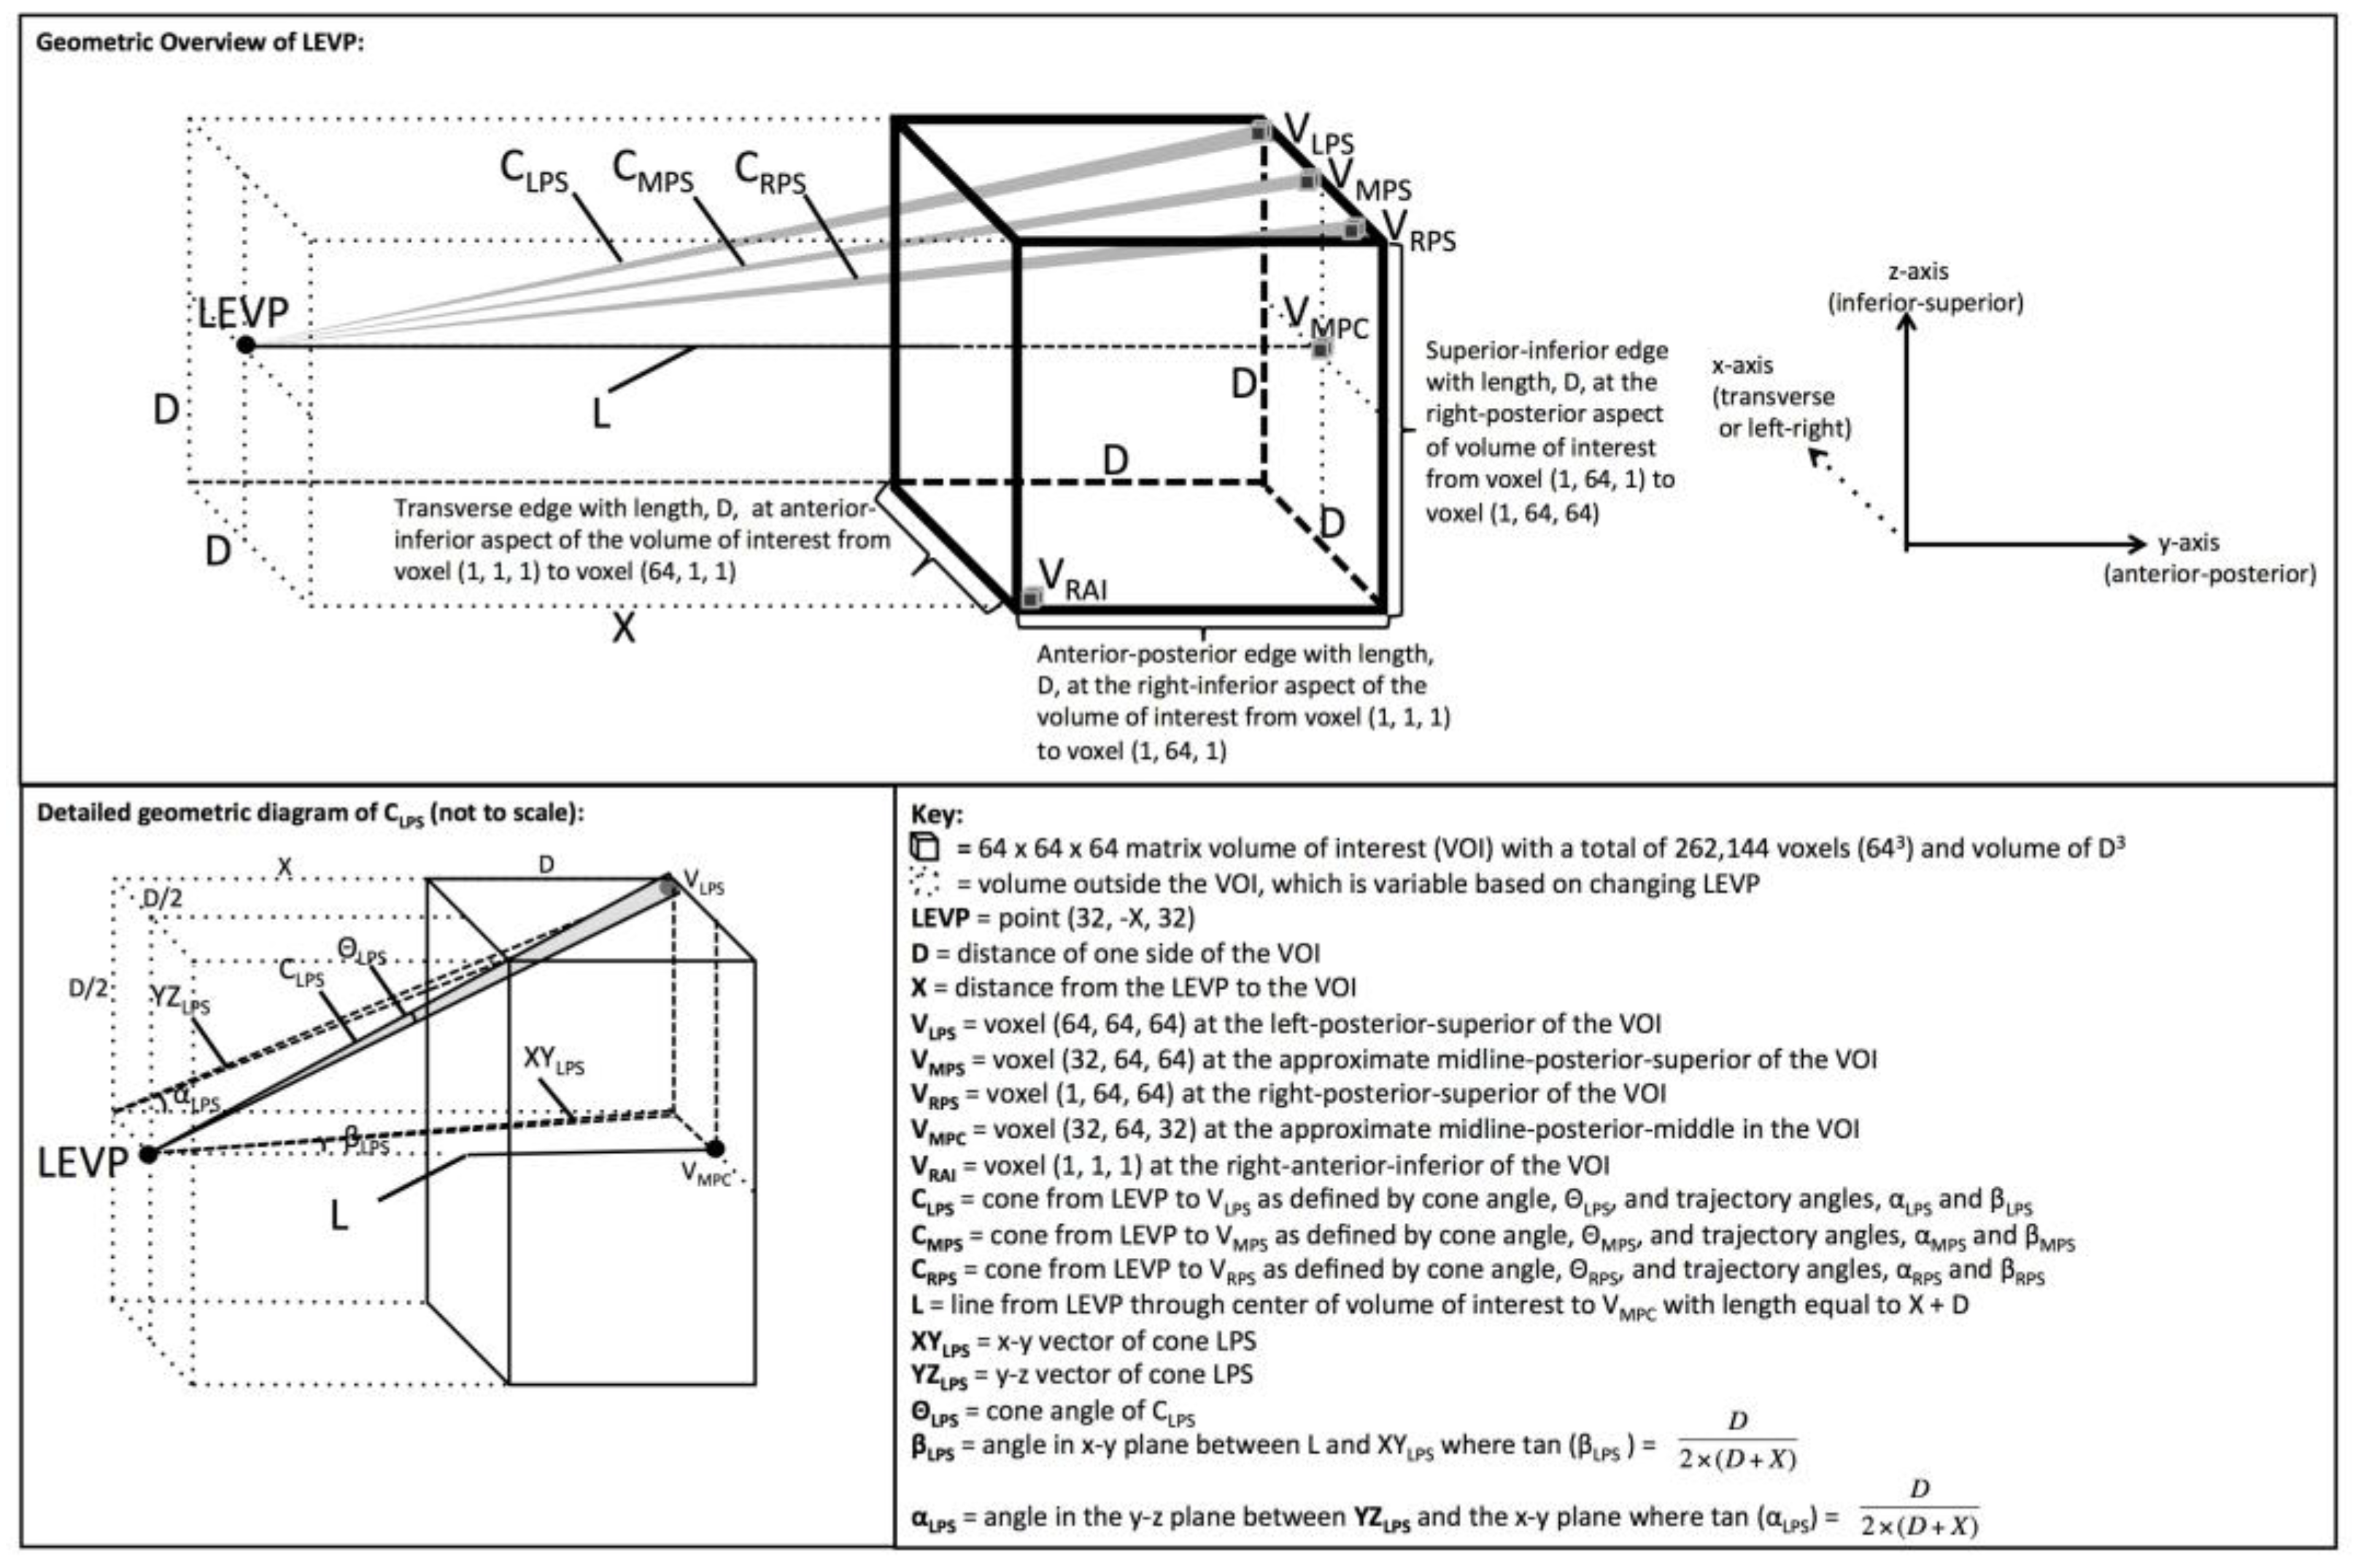
Depth 3-dimensional (D3D) is a system that can be used with either VR or AR, depending on the selected head mounted display (HMD) [12]. In this system, the D3D user wears a HMD that displays a separate image to each eye so the user has binocular disparity and depth perception. The unique left and right viewing perspectives are created in real time per user input through a computationally demanding image processing algorithm, which matches the way light naturally enters the eye by converging into one focal point rather than through a parallel ray technique (see Figure 4). Furthermore, this technique includes a proprietary-based context-based segmentation and priority-based filtering to accompany the 3D rendering [13,14].
2.4. Virtual Reality
VR technologies can be characterized as either non-immersive such as desktop computers, semi-immersive or fully immersive VR [16]. In fully immersive VR, the HMD presents a virtual image and completely occludes the real-world from the user’s field of view, as is seen in the Oculus Rift and HTC Vive [17]. In semi-immersive VR, the HMD presents a virtual image and partially occludes the real-world from the user’s field of view, as is seen in Samsung Gear VR [17]. In VR, the user can maneuver through the virtual world by head movements (via HMD tracking) or walking (via external camera tracking). The user can interact with the virtual environment through handheld devices with haptic feedback or voice gestures. One of the challenges of VR is the lack of accurate head-tracking and motion sickness [18].
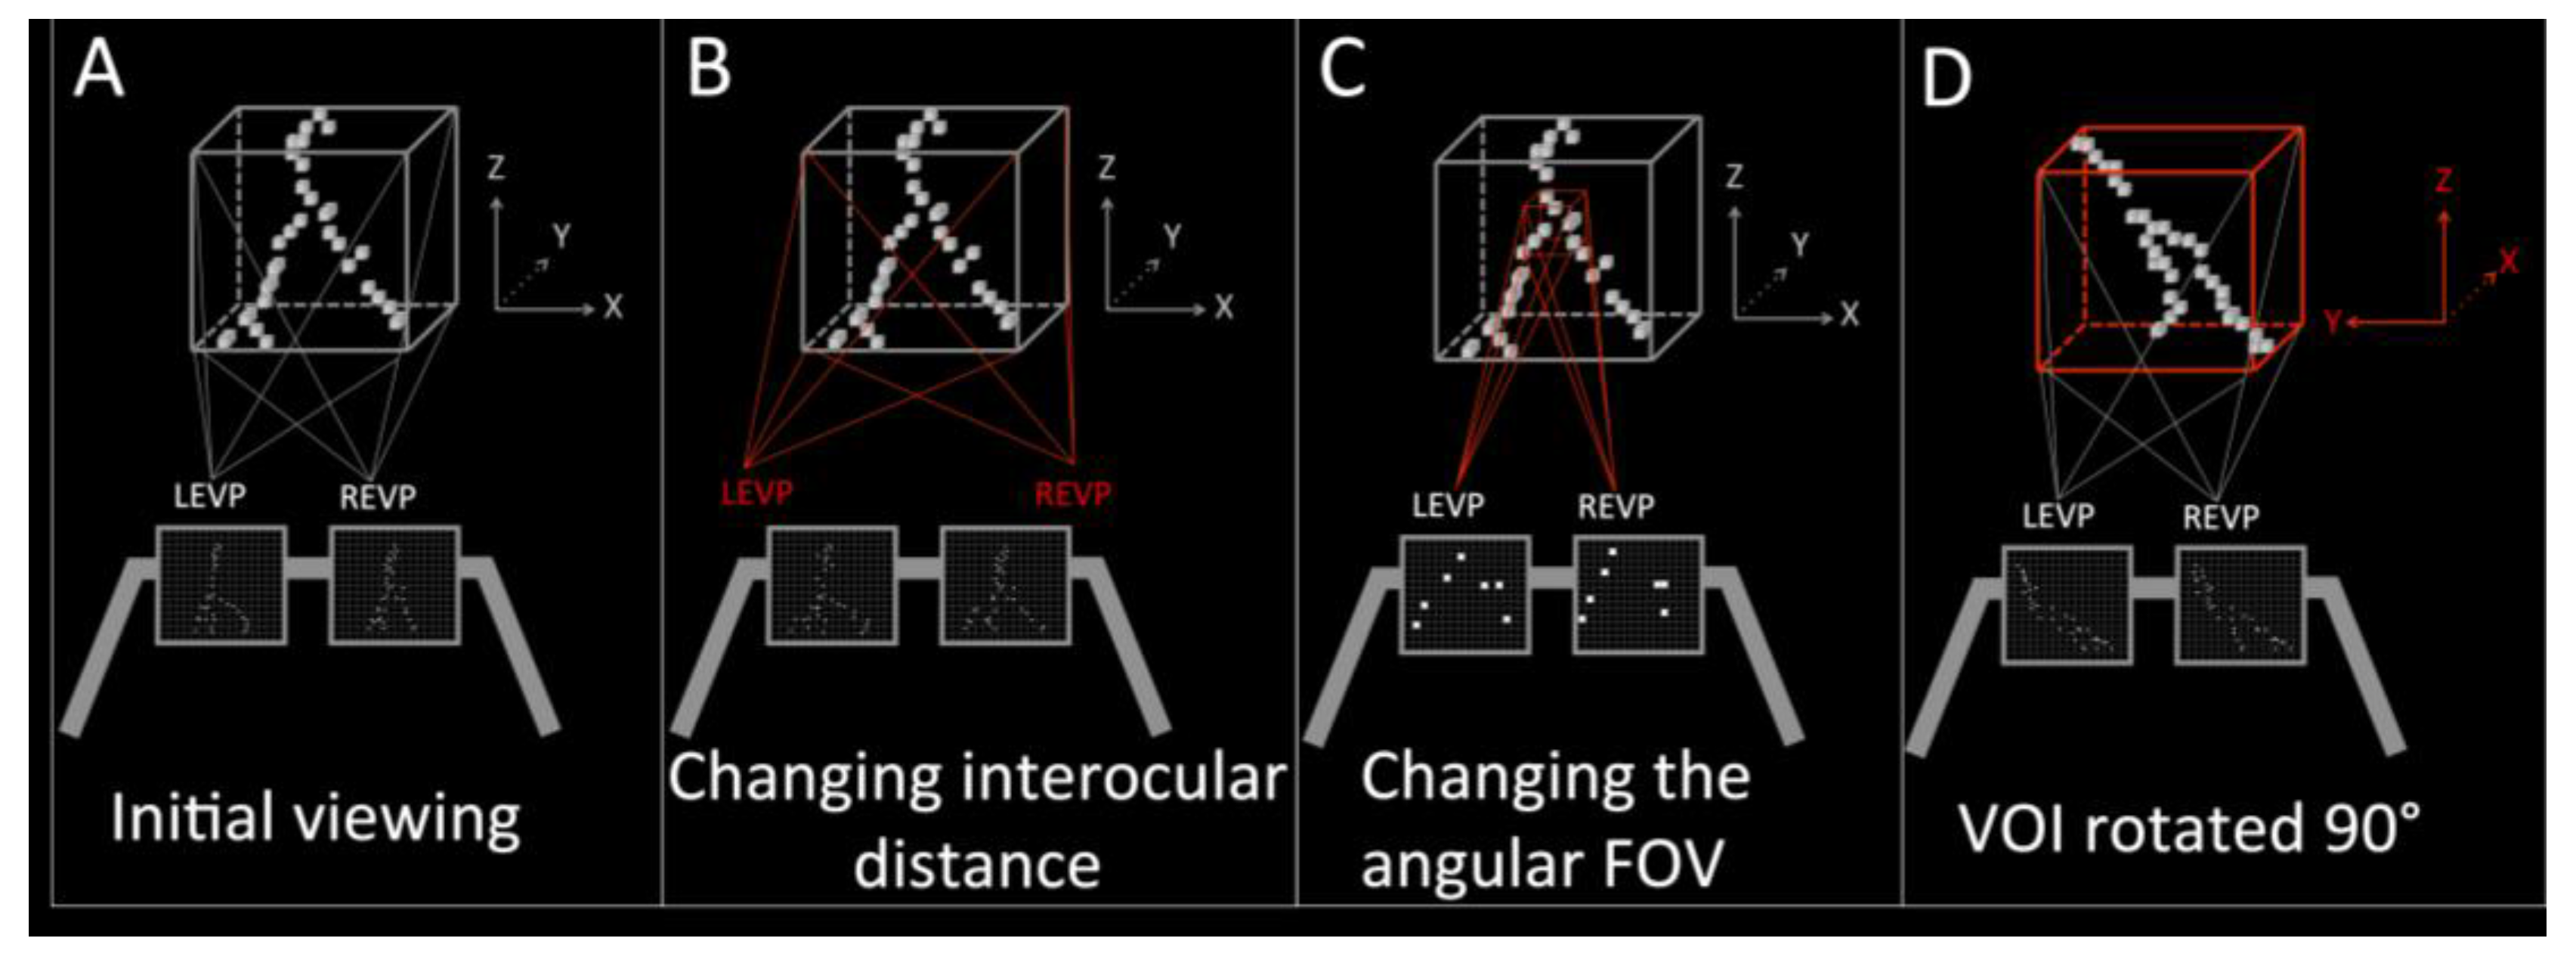
Virtual reality viewing of medical images is not currently Food and Drug Administration (FDA) approved. One medical application of the VR system that is being researched is imaging of breast cancer. Breast cancer is one of the leading causes of death in women [19,20]. Classifying the pattern of microcalcifications as “cluster”, “linear” or “branching” is important in determining the risk of cancer [21,22]. The pattern most concerning for cancer is the “branching” pattern [23,24]. In a recent study on using simulated data of breast microcalcifications, the linear and branching patterns of microcalcifications were better characterized with the D3D VR system as compared to viewing on a flat screen [15]. In fact, the radiologist rated the linear and branching pattern as a cluster on the 2D monitor, which would equate to a false negative (missing cancer), but correctly characterized it as linear and branching (true positive) with the D3D system [9]. Additionally, the authors noted that the HMD display coupled with the joystick control system yielded an improved human–machine interface (HMI) with an immersive fly-through experience with rotation and zooming capabilities (see Figure 5 and Figure 6).
2.5. Augmented Reality
Augmented reality (AR) technologies can be characterized into AR or mixed reality (MR). Both AR and MR have simultaneous display of a virtual image and a real-world image allowing the user to simultaneously interact with the real-world and the virtual image [25]. In both of these technologies, the user wears a HMD to display the virtual image and the real-world image. In AR, the virtual image is transparent like a hologram as is seen in Meta and DAQRI systems. In MR, the virtual image appears solid as is seen in the Microsoft Hololens.
AR viewing of medical images is not currently FDA approved for diagnostic radiology. The user receives simultaneous display of a virtual image from the patient’s imaging examination and the real-world image of the surroundings, which would vary based on the task being accomplished. The real-world image would be the patient’s anatomy if an integrated physical exam and medical imaging assessment, pre-operative planning assessment or intraoperative procedure were being conducted. In other circumstances, the real-world image could include other environments, such as the operating suite, educational lecture hall, radiology reading room or physician office.
Application of AR to Breast Cancer Diagnostic Imaging
Regarding breast cancer diagnosis, a critical role of the radiologist in assessing the risk of malignant potential of breast mass is accurately characterizing the shape and margins of the mass [26]. In regards to breast cancer treatment, imaging is now playing a major role since the tumor shrinkage is known to correlate with the efficacy of neoadjuvant chemotherapy (NACT) in advanced breast cancer [27]. The recent Investigation of Serial Studies to Predict Your Therapeutic Response with Imaging and Molecular Analysis (I-SPY) trial documented this importance of the morphology of the breast tumor as phenotypic appearances of the tumor margins correlated with the pathologic response to NACT. Furthermore, tumor morphology contributed to the clinical recommendation of whether the patient should undergo breast conservation therapy or mastectomy [26]. In fact, the MRI appearance was a better predictor for pathologic response as compared to the clinical assessment. Dedicated breast CT images also provide high spatial resolution images of breast masses [28] and the shape and margins can be carefully assessed. Spiculations (spikes extending from the surface of the mass) are a feature highly concerning for breast cancer. A known breast cancer imaged with a dedicated breast CT was viewed with the D3D system and the radiologist noted that the shape, margins and spiculations were better visualized with the D3D system than conventional 2D imaging [29] (see Figure 7).
3. Future Role of AR/VR in Diagnostic Medical Imaging
AR/VR may advance diagnostic imaging further. In oncology, imaging is critical in detection, diagnosis and treatment monitoring. During administration of chemotherapy, serial imaging of a tumor can be viewed with AR/VR to determine how the tumor changes in its overall size, involvement of adjacent structures, shape and margins. Tissue segmentation and subtraction can isolate the tumor’s outer shell for precise characterization of how the tumor changes over time as compared to its previous appearance. Improvements in the breast CT’s spatial resolution [30,31] and contrast resolution [32] are foreseeable and will provide larger databases and an even greater importance of image optimization, possibly with AR/VR imaging.
AR/VR may also enhance communication between the radiologist and surgeons. Currently, the radiologist provides tumor location information including the laterality (right breast verses left breast), the o’clock position, distance from the nipple and size of the tumor, but this could be enhanced through the use of augmented reality with additional metrics to include orientation, 3D location of spiculations and proximity to adjacent structures. Specifically, pre-operative mark-up of tumor boundaries combined with precision registration would provide an enhanced understanding of the complex tumor anatomy and help yield complete tumor resection during lumpectomies without residual tumor left behind.
3.1. What Are the Potential Advantages of the AR/VR Approach?
Most importantly, it should be noted that a direct comparison between AR/VR and volume rendering has not yet been performed in diagnostic imaging, so this question cannot yet be answered. However, there are theoretically potential advantages of AR/VR over traditional volume rendering techniques, but these are yet to be proven.
First, the depth perception achieved with AR/VR may reduce computer processing invoked with volume rendering techniques (e.g., creating an artificial light source and generating shadowing effects from structures within the image) and reduce processing related interpretation errors. The depth perception may improve visualization and lesion characterization, such as microcalcification patterns [15,29]. Finally, depth perception may reduce the amount of manual thresholding yielding faster, and allow more complete understanding of complex anatomical structures.
Second, the addition of digital content to the scene and radiologist utilization processing tools may be more effectively carried out in the AR/VR environment. Several examples include use of computer aided detection (CAD); use of a 3D cursor of variable size in the shape of a cube or sphere; using false color to connote different parts of the anatomy; inserting arrows to highlight the locations of micro-calcifications for physician communication; and improve patient–physician communications. The net effect of VR/AR may be to increase the use of the aforementioned tools and procedures to improve patient care and help manage the very high volume of data.
Third, the AR/VR headset allows for the potential of improved human control interface capabilities. Some commercial headsets with independent eye displays have capabilities to track head motion. If the head turns right, the viewing direction turns a corresponding angular change to the right; likewise for up and down. Thus, the radiologist can gain a quick understanding of the patient’s anatomy and then zoom to specific areas where there may be concern. A gaming industry handset or controller on the augmented reality device can be utilized. With the controller, the radiologist or end user can rapidly change the viewpoint positions, zoom, rotate, move the 3D cursor, etc.
To emphasize the point made early in the article, the AR/VR system provides key possible benefits. First, it holds promise in having a higher probability of early detection of tumors because with the true 3D AR, one can rotate, zoom and fly into the 3D volume and small tumors that may be occluded with other approaches [15,29]. The true 3D AR opens new possibilities in viewing that may enable the radiologist to gain a clear picture of anomalies such as the tell-tale distribution of microcalcifications and thereby provide more accurate diagnoses. Together, these advances may provide the possibility of lower misdiagnoses with improved patient care, reduced patient anxiety and resultant lower cost. Future applications of AR/VR with D3D may include complex imaging such as the connections of the brain as in diffusion tensor imaging [33,34], dual positron emission tomography (PET)-MRI [35] or even 3D facial recognition, analysis or cosmesis [36,37,38].
3.2. What Are the Potential Limitations of the AR/VR Approach over Volume Rendering?
First, it should be noted that while depth perception reduces the overlapping structures problem, it does not eliminate it entirely. Second, as previously mentioned, one of the challenges of VR is motion sickness [18], which is related to poor head tracking. Motion sickness could compromise the radiologist’s attention to detail and he/she may misclassify the critical finding. Third, a key challenge is acceptance of the HMD into the radiology reading room. There has been extensive research into the augmented reality in surgery [39,40,41] and experience has dictated that bulky HMDs will not be accepted into the operating room by surgeons [42].
4. Conclusions
In this article, we reviewed CT and MRI image acquisition, standard three-plane cross-sectional interpretation and discussed advanced 3D imaging techniques including surface rendering, volume rendering, D3D, VR and AR. While a side-by-side comparison of volume rendering and AR/VR has not yet been performed, we discussed potential advantages and disadvantages of these techniques. Examples included determining the patterns of microcalcification in breast cancer; qualitative assessment for changes in tumor shape and margins; improved human–machine interface; and enhancing communication between radiologists and surgeons. Future research in diagnostic imaging should include a comparison of volume rendering, AR and VR techniques.
Author Contributions
Author D.B.D. is the corresponding author and contributed to every section of the paper via writing or editing. C.A.W. was the lead author on Section 2.5. J.D.G. was the lead author on Section 2.4. J.M.B. helped write and edit Section 1.1, Section 1.1.1, Section 1.1.2, and Section 1.1.3. M.W. was the lead author on Section 2.1 and Section 2.2. All authors have read and approved the final manuscript.
Conflicts of Interest
Author D.B.D has a family member with a financial interest in D3D Enterprises. C.A.W. and J.D.G. are employees of DXC Technology (formerly Hewlett-Packard Enterprise). J.M.B. has a financial interest in breast CT. M.W. has no conflict of interest.
References
- Mettler, F.A., Jr.; Wiest, P.W.; Locken, J.A.; Kelsey, C.A. CT scanning: Patterns of use and dose. J. Radiol. Prot. 2000, 20, 353. [Google Scholar] [CrossRef] [PubMed]
- Mitchell, D.G.; Parker, L.; Sunshine, J.H.; Levin, D.C. Body MR imaging and CT volume: Variations and trends based on an analysis of medicare and fee-for-service health insurance databases. Am. J. Roentgenol. 2002, 179, 27–31. [Google Scholar] [CrossRef] [PubMed]
- Boone, J.M.; Brunberg, J.A. Computed tomography use in a tertiary care university hospital. J. Am. Coll. Radiol. 2008, 5, 132–138. [Google Scholar] [CrossRef] [PubMed]
- Ferroli, P.; Tringali, G.; Acerbi, F.; Schiariti, M.; Broggi, M.; Aquino, D.; Broggi, G. Advanced 3-imensional planning in neurosurgery. Neurosurgery 2013, 72, A54–A62. [Google Scholar] [CrossRef] [PubMed]
- Hohne, K.H.; Bomans, M.; Tiede, U.; Riemer, M. Display of Multiple 3d-Objects Using the Generalized Voxel-Model. In Proceedings of the SPIE 0914, Medical Imaging II, Newport Beach, CA, USA, 27 June 1988. [Google Scholar]
- Calhoun, P.S.; Kuszyk, B.S.; Heath, D.G.; Carley, J.C.; Fishman, E.K. Three-dimensional volume rendering of spiral CT data: Theory and method. Radiographics 1999, 19, 745–764. [Google Scholar] [CrossRef] [PubMed]
- Fishman, E.K.; Ney, D.R.; Heath, D.G.; Corl, F.M.; Horton, K.M.; Johnson, P.T. Volume rendering versus maximum intensity projection in CT angiography: What works best, when, and why. Radiographics 2006, 26, 905–922. [Google Scholar] [CrossRef] [PubMed]
- Johnson, P.T.; Heath, D.G.; Kuszyk, B.S.; Fishman, E.K. CT angiography with volume rendering: Advantages and applications in splanchnic vascular imaging. Radiology 1996, 200, 564–568. [Google Scholar] [CrossRef] [PubMed]
- Viola, I.; Kanitsar, A.; Groller, M.E. Importance-driven volume rendering. In Proceedings of the IEEE Visualization 2004, Austin, TX, USA, 10–15 October 2004; IEEE Computer Society: Washington, DC, USA, 2004; pp. 139–146. [Google Scholar]
- Viola, I.; Gröller, E. Smart Visibility in Visualization. Available online: https://www.cg.tuwien.ac.at/research/publications/2005/TR-186-2-05-06/TR-186-2-05-06-Paper.pdf (accessed on 29 August 2017).
- Kanitsar, A.; Wegenkittl, R.; Fleischmann, D.; Groller, M.E. Advanced Curved Planar Reformation: Flattening of Vascular Structures; IEEE: Piscataway, NJ, USA, 2003. [Google Scholar]
- Douglas, D.B.; Douglas, R.E. Method and Apparatus for Three Dimensional Viewing of Images. U.S. Patent 9,473,766 B2, 18 October 2016. [Google Scholar]
- Douglas, D. Method and Apparatus for Three Dimensional Viewing of Images. U.S. Patent 8,384,771 B1, 26 February 2013. [Google Scholar]
- Douglas, D.; Douglas, R.E. Method and Apparatus for Three Dimensional Viewing of Images. U.S. Patent 9,349,183 B1, 24 May 2016. [Google Scholar]
- Douglas, D.B.; Petricoin, E.F.; Liotta, L.; Wilson, E. D3D augmented reality imaging system: Proof of concept in mammography. Med. Devices 2016, 9, 277–283. [Google Scholar] [CrossRef] [PubMed]
- Baus, O.; Bouchard, S. Moving from virtual reality exposure-based therapy to augmented reality exposure-based therapy: A review. Front. Hum. Neurosci. 2014, 8, 112. [Google Scholar] [CrossRef] [PubMed]
- MEREL, T. The 7 Drivers of the $150 Billion AR/VR Industry; Aol Tech: New York, NY, USA, 2015. [Google Scholar]
- Chen, W.; Chao, J.-G.; Zhang, Y.; Wang, J.-K.; Chen, X.-W.; Tan, C. Orientation Preferences and Motion Sickness Induced in a Virtual Reality Environment. Aerosp. Med. Hum. Perform. 2017, 88, 903–910. [Google Scholar] [CrossRef] [PubMed]
- Ferlay, J.; Shin, H.R.; Bray, F.; Forman, D.; Mathers, C.; Parkin, D.M. Estimates of worldwide burden of cancer in 2008: GLOBOCAN 2008. Int. J. Cancer 2010, 127, 2893–2917. [Google Scholar] [CrossRef] [PubMed]
- DeSantis, C.; Ma, J.; Bryan, L.; Jemal, A. Breast cancer statistics, 2013. CA Cancer J. Clin. 2014, 64, 52–62. [Google Scholar] [CrossRef] [PubMed]
- Howell, A. The emerging breast cancer epidemic: Early diagnosis and treatment. Breast Cancer Res. 2010, 12, S10. [Google Scholar] [CrossRef] [PubMed]
- Kopans, D. Analyzing the Mammogram—Calcifications; Lippincott-Raven: Philadelphia, PA, USA, 1998. [Google Scholar]
- Lee, K.S.; Han, B.H.; Chun, Y.K.; Kim, H.S.; Kim, E.E. Correlation between mammographic manifestations and averaged histopathologic nuclear grade using prognosis-predict scoring system for the prognosis of ductal carcinoma in situ. Clin. Imaging 1999, 23, 339–346. [Google Scholar] [CrossRef]
- Burnside, E.S.; Ochsner, J.E.; Fowler, K.J.; Fine, J.P.; Salkowski, L.R.; Rubin, D.L.; Sisney, G.A. Use of microcalcification descriptors in BI-RADS 4th edition to stratify risk of malignancy. Radiology 2007, 242, 388–395. [Google Scholar] [CrossRef] [PubMed]
- Lovo, E.E.; Quintana, J.C.; Puebla, M.C.; Torrealba, G.; Santos, J.L.; Lira, I.H.; Tagle, P. A novel, inexpensive method of image coregistration for applications in image-guided surgery using augmented reality. Neurosurgery 2007, 60, 366–371. [Google Scholar] [CrossRef] [PubMed]
- Mukhtar, R.A.; Yau, C.; Rosen, M.; Tandon, V.J.; I-Spy, T.; Investigators, A.; Hylton, N.; Esserman, L.J. Clinically meaningful tumor reduction rates vary by prechemotherapy MRI phenotype and tumor subtype in the I-SPY 1 TRIAL (CALGB 150007/150012; ACRIN 6657). Ann. Surg. Oncol. 2013, 20, 3823–3830. [Google Scholar] [CrossRef] [PubMed]
- Khokher, S.; Qureshi, M.U.; Chaudhry, N.A. Comparison of WHO and RECIST criteria for evaluation of clinical response to chemotherapy in patients with advanced breast cancer. Asian Pac. J. Cancer Prev. 2012, 13, 3213–3218. [Google Scholar] [CrossRef] [PubMed]
- Boone, J.M.; Lindfors, K.K. Breast CT: Potential for breast cancer screening and diagnosis. Future Oncol. 2006, 2, 351–356. [Google Scholar] [CrossRef] [PubMed]
- Douglas, D.B.; Boone, J.M.; Petricoin, E.; Liotta, L.; Wilson, E. Augmented Reality Imaging System: 3D Viewing of a Breast Cancer. J. Nat. Sci. 2016, 2, e215. [Google Scholar] [PubMed]
- Willekens, I.; Van de Casteele, E.; Buls, N.; Temmermans, F.; Jansen, B.; Deklerck, R.; de Mey, J. High-resolution 3D micro-CT imaging of breast microcalcifications: A preliminary analysis. BMC Cancer 2014, 14, 9. [Google Scholar] [CrossRef] [PubMed]
- Gazi, P.M.; Yang, K.; Burkett, G.W., Jr.; Aminololama-Shakeri, S.; Seibert, J.A.; Boone, J.M. Evolution of spatial resolution in breast CT at UC Davis. Med. Phys. 2015, 42, 1973–1981. [Google Scholar] [CrossRef] [PubMed]
- Yang, K.; Burkett, G.; Boone, J.M. A breast-specific, negligible-dose scatter correction technique for dedicated cone-beam breast CT: A physics-based approach to improve Hounsfield Unit accuracy. Phys. Med. Biol. 2014, 59, 6487–6505. [Google Scholar] [CrossRef] [PubMed]
- Douglas, D.B.; Iv, M.; Douglas, P.K.; Anderson, A.; Vos, S.B.; Bammer, R.; Zeineh, M.; Wintermark, M. Diffusion Tensor Imaging of TBI: Potentials and Challenges. Top. Magn. Reson. Imaging 2015, 24, 241–251. [Google Scholar] [CrossRef] [PubMed]
- Douglas, D.; Goubran, M.; Wilson, E.; Xu, G.; Tripathi, P.; Holley, D.; Chao, S.; Wintermark, M.; Quon, A.; Zeineh, M. Correlation between arterial spin labeling MRI and dynamic FDG on PET-MR in Alzheimer’s disease and non-Alzhiemer’s disease patients. EJNMMI Phys. 2015, 2, A83. [Google Scholar] [CrossRef] [PubMed]
- Goubran, M.; Douglas, D.; Chao, S.; Quon, A.; Tripathi, P.; Holley, D.; Vasanawala, M.; Zaharchuk, G.; Zeineh, M. Assessment of PET & ASL metabolism in the hippocampal subfields of MCI and AD using simultaneous PET-MR. EJNMMI Phys. 2015, 2, A73. [Google Scholar] [PubMed]
- Berretti, S.; Del Bimbo, A.; Pala, P. 3D face recognition using isogeodesic stripes. IEEE Trans. Pattern Anal. Mach. Intell. 2010, 32, 2162–2177. [Google Scholar] [CrossRef] [PubMed]
- Marcolin, F.; Vezzetti, E. Novel descriptors for geometrical 3D face analysis. Multimed. Tools Appl. 2017, 76, 13805–13834. [Google Scholar] [CrossRef]
- Vezzetti, E.; Speranza, D.; Marcolin, F.; Fracastoro, G. Diagnosing cleft lip pathology in 3d ultrasound: A landmarking-based approach. Image Anal. Stereol. 2015, 35, 53–65. [Google Scholar] [CrossRef]
- Kersten-Oertel, M.; Gerard, I.; Drouin, S.; Mok, K.; Sirhan, D.; Sinclair, D.S.; Collins, D.L. Augmented reality in neurovascular surgery: Feasibility and first uses in the operating room. Int. J. Comput. Assist. Radiol. Surg. 2015, 10, 1823–1836. [Google Scholar] [CrossRef] [PubMed]
- Bernhardt, S.; Nicolau, S.A.; Soler, L.; Doignon, C. The status of augmented reality in laparoscopic surgery as of 2016. Med. Image Anal. 2017, 37, 66–90. [Google Scholar] [CrossRef] [PubMed]
- Meola, A.; Cutolo, F.; Carbone, M.; Cagnazzo, F.; Ferrari, M.; Ferrari, V. Augmented reality in neurosurgery: A systematic review. Neurosurg. Rev. 2016, 40, 537–548. [Google Scholar] [CrossRef] [PubMed]
- Volonte, F.; Pugin, F.; Bucher, P.; Sugimoto, M.; Ratib, O.; Morel, P. Augmented reality and image overlay navigation with OsiriX in laparoscopic and robotic surgery: Not only a matter of fashion. J. Hepatobiliary Pancreat. Sci. 2011, 18, 506–509. [Google Scholar] [CrossRef] [PubMed]
Figure 1.
Images of a normal brain in the axial plane. The head computed tomography (CT) image (A) shows the dense skull shown as white, the brain as a mid-gray shade and the cerebrospinal fluid as dark gray. The T2-weighted magnetic resonance imaging (MRI) image (B) shows the skull as black, the brain as a mid-gray shade with excellent gray matter and white matter differentiation and the cerebrospinal fluid as white.

Figure 2.
Illustration of volume rendering with maximum intensity projection (MIP). During this process, a series of parallel rays are traced from the 3D volume to the 2D image. The MIP image is created by displaying the voxel in a particular ray that has the highest brightness level (or Hounsfield Unit in CT). Note that the 3D volume contains a dark gray voxel and a light gray voxel, yet on the 2D image only a light gray pixel is shown.

Figure 3.
Magnetic Resonance Angiography (MRA) viewed with a volume rendering technique shows the cerebral vasculature with all other tissues removed. Note that there are multiple areas of overlapping blood vessels as indicated by the red arrows and the red ovals. No matter which way the volume rendering image is rotated, overlapping vessels will be seen, which limits evaluation. Additionally, computer processing of the images is performed including an apparent light source and shadowing, which can potentially cause interpretation errors.

Figure 4.
This is an overview of the depth 3-dimensional (D3D) processing system for the left eye viewing perspective [15]. Reprinted from Journal of Medical Devices: Evidence and Research, Volume 9, Douglas et al. “D3D augmented reality imaging system: proof of concept in mammography”, 277–283, 2016 with permission from Dove Medical Press Ltd.

Figure 5.
This is an illustration of VR used with D3D. This is an image of a simulated dataset of breast microcalcifications illustrating the head mounted display (HMD) as the gray goggles with the left eye viewing perspective (LEVP) and the right eye viewing perspective (REVP) [15]. Note that the D3D system can view the microcalcifications as follows: (A) initial viewing perspective; (B) widened interocular distance to enhance binocular disparity; (C) altered the angular field of view (FOV); and (D) rotated the volume of interest (VOI). Reprinted from Journal of Medical Devices: Evidence and Research, Volume 9, Douglas et al. “D3D augmented reality imaging system: proof of concept in mammography”, 277–283, 2016 with permission from Dove Medical Press Ltd.

Figure 6.
Images of simulated breast microcalcifications [15]. (A) Illustrates single projection viewing of the simulated breast microcalcifications as a cluster (false negative); (B) Illustrates viewing of the same breast microcalcifications with the VR D3D system with rotation. Note that there are two images, one of which shows the left eye viewing perspective (LEVP) and the other shows the right eye viewing perspective (REVP). Note that this illustrates a linear pattern, which is more suspicious for ductal carcinoma in situ (DCIS), a form of breast cancer. (C) Illustrates viewing of the same breast microcalcifications with the D3D system with rotation. Note the linear and branching pattern, which is most concerning for DCIS. This was classified as a true positive. Reprinted from Journal of Medical Devices: Evidence and Research, Volume 9, Douglas et al. “D3D augmented reality imaging system: proof of concept in mammography”, 277–283, 2016 with permission from Dove Medical Press Ltd.

Figure 7.
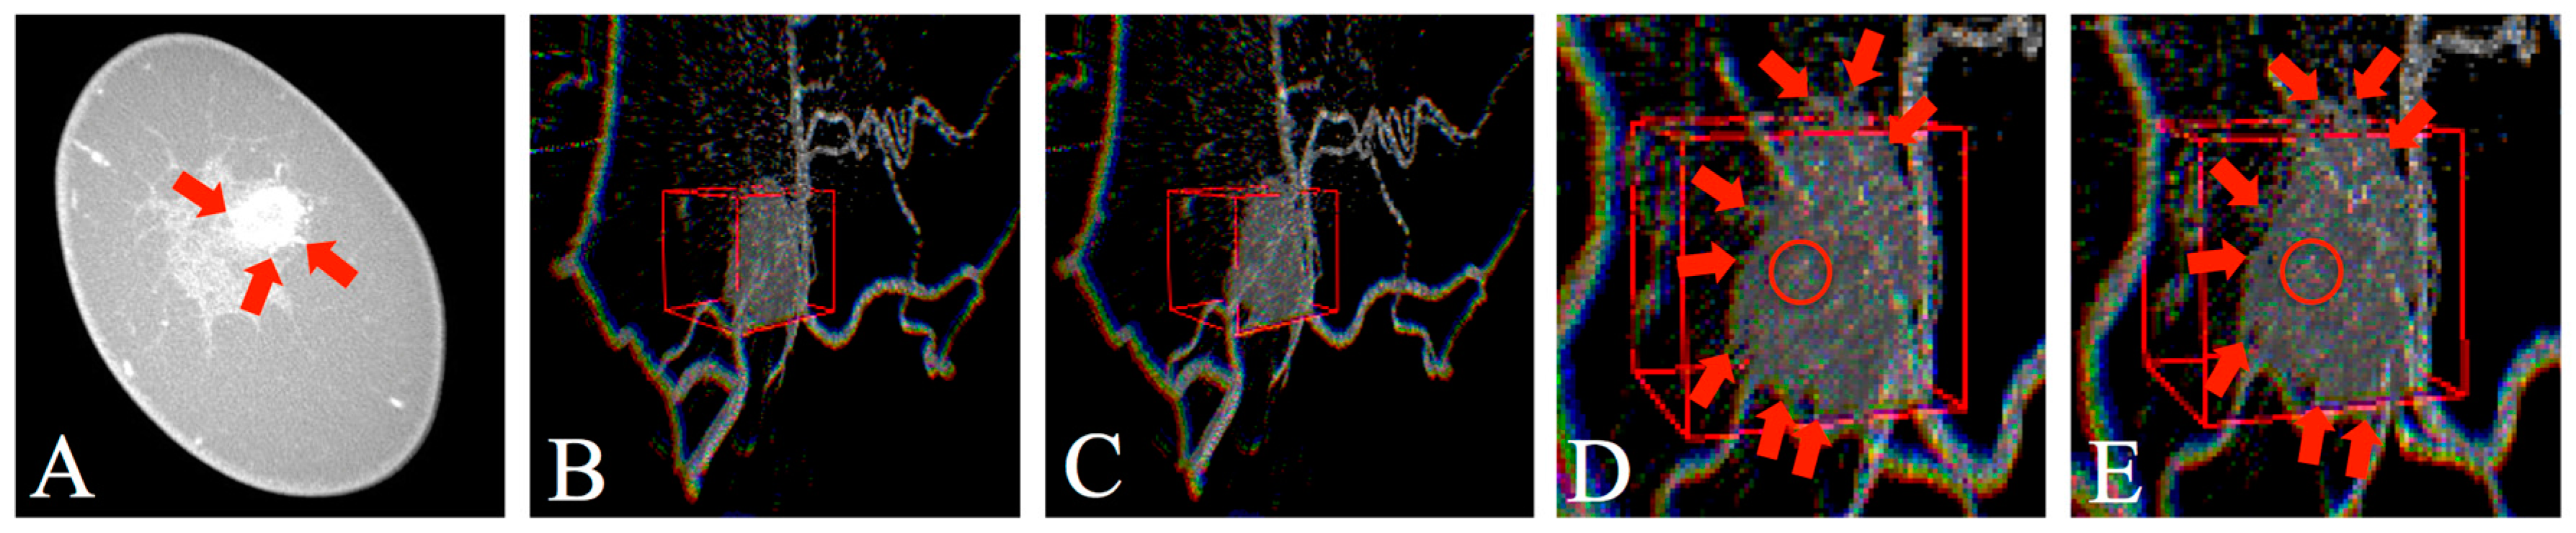
Dedicated breast CT images of a known breast cancer [21]. (A) Illustrates an axial CT image showing the breast mass with red arrows pointing toward the spiculations at the tumor margins; (B,C) illustrate LEVP and REVP viewed with D3D. Please note the breast cancer is denoted by the gray mass surrounded by the red 3D cursor; (D,E) illustrate zoomed in images of the breast cancer with LEVP and REVP viewed with D3D. Note the multiple red arrows at the margins of the breast mass, which show small spiculations extending from the surface of the mass. The red circle within the red box, which designates a spiculation, can only be seen with the D3D system’s depth perception since it is pointing toward the user. Optimum AR viewing is beyond the scope of print media and requires the aforementioned head mounted display (HMD). The real-world image (e.g., skin of the patient’s breast) and virtual image (i.e., breast mass on headset) can be viewed simultaneously using this system. (Note: the arrows in the figure were added to facilitate understanding of this complex tissue structure. In the future, these arrows would be computer generated. The 3D cursor was computer generated and user-input sized and positioned over the tumor.) Reprinted from Journal of Nature and Science, Volume 9, Douglas et al. “Augmented Reality Imaging System: 3D Viewing of a Breast Cancer”, e215, 2016, with permission.
Figure 7.
Dedicated breast CT images of a known breast cancer [21]. (A) Illustrates an axial CT image showing the breast mass with red arrows pointing toward the spiculations at the tumor margins; (B,C) illustrate LEVP and REVP viewed with D3D. Please note the breast cancer is denoted by the gray mass surrounded by the red 3D cursor; (D,E) illustrate zoomed in images of the breast cancer with LEVP and REVP viewed with D3D. Note the multiple red arrows at the margins of the breast mass, which show small spiculations extending from the surface of the mass. The red circle within the red box, which designates a spiculation, can only be seen with the D3D system’s depth perception since it is pointing toward the user. Optimum AR viewing is beyond the scope of print media and requires the aforementioned head mounted display (HMD). The real-world image (e.g., skin of the patient’s breast) and virtual image (i.e., breast mass on headset) can be viewed simultaneously using this system. (Note: the arrows in the figure were added to facilitate understanding of this complex tissue structure. In the future, these arrows would be computer generated. The 3D cursor was computer generated and user-input sized and positioned over the tumor.) Reprinted from Journal of Nature and Science, Volume 9, Douglas et al. “Augmented Reality Imaging System: 3D Viewing of a Breast Cancer”, e215, 2016, with permission.

© 2017 by the authors. Licensee MDPI, Basel, Switzerland. This article is an open access article distributed under the terms and conditions of the Creative Commons Attribution (CC BY) license (http://creativecommons.org/licenses/by/4.0/).
Share and Cite
MDPI and ACS Style
Douglas, D.B.; Wilke, C.A.; Gibson, J.D.; Boone, J.M.; Wintermark, M. Augmented Reality: Advances in Diagnostic Imaging. Multimodal Technol. Interact. 2017, 1, 29. https://doi.org/10.3390/mti1040029
AMA Style
Douglas DB, Wilke CA, Gibson JD, Boone JM, Wintermark M. Augmented Reality: Advances in Diagnostic Imaging. Multimodal Technologies and Interaction. 2017; 1(4):29. https://doi.org/10.3390/mti1040029
Chicago/Turabian StyleDouglas, David B., Clifford A. Wilke, J. David Gibson, John M. Boone, and Max Wintermark. 2017. "Augmented Reality: Advances in Diagnostic Imaging" Multimodal Technologies and Interaction 1, no. 4: 29. https://doi.org/10.3390/mti1040029