
Development and Validation of Micro-Azocasein Assay for Quantifying Bromelain
by
 ,
,
Krishna Pillai
1,2, 
Javed Akhter
1,2,
Ahmed H. Mekkawy
1,2,3,
Sarah J. Valle
1,2,4 and
David L. Morris
1,2,3,* 1
Mucpharm Pty Ltd., Sydney, NSW 2217, Australia
2
Department of Surgery, St. George Hospital, Sydney, NSW 2217, Australia
3
St. George & Sutherland Clinical School, University of New South Wales, Sydney, NSW 2217, Australia
4
Intensive Care Unit, St. George Hospital, Sydney, NSW 2217, Australia
*
Author to whom correspondence should be addressed.
Methods Protoc. 2024, 7(2), 25; https://doi.org/10.3390/mps7020025
Submission received: 17 January 2024
/
Revised: 8 March 2024
/
Accepted: 8 March 2024
/
Published: 15 March 2024
(This article belongs to the Section Biochemical and Chemical Analysis & Synthesis)
Abstract
:The proteolytic activity of enzymes may be evaluated by a colorimetric method with azocasein. Hence, we developed a micro-assay to quantify bromelain using azocasein. A total of 250 µL of 1.0% azocasein in dH2O was added to 250 µL of test solution, vortexed and incubated at ambient room temperature/30 min. The reaction was terminated with 1500 µL of 5% trichloroacetic acid, vortexed and centrifuged. A total of 150 µL of 0.5M NaOH was added to 150 µL of supernatant in triplicates, and absorbance was recorded at 410 nm. The linearity of the calibration curve was tested with 200–800 µg/mL serial dilutions. The detection limit, precision, accuracy, and robustness were tested along with the substrate enzyme reaction time and solvent matrix effect. Good linearity was seen with serially diluted 200 µg/mL bromelain. The limit of quantification and limit of detection were 5.412 and 16.4 µg/mL, respectively. Intra-day and inter-day analyses showed a relative standard deviation below 2.0%. The assay was robust when tested over 400–450 nm wavelengths. The assays performed using dH2O or PBS diluents indicated a higher sensitivity in dH2O. The proteolytic activity of bromelain was enhanced with L-cysteine or N-acetylcysteine. Hence, this micro-azocasein assay is reliable for quantifying bromelain.
1. Introduction
Several assays have been developed for quantifying proteolytic enzymes using chemicals that are hydrolyzed by the enzyme [1,2,3,4]. The azocasein assay is one such assay, where an azo (coloring) component is linked to casein (protein), and when the latter is hydrolyzed by the enzyme, the azo dye is released. The azo dye (yellowish in color) is then detected using UV spectroscopy at 410–440 nm [1]. Using this assay, several other proteolytic enzymes may be quantified based on their proteolytic potential.
The azocasein assay may be performed using large volumes of solution in cuvettes, and the azo dye released after proteolysis can be detected using UV spectroscopy. In the micro-assay, a small volume (µL) of reagents is used, and the final detection of the released dye can be carried out using very small volumes varying from 50–100 µL, which are decanted into a microwell. One of the major advantages of the micro-assay is that several different reactions can be conveniently carried out using this assay, with an accuracy that is equivalent to a macro-standard assay. Hence, this micro-assay is not only economical, since a small number and volume of reagents are used, but furthermore, several different enzymes and different reactions can be carried out simultaneously and evaluated both economically and conveniently.
Bromelain is a proteolytic enzyme that is widely used in industries for the hydrolysis of chitinous materials and complex carbohydrates [5]. Bromelain possesses a range of properties, including fibrinolytic, anti-edematous, anti-thrombotic, and anti-inflammatory activities [6]. In the pharmaceutical industries, it is used in wound debridement (Nemourid) [7], and more recently, it has been evaluated for the treatment of rare cancer known as pseudomyxoma peritonei (PMP) where cancerous cells secrete mucinous material in the peritoneal cavity [8]. With its proteolytic properties, bromelain acts as a mucolytic by acting on the mucinous glycoprotein peptide and glycosidic linkages, whereby depolymerization of polymeric mucin occurs [9]. It is currently combined with N-acetylcysteine, an antioxidant that effectively reduces the disulfide linkages found in between the polymeric glycoprotein of mucin. Hence, together these two agents are effective mucolytics, besides also having anti-cancer properties [10].
Therefore, in the current work, we demonstrate the methodology of setting up a micro-assay to detect the proteolytic activity of bromelain for quantification and validation using the ICH Harmonised Guideline: Validation of Analytical Procedures Q2(R2) [11], with the effect of other parameters on the assay, such as the reaction time, solvent matrix effect and effect of antioxidants. We also show that the present micro-assay is more sensitive than the earlier assay set up by Coelho et al. [1].
2. Experimental Design
2.1. Materials
- Bromelain (Enzybel, Villers-Le-Bouillet, Belgium).
- Azocasein (Sigma Aldrich, St. Louis, MO, USA, cat. A2765).
- Cysteamine (Sigma Aldrich, St. Louis, MO, USA, cat. 30070).
- Dithiobutylamine (DTBA) (Sigma Aldrich, St. Louis, MO, USA, cat. 774405).
- Dithiothreitol (DTT) (Sigma Aldrich, St. Louis, MO, USA, cat. 43815).
- N-acetylcysteine (NAC) (Sigma Aldrich, St. Louis, MO, USA, cat. A7250).
- L-cysteine (Sigma Aldrich, St. Louis, MO, USA, C7352).
- All other reagents were purchased from Sigma Aldrich, (St. Louis, MO, USA).
2.2. Equipment
- UV spectrometer (Shimadzu, Kyoto, Japan, cat. UV-1800).
3. Procedure
3.1. Calibration Curves
- Prepare a fresh stock solution of bromelain 10 mg/mL in distilled water (dH2O).
- For standard curve preparation, prepare a 200 µg/mL bromelain solution in dH2O. Then, carry out a serial dilution starting from 200 µg/mL and below in dH2O. Other standard curves that were serially diluted, such as 800, 600, and 400, were also investigated to arrive at linearity.
- Prepare 1% azocasein (w/v) in dH2O. Weigh the required quantity of azocasein and dissolve it in dH20 by vigorous vortex mixing. For a volume of 50 mL, 1.0 mL of ethanol (absolute) is added to the solids before adding the amount of dH2O.
- 0.5 M sodium hydroxide is prepared by dissolving the required amount in dH2O.
- Add 250 µL of azocasein solution to 250 µL of each bromelain concentration in a polypropylene tube at room temperature. The control contains only dH2O + 1% azocasein.
- Vortex mix the tubes and place them on an agitator shaker at ambient room temperature (23 °C) for 1 h.
- Add 1500 µL of 5% (w/v) trichloroacetic acid (TCA) that was previously mixed and centrifuged at 3000 rpm for 7 min. TCA is prepared by dissolving the required amount in dH2O.
- Pipette 150 µL of the clear yellow supernatant into the microwell of a 96-microwell plate from each dilution in triplicates.
- Add 150 µL of 0.5 Sodium hydroxide to each well to stop the reaction.
- Read the absorbance at 410 nm using a UV spectrophotometer.
- For unknown samples, similarly, 250 µL of each sample is treated as in steps 5–10. The concentration of unknown samples is calculated from the bromelain standard curve. The unknown bromelain sample should be suitably diluted to fall within the range of 200 µg/mL and below, treated with azocasein, and the absorbance can be measured to quantify the bromelain content.
3.2. Linearity of Calibration Curve
Serially diluted samples of bromelain with values of 600, 400, 300 and 200 were treated with the azocasein assay and evaluated for linearity of the calibration curves. The correlation coefficient (R2) value was used to determine the linearity of the graph.
3.3. Detection Limit
Three series of calibration curves were plotted by serial dilutions (0–200 µg/mL) in dH2O using a stock solution of bromelain. UV absorption was measured in triplicates at 410 nm. The limits of detection (LOD) and the limit of quantification (LOQ) were evaluated directly from the calibration curve, as stipulated by the ICH guidelines [11].
where σ = mean of the standard deviation of intercept; S = mean of the slopes of the calibration curves.
LOD = 3.3 σ/S and LOQ = 10.0 σ/S;
3.4. Precision
Intra-day precision was evaluated by measuring the concentration of three different samples of the same concentration (25.0 µg/mL) in triplicates under the same experimental conditions on the same day following the sample preparations described earlier.
Inter-day precision was evaluated by measuring the concentrations of three different samples of the same concentrations (25.0 µg/mL) in triplicates under the same experimental conditions on two different days following the sample preparations described earlier.
3.5. Accuracy
Accuracy was evaluated by assaying, in triplicates, samples of known concentrations of bromelain with the addition of different concentrations of bromelain (i.e., adding 3.0, 4.0, and 9.0 µg/mL to 25 µg/mL of known concentrations of bromelain) using samples prepared in dH2O as described earlier.
3.6. Robustness
The robustness of the assay was evaluated by analysis of sample solutions in comparison to standard (25.0 µg/mL) at wavelengths of 400–450 nm.
3.7. Reaction Time
Two sets of bromelain dilutions from 200 µg/mL and below were prepared in duplicates, and the azocasein assay was performed as outlined earlier; however, the reaction of the first was terminated at 30 min and the second at 60 min using 5% trichloroacetic acid.
3.8. Solvent Matrix Effect
Calibration curves (0–200 µg/mL) of bromelain were prepared in either dH2O or in Phosphate buffer Saline (PBS) in triplicates. Their slopes were compared initially with a subsequent comparison of LOD and LOQ values.
3.9. Effects of N-Acetylcysteine and Other Antioxidants on Calibration Curve
Bromelain 200 µg/mL was prepared with 2% of various antioxidants, a serial dilution was carried out in PBS, and the calibration curves were plotted. The slopes of the curves were compared to determine the enhancement of activity against the standard bromelain calibration curve.
3.10. Statistical Analysis
Data were reported as the mean ± SD. Qualitative variables were compared using Student’s t-test. Differences were considered statistically significant when p < 0.05.
4. Results
4.1. Linearity of Calibration Curves
4.2. Limits of Detection (LOD) and Limits of Quantification (LOQ)
Three series of calibration curves were plotted by serial dilutions (Figure 2). Both parameters, limits of detection (LOD) and limits of quantification (LOQ), were determined from the graph using principles stipulated in the ICH Harmonized Guidelines [11].
where σ = the standard deviation of the response and S = the slope of the calibration curve
LOD = 3.3 (σ)/S
LOD = 3.3 (0.00338)/0.002061
= 5.412 µg/mL
= 5.412 µg/mL
LOQ = 10 (σ)/S
= 10 (0.00338)/0.002061
= 16.4 µg/mL
= 10 (0.00338)/0.002061
= 16.4 µg/mL
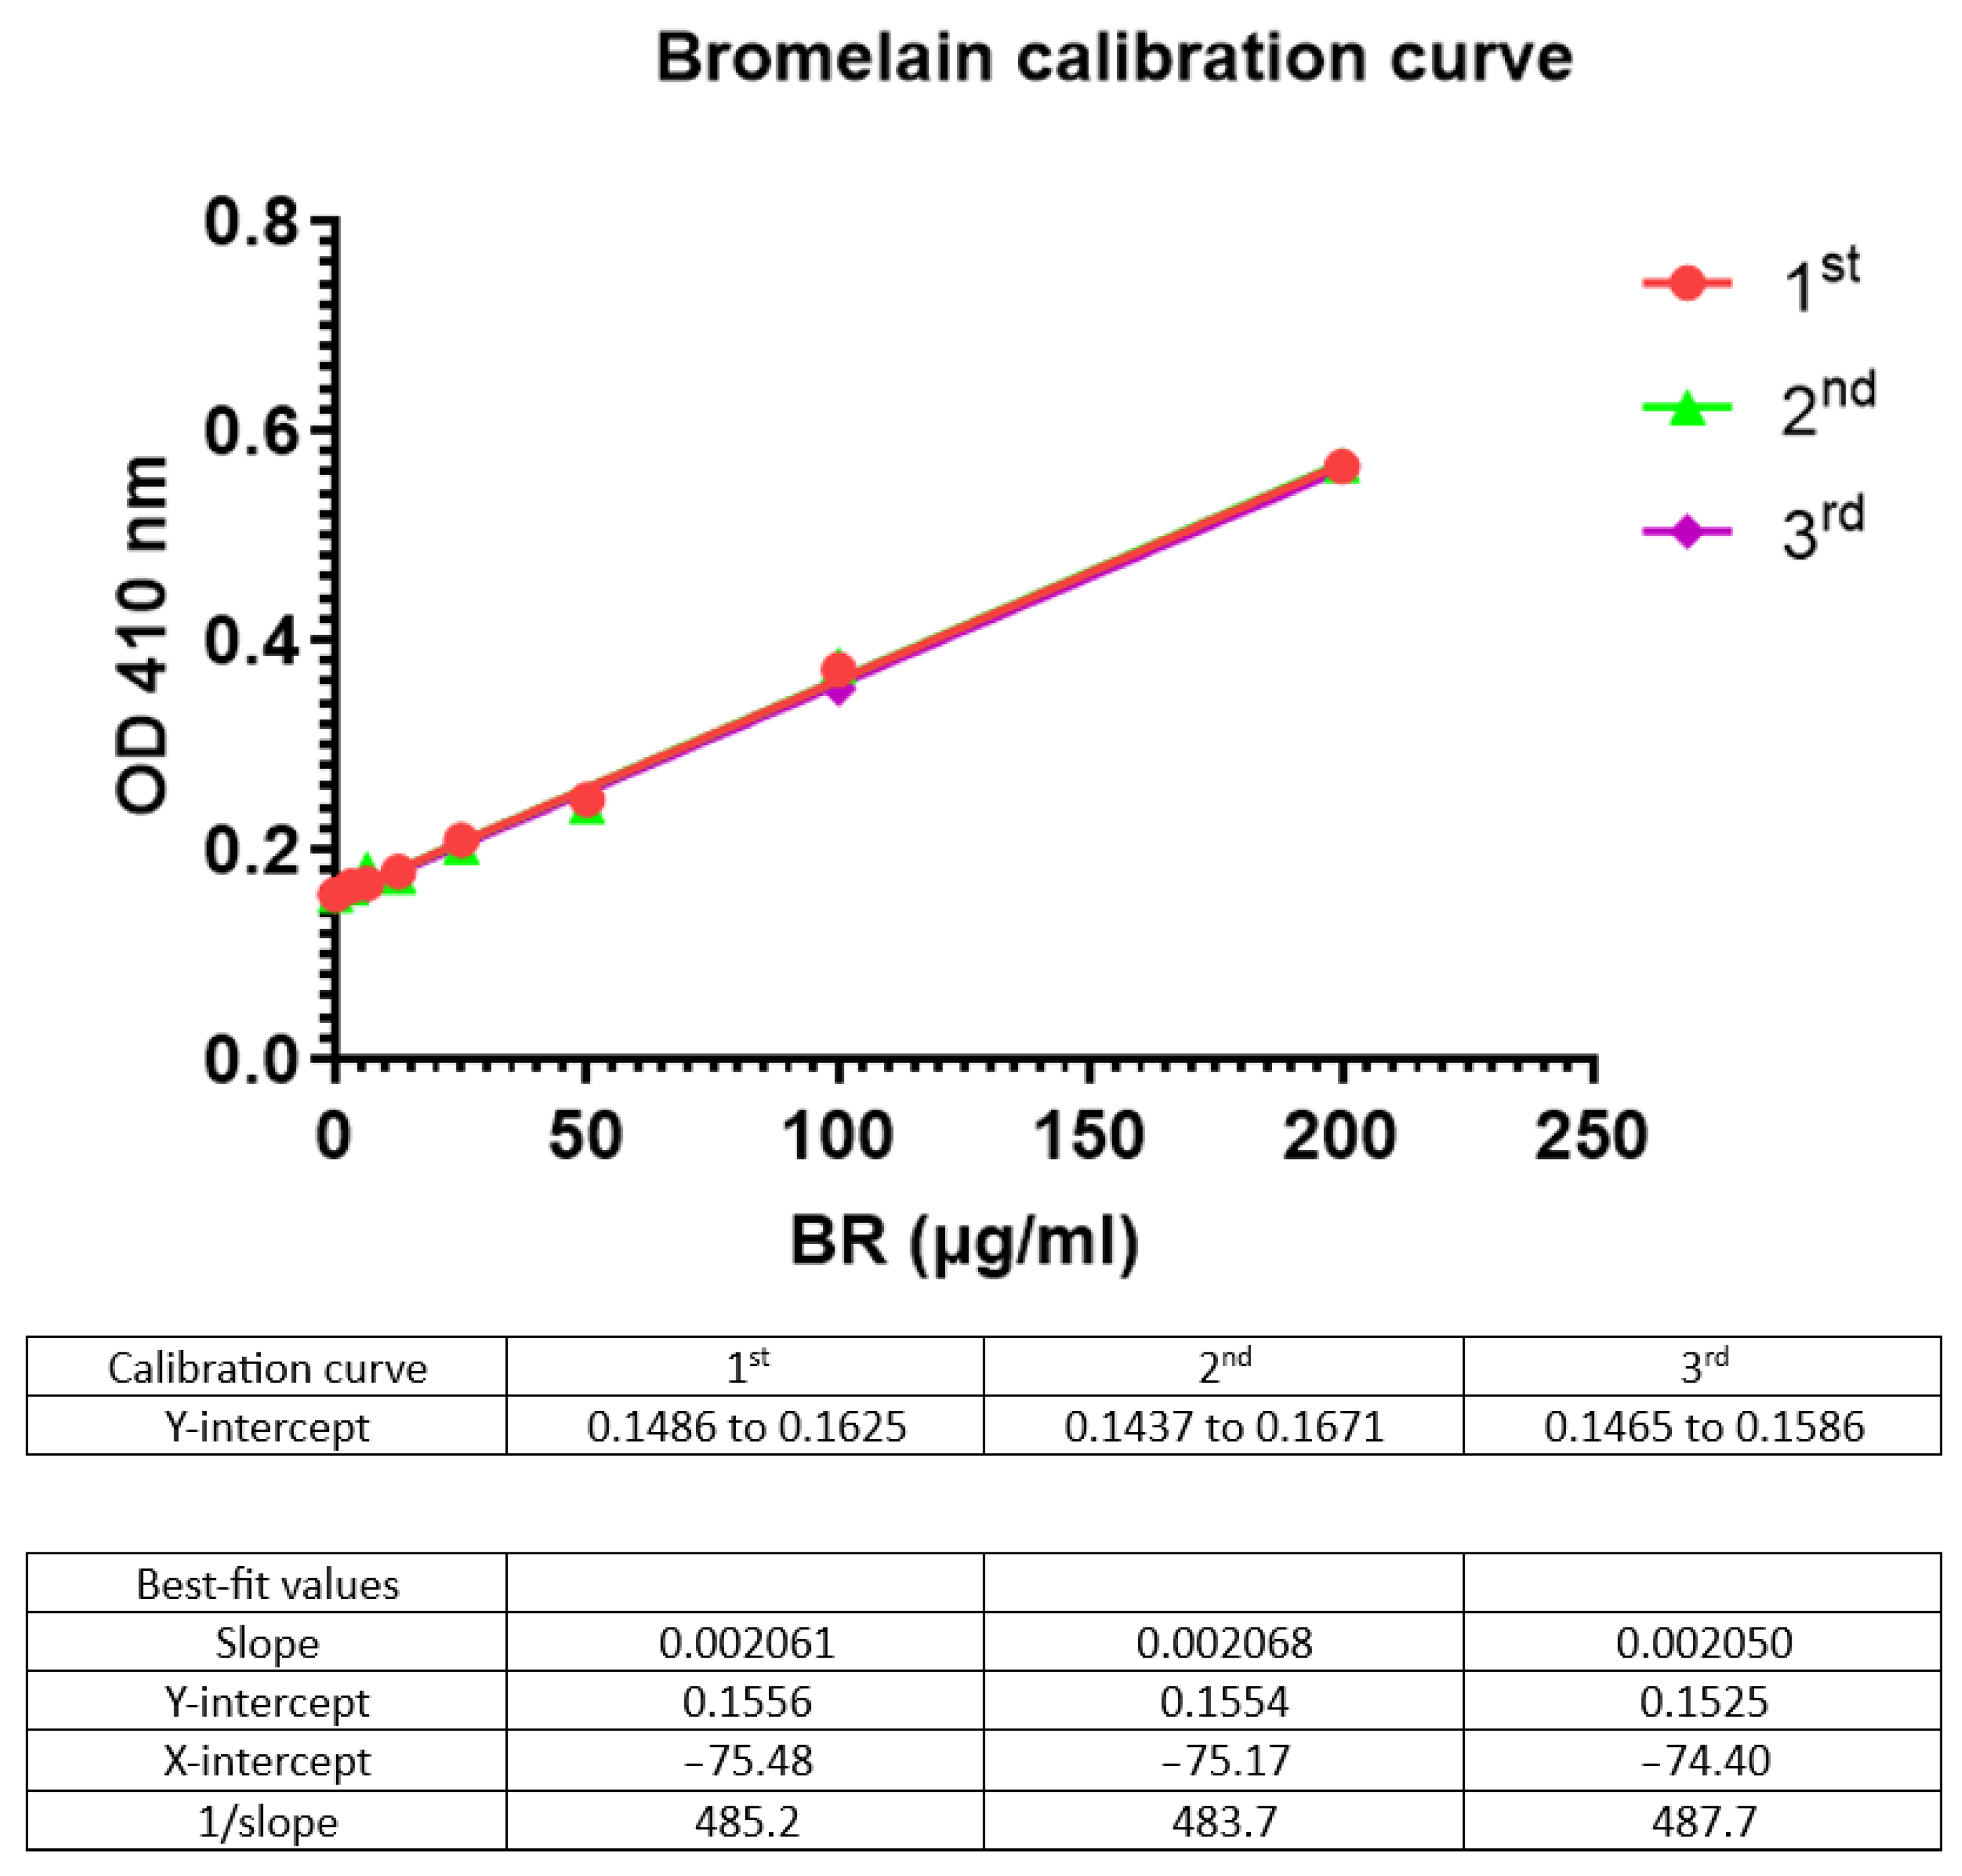
Although the calculated LOQ was 16.4 µg/mL, practically speaking, low levels that are even below 5.0 µg/mL can also be detected, although the accuracy may vary (Figure 2).
4.3. Precision (Intra-Day and Inter-Day Measurement)
The intra-day and inter-day measurements, as shown in Table 1, indicate that the relative standard deviation (RSD) fell below 2.0%, indicating that variance is very small and that analysis using the current method may be performed with good precision.
4.4. Accuracy
A further accuracy analysis, shown in Table 2, indicates that it is close to 100% (mean recovery = 99.56 ± 0.17).
4.5. Robustness
4.6. Enzyme-Substrate Reaction Time (OD in Relation to Proteolysis)
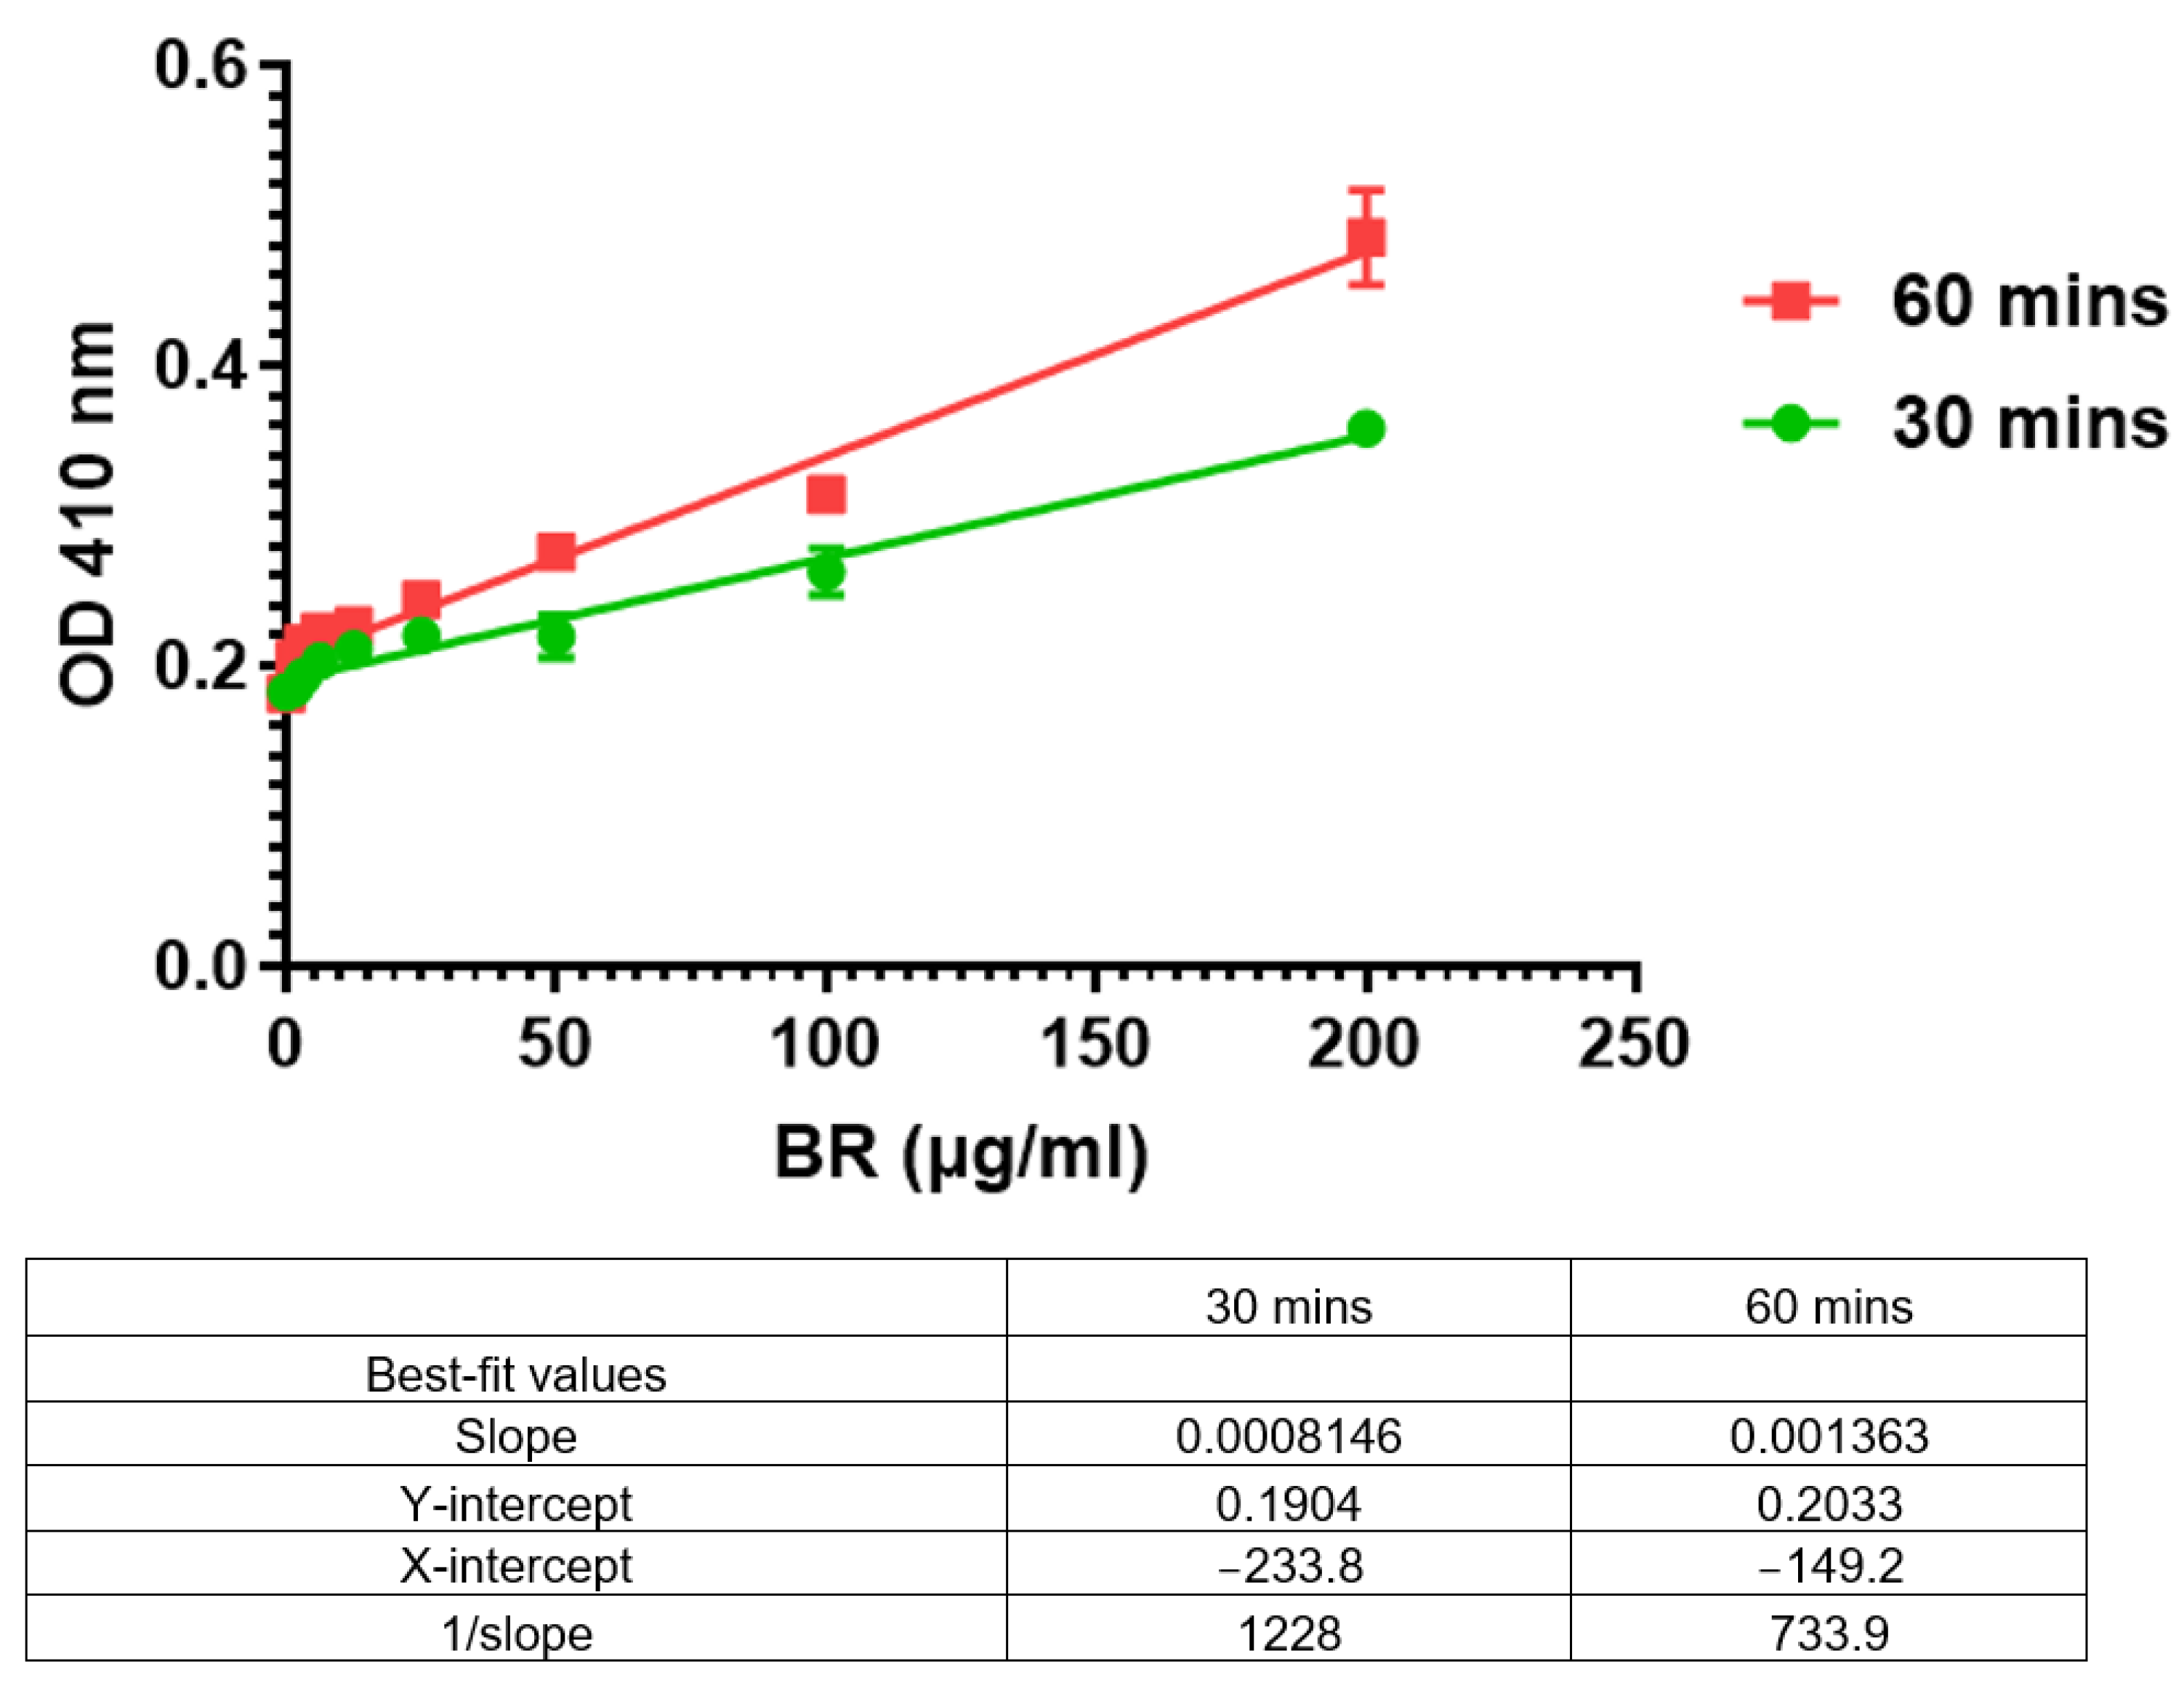
Two bromelain serial dilutions (0–200 µg/mL) were prepared, and the azocasein reactions were stopped at either 30 or 60 min (Figure 3). A comparison of the 1/slopes of the two calibration curves, 30 min vs. 60 min, shows that there is a much better response at 60 min (color as shown by the OD 400 nm).
733.9/1228 (100) = 59.76; 100 − 59.76 = 40.24%; hence, there is a difference of 40.24% in the signal (Figure 3).
4.7. Solvent Matrix Effect
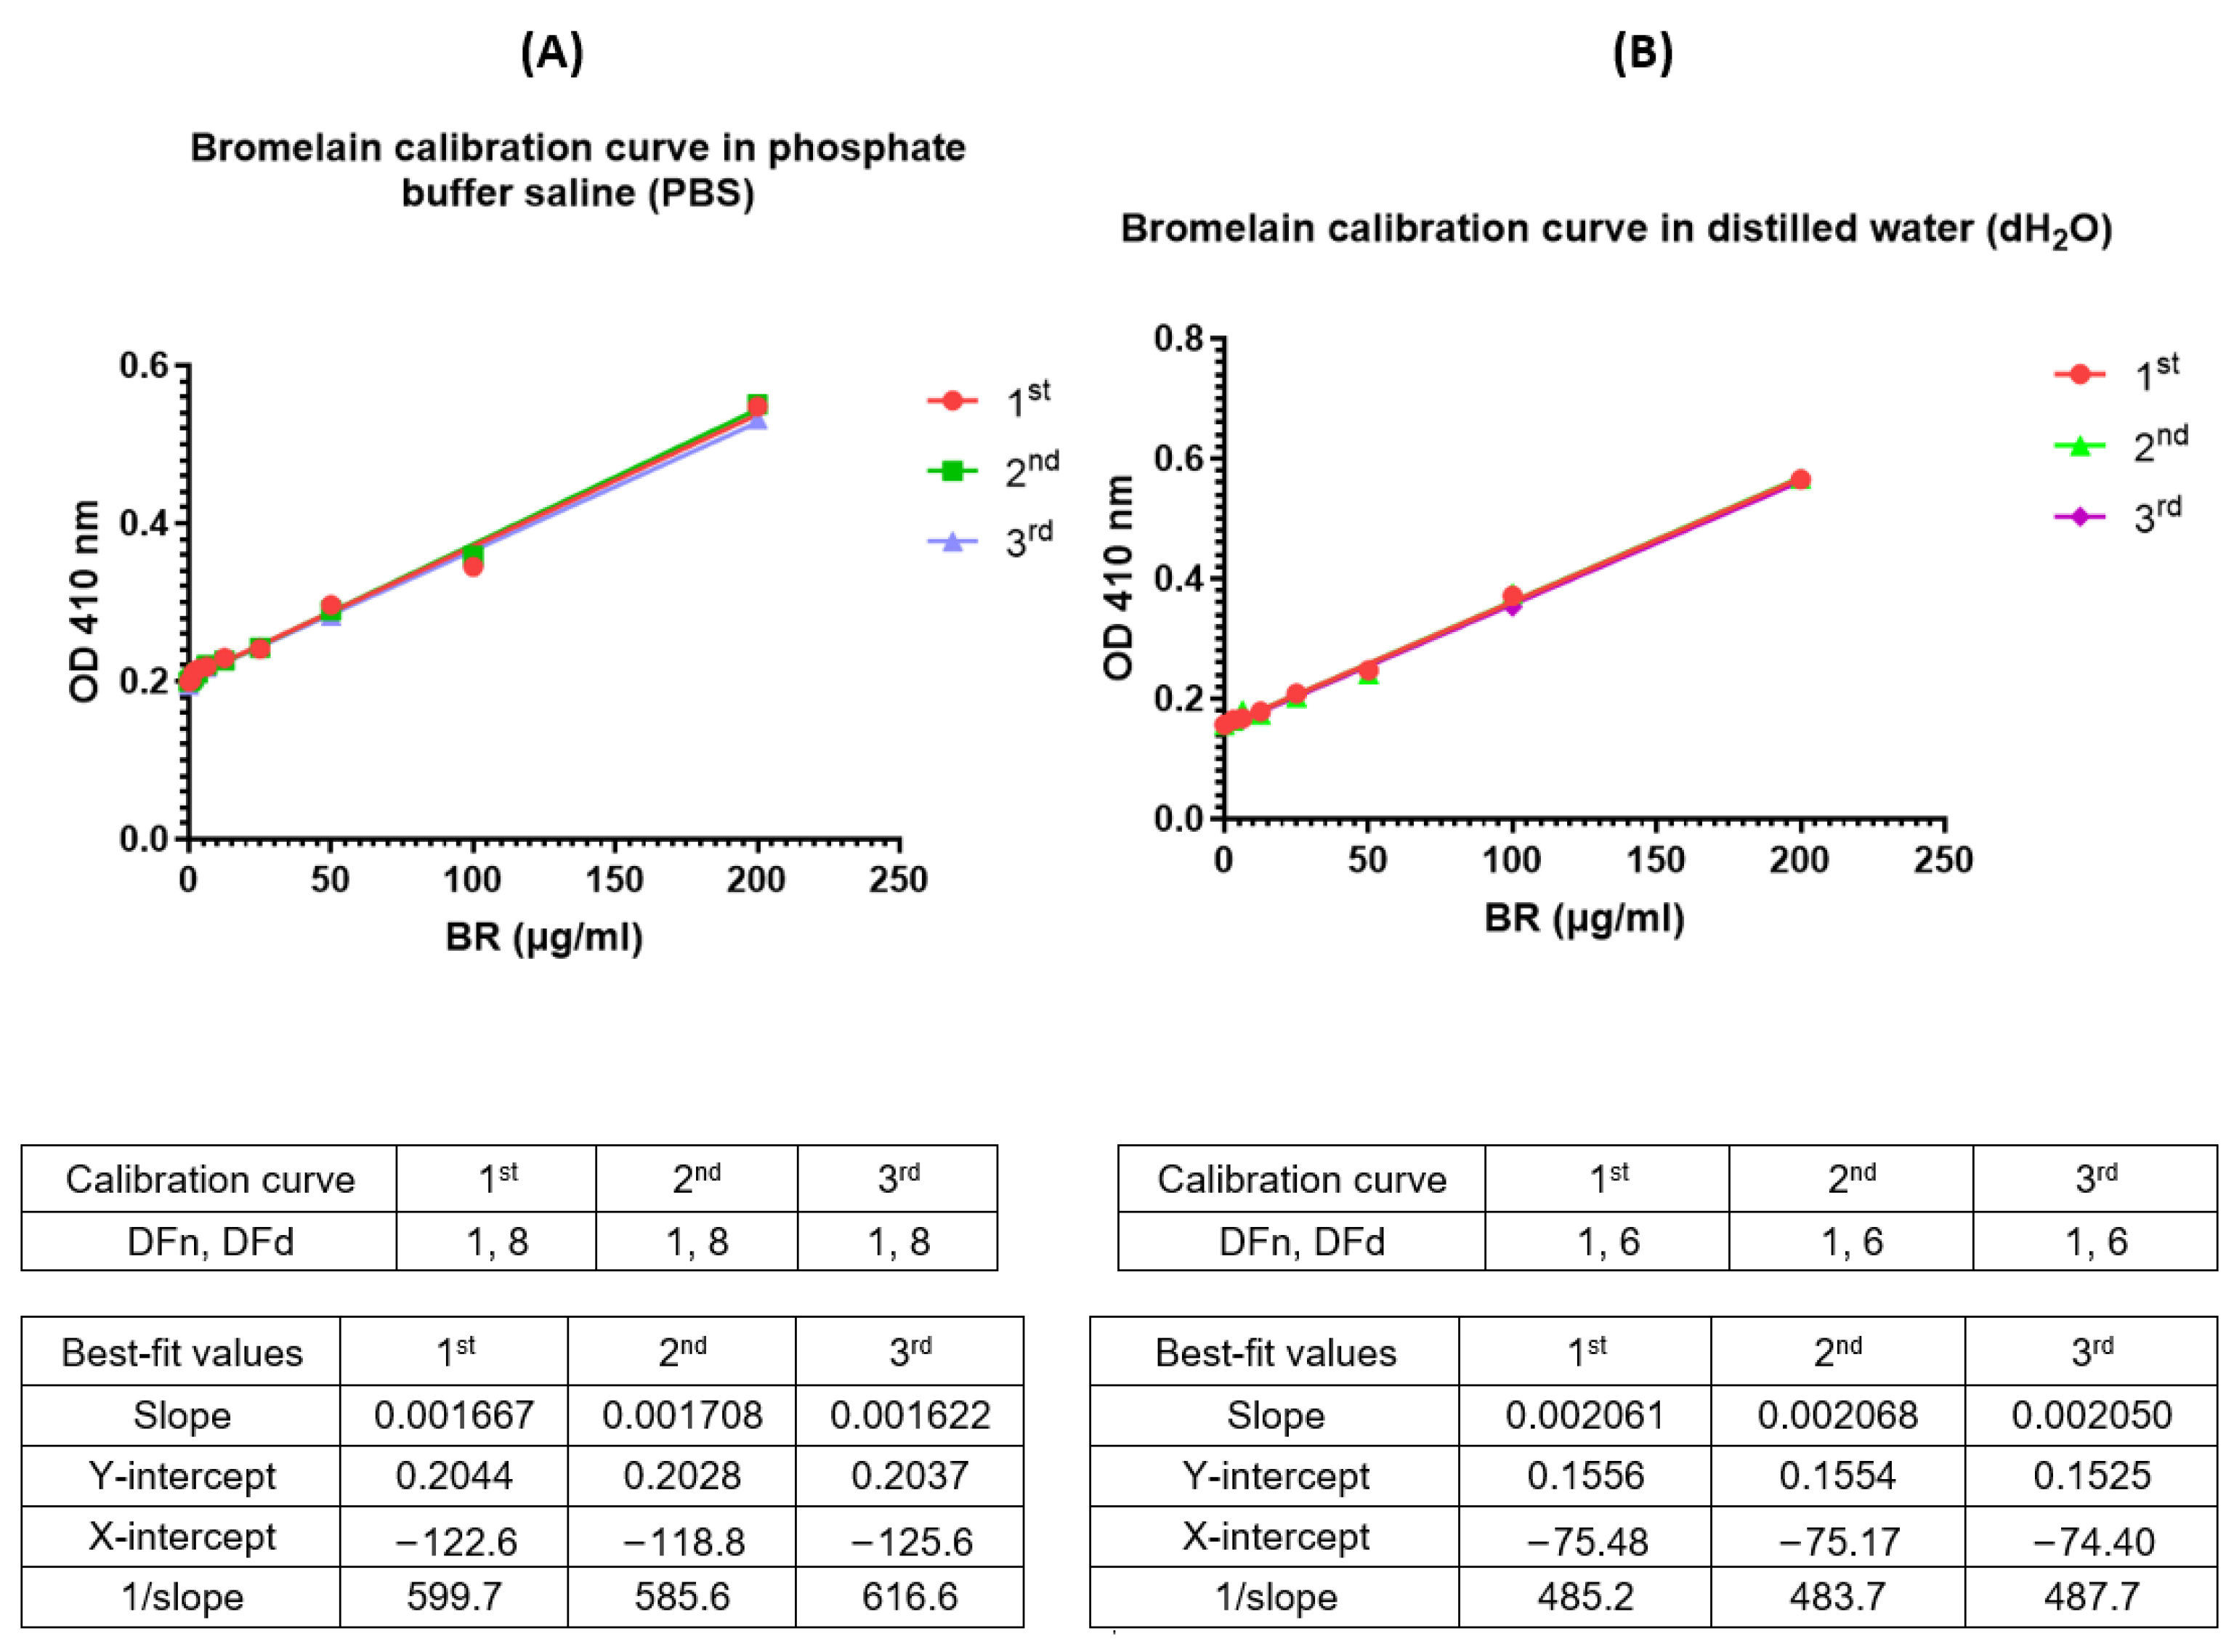
- Figure 4A: Mean slope ± S.D. = 0.001665 ± 3.5122 × 10⁻⁵
- Figure 4B: Mean slope ± S.D. = 0.002059 ± 7.4087 × 10⁻⁶
- When comparing the slopes, 0.002059/0.001665 (100) = 123.66 − 100 = 23.66%.
- A difference of 23.66% is observed.
Figure 4.
Three identical linear plots of bromelain dilution (200 µg/ml) in Phosphate Buffer Saline (PBS) (A); and distilled water (dH2O) (B).
Figure 4.
Three identical linear plots of bromelain dilution (200 µg/ml) in Phosphate Buffer Saline (PBS) (A); and distilled water (dH2O) (B).

Based on the LOD and LOQ values (Table 4), a slightly lower quantity of bromelain can be detected in dH2O as compared to PBS, and the same applies to the LOQ values. Hence, the bromelain standard curve prepared in dH2O is slightly more sensitive.
4.8. Effects of N-Acetylcysteine and Other Antioxidants on the Calibration Curve
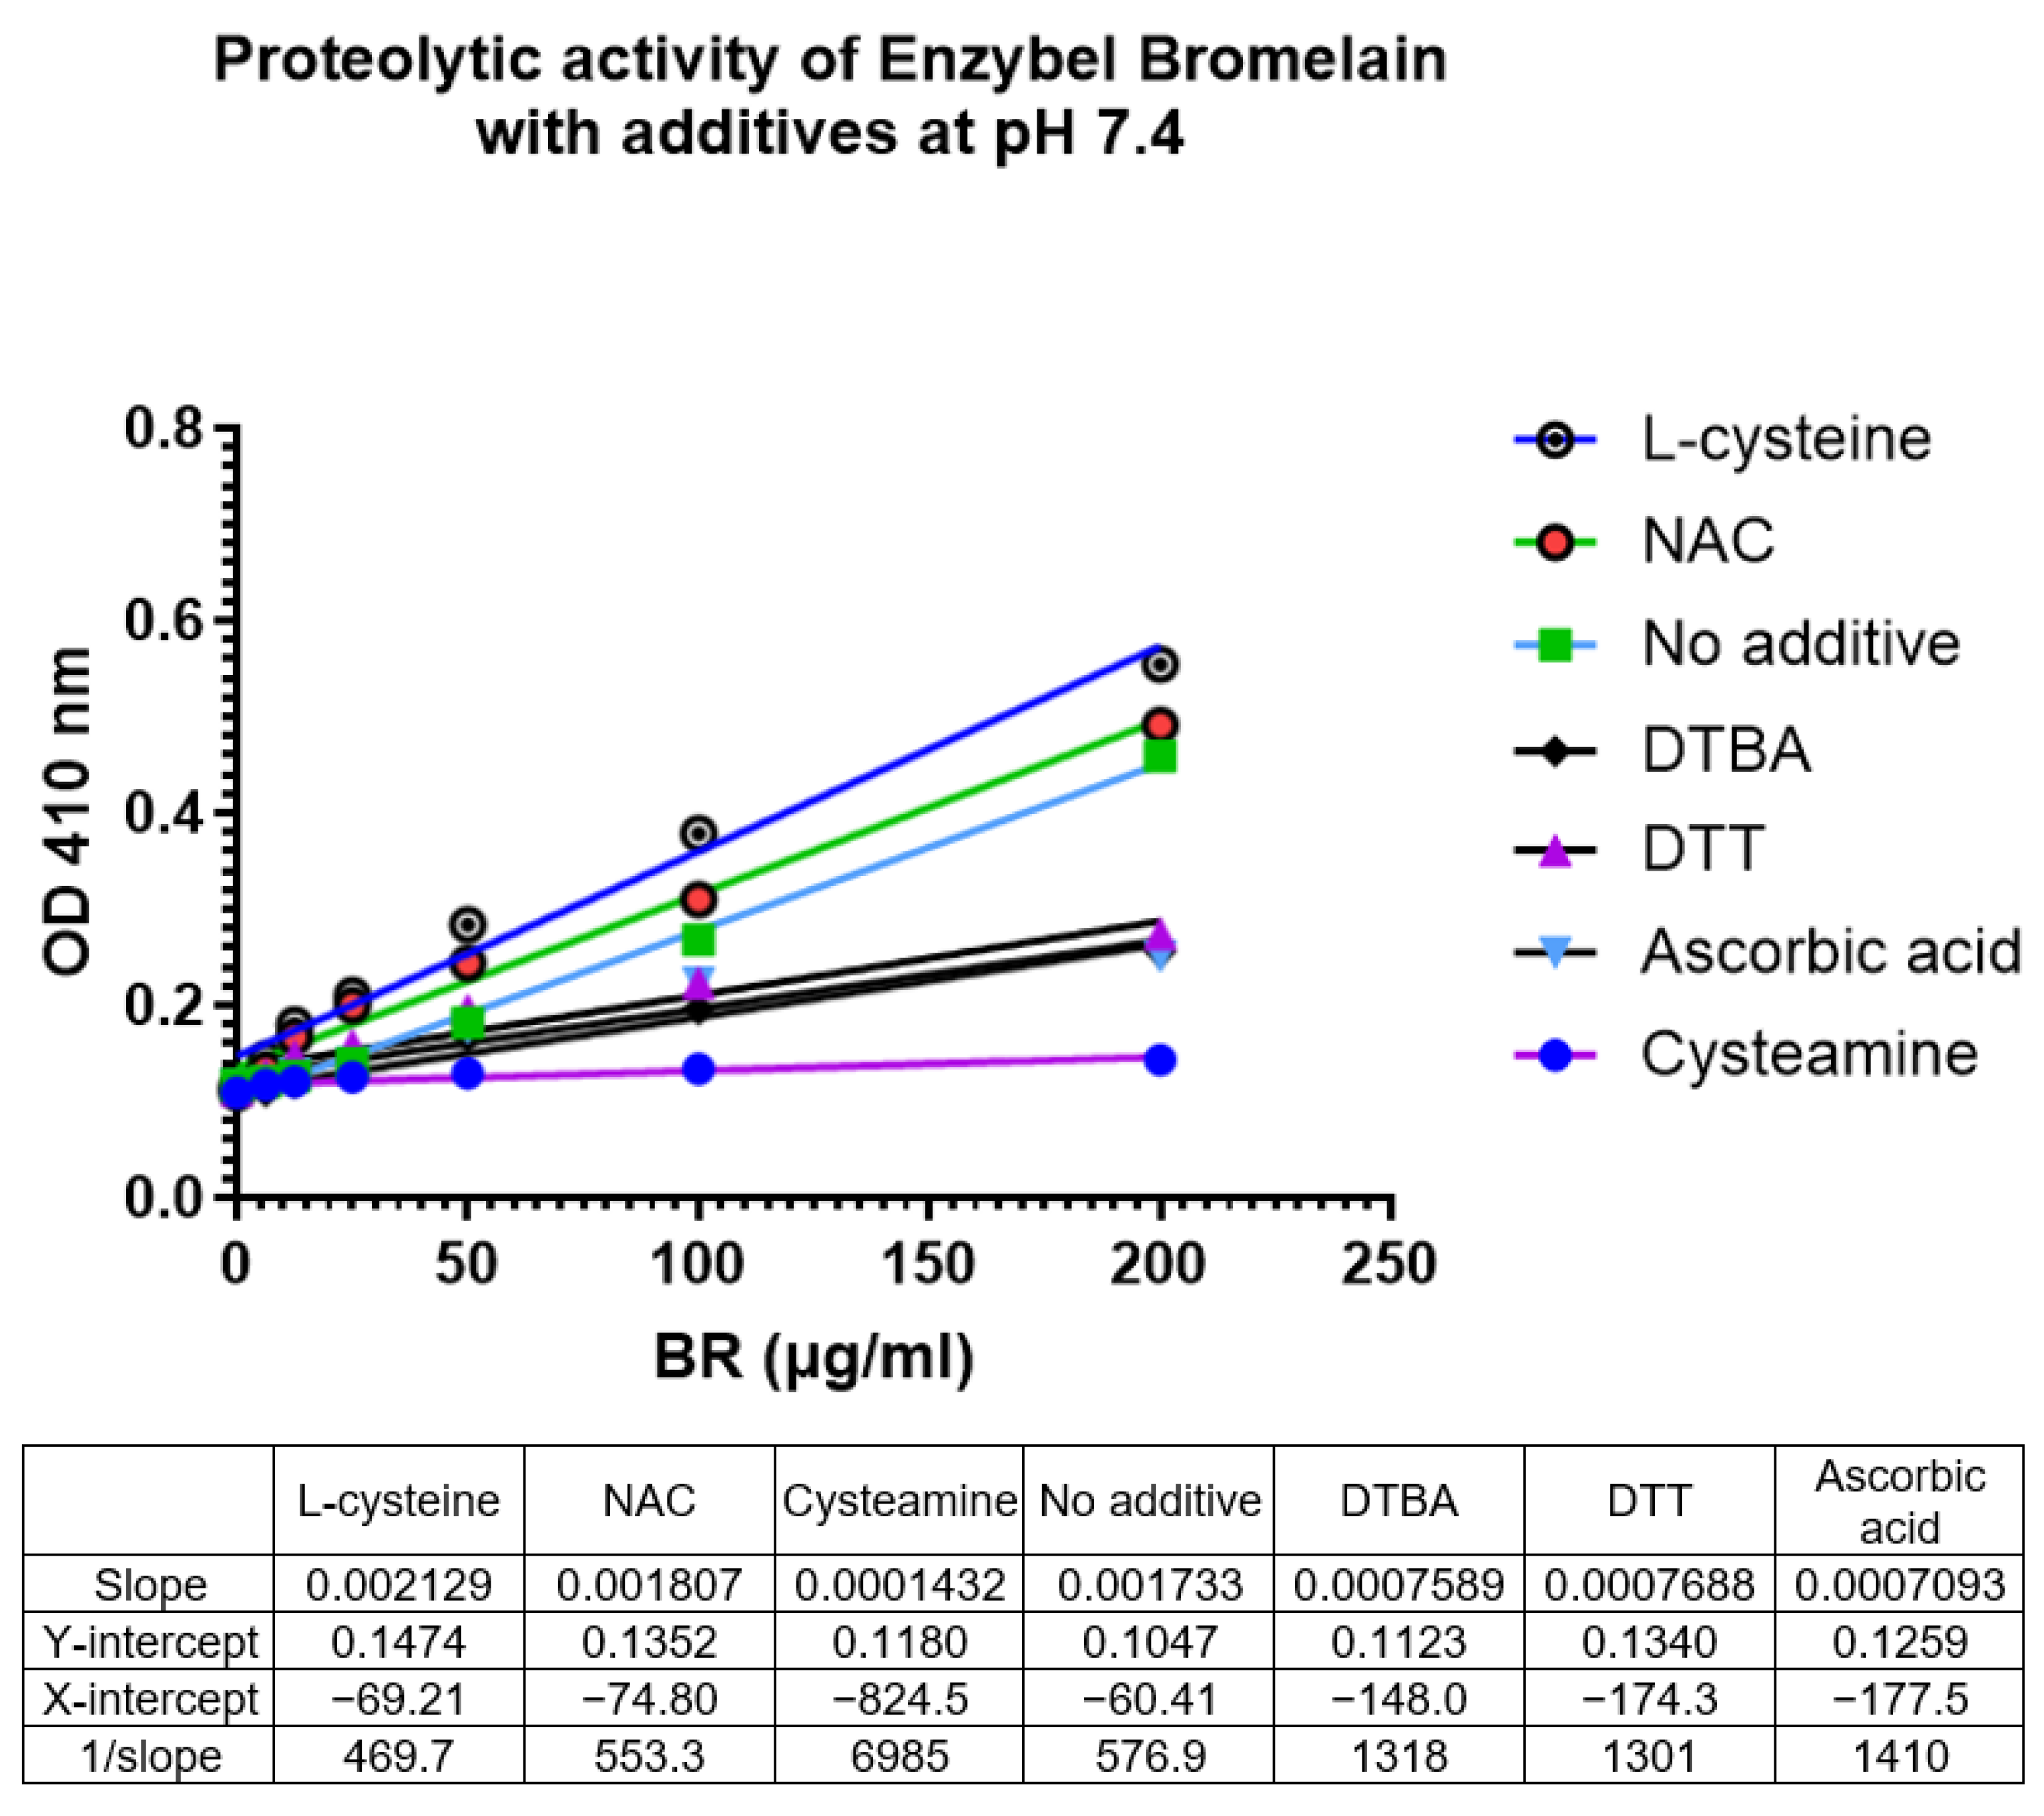
Amongst the various agents added, the proteolytic activity of bromelain with only L-cysteine and NAC was enhanced when compared to bromelain without any antioxidant addition (Figure 5).
Amongst the various agents added, the proteolytic activity of bromelain with only L-cysteine and NAC was enhanced when compared to bromelain without any antioxidant addition (Figure 5).
L-cysteine = (1/slope of L-cysteine)/(1/slope of No additive) × 100
= 469.7/576.9 (100) = 81.4; 100 − 81.4 = 18.6% enhancement
= 469.7/576.9 (100) = 81.4; 100 − 81.4 = 18.6% enhancement
N-acetylcysteine = (1/slope of N-acetylcysteine)/(1/slope of No additive) × 100
= 553.3/576.9 (100) = 95.9; 100 − 95.9 = 4.1% enhancement
= 553.3/576.9 (100) = 95.9; 100 − 95.9 = 4.1% enhancement
The addition of NAC only very slightly enhanced the proteolytic activity of bromelain at pH 7.4.
All the other additives, such as Cysteamine, DTT, Ascorbic acid, and DTBA, showed an inhibitory action on the proteolytic activity of bromelain at pH 7.4.
Comparison to the proteolytic activity of bromelain with no additives using 1/slope values:
Cysteamine = (1/slope of Cysteamine)/(1/slope of No additive) × 100
= 6985/576.9 (100) = 1210; 100 − 1210 = −1110 depression
= 6985/576.9 (100) = 1210; 100 − 1210 = −1110 depression
DTT = (1/slope of DTT)/(1/slope of No additive) × 100
= 1301/576.9 (100) = 225.5; 100 − 225.5 = −125.5% depression
= 1301/576.9 (100) = 225.5; 100 − 225.5 = −125.5% depression
Ascorbic acid = (1/slope of Ascorbic acid)/(1/slope of No additive) × 100
= 1410/576.9 (100) = 244.4; 100 − 244.4 = −144.4% depression
= 1410/576.9 (100) = 244.4; 100 − 244.4 = −144.4% depression
DTBA = (1/slope of DTBA)/(1/slope of No additive) × 100
= 1318/576.9 (100) = 228.5; 100 − 228.5= −128.5% depression
= 1318/576.9 (100) = 228.5; 100 − 228.5= −128.5% depression
Amongst the antioxidants evaluated, only N-acetylcysteine and L-cysteine enhanced the activity of bromelain at pH 7.4, whilst all others showed a depression of proteolytic activity as assessed using the azocasein assay (Table 5).
5. Discussion
The aim of the current work is twofold, i.e., to set up a micro azocasein assay and to validate the assay for quantifying bromelain through its proteolytic action on a substrate known as azocasein. The proteolysis (hydrolysis) of azocasein releases a yellowish azo dye that is detected at UV ranging from 400–450 nm. The intensity of color produced by the azo dye that is measured by UV spectroscopy can be used to quantify bromelain in a solution in the µg range.
Initially, serially diluted samples of bromelain with values of 800, 600, 400, etc. and below showed that using a 200 µg/mL bromelain solution that is serially diluted gives a good linear graph of absorbance vs. concentration. The correlation coefficient was 0.992, indicating good linearity, with the representative linear equation being:
which is calculated by the least square method.
y = 0.001681 × x + 0.1463 (p ≤ 0.0001);
The LOQ was found to be 16.4 µg/mL, whilst the LOD was 5.412 µg/mL. Although the LOQ calculated was 16.4 µg/mL, values as low as 5.0 µg/mL or even lower may be quantified.
Further, the intra-day and inter-day analysis showed that the relative standard deviation (R.S.D) values that were obtained by the designated method were found to be below 2.0%, indicating that variance is rather small and that analysis may from time to time be performed with a good accuracy that is close to 100% (mean recovery = 99.56 ± 0.17).
The reliability of the assay was tested by the assay robustness, with a measurement of the absorbance of the chromogen (azo dye) at different wavelengths (400–450 nm), which indicated almost 100% of the bromelain content evaluated. Hence, the azocasein assay is a reliable method for quantifying bromelain.
In addition, to validate the assay, we also examined certain other parameters in the assay, such as enzyme hydrolysis of casein (reaction time) at 30 vs. 60 min. The results indicated that terminating the reaction at 60 min as compared to 30 min provided a better response, as indicated by the slope of the graphs and the absorbance (OD), with a 40.24% increase in the signal. This is in agreement with other researchers who have monitored the time-dependent hydrolysis of casein [1].
Although bromelain can be quantified in either dH2O or in phosphate buffer saline, we examined the slope of the graphs in two media with similar dilution, and we found that there is a difference of 23% in favor of dH2O, indicating a steeper slope with dH2O. The zero absorbance was also relatively higher for PBS, although both media were at pH 7.4. When further evaluating the LOD and LOQ values, there is the indication that the assay is slightly more sensitive in dH2O, their respective values being LOD = 5.39 µg/mL and LOQ = 16.348 µg/mL for dH2O, as compared to PBS with LOD = 5.86 µg/mL and LOQ = 17.752 µg/mL.
Finally, we examined the effect of antioxidants on the proteolytic activity of bromelain, since, in our mucolytic formulation (BromAc), bromelain at 600 µg/mL is found in a solution of 2% N-acetylcysteine (20 mg/mL) at pH 7.0. A series of antioxidants were used for comparison to determine their effect on bromelain. Comparing the enhancement of proteolytic activity to standard bromelain without additives, only L-cysteine with 18.7% and N-acetylcysteine with 4% were on the list of enhancers, while all others showed a depression. Strong antioxidants such as DTT and DTBA only showed a depression, indicating that the pH of the media at 7.4 may have influenced this observation. On the other hand, the concentration of the antioxidants used may have affected the bromelain. Earlier studies with cysteamine have indicated that a combination of 2.0% cysteamine with 12.5 µg/mL bromelain showed a maximal proteolytic increase in activity of about 48%, whilst 1.0% NAC with 25 µg/mL bromelain gave an 87% enhancement, as compared to controls (with no antioxidants) (unpublished data). Various chemical agents investigated for their effect on bromelain indicated different degrees of proteolytic enhancement on bromelain extracted from different parts of the plant or unripe fruit, as compared to ripe fruits [11].
Bromelain has 222 amino acids, of which three are cysteine residues that carry an S-H group [12]. This group can get oxidized to form the disulfide linkages, resulting in the loss of proteolytic activity. Hence, the addition of cysteines and other reducing agents may restore the native state of the cysteine residues and thus may bring back the proteolytic activity at the catalytic site, thus showing an increase in activity. However, antioxidants are pH-sensitive, and hence a pH of 7.4 may not be favorable for all antioxidants [13], which leads to this observation.
Although other methods such as HPLC may provide a more sensitive quantification of bromelain, the current method may serve as a convenient and fast method of quantification where a high sensitivity for detecting nanograms of the enzyme is not required. Our earlier studies have also indicated that the present assay is not suitable for quantifying bromelain in patient serum owing to interference by the presence of endogenous proteolytic enzymes as well as other components that may react with bromelain. In addition, the bromelain present in blood occurs in the nanogram range, which the micro-azocasein assay is unable to detect owing to a lack of sensitivity. Hence, the micro-azocasein assay is a reliable and robust assay that can be routinely used in the laboratory in an economic way, since it involves neither a very laborious set-up nor expensive reagents.
Finally, although earlier work by Coelho et al. [1] has developed a miniature essay for quantifying bromelain, it neither uses the present micro level of reagents nor is their assay as sensitive. In comparison to the present assay, their LOD and LOQ was 72 and 494 µg/mL and 5.412 and 16.4 µg/mL, respectively, indicating that the current assay is several times more sensitive and useful, with much lower-level detection limits being required.
6. Conclusions
We conclude that the micro-azocasein assay is a convenient, economical, and versatile assay, since it may be applicable to assessing the proteolytic activity of different enzymes, and in particular cysteine proteases, with a sensitivity that exceeds an earlier assay that was published by another group.
Author Contributions
Conceptualization, K.P., J.A., A.H.M., S.J.V. and D.L.M.; methodology, K.P., J.A., A.H.M. and D.L.M.; software, K.P. and A.H.M.; formal analysis, K.P. and A.H.M.; investigation, K.P. and A.H.M.; writing—original draft preparation, K.P. and A.H.M.; writing—review and editing, K.P., J.A., A.H.M., S.J.V. and D.L.M.; visualization, K.P. and A.H.M.; supervision, D.L.M.; project administration, J.A. and S.J.V.; funding acquisition, D.L.M. All authors have read and agreed to the published version of the manuscript.
Funding
This research was funded by Mucpharm Pty Ltd., Australia.
Institutional Review Board Statement
Not applicable.
Informed Consent Statement
Not applicable.
Data Availability Statement
The datasets generated and/or analyzed during the current study are available from the corresponding author upon reasonable request.
Conflicts of Interest
Mucpharm Pty Ltd. solely owns or has sublicensed the intellectual property surrounding BromAc®. DLM and SV are shareholders of Mucpharm Pty Ltd. K.P., J.A. and A.H.M. are employees of Mucpharm Pty Ltd.
References
- Coêlho, D.F.; Saturnino, T.P.; Fernandes, F.F.; Mazzola, P.G.; Silveira, E.; Tambourgi, E.B. Azocasein Substrate for Determination of Proteolytic Activity: Reexamining a Traditional Method Using Bromelain Samples. BioMed Res. Int. 2016, 2016, 1–6. [Google Scholar] [CrossRef] [PubMed]
- Cupp-Enyard, C. Sigma’s non-specific protease activity assay-casein as a substrate. JoVE (J. Vis. Exp.) 2008, 19, e899. [Google Scholar]
- Zhang, X.; Shuai, Y.; Tao, H.; Li, C.; He, L. Novel Method for the Quantitative Analysis of Protease Activity: The Casein Plate Method and Its Applications. ACS Omega 2021, 6, 3675–3680. [Google Scholar] [CrossRef] [PubMed]
- Leippe, D.M.; Nguyen, D.; Zhou, M.; Good, T.; Kirkland, T.A.; Scurria, M.; Bernad, L.; Ugo, T.; Vidugiriene, J.; Cali, J.J.; et al. A bioluminescent assay for the sensitive detection of proteases. BioTechniques 2011, 51, 105. [Google Scholar] [CrossRef]
- Wang, S.-L.; Lin, H.-T.; Liang, T.-W.; Chen, Y.-J.; Yen, Y.-H.; Guo, S.-P. Reclamation of chitinous materials by bromelain for the preparation of antitumor and antifungal materials. Bioresour. Technol. 2008, 99, 4386–4393. [Google Scholar] [CrossRef]
- Pavan, R.; Jain, S.; Shraddha; Kumar, A. Properties and Therapeutic Application of Bromelain: A Review. Biotechnol. Res. Int. 2012, 2012, 976203. [Google Scholar] [CrossRef] [PubMed]
- Hirche, C.; Citterio, A.; Hoeksema, H.; Koller, J.; Lehner, M.; Martinez, J.R.; Kneser, U. Eschar removal by bromelain based enzymatic debridement (Nexobrid((R))) in burns: An European consensus. Burns 2017, 43, 1640–1653. [Google Scholar] [CrossRef]
- Amini, A.; Masoumi-Moghaddam, S.; Ehteda, A.; Morris, D.L. Secreted mucins in pseudomyxoma peritonei: Pathophysiological significance and potential therapeutic prospects. Orphanet J. Rare Dis. 2014, 9, 71. [Google Scholar] [CrossRef]
- Pillai, K.; Akhter, J.; Mekkawy, A.; Chua, T.C.; Morris, D.L. Physical and chemical characteristics of mucin secreted by pseudomyxoma peritonei (PMP). Int. J. Med Sci. 2017, 14, 18–28. [Google Scholar] [CrossRef] [PubMed]
- Pillai, K.; Akhter, J.; Chua, T.C.; Morris, D.L. Anticancer property of bromelain with therapeutic potential in malignant peritoneal mesothelioma. Cancer Investig. 2013, 31, 241–250. [Google Scholar] [CrossRef]
- ICH Harmonised Guideline. Validation of Analytical Procedures: Q2(R2). Available online: https://www.ich.org/page/quality-guidelines (accessed on 1 November 2023).
- Ritonja, A.; Rowan, A.D.; Buttle, D.J.; Rawlings, N.D.; Turk, V.; Barrett, A.J. Stem bromelain: Amino acid sequence and implications for weak binding of cystatin. FEBS Lett. 1989, 247, 419–424. [Google Scholar] [CrossRef] [PubMed]
- Lemańska, K.; Szymusiak, H.; Tyrakowska, B.; Zieliński, R.; Soffers, A.E.; Rietjens, I.M. The influence of pH on antioxidant properties and the mechanism of antioxidant action of hydroxyflavones. Free Radic. Biol. Med. 2001, 31, 869–881. [Google Scholar] [CrossRef] [PubMed]
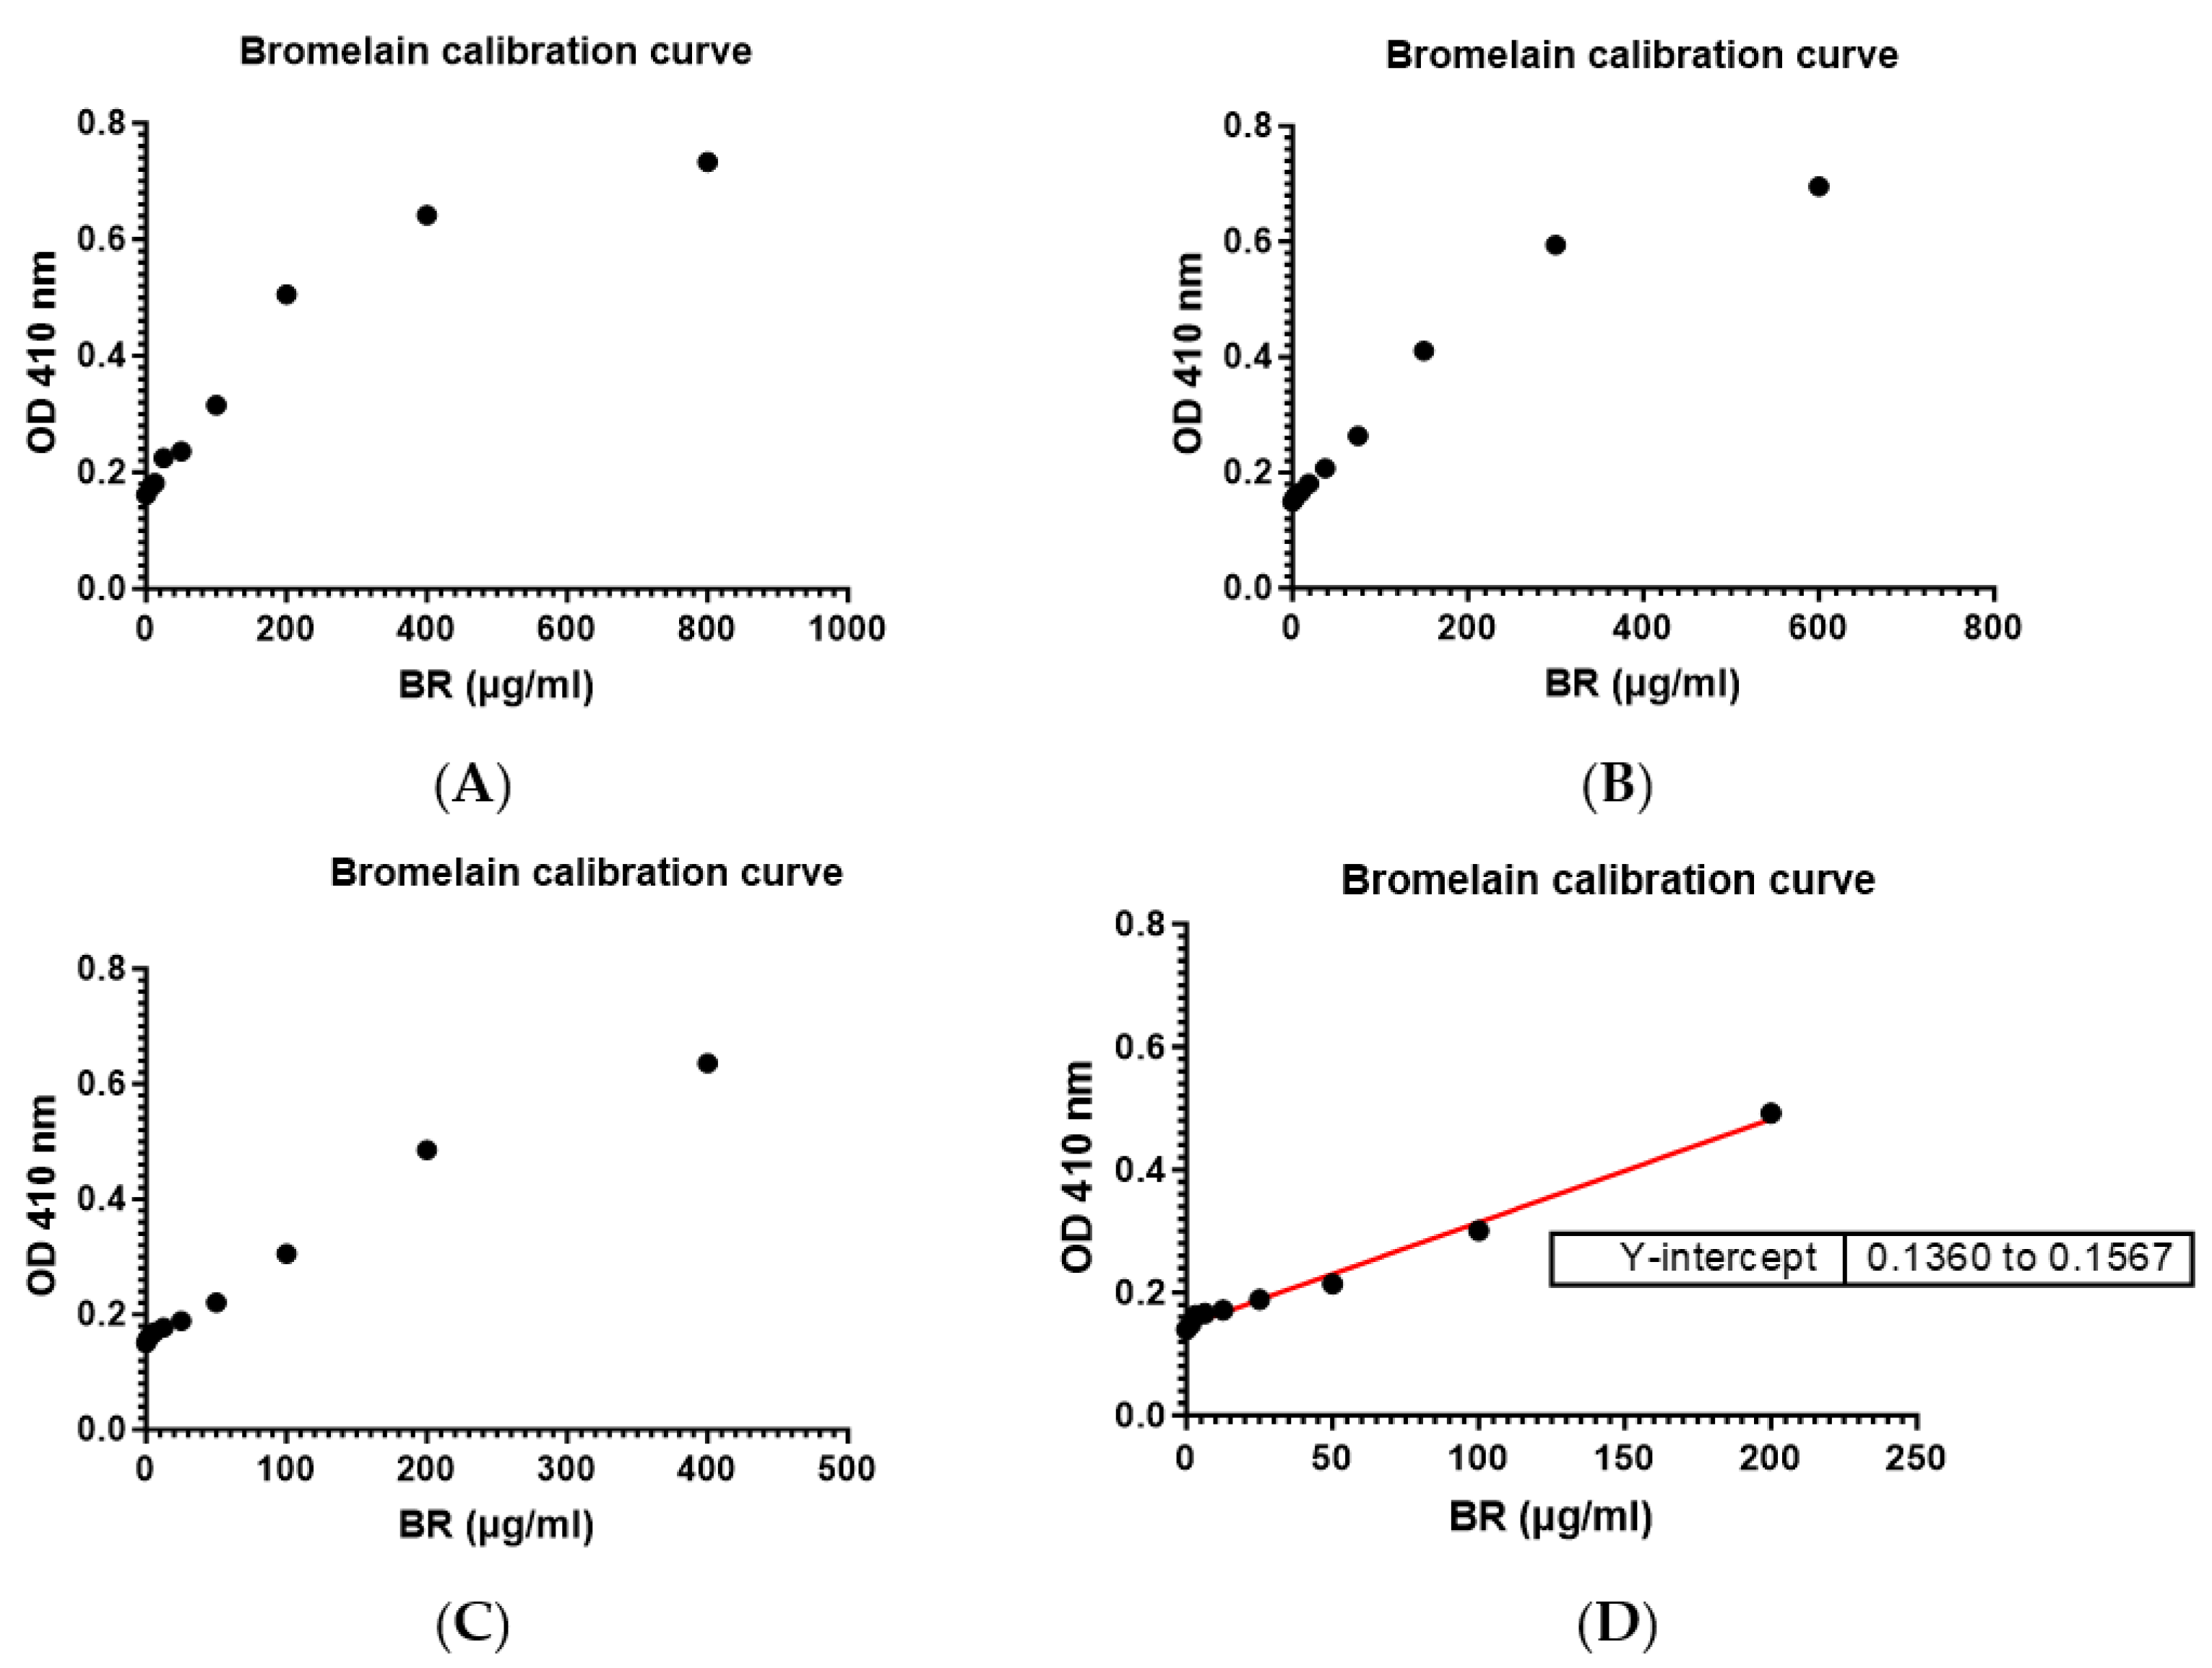
Figure 1.
The linear bromelain calibration curve was generated using different concentrations of Bromelain (i.e., serial dilutions of Bromelain at 800 (A); 600 (B); 400 (C); and 200 (D) µg/mL) to demonstrate linearity.
Figure 1.
The linear bromelain calibration curve was generated using different concentrations of Bromelain (i.e., serial dilutions of Bromelain at 800 (A); 600 (B); 400 (C); and 200 (D) µg/mL) to demonstrate linearity.

Figure 2.
Three series of bromelain linear calibration curves (1st, 2nd, and 3rd) were plotted by serial dilutions (0–200 µg/mL). The graph shows that the slopes are almost identical: 0.002061, 0.002068, and 0.002050.
Figure 2.
Three series of bromelain linear calibration curves (1st, 2nd, and 3rd) were plotted by serial dilutions (0–200 µg/mL). The graph shows that the slopes are almost identical: 0.002061, 0.002068, and 0.002050.

Figure 3.
The effect of enzyme-substrate reaction time on the bromelain calibration curve. At 60 min, the linear plot has a higher slope value compared to the 30 min linear curve.
Figure 3.
The effect of enzyme-substrate reaction time on the bromelain calibration curve. At 60 min, the linear plot has a higher slope value compared to the 30 min linear curve.

Figure 5.
Different calibration curves for bromelain with the addition of various antioxidants. L-cysteine has the highest slope value compared to the rest of the additives. DTBA: Dithiobutylamine; DTT: Dithiothreitol; NAC: N-acetylcysteine.
Figure 5.
Different calibration curves for bromelain with the addition of various antioxidants. L-cysteine has the highest slope value compared to the rest of the additives. DTBA: Dithiobutylamine; DTT: Dithiothreitol; NAC: N-acetylcysteine.


Table 1.
Intra-day (repeatability) and inter-day precision (intermediate precision) of the method using a theoretical concentration of 25 µg/mL. Data expressed as mean ± SD. RSD: Relative Standard Deviation.
Table 1.
Intra-day (repeatability) and inter-day precision (intermediate precision) of the method using a theoretical concentration of 25 µg/mL. Data expressed as mean ± SD. RSD: Relative Standard Deviation.
| Precision | Measured Concentration (µg/mL) | Mean Recovery (%) | RSD (%) |
|---|---|---|---|
| Intra-day (n = 3) | 25.886 ± 0.002 | 103 | 0.37 |
| Inter-day Day1 (n = 3) | 25.926 ± 0.163 | 103.7 | 0.6 |
| Inter-day Day2 (n = 3) | 25.093 ± 0.133 | 100.37 | 0.53 |
| Inter-day Day1 & 2 (n = 6) | 25.509 ± 0.416 | 102.04 | 1.63 |
Table 2.
The table indicates the accuracy (%) of the azocasein assay. Data expressed as mean ± SD.
| BR Sample (µg/mL) | Added BR (µg/mL) | BR Detected (µg/mL) | Accuracy (%) |
|---|---|---|---|
| 25.085 ± 0.098 | 3.0 | 27.94 ± 0.068 | 99.8 |
| 25.085 ± 0.098 | 4.0 | 28.82 ± 0.0049 | 99.4 |
| 25.085 ± 0.098 | 9.0 | 33.898 ± 0.0121 | 99.5 |
| Mean Recovery | 99.56 ± 0.17 | ||
Table 3.
Robustness of bromelain azocasein method at 6 different UV wavelengths. Data expressed as mean ± SD. UV: Ultraviolet.
Table 3.
Robustness of bromelain azocasein method at 6 different UV wavelengths. Data expressed as mean ± SD. UV: Ultraviolet.
| UV (nm) | Absorbance | Bromelain Content (%) | |
|---|---|---|---|
| Sample Solution (25 µg/mL) | Standard Solution (25 µg/mL) | ||
| 400 | 0.250 ± 0.001 | 0.252 ± 0.001 | 99.2 |
| 410 | 0.252 ± 0.0012 | 0.250 ± 0.0004 | 100.8 |
| 420 | 0.252 ± 0.0016 | 0.252 ± 0.0026 | 100 |
| 430 | 0.251 ± 0.0028 | 0.253 ± 0.0008 | 99.2 |
| 440 | 0.251 ± 0.0025 | 0.252 ± 0.0029 | 99.6 |
| 450 | 0.240 ± 0.0029 | 0.240 ± 0.0005 | 100 |
Table 4.
The effect of solvent matrix on limits of detection (LOD) and limits of quantification (LOQ) of the bromelain calibration curve.
Table 4.
The effect of solvent matrix on limits of detection (LOD) and limits of quantification (LOQ) of the bromelain calibration curve.
| Solvent | LOD (µg/mL) | LOQ (µg/mL) |
|---|---|---|
| Phosphate buffer Saline (PBS) | 5.86 | 17.75 |
| Distilled water (dH2O) | 5.39 | 16.35 |
Table 5.
The effect of antioxidants on the proteolytic activity of bromelain at physiological pH 7.4 as assessed by comparing the slope of the graph to that of bromelain without any addition (standard).
Table 5.
The effect of antioxidants on the proteolytic activity of bromelain at physiological pH 7.4 as assessed by comparing the slope of the graph to that of bromelain without any addition (standard).
| Additives | Enhancement/Depression |
|---|---|
| L-cysteine | Enhancement |
| N-acetylcysteine (NAC) | Enhancement |
| Dithiobutylamine (DTBA) | Depression |
| Dithiothreitol(DTT) | Depression |
| Ascorbic acid | Depression |
| Cysteamine | Depression |
Disclaimer/Publisher’s Note: The statements, opinions and data contained in all publications are solely those of the individual author(s) and contributor(s) and not of MDPI and/or the editor(s). MDPI and/or the editor(s) disclaim responsibility for any injury to people or property resulting from any ideas, methods, instructions or products referred to in the content. |
© 2024 by the authors. Licensee MDPI, Basel, Switzerland. This article is an open access article distributed under the terms and conditions of the Creative Commons Attribution (CC BY) license (https://creativecommons.org/licenses/by/4.0/).
Share and Cite
MDPI and ACS Style
Pillai, K.; Akhter, J.; Mekkawy, A.H.; Valle, S.J.; Morris, D.L. Development and Validation of Micro-Azocasein Assay for Quantifying Bromelain. Methods Protoc. 2024, 7, 25. https://doi.org/10.3390/mps7020025
AMA Style
Pillai K, Akhter J, Mekkawy AH, Valle SJ, Morris DL. Development and Validation of Micro-Azocasein Assay for Quantifying Bromelain. Methods and Protocols. 2024; 7(2):25. https://doi.org/10.3390/mps7020025
Chicago/Turabian StylePillai, Krishna, Javed Akhter, Ahmed H. Mekkawy, Sarah J. Valle, and David L. Morris. 2024. "Development and Validation of Micro-Azocasein Assay for Quantifying Bromelain" Methods and Protocols 7, no. 2: 25. https://doi.org/10.3390/mps7020025