Article

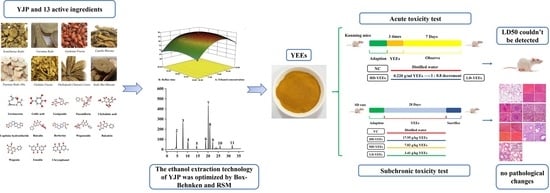
Optimization of Ethanol Extraction Technology for Yujin Powder Using Response Surface Methodology with a Box–Behnken Design Based on Analytic Hierarchy Process–Criteria Importance through Intercriteria Correlation Weight Analysis and Its Safety Evaluation

College of Veterinary Medicine, Gansu Agricultural University, Lanzhou 730070, China
*
Author to whom correspondence should be addressed.
Molecules 2023, 28(24), 8124; https://doi.org/10.3390/molecules28248124
Submission received: 25 October 2023 / Revised: 4 December 2023 / Accepted: 9 December 2023 / Published: 15 December 2023
(This article belongs to the Special Issue Veterinary Drugs—2nd Edition)

Abstract

:
Here, we aimed to optimize the ethanol extraction technology for Yujin powder (YJP) and evaluate its safety. The ultrasonic-assisted ethanol reflux extraction method refluxing was used to extract YJP. The parameters were optimized through a combination of single-factor and response surface methodology (RSM). The comprehensive Y value score calculated using the content of 13 active ingredients in YJP ethanolic extracts (YEEs) and the yield of the dry extract were used as measuring criteria. RSM with a Box–Behnken design using three factors and three levels was adopted to optimize the ethanol extraction technology for YJP. Finally, acute and subchronic toxicity tests were performed to evaluate its safety. The results revealed the best technological parameters: a liquid–material ratio of 24:1, an ethanol concentration of 69%, assistance of ultrasound (40 °C, 50 kHZ, 30 min), reflux time of 53 min, and reflux temperature of 50 °C. In acute toxicity tests, the maximum administration dosage in mice was 28.21 g/kg, which is higher than 10 times the clinical dosage. Adverse effects in the acute and subchronic toxicity tests were not observed. All clinical indexes were normal. In conclusion, the RSM based on AHP–CRITIC weight analysis could be used to optimize the ethanol extraction technology for YJP and YEEs prepared under the above conditions and ensure high safety.

Graphical Abstract

1. Introduction

Yujin powder (YJP), from Yuanheng Therapeutic Horse Collection, is composed of Curcumae Radix, Chebulae Fructus, Scutellariae Radix, Radix Rhei Rhizome, Coptidis Rhizoma, Gardeniae Fructus, Paeoniae Radix Alba and Phellodendri Chinrnsis Cortex [1]. It has the effect of clearing heat and detoxicating and astringing intestines and stopping diarrhea [1]. In veterinary clinics, it is often used to treat dampness-heat diarrhea of horses, calf diarrhea and acute enteritis of cattle [2,3,4]. In addition, our previous research demonstrated that YJP had a good therapeutic effect on large intestine dampness-heat syndrome (LIDHS) [5,6,7]. In YJP, Curcumae Radix can activate blood circulation and dissolve stasis, relieve pain and alleviate jaundice symptoms [1]. Germacrone, a main ingredient of Curcumae Radix, has good anti-inflammatory [8], antioxidative [9] and antipyretic analgesic effets [10]. Coptidis Rhizoma, Scutellariae Radix, Phellodendri Chinensis Cortex and Gardeniae Fructus have the effect of clearing heat, drying dampness, purging fire and removing toxins [1]. Among them, coptisine, berberine, baicalin, baicalein, wogonoside, wogonin and geniposide are the main components which have anti-inflammatory and antioxidative effects [11,12,13,14,15]; coptisine and berberine have certain antibacterial activities and could protect the intestinal epithelial barrier [16]. Baicalin could also alleviate chronic gastritis effectively by inhibiting inflammatory factors [17]. Paeoniae Radix Alba and Chebulae Fructus can astringe Yin and intestines to stop diarrhea [1], and the main components in them (peoniflorin, chebulinic acid and gallic acid) could regulate immunity and intestinal flora and alleviate colitis [18,19]. Rhei Radix Rhizoma could clear blood heat and remove stagnation [1]; as the main effective components, emodin has strong antibacterial, anti-inflammatory and antioxidative effects and chrysophanol could inhibit vasoconstriction and promote blood clotting [20,21,22]. Therefore, we subsequently selected the content of the 13 active components, including germacrone, gallic acid, geniposide, paeoniflorin, chebulinic acid, coptisine hydrochloride, baicalin, berberine, wogonoside, baicalein, wogonin, emodin and chrysophanol (Figure 1) in YJP and the yield of the dry extract to assess the extraction effects of YJP.
At present, the powder and/or decoction of YJP are often used in the clinic. However, they have some disadvantages, such as less active ingredients, high volatility, difficult preservation, etc. [23]. Therefore, it is very necessary to develop some new dosage forms of YJP. Meanwhile, extracts need to be used as the raw material. The traditional extraction methods such as heat reflux extraction (HRE), Soxhlet extraction, distillation, etc., have some drawbacks, e.g., they are time consuming, have low extraction selectivity and efficiency, few active ingredients, high volatility, difficult preservation, etc. [24,25]. Therefore, new methods and assisted strategies need to be created to improve the extraction efficiency and purity. Ultrasound-assisted (UA) extraction is an efficient method for the extraction of herbal active ingredients. Relevant studies have shown that the extraction of flavonoids, saponins and salvianolic acid B using UA extraction was significantly higher compared to Soxhlet extraction, high-purity extraction and distillation [26,27]. The cavitation effects, mechanical effects and thermal effects of ultrasonic waves can fracture the cytoderm of medicinal material and then accelerate the release, diffusion and dissolution of material within cells. The extraction of medicinal materials with alcoholic solution could extract both the water-soluble and alcohol-soluble ingredients. And we found that UA extraction combined with ethanol refluxing extraction was the most effective of the extraction technologies from our previous exploration. Ultimately, the ultrasonic-assisted ethanol reflux extraction method was used to extract YJP [28].
Response surface methodology (RSM) has been widely used for optimizing the extraction technology of Traditional Chinese Medicine (TCM), such as in flavonoid extracts from Paeonia lactiflora seed peel, alkaloids from Rhizoma Coptidis, and so on [29,30]. The method has advantages including the high accuracy and reliability of the test parameters. Analytic hierarchy process (AHP) and criteria importance through intercriteria correlation (CRITIC) methods are often used for quality evaluation in TCM [31,32]. AHP means using mathematical logical thinking to analyze information from multiple targets. A pairwise comparison discriminant matrix is constructed, and the weight ratio of each piece of information to the preceding information is calculated [33]. CRITIC is used to comprehensively determine the objective weight of each indicator through the variability and conflict between indexes, and it can also determine the weight according to the size of the indicator variation [34]. The AHP–CRITIC method combines the advantages of the AHP and CRITIC, considering both subjective and objective factors. It is the most commonly used method of subjective and objective comprehensive weighting in TCM. Therefore, it is essential to develop the extraction technology of YJP based on Box–Behnken combined with an AHP-CRITIC design.
In the present study, the synthetic weighing method based on AHP and CRITIC was used to calculate the comprehensive scores. On the basis of single-factor experiments, RSM based on a Box–Behnken design was carried out to optimize the ethanol extraction technology parameters of YJP. In addition, the safety of YJP ethanolic extracts (YEEs) was evaluated. It is hoped that this study will provide a basis for the effective extraction of YEEs and lay a foundation for the development and utilization of YEEs.

2. Results

2.1. Method Validation of HPLC

2.1.1. Linear Relationships

The calibration curves and linear ranges of germacrone, gallic acid, geniposide, paeoniflorin, chebulinic acid, coptisine hydrochloride, baicalin, berberine, wogonoside, baicalein, wogonin, emodin and chrysophanol are listed in Table 1.

2.1.2. Precision, Stability and Repeatability

As shown in Table 2, Table 3 and Table 4, the precision, stability and repeatability RSD values of the thirteen standards were all < 2%, indicating that this method is suitable for the quantitative analysis of the 13 components.

2.1.3. Sample Recovery Rate

Average recoveries ranged from 92.60% to 99.30%, and the RSD values were all < 2% for all thirteen compounds, indicating that the developed method was reliable and accurate enough for the measurement (Table 5).

2.2. AHP Weight

The normalized weight coefficients of germacrone, gallic acid, geniposide, paeoniflorin, chebulinic acid, coptisine hydrochloride, baicalin, berberine, wogonoside, baicalein, wogonin, emodin, and chrysophanol and the dry extract yield were 0.1541, 0.0467, 0.0897, 0.0467, 0.0467, 0.0467, 0.0897, 0.0897, 0.0897, 0.0897, 0.0897, 0.0467, 0.0467 and 0.0272, respectively (Table 6).

2.3. CRITIC Weight

The weight coefficients of germacrone, gallic acid, geniposide, paeoniflorin, chebulinic acid, coptisine hydrochloride, baicalin, berberine, wogonoside, baicalein, wogonin, emodin, and chrysophanol and the dry extract yield were 0.0711, 0.0776, 0.0916, 0.0767, 0.0524, 0.0607, 0.0584, 0.0611, 0.0654, 0.0697, 0.0653, 0.0726, 0.0751 and 0.1024, respectively (Table 7).

2.4. Weight Determination by AHP-CRITIC Mixed Weighting Method

The comprehensive weight coefficients of germacrone, gallic acid, geniposide, paeoniflorin, chebulinic acid, coptisine hydrochloride, baicalin, berberine, wogonoside, baicalein, wogonin, emodin, and chrysophanol and the dry extract yield were 0.1564, 0.0518, 0.1173, 0.0512, 0.0350, 0.0405, 0.0748, 0.0782, 0.0837, 0.0893, 0.0836, 0.0484, 0.0501 and 0.0398, respectively (Table 8).

2.5. Single-Factor Experiments

The comprehensive Y scores of 20 batches of the single-factor experiment were as follows: Y1 (liquid–material ratio 15:1) = 35.23%, Y2 (liquid–material ratio 20:1) = 45.55%, Y3 (liquid–material ratio 25:1) = 74.15%, Y4 (liquid–material ratio 30:1) = 52.80%, Y5 (reflux temperature 40 °C) = 39.81%, Y6 (reflux temperature 50 °C) = 47.27%, Y7 (reflux temperature 60 °C) = 52.74%, Y8 (reflux temperature 70 °C) = 45.61%, Y9 (ultrasonic intensity 40 kHZ) = 46.67%, Y10 (ultrasonic intensity 50 kHZ) = 50.94%, Y11 (ultrasonic intensity 60 kHZ) = 46.67%, Y12 (ultrasonic intensity 70 kHZ) = 42.43%, Y13 (reflux time 40 min) = 40.56%, Y14 (reflux time 50 min) = 60.99%, Y15 (reflux time 60 min) = 50.56%, Y16 (reflux time 70 min) = 47.05%, Y17 (ethanol concentration 50%) = 43.06%, Y18 (ethanol concentration 60%) = 51.18%, Y19 (ethanol concentration 70%) = 59.65%, Y20 (ethanol concentration 80%) = 45.68%.
The results showed that Y value changed sightly with the increase in refluxing temperature and ultrasonic intensity, indicating that they had little influence on the extraction quality of YEEs. The other three factors significantly affected the extraction quality of YEEs. The three levels of ethanol concentration were 60%, 70%, and 80%, the refluxing times were 40 min, 50 min, and 60 min and the liquid−material ratios were 20:1, 25:1, and 30:1, respectively (Figure 2).

2.6. Response Surface Experiment

2.6.1. Model Establishment and Significance Test

Based on the results of single-factor experiments, a quadratic regression model was established using a three-factor-three-level full central composite experimental design based on RSM. The experimental design results are shown in Table 9. The quadratic regression equation is as follows:
Y = 89.28 − 4.67 × A + 0.72 × B − 3.44 × C − 0.15 × A × B − 1.21 × A × C − 0.055 × B × C − 11.46 × A2 − 4.48 × B2 − 5.67 × C2
Y is the comprehensive score; A, B and C represent the ethanol concentration, refluxing time and liquid–material ratio, respectively.
The model F = 181.33 and p < 0.0001 indicated that the model was highly significant. Lack-of-fit F = 3.40 and p = 0.1340 indicated that the lack-of-fit of the model was not significant and the experimental values greatly agreed with the predicted ones. R2 = 0.9957 indicated that the credibility of the model was good. To sum up, the model fully fitted the experimental data. The response value Y was related to the selected variables: ethanol concentration (A), refluxing time (B) and liquid–material ratio (C). As the F value is higher, the various factors have a more significant effect on the Y value. The F values of the ethanol concentration (A), refluxing time (B) and liquid–material ratio (C) were 253.96, 5.95 and 137.63, respectively. The influences of A, B and C on the Y value were highly significant (p < 0.05). The influence degree of each factor on the Y value showed the following order: ethanol concentration, liquid–material ratio, and refluxing time (Table 10).

2.6.2. Validation of Response Surface Experiment

The optimal technology conditions were obtained as follows: ethanol concentration of 69%, liquid−material ratio of 24:1, and refluxing time of 53 min.
Under the above optimum conditions, we performed three parallel experiments with 24 g of crude drug each time, detected the content of 13 active ingredients in YJP, and calculated the yield of dry extract to calculate the comprehensive Y value score (Table 11, Figure 3). The weight of dry extract was 7.6944 ± 0.4080 g, and the yield of dry extract was 32.0613 ± 0.4989. Subsequently, an independent t-test was conducted using SPSS 26.0 software to compare the validation value with the predicted value. The result showed that the predicated value (90.0413) and validation value (90.0381) had no significant difference (p = 0.114 > 0.05), indicating that the predicated conditions of the model were identical to those of the actual situation and the model was successfully established. Therefore, the method was feasible and could be extensively enforced.

2.6.3. Interaction of Various Factors

The response surface analysis was used to assess the interaction of various factors by Design Expert 8.0.6 software. The shape of the contour plot indicates whether the interaction among variables is significant, and ellipse denotes the strong interaction. The denser the contours were and the steeper the response surface graph was, the greater the influence of factors on the extract yield.
As can be seen from Figure 4A, with the increase in ethanol concentration and reflux time, the Y value presented a trend of earlier increase and later decrease. As shown in Figure 4B, the contours along the ethanol concentration axis, which was elliptic, were denser than those along the refluxing time axis, indicating that the influence of ethanol concentration on the response values was more significant than that of the refluxing time and there was a strong and significant interaction between the two factors. Similarly, as can be seen from Figure 4C,D, with the increase in ethanol concentration and liquid–material ratio, the Y value presented a trend of earlier increase and later decrease, indicating that the influence of ethanol concentration on the response values was more significant than the liquid–material ratio. From Figure 4E,F, with the increase in liquid–material ratio and refluxing time, the Y value presented a trend of first increasing and later decreasing, indicating that the influence of the liquid–material ratio on the response values was more significant than the influence of the refluxing time.
To sum up, there were significant interactions among the ethanol concentration and refluxing time, ethanol concentration and liquid–material ratio, and refluxing time and liquid–material ratio. The influence on the comprehensive Y value score of YEEs showed the following order: ethanol concentration > liquid–material ratio > reflux time.

2.7. Acute Toxicity Test Results

2.7.1. Pre-Experiment Results

After 7 days of administration, all the mice were active and in good spirits; appetite, stools and urine were all normal; breathing was even, and no deaths occurred. LD50 could not be detected, indicating that the YEEs were actually nontoxic. Therefore, we subsequently performed the maximum administration dosage test.

2.7.2. Maximum Administration Dosage Test Results

The maximum administration dose was 28.21 g/kg (equal to 87.97 g/kg of crude drug) in one day, which was more than 10 times the dosage in the clinic. The mice in each group were active and in good spirits; appetites were all normal and no deaths occurred before and after drug administration.

2.8. Subchronic Toxicity Test Results

2.8.1. Observation of Clinical Symptoms and Signs

After administration, the rats of the vehicle control group (VC group), high-dose YEEs group (HD-YEEs group), middle-dose YEEs group (MD-YEEs group) and low-dose YEEs group (LD-YEEs group) were active and in good spirits; appetite, stools and urine were all normal, breathing was even, and no deaths occurred. The weights showed an increasing trend for all rats, and the increase in the weight of the female rats was less than that of the male rats. There was no significant difference in the weights of male and female rats among the four groups (Table 12 and Table 13).

2.8.2. Analysis of Organ Indices

As shown in Table 14 and Table 15, there was no significant difference in the heart, liver, spleen, lung, kidney, ovary and testis indices of male and female mice among the four groups.

2.8.3. Detection Results of the Blood Routine and Blood Biochemistry

As shown in Table 16, Table 17, Table 18 and Table 19, there was no significant difference in the blood routine (WBC, LYM, HGB, RBC and PLT, etc.) and blood biochemistry indices (ALT, AST, ALP, Cr and BUN, etc.) of male and female mice among the four groups.

2.8.4. Histopathological Change in Main Organs

There were no significant pathological changes in heart, liver, spleen, lung, kidney, ovary and testis of rats in each group. The structure of lung was clear, obvious atrophy; expansion and inflammatory cellular infiltrations were not observed (Figure 5). The structure of the liver and liver cells were regular and clear, the nucleus was located in the center of the cells, and the structure of the hepatic lobules was normal (Figure 6). The red pulp and white pulp of the spleen were sharply demarcated; the structure of the splenic corpuscle and central artery were clearly observed (Figure 7). The kidney and morphology of glomeruli were observed, expansion and atrophy were not observed, glomerular capsule cavity was smooth, and there was no exudation (Figure 8). The morphology of cardiomyocytes was normal; the myocardial fibers and cardiomyocytes were tightly connected and well arranged without atrophy, degeneration, edema and inflammatory infiltration (Figure 9). The morphological structure of the secondary oocyte in the ovary was normal, and the granular cell layer was well arranged without hyperemia and hemorrhage (Figure 10). The morphological structure of the testis was normal, the spermatocytes in the seminiferous tubules were evenly arranged, the mass of spermatids could be seen in the lumen and there was no thickening and obvious pathological changes in the interface membrane (Figure 11).

3. Discussion

The ethanol extraction technology of YJP was optimized by a single-factor test and RSM, which is a common method to optimize the extraction process of TCM. The comprehensive evaluation index was determined through the content of active ingredients and dry extract yield of YJP. The multi-objective components are transformed into single-objective optimization calculation by using a comprehensive evaluation method, which could not only merge together the comprehensive effects of all indices but also reflect the complexity of chemical composition and integrity and multi-targeted medicinal effects. It has been increasingly utilized in the extraction of Chinese herbal prescriptions in recent years. The key of the comprehensive evaluation method is to establish the weight coefficient of each index. In the present study, the synthetic weighing method based on the AHP and CRITIC was performed to calculate comprehensive scores. The compatibility of YJP and the objective factual data were both considered [35,36,37,38,39]. It could make the comprehensive scores more comprehensive, scientific and reasonable. The content of active ingredients in YJP was detected by HPLC, which is not restricted by the volatility and thermal stability of the samples, especially the compound with a high boiling point, macromolecular, strong polarity and poor heat stability. It is widely used in the analysis and detection of drug components due to the advantages of high sensitivity, fast analysis and high separation efficiency [40,41,42,43,44].
In the present study, the ultrasonic-assisted ethanol reflux extraction method was used to extract YJP. The ultrasonic intensity, ultrasonic time, ultrasonic temperature, ultrasonic frequency, reflux temperature, reflux time, liquid–material ratio and ethanol concentration were the main influential factors of ultrasonic-assisted ethanol reflux extraction, respectively [45,46,47,48,49,50,51]. The ultrasonic time and ultrasonic frequency should not be too long and high or the extraction yield of ineffective components increases, which is harmful for separation and purification; even the structures of active ingredients (flavonoids, alkaloids, glycosides) are damaged and hydrogen bonds in polysaccharides fracture, which might affect the biological activity [52]. Previous studies have shown that the ultrasonic time of 30 min and ultrasonic frequency of 300 W have a better effect on the extract of active ingredients such as flavonoids, polysaccharides, etc. [53,54]. Therefore, the ultrasonic time and ultrasonic frequency were set at 30 min and 300 W, respectively. Our previous experiment indicated that the optimum ultrasonic temperature was 40 °C. Therefore, we performed the single-factor experiment on only the following five factors: ultrasonic intensity, ethanol concentration, reflux temperature, reflux time, and liquid–material ratio. The results showed that the reflux temperature and ultrasonic intensity had less effect on the comprehensive Y score. Finally, the liquid–material ratio, ethanol concentration and reflux time were selected to perform an RSM experiment to obtain optimal extraction conditions. The interaction among the factors which affected the ethanol extraction technology of YJP was analyzed, and the impact degrees of several factors on the comprehensive Y score were in the following order: ethanol concentration > liquid–material ratio > reflux time. It was indicated that the selection of extraction solvent concentration played an important role in the ethanol extraction technology of YJP. Therefore, ethanol concentration had the greatest effect on the extraction rate of each component of YJP, which was followed closely by the liquid–material ratio and reflux time.
The YEEs is different from the traditional decoction and powder of YJP. Therefore, a safety evaluation must be performed before clinical application. We performed the acute toxicity and subchronic toxicity test on YEEs. The results of the toxicity test showed that YEEs were actually nontoxic and had no significant effect on the weight, main organ indices, blood routine, blood biochemistry and histopathological changes of various main organs. Therefore, it is safe and reliable under clinical doses. It is reported that each herb has high safety in YJP. The ethanol extract concentrate of the Curcumae Radix decoction pieces had no adverse effect on rats through subchronic toxicity [55]; the ethanol extract of Rhei Radix Rhizoma had minor liver and kidney damage only at the ultra-high dose [56]; the ethanol extract of Scutellariae Radix had low toxicity and was safe and reliable for clinical administration [57]; the ethanol extract of Gardeniae Fructus could cause liver and kidney damage in rats at a dosage of 0.14–0.56 g/kg, but it is reversible and much greater than the therapeutic dose [58]; the ethanol extracts of Coptidis Rhizoma, Phellodendri Chinensis Cortex, Chebulae Fructus and Paeoniae Radix Alba are usually used for anti-inflammatory, antibacterial and antioxidant research with little reports of toxicity [59,60,61,62]. To sum up, each of single herb of YJP has high safety, and the herbal ingredients are diluted compared with each single herb after formulation. Therefore, YEEs should have higher safety.

4. Materials and Methods

4.1. Materials and Reagents

4.1.1. Experimental Drugs

Curcumae Radix, Coptidis Rhizoma, Scutellariae Radix, Phellodendri Chinensis Cortex, Gardeniae Fructus, Rhei Radix Rhizoma, Paeoniae Radix Alba and Chebulae Fructus (2:2:2:2:2:4:1:1) were purchased from the Yellow River medicine markets in Lanzhou City, Gansu Province, China. The mixture was crushed proportionately and passed through a 60-mesh screen.

4.1.2. Experimental Reagents

Germacrone (batch number: YZ071922, CAS: 6902-91-6), gallic acid (batch number: YZ092122, CAS: 149-91-7), chebulinic acid (batch number: YZ0811222, CAS: 18942-26-2), geniposide (batch number: YZ081022, CAS: 24512-63-8), paeoniflorin (batch number: YZ032922, CAS: 23180-57-6), coptisine hydrochloride (batch number: YZ090423, CAS: 6020-18-4), berberine (batch number: YZ110920, CAS: 2086-83-1), baicalin (batch number: YZ051422, CAS: 21967-41-9), baicalein (batch number: YZ052421, CAS: 491-67-8), wogonoside (batch number: YZ053023, CAS: 51059-44-0), wogonin (batch number: YZ090220, CAS: 632-85-9), emodin (batch number: YZ080920, CAS: 518-82-1) and chrysophanol (batch number: YZDHF081020, CAS: 481-74-3) were purchased from Nanjing Yuanzhi Biotechnology Co., Ltd. (Nanjing, China). The purity of each reference component was determined to be above 98% by HPLC analysis. Chromatographic-grade methanol, acetonitrile and phosphoric acid were purchased from Sigma Aldrich (St. Louis, MO, USA). Anhydrous ethanol was obtained from the Tianjin Baishi Chemical Plant Co., Ltd. (Tianjin, China). Purified water was purchased from the Hangzhou Wahaha Group Co., Ltd. (Hangzhou, China).

4.1.3. Animals

Kunming mice (half males and half females, 18–22 g) and SD rats (half males and half females, 160–180 g) were purchased from the Animal Center of the Lanzhou Veterinary Research Institute of the Chinese Academy of Agricultural Sciences (SCXK (Gan) 2020-0002). During the experiment, the mice were housed in a 12 h dark/light circulating environment of room temperature (25 ± 2 °C), relative humidity of 55 ± 5%, and were given free access to a standard diet and purified water. Animal welfare and experimental procedures were carried out in strict accordance with the “Guidelines for the Management and Use of Laboratory Animals” (Ministry of Science and Technology of China, 2006) and approved by the Animal Ethics Committee and the Animal Protection and Utilization Committee of Gansu Agricultural University.

4.2. Drug Preparation

The mixture of drugs listed in Section 4.1.1. was extracted by an ultrasonic-assisted ethanol reflux extraction method through different conditions including the ultrasonic intensity (30 kHZ, 40 kHZ, 50 kHZ, 60 kHZ), liquid–material ratio (15:1, 20:1, 25:1, 30:1), reflux temperature (40 °C, 50 °C, 60 °C, 70 °C), reflux time (40 min, 50 min, 60 min, 70 min) and ethanol concentration (50%, 60%, 70%, 80%). The mixture was firstly processed by ultrasound (Jining Tianhua ULTRASONIC Electronic Instrument Co. Ltd., Jining, China) (30 min, 40 °C) and then extracted by ethanol reflux twice. The filtrate obtained twice was mixed and concentrated by a rotary evaporator at 60 °C (Shanghai Yarong Biochemical Instrument Co., Ltd., Shanghai, China) and then freeze-dried by a vacuum freeze dryer (Beijing Boyikang Instrument Co., Ltd., Beijing, China). The dry extract was accurately weighed.

4.3. HPLC Detection

We use the method of high-performance liquid chromatography (HPLC) to detect the content of 13 active components of YEEs, which were used for the subsequent calculations of comprehensive Y value score [28].

4.3.1. HPLC Chromatographic Condition

Agilent 1260 HPLC (Agilent Technologies, Santa, Clara, CA, USA) equipped with a Zorbax Eclipse Plus C18 column (4.6 × 250 mm, 5 μm) was used for HPLC analysis. The mobile phases were respectively composed of (A) aqueous phosphoric acid (0.1%, v/v) and (C) acetonitrile (gallic acid, geniposide, paeoniflorin, chebulinic acid, coptisine hydrochloride, berberine, baicalin, baicalein, wogonoside and wogonin), (A) aqueous acetic acid (10%, v/v) and (C) acetonitrile (emodin and chrysophanol), (A) ultrapure water and (C) acetonitrile (germacrone) at the flow rate of 1.0 mL/min. The following gradient elution conditions were used for the mobile phase A: 1–2 min, 95–85%, 2–13 min, 85–80%, 13–20 min, 80–62%, 20–30 min, 62–52%, 30–35 min, 52–41% (gallic acid, geniposide, paeoniflorin, chebulinic acid, coptisine hydrochloride, berberine, baicalin, baicalein, wogonoside and wogonin); 1–2 min, 95–85%, 2–10 min, 85–70%, 10–30 min, 70–40%, 30–40 min, 40–40% (emodin and chrysophanol); 0–15 min, 50–40%, 15–20 min, 40–15%, 20–25 min, 15–15%, 25–30 min, 15–5% (germacrone). The detection wavelengths were set at 250, 425 and 216 nm, respectively.

4.3.2. Preparation of Standard Solutions

The appropriate amounts of the standards were weighed accurately, added to the same 10 mL volumetric flask and dissolved in 70% methanol. The mass concentrations of gallic acid, chebulinic acid, geniposide, paeoniflorin, coptisine hydrochloride, berberine, baicalin, baicalein, wogonoside, wogonin, emodin, chrysophanol and germacrone were 0.76, 0.5, 0.42, 0.1, 0.3, 0.7, 0.5, 0.25, 0.4, 0.57, 0.78, 0.48 and 0.889 mg/mL, respectively. Then, the mixed standard solution was diluted with methanol to obtain a series of solutions with different concentrations in order to establish the linear relationships. All the solutions were filtered using 0.22 μm microporous membranes before analysis and stored at 4 °C away from light.

4.3.3. Method Validation with HPLC

The precision was validated by five replicate injections of mixed standard solutions under the optimized conditions. Stability was also tested by analyzing sample solutions at 0, 2, 4, 10 and 24 h. Five independent sample solutions of YEEs in parallel were prepared and analyzed for evaluating the repeatability. The sample recovery rate was conducted by adding thirteen accurately known quantities of the corresponding standards to a sample of YEEs that had previously been analyzed.

4.4. Weight and Calculation of Comprehensive Y Score

4.4.1. Index for Selection

We consulted a lot of studies in the literature and summarized 13 active ingredients for treating the dampness-heat type of gastrointestinal diseases in YJP, including germacrone, gallic acid, geniposide, paeoniflorin, chebulinic acid, coptisine hydrochloride, berberine, baicalin, baicalein, wogonoside, wogonin, emodin and chrysophanol. The comprehensive score value calculated through the contents of the above active ingredients and the dry extract yield was used as the measuring index for the single-factor and RSM experiments.

4.4.2. Weight Calculation by AHP

According to the compatible regularity and contribution of the monarch, minister, assistant and guide of YJP [63], the order of preference of 14 indicators was determined as follows: germacrone > berberine = baicalin = baicalein = wogonoside = wogonin = geniposide > chebulinic acid = gallic acid = paeoniflorin = emodin = chrysophanol = coptisine hydrochloride > dried extraction yield. According to this, we established the judgment priority matrix of paired comparison, and the relative scores of each index were obtained (Supplementary Table S1).

4.4.3. Weigh calculation by CRITIC

The CRITIC method mainly embodies the objective information of the test data, and it divides the index weight into the contrast intensity (δi) between the indices and the conflict (Rij) between the indices [64].
Rj = i = 0 n 1   rij   = 1 / x ¯ ,  
δj is the standard deviation of the standardized column vector; Cj = δj, Rj = δj/ x ¯ , rij is the association coefficient of index i and j, i = 1, 2……m, x ¯ is the average value of the data in each row of the correlation matrix;
Wj = Cj / j = 1 n Cj .
The data in Supplementary Table S2 are processed by linear interpolation (data index value = (measured value-minimum value)/(maximum value-minimum value) × 100%). After eliminating the unit dimension, the correlation coefficient matrix (A) was obtained through the process of SPSS 26 software. And the contrast intensity (δi), conflict (Rij), comprehensive weight (Ci) and weight (ωi) between the indicators were calculated according to the formula. The results are shown in Supplementary Tables S3 and S4.

4.4.4. Weight Determination by AHP-CRITIC Mixed Weighting Method

The AHP-CRITIC mixed weighting method was used to evaluate weight (ω). The calculating formula is shown below:
ωsynthesis = ωAHPij × ωCRITICij/(∑ ωAHPij × ωCRITICij),
where ωAHPij and ωCRITICij are the weight coefficients, respectively, by AHP and CRITIC [35,36,37].

4.4.5. Calculation of Comprehensive Y Score

The contents of germacrone, gallic acid, geniposide, paeoniflorin, chebulinic acid, coptisine hydrochloride, berberine, baicalin, baicalein, wogonoside, wogonin, emodin and chrysophanol in the YEEs were detected by HPLC, and the extraction rate of each active ingredient and dry extract yield were calculated. According to the extraction rate of the above active ingredients in YJP and the dry extract yield, the AHP-CRITIC mixed weighting method was used to determine the weight coefficient and calculate the comprehensive Y score [38].
Synthesis score Y = [(germacrone content/maximum germacrone content) × ωsynthesis1 + (gallic acid content/maximum gallic acid content) × ωsynthesis2 + (geniposide content/maximum geniposide content) × ωsynthesis3 + (paeoniflorin content/maximum paeoniflorin content) × ωsynthesis4 + (chebulinic acid content/maximum chebulinic acid content) × ωsynthesis5 + (coptisine hydrochloride content/maximum coptisine hydrochloride content) × ωsynthesis6 + (baicalin content/maximum baicalin content) × ωsynthesis7 + (berberine hydrochloride content/maximum berberine hydrochloride content) × ωsynthesis8 + (wogonoside content/maximum wogonoside content) × ωsynthesis9 + (baicalein content/maximum baicalein content) × ωsynthesis10 + (wogonin content/maximum wogonin content) × ωsynthesis11 + (emodin content/maximum emodin content) × ωsynthesis12 + (chrysophanol content/maximum chrysophanol content) × ωsynthesis13 + (dry extract yield/maximum dry extract yield) × ωsynthesis14] × 100.

4.5. Single-Factor Experiment

The main influential factors of the extraction rate were ethanol concentration, reflux temperature, reflux time, the ratio of material to solvent and ultrasonic intensity from the literature. The single-factor test with five factors and four levels was designed: 50%, 60%, 70%, and 80% of ethanol concentration; 40 °C, 50 °C, 60 °C, and 70 °C of reflux temperature; 40 min, 50 min, 60 min, and 70 min of reflux time; 15:1, 20:1, 25:1, and 30:1 of the ratio of solvent to material; 30 kHZ, 40 kHZ, 50 kHZ, and 60 kHZ of ultrasonic intensity, respectively. According to the above extraction method, three parallel experiments were used to detect every index. And comprehensive Y score was used as the evaluation index.

4.6. Optimization of Ethanol Extraction Conditions of YJP by RSM

4.6.1. Response Surface Experimental Design

The central composite design was performed by Design expert 8.0.6 software. The influence and interaction among ethanol concentration, reflux time and liquid–material ratio were investigated according to the Box–Behnken design principle; the matrix was generated, and the response surface model was analyzed (Table 20).

4.6.2. Verification Experiments

The optimal conditions were determined by the analysis of Design expert 8.0.6 software. On the basis of optimizing the experimental results, the predicted optimal conditions were verified through three parallel experiments, and the comprehensive Y score was calculated and compared with the predicted value by an independent t-test.

4.7. Acute Toxicity Test

4.7.1. Pre-Experiment

A total of 120 Kunming mice (18–22 g), half male and half female, were randomly divided into the vehicle control group (VC group), normal control group (NC group) and different dosages of YEEs groups (10 groups) with 10 mice in each group. All mice were fasted for 12 h but drank water freely before the experiment. The mice in the high-dose group were gavaged with YEEs with the maximum solubility in 0.5% carboxymethyl cellulose sodium (0.220 g/mL) and at the dose of 0.4 mL/10g body weight. The concentration of YEEs in the other 9 dosages groups were 0.176, 0.141, 0.113, 0.090, 0.072, 0.058, 0.047, 0.038 and 0.030 g/mL, respectively. All groups were gavaged 3 times every 6 h in one day. The mice in the NC and VC groups were gavaged with an equal volume of normal saline and 0.5% carboxymethyl cellulose sodium, respectively. The changes of the mental and active state, postures, hairs, stools, death, etc. of all mice were observed for 7 days, and the body weights were weighted every day during the experiment.

4.7.2. Maximum Administration Dosage Test

The Lethal Dose50 (LD50) of YEEs was not detected, and its concentration could not be further increased. And the gavage volume of the mice does not exceed 0.4 mL/10g with no more than 3 times of gavage. According to the Technical Requirements for Traditional Chinese medicine New drug Pharmaco-toxicological Research, we performed the maximum administration dosage test. After acclimatization for 7 days, 40 Kunming mice (18–22 g), half male and half female, were randomly divided into VC and YEEs groups with 20 mice in each group. The mice in VC and YEEs groups were treated the same as the VC and high-dose groups, respectively, in Section 4.7.1. The observing and detecting indices were also the same as those in Section 4.7.1.

4.8. Subchronic Toxicity Test

4.8.1. Animal Experiment

A total of 80 SD rats (160–180 g), half male and half female, were randomly divided into four groups with 20 rats in each group: the VC group, high-dose YEEs group (HD-YEEs group), middle-dose YEEs group (MD-YEEs group), and low-dose YEEs group (LD-YEEs group). After acclimatization for 7 days, the HD, MD, LD-YEEs groups were gavaged with YEEs (17.95, 7.82, 3.41 g/kg/day, respectively) once daily for 28 consecutive days, which was equal to 57.90 g/kg, 25.24 g/kg, and 11 g/kg of crude drug, respectively, and a corresponding volume of 0.5% carboxymethyl cellulose sodium in the VC group. The changes of the mental and active state, postures, hairs, appetites, stools, death, etc. of all rats were observed, and the mice were weighed every day during the experiment. After 28 days, all the rats were anesthetized intraperitoneally with 1% pentobarbital sodium. Blood samples were collected from abdominal aorta using EDTA-K2 and non-anticoagulant vacuum blood collection tubes. After that, the tissue samples of the heart, liver, spleen, lung, kidney, ovary and testicle were rapidly taken, weighed and then fixed in 10% neutral formalin. Finally, the organ indices were calculated (organ index = organ weight/body weight).

4.8.2. Blood Routine Detection

The EDTA-K2 anticoagulated whole blood samples were performed blood routine detection using a Helner Exigo H400 Vet Auto Hematology Analyzer (Helner Corporation, Dalian, China). The indices mainly contained the white blood cell count (WBC), lymphocyte count (LYM), red blood cell count (RBC), hemoglobin (HGB), platelet (PLT), etc.

4.8.3. Blood Biochemistry Detection

After 2–4 h standing at room temperature, the blood samples (from non-anticoagulant vacuum blood collection tubes) were centrifuged at 3000 rpm for 10 min. Serum samples were separated and stored at −80 °C for further use. The serum samples underwent performed biochemical detection using a Rayto Chemray 800 Auto Chemistry Analyzer (Rayto Corporation, Shenzhen, China). The indices mainly contained alanine transaminase (ALT), aspartate aminotransferase (AST), alkaline phosphatase (ALP), creatinine (Cr) and blood urea nitrogen (BUN).

4.8.4. Histopathological Observation

After being fixed in 10% neutral formalin for more than 10 days, the standard pieces of tissue samples were embedded in paraffin, sliced at 4 µm, stained with hematoxylin and eosin (H&E) by a routine method, and observed by the light microscope.

4.9. Statistical Analysis

All data were expressed as mean ± SD (n = 10), which were tested by one-way analysis of variance (ANOVA) followed by the Duncan’s multiple range test. These were performed on IBM SPSS V.26.0 (SPSS Inc., Chicago, IL, USA). Significant differences were considered at p < 0.05.

5. Conclusions

In the present study, RSM based on a single-factor test was used for optimizing ethanol extraction technology of YJP with the comprehensive scores Y calculated through the APH-CRITIC method as the evaluation index. The ethanol extraction technology of YJP was optimized under the following conditions: ultrasound of 40 °C, 30 min, 50 kHZ; liquid–material ratio of 24:1, reflux time of 53 min, reflux temperature of 60 °C, and ethanol concentration of 69%. Under the above conditions, YEEs were actually nontoxic and had higher safety. The present study is of great significance to improve the utilization rate of YJP, and it could provide a basis for the application of new dosage forms of YJP.

Supplementary Materials

The following supporting information can be downloaded at https://www.mdpi.com/article/10.3390/molecules28248124/s1, Table S1: Objective pairwise comparison judgment priority matrix; Table S2: Contents of 13 components (mg/g) and dry extract (%) in single-factor samples; Table S3: Correlation matrix; Table S4: Calculation results of CRITIC of each indicator.

Author Contributions

W.Y. designed the study. L.J. formulated the experimental scheme, interpreted the data, and wrote the manuscript. W.Z. (Wangdong Zhang) participated in the design of the study and the revision of the manuscript. L.J., W.Z. (Wenbo Zhao), Y.C., B.W. and X.Q. participated in the experimental operation. Y.W. (Yanming Wei), Y.H., J.X. and Y.W. (Yanqiao Wen) participated in the data processing. W.Y. contributed to the interpretation of data, the revision, and the approval of the final manuscript. All authors have read and agreed to the published version of the manuscript.

Funding

This research work was financially supported by the National Natural Science Foundation of China (No. 31802231), the Youth mentor support fund of Gansu Agricultural University (GAU-ODFC-2022-09), Scientific research start-up funds for openly recruited doctors (2017RCZX-14) and China Agriculture Research System-37 (CARS-37).

Institutional Review Board Statement

Not applicable.

Informed Consent Statement

Not applicable.

Data Availability Statement

All the data related to this work are included in the article or in the Supplementary Materials.

Acknowledgments

We are grateful to all other staff in the Institute of Traditional Chinese Veterinary Medicine of Gansu Agricultural University for their assistance in the experiments.

Conflicts of Interest

The authors declare no conflict of interest.

References

  1. Hu, Y.L. Traditional Chinese Veterinary Medicine; Science Press: Beijing, China, 2013. [Google Scholar]
  2. Zhang, Y.; Wen, W. Treatment of equine damp-heat diarrhea with modified YuJin powder and acupoint application of traditional Chinese medicine. Chin. J. Vet. Med. 2012, 48, 89. [Google Scholar]
  3. Ma, H.R. Modified Yujin Powder for Calf Diarrhea. J. Tradit. Chin. Vet. Med. 2007, 26, 1. [Google Scholar]
  4. Fu, N.X. Study on Jiawei Yujin Powder in the treatment of Bovine Acute Enteritis. Agric. Tech. Serv. 2015, 32, 1. [Google Scholar]
  5. Yao, W.L. Essence of Large Intestine Dampness-Heat Syndrome and Treatment Mechanisms of Yujin Powder on It. Ph.D. Thesis, Gansu Agricultural University, Lanzhou, China, 2017. [Google Scholar]
  6. Yao, W.L.; Yang, C.X.; Wen, Y.Q.; Zhang, W.D.; Zhang, X.S.; Ma, Q.; Ji, P.; Hua, Y.L.; Wei, Y.M. Treatment effects and mechanisms of Yujin Powder on rat model of large intestine dampness-heat syndrome. J. Ethnopharmacol. 2017, 202, 265–280. [Google Scholar] [CrossRef] [PubMed]
  7. Wen, Y.Q. Effects of Yujin Powder on Gastrointestinal Hormone and Hypothalamus-pituitary-adrenal Axis of Large Intestine Dampness-heat Syndrome Rat Model. Master’s Thesis, Gansu Agricultural University, Lanzhou, China, 2018. [Google Scholar]
  8. Yao, Y.; Luo, R.Y.; Shu, X.; Zhang, C.; Zhang, Y.K. Protective effects of curcumin against rat intestinal inflammation-related motility disorders. Mol. Med. Rep. 2021, 23, 319. [Google Scholar] [CrossRef] [PubMed]
  9. Cheng, P.; Ishfaq, M.; Yu, H.X.; Yang, Y.Q.; Li, S.H.; Li, X.T.; Fazlani, S.A.; Guo, W.X.; Zhang, X.Y. Curcumin ameliorates duodenal toxicity of AFB1 in chicken through inducing P-glycoprotein and downregulating cytochrome P450 enzymes. Poult. Sci. 2020, 99, 7035–7045. [Google Scholar] [CrossRef]
  10. Barzegar, A.; Moosavi-Movahedi, A.A. Intracellular ROS protection efficiency and free radical-scavenging activity of curcumin. PLoS ONE 2011, 6, e26012. [Google Scholar] [CrossRef]
  11. Lee, J.W.; Kang, Y.J.; Choi, H.K.; Yoon, Y.G. Fractionated Coptis chinensis Extract and Its Bioactive Component Suppress Propionibacterium acnes-Stimulated Inflammation in Human Keratinocytes. J. Microbiol. Biotechnol. 2018, 28, 839–848. [Google Scholar] [CrossRef] [PubMed]
  12. Fujii, A.; Okuyama, T.; Wakame, K.; Okumura, T.; Ikeya, Y.; Nishizawa, M. Identification of anti-inflammatory constituents in Phellodendri Cortex and Coptidis Rhizoma by monitoring the suppression of nitric oxide production. J. Nat. Med. 2017, 71, 745–756. [Google Scholar] [CrossRef]
  13. Georgieva, Y.; Katsarova, M.; Stoyanov, P.; Mladenov, R.; Dimitrova, S. Metabolite Profile and Antioxidant Activity of Some Species of Genus Scutellaria Growing in Bulgaria. Plants 2020, 10, 45. [Google Scholar] [CrossRef]
  14. Liao, H.F.; Ye, J.; Gao, L.L.; Liu, Y.L. The main bioactive compounds of Scutellaria baicalensis Georgi. for alleviation of inflammatory cytokines: A comprehensive review. Biomed. Pharmacother. 2021, 133, 110917. [Google Scholar] [CrossRef] [PubMed]
  15. Pu, Z.C.; Liu, Y.H.; Li, C.; Xu, M.; Xie, H.T.; Zhao, J. Using Network Pharmacology for Systematic Understanding of Geniposide in Ameliorating Inflammatory Responses in Colitis Through Suppression of NLRP3 Inflammasome in Macrophage by AMPK/Sirt1 Dependent Signaling. Am. J. Chin. Med. 2020, 48, 1693–1713. [Google Scholar] [CrossRef] [PubMed]
  16. Song, D.; Hao, J.; Fan, D. Biological properties and clinical applications of berberine. Front. Med. 2020, 14, 564–582. [Google Scholar] [CrossRef] [PubMed]
  17. Ji, W.; Liang, K.; An, R.; Wang, X. Baicalin protects against ethanol-induced chronic gastritis in rats by inhibiting Akt/NF-κB pathway. Life Sci. 2019, 239, 117064. [Google Scholar] [CrossRef] [PubMed]
  18. Fan, Q.; Guan, X.; Hou, Y.; Liu, Y.L.; Wei, W.; Cai, X.Y.; Zhang, Y.Y.; Wang, G.J.; Zheng, X.; Hao, H.P. Paeoniflorin modulates gut microbial production of indole-3-lactate and epithelial autophagy to alleviate colitis in mice. Phytomedicine Int. J. Phytother. Phytopharm. 2020, 79, 153345. [Google Scholar] [CrossRef]
  19. Bai, J.; Zhang, Y.; Tang, C.; Hou, Y.; Meng, X. Gallic acid: Pharmacological activities and molecular mechanisms involved in inflammation-related diseases. Biomed. Pharmacother. 2021, 133, 110985. [Google Scholar] [CrossRef]
  20. Liu, L.G.; Hu, J.Y.; Deng, X.T.; Tang, Y.H.; Chen, Y.T.; Bai, X.L. On the Antibacterial Effects of Anthraquinone Compounds in Rhubarb. J. Hangzhou Norm. Univ. 2021, 20, 54–58. [Google Scholar]
  21. Lee, H.S.; Jeong, G.S. Chrysophanol Attenuates Manifestations of Immune Bowel Diseases by Regulation of Colorectal Cells and T Cells Activation In Vivo. Molecules 2021, 26, 1682. [Google Scholar] [CrossRef]
  22. Wang, Y.; Yang, X.; Xia, P.F.; Ma, X.; Yang, R.J.; Hu, J.R.; Fan, Q.; Jin, X.J.; Wu, X.Y.; Peng, X.J.; et al. Research progress on chemical composition and pharmacological effects of Rhei Radix et Rhizoma and predictive analysis on quality markers. Chin. Tradit. Herb. Drugs 2019, 50, 4821–4837. [Google Scholar]
  23. Qiao, X.; Ye, M.; Xiang, C.; Wang, Q.; Liu, C.F.; Miao, W.J.; Guo, D.A. Analytical strategy to reveal the in vivo process of multicomponent herbal medicine: A pharmacokinetic study of licorice using liquid chromatography coupled with triple quadrupole mass spectrometry. J. Chromatogr. A 2012, 1258, 84–93. [Google Scholar] [CrossRef]
  24. Yang, Y.C.; Wei, M.C.; Huang, T.C.; Lee, S.Z.; Lin, S.S. Comparison of modified ultrasound-assisted and traditional extraction methods for the extraction of baicalin and baicalein from Radix Scutellariae. Ind. Crop. Prod. 2013, 45, 182–190. [Google Scholar] [CrossRef]
  25. Yang, B.Y.; Zhang, M.Y.; Weng, H.Y.; Xu, Y.; Zeng, L.H. Optimization of ultrasound assisted extraction (UAE) of kinsenoside compound from Anoectochilus roxburghii (Wall.) Lindl by response surface methodology (RSM). Molecules 2020, 25, 193. [Google Scholar] [CrossRef] [PubMed]
  26. Dong, J.; Liu, Y.B.; Liang, Z.S.; Wang, W.L. Investigation on ultrasound-assisted extraction of salvianolic acid B from Salvia miltiorrhiza root. Ultrason. Sonochem. 2010, 17, 61–65. [Google Scholar] [CrossRef] [PubMed]
  27. Elhag, H.E.E.A.; Naila, A.; Ajit, A.; Aziz, B.A.; Sulaiman, A.Z. Sequential extraction of saponins from Eurycoma longifolia roots by water extraction and ultrasound-assisted extraction. Mater. Today Proc. 2018, 5, 21672–21681. [Google Scholar] [CrossRef]
  28. Xue, J.; Wen, Y.Q.; Dong, J.Q.; Zhang, W.D.; Zhang, Y.H.; Xiao, T.; Cao, Y.X.; Yao, W.L.; Wei, Y.M. Extraction Efficiency Comparison of 3 Extraction Methods for Effective Components of Yujin Powder. Prog. Vet. Med. 2021, 42, 81–87. [Google Scholar]
  29. Shi, G.; Shen, J.; Wei, T.; Ren, F.; Guo, F.; Zhou, Y. UPLC-ESI-MS/MS Analysis and Evaluation of Antioxidant Activity of Total Flavonoid Extract from Paeonia lactiflora Seed Peel and Optimization by Response Surface Methodology (RSM). BioMed Res. Int. 2021, 2021, 7304107. [Google Scholar] [CrossRef] [PubMed]
  30. Teng, H.; Choi, Y.H. Optimization of ultrasonic-assisted extraction of bioactive alkaloid compounds from rhizoma coptidis (Coptis chinensis Franch.) using response surface methodology. Food Chem. 2014, 142, 299–305. [Google Scholar] [CrossRef]
  31. Zhao, Q.H.; Zhou, X.; Xie, F.R.; Li, Z.C. Comparison of three weighing methods for evaluation of the HPLC fingerprint of cortex fraxini. J. Liq. Chromatogr. Relat. Technol. 2011, 34, 2008–2019. [Google Scholar] [CrossRef]
  32. Xie, R.F.; Shi, Z.N.; Li, Z.C.; Chen, P.P.; Li, Y.M.; Zhou, X. Optimization of high pressure machine decocting process for Dachengqi Tang using HPLC fingerprints combined with the Box–Behnken experimental design. J. Pharm. Anal. 2015, 5, 110–119. [Google Scholar] [CrossRef]
  33. Ouyang, L.M.; Wang, X.H.; Zhu, S.M.; You, L.S.; An, R.; Cui, B. Based on the AHPCRITIC method to explore the optimal harvest period of Atractylodes sinensis. Chin. Pat. Med. 2020, 42, 708–713. [Google Scholar]
  34. Yang, Z.C.; Yang, Y.J.; He, Y.; Qi, J.; E, X.H. Application of multi-attribute decision making in the research and development and production of traditional Chinese medicine. Chin. Pat. Med. 2021, 43, 988–993. [Google Scholar]
  35. Liu, H.H.; Zhang, Q.; Xu, T.T.; Wang, Y.Z.; Wang, J.; Zhao, L.A.; Yao, Y.; Zhang, X.L.; Liu, S.J. Optimization of Water Extracting Procession of Qingwei San through Multi-Targets Integrated Weighted Method. J. Nanjing Univ. Tradit. Chin. Med. 2021, 37, 450–456. [Google Scholar]
  36. Ji, P.; Li, C.C.; Wei, Y.M.; Wu, F.L.; Liu, S.L.; Hua, Y.L.; Yao, W.L.; Zhang, X.S.; Yuan, Z.W.; Wen, Y.Q. Screening study of blood-supplementing active components in water decoction of angelica sinensis processed with yellow rice wine based on response surface methodology. Pharm. Biol. 2020, 58, 1167–1176. [Google Scholar] [CrossRef] [PubMed]
  37. Chen, J.; Yu, J.; Jiang, M.Y.; Yan, D.; Yang, R.P.; Zhang, C.N. Study on Extraction technology of Sanqi Traumatic Ointment based on Multi-index weight analysis and Orthogonal design method. J. Chin. Med. Mater. 2017, 40, 412–415. [Google Scholar]
  38. Liu, X.M.; Wang, S.S.; Shi, C.J.; Cheng, Z.Q.; Yuan, Q.H.; Song, Y. Optimization of Extraction Technique for Shenxi Oral Liquid by Box-Behnken Response Surface Methodology Based on AHP-CRITIC Weighted Analysis. J. Chin. Med. Mater. 2019, 42, 150–155. [Google Scholar]
  39. Shi, J.M.; Zhou, C.; Yu, X.M.; Wu, Z.Y.; Wang, J.; Lei, L.; Li, Z.Z. Optimization of the Decoction Process for Shengma Gegen Decoction with Boiling Machine by Orthogonal Design and AHP-CRITIC Weight Analysis. China Pharm. 2020, 23, 49–52. [Google Scholar]
  40. Wu, D.; Lei, C. Simultaneous Determination of Four Flavonoids in Huaihua Powder by HPLC. Chin. J. Inf. Tradit. Chin. Med. 2020, 27, 69–72. [Google Scholar]
  41. Xia, W.X.; Liu, Q.S.; Zhou, H.; Hua, S.Y.; Fu, X.y. Study on the Spectrum-Effect Relationship of the Traditional Effect of Saponins in Glycyrrhiza uralensis Fisch. Int. J. Anal. Chem. 2021, 2021, 6617033. [Google Scholar] [CrossRef]
  42. Qu, K.S.; Luo, Y.; Yan, X.N.; Kuai, L.; Ru, Y.; Luo, Y.; Song, J.K.; Ji, W.L.; Li, B.; Xing, M. Qinzhuliangxue mixture alleviates psoriasis-like skin lesions via inhibiting the IL6/STAT3 axis. J. Ethnopharmacol. 2021, 274, 114041. [Google Scholar] [CrossRef]
  43. Li, Y.N.; Li, J.N.; Qin, O.Y.; Zhou, Y.B.; Lei, C.; Cui, M.J.; Fu, K.C.; Li, J.; Huang, J.M.; Hou, A. Determination of maytansinoids in Trewia nudiflora using QuEChERS extraction combined with HPLC. J. Pharm. Biomed. Anal. 2021, 198, 113993. [Google Scholar] [CrossRef]
  44. Wu, Q.; Erbu, A.; Liang, X.X.; Luan, S.X.; He, C.L.; Yin, L.Z.; Yin, Z.Q.; Zou, Y.F.; Li, L.X.; Song, X. Determination of the main naphthoquinones in Onosma hookeri Clarke. var. longiforum Duthie and its optimization of the ultrasound-assisted extraction using response surface methodology. J. Food Sci. 2021, 86, 357–365. [Google Scholar] [CrossRef]
  45. Pan, P.C.; Chen, X.F.; Chen, W.; Guo, Z.Y.; Chai, Y.F. Optimization of the compound herba lysimachiae extraction prosess based on orthogonal experiment and response surface method. J. Pharm. Pract. 2020, 38, 27–34. [Google Scholar]
  46. Jiang, Y.M.; Wang, S.; Yu, M.; Wu, D.; Lei, J.; Li, W.W.; He, Y.Q.; Gang, W. Ultrasonic-Assisted Ionic Liquid Extraction of Two Biflavonoids from Selaginella tamariscina. ACS Omega 2020, 5, 33113–33124. [Google Scholar] [CrossRef]
  47. Li, C.Q.; Cui, Y.P.; Lu, J.; Liu, C.Y.; Chen, S.T.; Ma, C.Y.; Liu, Z.H.; Wang, J.M.; Kang, W.Y. Ionic Liquid-Based Ultrasonic-Assisted Extraction Coupled with HPLC and Artificial Neural Network Analysis for Ganoderma lucidum. Molecules 2020, 25, 1309. [Google Scholar] [CrossRef]
  48. Zhao, J. The Study on Quality Standards od Gastrodiae Rhizoma and Its Extracts. Master’s Thesis, Huazhong University of Science and Technology, Wuhan, China, 2019. [Google Scholar]
  49. Wang, Y.L.; Tao, R.; Xu, K.X.; Li, J.Y.; Wang, Y.; Song, X.S.; Wang, J.; Gao, S.J. Study on Determination of Flavonoids in Chinese Medicine Weight Loss and Lipid-lowering Compound. Contemp. Chem. Ind. 2020, 49, 1114–1117. [Google Scholar]
  50. Hu, Y.P.; Cui, X.M.; Zhang, Z.J.; Chen, L.J.; Zhang, Y.M.; Wang, C.X.; Yang, X.Y.; Qu, Y.; Xiong, Y. Optimisation of Ethanol-Reflux Extraction of Saponins from Steamed Panax notoginseng by Response Surface Methodology and Evaluation of Hematopoiesis Effect. Molecules 2018, 23, 1206. [Google Scholar] [CrossRef]
  51. Chen, Y.; Zhang, C.P.; Zhang, M.; Fu, X.B. Three statistical experimental designs for enhancing yield of active compounds from herbal medicines and anti-motion sickness bioactivity. Pharmacogn. Mag. 2015, 11, 435–443. [Google Scholar]
  52. Chen, G. Study of Extraction and Pirification of Schisandrin b in Schisandra Chinensis (Turcz.) Baill Leaves and Combined with Paclitaxel to Inhibit Cancerstudy and Compound Antioxidant with Total Flavonoids of Citrus Peel. Master’s Thesis, Jinzhou Medical University, Jinzhou, China, 2019. [Google Scholar]
  53. Wang, L.J.; Gao, X.; Liu, Q.C.; Yang, J.Z.; Sun, G.X.; Yu, J. Optimization of the Ultrasound Extraction Technology of Jinjuan Shengban Capsules by Response Surface Methodology Combined with Multi-index Comprehensive Scoring. China Pharm. 2019, 30, 1781–1785. [Google Scholar]
  54. Hou, T.H.; Yang, J.Y.; Yang, X.X.; Xu, X.S.; Su, Y.Y.; Qu, X.L. Optimization of polysaccharide extraction from ganoderma spore powder residue by response surface methodology. Lishizhen Med. Mater. Med. Res. 2020, 31, 199–202. [Google Scholar]
  55. Yi, C.Z.; Wu, Y.N.; Xiao, P.; Cui, L.W.; Zhou, Y.C.; Hu, Y.M. Study on sub-chronic toxicity of Curcuma aromatica Salisb extract. Cap. J. Public Health 2018, 12, 250–252. [Google Scholar]
  56. Deng, N. Study on Liver and Kidney Toxicity of Rhubarb and Its Total Anthraquinones. Master’s Thesis, China Academy of Chinese Medical Sciences, Beijing, China, 2018. [Google Scholar]
  57. Liu, F.; Li, L.L.; Liu, G.J.; Jiang, H.; Zhang, Q.Z. Study on the acute toxicity of water and alcohol extract of radix seutellariae. Hebei J. Tradit. Chin. Med. 2014, 36, 425–427. [Google Scholar]
  58. Li, H.F.; Zhang, H.H.; Xia, L. Study on chronic hepatic and renal toxicity of gardenia extract in normal and jaundice model rats. Clin. Basic Bridg. Res. 2020, 36, 3755–3759. [Google Scholar]
  59. Zhang, Z.Y.; Wu, R. Study on the sensitivity of six disinfectants such as Jiududi liquid and Strong antiseptic liquid and three Chinese herbs such as coptis chinensis, glycyrrhiza chinensis and Phellodendri chinensis to laboratory air bacteria. Chin. J. Tradit. Vet. Sci. 2017, 197, 10–12. [Google Scholar]
  60. Liu, Y.; Ran, C.; You, G.X.; He, J.Z.; Wu, W.; Hou, K. Determination of Berberine Hydrochloride in Crystal of Phellodendron chinensis by HPLC and Evaluation of Bacteriostatic Activity. J. Agric. Sci. Technol. 2020, 22, 179–186. [Google Scholar]
  61. Li, X.F.; Xiong, H.B.; Zhang, H.F.; Zi, Y.L.; Zhang, Y.; Gao, Y.T.; Zhang, Y.L. Spectrometric investigation of the antioxidant activities of Terminalia polyphenol against DPPH free radicals. Hubei Agric. Sci. 2019, 58, 121–125. [Google Scholar]
  62. Peng, Z.T.; Li, C.; Hu, S.Q. Effect of total glucosides of paeony plus glycyrrhizic acid on inflammatory response of brain-gut tissue in diarrheal irritable bowel sydrome. Chin. J. Hosp. Pharm. 2021, 41, 1536–1540. [Google Scholar]
  63. Zhu, Y.; Yu, S.R.; Zhang, X.Y.; Zhou, C.; Gui, L.L.; Yu, H.F.; Wei, J. Optimization of Extraction Process for Compound Roucongrong Mixture by Analytic Hierarchy Process Combined with Box-Behnken Response Surface Methodology. Chin. J. Mod. Appl. Pharm. 2020, 37, 2852–2858. [Google Scholar]
  64. Lan, T.J.; Chang, M.; Li, Q.F.; Liang, W.P.; Yun, C.X.; Guo, H.W. Optimization of Formation Process for Leigong Antihypertensive Granules by Central Composite Design-Respones Surface Methodology Based on CRITIC Weighted Evaluation. J. Chin. Med. Mater. 2019, 42, 1356–1359. [Google Scholar]
Figure 1. Three-dimensional depiction of 13 active components in Yujin powder. Red represents oxygen atoms, blue represents nitrogen atoms.
Molecules 28 08124 g001
Figure 2. Y value of comprehensive score of five factors and four levels in single-factor experiment.
Molecules 28 08124 g002
Figure 3. HPLC chromatograms of 13 components. (AC) are the chromatograms of the standards. (DF) are the chromatograms of the samples. 1—germacrone, 2—gallic acid, 3—geniposide, 4—paeoniflorin, 5—chebulinic acid, 6—coptisine hydrochloride, 7—baicalin, 8—berberine, 9—wogonoside, 10—baicalein, 11—wogonin, 12—emodin, 13—chrysophanol.
Molecules 28 08124 g003
Figure 4. Interaction among various factors. (A,C,E) a three-dimensional response surface map; (B,D,F) a contour map.
Molecules 28 08124 g004
Figure 5. The H&E staining of serial parts of lung tissues in VC group (A), LD-YEEs group (B), MD-YEEs group (C) and HD-YEEs group (D). Original magnification, ×40. The scale bar represents 100 µm.
Molecules 28 08124 g005
Figure 6. The H&E staining of serial parts of liver tissues in the VC group (A), LD-YEEs group (B), MD-YEEs group (C) and HD-YEEs group (D). Original magnification, ×40. The scale bar represents 100 µm.
Molecules 28 08124 g006
Figure 7. The H&E staining of serial parts of spleen tissues in the VC group (A), LD-YEEs group (B), MD-YEEs group (C) and HD-YEEs group (D). Original magnification, ×40. The scale bar represents 100 µm.
Molecules 28 08124 g007
Figure 8. The H&E staining of serial parts of kidney tissues in the VC group (A), LD-YEEs group (B), MD-YEEs group (C) and HD-YEEs group (D). Original magnification, ×40. The scale bar represents 100 µm.
Molecules 28 08124 g008
Figure 9. The H&E staining of serial parts of heart tissues in the VC group (A), LD-YEEs group (B), MD-YEEs group (C) and HD-YEEs group (D). Original magnification, ×40. The scale bar represents 100 µm.
Molecules 28 08124 g009
Figure 10. The H&E staining of serial parts of ovarian tissues in the VC group (A), LD-YEEs group (B), MD-YEEs group (C) and HD-YEEs group (D). Original magnification, ×40. The scale bar represents 100 µm.
Molecules 28 08124 g010
Figure 11. The H&E staining of serial parts of testes tissues in the VC group (A), LD-YEEs group (B), MD-YEEs group (C) and HD-YEEs group (D). Original magnification, ×40. The scale bar represents 100 µm.
Molecules 28 08124 g011
Table 1. Regression equation, linear range and correlation coefficient of 13 components in Yujin Powder.
NameRegression EquationLinear Range (μg/mL)Correlation Coefficient R2
GermacroneY = 57355X + 126.2927.80–222.250.9995
Gallic acidY = 16357X − 25.8346.30–24.320.9993
GeniposideY = 21963X − 4.988626.24–100.000.9995
PaeoniflorinY = 5646.1X − 9.989220.82–80.000.9996
Chebulinic acidY = 16412X − 213.114.87–57.120.9996
Coptisine hydrochlorideY = 59330X + 6.30533.12–12.000.9995
BaicalinY = 101568X − 202.9526.03–100.000.9991
BerberineY = 51677X + 10.0989.48–36.400.9990
WogonosideY = 28001X − 30.9714.17–16.000.9997
BaicaleinY = 23263X + 53.5412.60–100.000.9996
WogoninY = 18631X − 2.42124.16–15.960.9992
EmodinY = 7890.3X + 9.2587.50–28.800.9992
ChrysophanolY = 6005.5X − 23.3224.87–18.720.9993
Table 2. Results of precision peak area RSD.
NameAverageSDRSD (%)
Germacrone465.94.280.92
Gallic acid1106.126.670.60
Geniposide599938.860.65
Paeoniflorin396431.370.73
Chebulinic acid491412.80.36
Coptisine hydrochloride395133.10.83
Baicalin445925.50.57
Berberine15,46464.10.41
Wogonoside165414.530.87
Baicalein265419.10.72
Wogonin8485.360.63
Emodin10147.620.75
Chrysophanol1190.770.65
Table 3. Results of stability peak area RSD.
NameAverageSDRSD (%)
Germacrone388.464.761.23
Gallic acid568.25.40.95
Geniposide24068.40.35
Paeoniflorin6174.560.74
Chebulinic acid7113.230.45
Coptisine hydrochloride8463.650.55
Baicalin245421.140.86
Berberine264621.570.82
Wogonoside560.63.980.71
Baicalein524.54.870.93
Wogonin670.55.140.77
Emodin20087.850.39
Chrysophanol3433.160.92
Table 4. Results of repeatability peak area RSD.
NameAverageSDRSD (%)
Germacrone309.243.010.97
Gallic acid518.126.711.29
Geniposide224515.740.70
Paeoniflorin5943.670.62
Chebulinic acid6647.841.18
Coptisine hydrochloride7623.190.42
Baicalin237113.150.55
Berberine219624.301.11
Wogonoside524.54.630.88
Baicalein497.314.110.82
Wogonin641.34.290.67
Emodin1974.96.350.32
Chrysophanol290.11.470.51
Table 5. Determination results of sample recovery rate.
NameAverageSDRSD (%)Rate of Recovery (%)
Germacrone324.62.370.7395.63
Gallic acid901.068.470.9493.71
Geniposide1855.711.320.6192.60
Paeoniflorin1196.556.940.5897.65
Chebulinic acid2374.4711.160.4793.42
Coptisine hydrochloride19299.450.4994.28
Baicalin2385.16.440.2799.30
Berberine10,11215.450.1592.88
Wogonoside641.91.990.3196.85
Baicalein11098.980.8195.52
Wogonin8291.160.1496.44
Emodin9825.990.6193.79
Chrysophanol131.370.670.5195.77
Table 6. AHP weight coefficient.
NameWeight Coefficients
Germacrone0.1541
Gallic acid0.0467
Geniposide0.0897
Paeoniflorin0.0467
Chebulinic acid0.0467
Coptisine hydrochloride0.0467
Baicalin0.0897
Berberine0.0897
Wogonoside0.0897
Baicalein0.0897
Wogonin0.0897
Emodin0.0467
Chrysophanol0.0467
Yield of dry extract0.0272
Table 7. CRITIC weight coefficients.
NameWeight Coefficients
Germacrone0.0711
Gallic acid0.0776
Geniposide0.0916
Paeoniflorin0.0767
Chebulinic acid0.0524
Coptisine hydrochloride0.0607
Baicalin0.0584
Berberine0.0611
Wogonoside0.0654
Baicalein0.0697
Wogonin0.0653
Emodin0.0726
Chrysophanol0.0751
Yield of dry extract0.1024
Table 8. AHP-CRITIC comprehensive weight coefficients.
NameComprehensive Weight Coefficients
Germacrone0.1564
Gallic acid0.0518
Geniposide0.1173
Paeoniflorin0.0512
Chebulinic acid0.0350
Coptisine hydrochloride0.0405
Baicalin0.0748
Berberine0.0782
Wogonoside0.0837
Baicalein0.0893
Wogonin0.0836
Emodin0.0484
Chrysophanol0.0501
Yield of dry extract0.0398
Table 9. Box–Behnken response surface test factor level, experiment design and results.
No.(A) Ethanol Concentration%(B) Reflux Time min(C) Liquid–Material Ratio mL/gY Value%
180.0050.0030:162.4835
270.0050.0025:189.7089
370.0050.0025:188.5748
460.0050.0030:175.3015
570.0060.0020:183.8701
680.0060.0025:169.4049
770.0040.0020:181.6292
870.0050.0025:188.7082
970.0060.0030:176.5164
1060.0060.0025:178.0018
1180.0050.0020:171.4199
1260.0050.0020:179.4086
1370.0050.0025:189.6892
1460.0040.0025:176.9670
1580.0040.0025:168.9748
1670.0040.0030:174.4967
1770.0050.0025:189.7066
Table 10. Analysis of quadratic model variance table of response surface.
ProjectSum of SquaresDegree of FreedomMean SquareF Valuep ValueSignificance
Modal1123.359124.82181.33<0.0001 **Significant
A174.811174.81253.96<0.0001 **
B4.1014.105.950.0448 *
C94.74194.74137.63<0.0001 **
AB0.09110.0910.130.7263
AC5.8315.838.470.0226 *
BC0.01210.0120.0180.8977
A2552.741552.74803.02<0.0001 **
B284.61184.61122.93<0.0001 **
C2135.201135.20196.42<0.0001 **
Residual error4.8270.69
Misfit term3.4631.153.400.1340Not significant
Pure error1.3640.34
Total deviation1128.1716
* indicated significant difference (p < 0.05); ** indicated extremely significant difference (p < 0.01).
Table 11. Content of each chemical composition in YEEs in validation experiment (mg/g).
NameContent in YEEs
Germacrone1.3160 ± 0.0055
Gallic acid6.5340 ± 0.01078
Geniposide17.7005 ± 0.0070
Paeoniflorin89.6883 ± 0.0271
Chebulinic acid17.5867 ± 0.0093
Coptisine hydrochloride3.9456 ± 0.0023
Baicalin14.6616 ± 0.0047
Berberine98.2565 ± 0.0100
Wogonoside5.0976 ± 0.0066
Baicalein1.9298 ± 0.0020
Wogonin2.8679 ± 0.0020
Emodin1.0792 ± 0.0037
Chrysophanol17.2449 ± 0.0096
Table 12. Body weight changes of male rats (x ± s).
GroupInitial WeightFirst WeekSecond WeekThird WeekFourth Week
HD-YEEs group209.71 ± 4.60220.04 ± 3.86243.87 ± 4.49300.19 ± 10.42315.15 ± 6.90
MD-YEEs group205.69 ± 2.04227.17 ± 2.80258.02 ± 2.86291.75 ± 2.39320.42 ± 1.55
LD-YEEs group210.97 ± 3.93232.75 ± 4.83264.19 ± 3.86304.72 ± 4.54332.90 ± 4.42
VC group210.25 ± 4.15233.61 ± 2.25266.38 ± 2.87302.68 ± 5.82323.11 ± 8.64
Note, there was no significant difference among the four groups.
Table 13. Body weight changes of female rats (x ± s).
GroupInitial WeightFirst WeekSecond WeekThird WeekFourth Week
HD-YEEs group193.39 ± 5.23196.33 ± 4.14205.21 ± 3.28219.45 ± 1.81228.22 ± 2.68
MD-YEEs group189.05 ± 2.95206.18 ± 2.34220.99 ± 1.78229.96 ± 1.66235.44 ± 2.82
LD-YEEs group198.12 ± 1.77202.13 ± 3.02213.73 ± 7.42238.49 ± 7.47237.89 ± 11.26
VC group196.74 ± 3.13202.57 ± 3.29211.59 ± 3.52227.90 ± 9.04231.23 ± 8.03
Note, there was no significant difference among the four groups.
Table 14. Effect of YEEs on organ indices of male rats (%).
GroupHeartLiverSpleenLUNGKidneyTestis
HD-YEEs group0.30 ± 0.012.65 ± 0.030.21 ± 0.010.43 ± 0.020.69 ± 0.031.02 ± 0.16
MD-YEEs group0.30 ± 0.012.68 ± 0.160.21 ± 0.020.39 ± 0.010.66 ± 0.060.99 ± 0.10
LD-YEEs group0.31 ± 0.012.66 ± 0.060.21 ± 0.010.41 ± 0.020.69 ± 0.020.99 ± 0.08
VC group0.30 ± 0.012.56 ± 0.050.20 ± 0.010.42 ± 0.020.65 ± 0.020.91 ± 0.07
Note, there was no significant difference among the four groups.
Table 15. Effect of YEEs on organ indices of female rats (%).
GroupHeartLiverSpleenLungKidneyOvary
HD-YEEs group0.32 ± 0.022.45 ± 0.040.28 ± 0.020.57 ± 0.060.73 ± 0.020.32 ± 0.03
MD-YEEs group0.32 ± 0.012.52 ± 0.060.25 ± 0.020.59 ± 0.070.73 ± 0.020.37 ± 0.01
LD-YEEs group0.32 ± 0.022.79 ± 0.200.26 ± 0.010.50 ± 0.030.70 ± 0.100.33 ± 0.02
VC group0.33 ± 0.012.67 ± 0.110.26 ± 0.020.54 ± 0.020.67 ± 0.070.34 ± 0.01
Note, there was no significant difference among the four groups.
Table 16. Effect of YEEs on blood routine of male rats (x ± s).
GroupWBC (109/L)LYM (109/L)HGB (109/L)RBC (1012/L)PLT (109/L)
HD-YEEs group7.01 ± 0.115.41 ± 0.1215.57 ± 0.167.20 ± 0.151126.80 ± 7.95
MD-YEEs group7.44 ± 0.306.12 ± 0.2715.60 ± 0.137.30 ± 0.081144.55 ± 16.75
LD-YEEs group6.79 ± 0.356.24 ± 0.4615.90 ± 0.177.46 ± 0.141163.63 ± 12.97
VC group7.11 ± 0.595.21 ± 0.5515.54 ± 0.287.50 ± 0.221158.75 ± 24.17
Note, there was no significant difference among the four groups.
Table 17. Effect of YEEs on blood routine of female rats (x ± s).
GroupWBC (109/L)LYM (109/L)HGB (109/L)RBC (1012/L)PLT (109/L)
HD-YEEs group3.76 ± 0.273.48 ± 0.2915.41 ± 0.187.18 ± 0.11806.75 ± 29.72
MD-YEEs group4.00 ± 0.363.60 ± 0.3215.13 ± 0.157.43 ± 0.11842.14 ± 42.28
LD-YEEs group4.27 ± 0.083.53 ± 0.2915.37 ± 0.257.09 ± 0.25794.14 ± 18.29
VC group3.72 ± 0.253.00 ± 0.2115.33 ± 0.217.07 ± 0.12780.71 ± 80.67
Note, there was no significant difference among the four groups.
Table 18. Effect of YEEs on blood biochemistry of male rats (x ± s).
GroupALT (U/L)AST (U/L)ALP (g/L)Cr (umol/L)BUN (mg/dL)
HD-YEEs group120.84 ± 30.99119.73 ± 38.95161.86 ± 41.1253.94 ± 7.8921.09 ± 2.62
MD-YEEs group115.20 ± 27.58115.54 ± 35.91160.86 ± 38.7251.62 ± 7.9419.81 ± 2.72
LD-YEEs group116.09 ± 29.42120.73 ± 35.86162.29 ± 37.3750.04 ± 8.0822.40 ± 2.54
VC group114.96 ± 33.85119.49 ± 37.17156.75 ± 39.8050.89 ± 8.1720.44 ± 3.25
Note, there was no significant difference among the four groups.
Table 19. Effect of YEEs on blood biochemistry of female rats (x ± s).
GroupALT (U/L)AST (U/L)ALP (g/L)Cr (umol/L)BUN (mg/dL)
HD-YEEs group102.38 ± 19.11129.56 ± 23.8258.29 ± 13.5668.30 ± 17.9227.78 ± 3.43
MD-YEEs group97.50 ± 22.03126.12 ± 27.6351.27 ± 9.1266.69 ± 16.1025.35 ± 3.65
LD-YEEs group97.63 ± 27.86124.91 ± 27.0662.83 ± 14.5967.24 ± 12.0327.20 ± 3.30
VC group111.55 ± 19.95130.34 ± 38.4460.72 ± 11.4871.82 ± 11.9129.05 ± 3.72
Note, there was no significant difference among the four groups.
Table 20. Factors and levels for the Box–Behnken experimental design.
Level(A) Ethanol Concentration (%)(B) Reflux Time (min)(C) Liquid–Material Ratio (mL/g)
−1604020:1
0705025:1
1806030:1
Disclaimer/Publisher’s Note: The statements, opinions and data contained in all publications are solely those of the individual author(s) and contributor(s) and not of MDPI and/or the editor(s). MDPI and/or the editor(s) disclaim responsibility for any injury to people or property resulting from any ideas, methods, instructions or products referred to in the content.

