Article

Superior Valorisation of Juglans regia L. Leaves of Different Maturity through the Isolation of Bioactive Compounds

1
Department of Organic Chemistry “Costin Neniţescu”, Faculty of Chemical Engineering and Biotechnologies, National University of Science and Technology POLITEHNICA Bucharest, 1–7 Gh. Polizu Street, 011061 Bucharest, Romania
2
National Research and Development Institute for Food Bioresources—IBA Bucharest, 6 Dinu Vintilă Street, 021101 Bucharest, Romania
*
Author to whom correspondence should be addressed.
Molecules 2023, 28(21), 7328; https://doi.org/10.3390/molecules28217328
Submission received: 22 September 2023 / Revised: 16 October 2023 / Accepted: 27 October 2023 / Published: 29 October 2023

Abstract

:
Extracts rich in bioactive compounds from natural sources have received great interest due to their great impact on human health. The aim of this research is focused on the obtaining and characterization of several extracts from Juglans regia L. leaves in four different maturity phases: young green leaves (YGL), green leaves (GL), mature green leaves (MGL), and yellow leaves (YL), using different solvents: ethanol (e), water (w), or water:ethanol (1:1 (v/v)—m) by employing several methods: magnetic stirring (MS), ultrasound-assisted (UA), as well as maceration (M). The obtained extracts were quantitatively evaluated through spectrophotometric methods: Total Polyphenol Content (TPC-Folin–Ciocalteu assay) and Total Antioxidant Capacity (TEAC assay). Phytochemical screening by means of Fourier-Transform Ion–Cyclotron-Resonance High-Resolution Mass Spectrometry (FT-ICR-MS) indicated the presence of 40 compounds belonging to different phytochemical classes: phenolic acids, flavonoids, flavones, flavanones, flavonones, flavanols, vitamins, tereponoid, steroid, anthocyanidin, and other compounds. Based on TPC and TEAC assays, the water-ethanol mixture was found to be the proper extraction solvent, with the best results being obtained for YL plant material: 146.29 mg GAE/g DM (TPC) and 11.67 mM TE/g DM (TEAC). This type of extract may be used in various domains, such as the cosmetics industry, the biomedical field, and/or the design of functional foods, relying on their phytochemical composition.

1. Introduction

There is a general tendency among the population to improve or maintain their health by using foods and cosmetics containing bioactive compounds of natural origin [1]. Plants can be used in the food industry for their organoleptic and nutritional qualities, as sources of antioxidants to preserve food quality, and also for medicinal purposes, since medicinal herbs are still involved in human healthcare and disease prevention for an important part of the world’s population [2,3].
Juglans regia L. belongs to the family Juglandaceae, which includes a few species and is largely spread out around the world [4]. The walnut crops are predominant in moderate-climate regions, being abundant in the North-Western Himalayas of Kashmir, which produces most of the world’s walnuts (around 88% of total walnut production), while the United States, North Africa, western South America, southern Europe, and East Asia are the largest traders of nuts and nut derivatives [4,5].
The Juglans regia L. harvests generate agro-forest waste of great value as a source of natural compounds with medicinal properties [6], as the roots [7], bark [8], shoot, leaves, branch, male flowers [9,10], fruits (husk [11,12], septum [13], kernel [14], and kernel skin [15]). Among the identified medicinal properties, we can list antidiabetic, anticancer, antioxidant, antimicrobial, anti-hypersensitivity [16], and UV-protective, anti-inflammatory, and antiaging activities [1]. Each part of the plant leads to extracts with different properties based on their varieties, soil and geographic conditions, and extraction method [17].
Even if it is a by-product or agricultural waste, the walnut leaves contain considerable amounts of phenolic compounds remarkable for their excellent pharmacological and therapeutic properties [18]. They are easily available in large quantities, while the other parts of the tree, such as bark, are not abundant, and plant development depends on them. Walnut leaves serve as a source of phytocompounds and have been extensively used as remedies in folk medicine for the treatment of venous insufficiency, hemorrhoidal symptomatology, anthelmintics, antidiarrheal, depurative, and astringent properties, fungal or microbial infections, and hypoglycemia. Anti-scrofulous, hypotensive, antifungal, keratolytic, hypoglycemic, and sedative activities have also been reported for the extracts derived from walnut leaves [19,20,21,22,23]. In European countries, dried walnut leaves are often used as an infusion, particularly in rural areas. Juglone is the main natural phenolic compound identified in walnut [24,25], being found in fresh walnut leaves [26]. Moreover, the leaves of Juglans regia L. are considered a good source of flavonoids [27] and other important bioactive compounds [28,29]. Thus, several studies reported the presence of different valuable compounds in the walnut leaves, such as quercetin 3-o-glucoside and quercetin pentosides, gallic acid, 3-caffeoylquinic acid, 3-ρ-coumaroylquinic acid, protocatechuic acid, 4-caffeoylquinic acid, 4-ρ-coumaroylquinic acid, ρ-coumaric acid quercetin-3-o-deoxyhexoside, and other important phenolic derivatives [30,31,32].
Using secondary plant resources to isolate bioactive compounds represents an important way to reduce agricultural waste but also to isolate essential chemicals from biomass. In this regard, the aim of this work was to establish the biological activities of plant extracts obtained from non-conventional sources. Thus, we report a good correlation between the phytochemical compounds of extracts prepared from Juglans regia L. leaves in different maturity phases: young green leaves (YGL), green leaves (GL), mature green leaves (MGL), and yellow leaves (YL), identified by FT-ICR-MS and quantified by spectrophotometric methods. Firstly, the optimization of the extraction process was performed (extraction time and method). The optimum conditions were then used for the preparation of different extracts prepared from leaves with different degrees of maturity.

2. Results and Discussion

2.1. Obtaining and Characterization of Juglans regia L. Leaves Extracts

2.1.1. Processing of Plant Material

The plant material was harvested from the same source (Juglans regia L. from the Muntenia region, Romania) in different periods of the year. The walnut leaves were processed under the same conditions in order to obtain comparable results. The walnut leaves were dried to a constant mass, and the moisture amount (%wt.) was determined (Table 1). The dried leaves were crushed mechanically and passed through a sieve with a mesh diameter of 1 mm. The obtained products were stored in paper bags at room temperature.
According to the data in Table 1, the moisture content (%wt.) varied greatly (55.17–75.74%) depending on the harvest time, being directly influenced by the atmospheric conditions (temperature and relative humidity). Thus, %wt. decreased by up to 27.16% for MGL, by 14.66% for YL, and by 3.97% for GL compared to YGL. This aspect is very important to estimate the amount of plant material that can result annually, respectively, in raw material to obtain extracts on an industrial scale.

2.1.2. Establishing the Optimal Extraction Parameters

The performance of the extraction method is related to the content of isolated bioactive molecules from the YGL, GL, MGL, and YL (considered initial dry leaves, not. DM) was evaluated considering the total polyphenol content (TPC) using the Folin–Ciocalteu method and the Trolox equivalent antioxidant capacity (TEAC) using the TEAC assay. TPC has been expressed in mg gallic acid equivalents (GAE)/g dry matter (DM), and TEAC has been expressed in mM Trolox equivalents (TE)/g dry matter (DM).

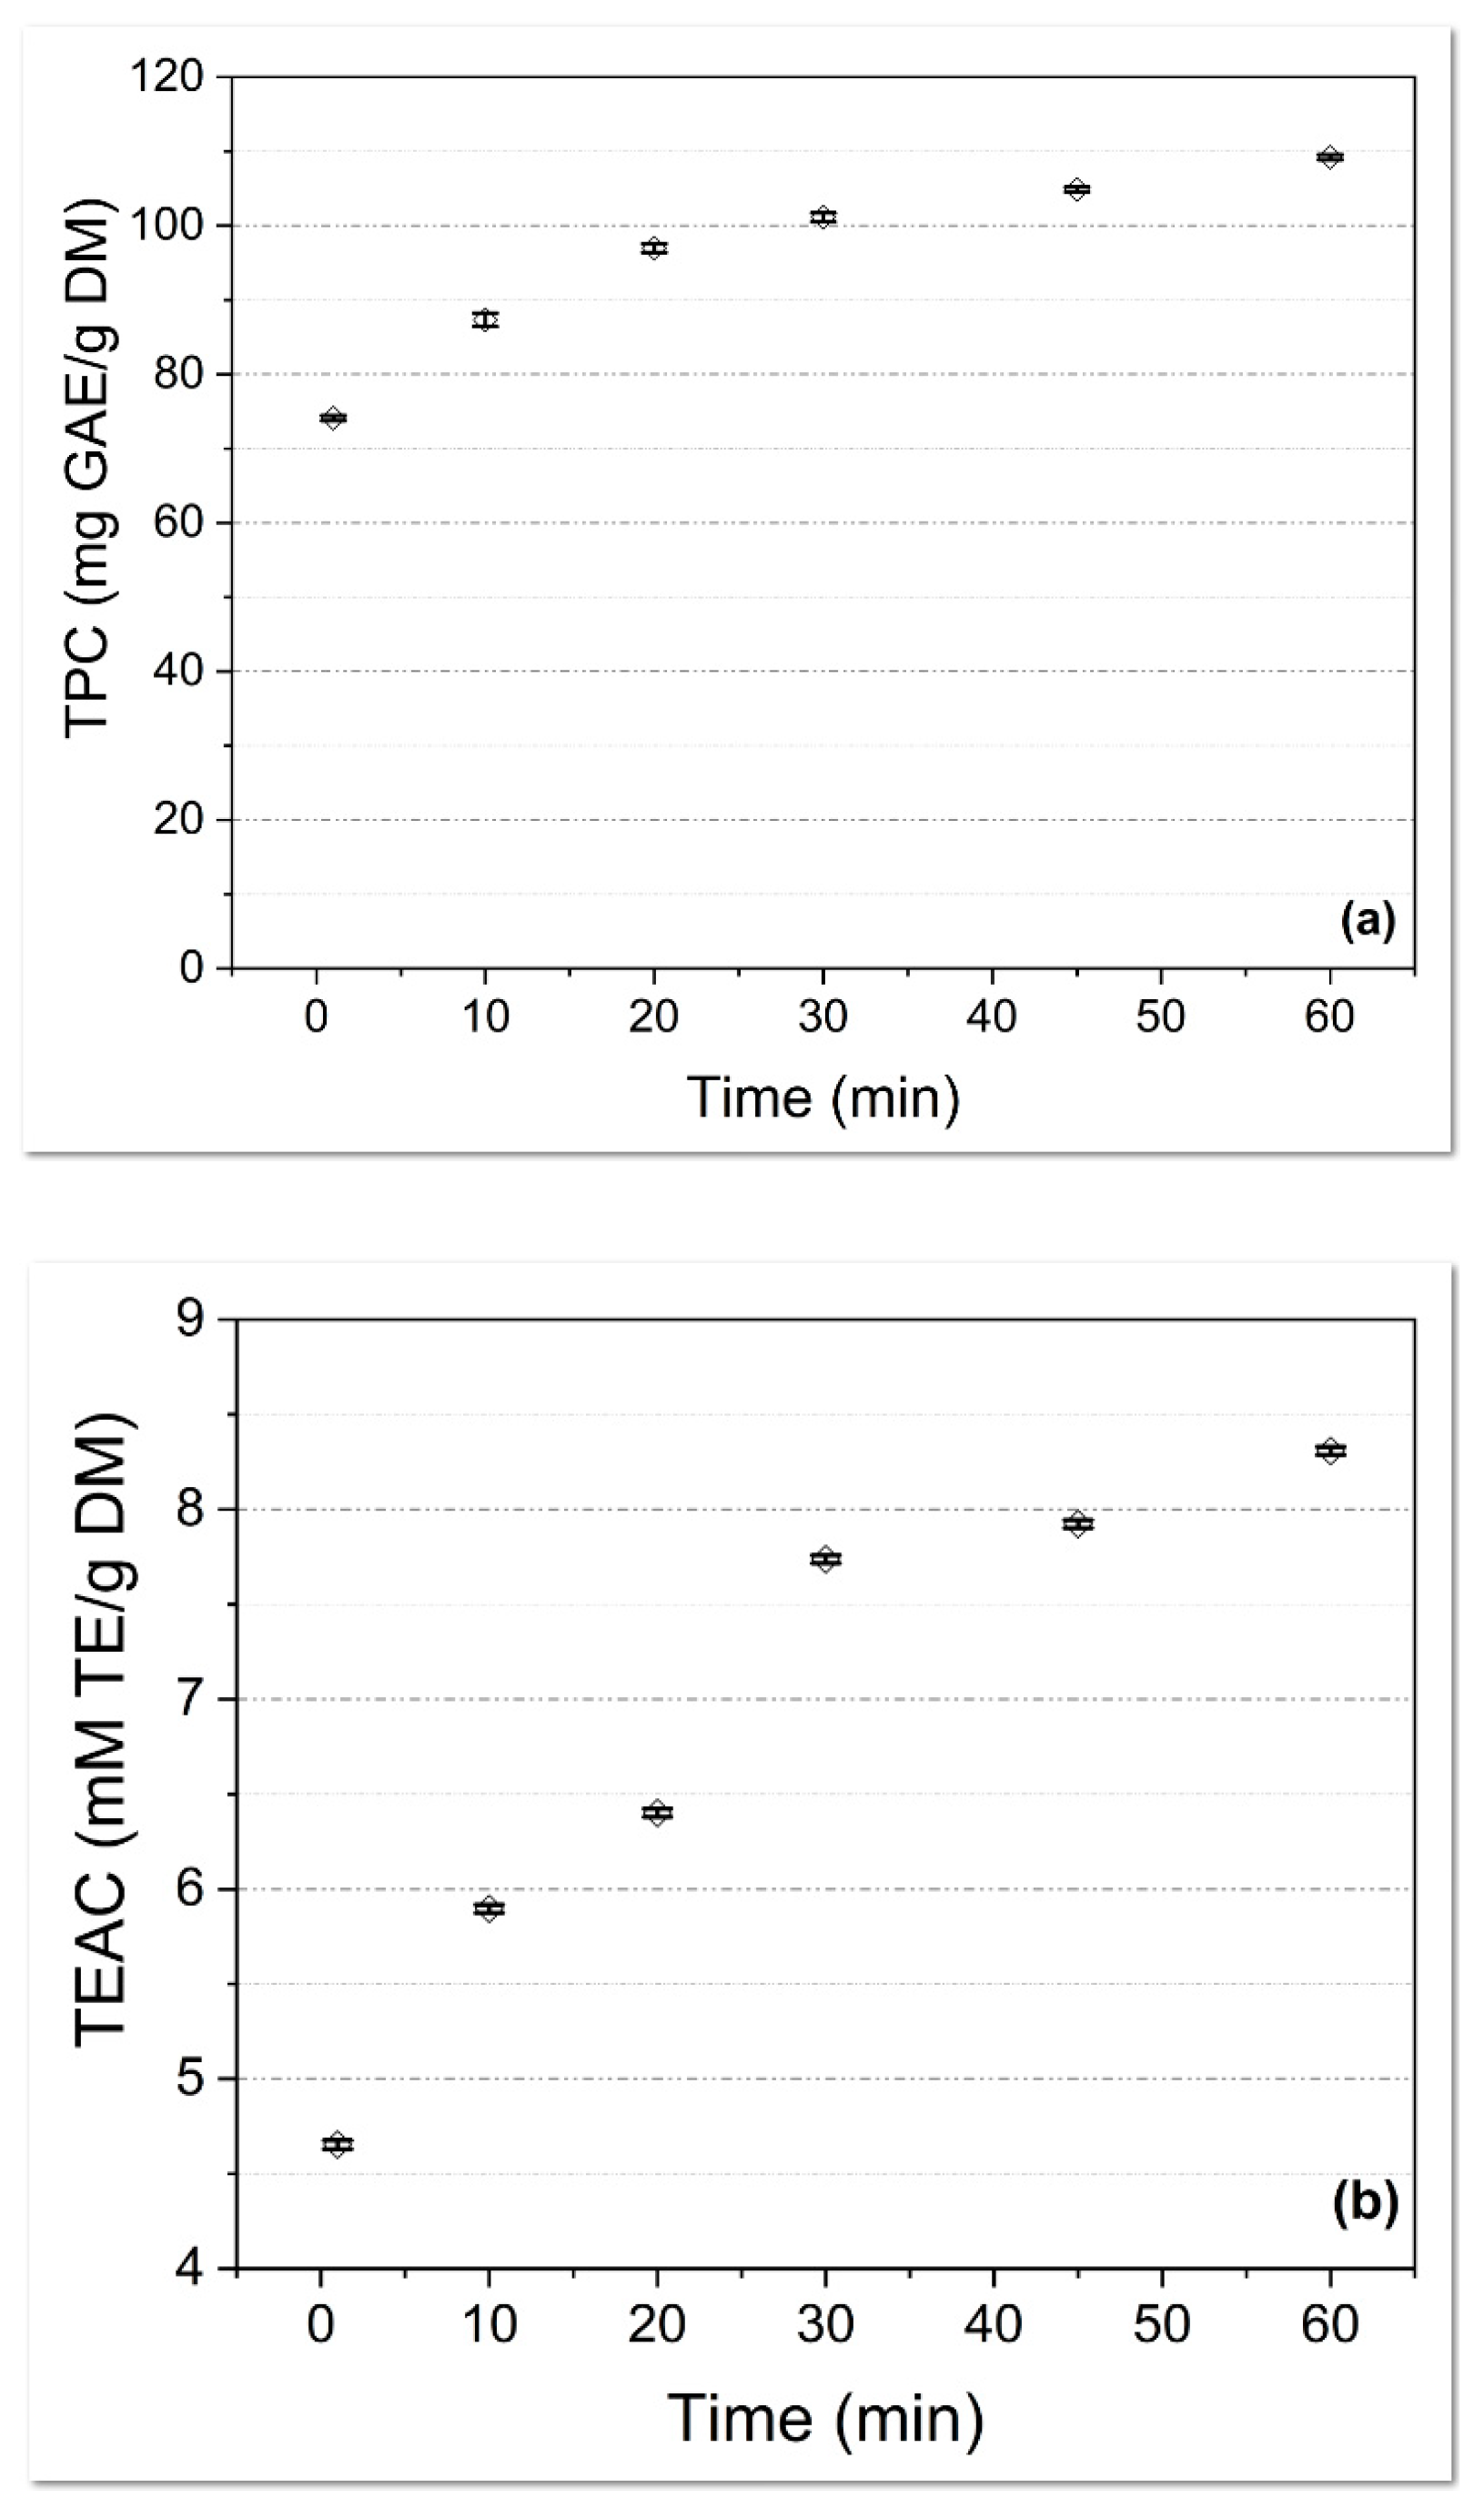
The Influence of the Extraction Time

To identify the optimal extraction time, MGL raw material was first used. This type of plant material was chosen in accordance with Salami et al. [33], who established that the green leaves contain a high amount of phenolic compounds. The plant product (MGL) was extracted with a hydroethanolic mixture by the MS method at different times: 1, 10, 20, 30, 45, and 60 min.
According to reported studies [34], a long extraction time is required to isolate higher amounts of polyphenols. As can be observed, the mean TPC values and TEAC values increased with the increase in extraction time. The TPC values (Figure 1a) ranged from 74.10 ± 0.34 mg GAE/g DM (1 min of extraction) to 109.21 ± 0.34 mg GAE/g DM (60 min of extraction), with a linear increase up to 20 min. The TEAC values (Figure 1b) range from 4.65 ± 0.02 mM TE/g DM (after 1 min) to 8.31 ± 0.02 mM TE/g DM (after 60 min), with an almost linear increase up to 30 min. These results indicate the possibility of using a shorter extraction time (less than 60 min) to obtain products with convenient bioactive compound content in the context of a cost-reduced process. This may be argued by the percentage differences between 20 min and, respectively, 60 min of extraction. The TPC values for the extract resulted in a 20 min increase of almost 131%, while the TPC value for the extract obtained after 60 min increased by almost 147%, with comparisons being made against the TPC values for the product obtained after 1 min of extraction. For the TEAC results, when the same comparison is made (against the extract resulted from 1 min), the results show an increase of almost 166% for the extract resulted after 30 min and almost 179% for that obtained after 60 min. This small difference of only 13% of TEAC values and 16% for TPC values suggests the possibility of using shorter extraction times with convenient results in the context of an industrial application.

The Influence of the Extraction Solvent and Processing Method

MGL has been subjected to extraction with different solvents: aqueous medium (ultrapure water), organic solvent (absolute ethyl alcohol), and a mixture of them in a ratio of 1:1 (v/v). The three solvents were used to obtain MGL extracts using all the selected extraction methods: MS (60 min), UA (60 min), and M (24 h).
The extraction solvent greatly influences the type and quantity of polyphenols, being higher in the case of the water-ethanol mixture than for ethanol or water. These results are related to the solubility of the extracted polyphenol species, most of which are probably water-soluble [35]. The TPC values (Table 2) range from 27.75 ± 0.59 mg GAE/g DM to 110.39 ± 0.90 mg GAE/g DM. The determined content of total polyphenols was higher compared to previously published reports on the analysis of Juglans regia leaves. In the work by Shah et al., the content of these compounds ranged from 37.61 to 46.47 mg GAE/g (TPC) [36], in the work of Untea et al., the TPC was 53.94 mg GAE/g [37], and in the work of Jabli et al., it was 103.33 mg GAE/g (TPC) [38].
When the experiments were compared regarding the method and solvent used, the highest quantity of polyphenols was obtained using magnetic stirring (60 min) and maceration extraction (24 h) in a water-ethanol solvent mixture. Thus, the influence of the extraction method may be noticed in the context of a more rapid process. The use of water or ethanol as an extraction solvent led to lower phenolic contents for all the extraction methods, contrary to other reported results [39].
Polyphenolic extracts obtained from the MGL raw material were also characterized concerning their ability to interact with free radicals using ABTS assays (Table 2). The radical scavenger activity expressed as Trolox equivalents (TE)/g dry matter (DM) varied between 2.79 ± 0.02 mM TE/g DM and 8.27 ± 0.02 mM TE/g DM. The antioxidant activity of the obtained extracts is similar to that reported by Zurek et al., respectively 9.09 mmol TE/g dry extract (ABTS) [30]. Ethanol and water used for the extractive procedure may promote the extraction of the cyanidins, which have strong antioxidant potential due to their -OH group position within the molecule [40].
Comparing the experimental methods, considering the solvent and time for the extraction of the polyphenolic compounds and antioxidants from the MGL extracts, the obtained results (Table 2) clearly indicate that ultrasound-assisted extraction is more efficient, obtaining the highest value for TEAC (8.27 ± 0.02 mM TE/g DM, water/ethanol mixture).
The statistical analysis performed according to a Two-Way ANOVA highlights the importance of the involved method for the polyphenolic content of the obtained extracts. As can be observed from Table 2, both the solvent and the extraction method influence the amount of phytocompounds. Most of the samples resulted from the UA and M methods being statistically different when compared to the reference method, MS. In this context, UA was selected as the extraction method for the extractive experiments, considering the advantages of unconventional processes (ultrasounds, microwaves, and so on), which do not affect the quality of the extracted bioactive compounds. Also, unconventional methods are considered sustainable processes (low energy consumption) [41,42,43].
The mean values of TPC for experiments 1–9 presented in Table 2 and corresponding levels of model factors are listed in Table 3. The effects of the considered categorical factors (extraction method and solvent) on total polyphenol content were quantified using a statistical model presented in Equation (1). Predicted values of total polyphenol content (TPCpred) and related residuals (ΔTPC) are also presented in Table 3. The values of the main model characteristic RMSE defined by Equation (2) (multiple R2, adjusted R2, predicted R2, adequate precision, F, and p), encompassed in Table 3, emphasize a good correlation between experimental and predicted TPC values. Similar statistics were applied to the antioxidant capacity, and the corresponding statistics are presented in Table 4 using Equations (3) and (4).
In the experiment’s design, categorical factors, extraction method, and solvent were associated with numerical values. To quantify the extraction method for magnetic stirring, A [1] = 1, A [2] = 0, ultrasound-assisted A [1] = 0, A [2] = 1, and maceration, A [1] = −1, A [2] = −1. To quantify the solvent, ethanol is denoted B [1] = 1, B [2] = 0; water is B [1] = 0, B [2] = 1; water-ethanol: B [1] = −1, B [2] = −1.
TPC pred = 76.27 5.26 A [ 1 ] 0.3945 A [ 2 ] 40.11 B [ 1 ] + 7.63 B [ 2 ]
R M S E = i = 1 N Δ T P C i 2 N = i = 1 9 ( T P C i TPC pred i ) 2 9
R M S E = i = 1 N Δ T E A C i 2 N = i = 1 9 ( T E A C i TEAC pred i ) 2 9
T E A C p r e d = 5.35 0.0126 A [ 1 ] + 0.4061 A [ 2 ] 2.29 B [ 1 ] + 0.11 B [ 2 ]
After performing a numerical optimization of the proposed model and imposing a maximized value of both TPC and TEAC, the best extraction process was considered ultrasound-assisted in hydroethanolic solvent with a good desirability value of 0.957.

The Obtaining of Walnut Leaf Extracts (YGL, GL, MGL, YL)—The Influence of the Extraction Solvent

For this experimental phase, the plant material is represented by walnut leaves in different stages of maturity, from young green leaves to yellow leaves, which are harvested at different times of the year (according to Table 1). The studied walnut leaves (YGL, GL, MGL, and YL) were subjected to extraction with the same three solvents: water, ethanol, and their mixture, respectively (1:1, v/v).
All 12 experiments were performed using ultrasound-assisted extraction (UA) for 60 min.
TPC values range from 0.73 ± 0.34 to 146.29 ± 0.90 mg GAE/g DM, depending on the studied extract. TEAC values range from 0.03 ± 0.00 to 11.67 ± 0.02 mM TE/g DM. The lowest values for TPC and TEAC were recorded for green leaf extract (GL) in ethanol, and the highest values were recorded for yellow leaf extract (YL) in water:ethanol. In an unexpected manner, these results indicate that YL-type plant material contains high amounts of biologic compounds (phenolic species) with great antioxidant activity.
Beside these maxim values registered for the YL type material, MGL also indicated a great content of polyphenol species and great antioxidant capacity, irrespective of the used extraction solvent. Moreover, in a sustainable and economical context related to industrial applications, water demonstrates to be a good choice to isolate polyphenols from MGL and YL as well. However, reported performant polyphenol water extractions of different algae required more complex extraction procedures, such as pressurized liquid extraction assisted by pulsed electric fields [44,45].
Statistical analysis (Two-Way ANOVA) on TPC values considering both leaves maturity and the solvent used shows that both factors influenced the total polyphenol amount, with similarities being observed for extract prepared in ethanol and water or water and hydroethanolic mixture, or from MGL and YL or YGL and GL raw material. In the case of TEAC values, statistical analysis showed that the maturity of the leaves influences the antioxidant activity, with similarities in the cases of MGL and YL or YGL and GL, while the solvent does not significantly influence TEAC values.
The mean values of TPC for experiments 1–12 are presented in Table 5, and the corresponding levels of model factors are listed in Table 6. The effects of considered categorical factors (leaves maturity and solvent) on total polyphenol content were quantified using a statistical model presented in Equation (5). Predicted values of total polyphenol content (TPCpred) and related residuals (ΔTPC) are also presented in Table 6. The values of the main model characteristic RMSE defined by Equation (6), multiple R2, adjusted R2, predicted R2, adequate precision, F, and p), encompassed in Table 6, emphasize a good correlation of experimental and predicted TPC values. Similar statistics were applied to the antioxidant capacity, and the corresponding statistics are presented in Table 7 using Equations (7) and (8).
In the experiment’s design, categorical factors such as leaf maturity and solvent were associated with numerical values. To quantify leaf maturity: YGL (A [1] = 1, A [2] = 0; A [3] = 0), GL (A [1] = 0, A [2] = 1; A [3] = 0), MGL (A [1] = 0, A [2] = 0; A [3] = 1), and YL (−1, −1, −1). To quantify the solvent, ethanol is denoted B [1] = 1, B [2] = 0; water is B [1] = 0, B [2] = 1; water−ethanol: B [1] = −1, B [2] = −1.
TPC pred = 5.83 3.45 A [ 1 ] 3.59 A [ 2 ] + 2.71 A [ 3 ] 1.83 B [ 1 ] 0.0408 B [ 2 ]
R M S E = i = 1 N Δ T P C i 2 N = i = 1 12 ( T P C i TPC pred i ) 2 12
R M S E = i = 1 N Δ T E A C i 2 N = i = 1 12 ( T E A C i TEAC pred i ) 2 12
log ( TEAC pred ) = 0.2793 1.05 A [ 1 ] 1.12 A [ 2 ] + 1.01 A [ 3 ] 0.2025 B [ 1 ] 0.0426 B [ 2 ]
A numerical optimization of the proposed model was performed, imposing a maximized value of both TPC and TEAC. The best extraction factors were yellow leaves (YL) and hydroethanolic solvent, with an excellent desirability value of 0.998.

2.2. Phytochemical Characteristics of Walnut Leaves Extracts

Identification of Phytochemical Compounds from Walnut Leaf Extracts

Following FT-ICR-MS analysis (ESI+, according to Figures S4_1–S4_23 in Supplementary Materials), we have identified for the studied YGL, GL, MGL, and YL extracts a total number of 40 different compounds based on their molecular formulas, the identification being made based on their specific molecular weight (Table 8). These results were obtained in a relatively short time by direct analysis of the sample without prior processing.
All the obtained and earlier discussed MGL extracts were subjected to the FT-ICR-MS analysis, both those obtained by magnetic stirring (MS, 1–60 min of extraction, water:ethanol mixture as extraction solvent, or MS, 60 min of extraction in water or ethanol) or by using ultrasound treatment (UA, 60 min) or maceration (M, 24 h).
Also, YGL, GL, and YL extracts obtained through UA treatment (60 min) using the three extraction solvents (water, ethanol, or their mixture) were evaluated through the FT-ICR-MS analysis. The obtained results are summarized in Table 8, where the present compounds are marked with the “+” sign, while the compounds that were not identified in the studied extracts are marked with the “−” sign. In Table 8, the analyzed samples were numbered from 1 to 23.
As can be observed from the experimental results from Table 8, there are no major compositional differences for 1–6 extract samples, representing the different MGL products obtained through the MS method in hydroalcoholic solvent by varying the extraction time (1–60 min). Also, by comparing the compositions of the hydroalcoholic MGL extracts (MGL, m) obtained by different extraction methods (MS, samples 7, 9, 12; UA, samples 8, 10, 13; M, samples 6, 11, 14), there were no notable differences. Thus, assume that both the extraction time and the extraction method do not influence the composition of the resulting extracts. However, the same similarity is no longer preserved for aqueous and ethanolic extracts; these results are explained by the different solubility of the phytochemical compounds.
FT-ICR-MS results indicate the presence of common compounds in all extracts (samples 1–23, according to Table 8): chlorogenic acid, 3-p-coumaroylquinic acid, quercetin 3-o-arabinoside, quercetin 3-rhamnoside, quercetin, epigallocatechin gallate kaempferol, kaempferol 3-o-arabinoside, kaempferol-3-o-rhamnoside, catechin hydrate, luteolin, catechin, taxifolin, and specific compounds also for some extract samples: ellaigic acid, cyanidin-3-glucoside chloride, resveratrol, azelaic acid. Related to the solvent used for the extraction, most phytochemicals were identified in both ethanolic and aqueous samples. However, some compounds were not identified for the ethanolic ones: caffeic acid, ferulic acid, juglone, myricetin, isokaempferide, hyperoside, fisetinidol, guibourtinidol, pelargonidin, and quinic acid, the explanation being their insolubility in this organic solvent [46].
When comparing the composition of the extracts obtained starting from walnut leaves with different degrees of maturity (UA extraction, 60 min), FT-ICR-MS analysis reveals the lack of certain phytochemical compounds for the YGL samples (irrespective of the used extraction solvent), such as pelargodin, p-coumaric acid, sinapate, hesperetin, ferulic acid, fisetinidol, and guibourtinidol. But it is important to mention the presence of azelaic acid in the ethanolic YGL extract. Also, another important feature of some walnut leaf extracts is the presence of sinapate, p-coumaric acid, epigallocatechin, ferulic acid, and fisetinidol, which were identified exclusively in mature leaves, MGL and YL, respectively. This behavior suggests that the appearance of these bioactive compounds in leaves is associated with the processes of maturation and aging.
Following FT-ICR-MS analysis (ESI+), the results show a greater diversity in the phytochemical profile of the MGL samples; the color changes from green to yellow (due to the aging process of the leaves), leading to changes in composition and the appearance of new compounds with biologically active value. However, by correlating all the experimental information, YL extracts indicate high antioxidant capacity, which denotes the presence of large or important quantities of phenolic species of great interest and antioxidant activity. The composition of the phytochemical compounds in the natural extracts is very important for the selection of further applications. Related to the studied walnut leaf extracts, due to their compositional diversity, they are recommended to be used in food and non-food products. The so varied composition of phytochemicals belonging to different classes of compounds was clearly suggested from the first experimental phase by the different colors of the various obtained extracts, as can be seen from the Supplementary Material—Figure S1.
The phytochemical compounds identified in the studied walnut leaf extracts have a series of biological activities. These were established and published in several studies, listed in the Supplementary Material (Table S1) [6,34,39,47,48,49,50,51,52,53,54,55,56,57,58,59,60]. The main compounds identified within this study belong to the following phytochemical classes: phenolic acids, flavonoids, flavones, flavanones, flavonones, flavanols, vitamins, tereponoids, steroids, anthocyanidins, and other compounds.
By corroborating the experimental data obtained within this study with other literature reports, we can state that walnut leaves contain a series of compounds with important biological activity, irrespective of the degree of the leaf’s maturity.
In this regard, these plant materials, considered to be residue/byproduct are strongly recommended to be more investigated and directed to different applications in the food or non-food industries as sources of polyphenolic and antioxidant species.

3. Materials and Methods

3.1. Plant Material

Walnut leaves (Juglans regia L.) were harvested between October 2022 and June 2023 from the Muntenia region (Romania—latitude: 44,44869 N 44°26′55″; longitude: 26,0791 E 26°4′44″), an area with a moderate-continental climate with an average annual temperature of 10–11 °C. So that there are no changes due to the source and the soil, the leaves were harvested from the same tree, a 7-year-old walnut, located in a place protected from direct sunlight, with harvesting being carried out at different times of leaf maturity. The fresh leaves were cleaned to remove dust and impurities, then they were dried at room temperature (T = 25 °C) in a place protected from direct sunlight until they reached a constant mass for 7–10 days. Size reduction was achieved using a mechanical grinder. Then, the dried plant material was sieved through a 1 mm mesh sieve. The dried and ground leaves were stored in paper bags in a dry place until use.

3.2. Chemicals

Ethanol (96% purity, Sigma Aldrich, St. Louis, MO, USA) was used as received; ultrapure water was also used for the extraction experiments. Approximately 2,2′-Azino-bis (3-ethylbenzo-thiazoline-6-sulphonic acid) (ABTS), 6-hydroxy-2,5,7,8-tetramethylchroman-2-carboxylic acid (Trolox), gallic acid (GA), sodium carbonate, and potassium persulfate were purchased from Sigma-Aldrich. Folin–Ciocalteu reagent was purchased from Merck. These chemicals were analytical grade, and the water was Milli-Q, with a resistivity of 18.2 MΩ·cm at 25 °C.

3.3. Preparation of Plant Extracts

Plant extracts were obtained starting from walnut leaves in four different phases of maturity: young green leaves (YGL), green leaves (GL), mature green leaves (MGL), and yellow leaves (YL). The extraction of biological compounds from the four plant materials was performed by varying the extraction method: magnetic stirring (MS), ultrasound-assisted extraction (UA), as well as maceration (M). Different extraction parameters were tested. Thus, as extraction media, ultrapure water (w), ethanol (e), or a water-ethanol mixture (1:1, v/v, m) were employed. Several extraction times were also tested: 1, 10, 20, 30, 45, 60 min when MS or UA have been involved (1000 rpm, MSH 300, BIOSAN for MS; Elmasonic S10 Elma ultrasound bath, power level of 30 W for UA) and 24 h for maceration (in the dark, room temperature). The ratio of walnut leaves (YGL, GL, MGL, and YL) to solvent was 1:200 (g/mL). After leaf processing, the obtained mixtures were filtered using medium-porosity filter paper and then centrifuged at 4000 rpm (Nahita centrifuge model 2640/12) for 10 min. The supernatant was collected and stored at 4 °C until the analysis.

3.4. Determination of Total Polyphenol Content (TPC) Using Spectrophotometric Method

The determination of total polyphenol content (TPC) was performed based on the Folin–Ciocalteu (FC) reaction, according to ISO 14502-1:2005(E) [61]. The studied extracts (0.01 mL, obtained from YGL, GL, MGL, and YL) were diluted with ultrapure water (0.99 mL), then 5 mL of Folin–Ciocalteu reagent (10%) was added, and after 4 min, 4 mL of Na2CO3 solution (7.5%) was added. The mixtures were incubated for 1 h at room temperature in a dark place.
The absorbance of each sample was recorded at λ = 765 nm using a Helios Beta UV–Vis spectrophotometer (Thermo Electron Corporation, Waltham, MA, United States) with Thermo Scientific™ VISION pro™ software. The analysis of each extract was performed in triplicate.
The results were expressed as mg of gallic acid equivalents (GAE) per g of dry matter (mg GAE/g DM) using a standard curve corresponding to a gallic acid solution of 0.5–50 mg/mL, with R2 = 0.9986 (y = 0.0168x + 0.0141) (the standard curve is presented as Supplementary Material—Figure S2).

3.5. Evaluation of Trolox Equivalent Antioxidant Capacity (TEAC) Using the Spectrophotometric Method

The turquoise-colored ABTS radical (ABTS•+) results from the reaction of a strong oxidizing agent (potassium persulfate) with the ammonium salt of 2,2′-azino-bis(3-ethylbenzothiazoline 6-sulfonic acid). Under the reaction of the antioxidant, the color intensity is reduced to colorless [62]. The concentration of the reagents in aqueous solutions was 7 mM for ABTS and 2.45 mM for potassium persulfate. After 16 h (kept in the dark at room temperature), the reaction mixture was normalized by adjusting the absorbance value to 0.68 (± 0.02) at 734 nm with ethanol. In a 1 cm cuvette, 990 µL ABTS•+ solution and 10 µL standard/extract were homogenized, and the absorbance was read after 1 min. For the calibration curve, solutions of Trolox in ethanol at concentrations between 0.25 and 1.25 mM were prepared. The equation of the linear domain of the curve for inhibition percentage vs. Trolox concentration was: y = 63.614x + 1.7268 (where y = percentage of inhibition and x = concentration of standard) and R2 = 0.9992 (the calibration curve is presented as Supplementary Material—Figure S3). For the spectral measurements, a UV–Vis Spectrophotometer UVmini-1240 instrument from SHIMADZU (Kyoto, Japan) was used. The inhibition of the ABTS•+ radical was calculated as follows:
%I ABTS•+ = [(ODi − ODf)/ODi] × 100
where ODi represents the absorbance of the reference solution (990 μL ABTS•+ normalized solution) and ODf is the absorbance of the tested samples (990 μL ABTS•+ normalized solution, 10 μL standard/extract). All measurements were performed in triplicate, and the antioxidant activity was expressed as mmoli/g DM Trolox equivalents.

3.6. Fourier-Transform Ion-Cyclotron-Resonance High-Resolution Mass Spectrometry (FT-ICR-MS Method)

Analysis was performed with the Fourier-Transform Ion-Cyclotron-Resonance High-Resolution Mass Spectrometer (FT-ICR-MS) system type SolariX-XR QqqFT-ICR HR (Bruker Daltronics, Bremen, Germany) with a 15T superconducting magnet for both negative and positive ionization [63]. Each sample was introduced by direct infusion and positive ESI ionization, with a sample flow rate of 120 µL/h, a nebulization gas pressure (N2) of 2.2 bar at 180 °C, and a flow rate of 4 L/min. The spectra were recorded over a mass range between 46 and 1200 amu at a source voltage of 5700 V.
The samples were prepared by dissolving the extracts in solvents: ultrapure water or methanol or ultrapure water:methanol 1:1 (v/v) (Sigma-Aldrich, Taufkirchen, Germany), depending on the solvent used for extraction. A 100 µL sample was taken, adding 10 µL of formic acid and diluting to 10 mL. The sample thus obtained was injected into the system. Based on the molecular formula, ESI+ (1M + nH) ionization templates were generated (Bruker Compass Data Analysis) and identified in the obtained spectrograms.

3.7. Statistical Analysis

Statistical analysis was performed using a Two-Way ANOVA followed by a post-hoc Tukey Test from Origin Lab 2021 software (Origin Lab Corporation, Northampton, MA, USA), and differences were considered significant at p < 0.05.
Statistical models employed to determine effect factors on TPC and TEAC were determined using Design Expert 13 software (StatEase, Minneapolis, MN, USA).

4. Conclusions

The experimental results obtained in the current study showed that the investigated walnut leaves, with different degrees of maturity (young green leaves—YGL; green leaves—GL; mature green leaves—MGL; yellow leaves—YL), contain significant amounts of polyphenolic compounds, especially YL and MGL, irrespective of the extraction solvent used.
The best results were obtained for the hydroethanolic YL extract obtained by ultrasound-assisted extraction for 60 min. The YL extraction product registered a TPC of 146.29 ± 0.90 mg GAE/g DM and a TEAC of 11.67 ± 0.02 mM TE/g DM. Thus, the starting material, yellow leaves, considered a real waste from walnut crops, proves to be a valuable material for the isolation of bioactive compounds.
All the studied extracts were characterized by means of FT-ICR-MS, establishing their phytochemical profiles and identifying a total of 40 different compounds. It was found that their composition is considerably influenced by the solvent used, and the different plant materials involved in the extractive processes contain different biological molecules. Also, it was noticed that the number and diversity of the phytochemicals increased over time. YL extracts (from the more mature leaf type) indicated a varied profile of phenolic compounds and contained the highest total flavonoid content, which explains the greater antioxidant activity registered for these samples.
Statistical analysis (Two-Way ANOVA) indicates that the extraction solvent and the leaf’s maturity degree influence the total polyphenol content and the antioxidant capacity of each extract.
The current research provides a background for further studies and, respectively, the utilization of the different walnut leaf extracts based on their phytochemical profiles, being adaptable for the food industry (e.g., treatment and improvement of various aliments) or non-food applications (as nutraceuticals).
This research study dealt with notable aspects regarding the obtaining of the walnut leaves’ extracts and their general composition through qualitative determinations. Perspective works on more detailed analysis related to the antioxidant capacity, quantitative evaluation of the isolated phytochemical compounds, and their possible applications are envisaged.

Supplementary Materials

The following supporting information can be downloaded at: https://www.mdpi.com/article/10.3390/molecules28217328/s1, Figure S1: Different extracts of Juglans regia L (color variation); Figure S2: Standard curve of gallic acid for total polyphenol content assay (TPC); Figure S3: Standard curve of Trolox for Trolox equivalent antioxidant capacity assay (TEAC). Figures S4_1–S4_23 show the FT-ICR-MS spectra of all samples. Table S1. Biological activities of the main compounds identified by the FT-ICR-MS method.

Author Contributions

Conceptualization, M.T., and R.S.; methodology, M.T., and A.M.; software, M.T.; validation, M.T., and A.M.; formal analysis, F.M., and A.M.; investigation, M.T., F.M., and B.B.; resources, M.T.; data curation, M.T., and F.M.; writing—original draft preparation, M.T.; writing—review and editing, B.B., and R.S.; visualization, M.T.; supervision, R.S. All authors have read and agreed to the published version of the manuscript.

Funding

This research received no external funding.

Institutional Review Board Statement

Not applicable.

Informed Consent Statement

Not applicable.

Data Availability Statement

Not applicable.

Acknowledgments

This work has been funded by the European Social Fund from the Sectoral Operational Programme Human Capital 2014–2020 through the Financial Agreement with the title “Training of PhD students and postdoctoral researchers in order to acquire applied research skills-SMART”; contract no. 13530/16.06.2022-SMIS code: 153734. The FT-ICR-MS analyses were possible due to the European Regional Development Fund through Competitiveness Operational Program 2014–2020, Priority Axis 1, Project No. P_36_611, MySMIS code 107066, Innovative Technologies for Materials Quality Assurance in Health, Energy, and Environmental—Center for Innovative Manufacturing Solutions of Smart Biomaterials and Biomedical Surfaces—INOVABIOMED.

Conflicts of Interest

The authors declare no conflict of interest.

Sample Availability

Not applicable.

References

  1. Besrour, N.; Oludemi, T.; Mandim, F.; Pereira, C.; Dias, M.I.; Sokovic, M.; Stojkovic, D.; Ferreira, O.; Ferreira, I.C.F.R.; Barros, L. Valorization of Juglans regia Leaves as Cosmeceutical Ingredients: Bioactivity Evaluation and Final Formulation Development. Antioxidants 2022, 11, 677. [Google Scholar] [CrossRef] [PubMed]
  2. Medic, A.; Zamljen, T.; Slatnar, A.; Hudina, M.; Grohar, M.C.; Veberic, R. Effect of Juglone and Other Allelochemicals in Walnut Leaves on Yield, Quality and Metabolites of Snack Cucumber (Cucumis sativus L.). Foods 2023, 12, 371. [Google Scholar] [CrossRef]
  3. Medic, A.; Zamljen, T.; Grohar, M.C.; Slatnar, A.; Hudina, M.; Veberic, R. Using HPLC-MS/MS to Assess the Quality of Beet, Mizuna, Lettuce and Corn Salad after Juglone and Walnut Leaf Extract Treatments. Agronomy 2022, 12, 347. [Google Scholar] [CrossRef]
  4. Acarsoy Bilgin, N. Morphological Characterization of Pollen in Some Varieties of Walnut (Juglans regia). Int. J. Fruit Sci. 2022, 22, 471–480. [Google Scholar] [CrossRef]
  5. Karakaya, S.; Koca, M.; Yeşilyurt, F.; Hacimüftüoğlu, A. Antioxidant and Anticholinesterase Activities of Juglans regia L. Growing in Turkey. J. Fac. Pharm. Ankara 2019, 43, 230–238. [Google Scholar] [CrossRef]
  6. Bhat, A.A.; Shakeel, A.; Rafiq, S.; Farooq, I.; Malik, A.Q.; Alghuthami, M.E.; Alharthi, S.; Qanash, H.; Alharthy, S.A. Juglans regia Linn.: A Natural Repository of Vital Phytochemical and Pharmacological Compounds. A review. Life 2023, 13, 380. [Google Scholar] [CrossRef] [PubMed]
  7. Amirou, A.; Bnouham, M.; Legssyer, A.; Ziyyat, A.; Aziz, M.; Berrabah, M.; Mekhfi, H. Effects of Juglans regia Root Bark Extract on Platelet Aggregation, Bleeding Time, and Plasmatic Coagulation: In Vitro and Ex Vivo Experiments. Evid. Based Complement. Altern. Med. 2018, 2018, 7313517. [Google Scholar] [CrossRef]
  8. Bourais, I.; Elmarrkechy, S.; Taha, D.; Badaoui, B.; Mourabit, Y.; Salhi, N.; Alshahrani, M.M.; Al Awadh, A.A.; Bouyahya, A.; Goh, K.W.; et al. Comparative Investigation of Chemical Constituents of Kernels, Leaves, Husk, and Bark of Juglans regia L., Using HPLC-DAD-ESI-MS/MS Analysis and Evaluation of Their Antioxidant, Antidiabetic, and Anti-Inflammatory Activities. Molecules 2022, 27, 8989. [Google Scholar] [CrossRef] [PubMed]
  9. Pop, A.; Fizesan, I.; Vlase, L.; Rusu, M.E.; Cherfan, J.; Babota, M.; Gheldiu, A.M.; Tomuta, I.; Popa, D.S. Enhanced Recovery of Phenolic and Tocopherolic Compounds from Walnut (Juglans regia L.) Male Flowers Based on Process Optimization of Ultrasonic Assisted-Extraction: Phytochemical Profile and Biological Activities. Antioxidants 2021, 10, 607. [Google Scholar] [CrossRef]
  10. Zurek, N.; Pawlowska, A.; Pycia, K.; Grabek-Lejko, D.; Kapusta, I.T. Phenolic Profile and Antioxidant, Antibacterial, and Antiproliferative Activity of Juglans regia L. Male Flowers. Molecules 2022, 27, 2762. [Google Scholar] [CrossRef]
  11. Fernández-Agulló, A.; Pereira, E.; Freire, M.S.; Valentão, P.; Andrade, P.B.; González-Álvarez, J.; Pereira, J.A. Influence of solvent on the antioxidant and antimicrobial properties of walnut (Juglans regia L.) green husk extracts. Ind. Crops Prod. 2013, 42, 126–132. [Google Scholar] [CrossRef]
  12. Vieira, V.; Pereira, C.; Abreu, R.M.V.; Calhelha, R.C.; Alves, M.J.; Coutinho, J.A.P.; Ferreira, O.; Borros, L.; Ferreira, I.C.F.R. Hydroethanolic extract of Juglans regia L. green husks: A source of bioactive phytochemicals. Food Chem. Toxicol. 2020, 137, 111189. [Google Scholar] [CrossRef] [PubMed]
  13. Rusu, M.R.; Gheldiu, A.M.; Mocan, A.; Moldovan, C.; Popa, D.S.; Tomuta, I.; Vlase, L. Process Optimization for Improved Phenolic Compounds Recovery from Walnut (Juglans regia L.) Septum: Phytochemical Profile and Biological Activities. Molecules 2018, 23, 2814. [Google Scholar] [CrossRef] [PubMed]
  14. Herrera, R.; Hemming, J.; Smeds, A.; Gordobil, O.; Willför, S.; Labidi, J. Recovery of Bioactive Compounds from Hazelnuts and Walnuts Shells: Quantitative-Qualitative Analysis and Chromatographic Purification. Biomolecules 2020, 10, 1363. [Google Scholar] [CrossRef]
  15. Pycia, K.; Kapusta, I.; Jaworska, G. Impact of the Degree of Maturity of Walnuts (Juglans regia L.) and Their Variety on the Antioxidant Potential and the Content of Tocopherols and Polyphenols. Molecules 2019, 24, 2936. [Google Scholar] [CrossRef] [PubMed]
  16. Jahanban-Esfahlan, A.; Ostadrahimi, A.; Tabibiazar, M.; Amarowicz, R. A Comparative Review on the Extraction, Antioxidant Content and Antioxidant Potential of Different Parts of Walnut (Juglans regia L.) Fruit and Tree. A review. Molecules 2019, 24, 2133. [Google Scholar] [CrossRef]
  17. Segelke, T.; von Wuthenau, K.; Kuschnereit, A.; Müller, M.S.; Fischer, M. Origin Determination of Walnuts (Juglans regia L.) on a Worldwide and Regional Level by Inductively Coupled Plasma Mass Spectrometry and Chemometrics. Foods 2020, 9, 1708. [Google Scholar] [CrossRef] [PubMed]
  18. Nour, V.; Trandafir, I.; Cosmulescu, S. Optimization of ultrasound-assisted hydroalcoholic extraction of phenolic compounds from walnut leaves using response surface methodology. Pharm. Biol. 2016, 54, 2176–2187. [Google Scholar] [CrossRef] [PubMed]
  19. Hadis, E.; Mostafa, H.-Z.S.; Saeedeh, N.; Mehdi, M. Study of the effects of walnut leaf on the levels of a number of Blood Biochemical Factors in normal male rats fed with high cholesterol diet. Clin. Biochem. 2011, 44, S331. [Google Scholar] [CrossRef]
  20. Hosseini, S.; Fallah Huseini, H.; Larijani, B.; Mohammad, K.; Najmizadeh, A.; Nourijelyani, K.; Jamshidi, L. The hypoglycemic effect of Juglans regia leaves aqueous extract in diabetic patients: A first human trial. DARU J. Pharm. Sci. 2014, 22, 19. [Google Scholar] [CrossRef]
  21. Hosseini, S.; Mehrzadi, S.; Najmizadeh, A.R.; Kazem, M.; Alimoradi, H.; Fallah Huseini, H. Effects of Juglans regia L. leaf extract on hyperglycemia and lipid profiles in type two diabetic patients: A randomized double-blind, placebo-controlled clinical trial. J. Ethnopharmacol. 2014, 152, 451–456. [Google Scholar] [CrossRef]
  22. Mahmoodi, M.; Eghbali, H.; Hosseini zijoud, S.M.; Pourrashidi, A.; Mohamadi, A.; Borhani, M.; Hassanshahi, G.; Rezaeian, M. Study of the effects of walnut leaf on some blood biochemical parameters in hypercholesterolemic rats. Biochem. Anal. Biochem. 2011, 103, S331. [Google Scholar] [CrossRef]
  23. Pitschmann, A.; Zehl, M.; Atanasov, A.G.; Dirsch, V.M.; Heiss, E.; Glasl, S. Walnut leaf extract inhibits PTP1B and enhances glucose-uptake in vitro. J. Ethnopharmacol. 2014, 152, 599–602. [Google Scholar] [CrossRef]
  24. Wianowska, S.; Garbaczewska, A.; Cieniecka-Roslonkiewicz, A.L.; Dawidowicz, A.; Jankowska, A. Comparison of antifungal activity of extracts from different Juglans regia cultivars and juglone. Microb. Pathog. 2016, 100, 263–267. [Google Scholar] [CrossRef]
  25. Chamorro, F.; Carpena, M.; Lourenço-Lopes, C.; Taofiq, O.; Otero, P.; Cao, H.; Xiao, J.; Simal-Gandara, J.; Prieto, M.A. By-Products of Walnut (Juglans regia) as a Source of Bioactive Compounds for the Formulation of Nutraceuticals and Functional Foods. Biol. Life Sci. Forum 2022, 12, 35. [Google Scholar] [CrossRef]
  26. Qadan, F.; Thewaini, A.J.; Ali, D.A.; Afifi, R.; Elkhawad, A.; Matalka, K.Z. The antimicrobial activities of Psidium guajava and Juglans regia leaf extracts to acne-developing organisms. Am. J. Chin. Med. 2005, 33, 197–204. [Google Scholar] [CrossRef]
  27. Abuajah, C.I.; Ogbonna, A.C.; Osuji, C.M. Functional components and medicinal properties of food: A review. J. Food Sci. Technol. 2015, 52, 2522–2529. [Google Scholar] [CrossRef]
  28. Verma, R.S.; Padalia, R.C.; Chauhan, A.; Thul, S.T. Phytochemical analysis of the leaf volatile oil of walnut tree (Juglans regia L.) from western Himalaya. Ind. Crops Prod. 2013, 42, 195–201. [Google Scholar] [CrossRef]
  29. Boukhari, F.; Tigrine-Kordjani, N.; Meklati, B.Y. Phytochemical investigation by microwave-assisted extraction of essential oil of the leaves of walnut cultivated in Algeria. Helv. Chim. Acta 2013, 96, 1168–1175. [Google Scholar] [CrossRef]
  30. Zurek, N.; Pycia, K.; Pawlowska, A.; Potocki, L.; Kapusta, I.T. Chemical Profiling, Bioactive Properties, and Anticancer and Antimicrobial Potential of Juglans regia L. Leaves. Molecules 2023, 28, 1989. [Google Scholar] [CrossRef] [PubMed]
  31. Gawlik-Dziki, U.; Durak, A.; Pecio, Ł.; Kowalska, I. Nutraceutical Potential of Tinctures from Fruits, Green Husks, and Leaves of Juglans regia L. Sci. World J. 2014, 2014, 501392. [Google Scholar] [CrossRef]
  32. Rather, M.A.; Dar, B.A.; Dar, M.Y.; Wani, B.A.; Shah, W.A.; Bhat, B.A.; Ganai, B.A.; Bhat, K.A.; Anand, R.; Qurishi, M.A. Chemical composition, antioxidant and antibacterial activities of the leaf essential oil of Juglans regia L. and its constituents. Phytomedicine 2012, 19, 1185–1190. [Google Scholar] [CrossRef] [PubMed]
  33. Salimi, M.; Majd, A.; Sepahdar, Z.; Azadmanesh, K.; Irian, S.; Ardestaniyan, M.H.; Hedayati, M.H.; Rastkari, N. Cytotoxicity effects of various Juglans regia (walnut) leaf extracts in human cancer cell lines. Pharm. Biol. 2012, 50, 1416–1422. [Google Scholar] [CrossRef]
  34. Fernández-Agulló, A.; Castro-Iglesias, A.; Freire, M.S.; González-Álvarez, J. Optimization of the Extraction of Bioactive Compounds from Walnut (Juglans major 209 x Juglans regia) Leaves: Antioxidant Capacity and Phenolic Profile. Antioxidants 2020, 99, 18. [Google Scholar] [CrossRef]
  35. Harish, K.; Neha, C.; Varsha, N.; Naveen, K.; Raman, S. Polyphenols and their benefits: A review. Int. J. Food Prop. 2017, 20, 1700–1741. [Google Scholar] [CrossRef]
  36. Shah, U.N.; Mir, J.I.; Ahmed, N.; Jan, S.; Fazili, K.M. Bioefficacy Potential of Different Genotypes of Walnut Juglans regia L. J. Food Sci. Technol. 2018, 55, 605–618. [Google Scholar] [CrossRef] [PubMed]
  37. Untea, A.; Lupu, A.; Saracila, M.; Panaite, T. Comparison of ABTS, DPPH, Phosphomolybdenum Assays for Estimating Antioxidant Activity and Phenolic Compounds in Five Different Plant Extracts. Bull. UASVM Anim. Sci. Biotechnol. 2018, 75, 110. [Google Scholar] [CrossRef]
  38. Jabli, M.; Sebeia, N.; Boulares, M.; Faidi, K. Chemical Analysis of the Characteristics of Tunisian Juglans regia L. Fractions: Antibacterial Potential, Gas Chromatography–Mass Spectroscopy and a Full Investigation of Their Dyeing Properties. Ind. Crops Prod. 2017, 108, 690–699. [Google Scholar] [CrossRef]
  39. Sytykiewicz, H.; Chrzanowski, G.; Czerniewicz, P.; Leszczy’nski, B.; Sprawka, I.; Krzyzanowski, R.; Matok, H. Antifungal activity of Juglans regia (L.) leaf extracts against Candida albicans isolates. Pol. J. Environ. Stud. 2015, 24, 1339–1448. [Google Scholar] [CrossRef]
  40. Tan, J.; Li, Y.; De-Xing, H.; Wu, S. The Effects and Mechanisms of Cyanidin-3-Glucoside and Its Phenolic Metabolites in Maintaining Intestinal Integrity. Antioxidant 2019, 8, 479. [Google Scholar] [CrossRef]
  41. Ivanovic, J.; Tadic, V.; Dimitrijevic, S.; Stamenic, M.; Petrovic, S.; Zizovic, I. Antioxidant properties of the anthocyanin-containing ultrasonic extract from blackberry cultivar “Čačanska Bestrna”. Ind. Crops Prod. 2013, 53, 274–281. [Google Scholar] [CrossRef]
  42. Cristianini, M.; Guillén Sánchez, J.S. Extraction of bioactive compounds from purple corn using emerging technologies: A review. J. Food Sci. 2020, 85, 855–1379. [Google Scholar] [CrossRef] [PubMed]
  43. Piyapanrungrueang, W.; Chantrapornchai, W.; Haruthaithanasan, V.; Sukatta, U.; Aekatasanawan, C. Comparison of anthocyanin extraction methods from high anthocyanin purple corn cob Hybrid: KPSC 901, and quality of the extract powder. J. Food Process. Preserv. 2016, 40, 1125–1133. [Google Scholar] [CrossRef]
  44. Zhou, J.; Wang, M.; Bäuerl, C.; Cortés-Macías, E.; Calvo-Lerma, J.; Collado, M.C.; Barba, F.J. The impact of liquid-pressurized extracts of Spirulina, Chlorella and Phaedactylum tricornutum on in vitro antioxidant, antiinflammatory and bacterial growth effects and gut microbiota modulation. Food Chem. 2023, 401, 134083. [Google Scholar] [CrossRef] [PubMed]
  45. Zhou, J.; Wang, M.; Barrada, H.; Zhu, Z.; Grimi, N.; Barba, F.J. Pulsed electric fields (PEF), pressurized liquid extraction (PLE) and combined PEF + PLE process evaluation: Effects on Spirulina microstructure, biomolecules recovery and Triple TOF-LC-MS-MS polyphenol composition. IFSET 2022, 77, 102989. [Google Scholar] [CrossRef]
  46. Ungureanu, A.R.; Chitescu, C.L.; Luta, E.A.; Morosan, A.; Mihaiescu, D.E.; Mihai, D.P.; Costea, L.; Ozon, E.A.; Fita, A.C.; Balaci, T.D.; et al. Outlook on Chronic Venous Disease Treatment: Phytochemical Screening, In Vitro Antioxidant Activity and In Silico Studies for Three Vegetal Extracts. Molecules 2023, 28, 3668. [Google Scholar] [CrossRef] [PubMed]
  47. Arslan, H.; Ondul Koc, E.; Ozay, Y.; Canli, O.; Ozdemir, S.; Tollu, G.; Dizge, N. Antimicrobial and antioxidant activity of phenolic extracts from walnut (Juglans regia L.) green husk by using pressure-driven membrane process. J. Food Sci. Technol. 2022, 60, 73–83. [Google Scholar] [CrossRef]
  48. Lockyer, S.; de la Hunty, A.E.; Steenson, S.; Spiro, A.; Stanner, S.A. Walnut consumption and health outcomes with public health relevance-A systematic review of cohort studies and randomized controlled trials published from 2017 to present. Nutr. Rev. 2023, 81, 26–54. [Google Scholar] [CrossRef]
  49. Almeida, I.; Fernandes, E.; Lima, J.; Costa, P.; Bahia, M. Walnut (Juglans regia) leaf extracts are strong scavengers of pro-oxidant reactive species. Food Chem. 2008, 106, 1014–1020. [Google Scholar] [CrossRef]
  50. Papoutsi, Z.; Kassi, E.; Chinou, I.; Halabalaki, M.; Skaltsounis, L.A.; Moutsatsou, P. Walnut extract (Juglans regia L.) and its component ellagic acid exhibit anti-inflammatory activity in human aorta endothelial cells and osteoblastic activity in the cell line KS483. Br. J. Nutr. 2008, 99, 715–722. [Google Scholar] [CrossRef]
  51. D’Angeli, F.; Malfa, G.A.; Garozzo, A.; Li Volti, G.; Genovese, C.; Stivala, A.; Nicolosi, D.; Attanasio, F.; Bellia, F.; Ronsisvalle, S.; et al. Antimicrobial, Antioxidant, and Cytotoxic Activities of Juglans regia L. Pellicle Extract. Antibiotics 2021, 10, 159. [Google Scholar] [CrossRef] [PubMed]
  52. Arsenie, L.V.; Lacatusu, I.; Oprea, O.; Bordei, N.; Bacalum, M.; Badea, N. Azelaic acid-willow bark extract-panthenol—Loaded lipid nanocarriers improve the hydration effect and antioxidant action of cosmetic formulations. Ind. Crops Prod. 2020, 154, 112658. [Google Scholar] [CrossRef]
  53. Koriem, K.M.M. Caftaric acid: An overview on its structure, daily consumption, bioavailability and pharmacological effects. Biointerface Res. Appl. Chem. 2020, 10, 5616–5623. [Google Scholar] [CrossRef]
  54. Ortiz, A.L.G.; Berti, F.; Navarini, L.; Crisafulli, P.; Colomban, S.; Forzato, C. Aqueous extracts of walnut (Juglans regia L.) leaves: Quantitative analyses of hydroxycinnamic and chlorogenic acids. J. Chromatogr. Sci. 2018, 56, 753–760. [Google Scholar] [CrossRef]
  55. Santos, A.; Barros, L.; Calhelha, R.C.; Duenas, M.; Carvalh, A.M.; Santos-Buelga, C.; Ferreira, I.C.F.R. Leaves and decoction of Juglans regia L.: Different performances regarding bioactive compounds and in vitro antioxidant and antitumor effects. Ind. Crops Prod. 2013, 51, 430–436. [Google Scholar] [CrossRef]
  56. Pasini, A.M.F.; Cominacini, L. Potential Benefits of Antioxidant Phytochemicals on Endogenous Antioxidants Defences in Chronic Diseases. Antioxidants 2023, 12, 890. [Google Scholar] [CrossRef]
  57. Sebastia, N.; Montoro, A.; León, Z.; Soriano, J.M. Searching trans-resveratrol in fruits and vegetables: A preliminary screening. J. Food Sci. Technol. 2017, 54, 842–845. [Google Scholar] [CrossRef]
  58. Yang, L.; Ma, S.; Han, Y.; Wang, Y.; Guo, Y.; Weng, Q.; Xu, M. Walnut Polyphenol Extract Attenuates Immunotoxicity Induced by 4-Pentylphenol and 3-methyl-4-nitrophenol in Murine Splenic Lymphocyte. Nutrients 2016, 8, 287. [Google Scholar] [CrossRef]
  59. Ravanbakhsh, A.; Mahdavi, M.; Jalilzade-Amin, G.; Javadi, S.; Maham, M.; Mohammadnejad, D.; Rashidi, M.R. Acute and Subchronic Toxicity Study of the Median Septum of Juglans regia in Wistar Rats. Adv. Pharm. Bull. 2016, 6, 541–549. [Google Scholar] [CrossRef] [PubMed]
  60. Pan, A.; Sun, Q.; Manson, J.E.; Willett, W.C.; Hu, F.B. Walnut Consumption Is Associated with Lower Risk of Type 2 Diabetes in Women. J. Nutr. 2013, 143, 512–518. [Google Scholar] [CrossRef] [PubMed]
  61. ISO 14502-1:2005; Determination of Substances Characteristic of Green and Black Tea. ISO: Geneva, Switzerland, 2005.
  62. Lungu, L.; Savoiu, M.R.; Manolescu, B.N.; Farcasanu, I.C.; Popa, C.V. Phytotoxic and Antioxidant Activities of Leaf Extracts of Ailanthus altissima Swingle. Rev. Chim. 2016, 67, 1928–1931. [Google Scholar]
  63. Luță, E.A.; Biță, A.; Moroșan, A.; Mihaiescu, D.E.; Ghica, M.; Mihai, D.P.; Olaru, O.T.; Deculescu-Ioniță, T.; Duțu, L.E.; Popescu, M.L.; et al. The Influence of Phytosociological Cultivation and Fertilization on Polyphenolic Content of Menthae and Melissae folium and Evaluation of Antioxidant Properties through In Vitro and In Silico Methods. Plants 2022, 11, 2398. [Google Scholar] [CrossRef] [PubMed]
Figure 1. Evaluation of the extraction time for (a) TPC and (b) TEAC (MGL extract in hydroethanolic mixture, MS extraction method, different extraction times).
Molecules 28 07328 g001
Table 1. The percentage of moisture in the samples varies according to the degree of maturity.
Vegetable MaterialHarvest DateMoisture Content, %
young green leaves (YGL)15 May 202375.74 ± 0.03
green leaves (GL)26 June 202372.73 ± 0.02
mature green leaves (MGL)14 October 202255.17 ± 0.04
yellow leaves (YL)15 November 202264.64 ± 0.03
Table 2. TPC and TEAC of MGL extracts (different solvents and methods).
MethodSolventTPC *TEAC **
mg GAE/g DMmM TE/g DM
magnetic stirring
(MS)
ethanol27.76 ± 0.59 a2.88 ± 0.02 a
water76.08 ± 0.90 b5.60 ± 0.02 b
water:ethanol109.21 ± 0.34 c7.53 ± 0.02 c
ultrasounds assisted extraction
(UA)
ethanol38.40 ± 0.59 a3.49 ± 0.02 a
water82.58 ± 0.90 b5.49 ± 0.02 b
water:ethanol106.65 ± 0.34 c8.27 ± 0.02 c
maceration
(M)
ethanol42.35 ± 0.90 a2.79 ± 0.02 a
water93.04 ± 0.34 b5.28 ± 0.02 b
water:ethanol110.39 ± 0.90 c6.79 ± 0.02 c
* TPC—Total polyphenol content; ** TEAC—Trolox equivalent antioxidant capacity; DM—dry matter; GAE—gallic acid equivalents; TE—Trolox equivalents; different letters (a–c) show significantly different samples according to Two-Way ANOVA (p < 0.05) followed by a post-hoc Tukey Test.
Table 3. Experimental and predicted values of total polyphenol content at different levels of extraction process factors and relevant statistics correspond to the regression model.
No. Exp.Extraction MethodSolventTPC
(mg GAE/g DM)
TPCpred
(mg GAE/g DM)
ΔTPC
(mg GAE/g DM)
1MSethanol27.7530.91−3.16
2MSwater76.0878.64−2.56
3MSwater:ethanol109.21103.495.72
4UAethanol38.4035.772.63
5UAwater82.5883.50−0.92
6UAwater:ethanol106.65108.36−1.71
7Methanol42.3541.820.53
8Mwater93.0489.553.48
9Mwater:ethanol110.39114.40−4.01
RMSE3.134
R20.990
Adjusted R20.979
Predicted R20.950
Adequate Precision23.82
F94.34
p0.0003
TPC—mean values of three replicates for total polyphenol content; TPCpredpredicted TPC values computed from Equation (1); ΔTPC—residual; RMSE—root mean square error determined using Equation (2); R2—coefficient of multiple determination.
Table 4. Experimental and predicted values of antioxidant activity at different levels of extraction process factors and relevant statistics correspond to the regression model.
No. Exp.Extraction MethodSolventTEAC
(mg TE/g DM)
TEACpred
(mg TE/g DM)
ΔTEAC
(mg TE/g DM)
1MSethanol2.883.04−0.1628
2MSwater5.605.440.1526
3MSwater:ethanol7.537.520.0102
4UAethanol3.493.460.0315
5UAwater5.495.86−0.3687
6UAwater:ethanol8.277.930.3373
7Methanol2.792.660.1313
8Mwater5.285.060.2162
9Mwater:ethanol6.797.13−0.3474
RMSE0.232
R20.985
Adjusted R20.969
Predicted R20.922
Adequate Precision20.30
F63.89
p0.0007
TEAC—mean values of three replicates for total polyphenols content; TEACpred—predicted TPC values computed from Equation (3); ΔTEAC—residual; RMSE—root mean square error determined using Equation (4); R2—coefficient of multiple determination.
Table 5. TPC and TEAC of YGL, GL, MGL, YL extracts using different solvents (UA, 60 min).
Type of LeavesSolventTPC *TEAC **
mg GAE/g DMmM TE/g DM
YGLethanol1.32 ± 0.34 a0.03 ± 0.00 a
water2.90 ± 0.59 ab0.04 ± 0.00 a
water:ethanol18.28 ± 0.59 b0.09 ± 0.00 a
GLethanol0.73 ± 0.34 a0.03 ± 0.00 a
water3.49 ± 0.59 ab0.03 ± 0.00 a
water:ethanol16.90 ± 0.90 b0.08 ± 0.00 a
MGLethanol38.40 ± 0.59 c3.50 ± 0.02 b
water82.58 ± 0.90 cd5.50 ± 0.02 b
water:ethanol106.65 ± 0.34 c8.27 ± 0.02 b
YLethanol62.66 ± 0.59 c4.74 ± 0.02 b
water110.20 ± 0.34 cd7.76 ± 0.02 b
water:ethanol146.29 ± 0.90 c11.67 ± 0.02 b
* TPC—Total polyphenol content; ** TEAC—Trolox equivalent antioxidant capacity; DM—dry matter; GAE—gallic acid equivalents; TE—Trolox equivalents; different letters (a–d) show significantly different samples according to Two-Way ANOVA (p < 0.05) followed by a post-hoc Tukey Test.
Table 6. Experimental and predicted values of total polyphenols content at different levels of extraction process factors and relevant statistics correspond to the regression model.
No. Exp.Plant MaturitySolventTPC0.5
(mg GAE/g DM)
TPCpred0.5
(mg GAE/g DM)
ΔTPC0.5
(mg GAE/g DM)
1YGLethanol12.1012.040.0531
2YGLwater1.702.34−0.6326
3YGLwater:ethanol9.098.500.5912
4GLethanol4.284.250.0273
5GLwater7.928.34−0.4218
6GLwater:ethanol0.72970.40470.3250
7MGLethanol4.114.110.0023
8MGLwater1.150.54430.6052
9MGLwater:ethanol6.206.71−0.5084
10YLethanol10.3310.41−0.0827
11YLwater10.5010.130.3687
12YLwater:ethanol1.872.20−0.3273
RMSE0.398
R20.9895
Adjusted R20.9808
Predicted R20.9581
Adequate Precision29.15
F113.29
p<0.0001
TPC—mean values of three replicates for total polyphenol content; TPCpred—predicted TPC values computed from Equation (5); ΔTPC—residual; RMSE—root mean square error determined using Equation (6); R2—coefficient of multiple determination.
Table 7. Experimental and predicted values of antioxidant activity at different levels of extraction process factors and relevant statistics correspond to the regression model.
No. Exp.Plant MaturitySolventlog(TEAC)
(mg TE/g DM)
log(TEACpred)
(mg TE/g DM)
log(ΔTEAC)
(mg TE/g DM)
1YGLethanol1.071.12−0.0556
2YGLwater−1.39−1.37−0.0168
3YGLwater:ethanol0.73990.69100.0489
4GLethanol−1.05−1.080.0351
5GLwater0.67600.67500.0010
6GLwater:ethanol−1.60−1.600.0051
7MGLethanol−1.07−1.150.0817
8MGLwater−1.55−1.53−0.0183
9MGLwater:ethanol0.54330.53110.0122
10YLethanol0.91760.9787−0.0612
11YLwater0.88960.83500.0546
12YLwater:ethanol−1.53−1.44−0.0867
RMSE0.049
R20.998
Adjusted R20.966
Predicted R20.922
Adequate Precision55.98
F615.14
p<0.0001
TEAC—mean values of three replicates for total polyphenol content; TEACpred—predicted TPC values computed from Equation (7); ΔTEAC—residual; RMSE—root mean square error determined using Equation (8); R2—coefficient of multiple determination.
Table 8. The phytochemical profiles of YGL, GL, MGL, and YL extracts resulted from the FT-ICR-MS method.
CompoundTheoretical m/z
(ESI+)
Type of Extract
MGL *YGL **GL ***MGL *YL ****
Extraction Method
MS (m)MSUAMUA
Extraction Time
(min)
Extraction Solvent
(60 min)
Extraction Solvent
(60 min)
11020304560ewmewmewmewmewmewmewm
Sample Number
1234567869101112131415161718192091011212223
Caffeic acid181.049535+++++++++++++++++
Caftaric acid+Na335.037353+++++++++++++++++
Chlorogenic acid355.102359+++++++++++++++++++++++++++
Ellagic acid303.013544++
Ferulic acid196.065185+++++++++++++++++
Juglone175.038971++++++++++++++++++
p-coumaric acid165.054621++++++++++++++++
Sinapate225.075750++++++++++++++++
3-p-coumaroylquinic acid339.107444+++++++++++++++++++++++++++
Quercetin 3-o-arabinoside435.092188+++++++++++++++++++++++++++
Quercetin 3-rhamnoside449.107838++++++++++++++++++++++++++
Quercetin 3-o-pentoside567.134447++++
Quercetin303.049929+++++++++++++++++++++++++++
Myricetin319.044844++++++++++++++++++
Kaempferol287.055014+++++++++++++++++++++++++++
Kaempferol 3-o-arabinoside419.097273+++++++++++++++++++++++++++
Kaempferol-3-o-rhamnoside433.112923+++++++++++++++++++++++++++
Isokaempferide301.070665+++++++++++++++++++
Catechin hydrate309.096879+++++++++++++++++++++++++++
Hyperoside465.102753++++++++++++++++++++
Luteolin287.055014+++++++++++++++++++++++++++
Naringenin273.075750++++++++++++++++++++++++
Hesperetin303.086812++++++++++++++++++++++
Catechin291.086315+++++++++++++++++++++++++++
Epigallocatechin307.081229+++++++++++++++
Epigallocatechin gallate443.097273+++++++++++++++++++++++++++
Fisetinidol275.091400+++++++++++++++++
Guibourtinidol259.096485+++++++++++++++++
Oleanic acid457.367622++++++++++++++++++++++
Stigmasterol413.377793++++++++++++++++++++++++
Resveratrol229.085921++++++++++
Myo-inositol181.070665++++++++++++++
Taxifolin305.065579+++++++++++++++++++++++++++
Pelargonidin271.060100++++++++++++++++++
Malvidin331.081229++++++++++++++
Cyanidin-3-glucoside chloride485.084516+++++++
Quinic acid193.070665++++++++++++++++++++
Citric acid+Na215.016223+++++++
Azelaic acid189.112135+
Asiatic acid489.357451++++++++++++++++++++++++++
Total number of compounds333435353536173436183633183233182327152628183633183431
Sample number1234567869101112131415161718192091011212223
* MGL—mature green leaves; ** YGL—young green leaves; *** GL—green leaves; **** YL—yellow leaves; MS—magnetic stirring; UA—ultrasounds assisted; M—maceration; e—ethanol; w—water; m—hydroethanolic mixture; +/−—indicates the presence/ absence of the compounds in each studied extract sample.
Disclaimer/Publisher’s Note: The statements, opinions and data contained in all publications are solely those of the individual author(s) and contributor(s) and not of MDPI and/or the editor(s). MDPI and/or the editor(s) disclaim responsibility for any injury to people or property resulting from any ideas, methods, instructions or products referred to in the content.

