Article

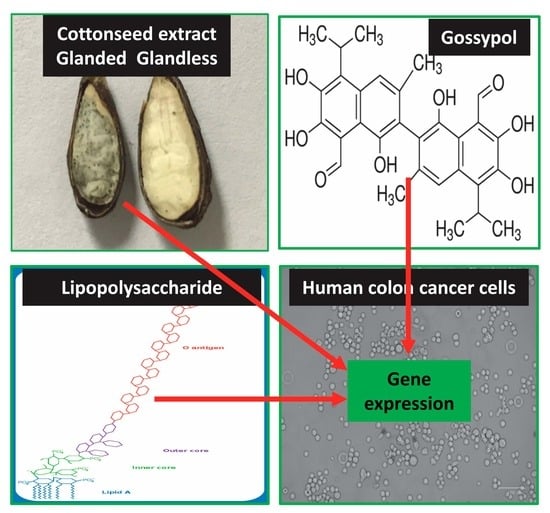
Identification of Bcl2 as a Stably Expressed qPCR Reference Gene for Human Colon Cancer Cells Treated with Cottonseed-Derived Gossypol and Bioactive Extracts and Bacteria-Derived Lipopolysaccharides

United States Department of Agriculture, Agricultural Research Service, Southern Regional Research Center, 1100 Allen Toussaint Boulevard, New Orleans, LA 70124, USA
*
Author to whom correspondence should be addressed.
Molecules 2022, 27(21), 7560; https://doi.org/10.3390/molecules27217560
Submission received: 29 September 2022 / Revised: 28 October 2022 / Accepted: 1 November 2022 / Published: 4 November 2022

Abstract

:
Cottonseed contains many bioactive molecules including plant polyphenols. Cottonseed value might be increased by providing high-value bioactive polyphenols for improving nutrition and health. However, there was a lack of molecular evidence for cottonseed bioactivity in mammalian cells. One widely used method for evaluating the bioactivity of natural products is quantitative real-time-PCR (qPCR). The selection of stably expressed internal reference genes is a crucial task of qPCR assay for data analysis. The rationale for reference gene selection is that a lower standard deviation of the cycle of threshold (Cq) among the treatments indicates a more stable expression of the gene. The objective of this study was to select reference genes in human colon cancer cells (COLO 205) treated with cottonseed-derived gossypol and bioactive extracts along with bacterial endotoxin lipopolysaccharides (LPS). SYBR Green qPCR was used to analyze the mRNA levels of a wide range of biomarkers involved in glucose transport, lipid biosynthesis, inflammatory response, and cancer development. qPCR data (10,560 Cq values) were generated from 55 genes analyzed from 64 treatments with triplicate per treatment for each gene. The data showed that B-cell lymphoma 2 (Bcl2) mRNA was the most stable among the 55 mRNAs analyzed in the human colon cancer cells. Glyceraldehyde 3 phosphate dehydrogenase (Gapdh) and ribosome protein L32 (Rpl32) mRNAs were not good qPCR references for the colon cancer cells. These observations were consistent regardless of the treatment comparison between gossypol and LPS, glanded and glandless seed extracts, seed coat and kernel extracts, or treatment for 8 and 24 h. These results suggest that Bcl2 is a preferable reference gene for qPCR assays in human colon cancer cells treated with cottonseed-derived gossypol and bioactive extracts as well as LPS. The extensive qPCR results firmly support the conclusion that the Bcl2 gene is stably expressed at the mRNA level in the human colon cancer cells regardless of the treatment, suggesting that Bcl2 gene expression is not regulated at the mRNA level but at the post-transcriptional level. These results should facilitate studies designated to evaluate bioactivity on gene expression regulation by cottonseed molecules and other natural and synthetic molecules for nutrition and health uses.

Graphical Abstract

1. Introduction

The cotton (Gossypium hirsutum L.) plant provides economically important fiber and cottonseed but cottonseed only contributes to approximately 20% of the crop value. It is either glanded or glandless depending on its seed with or without gossypol glands (Figure 1A) [1,2]. Cottonseed contains many bioactive molecules including gossypol (Figure 1B), quercetin, gallic acid, 3,4-dihydroxybenzoic acid, flavonoids, cyclopropenoid fatty acids, and peptides [3,4,5,6,7,8,9,10]. Most of these value-added products possess health promotion and disease prevention potentials [6,11,12,13,14,15]. Cottonseed value could be potentially increased by providing high-value bioactive products because plant-derived bioactive materials have been used for disease prevention and treatment since ancient history [16,17,18,19,20].
One of the bioactive materials derived from cottonseed is gossypol, a plant polyphenol with a highly colored yellow pigment found in the leaves, stems, roots, and seeds of cotton plants (Figure 1B) [22]. Gossypol and related compounds are reported to have anticancer activities associated with breast cancer [23,24,25], colon cancer [26,27], pancreatic cancer [28,29], and prostate cancer [30,31]. Gossypol has additional bioactivities such as antiobesity [25], anti-inflammatory [32], and antifungal activities [33]. These new discoveries have generated intensive interest in gossypol and related molecules in the biomedical field.
The other bioactive materials derived from cottonseed are polyphenolic extracts (Figure 1C). Beneficial plant polyphenolic extracts are present in most diets [34]. They regulate gene expression in numerous studies [35,36,37,38,39,40,41]. We recently isolated bioactive ethanol extracts from glanded and glandless cottonseed which were shown to be essentially free of gossypol by HPLC-MS analysis [1]. These bioactive cottonseed extracts also regulate gene expression in mammalian cells [42,43].
The long-term objective of our current research was to explore the potential anti-colon cancer materials from natural sources, especially cottonseed. Colon cancer is one of the deadliest diseases in the world. The lifetime risk of developing colorectal cancer is approximately 4.0% for men and women in 2022 (https://www.cancer.org/cancer/colon-rectal-cancer/about/key-statistics.html, accessed on 1 October 2022). It is urgently needed. access to fully understand the mechanism of developing colon cancer and explore ways to ease the burden of the healthcare crisis. However, there was a lack of molecular evidence for the bioactivity of cottonseed-derived materials in colon cancer cells.
Quantitative real-time-PCR (qPCR) for gene expression analysis is a widely used method for evaluating the bioactivity of natural products. Some questions can be easily answered by qPCR, e.g., the number of isoforms, the levels of gene expression, and the expression patterns of genes regulated by various stimuli. However, the reliability and reproducibility of qPCR results can be affected by many genetic, environmental, and experimental factors because of the high sensitivity [44]. Therefore, one of the critical tasks of qPCR assay design is to select stably expressed internal reference genes for data analysis due to the inherited variations of gene expression among individual organisms, various tissues, different experimental stages and RNA stability, experimental variations such as RNA extraction methods and cDNA preparations, and human errors [45,46]. Carefully selected internal reference mRNAs are used to normalize transcript levels of test genes to more accurately detect the variations [47,48,49,50]. The rationale for qPCR reference gene selection is that the reference gene should be stably expressed without much variation by the experimental treatments. A lower standard deviation of the cycle of threshold (Cq) among the treatments might be an indication of a more stable expression of the gene which could serve as an internal reference.
The objective of this study was to characterize potential reference genes in human colon cancer cells treated with cottonseed-derived gossypol and bioactive extracts. The well-known bacterial endotoxin lipopolysaccharide (LPS) was selected for comparison with cottonseed materials during the qPCR analysis of gene expression. LPS is a major cell wall component of Gram-negative bacteria (Figure 1D). LPS is widely present in the gut and may be derived from colonial bacteria and/or food contamination. LPS was proposed to have an antitumor effect in several experimental models [51]. One study found that LPS induced TGFβ and HGF production mediated by CD14/TLR-2 in cultured human colon cancer cell lines [52]. Another study showed that LPS promoted NFkB activation in colon cancer cells [53]. A third study demonstrated that LPS promoted the migratory capacity of colon cancer cells with the activation of the SDF-1α/CXCR4 axis and epithelial–mesenchymal transition occurrence [54].
In this study, human colon cancer cells (COLO 205) (Figure 1E) were treated with cottonseed-derived gossypol and ethanol extracts, along with LPS. SYBR Green qPCR was used to analyze the mRNA levels of a wide range of biomarkers involved in glucose transport, lipid biosynthesis, inflammatory response, and cancer development. The data showed that B-cell lymphoma 2 (Bcl2) mRNA was the most stable among the 55 mRNAs analyzed in human colon cancer cells. Glyceraldehyde 3 phosphate dehydrogenase (Gapdh) and ribosome protein L32 (Rpl32) mRNAs, two widely used references in mammalian cells, were not good qPCR references for colon cancer cells. These results suggest that Bcl2 is a preferable reference gene for qPCR assay of gene regulation by cottonseed and bacterial products in human colon cancer cells. The extensive qPCR results firmly support the conclusion that the Bcl2 gene is stably expressed at the mRNA level in the human colon cancer cells regardless of the treatment, suggesting that Bcl2 gene expression is not regulated at the mRNA level but at the post-transcriptional level.

2. Results

2.1. Cq mean Distribution in Colon Cancer Cells Treated with Gossypol, LPS, and Cottonseed Extracts

The ideal reference gene should not be expressed at extreme levels. In qPCR technology, cDNA is doubled per cycle of PCR amplification, i.e., one Cq difference equates to a 2-fold difference at the mRNA levels [48]. A lower Cq means a higher mRNA level and vice versa. SYBR Green qPCR assay with the specific primers (Table 1) was used to measure the relative mRNA levels of 55 genes in the cells treated with plant toxin gossypol, bacterial toxin LPS, and cottonseed extracts with 1% DMSO as the control. The qPCR assay showed that Bcl2 Cq was 28.82 and Inos mRNA was undetectable (mean of 192 independent samples) (Figure 2).
The mean Cq values of 11 mRNAs (mean of 192 independent samples) were at least one Cq less than Bcl2 Cq including Bcl2l1 (−1.00), Bnip3 (−1.75), Csnk2a1 (−2.43), Gapdh (−4.17), Glut3 (−1.42), Hif1a (−1.13), Hmgr (−1.21), Map1lc3b (−2.17), Rpl32 (−3.92), Tnfsf10 (−1.19), and Zfand5 (−1.67) (Figure 2). The mean Cq values of 24 mRNAs (mean of 192 independent samples) were at least one Cq larger than Bcl2 Cq including Ahrr1 (5.15), Claudin1 (1.92), Cox1 (10.99), Cox2 (1.29), Cxcl1 (7.07), Cyclind1 (5.71), Dgat2a (3.52), Dgat2b (2.15), Elk1 (2.87), Fas (3.17), Glut4 (10.21), Hua (3.38), Icam1 (6.40), Inos (undetected), Insr (2.59), Il2 (1.88), Il10 (2.79), Il12 (5.17), Nfkb (3.50), P53 (2.79), Rab24 (13.82), Tnf (1.23), Vegf (2.35), Zfp36l1 (1.69), and Zfp36l2 (5.66) (Figure 2).
The above Cq data suggest that the Bcl2 mRNA level was within the middle range of the tested 55 genes in the human colon cancer cells treated with gossypol, LPS, and cottonseed extracts. The mRNA levels of Gapdh and Rpl32 were the most abundant in the cells with approximately 18- and 15-fold of Bcl2 mRNA, respectively, whereas Inos mRNA was undetectable and those of Ahrr1, Cox1, Cxcl1, Cyclind1, Dgat2a, Glut4, Hua, Icam1, Il12, Nfkb, Rab24, and Zfp36l2 mRNAs were minimally detected with less than 10% of Bcl2 mRNA in the colon cancer cells. These results suggest that the Bcl2 gene is modestly expressed (i.e., not at an extreme level among the selected biomarkers analyzed) in the human colon cancer cells treated with gossypol, LPS, and cottonseed extracts and that the Bcl2 gene could serve as a good reference gene for qPCR analysis of gene expression in the human colon cancer cells.

2.2. Cq standard Deviation Distribution in Colon Cancer Cells Treated with Gossypol, LPS, and Cottonseed Extracts

The qPCR assay showed that Bcl2 Cq was the least varied mRNA among the 55 genes analyzed. The standard deviation of Cq for Bcl2 was 1.09 (mean of 192 independent samples) (Figure 3). The standard deviations of Cq for Gapdh and Rpl32 were 3.12 and 3.16 (mean of 192 independent samples), respectively (Figure 3). All of the other mRNAs had larger standard deviations of Cq than Bcl2 (Figure 3). The mRNAs with closest standard deviations of Bcl2 Cq (less than 1.50) included Bnip3 (1.21), Glut3 (1.30), Hmgr (1.49), Il2 (1.12), Il6 (1.37), Il8 (1.32), Il17 (1.48), Pim1 (1.26), Pparr (1.32), Tnf (1.39), Tnfsf10 (1.40), Ulk2 (1.16), and Zfand5 (1.34) (Figure 3). These results suggest that Bcl2 is the most stably expressed gene and therefore, could serve as a reliable reference for qPCR analysis of gene expression in human colon cancer cells treated with gossypol, LPS, and cottonseed extracts, regardless of the treatments.

2.3. Variation of Gene Expression between Plant Toxin Gossypol and Bacterial Toxin LPS Treatment

To confirm the above conclusion that Bcl2 was a preferable reference gene for qPCR analysis of gene expression in the human colon cancer cells treated with gossypol, LPS, and cottonseed extracts, we selected subsets of data for comparison. We first compared the variation of gene expression in the human colon cancer cells under the treatment with plant toxin gossypol and bacterial toxin LPS. As shown in Figure 4, Bcl2 Cq was the least varied among the 55 targets with a standard deviation of 1.08 and 1.16 for gossypol and LPS treatment (mean of 24 independent samples), respectively. The standard deviations of Gapdh Cq were 4.01 (gossypol treatment) and 3.15 (LPS treatment) and those of Rpl32 Cq were 3.68 (gossypol treatment) and 3.10 (LPS treatment) (mean of 24 independent samples) (Figure 4). All of the other mRNAs had larger standard deviations of Cq than Bcl2 Cq (Figure 4). The mRNA levels of genes regulated by gossypol that were at least 2-fold of those regulated by LPS could be interpreted as gossypol regulation of gene expression being significantly higher than LPS. There were 14 genes with more abundantly expressed mRNA levels under gossypol treatment than LPS treatment including Ahrr1, Claudin1, Cox1, Cox2, Cxcl1, Dgat2a, Fas, Glut1, Icam1, Insr, Nfkb, P53, Rab24, and Zfp36l1 (Figure 4). Similarly, the mRNA levels of genes regulated by gossypol less than 0.5-fold of those regulated by LPS could be interpreted as their expression being regulated by gossypol significantly less than the LPS effect. There were 7 genes with less abundantly expressed mRNA levels under gossypol treatment than under LPS treatment including Cyp19a1, Il6, Il10, Il12, Il16, Vegf, and Zfp36l2 (Figure 4). The above results of modest expression of the Bcl2 gene with minimal variation agree with the conclusion that Bcl2 is a suitable reference gene for qPCR analysis of gene expression in human colon cancer cells regardless of treatments with gossypol or LPS.

2.4. Variation of Gene Expression between Glanded and Glandless Cottonseed Extract Treatment

We further compared the variation of gene expression in the human colon cancer cells under the treatment with glanded and glandless cottonseed extracts. Again, Bcl2 Cq was the least varied among the 55 targets with a standard deviation of 1.07 and 0.98 for glanded seed extract and glandless seed extract (mean of 48 independent samples), respectively (Figure 5). The standard deviations of Gapdh Cq were 3.34 (glanded seed extract) and 3.51 (glandless seed extract) and those of Rpl32 Cq were 3.22 (glanded seed extract) and 3.43 (glandless seed extract) (mean of 48 independent samples) (Figure 5). All of the other mRNAs had larger standard deviations of Cq than Bcl2 Cq (Figure 5). There were only two genes more abundantly expressed under glanded seed extract treatment than glandless seed extract treatment including Vegf and Zfp36l1 (Figure 5). There were 15 genes with lower mRNA levels under glanded seed extract treatment than under glandless seed extract treatment including Claudin1, Cox1, Cyclind1, Elk1, Fas, Gapdh, Glut1, Insr, Il10, Il12, Nfkb, P53, Rab24, Zfp36l1, and Zfp36l2 (Figure 5). These results support the conclusion that Bcl2 is a suitable reference gene for qPCR analysis of gene expression in human colon cancer cells regardless of treatment with glanded or glandless cottonseed extracts.

2.5. Variation of Gene Expression between Cottonseed Coat and Kernel Extract Treatment

We also compared the variation of gene expression under the treatment with seed coat and kernel extracts in the human colon cancer cells. As shown in Figure 6, Bcl2 Cq was the least varied mRNA among the 55 targets with a standard deviation of 1.06 and 0.96 for coat extract and kernel extract (mean of 48 independent samples), respectively. The standard deviations of Gapdh Cq were 3.05 (coat extract) and 3.83 (kernel extract) and those of Rpl32 Cq were 3.18 (coat extract) and 3.49 (kernel extract) (mean of 48 independent samples), respectively (Figure 6). All of the other mRNAs had larger standard deviations of Cq than Bcl2 Cq (Figure 6). There were none of the genes with more abundantly expressed mRNA levels under the coat extract treatment than the kernel extract treatment (Figure 6). There were 13 genes with less abundantly expressed mRNA levels under coat extract treatment than kernel extract treatment including Ahrr1, Cox1, Elk1, Gapdh, Icam1, Insr, Il10, Il12, Nfkb, Rab24, Vegf, Zfp36l1, and Zfp36l2 (Figure 6). The conclusion that Bcl2 is a suitable reference gene for qPCR analysis of gene expression in human colon cancer cells is confirmed with this comparison regardless of the cells treated with seed coat or kernel extract.

2.6. Variation of Gene Expression between Cottonseed Extract Treatment Time

In addition, we compared the variation of gene expression in the human colon cancer cells between 8 and 24 h treatment with seed coat extract. As shown in Figure 7, Bcl2 Cq was the least varied mRNA among the 55 targets with a standard deviation of 1.06 and 0.95 for 8 h and 24 h (mean of 48 independent samples), respectively. The standard deviations of Gapdh Cq were 3.05 (8 h) and 2.90 (24 h) and those of Rpl32 Cq were 3.18 (8 h) and 2.93 (24 h) (mean of 48 independent samples), respectively (Figure 7). All of the other mRNAs had larger standard deviations of Cq than Bcl2 Cq (Figure 7). There were 21 genes with more abundantly expressed mRNA levels under 8 h treatment than 24 h treatment including Bcl2l1, Claudin1, Cox1, Cox2, Cstb, Cxcl1, Cylind1, Dgat1, Elk1, Fas, Gapdh, Glut1, Hua, Icam1, Insr, Il8, Nfkb, P53, Rpl32, Zfp36l1, and Zfp36l2 (Figure 7). There were 5 genes with less abundantly expressed mRNA levels under 8 h treatment than 24 h treatment including Ahrr1, Glut4, Il12, Rab24, and Vegf (Figure 7). These results of gene expression variation in the human colon cancer cells under 8 or 24 h treatment with seed coat extract also support the conclusion that Bcl2 but not Gapdh or Rpl32 or any other gene is a preferable reference gene for qPCR analysis

2.7. Variation of Gene Expression between DMSO Control and Various Treatments

Finally, we compared the variation of gene expression in the human colon cancer cells under the 1% DMSO control and various treatments with plant toxin gossypol, bacterial toxin LPS, and cottonseed-derived ethanol extracts. Figure 8 confirms that Bcl2 was the most stable gene among the 55 targets with standard deviations of 1.08 and 1.08 for DMSO control (mean of 24 independent samples) and treatment (mean of 168 independent samples). The standard deviations of Gapdh Cq were 4.01 (DMSO control) and 3.57 (treatment) and those of Rpl32 Cq were 3.68 (DMSO control) and 3.07 (treatment) (Figure 8). All of the other mRNAs had larger standard deviations of Cq than Bcl2 Cq (Figure 8). These qPCR data analyses further support the above conclusion that Bcl2 gene is stably expressed at the mRNA level in human colon cancer cells regardless of the treatment.

3. Discussion

Cottonseed is a low-value commodity and contributes to approximately 20% of the cotton value. Cottonseed value could be increased by serving as a cheap source of high-value bioactive materials for improving nutrition and preventing diseases. However, molecular evidence to support cottonseed bioactivity in mammalian cells is not substantial.
qPCR is widely used to evaluate the bioactivity of natural products at the gene expression level. However, many factors affect the calculation of gene expression data due to the inherited variations of gene expression among individual organisms, various tissues, different experimental stages, and RNA stability. It is also affected by experimental variations such as RNA extraction methods and cDNA preparations, and human errors [44,46]. Therefore, the selection of stably expressed internal reference genes is a critical task for qPCR assay design for normalizing transcript levels of test genes during the post-qPCR data analysis [48,49].
The hallmark of qPCR reference gene selection is that a reference gene should be stably expressed without much variation by experimental conditions and ideally its expression level is like those of the target genes [45,97]. A lower standard deviation of Cq among the treatments indicates a more stable expression of the gene which could serve as a better internal reference. In this study, we used the qPCR method to screen reference genes from 55 genes involved in glucose transport, lipid biosynthesis, inflammatory response, and cancer development using human colon cancer cells treated with multiple concentrations of plant toxin gossypol, bacterial toxin LPS, and bioactive cottonseed extracts. Our results consistently showed that Bcl2 is a very stably expressed gene with minimal variation and expressed at adequate mRNA levels similar to most of the other gene targets. On the other hand, two widely used reference genes (Gapdh or Rpl32) were the most abundantly expressed genes with much larger variations among the treatments. These expression differences among them make Bcl2 rather than Gapdh or Rpl32 a preferable qPCR reference for colon cancer cells. These conclusions were confirmed by various comparisons between gossypol and LPS, glanded and glandless seed extracts, seed coat and kernel extracts, or treatment for 8 and 24 h. A previous study analyzed the effect of gossypol on gene expression in human colon cancer cells, using Bcl2 as the reference gene [26]. The current study is technically oriented rather than looking at the regulation of specific genes with specific agents. This study has analyzed much larger data sets with a broader new view. The comparisons among the treatments are also much more comprehensive. All of the data support the conclusion that Bcl2 is a preferable reference gene for qPCR assay of gene expression in human colon cancer cells.
Our current results firmly support the conclusion that Bcl2 is a preferable reference gene for qPCR assay of gene expression in human colon cancer cells treated with cottonseed molecules and bacterial endotoxin LPS. This conclusion is drawn from extensive qPCR data with 55 genes analyzed and 192 individual samples (64 treatments with triplicate for each treatment) for each gene for a total of 10,560 Cq values. Since our study used regulatory molecules ranging from plant toxin gossypol to bacterial endotoxin LPS as well as bioactive cottonseed mixtures, it is expected that the technical advance should be applicable to evaluating a wide range of biomolecules’ modulation of gene expression in the human colon cancer cells. However, further research is required if Bcl2 is a preferable reference gene for qPCR assay of gene expression in other cell lines since responses of stimuli on gene expression are widely different in different cell types.
Our extensive qPCR results support the conclusion that the Bcl2 gene is stably expressed at the mRNA level in human colon cancer cells regardless of the treatment with plant toxin gossypol, bacterial endotoxin LPS, or cottonseed-derived bioactive extracts. However, a number of previous studies reported the regulation of Bcl2 gene expression in other testing systems, even though the findings in those reports were mostly generated by less sensitive methods such as immunoblotting, immunostaining, and end-point PCR techniques. For example, Western blotting showed that Bcl2 protein levels in colorectal cancer HCT-116 cells were reduced to less than half of the control by 5 days of treatment with 25–100 µg/mL of 3,6-anhydro-L-galactose derived from red seaweed agarose [98]. Similarly, fermented Pu-erh tea (Xiaguan bowl tea [X]) decreased Bcl2 gene expression in HT-29 colon cancer cells [99]. In situ hybridization and immunostaining showed that tea polyphenol treatment significantly reduced the percentage of Bcl2 expressing cells and reduced the level of Bcl2 mRNA and protein in the Bcl2 positive cells in lung preneoplastic lesions of Sprague Dawley rats [100]. Curcumin (diferuloylmethane), the yellow pigment in turmeric (Curcuma longa), at 25 µM for 4 h suppressed NFκB-regulated gene products (Bcl2, BclxL, Cox2, cyclin D1, and inhibitor of apoptosis protein-2) in HCT-116 cells [101]. Western blotting showed that curcumin treatment at 20 µM for 24 h but not 6 h or 12 h inhibited the expression of Bcl2 by about 50% in COLO 205 cells [102]. Regular end-point PCR showed that methanol extract from the plant Drimia calcarata significantly downregulated Bcl2 gene expression in both Caco-2 and HT-29 cells [103]. Finally, Western blot and qPCR showed that treatment with berberine (40 μM), a natural isoquinoline alkaloid derived from Berberis genus plants, decreased the expression of Bcl2 protein but not mRNA in human colorectal cancer cell lines HT-29 and HCT-116 [104]. Taken together, all of the above results strongly suggest that Bcl2 gene expression is not regulated at the mRNA level but at the post-transcriptional level.
In conclusion, this study identified Bcl2 as a preferable reference gene for qPCR assays in human colon cancer cells treated with cottonseed-derived gossypol and bioactive extracts as well as LPS. Our extensive qPCR results firmly support the conclusion that the Bcl2 gene is stably expressed at the mRNA level in human colon cancer cells regardless of the treatment with plant toxin gossypol, bacterial endotoxin LPS, or cottonseed-derived bioactive extracts, suggesting that Bcl2 gene expression is not regulated at the mRNA level but at the post-transcriptional level. These results should facilitate studies designated to evaluate the bioactivity of cottonseed molecules and other natural and synthetic molecules for nutrition and health uses.

4. Materials and Methods

4.1. Colon Cancer Cell Line

American Type Culture Collection (Manassas, VA, USA) provided the human colon cancer cell line (COLO 205-ATCC CCL-222). For long-term storage, the cells were kept under liquid nitrogen vapor in a cryogenic storage vessel (Thermo Fisher Scientific, Waltham, MA, USA). During the experiment, the cells were maintained at 37 °C in a humidified incubator with 5% CO2 in RPMI-1640 medium (Gibco, Life Technologies, Carlsbad, CA, USA) supplemented with 10% (v:v) fetal bovine serum, 0.1 million units/L penicillin, 100 mg/L streptomycin, and 2 mmol/L L-glutamine.

4.2. Gossypol, LPS, and Cottonseed Extracts

Gossypol (molar mass: 518.56 g/mol) was purified from cottonseed by HPLC (Sigma, St. Louis, MO, USA). LPS was extracted from E. coli serotype K235 and purified by gel filtration (Sigma, St. Louis, MO, USA). Cottonseed extracts were isolated by fractionation, defatting, and ethanol extraction from cottonseed coats and kernels of glanded and glandless seeds [1]. Briefly, the cottonseed coat or kernel was ground into a fine powder and homogenized. The kernel fraction was defatted with chloroform and hexane. The coat fraction was treated with acetic acid followed by autoclave and centrifugation. The defatted materials were extracted with ethanol followed by evaporation to remove acetic acid and ethanol. Ethanol extracts were reconstituted in 100% DMSO (100 mg/mL) (Sigma, St. Louis, MO, USA) and analyzed by HPLC-MS. The ethanol extracts contained trace amounts of gossypol (0.82 ng gossypol/mg extract in glanded seed coat, 0.03 ng gossypol/mg extract in glanded seed kernel, 0.37 ng gossypol/mg extract in glandless seed coat, and 0 ng gossypol/mg extract in glandless seed kernel) [1]. Gossypol, LPS, and cottonseed extract stocks were prepared in 100% DMSO and diluted before use.

4.3. Reagents and Equipment

Tissue culture reagents (RPMI-1640, fetal bovine serum, penicillin, streptomycin, and L-glutamine) were from Gibco BRL. The tissue culture incubator (water jacket CO2 incubator, Forma Series II, Model 3100 Series) was from Thermo Fisher. The tissue culture workstation (Logic+ A2 hood) was from Labconco (Kansas City, MO, USA). Tissue culture plastic (flasks, plates, cell scraper) was from CytoOne (USA Scientific, Ocala, FL, USA). Cell counting reagent (trypsin blue dye), slides (dual chamber), counter (TC20 Automatic Cell Counter), and microscope (Zoe Florescent Cell Imager) were from Bio-Rad (Hercules, CA, USA). The microplate spectrophotometer (Epoch) was from BioTek Instruments (Winooski, VT, USA).

4.4. Cell Culture and Chemical Treatment

Cancer cells were dissociated from the T-75 flask with 0.25% (w/v) trypsin−0.53 mM EDTA solution, stained with an equal volume of 0.4% trypsin blue dye before counting the number of live cells with a TC20 Automatic Cell Counter. Cancer cells (0.5 mL) from trypsin-dissociated flasks were subcultured at approximately 1 × 10⁵ cells/mL density in 24-well tissue culture plates. The cancer cells were routinely observed under a Zoe Florescent Cell Imager before and during the treatment. Cancer cells in 24-well plates (triplicate for every treatment) were treated with gossypol (0, 0.1, 0.5, 1, 5, 10, 50, and 100 µg/mL), LPS (0, 5, 10, 20, 50, 100, 500, and 1000 ng/mL), or ethanol extracts (0, 5, 10, 20, 30, 40, 50, and 100 µg/mL) for 8 and 24 h. The experimental control “0” treatment corresponded to 1% DMSO present in all of the culture mediums. Gossypol concentrations were in the range of previously published concentrations for gossypol (up to 100 µM) [23,25,105], (-) gossypol (up to 100 µM) [106], apogossypolone (up to 40 µM) [107], and gossypol derivatives (IC50 concentrations of 6–28 µM) [108].

4.5. Real-Time qPCR Primers and Probes

The selection of 55 genes for qPCR analysis was based on the literature showing those gene expressions regulated by TTP, gossypol, or cinnamon extract in cancer cells and macrophages (relevant references are listed in the right column in Table 1). RNA sequences were obtained from the National Center for Biotechnology Information (NCBI)’s non-redundant protein sequence databases (http://blast.ncbi.nlm.nih.gov/Blast.cgi). The qPCR primers were designed with Primer Express 3.0 software (Applied Biosystems, Foster City, CA, USA) using the default parameter values including amplicon length (50 to 150 bases for optimum PCR efficiency), optimal primer length (20 bases), Tm (58 °C to 60 °C), % GC (30% to 80%), 3′ end (the last five nucleotides at the 3′ end contain no more than two G + C residues), and repeating oligonucleotides (void runs of identical nucleotides; if repeats are present, there must be fewer than four consecutive G residues). The primers were synthesized by Biosearch Technologies, Inc. (Navato, CA, USA). The names of mRNAs and their nucleotide sequences (5′ to 3′) of the forward primers and reverse primers, and corresponding references are described in Table 1.

4.6. RNA Isolation and cDNA Synthesis

RNA isolation and cDNA synthesis were essentially as described [13]. Human colon cancer cells in 24-well plates treated with various concentrations of gossypol, LPS, or cottonseed extracts for 8 h (triplicate in every concentration). The dishes were washed twice with 1 mL 0.9% NaCl and lysed directly with 1 mL of TRIZOL reagent (Invitrogen, Carlsbad, CA, USA). RNA was isolated according to the manufacturer’s instructions without DNase treatment and stored in a −80 °C freezer. RNA concentrations were quantified with an Implen NanoPhotometer (Munchen, Germany). The mean and standard deviations of A260/A280 for the 192 independent RNA samples was 1.73 ± 0.17, indicating some contaminations of the RNA samples with protein, phenol, or other contaminants that have an absorbance close to 280 nm. RNA quality was evaluated by electrophoretic gel and electropherogram analyses. In our typical analysis, RNA isolated from mammalian cells with the Trizol reagent without DNase treatment resulted in high-quality RNA as evidenced by sharp 28S and 18S rRNA bands on electrophoretic gel and sharp peaks on electropherogram [109]. The total RNA was used to synthesize cDNAs using SuperScript II reverse transcriptase at 42 °C for 50 min. The cDNA synthesis mixture (20 μL) contained 5 μg total RNA, 2.4 μg oligo(dT)12–18 primer, 0.1 μg random primers, 500 μM dNTPs, 10 mM DTT, 40 u RNaseOUT and 200 u SuperScript II reverse transcriptase in 1X first-strand synthesis buffer (Life Technologies, Carlsbad, CA, USA). The cDNA was stored in a −80 °C freezer and diluted with water to 1 ng/µL before qPCR analyses.

4.7. Quantitative Real-Time PCR Analysis

The qPCR assays followed the MIQE guidelines: minimum information for publication of quantitative real-time PCR experiments [46]. The qPCR assays were described in detail previously [26]. The qPCR efficiency was performed with variable amounts of template cDNA concentrations (0, 0.05, 0.5, 2.5, 5, 12.5, and 25 ng) essentially as described [109]. The correlation coefficiencies between Cq and cDNA concentration were over 0.99 for the BCL2 gene and tested genes. SYBR Green qPCR reaction mixture (12.5 μL) contained 5 ng of total RNA-derived cDNA, 200 nM each of the forward primer and reverse primer, and 1× iQ SYBR Green Supermix (Bio-Rad Laboratories, Hercules, CA, USA). The reactions in 96-well clear plates sealed by adhesives were performed with CFX96 real-time system-C1000 Thermal Cycler (Bio-Rad Laboratories, Hercules, CA, USA). The thermal cycle conditions were as follows: 3 min at 95 °C, followed by 40 cycles at 95 °C for 10 s, 65 °C for 30 s and 72 °C for 30 s. The specificity of qPCR products was evaluated by melt curve analysis and 3% agarose gel electrophoresis as described [109]. Primer pair specificity for cDNA was evident from the analysis of qPCR products with sharp peaks on the melt curve and a single band on the electrophoretic gel.

4.8. Data Analysis and Statistics

qPCR data (10,560 Cq values) were generated from 55 genes analyzed and 64 treatments with triplicate per treatment for each gene. The data in the figures and tables represent the mean and standard deviation of 24–192 independent samples.

Author Contributions

Conceptualization, H.C.; methodology, H.C. and K.S.; validation, H.C. and K.S.; investigation, H.C. and K.S.; data curation, H.C.; writing—original draft preparation, H.C.; writing—review and editing, H.C.; supervision, H.C.; project administration, H.C.; funding acquisition, H.C. All authors have read and agreed to the published version of the manuscript.

Funding

This work was supported by the USDA-ARS Quality and Utilization of Agricultural Products National Program 306 through ARS Research Projects 6054-41000-103-00-D and 6054-41000-113-00-D. Mention of trade names or commercial products in this publication is solely for the purpose of providing specific information and does not imply recommendation or endorsement by the U.S. Department of Agriculture. USDA is an equal opportunity provider and employer.

Institutional Review Board Statement

Not applicable.

Informed Consent Statement

Not applicable.

Data Availability Statement

The datasets generated during the current study are available in the NIH Gene Expression Omnibus (GEO) Database, accession number GSE200980, GSE203027, GSE204818, and GSE204820.

Acknowledgments

We thank Thomas Klasson for his general support of the research.

Conflicts of Interest

The authors declare no conflict of interest.

Sample Availability

Samples of the compounds are available from the authors.

References

  1. Cao, H.; Sethumadhavan, K.; Bland, J.M. Isolation of cottonseed extracts that affect human cancer cell growth. Sci. Rep. 2018, 8, 10458. [Google Scholar] [CrossRef] [PubMed] [Green Version]
  2. Pons, W.A.; Hoffpauir, C.L.; Hopper, T.H. Gossypol in Cottonseed, Influence of Variety of Cottonseed and Environment. J. Agric. Food Chem. 1953, 1, 1115–1118. [Google Scholar] [CrossRef]
  3. Cao, H.; Sethumadhavan, K. Cottonseed bioactive compounds and peptides. In Proceedings of the 2020 Beltwide Cotton Conferences, Austin, TX, USA, 8–10 January 2020; National Cotton Council of America: Cordova, TN, USA; pp. 270–281. [Google Scholar]
  4. Piccinelli, A.L.; Veneziano, A.; Passi, S.; Simone, F.D.; Rastrelli, L. Flavonol glycosides from whole cottonseed by-product. Food Chem. 2007, 100, 344–349. [Google Scholar] [CrossRef]
  5. Wang, X.; Howell, C.P.; Chen, F.; Yin, J.; Jiang, Y. Gossypol—A polyphenolic compound from cotton plant. Adv. Food Nutr. Res. 2009, 58, 215–263. [Google Scholar] [CrossRef]
  6. He, Z.; Zhang, D.; Olanya, O.M. Antioxidant activities of the water-soluble fractions of glandless and glanded cottonseed protein. Food Chem. 2020, 325, 126907. [Google Scholar] [CrossRef]
  7. He, Z.; Nam, S.; Zhang, H.; Olanya, O.M. Chemical Composition and Thermogravimetric Behaviors of Glanded and Glandless Cottonseed Kernels. Molecules 2022, 27, 316. [Google Scholar] [CrossRef]
  8. Song, W.; Kong, X.; Hua, Y.; Li, X.; Zhang, C.; Chen, Y. Antioxidant and antibacterial activity and in vitro digestion stability of cottonseed protein hydrolysates. LWT 2020, 118, 108724. [Google Scholar] [CrossRef]
  9. He, Z.; Zhang, D.; Mattison, C.P. Quantitative comparison of the storage protein distribution in glandless and glanded cottonseeds. Agric. Environ. Lett. 2022, 7, e20076. [Google Scholar] [CrossRef]
  10. He, Z.; Liu, S.; Nam, S.; Klasson, K.T.; Cheng, H.N. Molecular level characterization of the effect of roasting on the extractable components of glandless cottonseed by Fourier transform ion cyclotron resonance mass spectrometry. Food Chem. 2022, 403, 134404. [Google Scholar] [CrossRef]
  11. Randel, R.D.; Chase, C.C., Jr.; Wyse, S.J. Effects of gossypol and cottonseed products on reproduction of mammals. J. Anim. Sci. 1992, 70, 1628–1638. [Google Scholar] [CrossRef]
  12. Zhang, L.M.; Zhang, Y.Z.; Liu, Y.Q.; Gong, Z.H.; Zhao, Y.M.; Li, Y.F. CTN-986, a compound extracted from cottonseeds, increases cell proliferation in hippocampus in vivo and in cultured neural progenitor cells in vitro. Eur. J. Pharmacol. 2009, 607, 110–113. [Google Scholar] [CrossRef] [PubMed]
  13. Cao, H.; Sethumadhavan, K. Cottonseed extracts and gossypol regulate diacylglycerol acyltransferase gene expression in mouse macrophages. J. Agric. Food Chem. 2018, 66, 6022–6030. [Google Scholar] [CrossRef]
  14. Kong, X.; Song, W.; Hua, Y.; Li, X.; Chen, Y.; Zhang, C.; Chen, Y. Insights into the antibacterial activity of cottonseed protein-derived peptide against Escherichia coli. Food Funct. 2020, 11, 10047–10057. [Google Scholar] [CrossRef] [PubMed]
  15. Wang, L.; Ma, M.; Yu, Z.; Du, S.K. Preparation and identification of antioxidant peptides from cottonseed proteins. Food Chem. 2021, 352, 129399. [Google Scholar] [CrossRef]
  16. Cao, H.; Qin, B.; Panickar, K.S.; Anderson, R.A. Tea and cinnamon polyphenols improve the metabolic syndrome. Agro Food Ind. Hi-Tech 2008, 19, 14–17. [Google Scholar]
  17. Hu, Q.; Liao, W.; Zhang, Z.; Shi, S.; Hou, S.; Ji, N.; Zhang, X.; Zhang, Q.; Liao, Y.; Li, L.; et al. The hepatoprotective effects of plant-based foods based on the “gut-liver axis”: A prospective review. Crit. Rev. Food Sci. Nutr. 2022, 1–27. [Google Scholar] [CrossRef] [PubMed]
  18. Hazafa, A.; Rehman, K.U.; Jahan, N.; Jabeen, Z. The Role of Polyphenol (Flavonoids) Compounds in the Treatment of Cancer Cells. Nutr. Cancer 2020, 72, 386–397. [Google Scholar] [CrossRef] [PubMed]
  19. Long, J.; Guan, P.; Hu, X.; Yang, L.; He, L.; Lin, Q.; Luo, F.; Li, J.; He, X.; Du, Z.; et al. Natural Polyphenols as Targeted Modulators in Colon Cancer: Molecular Mechanisms and Applications. Front. Immunol. 2021, 12, 635484. [Google Scholar] [CrossRef] [PubMed]
  20. Mileo, A.M.; Nistico, P.; Miccadei, S. Polyphenols: Immunomodulatory and Therapeutic Implication in Colorectal Cancer. Front. Immunol. 2019, 10, 729. [Google Scholar] [CrossRef]
  21. Kenar, J.A. Reaction chemistry of gossypol and its derivatives. J. Am. Oil Chem. Soc. 2006, 83, 269–302. [Google Scholar] [CrossRef]
  22. Liu, S.; Kulp, S.K.; Sugimoto, Y.; Jiang, J.; Chang, H.L.; Dowd, M.K.; Wan, P.; Lin, Y.C. The (-)-enantiomer of gossypol possesses higher anticancer potency than racemic gossypol in human breast cancer. Anticancer Res. 2002, 22, 33–38. [Google Scholar] [PubMed]
  23. Messeha, S.S.; Zarmouh, N.O.; Mendonca, P.; Alwagdani, H.; Cotton, C.; Soliman, K.F.A. Effects of gossypol on apoptosis-related gene expression in racially distinct triple-negative breast cancer cells. Oncol. Rep. 2019, 42, 467–478. [Google Scholar] [CrossRef] [PubMed]
  24. Zhong, S.; Leong, J.; Ye, W.; Xu, P.; Lin, S.H.; Liu, J.Y.; Lin, Y.C. (-)-Gossypol-enriched cottonseed oil inhibits proliferation and adipogenesis of human breast pre-adipocytes. Anticancer Res. 2013, 33, 949–955. [Google Scholar] [PubMed]
  25. Chien, C.C.; Ko, C.H.; Shen, S.C.; Yang, L.Y.; Chen, Y.C. The role of COX-2/PGE2 in gossypol-induced apoptosis of colorectal carcinoma cells. J. Cell Physiol. 2012, 227, 3128–3137. [Google Scholar] [CrossRef]
  26. Cao, H.; Sethumadhavan, K.; Cao, F.; Wang, T.T.Y. Gossypol decreased cell viability and down-regulated the expression of a number of genes in human colon cancer cells. Sci. Rep. 2021, 11, 5922. [Google Scholar] [CrossRef]
  27. Yuan, Y.; Tang, A.J.; Castoreno, A.B.; Kuo, S.Y.; Wang, Q.; Kuballa, P.; Xavier, R.; Shamji, A.F.; Schreiber, S.L.; Wagner, B.K. Gossypol and an HMT G9a inhibitor act in synergy to induce cell death in pancreatic cancer cells. Cell Death Dis. 2013, 4, e690. [Google Scholar] [CrossRef] [Green Version]
  28. Thakur, A.; Lum, L.G.; Schalk, D.; Azmi, A.; Banerjee, S.; Sarkar, F.H.; Mohommad, R. Pan-Bcl-2 inhibitor AT-101 enhances tumor cell killing by EGFR targeted T cells. PLoS ONE 2012, 7, e47520. [Google Scholar] [CrossRef] [Green Version]
  29. Pang, X.; Wu, Y.; Wu, Y.; Lu, B.; Chen, J.; Wang, J.; Yi, Z.; Qu, W.; Liu, M. (-)-Gossypol suppresses the growth of human prostate cancer xenografts via modulating VEGF signaling-mediated angiogenesis. Mol. Cancer Ther. 2011, 10, 795–805. [Google Scholar] [CrossRef] [Green Version]
  30. Huang, Y.W.; Wang, L.S.; Dowd, M.K.; Wan, P.J.; Lin, Y.C. (-)-Gossypol reduces invasiveness in metastatic prostate cancer cells. Anticancer Res. 2009, 29, 2179–2188. [Google Scholar]
  31. Huo, M.; Gao, R.; Jiang, L.; Cui, X.; Duan, L.; Deng, X.; Guan, S.; Wei, J.; Soromou, L.W.; Feng, H.; et al. Suppression of LPS-induced inflammatory responses by gossypol in RAW 264.7 cells and mouse models. Int. Immunopharmacol. 2013, 15, 442–449. [Google Scholar] [CrossRef]
  32. Mellon, J.E.; Zelaya, C.A.; Dowd, M.K.; Beltz, S.B.; Klich, M.A. Inhibitory effects of gossypol, gossypolone, and apogossypolone on a collection of economically important filamentous fungi. J. Agric. Food Chem. 2012, 60, 2740–2745. [Google Scholar] [CrossRef] [PubMed]
  33. Prior, R.L.; Gu, L. Occurrence and biological significance of proanthocyanidins in the American diet. Phytochemistry 2005, 66, 2264–2280. [Google Scholar] [CrossRef] [PubMed]
  34. Cao, H.; Hininger-Favier, I.; Kelly, M.A.; Benaraba, R.; Dawson, H.D.; Coves, S.; Roussel, A.M.; Anderson, R.A. Green tea polyphenol extract regulates the expression of genes involved in glucose uptake and insulin signaling in rats fed a high fructose diet. J. Agric. Food Chem. 2007, 55, 6372–6378. [Google Scholar] [CrossRef] [PubMed]
  35. Cao, H.; Kelly, M.A.; Kari, F.; Dawson, H.D.; Urban, J.F., Jr.; Coves, S.; Roussel, A.M.; Anderson, R.A. Green tea increases anti-inflammatory tristetraprolin and decreases pro-inflammatory tumor necrosis factor mRNA levels in rats. J. Inflamm. 2007, 4, 1. [Google Scholar] [CrossRef] [PubMed]
  36. Cao, H.; Anderson, R.A. Cinnamon polyphenol extract regulates tristetraprolin and related gene expression in mouse adipocytes. J. Agric. Food Chem. 2011, 59, 2739–2744. [Google Scholar] [CrossRef]
  37. Cao, H.; Graves, D.J.; Anderson, R.A. Cinnamon extract regulates glucose transporter and insulin-signaling gene expression in mouse adipocytes. Phytomedicine 2010, 17, 1027–1032. [Google Scholar] [CrossRef]
  38. Cao, H.; Polansky, M.M.; Anderson, R.A. Cinnamon extract and polyphenols affect the expression of tristetraprolin, insulin receptor, and glucose transporter 4 in mouse 3T3-L1 adipocytes. Arch. Biochem. Biophys. 2007, 459, 214–222. [Google Scholar] [CrossRef]
  39. Cao, H.; Urban, J.F., Jr.; Anderson, R.A. Cinnamon polyphenol extract affects immune responses by regulating anti- and proinflammatory and glucose transporter gene expression in mouse macrophages. J. Nutr. 2008, 138, 833–840. [Google Scholar] [CrossRef] [Green Version]
  40. Cao, H.; Sethumadhavan, K.; Li, K.; Boue, S.M.; Anderson, R.A. Cinnamon polyphenol extract and insulin regulate diacylglycerol acyltransferase gene expression in mouse adipocytes and macrophages. Plant Foods Hum. Nutr. 2019, 74, 115–121. [Google Scholar] [CrossRef]
  41. Cao, H.; Sethumadhavan, K. Gossypol but not cottonseed extracts or lipopolysaccharides stimulates HuR gene expression in mouse cells. J. Funct. Foods 2019, 59, 25–29. [Google Scholar] [CrossRef]
  42. Cao, H.; Sethumadhavan, K. Regulation of cell viability and anti-inflammatory tristetraprolin family gene expression in mouse macrophages by cottonseed extracts. Sci. Rep. 2020, 10, 775. [Google Scholar] [CrossRef] [Green Version]
  43. Rietschel, E.T.; Kirikae, T.; Schade, F.U.; Mamat, U.; Schmidt, G.; Loppnow, H.; Ulmer, A.J.; Zähringer, U.; Seydel, U.; Di Padova, F.; et al. Bacterial endotoxin: Molecular relationships of structure to activity and function. FASEB J. 1994, 8, 217–225. [Google Scholar] [CrossRef] [PubMed]
  44. Bustin, S.A. Quantification of mRNA using real-time reverse transcription PCR (RT-PCR): Trends and problems. J. Mol. Endocrinol. 2002, 29, 23–39. [Google Scholar] [CrossRef] [PubMed]
  45. Cao, H.; Cao, F.; Klasson, K.T. Characterization of reference gene expression in tung tree (Vernicia fordii). Ind. Crops Prod. 2013, 50, 248–255. [Google Scholar] [CrossRef]
  46. Bustin, S.A.; Benes, V.; Garson, J.A.; Hellemans, J.; Huggett, J.; Kubista, M.; Mueller, R.; Nolan, T.; Pfaffl, M.W.; Shipley, G.L.; et al. The MIQE guidelines: Minimum information for publication of quantitative real-time PCR experiments. Clin. Chem. 2009, 55, 611–622. [Google Scholar] [CrossRef] [Green Version]
  47. Bustin, S.A.; Benes, V.; Nolan, T.; Pfaffl, M.W. Quantitative real-time RT-PCR—A perspective. J. Mol. Endocrinol. 2005, 34, 597–601. [Google Scholar] [CrossRef] [Green Version]
  48. Livak, K.J.; Schmittgen, T.D. Analysis of relative gene expression data using real-time quantitative PCR and the 2−∆∆CT Method. Methods 2001, 25, 402–408. [Google Scholar] [CrossRef]
  49. Pfaffl, M.W. A new mathematical model for relative quantification in real-time RT-PCR. Nucleic Acids Res. 2001, 29, e45. [Google Scholar] [CrossRef]
  50. Udvardi, M.K.; Czechowski, T.; Scheible, W.R. Eleven golden rules of quantitative RT-PCR. Plant Cell 2008, 20, 1736–1737. [Google Scholar] [CrossRef] [Green Version]
  51. Lejeune, P.; Reisser, D.; Onier, N.; Lagadec, P.; Lindley, I.; Jeannin, J.F. Interleukin-8 has antitumor effects in the rat which are not associated with polymorphonuclear leukocyte cytotoxicity. Cancer Immunol. Immunother. 1994, 38, 167–170. [Google Scholar] [CrossRef]
  52. Yoshioka, T.; Morimoto, Y.; Iwagaki, H.; Itoh, H.; Saito, S.; Kobayashi, N.; Yagi, T.; Tanaka, N. Bacterial lipopolysaccharide induces transforming growth factor beta and hepatocyte growth factor through toll-like receptor 2 in cultured human colon cancer cells. J. Int. Med. Res. 2001, 29, 409–420. [Google Scholar] [CrossRef] [PubMed]
  53. Ikebe, M.; Kitaura, Y.; Nakamura, M.; Tanaka, H.; Yamasaki, A.; Nagai, S.; Wada, J.; Yanai, K.; Koga, K.; Sato, N.; et al. Lipopolysaccharide (LPS) increases the invasive ability of pancreatic cancer cells through the TLR4/MyD88 signaling pathway. J. Surg.Oncol. 2009, 100, 725–731. [Google Scholar] [CrossRef] [PubMed]
  54. Liu, W.T.; Jing, Y.Y.; Yan, F.; Han, Z.P.; Lai, F.B.; Zeng, J.X.; Yu, G.F.; Fan, Q.M.; Li, R.; Zhao, Q.D.; et al. LPS-induced CXCR4-dependent migratory properties and a mesenchymal-like phenotype of colorectal cancer cells. Cell Adhes. Migr. 2017, 11, 13–23. [Google Scholar] [CrossRef] [PubMed] [Green Version]
  55. Lee, H.H.; Kim, W.T.; Kim, D.H.; Park, J.W.; Kang, T.H.; Chung, J.W.; Leem, S.H. Tristetraprolin suppresses AHRR expression through mRNA destabilization. FEBS Lett. 2013, 587, 1518–1523. [Google Scholar] [CrossRef] [Green Version]
  56. Kitada, S.; Kress, C.L.; Krajewska, M.; Jia, L.; Pellecchia, M.; Reed, J.C. Bcl-2 antagonist apogossypol (NSC736630) displays single-agent activity in Bcl-2-transgenic mice and has superior efficacy with less toxicity compared with gossypol (NSC19048). Blood 2008, 111, 3211–3219. [Google Scholar] [CrossRef] [PubMed] [Green Version]
  57. Frevel, M.A.; Bakheet, T.; Silva, A.M.; Hissong, J.G.; Khabar, K.S.; Williams, B.R. p38 Mitogen-activated protein kinase-dependent and -independent signaling of mRNA stability of AU-rich element-containing transcripts. Mol. Cell. Biol. 2003, 23, 425–436. [Google Scholar] [CrossRef] [PubMed] [Green Version]
  58. Xu, L.; Ning, H.; Gu, L.; Wang, Q.; Lu, W.; Peng, H.; Cui, W.; Ying, B.; Ross, C.R.; Wilson, G.M.; et al. Tristetraprolin induces cell cycle arrest in breast tumor cells through targeting AP-1/c-Jun and NF-kappaB pathway. Oncotarget 2015, 6, 41679–41691. [Google Scholar] [CrossRef] [Green Version]
  59. Sharma, A.; Bhat, A.A.; Krishnan, M.; Singh, A.B.; Dhawan, P. Trichostatin-A modulates claudin-1 mRNA stability through the modulation of Hu antigen R and tristetraprolin in colon cancer cells. Carcinogenesis 2013, 34, 2610–2621. [Google Scholar] [CrossRef] [Green Version]
  60. Warzych, E.; Wolc, A.; Cieslak, A.; Lechniak-Cieslak, D. 217 transcript abundance of cathepsin genes in cumulus cells as a marker of cattle oocyte quality. Reprod. Fertil. Dev. 2012, 25, 257. [Google Scholar] [CrossRef]
  61. Sawaoka, H.; Dixon, D.A.; Oates, J.A.; Boutaud, O. Tristetraprolin binds to the 3’-untranslated region of cyclooxygenase-2 mRNA. A polyadenylation variant in a cancer cell line lacks the binding site. J. Biol. Chem. 2003, 278, 13928–13935. [Google Scholar] [CrossRef] [Green Version]
  62. Lee, W.H.; Lee, H.H.; Vo, M.T.; Kim, H.J.; Ko, M.S.; Im, Y.C.; Min, Y.J.; Lee, B.J.; Cho, W.J.; Park, J.W. Casein kinase 2 regulates the mRNA-destabilizing activity of tristetraprolin. J. Biol. Chem. 2011, 286, 21577–21587. [Google Scholar] [CrossRef] [PubMed] [Green Version]
  63. Fuhrmann, D.C.; Tausendschon, M.; Wittig, I.; Steger, M.; Ding, M.G.; Schmid, T.; Dehne, N.; Brune, B. Inactivation of tristetraprolin in chronic hypoxia provokes the expression of cathepsin B. Mol. Cell Biol. 2015, 35, 619–630. [Google Scholar] [CrossRef] [PubMed]
  64. Datta, S.; Biswas, R.; Novotny, M.; Pavicic, P.G., Jr.; Herjan, T.; Mandal, P.; Hamilton, T.A. Tristetraprolin regulates CXCL1 (KC) mRNA stability. J. Immunol. 2008, 180, 2545–2552. [Google Scholar] [CrossRef] [Green Version]
  65. Ligueros, M.; Jeoung, D.; Tang, B.; Hochhauser, D.; Reidenberg, M.M.; Sonenberg, M. Gossypol inhibition of mitosis, cyclin D1 and Rb protein in human mammary cancer cells and cyclin-D1 transfected human fibrosarcoma cells. Br. J. Cancer 1997, 76, 21–28. [Google Scholar] [CrossRef] [PubMed] [Green Version]
  66. Dong, Y.; Mao, B.; Li, L.; Guan, H.; Su, Y.; Li, X.; Lian, Q.; Huang, P.; Ge, R.S. Gossypol enantiomers potently inhibit human placental 3beta-hydroxysteroid dehydrogenase 1 and aromatase activities. Fitoterapia 2015, 109, 132–137. [Google Scholar] [CrossRef]
  67. Ludwig, E.H.; Mahley, R.W.; Palaoglu, E.; Ozbayrakci, S.; Balestra, M.E.; Borecki, I.B.; Innerarity, T.L.; Farese, R.V., Jr. DGAT1 promoter polymorphism associated with alterations in body mass index, high density lipoprotein levels and blood pressure in Turkish women. Clin. Genet. 2002, 62, 68–73. [Google Scholar] [CrossRef]
  68. Dey, P.; Chakraborty, M.; Kamdar, M.R.; Maiti, M.K. Functional characterization of two structurally novel diacylglycerol acyltransferase2 isozymes responsible for the enhanced production of stearate-rich storage lipid in Candida tropicalis SY005. PLoS ONE 2014, 9, e94472. [Google Scholar] [CrossRef]
  69. Lee, H.H.; Lee, S.R.; Leem, S.H. Tristetraprolin regulates prostate cancer cell growth through suppression of E2F1. J. Microbiol. Biotechnol. 2014, 24, 287–294. [Google Scholar] [CrossRef] [Green Version]
  70. Florkowska, M.; Tymoszuk, P.; Balwierz, A.; Skucha, A.; Kochan, J.; Wawro, M.; Stalinska, K.; Kasza, A. EGF activates TTP expression by activation of ELK-1 and EGR-1 transcription factors. BMC Mol. Biol. 2012, 13, 8. [Google Scholar] [CrossRef] [Green Version]
  71. Chang, J.S.; Hsu, Y.L.; Kuo, P.L.; Chiang, L.C.; Lin, C.C. Upregulation of Fas/Fas ligand-mediated apoptosis by gossypol in an immortalized human alveolar lung cancer cell line. Clin. Exp. Pharmacol. Physiol. 2004, 31, 716–722. [Google Scholar] [CrossRef]
  72. Chen, D.; Pan, X.; Xiao, P.; Farwell, M.A.; Zhang, B. Evaluation and identification of reliable reference genes for pharmacogenomics, toxicogenomics, and small RNA expression analysis. J. Cell Physiol. 2011, 226, 2469–2477. [Google Scholar] [CrossRef]
  73. Fahling, M.; Persson, A.B.; Klinger, B.; Benko, E.; Steege, A.; Kasim, M.; Patzak, A.; Persson, P.B.; Wolf, G.; Bluthgen, N.; et al. Multilevel regulation of HIF-1 signaling by TTP. Mol. Biol. Cell 2012, 23, 4129–4141. [Google Scholar] [CrossRef] [PubMed]
  74. Kagami, S.; Kanari, H.; Suto, A.; Fujiwara, M.; Ikeda, K.; Hirose, K.; Watanabe, N.; Iwamoto, I.; Nakajima, H. HMG-CoA reductase inhibitor simvastatin inhibits proinflammatory cytokine production from murine mast cells. Int. Arch. Allergy Immunol. 2008, 146, 61–66. [Google Scholar] [CrossRef] [PubMed]
  75. Jamal, U.M.; Joe, Y.; Zheng, M.; Blackshear, P.J.; Ryter, S.W.; Park, J.W.; Chung, H.T. A functional link between heme oxygenase-1 and tristetraprolin in the anti-inflammatory effects of nicotine. Free Radic. Biol. Med. 2013, 65, 1331–1339. [Google Scholar] [CrossRef] [Green Version]
  76. Shi, J.X.; Li, J.S.; Hu, R.; Shi, Y.; Su, X.; Li, Q.; Zhang, F. CNOT7/hCAF1 is involved in ICAM-1 and IL-8 regulation by tristetraprolin. Cell Signal. 2014, 26, 2390–2396. [Google Scholar] [CrossRef] [PubMed]
  77. Su, N.Y.; Tsai, P.S.; Huang, C.J. Clonidine-Induced Enhancement of iNOS Expression Involves NF-kappaB. J. Surg. Res. 2008, 149, 131–137. [Google Scholar] [CrossRef]
  78. Ogilvie, R.L.; Abelson, M.; Hau, H.H.; Vlasova, I.; Blackshear, P.J.; Bohjanen, P.R. Tristetraprolin down-regulates IL-2 gene expression through AU-rich element-mediated mRNA decay. J. Immunol. 2005, 174, 953–961. [Google Scholar] [CrossRef] [Green Version]
  79. Hochdorfer, T.; Tiedje, C.; Stumpo, D.J.; Blackshear, P.J.; Gaestel, M.; Huber, M. LPS-induced production of TNF-alpha and IL-6 in mast cells is dependent on p38 but independent of TTP. Cell Signal. 2013, 25, 1339–1347. [Google Scholar] [CrossRef] [Green Version]
  80. Balakathiresan, N.S.; Bhattacharyya, S.; Gutti, U.; Long, R.P.; Jozwik, C.; Huang, W.; Srivastava, M.; Pollard, H.B.; Biswas, R. Tristetraprolin regulates IL-8 mRNA stability in cystic fibrosis lung epithelial cells. Am. J. Physiol.-Lung Cell. Mol. Physiol. 2009, 296, L1012–L1018. [Google Scholar] [CrossRef] [Green Version]
  81. Gaba, A.; Grivennikov, S.I.; Do, M.V.; Stumpo, D.J.; Blackshear, P.J.; Karin, M. Cutting edge: IL-10-mediated tristetraprolin induction is part of a feedback loop that controls macrophage STAT3 activation and cytokine production. J. Immunol. 2012, 189, 2089–2093. [Google Scholar] [CrossRef] [Green Version]
  82. Gu, L.; Ning, H.; Qian, X.; Huang, Q.; Hou, R.; Almourani, R.; Fu, M.; Blackshear, P.J.; Liu, J. Suppression of IL-12 production by tristetraprolin through blocking NF-kcyB nuclear translocation. J. Immunol. 2013, 191, 3922–3930. [Google Scholar] [CrossRef] [PubMed] [Green Version]
  83. Milke, L.; Schulz, K.; Weigert, A.; Sha, W.; Schmid, T.; Brune, B. Depletion of tristetraprolin in breast cancer cells increases interleukin-16 expression and promotes tumor infiltration with monocytes/macrophages. Carcinogenesis 2013, 34, 850–857. [Google Scholar] [CrossRef] [PubMed]
  84. Datta, S.; Novotny, M.; Pavicic, P.G., Jr.; Zhao, C.; Herjan, T.; Hartupee, J.; Hamilton, T. IL-17 regulates CXCL1 mRNA stability via an AUUUA/tristetraprolin-independent sequence. J. Immunol. 2010, 184, 1484–1491. [Google Scholar] [CrossRef] [PubMed] [Green Version]
  85. Xu, P.; Ye, W.; Zhong, S.; Li, H.; Feng, E.; Lin, S.H.; Kuo, C.T.; Liu, J.Y.; Lin, Y.C. Leptin and zeranol up-regulate cyclin D1 expression in primary cultured normal human breast pre-adipocytes. Mol. Med. Rep. 2010, 3, 983–990. [Google Scholar] [CrossRef]
  86. Voss, A.K.; Thomas, T.; Gruss, P. Compensation for a gene trap mutation in the murine microtubule-associated protein 4 locus by alternative polyadenylation and alternative splicing. Dev. Dyn. 1998, 212, 258–266. [Google Scholar] [CrossRef]
  87. Jiang, J.; Slivova, V.; Jedinak, A.; Sliva, D. Gossypol inhibits growth, invasiveness, and angiogenesis in human prostate cancer cells by modulating NF-kappaB/AP-1 dependent- and independent-signaling. Clin. Exp. Metastasis 2012, 29, 165–178. [Google Scholar] [CrossRef]
  88. Barba-Barajas, M.; Hernandez-Flores, G.; Lerma-Diaz, J.M.; Ortiz-Lazareno, P.C.; Dominguez-Rodriguez, J.R.; Barba-Barajas, L.; de Celis, R.; Jave-Suarez, L.F.; Aguilar-Lemarroy, A.C.; Guevara-Barraza, M.G.; et al. Gossypol induced apoptosis of polymorphonuclear leukocytes and monocytes: Involvement of mitochondrial pathway and reactive oxygen species. Immunopharmacol. Immunotoxicol. 2009, 31, 320–330. [Google Scholar] [CrossRef]
  89. Kim, H.K.; Kim, C.W.; Vo, M.T.; Lee, H.H.; Lee, J.Y.; Yoon, N.A.; Lee, C.Y.; Moon, C.H.; Min, Y.J.; Park, J.W.; et al. Expression of proviral integration site for Moloney murine leukemia virus 1 (Pim-1) is post-transcriptionally regulated by tristetraprolin in cancer cells. J. Biol. Chem. 2012, 287, 28770–28778. [Google Scholar] [CrossRef] [Green Version]
  90. Huang, Y.W.; Wang, L.S.; Chang, H.L.; Ye, W.; Dowd, M.K.; Wan, P.J.; Lin, Y.C. Molecular mechanisms of (-)-gossypol-induced apoptosis in human prostate cancer cells. Anticancer Res. 2006, 26, 1925–1933. [Google Scholar]
  91. Militello, R.D.; Munafo, D.B.; Beron, W.; Lopez, L.A.; Onier, S.; Oud, B.; Olombo, M.I.; Oloris, S.C. Rab24 is Required for Normal Cell Division. Traffic 2013, 14, 502–518. [Google Scholar] [CrossRef]
  92. Brattelid, T.; Winer, L.H.; Levy, F.O.; Liestol, K.; Sejersted, O.M.; Andersson, K.B. Reference gene alternatives to Gapdh in rodent and human heart failure gene expression studies. BMC Mol. Biol. 2010, 11, 22. [Google Scholar] [CrossRef] [PubMed] [Green Version]
  93. Yeow, W.S.; Baras, A.; Chua, A.; Nguyen, D.M.; Sehgal, S.S.; Schrump, D.S.; Nguyen, D.M. Gossypol, a phytochemical with BH3-mimetic property, sensitizes cultured thoracic cancer cells to Apo2 ligand/tumor necrosis factor-related apoptosis-inducing ligand. J. Thorac. Cardiovasc. Surg. 2006, 132, 1356–1362. [Google Scholar] [CrossRef] [PubMed] [Green Version]
  94. Gao, W.; Shen, Z.; Shang, L.; Wang, X. Upregulation of human autophagy-initiation kinase ULK1 by tumor suppressor p53 contributes to DNA-damage-induced cell death. Cell Death. Differ. 2011, 18, 1598–1607. [Google Scholar] [CrossRef] [PubMed]
  95. Essafi-Benkhadir, K.; Onesto, C.; Stebe, E.; Moroni, C.; Pages, G. Tristetraprolin inhibits ras-dependent tumor vascularization by inducing VEGF mRNA degradation. Mol. Biol. Cell 2007, 18, 4648–4658. [Google Scholar] [CrossRef] [PubMed] [Green Version]
  96. He, G.; Sun, D.; Ou, Z.; Ding, A. The protein Zfand5 binds and stabilizes mRNAs with AU-rich elements in their 3’-untranslated regions. J. Biol. Chem. 2012, 287, 24967–24977. [Google Scholar] [CrossRef] [Green Version]
  97. Cao, H.; Shockey, J.M. Comparison of TaqMan and SYBR Green qPCR methods for quantitative gene expression in tung tree tissues. J. Agric. Food Chem. 2012, 60, 12296–12303. [Google Scholar] [CrossRef]
  98. Yun, E.J.; Yu, S.; Kim, Y.A.; Liu, J.J.; Kang, N.J.; Jin, Y.S.; Kim, K.H. In Vitro Prebiotic and Anti-Colon Cancer Activities of Agar-Derived Sugars from Red Seaweeds. Mar. Drugs 2021, 19, 213. [Google Scholar] [CrossRef]
  99. Zhao, X.; Song, J.L.; Kim, J.D.; Lee, J.S.; Park, K.Y. Fermented Pu-erh tea increases in vitro anticancer activities in HT-29 cells and has antiangiogenetic effects on HUVECs. J. Environ. Pathol. Toxicol. Oncol. 2013, 32, 275–288. [Google Scholar] [CrossRef]
  100. Gu, Q.; Hu, C.; Chen, Q.; Xia, Y. Tea polyphenols prevent lung from preneoplastic lesions and effect p53 and bcl-2 gene expression in rat lung tissues. Int. J. Clin. Exp. Pathol. 2013, 6, 1523–1531. [Google Scholar]
  101. Sandur, S.K.; Deorukhkar, A.; Pandey, M.K.; Pabon, A.M.; Shentu, S.; Guha, S.; Aggarwal, B.B.; Krishnan, S. Curcumin modulates the radiosensitivity of colorectal cancer cells by suppressing constitutive and inducible NF-kappaB activity. Int. J. Radiat. Oncol. Biol. Phys. 2009, 75, 534–542. [Google Scholar] [CrossRef] [Green Version]
  102. Su, C.C.; Lin, J.G.; Li, T.M.; Chung, J.G.; Yang, J.S.; Ip, S.W.; Lin, W.C.; Chen, G.W. Curcumin-induced apoptosis of human colon cancer colo 205 cells through the production of ROS, Ca2+ and the activation of caspase-3. Anticancer Res. 2006, 26, 4379–4389. [Google Scholar] [PubMed]
  103. Laka, K.; Mapheto, K.B.F.; Mbita, Z. Selective in vitro cytotoxicity effect of Drimia calcarata bulb extracts against p53 mutant HT-29 and p53 wild-type Caco-2 colorectal cancer cells through STAT5B regulation. Toxicol. Rep. 2021, 8, 1265–1279. [Google Scholar] [CrossRef] [PubMed]
  104. Dai, W.; Mu, L.; Cui, Y.; Li, Y.; Chen, P.; Xie, H.; Wang, X. Berberine Promotes Apoptosis of Colorectal Cancer via Regulation of the Long Non-Coding RNA (lncRNA) Cancer Susceptibility Candidate 2 (CASC2)/AU-Binding Factor 1 (AUF1)/B-Cell CLL/Lymphoma 2 (Bcl-2) Axis. Med. Sci. Monit. 2019, 25, 730–738. [Google Scholar] [CrossRef] [PubMed]
  105. Ko, C.H.; Shen, S.C.; Yang, L.Y.; Lin, C.W.; Chen, Y.C. Gossypol reduction of tumor growth through ROS-dependent mitochondria pathway in human colorectal carcinoma cells. Int. J. Cancer 2007, 121, 1670–1679. [Google Scholar] [CrossRef]
  106. Lan, L.; Appelman, C.; Smith, A.R.; Yu, J.; Larsen, S.; Marquez, R.T.; Liu, H.; Wu, X.; Gao, P.; Roy, A.; et al. Natural product (-)-gossypol inhibits colon cancer cell growth by targeting RNA-binding protein Musashi-1. Mol.Oncol. 2015, 9, 1406–1420. [Google Scholar] [CrossRef]
  107. Hu, Z.Y.; Wang, J.; Cheng, G.; Zhu, X.F.; Huang, P.; Yang, D.; Zeng, Y.X. Apogossypolone targets mitochondria and light enhances its anticancer activity by stimulating generation of singlet oxygen and reactive oxygen species. Chin. J. Cancer 2011, 30, 41–53. [Google Scholar] [CrossRef] [Green Version]
  108. Yan, F.; Cao, X.X.; Jiang, H.X.; Zhao, X.L.; Wang, J.Y.; Lin, Y.H.; Liu, Q.L.; Zhang, C.; Jiang, B.; Guo, F. A novel water-soluble gossypol derivative increases chemotherapeutic sensitivity and promotes growth inhibition in colon cancer. J. Med. Chem. 2010, 53, 5502–5510. [Google Scholar] [CrossRef]
  109. Cao, H.; Cao, F.; Roussel, A.M.; Anderson, R.A. Quantitative PCR for glucose transporter and tristetraprolin family gene expression in cultured mouse adipocytes and macrophages. In Vitro Cell Dev. Biol. Anim. 2013, 49, 759–770. [Google Scholar] [CrossRef]
Figure 1. Cottonseed, cottonseed-derived gossypol and polyphenolic extracts, bacteria-derived LPS, and human colon cancer cells. (A) Cottonseed (glanded and glandless seed). Glanded seed contains numerous dark-green-colored gossypol glands. (B) Cottonseed-derived gossypol (molar mass: 518.56 g/mol). It contains 6 -OH groups and 6 -CH3 groups (image was taken from public domain, Gossypol—Wikipedia.) (C) Cottonseed-derived ethanol extracts. Cottonseed extracts were isolated by fractionation, defatting, and ethanol extraction from cottonseed coats and kernels of glanded and glandless seeds [1]. (D) Bacteria-derived endotoxin LPS. Intact LPS is made up of three structural components (10–20 kDa) [21]: a hydrophobic lipid section, lipid A, which is responsible for the toxic properties of the molecule; a hydrophilic core polysaccharide chain; and a repeating hydrophilic O-antigenic oligosaccharide side chain that is specific to the bacterial serotype. (http://www.vetbact.org/popup/popup.php?id=73, accessed on 1 October 2022). (E) Human colon cancer cells used in the study.
Molecules 27 07560 g001
Figure 2. Mean Cq distribution of 55 mRNAs in human colon cancer cells. The cancer cells were treated with multiple concentrations of gossypol (0, 0.1, 0.5, 1, 5, 10, 50, and 100 µg/mL), LPS (0, 5, 10, 20, 50, 100, 500, and 1000 ng/mL) and cottonseed extracts (0, 5, 10, 20, 30, 40, 50, and 100 µg/mL) for 8 h and 24 h. Total mRNAs were extracted from the cells, converted into cDNAs, and the relative abundance was analyzed by SYBR Green qPCR. The Cq values represent the mean of 192 independent samples.
Molecules 27 07560 g002
Figure 3. Mean standard deviation distribution of 55 mRNAs in human colon cancer cells. The cancer cells were treated with multiple concentrations of gossypol (0, 0.1, 0.5, 1, 5, 10, 50, and 100 µg/mL), LPS (0, 5, 10, 20, 50, 100, 500, and 1000 ng/mL) and cottonseed extracts (0, 5, 10, 20, 30, 40, 50, and 100 µg/mL) for 8 h and 24 h. Total mRNAs were extracted from the cells, converted into cDNAs, and the relative abundance was analyzed by SYBR Green qPCR. The standard deviations of Cq values represent the mean of 192 independent samples.
Molecules 27 07560 g003
Figure 4. Variation of gene expression between gossypol and LPS treatment. The cancer cells were treated with multiple concentrations of gossypol (0, 0.1, 0.5, 1, 5, 10, 50, and 100 µg/mL) and LPS (0, 5, 10, 20, 50, 100, 500, and 1000 ng/mL) for 8 h. Total mRNAs were extracted from the cells, converted into cDNAs, and the relative abundance was analyzed by SYBR Green qPCR. The Cq values represented the mean and standard deviation of 24 independent samples.
Molecules 27 07560 g004
Figure 5. Variation of gene expression between glanded and glandless cottonseed extract treatment. The cancer cells were treated with multiple concentrations of cottonseed extracts (0, 5, 10, 20, 30, 40, 50, and 100 µg/mL) for 8 h. Total mRNAs were extracted from the cells, converted into cDNAs, and the relative abundance was analyzed by SYBR Green qPCR. The Cq values represented the mean and standard deviation of 48 independent samples.
Molecules 27 07560 g005
Figure 6. Variation of gene expression between cottonseed coat and kernel extract treatment. The cancer cells were treated with multiple concentrations of cottonseed extracts (0, 5, 10, 20, 30, 40, 50, and 100 µg/mL) for 8 h. Total mRNAs were extracted from the cells, converted into cDNAs, and the relative abundance was analyzed by SYBR Green qPCR. The Cq values represented the mean and standard deviation of 48 independent samples.
Molecules 27 07560 g006
Figure 7. Variation of gene expression between 8 and 24 h treatment of coat extract of cottonseed. The cancer cells were treated with multiple concentrations of cottonseed extracts (0, 5, 10, 20, 30, 40, 50, and 100 µg/mL) for 8 h. Total mRNAs were extracted from the cells, converted into cDNAs, and the relative abundance was analyzed by SYBR Green qPCR. The Cq values represented the mean and standard deviation of 48 independent samples.
Molecules 27 07560 g007
Figure 8. Variation of gene expression between DMSO control and treatment. The cancer cells were treated with 1% DMSO and multiple concentrations of gossypol (0.1, 0.5, 1, 5, 10, 50, and 100 µg/mL), LPS (5, 10, 20, 50, 100, 500, and 1000 ng/mL) and cottonseed extracts (5, 10, 20, 30, 40, 50, and 100 µg/mL) for 8 h and 24 h. Total mRNAs were extracted from the cells, converted into cDNAs, and the relative abundance was analyzed by SYBR Green qPCR. The Cq values represented the mean and standard deviation of 24 independent samples.
Molecules 27 07560 g008
Table 1. Human mRNA targets analyzed by qPCR; these genes are regulated by TTP, plant toxin gossypol, and plant nutrient cinnamon extract as indicated in the references.
IDmRNANameForward Primer (5' to 3')Reverse Primer (5' to 3')Regulator [Reference]
H1Ahrr1Aryl hydrocarbon receptor repressorAGGCTGCTGTTGGAGTCTCTTAACGATCGTTGCTGATGCATAAATTP [55]
H2Bcl2B-cell lymphoma 2CAGCATGCGGCCTCTGTTGGGCCAAACTGAGCAGAGTCTGossypol [56]
H3Bcl2l1B-cell lymphoma 2 like 1GTGCGTGGAAAGCGTAGACAATTCAGGTAAGTGGCCATCCAATTP [57]
H4Bnip3BCL2 protein-interacting protein 3GTCAAGTCGGCCGGAAAATATGCGCTTCGGGTGTTTAAAGGossypol [27]
H5Cd36Cluster of differentiation 36/fatty acid translocaseCTCTTTCCTGCAGCCCAATGTTGTCAGCCTCTGTTCCAACTGTTP [58]
H6Claudin1Maintain tissue integrity and water retentionGACAAAGTGAAGAAGGCCCGTATCAAGACCTGCCACGATGAAATTP [59]
H7Cox1Cyclooxygenase 1CGCCCACGCCAGTGAAGGCCGAAGCGGACACATTP [60]
H8Cox2Cyclooxygenase 2CGATTGTACCCGGACAGGATTTGGAGTGGGTTTCAGAAATAATTTTTP [61]
H9Csnk2a1Casein kinase 2 alpha 1AGCGATGGGAACGCTTTGAAGGCCTCAGGGCTGACAATTP [62]
H10CtsbCathepsin BGACTTGTAGCTGCTGTCTCTCTTTGTCAAGAGTCGCAAGAACATGCATTP [63]
H11Cxcl1Chemokine (C-X-C motif) ligand 1GCCCAAACCGAAGTCATAGCTGCAGGATTGAGGCAAGCTTTP [64]
H12Cyclind1Cyclin D1ACACGCGCAGACCTTCGTCCATGGAGGGCGGATTGGossypol [65]
H13Cyp19a1Cytochrome P450 family 19 subfamily A member 1GACATTGCAAGGACAGTGTGTTGAGTCTCATCTGGGTGCAAGGAGossypol [66]
H14Dgat1Diacylglycerol O-acyltransferase 1ACCTCATCTGGCTCATCTTCTTCTACCCGGTCTCCAAACTGCATCinnamon [40,67]
H15Dgat2aDiacylglycerol O-acyltransferase 2aCCCAGGCATACGGCCTTACAACACAGGCATTCGGAAGTTCinnamon [40,68]
H16Dgat2bDiacylglycerol O-acyltransferase 2bACTCTGGCCCTTCTCTGTTTTTTATCCACCTTGGTTGGGTGTGTCinnamon [40,68]
H17E2f1E2F transcription factor 1CGGCGCATCTATGACATCACCAGCCACTGGATGTGGTTCTTTTP [69]
H18Elk1ETS transcription factorCTCCTCCGCATCCCTCTTTAAAGCGTCACAGATGGGTCCATTTP [70]
H19FasFas cell surface death receptorGAACTCCTTGGCGGAAGAGAAGGACCCCGTGGAATGTCAGossypol [71]
H20GapdhGlyceraldehyde-3-phosphate dehydrogenaseGGGTGTGAACCATGAGAAGTATGAGGTGCAGGAGGCATTGCT[72]
H21Glut1Glucose transporter 1TGCTCATGGGCTTCTCGAAAAGCGGCCCAGGATCAGCinnamon [39]
H22Glut2Glucose transporter 2GCATTTTTCAGACGGCTGGTAGCGCCAACTCCAATGGTTCinnamon [39]
H23Glut3Glucose transporter 3GAGGATATCACACGGGCCTTTCCATGACGCCGTCCTTTCCinnamon [39]
H24Glut4Glucose transporter 4CGTGGGCGGCATGATTCCAGCATGGCCCTTTTCCCinnamon [39]
H25Hif1aHypoxia inducible factor 1 subunit alphaGGTGGATATGTCTGGGTTGAAACATGCACTGTGGTTGAGAATTCTTGTTP [73]
H26Hmgr3-Hydroxy-3-methylglutaryl-CoA reductaseAAGTGAAAGCCTGGCTCGAACTAGTGCTGTCAAATGCCTCCTT[74]
H27Hmox1Heme oxygenase 1CTTCTCCGATGGGTCCTTACACTTCACATGGCATAAAGCCCTACATTP [75]
H28HuaHuman antigen aGATCCTCTGGCAGATGTTTGGCGCGGATCACTTTCACATTGGossypol [41]
H29Icam1Intercellular adhesion molecule 1/CD54GGAGCTTCGTGTCCTGTATGGTTTCTGGCCACGTCCAGTTT[76]
H30InosInducible nitric oxide synthaseAGATCCGGTTCACAGTCTTGGTGCCATGACCTTCCGCATTAG[77]
H31InsrInsulin receptorCAACGGGCAGTTTGTCGAATGGTCGGGCAAACTTTCTG[38]
H32Il2Interleukin 2TATGCAGATGAGACAGCAACCATTTGAGATGATGCTTTGACAAAAGGTTP [78]
H33IL6Interleukin 6CCCACACAGACAGCCACTCACCGTCGAGGATGTACCGAATTTP [79]
H34IL8Interleukin 8CCATCTCACTGTGTGTAAACATGACTTATCAGGAAGGCTGCCAAGAGTTP [80]
H35Il10Interleukin 10GCCGTGGAGCAGGTGAAGTGGCTTTGTAGATGCCTTTCTCTTTP [81]
H36Il12Interleukin 12TGCCTTCACCACTCCCAAATGTCTGGCCTTCTGGAGCATTTP [82]
H37Il16Interleukin 16CAGGGCCTCACACGGTTTGACAATCGTGACAGGTCCATCATTP [83]
H38Il17Interleukin 17CCCAAAAGGTCCTCAGATTACTACATCATTGCGGTGGAGATTCCTTP [84]
H39LeptinBody fat and obesity hormoneAGGGAGACCGAGCGCTTTCACATCCCTCACCTCCTTCAAA[85]
H40Map1lc3aMicrotubule-associated proteins 1 light chain 3AGTGAACCAGCACAGCATGGTCCTCGTCTTTCTCCTGCTCGTA[86]
H41Map1lc3bMicrotubule-associated proteins 1 light chain 3BAGGCGCTTACAGCTCAATGCACCATGCTGTGTCCGTTCAC[86]
H42NfkbNuclear factor kappa BGGTGCCTCTAGTGAAAAGAACAAGAGCTGGTCCCACATAGTTGCA[87]
H43P53Tumor suppressorCTTGCAATAGGTGTGCGTCAGAGGAGCCCCGGGACAAAGossypol [88]
H44Pim1Proto-oncogene serine/threonine-protein kinaseTGCTCCACCGCGACATCTGAGCTCGCCGCGATTTTP [89]
H45PparrPeroxisome proliferator-activated receptor γGAACGACCAAGTAACTCTCCTCAAACAAGGAGGCCAGCATTGTGTGossypol [90]
H46Rab24Ras-related oncogene 24TCGGTCGGAGACGCACTTTGGCCTCATAGCGCTCAGA[91]
H47Rpl32Ribosomal protein L32 (60S ribosomal unit)CCTCCAAGAACCGCAAAGCGGTGACTCTGATGGCCAGTTG[92]
H48TnfTumor necrosis factorGGAGAAGGGTGACCGACTCACAGACTCGGCAAAGTCGAGATTTP [79]
H49Tnfsf10Tumor necrosis factor superfamily, member 10GCTCTGGGCCGCAAAATAGGAATGAATGCCCACTCCTTGossypol [93]
H50Ulk2Unc-51 like autophagy activating kinase 2ACAGCTCCTTTCAAAATCCCTAAAAGGCCCATGACGAGTAACCA[94]
H51VegfVascular endothelial growth factorCCCACTGAGGAGTCCAACATCGGCCTTGGTGAGGTTTGATCTTP [95]
H52Zfand5Zinc finger AN1-type containing 5AGGGTTTGACTGCCGATGTGACTGGATTCTCTTTTCTGATTTTTGCTTP [96]
H53Zfp36/TtpZinc finger protein 36/TristetraprolinGGCGACTCCCCATCTTCAAGACCGGGCAGTCACTTTGTCTTP [38]
H54Zfp36l1Zinc finger protein 36 like 1TCTGCCACCATCTTCGACTTGTGGGAGCACTATAGTTGAGCATCTTTP [38]
H55Zfp36l2Zinc finger protein 36 like 2CCTTTCATACCATCGGCTTCTGTCGTCCGCGTTGTGGATTTP [38]
Publisher’s Note: MDPI stays neutral with regard to jurisdictional claims in published maps and institutional affiliations.

