Article

Anharmonicity and Spectra–Structure Correlations in MIR and NIR Spectra of Crystalline Menadione (Vitamin K3)

by
Krzysztof B. Beć
1,*,
Justyna Grabska
1,
Christian W. Huck
1,
Sylwester Mazurek
2 and
Mirosław A. Czarnecki
2,*
1
CCB-Center for Chemistry and Biomedicine, Institute of Analytical Chemistry and Radiochemistry, Leopold-Franzens University, 6020 Innsbruck, Austria
2
Faculty of Chemistry, University of Wrocław, 50-383 Wrocław, Poland
*
Authors to whom correspondence should be addressed.
Molecules 2021, 26(22), 6779; https://doi.org/10.3390/molecules26226779
Submission received: 14 October 2021 / Revised: 3 November 2021 / Accepted: 8 November 2021 / Published: 10 November 2021
(This article belongs to the Special Issue Perspectives in Near Infrared Spectroscopy and Related Techniques)

Abstract

:
Mid-infrared (MIR) and near-infrared (NIR) spectra of crystalline menadione (vitamin K3) were measured and analyzed with aid of quantum chemical calculations. The calculations were carried out using the harmonic approach for the periodic model of crystal lattice and the anharmonic DVPT2 calculations applied for the single molecule model. The theoretical spectra accurately reconstructed the experimental ones permitting for reliable assignment of the MIR and NIR bands. For the first time, a detailed analysis of the NIR spectrum of a molecular system based on a naphthoquinone moiety was performed to elucidate the relationship between the chemical structure of menadione and the origin of the overtones and combination bands. In addition, the importance of these bands during interpretation of the MIR spectrum was demonstrated. The overtones and combination bands contribute to 46.4% of the total intensity of menadione in the range of 3600–2600 cm−1. Evidently, these bands play a key role in shaping of the C-H stretching region of MIR spectrum. We have shown also that the spectral regions without fundamentals may provide valuable structural information. For example, the theoretical calculations reliably reconstructed numerous overtones and combination bands in the 4000–3600 and 2800–1800 cm−1 ranges. These results, provide a comprehensive origin of the fundamentals, overtones and combination bands in the NIR and MIR spectra of menadione, and the relationship of these spectral features with the molecular structure.

Graphical Abstract

1. Introduction

Vitamins play an important role in living organisms, therefore are subject of numerous experimental and theoretical studies [1,2]. The investigations cover the fundamental chemical and biological processes involving vitamins, e.g., electron transfer reactions [3] as well as their biochemical activity in living organisms [4]. However, equally important are studies on the physical and chemical properties of vitamins. Different experimental methods were used to examine the correlation between the properties and the biochemical functions of vitamins, e.g., interactions of vitamins with the chemical environment and solubility in various solvents [5,6] their antioxidant potentials [7] photosensitivity and photostability [8] and the relationships between their molecular structure and chemical stability [9].
Among numerous experimental methods, vibrational spectroscopy is particularly powerful tool since it provides detailed information on changes at a molecular level. Fundamental vibrations of vitamins were intensively examined by various spectroscopic techniques, i.e., mid-infrared (MIR; i.e., infrared, IR), far-infrared (FIR), terahertz (THz) and Raman. For example, attenuated total reflectance terahertz (ATR-THz) spectroscopy of low-lying vibrational modes provided information on the effect of temperature on the structure of vitamin C [10]. MIR spectroscopy is also useful in studies of different aspects of intermolecular interactions of vitamins [11,12]. Vitamins were also examined by more sophisticated spectroscopic techniques, such as surface-enhanced IR spectroscopy (SEIRA), which provided information on temperature-induced changes in structure of vitamin B3 absorbed at metal surface [13]. Another example is an application of the resonance Raman for studies of unique insight into structural sensitivity of vitamin B12 [14].
Interpretation of the vibrational spectra is based on the characteristic group frequencies that are often doubtful. For example, assignment of the fundamental bands in IR, Raman and SERS spectra of vitamin C was discussed until recently [15]. Thus, particular interest has been paid for application of the computational methods to aid interpretation of the spectra of vitamins. The theoretical vibrational analysis provided assignments of the fundamental bands in MIR and Raman spectra of vitamin C [16,17], including the anion and cation forms [18]. The other Density Functional Theory (DFT) calculations elucidated the contribution of tautomeric forms of vitamin C to the experimental ultraviolet-visible (UV-VIS), nuclear magnetic resonance (NMR) and MIR spectra [19]. Theoretical calculations were often used to study the impact of hydrogen bonding on the molecular structure of vitamin C [20]. Additionally, the changes in the vibrational spectra resulting from interaction between vitamin C and water were investigated [21]. Recent examination of the hydrogen bonding in the crystalline phase by Car-Parinello molecular dynamics allowed to observe the double minimum proton potentials [22]. On the other hand, exploration of the vibrational spectra of other vitamins by computational chemistry were occasional. For example, the vibrational spectra of vitamin K were subject of few theoretical studies [23,24,25,26]. One has to mention the quantum chemical examinations of molecular structure and the MIR and Raman spectra of vitamin B3 [27,28].
In contrast, the studies of the spectra–structure relationships in near-infrared (NIR) range are rare. First of all, it results from higher complexity of NIR spectra as compared with IR or Raman ones [29,30,31]. As a result, no successful investigations of the overtones and combination bands of vitamins have been reported so far. Therefore, the understanding of NIR spectra of vitamins is poor, despite of using of two-dimensional correlation spectroscopy (2DCOS), which enhances the spectral and structural selectivity of NIR spectra [32].
Recent progress in the hardware and new theoretical methods allows the calculations of NIR spectra and improve their interpretability [29,30,33]. This gives an opportunity to explore NIR spectra of vitamins and their relationships with the IR ones. NIR spectroscopy is often applied for determination of vitamin content in fruits and extracts [34,35], pharmaceutical formulations [36] or powdered mixtures and solutions [37]. However, these analytical applications of NIR spectroscopy do not rely on interpretation of the characteristic vibrational frequencies. In this work we undertook an experimental and theoretical investigation of vibrational spectra of menadione (vitamin K3). Menadione is of great importance for life since it is responsible for proper blood clotting [38]. The molecule of menadione possess naphthoquinone unit that never has been examined by NIR spectroscopy. Further, the presence of C=O group in molecule of menadione provides an opportunity for comparison with the spectral characteristic of the same group in ketones [39]. This work is focused on the NIR spectrum, however, manifestation of the overtones and combination bands in the MIR spectra will be shown as well. Despite importance of non-fundamental transitions, the analysis of these bands in the MIR spectra has been occasional [40,41,42,43].
To increase the reliability of the spectra-structure correlations, the experimental spectra of vitamin K3 were measured in a well-defined crystalline state. The interpretation and discussion of the fundamental bands is based on the periodic DFT calculations (i.e., infinite models within periodic boundary conditions) of MIR spectra, which represent a substantial advancement over previous studies based on the finite models [17]. The cost of currently available implementation of the anharmonic calculations for periodic systems do not permit for application of a similar theoretical approach to NIR spectra. Therefore, NIR spectra were simulated using a single-molecule with the geometry extracted from the crystalline structure and then optimized in vacuum. As demonstrated recently, such approach is feasible due to local character of the vibrational modes in the NIR region [33,44]. Numerous studies have been devoted to investigations of hydrogen bonding effects in MIR spectra [20,22,45,46,47]. Recently, increases the interest in studying weak interactions, such as CH···O hydrogen bonding [48,49]. However, the investigations of these interactions in NIR spectra have been started not long ago [44,50,51,52,53,54]. The CH···O hydrogen bonding is very weak, and therefore difficult to observe in MIR spectra. On the other hand, electrical anharmonicity leads to increased intensity of NIR bands of X-H group involved in weak hydrogen bonding [55,56]. The first overtone of the carbonyl group is located in MIR region, while the second overtone appears in NIR region [39]. Therefore, simultaneous examination of MIR and NIR spectra of menadione in a well-defined crystalline phase is expected to yield helpful information on the CH···O=R interactions in vibrational spectra.
The aim of this work was providing a detailed assignment of all fundamental bands as well as overtones and combination bands of menadione in the crystalline state. On the basis of these assignments, we elucidated the spectra–structure correlation in MIR and NIR regions. These correlations give an opportunity for study of the structure and interactions of menadione in different environments. Besides, information included in this work has a great potential in analytical applications.

2. Results and Discussion

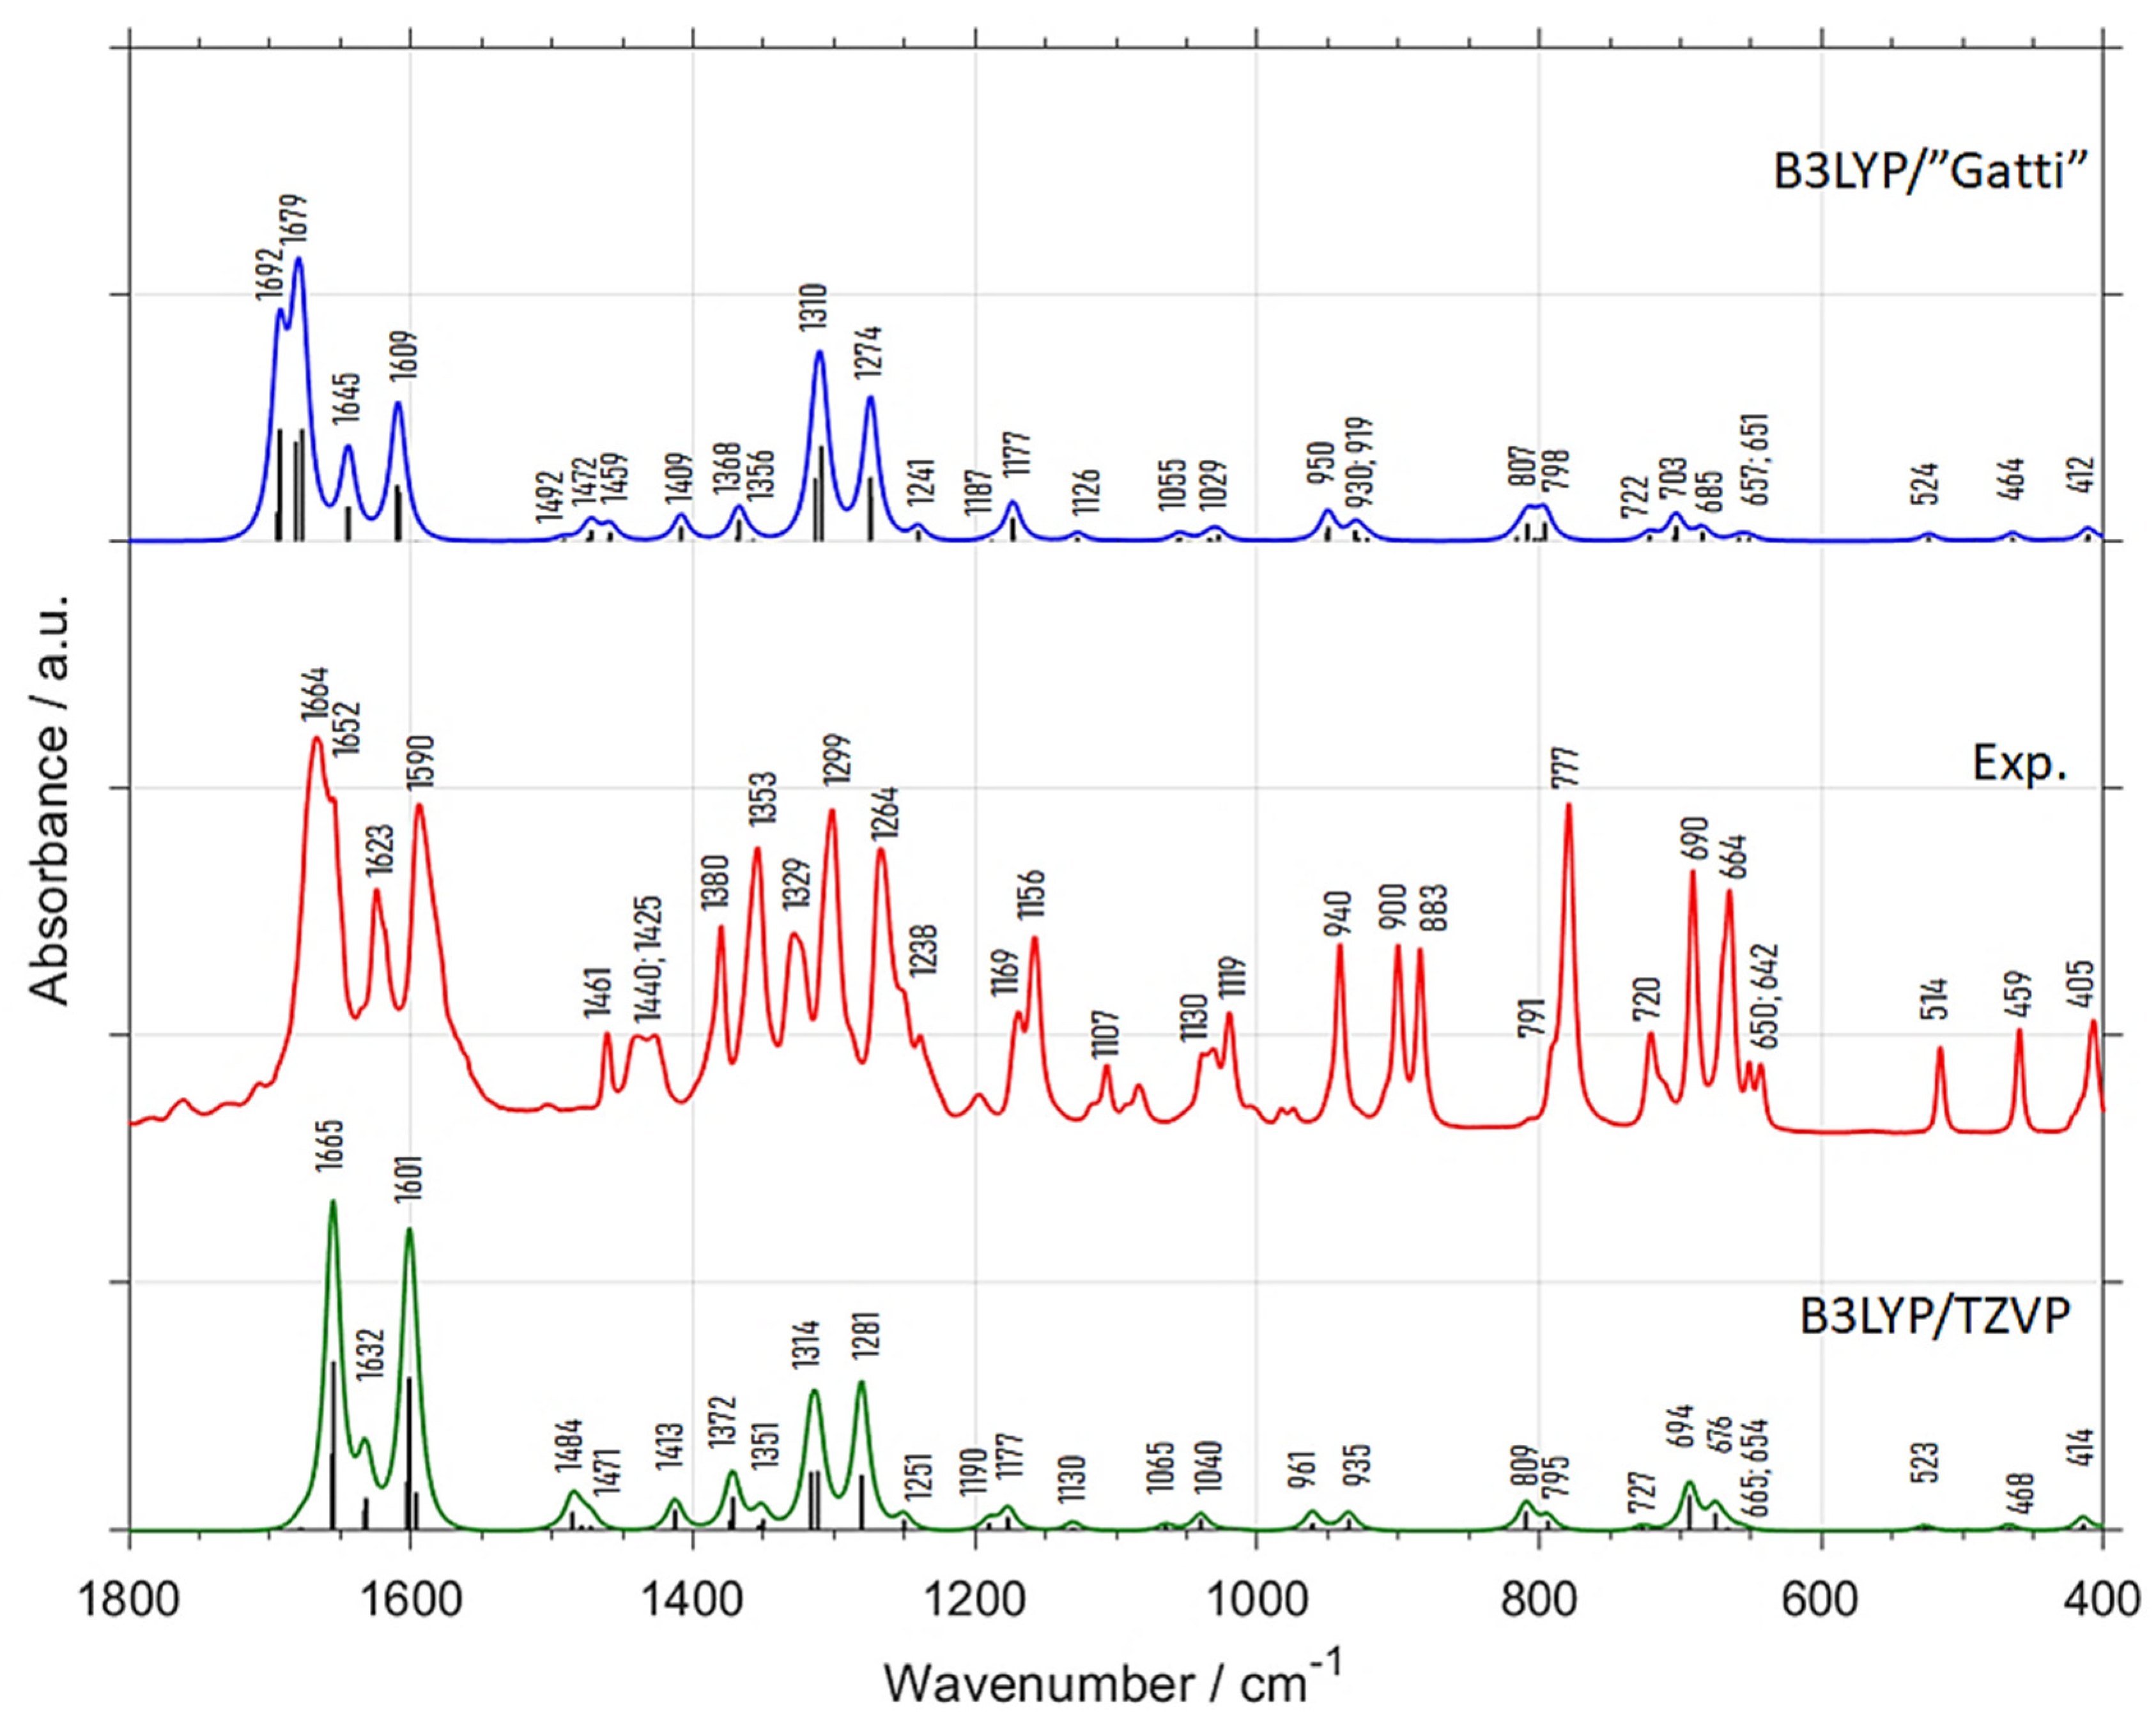
2.1. Comparison of Experimental and Theoretical (Harmonic Approximation within Periodic Model) MIR Spectra

Comparing the experimental ATR-IR and DRIFT (diffuse reflectance infrared Fourier transform) spectra one can notice obvious differences resulting from the specificity of each method (Figures S1 and S2 in Supplementary Materials). Firstly, the measured spectral intensity in DRIFT spectrum is close to optimal, as the concentration of menadione could be easily adjusted by mixing with KBr. Furthermore, the penetration depth in ATR method depends on optical properties of the sample and ATR crystal and is reduced towards the shorter wavelengths (i.e., higher wavenumbers). This effect is easily seen in the normalized spectra (Figure S2). As a result, the spectral features in the high frequency region of ATR-IR spectrum (4000–1800 cm−1) are very weak. In contrast, this spectral region is much better developed in the DRIFT spectrum. Therefore, we used DRIFT spectrum of menadione for further discussion.
Regardless of the method used (i.e., B3LYP/”Gatti” or B3LYP/TZVP), the MIR spectra in the 3400–2800 cm−1 region (Figure S3) are poorly reconstructed by harmonic calculations and numerous bands are missing. Evidently, the contributions from the anharmonic vibrations (overtones and combination bands) in this spectral region are significant, and therefore, harmonic spectra calculated by periodic B3LYP/”Gatti” and B3LYP/TZVP methods do not provide basis for reliable bands assignments.
In contrast, the harmonic spectra in the 1800–400 cm−1 range (Figure 1) obtained by B3LYP/”Gatti” and B3LYP/TZVP methods are similar to each other, and resemble the DRIFT spectra. In spite of some differences in the peak positions and relative intensities both simulated spectra develop the same spectral features. This means that the anharmonic modes have minor contribution in this spectral range. Hence, one can conclude that the fundamental bands observed in IR spectrum of crystalline menadione can be reliably identified by the periodic harmonic calculations (Figure 1 and Table 1). In addition, we briefly investigated whether any spectral changes appear upon increasing the sample temperature from room temperature to the temperature of ca. 363 K (Figure S4 in Supplementary Materials), below melting point of menadione at 380 K. From Figure S4 it is evident that the spectra recorded at room and elevated temperatures are similar, indicating that the crystalline structure of menadione is very stable and dominates in the solid sample. Therefore, the crystalline model considered in this work is representative for the wider range of experimental conditions.

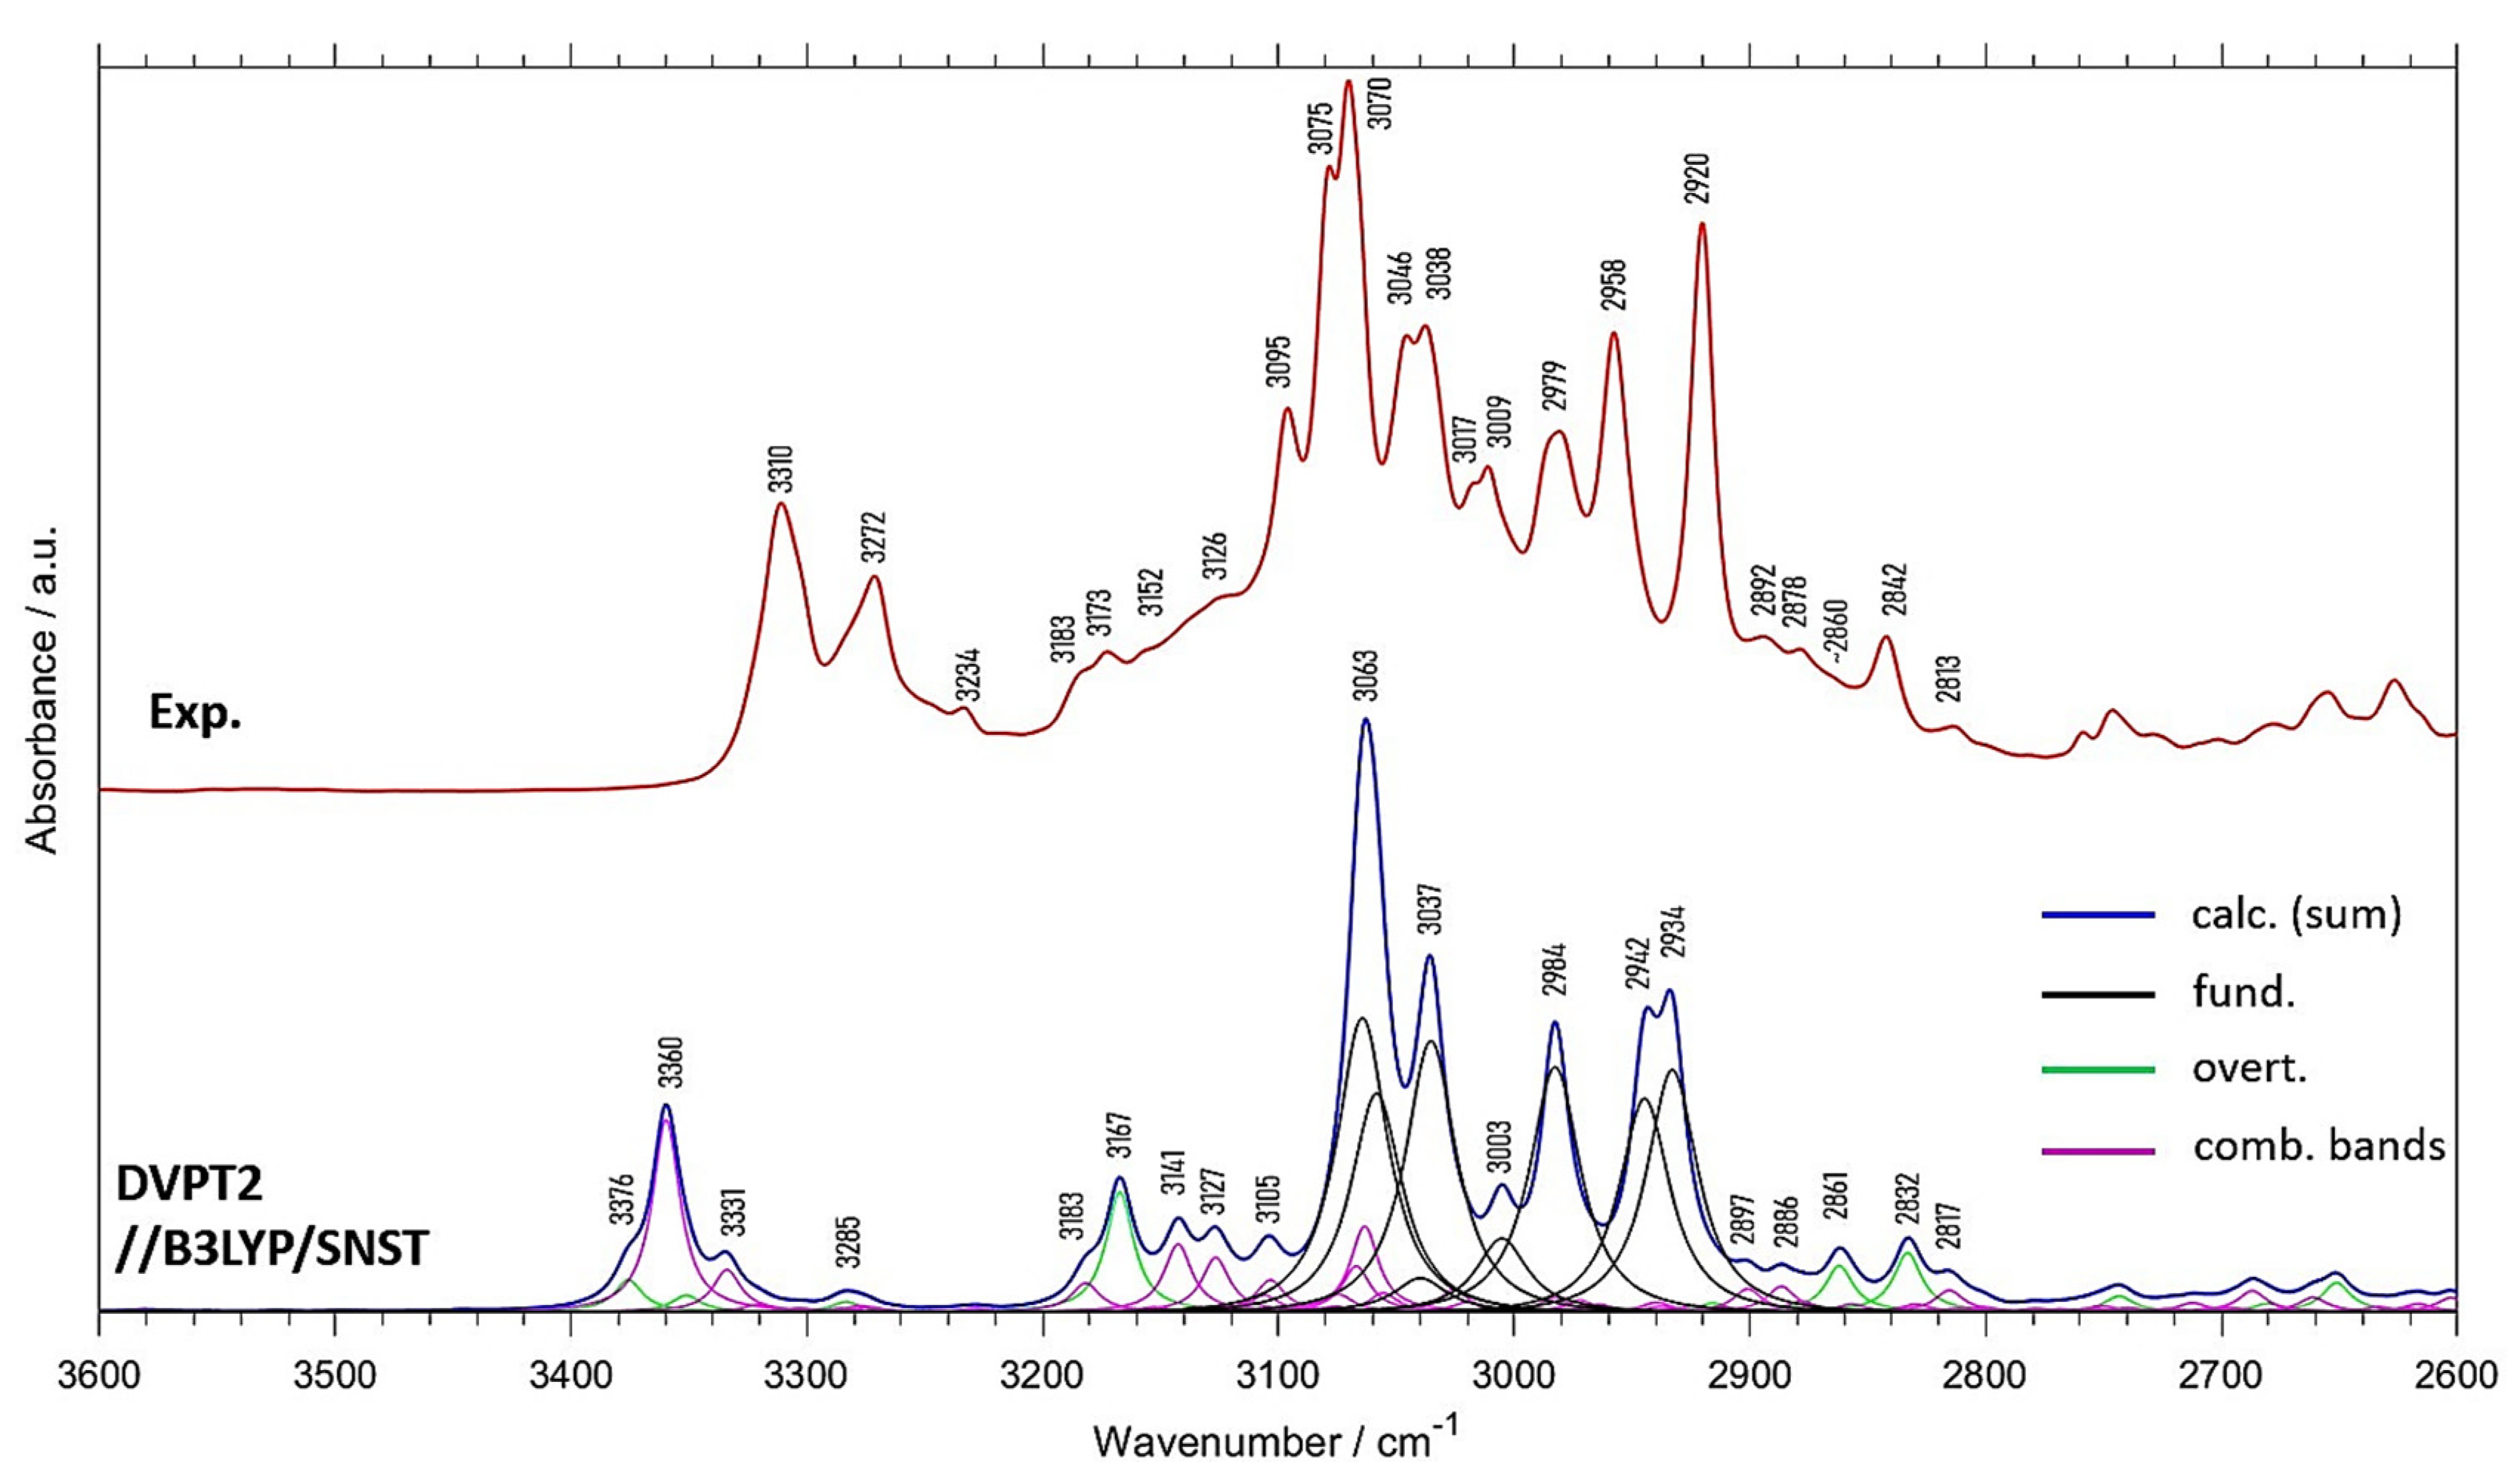
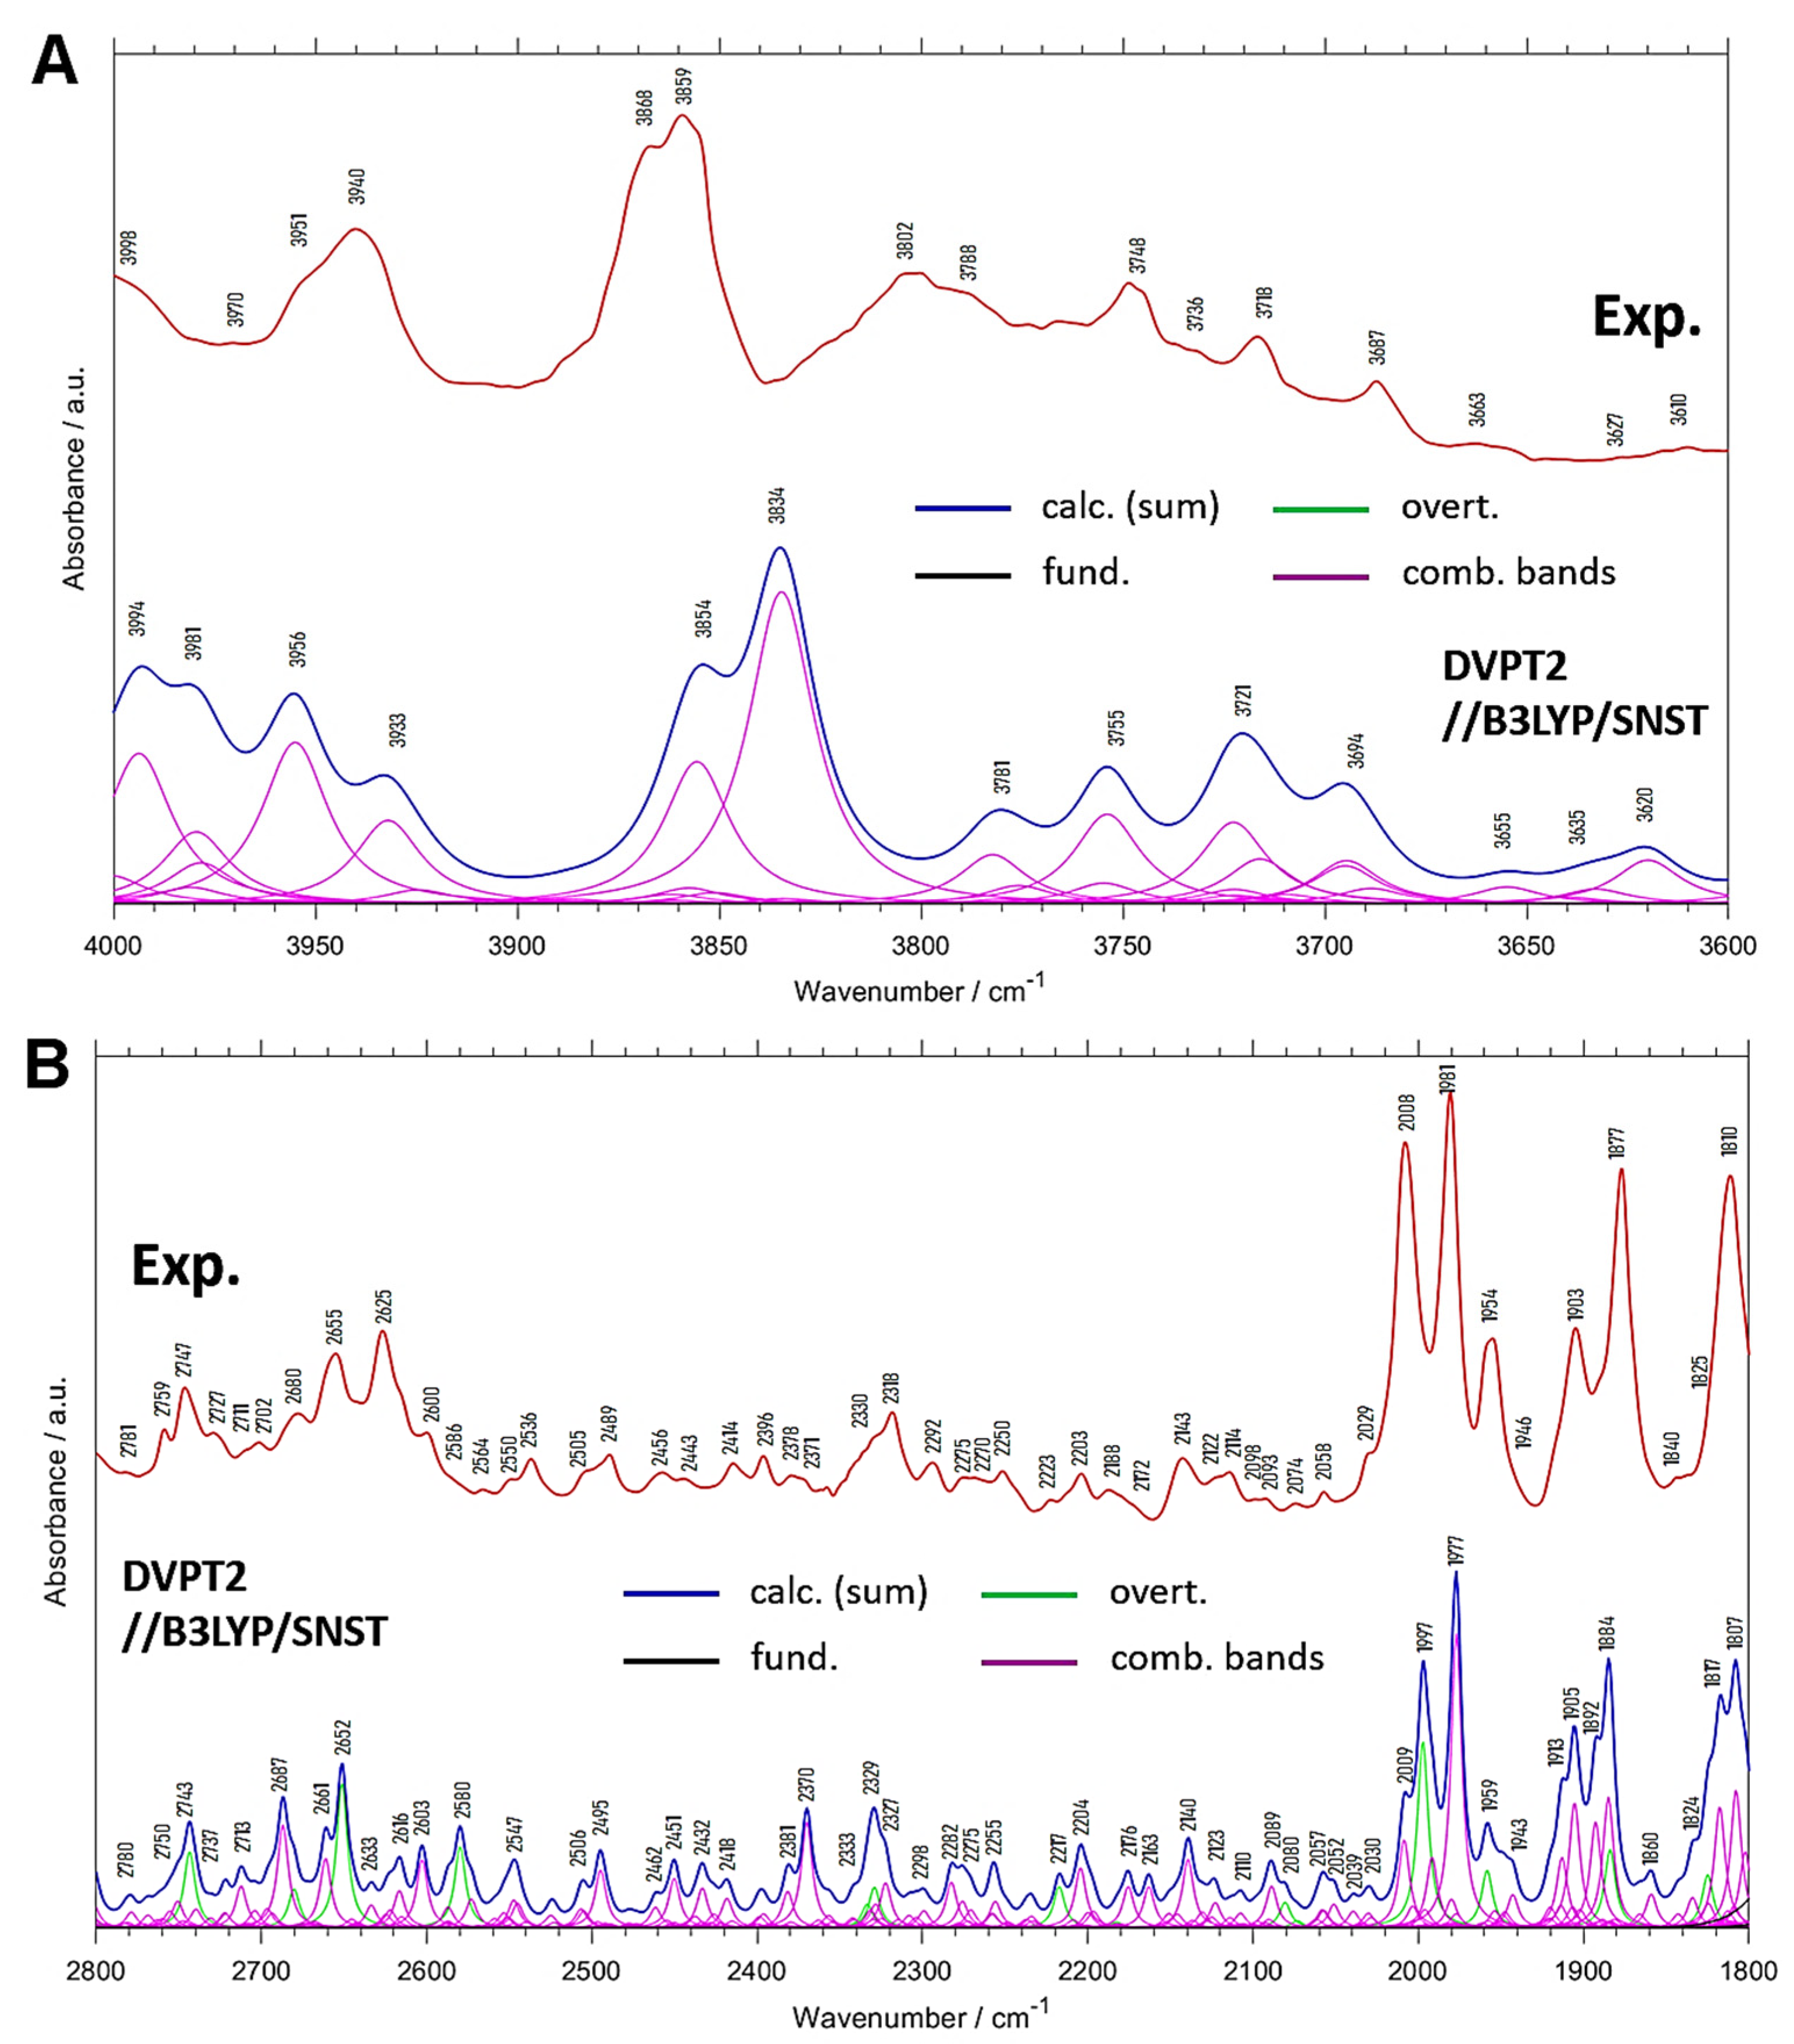
2.2. Overtones and Combination Bands in MIR Spectrum of Menadione

Figure 2 and Table 2 reveal that much better reconstruction of the spectra of menadione in the 3600–2600 cm−1 region was obtained by anharmonic calculations. It is of note that only relatively narrow spectral range (3100–2900 cm−1) originates from the fundamental transitions, while outside this range dominate the combination and overtone modes (Figure 2). To obtain quantitative information on the contributions from different vibrational modes, we calculated the integral intensities of the theoretical anharmonic spectrum in the 3600–2600 cm−1 region. It is of note that the fundamental bands contribute only to 53.6% of the total integral intensity in this region, while the contributions from the combination and overtone bands are 34.8% and 11.6%, respectively. This illustrates very well the importance of the non-fundamental transitions in this fragment of the spectrum of menadione. The distinct peaks at 3310 and 3272 cm−1, as well as broader absorption structures observed at ca. 3183–3126 cm−1 and 2892–2813 cm−1 (including a better resolved peak at 2842 cm−1) originate solely from the first overtones and binary combination bands (Figure 2 and Table 2). The significant contribution from the anharmonic vibrations in this spectral region is the main reason of poor agreement between the harmonic spectra and the experimental ones (discussed in Section 2.1). This is another example of great impact of the non-fundamental peaks on the νC-H region of MIR spectrum [40]. Note, as DVPT2 calculations offer anharmonic transition intensities as well, the IR spectra calculated with this method improve the accuracy not only of the positions of the calculated fundamental bands but also their intensities, as compared with harmonic calculations.
The presence of the first overtones and binary combination bands is clearly manifested in the regions of MIR spectra free from the fundamental bands such as 4000–3600 cm−1 (Figure 3A) or 2800–1800 cm−1 (Figure 3B). The corresponding band assignments are collected in Table 3 and Table 4. These spectral regions are often neglected during the routine studies. In principle, both regions belong to IR range, however, they include only the bands from non-fundamental transitions (overtones and combinations), just like NIR spectra. In the case of simple deuterated compounds, the range of MIR spectrum without fundamentals may cover the range from 4000 to 2300 cm−1 [42,43]. Figure 3B reveals that in the 2800–1800 cm−1 range appears a lot of peaks that may be interpreted with aid of the anharmonic calculations. It is of note that below 2000 cm−1 the highest frequency fundamental band is observed at 1664 cm−1 and it originates from a mixed δ(ring) and νC=O vibration.
The domination of anharmonic transitions is clearly seen in the 2800–1800 cm−1 region. The bands due to the first overtones are less numerous than the combination bands. Yet, they clearly appear in the experimental MIR spectrum of menadione, e.g., at 2747, 2655 or 2625, and 2008 cm−1 (Figure 3B and Table 4). In the range of 2010–1800 cm−1, occur few sharp peaks of relatively high intensity, originating mainly from the combination bands involving γC-H vibrations. In addition, the overtones of γC-H modes contribute to this range, but this contribution is much smaller.

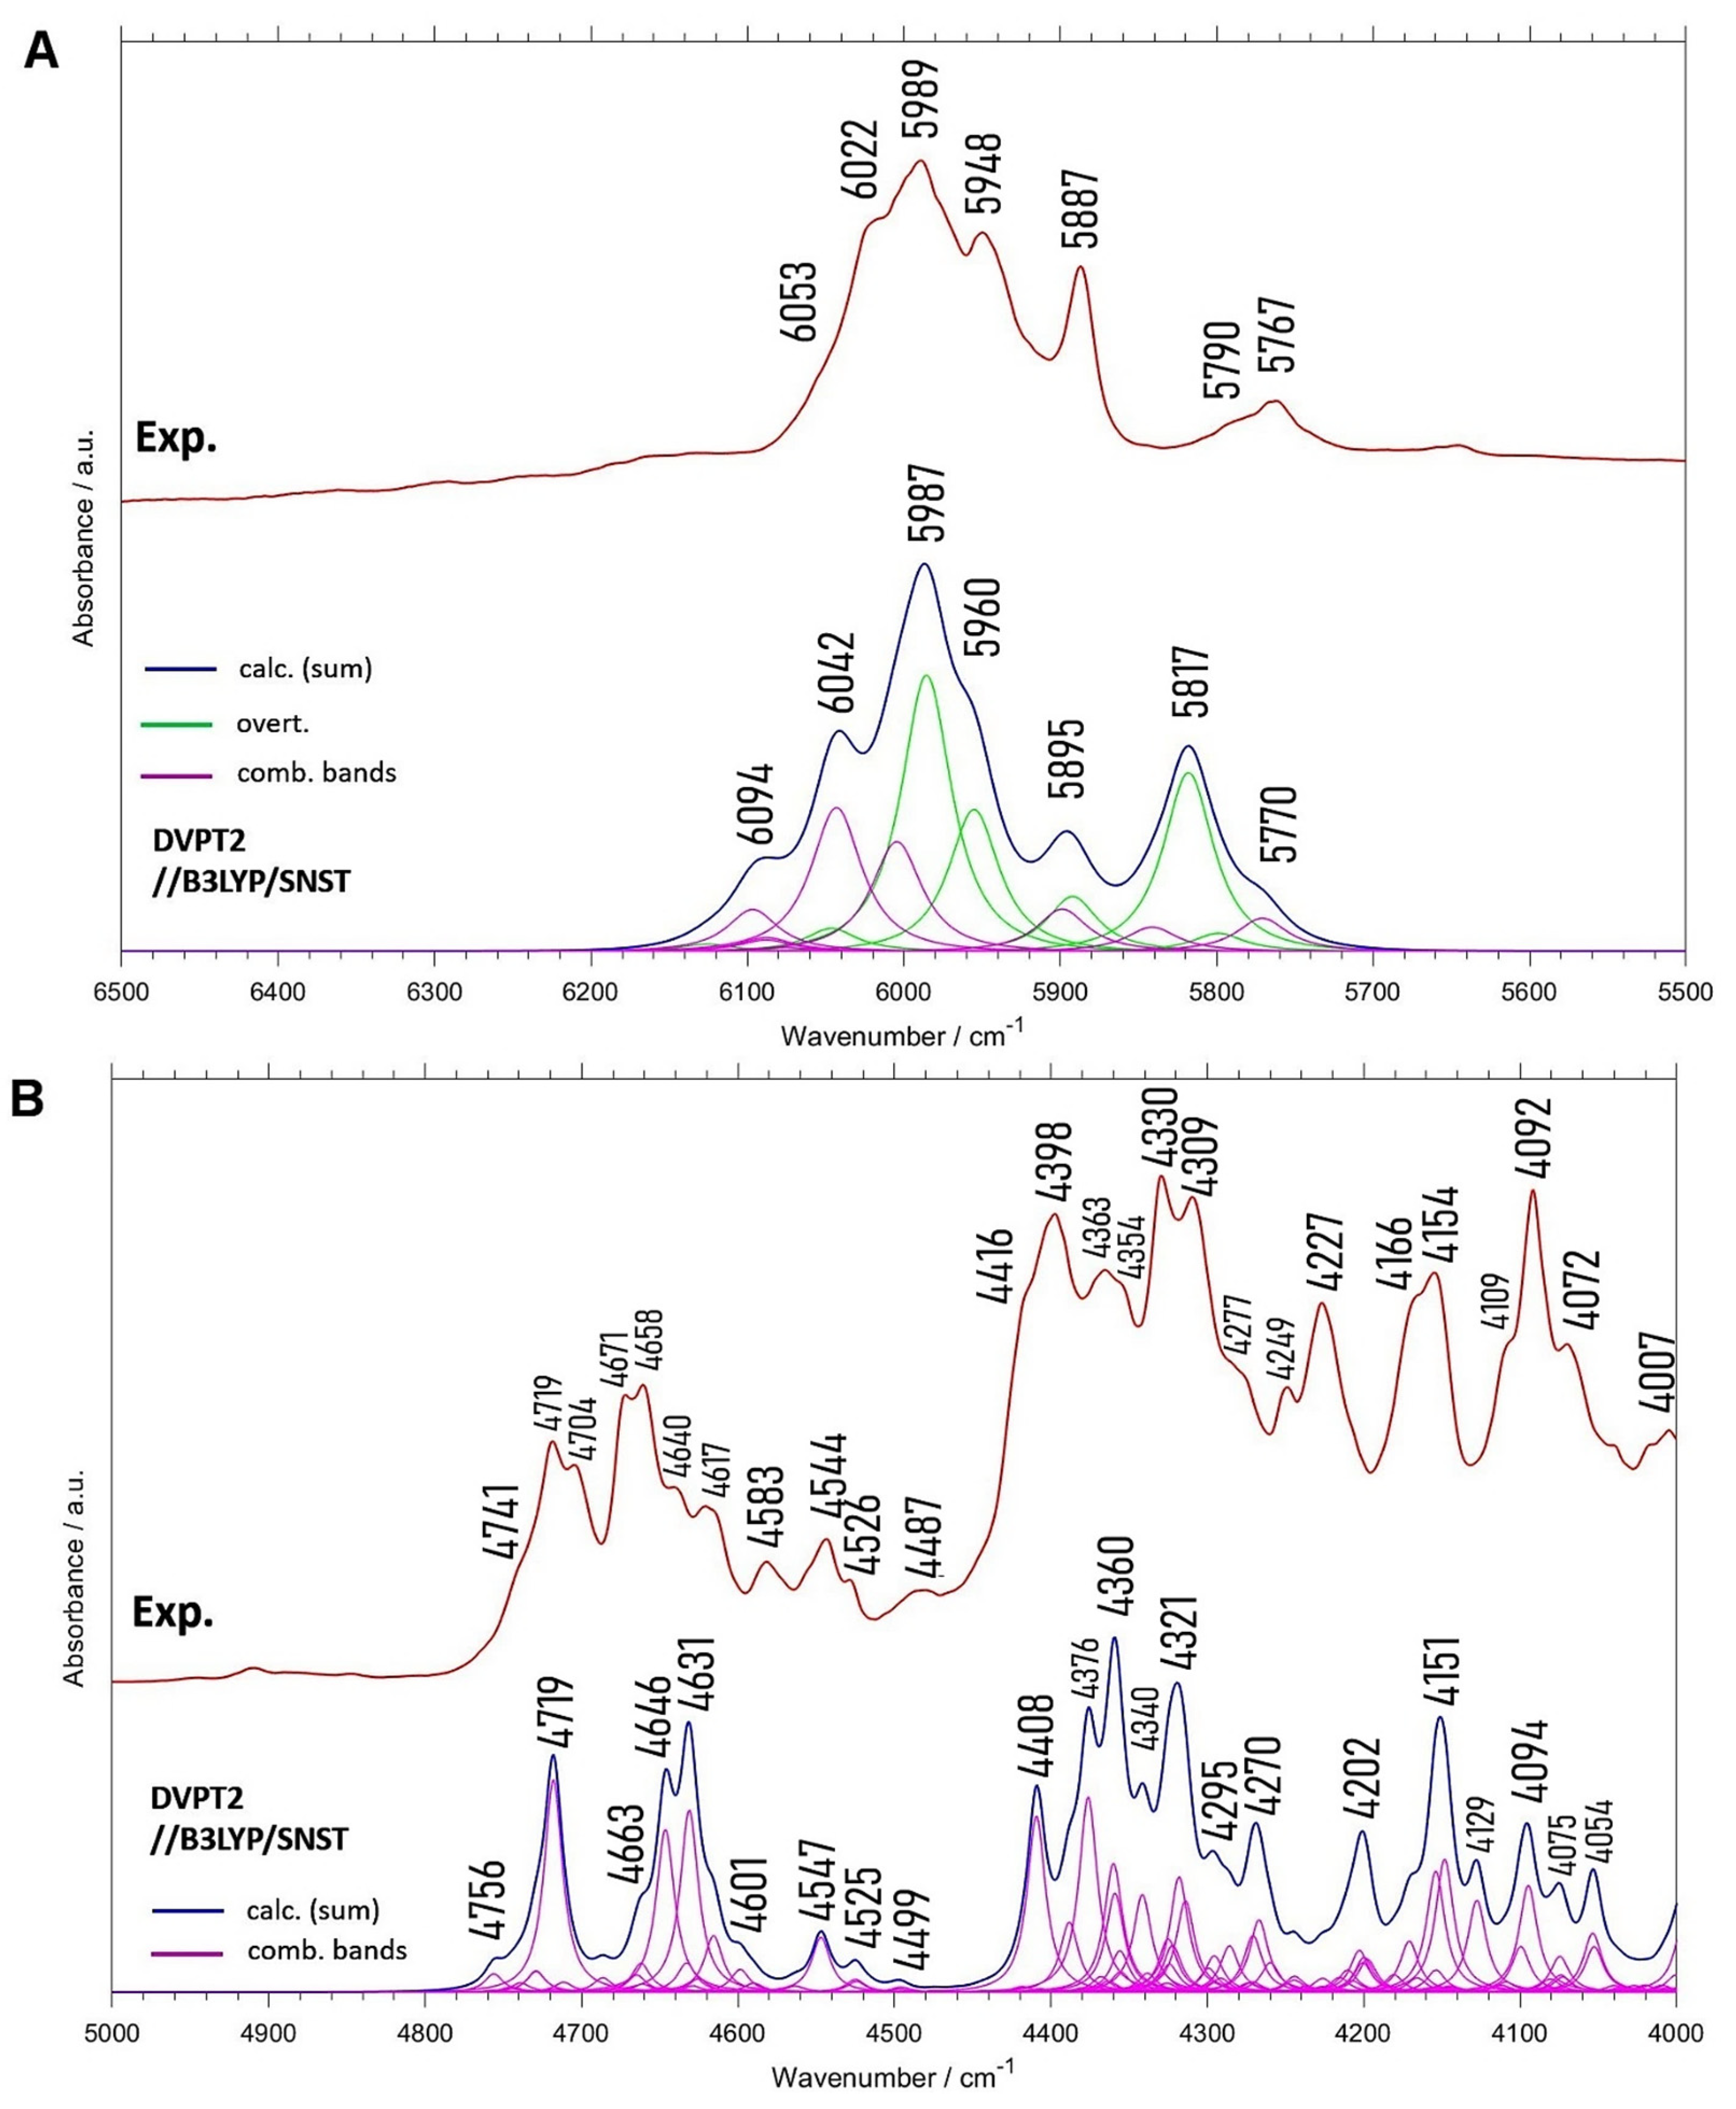
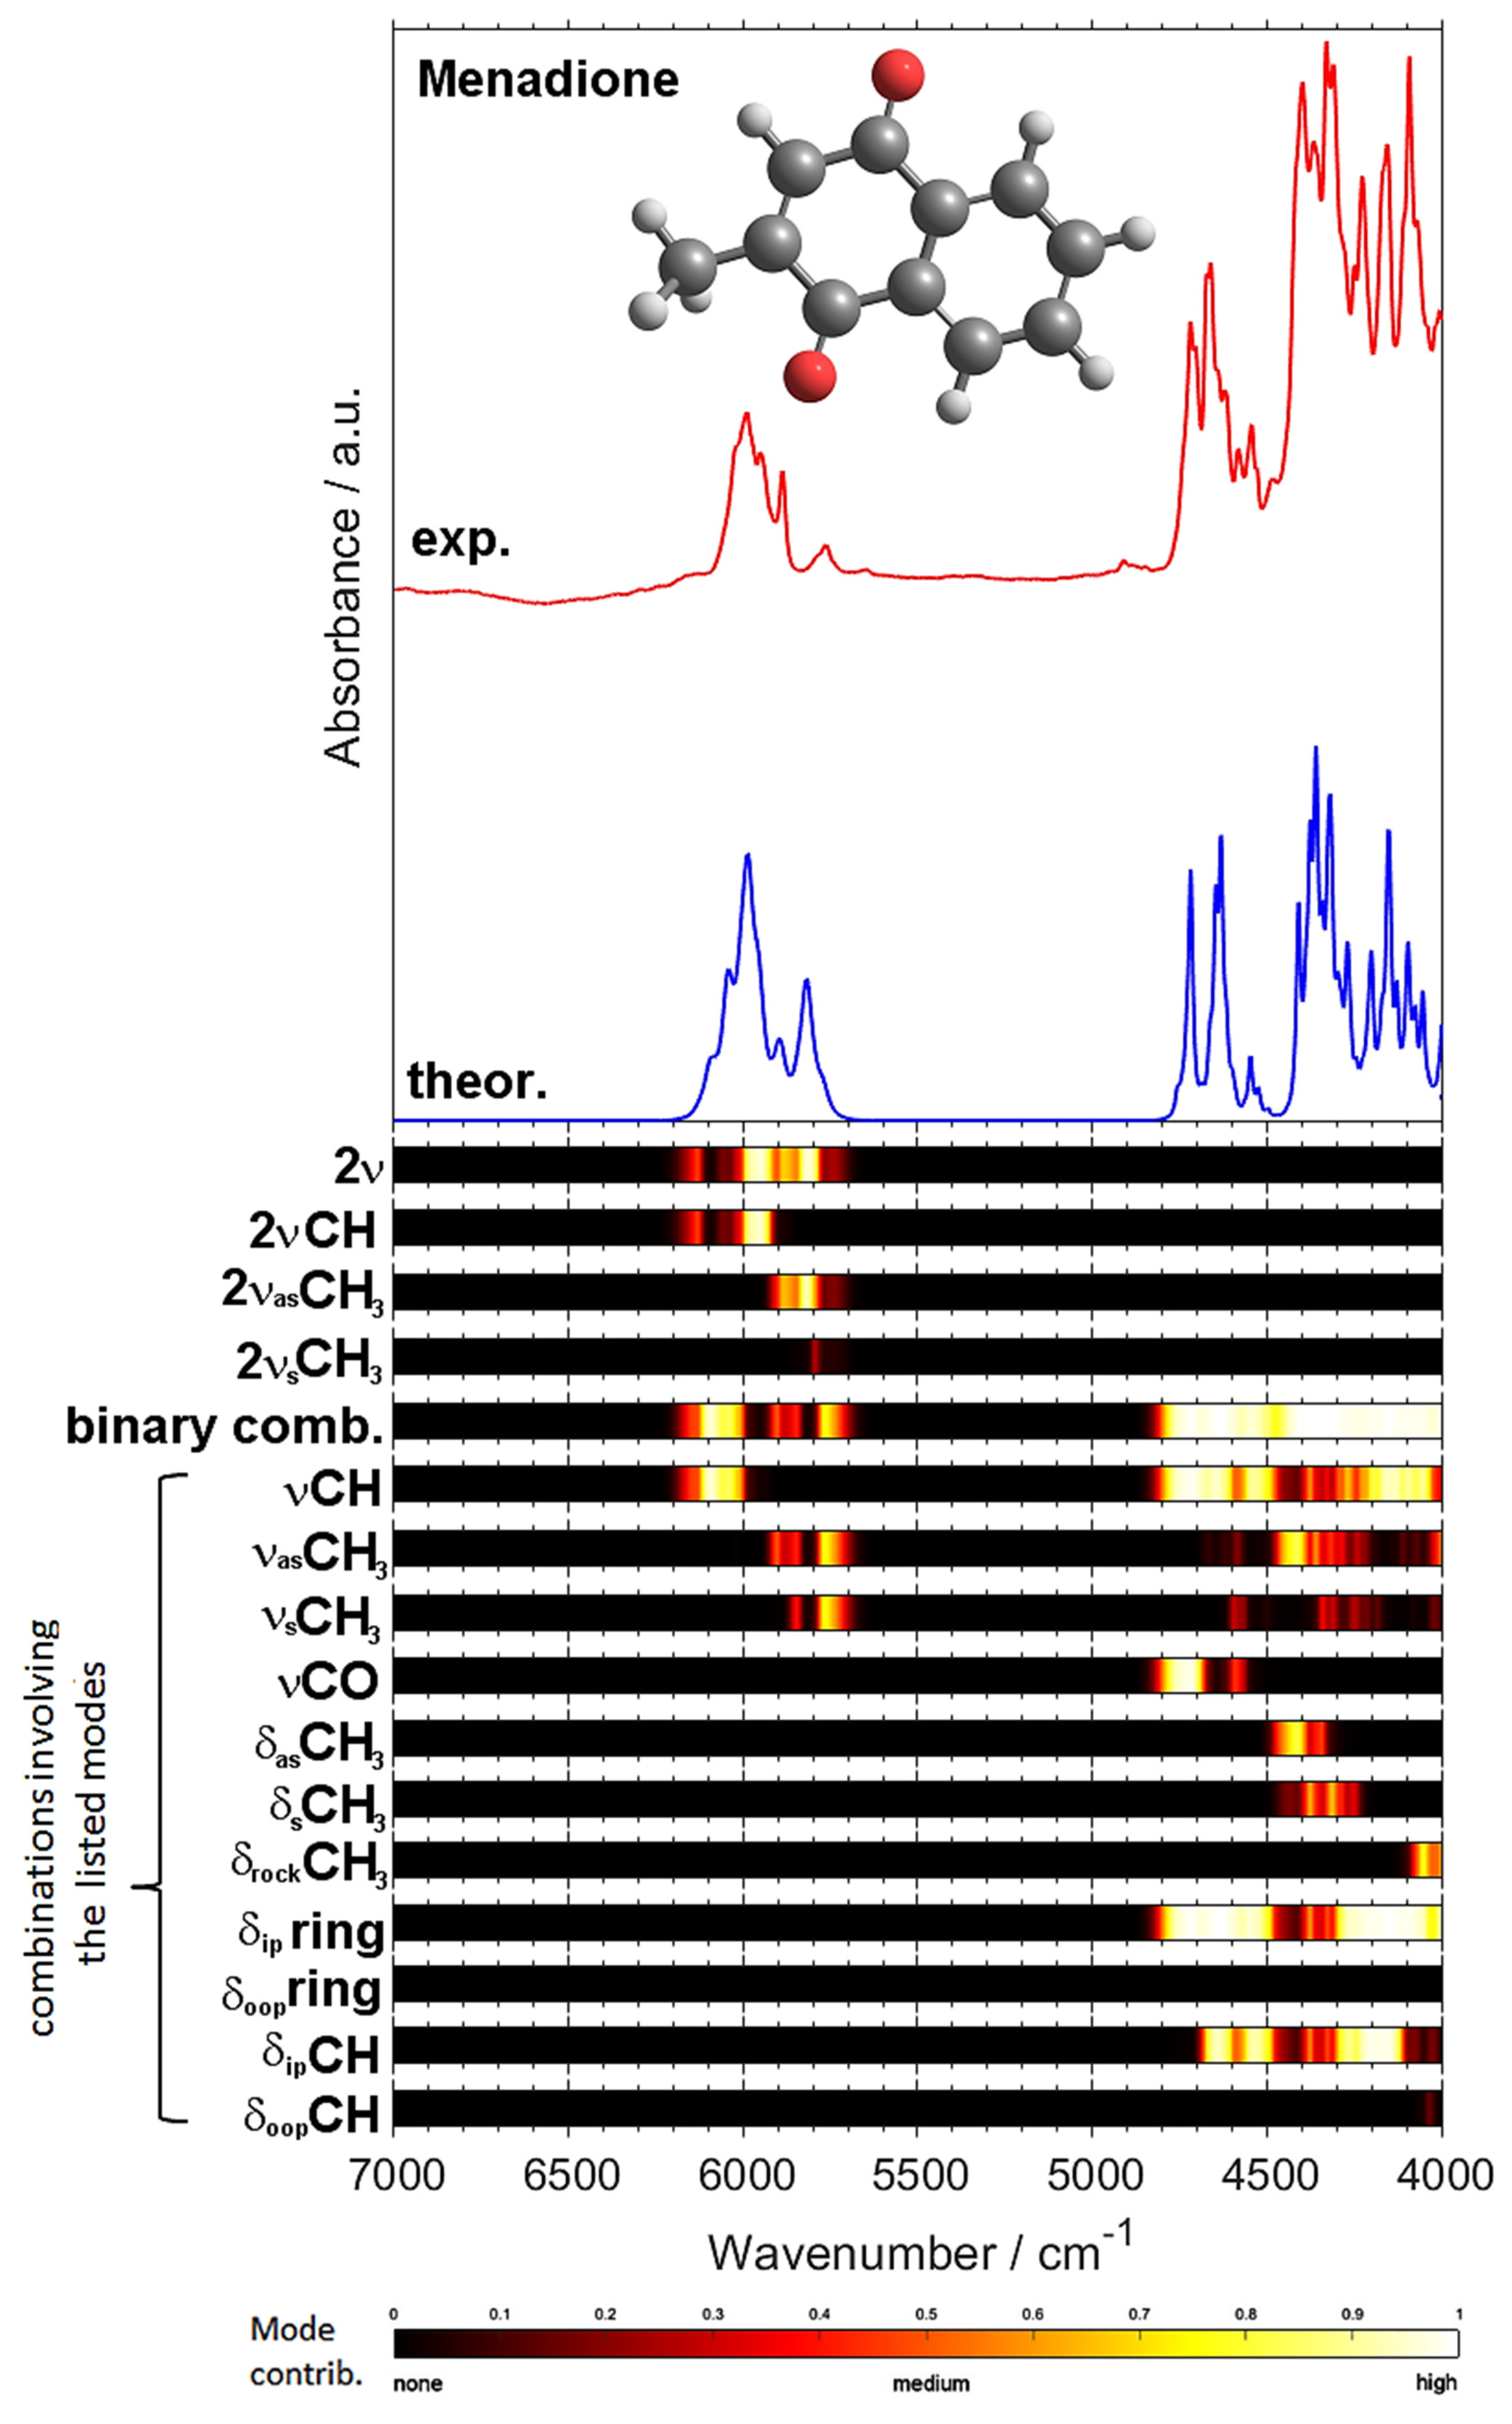
2.3. NIR Spectrum of Menadione

Most of bands in NIR spectrum of crystalline menadione is located in two spectral regions: 6100–5700 cm−1 (Figure 4A) and 4800–4100 cm−1 (Figure 4B). Outside these regions are observed only extremely weak bands from the higher order overtones and combination bands. To estimate the relative importance of the overtones and combination bands in the NIR range, we calculated integral intensity values for the theoretical spectrum. It appears that in the 7000–4000 cm−1 range the binary combinations and the first overtones contribute to 70% and 30% of total intensity, respectively. Evidently, the combination bands are the main component of the NIR spectrum of crystalline menadione.
The 6100–5700 cm−1 region is contributed mainly by the first overtones, while the contribution from the binary combinations is visible at 6022 cm−1 (Figure 4A). The other higher frequency combinations (e.g., 6094 cm−1) in the theoretical spectra are less clear in the experimental spectrum. Some of these bands appear as not resolved shoulders.
As shown, NIR spectra of even relatively simple molecules are complex and consist of numerous overlapped bands [57]. This feature of NIR spectra is well demonstrated in the case of crystalline menadione. In Figure 4, the experimental and calculated NIR spectra are compared. For the theoretical spectra, the contributions from all individual overtones and combination bands are also shown. Evidently, the degree of overlap of various bands is significantly higher than that observed in the MIR spectrum (Figure 1). Consequently, the structural information included in the NIR spectrum is obscured and difficult to present in the table with the individual band assignments. Therefore, to better reflect this intrinsic complexity of NIR line shape and present the assignments in a clear way, the contributions from selected vibrational modes to NIR spectra are shown in form of color maps.
As can be seen (Figure 5) most of bands contribute to 4800–4000 cm−1 and 6200–5700 cm−1 regions, confirming direct observation from the spectra. Interestingly, the extent of the overlap of peaks in the 4400–4000 cm−1 region is noticeable greater than that in the 4000–3600 cm−1 range (Figure 3A), despite similar origin of the major contributing bands, i.e., δring + νCH and δCH + νCH (see Figure 3 and Figure 5, Table 3). Obviously, the degree of overlap of NIR bands rapidly increases with the size of the molecule [40,58]. However, NIR spectrum of menadione consist of relatively sharp and well-resolved peaks, as compared with smaller molecules such as crystalline melamine [33], butyl alcohols [59] or ethanol in CCl4 [60,61]. Therefore, menadione offers an opportunity to elucidate reliable spectra–structure correlations in the NIR region.
As expected, the major contribution to NIR spectra originates from the first overtones of the aromatic C-H stretching modes absorbing above 5900 cm−1 (Figure 4A). However, the presence of the methyl group is clearly seen in the 5900–5600 cm−1 range. The two 2νasCH3 bands (of different symmetry, i.e., 2νasCH3 and 2νas’CH3 according to Pulay’s convention [62]) appear at 5895 and 5817 cm−1. It seems that the former band has an underestimated intensity, and probably it corresponds to the sharp peak at 5887 cm−1 in the experimental spectrum. Interestingly, the 2νsCH3 vibration has only a minor contribution at 5799 cm−1.
In the spectral region from 4780 to 4600 cm−1 appears a series of sharp peaks with a relatively small extent of overlap (Figure 4B). The pronounced absorbance at 4719 cm−1 corresponds to the combination band (νC=O, δring) + νCH, while the peaks at 4646 cm−1 and 4631 cm−1 are due to the other combinations (δring, δCH) + νCH. The prominent intensity of these combination bands and relatively good separation reflects strong coupling between the vibrational modes. This may result from the localization of the modes in a rigid and symmetric ring structure. Similar peaks have been recently observed in polymers having six-membered aromatic rings [63] and in NIR spectra of other systems with aromatic rings [64]. Interestingly, the combinations of ring in-plane deformation with C=O stretching vibrations are more pronounced for menadione than those for the six-membered rings [63]. Further studies are necessary to better understand the impact of the C=O bonds in the aromatic ring on presence of this characteristic pattern in NIR spectra. The presence of a series of strong and isolated combination bands in this spectral range may evidence the presence of aromatic rings in the sample.

3. Materials and Methods

3.1. Experimental

Menadione of high purity (>98%) purchased from Sigma Aldrich (St. Louis, MO, USA) was used as received. MIR spectra were measured by attenuated total reflection (ATR) and diffuse reflectance (DRIFT) techniques on a Nicolet iS50 FT-IR/NIR spectrometer (Thermo Fisher Scientific, Waltham, MA, USA) using KBr beamsplitter and DTGS/KBr detector. IR spectra were measured in the 4000–400 cm−1 range with a resolution of 2 cm−1 and 512 scans were accumulated. DRIFT spectra were measured with the Collector accessory. The sample was mixed with dry KBr to obtain approx. 2% (w/w) solid solution. The sample was prepared directly before the spectral measurements. ATR-IR spectra were acquired by ATR Smart Golden Gate accessory (single reflection, 45° incident angle) with diamond internal reflection element (IRE). Next, the spectra were subjected to ATR correction using the refractive index of the IRE and the sample. NIR spectra were measured on Nicolet iS50 spectrometer (Thermo Fisher Scientific, Waltham, MA, USA), with CaF2 beamsplitter and DTGS/KBr detector. The spectra were collected in the 10,000–4000 cm−1 range with resolution of 4 cm−1 and 256 scans were accumulated.

3.2. Computational Procedures

The simulation of MIR spectra of crystalline menadione was based on harmonic analysis in three-dimensional periodic representation of crystal structure of menadione using Crystal 09 software (Aethia Srl, Turin, Italy) [65]. An infinite 3D models of crystal lattice was constructed by defining the primitive cell based on the experimental structural data obtained from the Cambridge Structural Database (CSD) (Figure 6) [66]. At first, an unconstrained and full geometry optimization involving both the atomic centers and cell parameters was performed. The following parameters were set throughout the geometry and vibrational computing steps. The Monkhorst-Pack reciprocal space was sampled over a shrinking factor of eight. The self-consistent field (SCF) procedure was iteratively converged with a tolerance of 10−13 atomic units per unit cell. The truncation of Coulomb and exchange sums in direct space was controlled by setting the Gaussian overlap tolerance criteria to 10−8, 10−8, 10−8, 10−8, and 10−16. To accelerate the convergence of the SCF procedure, a linear mixing of Fock matrices by 25% between adjacent steps and an energy shifting of 0.8 Hartree for the first SCF cycle were employed. The electron integrals were numerically calculated over a dense (XL) integration grid. The periodic Density Functional Theory (DFT) computations were performed with the use of B3LYP (Becke, three-parameter, Lee-Yang-Parr) [67] single-hybrid density functional, as implemented in Crystal 09 software. The calculations were performed using two different basis sets. In the first one, we applied the basis sets for the respective atomic centers: 3-1p1G for hydrogen, and 6-31d1G for carbon and oxygen. As these basis sets were proposed by Gatti et al. [68], for clarity we refer them as “Gatti” basis sets. The second kind of calculations used triple-ζ valence basis set with polarization (TZVP), applied uniformly for all atomic centers (C, O, H). An application of the TZVP basis set substantially increased the computational time. Harmonic vibrational frequencies and intensities were obtained at the Gamma point in each case. The frequencies were numerically calculated by Crystal 09. To ensure the high stability of this procedure, numerical derivation (the second derivatives of the potential energy) was based on two-point finite difference scheme. The convergence criterion for the vibrational analysis was successfully achieved, as the sonic modes of the crystal lattice approached near zero values (not exceeding −0.5 cm−1).
Simulations of NIR spectra required multi-modal anharmonic computations in order to yield data on binary combinations, which are the most important factors in this spectral region [69]. For this purpose, we applied Deperturbed Vibrational Second-Order Perturbation Theory (DVPT2), and the calculations were performed with Gaussian 16 Rev. B.02 software [70]. Computations of NIR spectra were carried out using DFT approach at B3LYP/SNST [71] level of theory, and additionally refined by applying Grimme’s third version of empirical correction for dispersion with Becke-Johnson damping (GD3BJ) [72]. The considered system is not expected to be appreciably impacted by the dispersion forces, but the modern variants of the dispersion correction should be commonly used with DFT [73], as the gain in accuracy is achieved whenever geometry optimization is performed [74,75,76]. The accuracy of the calculated anharmonic frequencies and intensities is known to be sensitive to the precision of the optimized geometry [77]. The calculations were based on the model of a single molecule in vacuum (Figure S5 in Supplementary Materials). The initial atomic coordinates were extracted from the experimental crystalline structure and subsequently optimized to the local minimum energy. The geometry optimization was performed with very tight convergence criteria. Superfine grids were used for the evaluation of two-electron integrals and solving coupled perturbed Hartree-Fock equations.
The modelling of the MIR and NIR band shapes was carried out by using product of Lorentz-Gauss (Cauchy-Gauss) functions [51,78]. To improve the agreement between the harmonic spectra calculated in periodic conditions with the experimental MIR spectra, we applied a single-parameter scaling based on Yoshida’s wavenumber linear scaling (WLS) method [79]. Such an approach was found to yield helpful improvement of the calculated peak positions in our earlier works in which calculations of IR spectra of crystalline systems were performed [33,41]. No frequency scaling was applied to the anharmonic spectra.

4. Conclusions

A detailed vibrational analysis of MIR and NIR spectra of crystalline menadione (i.e., vitamin K3) was performed with the use of harmonic approximation applied to a periodic model of a crystal lattice and anharmonic DVPT2 calculations applied to an isolated molecule. The combination of different theoretical approaches made possible for successful reconstruction of the experimental spectra and enabled reliable band assignments. For the first time, a detailed analysis of the NIR spectrum of a molecule with naphthoquinone moiety was performed, and new spectra–structure relationships were elucidated. Our results evidence the great importance of overtones and combination bands in the interpretation of MIR spectrum of crystalline menadione. It was estimated that these non-fundamental bands contribute to 46.4% of the total integral intensity in the 3600–2600 cm−1 region. Evidently, they are significant factors influencing the spectral line shape. As shown, the overtones and combination bands absorbing in the regions of MIR spectrum without the fundamental bands (4000–3600 and 2800–1800 cm−1) provide useful structural information. Using a color map, we presented in a clear way the contribution to NIR intensity from different vibrational modes. As shown, the NIR spectrum is dominated by the combination bands, while the first overtones (from νC-H) significantly contribute only in the 6000–5800 cm−1 range. The total contribution to the NIR intensity from the combination modes and first overtones was estimated to be 70% and 30%, respectively. This work provides solid basis for comprehensive interpretation of NIR and MIR spectra of crystalline menadione, and establish new relationships between these two spectral regions.

Supplementary Materials

The following are available online, Figure S1. Untreated experimental ATR and DRIFT IR spectra of crystalline menadione in region of 4000–400 cm−1; Figure S2. Normalized experimental ATR-IR and DRIFT spectra of crystalline menadione in region of 4000–400 cm−1; Figure S3. IR (DRIFT) spectrum of crystalline menadione in the 3400–2800 cm−1 region together with the harmonic spectra calculated by periodic DFT (B3LYP/“Gatti” and B3LYP/TZVP); Figure S4. Experimental ATR spectra of crystalline menadione in region of 4000–400 cm−1 measured in room temperature (bottom) and at around 373 K. Figure S5. The molecule of menadione optimized at B3LYP-GD3BJ/SNST level of theory; Table S1. Geometrical parameters in Cartesian coordinates of menadione optimized at B3LYP-GD3BJ/SNST level of theory; Table S2. Potential energy distributions over the internal coordinates of menadione resulting from harmonic analysis performed at B3LYP-GD3BJ/SNST level of theory.

Author Contributions

Conceptualization, K.B.B.; methodology, K.B.B., J.G. and S.M.; formal analysis, K.B.B. and J.G.; investigation, K.B.B., J.G. and M.A.C.; writing—original draft preparation, K.B.B., J.G. and M.A.C.; writing—review and editing, all authors; supervision, C.W.H. and M.A.C. All authors have read and agreed to the published version of the manuscript.

Funding

This work was funded by the Austrian Science Fund (FWF): M2729-N28. This work was supported by National Science Center Poland, Grant 2017/27/B/ST4/00948.

Data Availability Statement

Data is available from the authors.

Acknowledgments

Calculations have been carried out in Wrocław Centre for Networking and Supercomputing (http:/www.wcss.pl) (accessed on 14 October 2021), under Grant no. 163.

Conflicts of Interest

The authors declare no conflict of interest.

Sample Availability

Samples of the compounds are available from the authors.

References

  1. Walsh, C.T.; Tang, Y. The Chemical Biology of Human Vitamins; The Royal Society of Chemistry: London, UK, 2019. [Google Scholar]
  2. Liao, M.-L.; Seib, P.A. Chemistry of L-ascorbic acid related to foods. Food Chem. 1988, 30, 289–290. [Google Scholar] [CrossRef]
  3. Belzile, M.-N.; Godin, R.; Durantini, A.M.; Cosa, G. Monitoring chemical and biological electron transfer reactions with a fluorogenic vitamin K analogue probe. J. Am. Chem. Soc. 2016, 138, 16388–16397. [Google Scholar] [CrossRef]
  4. Bik, E.; Mateuszuk, L.; Stojak, M.; Chlopicki, S.; Baranska, M.; Majzner, K. Menadione-induced endothelial inflammation detected by Raman spectroscopy. Biochim. Biophys. Acta (BBA) Mol. Cell Res. 1868, 2021, 118911. [Google Scholar] [CrossRef]
  5. Song, C.-Y.; Shen, H.-Z.; Wang, L.-C.; Zhao, J.-H.; Wang, F.-A. Solubilities of vitamin K3 in benzene, toluene, ethylbenzene, o-xylene, m-xylene, and p-xylene between (299.44 and 344.24) K. J. Chem. Eng. Data 2008, 53, 283–285. [Google Scholar] [CrossRef]
  6. Dubbs, M.D.; Gupta, R.B. Solubility of vitamin E (α-tocopherol) and vitamin K3 (menadione) in ethanol−water mixture. J. Chem. Eng. Data 1998, 43, 590–591. [Google Scholar] [CrossRef]
  7. Lu, X.; Nan, M.; Zhang, H.; Liu, X.; Yuan, H.; Yang, J. Investigation of the antioxidant property of ascorbic acid. J. Phys. Chem. C 2007, 111, 14998–15002. [Google Scholar] [CrossRef]
  8. Zhu, B.; Wang, J.-R.; Zhang, Q.; Mei, X. Improving dissolution and photostability of vitamin K3 via cocrystallization with naphthoic acids and sulfamerazine. Cryst. Growth Des. 2016, 16, 483–492. [Google Scholar] [CrossRef]
  9. Yang, Z.; Zhu, B.; Jiang, Y.; Zhang, Z.; Dai, W.; Mei, X. Different solid forms of vitamin K3 and their effect on the chemical stability. Cryst. Growth Des. 2021, 21, 528–535. [Google Scholar] [CrossRef]
  10. Yulia, M.; Suhandy, D.; Ogawa, Y.; Kondo, N. Investigation on the influence of temperature in l-ascorbic acid determination using FTIR-ATR terahertz spectroscopy: Calibration model with temperature compensation. Eng. Agric. Environ. Food 2014, 7, 148–154. [Google Scholar] [CrossRef]
  11. Bichara, L.C.; Lanús, H.E.; Brandán, S.A. Stabilities of aqueous solutions of sucrose containing ascorbic and citric acids by using FTIR spectroscopy and physicochemical studies. J. Mol. Liq. 2014, 200, 448–459. [Google Scholar] [CrossRef]
  12. Bayari, S.; Atac, A.; Yurdakul, S. Coordination behaviour of nicotinamide: An infrared spectroscopic study. J. Mol. Struct. 2003, 655, 163–170. [Google Scholar] [CrossRef]
  13. Kokaislova, A.; Parchansky, V.; Matejka, P. Surface-enhanced infrared spectra of nicotinic acid and pyridoxine on copper substrates: What is the effect of temperature and deposition conditions? J. Phys. Chem. C 2015, 119, 26526–26539. [Google Scholar] [CrossRef]
  14. Machalska, E.; Zajac, G.; Gruca, A.; Zobi, F.; Baranska, M.; Kaczor, A. Resonance Raman optical activity shows unusual structural sensitivity for systems in resonance with multiple excited states: Vitamin B12 case. J. Phys. Chem. Lett. 2020, 11, 5037–5043. [Google Scholar] [CrossRef] [PubMed]
  15. Panicker, C.Y.; Varghese, H.T.; Philip, D. FT-IR, FT-Raman and SERS spectra of vitamin C. Spectrochim. Acta A 2006, 65, 802–804. [Google Scholar] [CrossRef] [PubMed]
  16. Singh, G.; Kaur, S.; Saini, G.S.S. Experimental and theoretical vibrational analysis of vitamin C. Indian J. Pure Appl. Phys. 2007, 45, 714–720. [Google Scholar]
  17. Bichara, L.C.; Lanús, H.E.; Nieto, C.G.; Brandán, S.A. Density functional theory calculations of the molecular force field of l-ascorbic acid, vitamin C. J. Phys. Chem. A 2010, 114, 4997–5004. [Google Scholar] [CrossRef]
  18. Yadav, R.A.; Rani, P.; Kumar, M.; Singh, R.; Singh, P.; Singh, N.P. Experimental IR and Raman spectra and quantum chemical studies of molecular structures, conformers and vibrational characteristics of L-ascorbic acid and its anion and cation. Spectrochim. Acta A 2011, 84, 13–14. [Google Scholar] [CrossRef]
  19. Dabbagh, H.A.; Azami, F.; Farrokhpour, H.; Chermahini, A.N. UV-VIS, NMR and FT-IR spectra of tautomers of vitamin C. Experimental and DFT calculations. J. Chil. Chem. Soc. 2014, 59, 2588–2594. [Google Scholar] [CrossRef] [Green Version]
  20. Falk, M.; Wójcik, M.J. Effect of temperature and hydrogen-bond strength on the i.r. absorption of isolated OH oscillators: Crystalline L-ascorbic acid. Spectrochim. Acta A 1979, 35, 1117–1123. [Google Scholar] [CrossRef]
  21. Dimitrova, Y. Theoretical study of the changes in the vibrational characteristics arising from the hydrogen bonding between Vitamin C (l-ascorbic acid) and H2O. Spectrochim. Acta A 2006, 63, 427–437. [Google Scholar] [CrossRef]
  22. Brela, M.Z.; Wójcik, M.J.; Boczar, M.; Witek, L.; Yasuda, M.; Ozaki, Y. Car-Parrinello molecular Dynamics simulations of infrared spectra of crystalline vitamin C with analysis of double minimum proton potentials for medium-strong hydrogen bonds. J. Phys. Chem. B 2015, 119, 7922–7930. [Google Scholar] [CrossRef]
  23. Balakrishnan, G.; Mohandas, P.; Umapathy, S. Time-resolved resonance Raman spectroscopic studies on the radical anions of menaquinone and naphthoquinone. J. Phys. Chem. 1996, 100, 16475. [Google Scholar] [CrossRef]
  24. Balakrishnan, G.; Mohandas, P.; Umapathy, S. Ab initio studies on structure and vibrational spectra of ubiquinone and its radical anion. Spectrochim. Acta A 1997, 53, 1553–1561. [Google Scholar] [CrossRef]
  25. Grafton, A.K.; Boesch, S.E.; Wheeler, R.A. Structures and properties of vitamin K and its radical anion predicted by a hybrid Hartree-Fock/density functional method. J. Mol. Struct. THEOCHEM 1997, 392, 1–11. [Google Scholar] [CrossRef]
  26. Guo, Y.; Xue, Y.; Shu, X.; Yan, G.S. Density functional theory investigations on the conformational stability and vibrational spectra of the model compound of vitamin K. J. Mol. Struct. THEOCHEM 2007, 820, 40–47. [Google Scholar] [CrossRef]
  27. Kumar, M.; Yadav, R.A. Experimental IR and Raman spectra and quantum chemical studies of molecular structures, conformers and vibrational characteristics of nicotinic acid and its N-oxide. Spectrochim. Acta A 2011, 79, 1316–1325. [Google Scholar] [CrossRef]
  28. Koczoń, P.; Dobrowolski, J.C.; Lewandowski, W.; Mazurek, A.P. Experimental and theoretical IR and Raman spectra of picolinic, nicotinic and isonicotinic acids. J. Mol. Struct. 2003, 655, 89–95. [Google Scholar] [CrossRef]
  29. Beć, K.B.; Grabska, J.; Hofer, T.S. Introduction to quantum vibrational spectroscopy. In Near-Infrared Spectroscopy; Ozaki, Y., Huck, C.W., Tsuchikawa, S., Engelsen, S.B., Eds.; Springer: Singapore, 2021; pp. 83–110. [Google Scholar] [CrossRef]
  30. Ozaki, Y.; Beć, K.B.; Morisawa, Y.; Yamamoto, S.; Tanabe, I.; Huck, C.W.; Hofer, T.S. Advances, challenges and perspectives of quantum chemical approaches in molecular spectroscopy of the condensed phase. Chem. Soc. Rev. 2021. [Google Scholar] [CrossRef]
  31. Beć, K.B.; Huck, C.W. Breakthrough potential in near-infrared spectroscopy: Spectra simulation. A review of recent developments. Front. Chem. 2019, 7, 48. [Google Scholar] [CrossRef] [Green Version]
  32. Liu, H.; Xiang, B.; Qu, L. Structure analysis of ascorbic acid using near-infrared spectroscopy and generalized two-dimensional correlation spectroscopy. J. Mol. Struct. 2006, 794, 12–17. [Google Scholar] [CrossRef]
  33. Grabska, J.; Beć, K.B.; Kirchler, C.G.; Ozaki, Y.; Huck, C.W. Distinct difference in sensitivity of NIR vs. IR bands of melamine to inter-molecular interactions with impact on analytical spectroscopy explained by anharmonic quantum mechanical study. Molecules 2019, 24, 1402. [Google Scholar] [CrossRef] [Green Version]
  34. Xia, J.-F.; Li, X.-J.; Li, P.-W.; Ma, Q.; Ding, X.-X. Application of wavelet transform in the prediction of navel orange vitamin C content by near-infrared spectroscopy. Agric. Sci. China 2007, 6, 1067–1073. [Google Scholar] [CrossRef]
  35. Dos Santos Garcia, V.A.; da Silva, M.R.; Seixas, F.A.V. Rapid analisys of vitamin-C content in acerola extract by FT-NIR spectroscopy. Rev. Tecnol. 2013, 22, 13–21. [Google Scholar]
  36. Blanco, M.; Coello, J.; Iturriaga, H.; Maspoch, S.; de la Pezuela, C. Determination of ascorbic acid in pharmaceutical preparations by near infrared reflectance spectroscopy. Talanta 1993, 40, 1671–1676. [Google Scholar] [CrossRef]
  37. Yang, H.; Irudayaraj, J. Rapid determination of vitamin C by NIR, MIR and FT-Raman techniques. J. Pharm. Pharmacol. 2002, 54, 1247–1255. [Google Scholar] [CrossRef] [PubMed]
  38. Maqbool, M.A.; Aslam, M.; Akbar, W.; Iqbal, Z. Biological importance of vitamins for human health: A review. J. Agric. Basic Sci. 2017, 2, 50–58. [Google Scholar]
  39. Chen, Y.; Morisawa, Y.; Futami, Y.; Czarnecki, M.A.; Wang, H.-S.; Ozaki, Y. Combined IR/NIR and density functional theory calculations analysis of the solvent effects on frequencies and intensities of the fundamental and overtones of the C=O stretching vibrations of acetone and 2-hexanone. J. Phys. Chem. A 2014, 118, 2576–2583. [Google Scholar] [CrossRef]
  40. Beć, K.B.; Grabska, J.; Ozaki, Y.; Hawranek, J.P.; Huck, C.W. Influence of non-fundamental modes on mid-infrared spectra. Anharmonic DFT study of aliphatic ethers. J. Phys. Chem. A 2017, 121, 1412–1424. [Google Scholar] [CrossRef]
  41. Beć, K.B.; Grabska, J.; Czarnecki, M.A.; Huck, C.W.; Wójcik, M.J.; Nakajima, T.; Ozaki, Y. IR spectra of crystalline nucleobases: Combination of periodic harmonic calculations with anharmonic corrections based on finite models. J. Phys. Chem. B 2019, 123, 10001–10013. [Google Scholar] [CrossRef]
  42. Singh, S.; Czarnecki, M.A. How much anharmonicity is in vibrational spectra of CH3I and CD3I? Spectrochim. Acta A 2021, 248, 119176. [Google Scholar] [CrossRef]
  43. Singh, S.; Szostak, R.; Czarnecki, M.A. Vibrational intensities and anharmonicity in MIR, NIR and Raman spectra of liquid CHCl3, CDCl3, CHBr3 and CDBr3: Spectroscopic and theoretical study. J. Mol. Liq. 2021, 336, 116277. [Google Scholar] [CrossRef]
  44. Beć, K.B.; Grabska, J.; Ozaki, Y.; Czarnecki, M.A.; Huck, C.W. Simulated NIR spectra as sensitive markers of the structure and interactions in nucleobases. Sci. Rep. 2019, 9, 17398. [Google Scholar] [CrossRef] [PubMed]
  45. Corinti, D.; Chiavarino, B.; Scuderi, D.; Fraschetti, C.; Filippi, A.; Fornarini, S.; Crestoni, M.E. Molecular properties of bare and microhydrated vitamin B5–calcium complexes. Int. J. Mol. Sci. 2021, 22, 692. [Google Scholar] [CrossRef]
  46. Ebrahimi, S.; Dabbagh, H.A.; Eskandari, K. Nature of intramolecular interactions of vitamin C in view of interacting quantum atoms: The role of hydrogen bond cooperativity on geometry. Phys. Chem. Chem. Phys. 2016, 18, 18278–18288. [Google Scholar] [CrossRef]
  47. Oliviera, L.B.A.; Colherinhas, G.; Castro, M.A. Spectroscopic properties of vitamin E models in solution. Chem. Phys. Lett. 2015, 628, 49–53. [Google Scholar] [CrossRef]
  48. Sato, H.; Murakami, R.; Padermshoke, A.; Hirose, F.; Senda, K.; Noda, I.; Ozaki, Y. Infrared spectroscopy studies of CH···O hydrogen bondings and thermal behavior of biodegradable poly(hydroxyalkanoate). Macromolecules 2004, 37, 7203–7213. [Google Scholar] [CrossRef]
  49. Guo, L.; Sato, H.; Hashimoto, T.; Ozaki, Y. FTIR study on hydrogen-bonding interactions in biodegradable polymer blends of poly(3-hydroxybutyrate) and poly(4-vinylphenol). Macromolecules 2010, 43, 3897–3902. [Google Scholar] [CrossRef]
  50. Beć, K.B.; Futami, Y.; Wójcik, M.J.; Nakajima, T.; Ozaki, Y. Spectroscopic and computational study of acetic acid and its cyclic dimer in the near-infrared region. J. Phys. Chem. A 2016, 120, 6170–6183. [Google Scholar] [CrossRef]
  51. Grabska, J.; Ishigaki, M.; Beć, K.B.; Wójcik, M.J.; Ozaki, Y. Correlations between structure and near-infrared spectra of saturated and unsaturated carboxylic acids. Insight from anharmonic density functional theory calculations. J. Phys. Chem. A 2017, 121, 3437–3451. [Google Scholar] [CrossRef]
  52. Grabska, J.; Beć, K.B.; Ishigaki, M.; Wójcik, M.J.; Ozaki, Y. Spectra-structure correlations of saturated and unsaturated medium-chain fatty acids. Near-infrared and anharmonic DFT study of hexanoic acid and sorbic acid. Spectrochim. Acta A 2017, 185, 35–44. [Google Scholar] [CrossRef]
  53. Grabska, J.; Beć, K.B.; Ishigaki, M.; Huck, C.W.; Ozaki, Y. NIR spectra simulations by anharmonic DFT-saturated and unsaturated long-chain fatty acids. J. Phys. Chem. B 2018, 122, 6931–6944. [Google Scholar] [CrossRef] [PubMed]
  54. Czarnecki, M.A.; Morisawa, Y.; Katsumoto, Y.; Takaya, T.; Singh, S.; Sato, H.; Ozaki, Y. Solvent effect on competition between weak and strong interactions in phenol solutions studied by near-infrared spectroscopy and DFT calculations. Phys. Chem. Chem. Phys. 2021, 23, 19188–19194. [Google Scholar] [CrossRef] [PubMed]
  55. Bernard-Houplain, M.C.; Sandorfy, C. Low-temperature infrared study of sterically hindered associated alcohols. Chem. Phys. Lett. 1974, 27, 154–156. [Google Scholar] [CrossRef]
  56. Sandorfy, C. Chapter 13. In The Hydrogen Bond. Recent Developments in Theory and Experiments; Schuster, P., Zundel, G., Sandorfy, C., Eds.; North-Holland Publ. Co: Amsterdam, The Netherlands, 1976; pp. 615–654. [Google Scholar]
  57. Czarnecki, M.A.; Morisawa, Y.; Futami, Y.; Ozaki, Y. Advances in Molecular Structure and Interaction Studies Using Near-Infrared Spectroscopy. Chem. Rev. 2015, 115, 9707–9744. [Google Scholar] [CrossRef] [PubMed]
  58. Huck, C.W.; Beć, K.B.; Grabska, J.; Ozaki, Y. Quantum chemical calculation of NIR spectra of practical materials. NIR News 2017, 28, 13–20. [Google Scholar] [CrossRef]
  59. Grabska, J.; Beć, K.B.; Ozaki, Y.; Huck, C.W. Temperature drift of conformational equilibria of butyl alcohols studied by near-infrared spectroscopy and fully anharmonic DFT. J. Phys. Chem. A 2017, 121, 1950–1961. [Google Scholar] [CrossRef]
  60. Beć, K.B.; Grabska, J.; Huck, C.W.; Czarnecki, M.A. Spectra–structure correlations in isotopomers of ethanol (CX3CX2OX.; X = H, D): Combined near-infrared and anharmonic computational study. Molecules 2019, 24, 2189. [Google Scholar] [CrossRef] [Green Version]
  61. Beć, K.B.; Grabska, J.; Huck, C.W.; Czarnecki, M.A. Effect of conformational isomerism on NIR spectra of ethanol isotopologues. Spectroscopic and anharmonic DFT study. J. Mol. Liq. 2020, 310, 113271. [Google Scholar] [CrossRef]
  62. Pulay, P.; Fogarasi, G.; Pang, F.; Boggs, J.E. Systematic ab initio gradient calculation of molecular geometries, force constants, and dipole moment derivatives. J. Am. Chem. Soc. 1979, 101, 2550–2560. [Google Scholar] [CrossRef]
  63. Beć, K.B.; Grabska, J.; Badzoka, J.; Huck, C.W. Spectra-structure correlations in NIR region of polymers from quantum chemical calculations. The cases of aromatic ring, C=O, C≡N and C-Cl functionalities. Spectrochim. Acta A 2021, 262, 120085. [Google Scholar] [CrossRef]
  64. Weyer, L.G.; Lo, S.C. Spectra–structure correlations in the near-infrared. In Handbook of Vibrational Spectroscopy; Chalmers, J.M., Griffiths, P.R., Eds.; Wiley: Chichester, UK, 2002; Volume 3, pp. 1817–1837. [Google Scholar]
  65. Dovesi, R.; Saunders, V.R.; Roetti, C.; Orlando, R.; Zicovich-Wilson, C.M.; Pascale, F.; Civalleri, B.; Doll, K.; Harrison, N.M.; Bush, I.J.; et al. CRYSTAL09 User’s Manual; University of Torino: Torino, Italy, 2009. [Google Scholar]
  66. Cambridge Structural Database. Available online: https://www.ccdc.cam.ac.uk/ (accessed on 20 January 2021).
  67. Becke, A.D. Density-functional thermochemistry. III. The role of exact exchange. J. Chem. Phys. 1993, 98, 5648–5652. [Google Scholar] [CrossRef] [Green Version]
  68. Gatti, C.; Saunders, V.R.; Roetti, C. Crystal-field effects on the topological properties of the electron-density in molecular-crystals. The case of urea. J. Chem. Phys. 1994, 101, 10686–10696. [Google Scholar] [CrossRef]
  69. Grabska, J.; Czarnecki, M.A.; Beć, K.B.; Ozaki, Y. Spectroscopic and quantum mechanical calculation study of the effect of isotopic substitution on NIR spectra of methanol. J. Phys. Chem. A 2017, 121, 7925–7936. [Google Scholar] [CrossRef] [PubMed]
  70. Frisch, M.J.; Trucks, G.W.; Schlegel, H.B.; Scuseria, G.E.; Robb, M.A.; Cheeseman, J.R.; Scalmani, G.; Barone, V.; Petersson, G.A.; Nakatsuji, H.; et al. Gaussian 16, Revision B.02; Gaussian, Inc.: Wallingford, CT, USA, 2016. [Google Scholar]
  71. Barone, V.; Biczysko, M.; Bloino, J. Fully anharmonic IR and Raman spectra of medium-size molecular systems: Accuracy and interpretation. J. Phys. Chem. Chem. Phys. 2014, 16, 1759–1787. [Google Scholar] [CrossRef]
  72. Grimme, S.; Antony, J.; Ehrlich, S.; Krieg, H. A consistent and accurate ab initio parameterization of density functional dispersion correction (DFT-D) for the 94 elements H-Pu. J. Chem. Phys. 2010, 132, 154104. [Google Scholar] [CrossRef] [Green Version]
  73. Grimme, S. Density functional theory with London dispersion corrections. WIREs 2011, 1, 211–228. [Google Scholar] [CrossRef]
  74. Risthaus, T.; Steinmetz, M.; Grimme, S. Implementation of nuclear gradients of range-separated hybrid density functionals and benchmarking on rotational constants for organic molecules. J. Comput. Chem. 2014, 35, 1509. [Google Scholar] [CrossRef] [PubMed]
  75. Grimme, S.; Steinmetz, M. Effects of London dispersion correction in density functional theory on the structures of organic molecules in the gas phas. Phys. Chem. Chem. Phys. 2013, 15, 16031–16042. [Google Scholar] [CrossRef]
  76. Folmsbee, D.; Hutchison, G. Assessing conformer energies using electronic structure and machine learning methods. Quantum Chem. 2021, 121, e26381. [Google Scholar] [CrossRef]
  77. Beć, K.B.; Futami, Y.; Wójcik, M.J.; Ozaki, Y. A spectroscopic and theoretical study in the near-infrared region of low concentration aliphatic alcohols. Phys. Chem. Chem. Phys. 2016, 18, 13666–13682. [Google Scholar] [CrossRef]
  78. Bradley, M.S. Lineshapes in IR and Raman spectroscopy: A primer. Spectroscopy 2015, 30, 42–46. [Google Scholar]
  79. Yoshida, H.; Ehara, A.; Matsuura, H. Density functional vibrational analysis using wavenumber-linear scale factors. Chem. Phys. Lett. 2000, 325, 477–483. [Google Scholar] [CrossRef]
Figure 1. Spectrum of crystalline menadione in the 1800–400 cm−1 range together with the harmonic spectra calculated by periodic DFT (B3LYP/”Gatti” and B3LYP/TZVP). The detailed band assignments are presented in Table 1.
Molecules 26 06779 g001
Figure 2. Spectrum of crystalline menadione in the 3600–2600 cm−1 range together with the anharmonic vibrational spectra (DVPT2//B3LYP/SNST). The detailed band assignments are presented in Table 2.
Molecules 26 06779 g002
Figure 3. Spectrum of crystalline menadione in the 4000–3600 cm−1 (A) and 2800–1800 cm−1 (B) range together with the anharmonic (DVPT2//B3LYP/SNST) spectrum.
Molecules 26 06779 g003
Figure 4. Experimental and calculated NIR spectra of Vitamin K3 in 6500–5000 cm−1 (A) and 5000–4500 cm−1 (B) region.
Molecules 26 06779 g004
Figure 5. Contributions from selected vibrational modes to NIR spectrum of menadione.
Molecules 26 06779 g005
Figure 6. (A): Molecular structure of crystalline menadione used in this study; (B): the content of the unit cell, perspective view along the x-axis.
Molecules 26 06779 g006
Table 1. Experimental and calculated band positions [cm−1] together with calculated relative intensities [%] and assignments of the fundamental bands in the 1800–400 cm−1 range for crystalline menadione.
Experimental Position (int.) (a)B3LYP/”Gatti”B3LYP/TZVPPosition Difference (Exp—Calc)Assignment (c)
PositionInt. (b)PositionInt. (b)B3LYP/”Gatti”B3LYP/TZVP
1664 (vs)169282.51665100.0−28−1δring, νC=O
1652 (vs)1679100.0--−27-δring, νC=O
1623 (m)164533.3163226.5−22−9δring (νCC), νC=O
1590 (s)160949.1160189.7−19−11δring, δCH
1461 (w)14921.8148411.8−31−23δring, δCH, δasCH3
1440 (w)14727.014715.9−32−31δasCH3
1425 (w)14595.314138.8−3412δasCH3
1380 (m)14098.8137217.6−298δsCH3
1353 (m)136812.313518.8−152δring, δCH
1329 (m)13563.5--−27-δring, δCH
1299 (s)131066.7131441.2−11−15δring, δCH
1264 (m)127450.9128144.1−10−17δring, δCH
1238 (w)12415.312514.4−3−13δring, δCH
1169 (w)11871.811904.4−18−21δring, δCH
1156 (m)11771.811777.4−21−21δring, δCH
1107 (vw)112614.011302.9−19−23δring, δCH
1030 (vw)10553.510651.5−25−35γCH, ρCH3
1019 (w)10293.510407.4−10−21γCH, ρCH3
940 (w)9505.39615.9−10−21δring
900 (w)93010.59355.9−30−35γring, γCH, ρCH3
883 (w)9197.0--−36-γring, γCH, ρCH3
791 (w)80712.38098.8−16−18γring, γCH
777 (s)79812.37955.9−21−18γring, γCH
720 (w)7223.57271.5−2−7δring
690 (m)70310.569414.7−13−4γring
664 (m)6855.36768.8−21−12γring
650 (vw)6571.86652.9−7−15δring
642 (vw)6511.86541.5−9−12δring
514 (w)5243.55231.5−10−9δring
459 (w)4643.54681.5−5−9δring
405 (w)4125.34144.4−7−9δring
(a) vs—very strong; s—strong; m—medium; w—weak; vw—very weak; (b) normalized to the most intense calculated band, separately for each calculated spectrum (i.e., B3LYP/”Gatti” and B3LYP/TZVP); (c) ν—stretching; δ—in-plane bending; γ—out-of-plane bending; ρ—rocking.
Table 2. Experimental and calculated band positions [cm−1] together with calculated relative intensities [%] and assignments of the fundamental bands in the 3600–2600 cm−1 range for crystalline menadione. Highlighted (bold) are the fundamental bands.
Experimental PositionExp. Intensity (Normalized)Calc. PositionCalc. Intensity (Normalized)Position Difference (Exp—Calc)Assignment (a)
- 337611.0-2(δring, νC=O)
331040.7336035.1−50(δring, νC=O) + (δring, νC=O); 2(δring, νC=O)
327230.4333110.2−59(δring, νC=O) + (δring, νC=O)
323411.932853.5−512(δring, νC=O)
318316.731838.80(δring, δCH) + (δring, δCH)
317319.8316722.962(δring, δCH)
315219.9314115.911δCH + (δring, νC=O)
312627.7312714.3−1δCH + (δring, νC=O)
309554.1310512.9−10δCH + (δring, δCH)
3075; 307088.0; 100.03063100.012; 7νCH; δsymCH3 + (δring, νC=O)
3046; 303864.1; 65.6303760.29; 1νCH
3017; 300943.5; 45.8300321.614; 6νCH
297950.6298449.1−5νasCH3
295864.5294251.616νasCH3
292079.5293454.9−14νsCH3
289221.928978.7−5δring + (δring, δCH)
287820.228867.9−8(δring, δCH) + (δring, δCH)
~286016.1286110.9−1asymCH3
284221.8283212.410asymCH3
28139.328176.7−4δsymCH3 + δasymCH3
(a) ν—stretching; δ—in-plane bending; γ—out-of-plane bending.
Table 3. Experimental and calculated band positions [cm−1] together with calculated relative intensities [%] (normalized to the intensity of 3063 cm−1 band; see Table 2) and assignments of the fundamental bands in the 4000–3600 cm−1 range for crystalline menadione.
Experimental PositionCalc. Position Calc. Intensity (a)Position Difference (Exp—Calc)Assignment (b)
399839941.64(δring, ρCH3) + νasCH3
397039811.5−11δring + νCH
395139561.5−5ρCH3 + νsCH3
394039330.97(δring, ρCH3) + νsCH3
386838541.614(δring, ρCH3) + νCH
385938342.525(δring, ρCH3) + νCH
3802; 378837810.621; 7δring + νCH
374837550.9−7δring + νCH
371837211.2−3δring + νCH
368736940.8−7δring + νCH
366336550.28δring + νasCH3
362736350.2−8δring + νasCH3
361036200.4−10(γring, ρCH3) + νasCH3
(a) normalized to the most intense calculated band; (b) ν—stretching; δ—in-plane bending; γ—out-of-plane bending; ρ—rocking.
Table 4. Experimental and calculated band positions [cm−1] together with calculated relative intensities [%] (normalized to the intensity of 3063 cm−1 band; see Table 2) and assignments of the fundamental bands in the 2800–1800 cm−1 range for crystalline menadione.
Experimental PositionCalc. Position Calc. Intensity (a)Position Difference (Exp—Calc)Assignment (b)
278127801.11δasymCH3 + (δring, δCH)
275927501.99(δring, δCH) + δCH
274727433.64symCH3
272727371.6−10(δring, δCH) + δCH
271127231.6−12δsymCH3 + (δring, δCH)
270227132.1−11(δring, δCH) + δCH
268026874.4−7(δring, δCH) + (δring, δCH)
265526613.4−6(δring, ρCH3) + (δring, νC=O)
262526525.5−272δring
260026331.5−33(δring, δCH) + (δring, δCH)
258626162.4−30(δring, δCH) + δring
256426032.8−39(δring, δCH) + (δring, δCH)
255025803.4−302(δring, δCH)
253625472.3−11(δring, δCH) + δsymCH3
250525061.6−1(δring, δCH) + (δring, δCH)
248924952.7−6(δring, δCH) + (δring, δCH)
245624621.2−6ρCH3 + δasymCH3
244324512.3−8(δring, ρCH3) + δasymCH3
241424322.2−18(δring, δCH) + (δring, δCH)
239624181.6−22ρCH3 + δsymCH3
237823812.1−3(δring, δCH) + (δring, δCH)
237123704.11(δring, δCH) + (δring, δCH)
233023334.1−32(δring, δCH)
231823232.9−52(δring, δCH); (δring, δCH) + (δring, δCH)
229222981.3−6δring (breath) + (δring, δCH)
227522822.1−7δring + (δring, δCH)
227022752.1−5(δring, δCH) + (δring, δCH)
225022552.2−5(δring, δCH) + (δring, δCH)
222322171.862(δring, δCH)
220322042.8−1δring + (δring, δCH)
218821762.312δring + (δring, δCH)
217221631.89δring + (δring, νC=O)
214321403.13(δring, ρCH3) + (δring, δCH)
211121231.6−12(δring, ρCH3) + (δring, δCH)
211421101.24(δring, ρCH3) + (δring, δCH)
209820892.39(δring, ρCH3) + (δring, δCH)
209320801.5132ρCH3
207420571.917δring + (δring, δCH)
205820521.66δring + (δring, νC=O)
202920301.4−1(δring, ρCH3) + (δring, δCH)
20082009; 19974.6/9.0−1; 11δring + (δring, δCH); 2γCH
1981197712.04γCH + γCH
195419593.5−52γCH
194619432.23δring + (δring, δCH)
19031913; 19055.0/6.8−10; −2γCH + γCH
18771892; 18846.5/9.1−15; −7γCH + γCH
184018601.9−20δring + (δring, δCH)
182518245.612γCH
18101817; 18077.8/9.0−7; 3γCH + γCH; δring + (δring, δCH)
(a) normalized to the most intense calculated band; (b) ν—stretching; δ—in-plane bending; γ—out-of-plane bending; ρ—rocking.
Publisher’s Note: MDPI stays neutral with regard to jurisdictional claims in published maps and institutional affiliations.

