Article

Effect of Astaxanthin on the Inhibition of Lipid Accumulation in 3T3-L1 Adipocytes via Modulation of Lipogenesis and Fatty Acid Transport Pathways

1
Department of Nutrition, Chung Shan Medical University, Taichung 40201, Taiwan
2
Department of Nutrition and Health Nutrition, Chinese Culture University, Taipei 11114, Taiwan
3
Institute of Medicine and School of Medicine, Chung Shan Medical University, Taichung 40201, Taiwan
4
Department of Family and Community Medicine, Chung Shan Medical University Hospital, Taichung 40201, Taiwan
5
Department of Nutrition, Chung Shan Medical University Hospital, Taichung 40201, Taiwan
*
Author to whom correspondence should be addressed.
These authors contributed equally to this work.
Molecules 2020, 25(16), 3598; https://doi.org/10.3390/molecules25163598
Submission received: 10 June 2020 / Revised: 3 August 2020 / Accepted: 5 August 2020 / Published: 7 August 2020

Abstract

:
Obesity is defined as a condition of excessive fat tissue accumulation. It was the major factor most closely associated with lifestyle-related diseases. In the present study, we investigated the effect of astaxanthin on the inhibition of lipid accumulation in 3T3-L1 adipocytes. 3T3-L1 adipocytes were treated with 0–25 µg/mL of astaxanthin for 0–48 h. The result indicated that astaxanthin significantly decreased the oil Red O stained material (OROSM), intracellular triglyceride accumulation, and glycerol 3-phosphate dehydrogenase (GPDH) activity in 3T3-L1 adipocytes (p < 0.05). At the molecular level, astaxanthin significantly down-regulated the mRNA expression of peroxisome proliferator-activated receptor-γ (PPARγ) in 3T3-L1 adipocytes (p < 0.05). Moreover, target genes of PPARγ on the inhibition of lipogenesis, such as Acetyl-CoA carboxylase (ACC), fatty acid synthase (FAS), fatty acid binding protein (aP2), cluster of differentiation 36 (CD36), and lipoprotein lipase (LPL) in 3T3-L1 adipocytes were significantly down-regulated at a time-dependent manner (p < 0.05). These results suggested that astaxanthin efficiently suppressed lipid accumulation in 3T3-L1 adipocytes and its action is associated with the down-regulation of lipogenesis-related genes and the triglyceride accumulation in 3T3-L1 adipocytes. Therefore, astaxanthin can be developed as a potential nutraceutical ingredient for the prevention of obesity in a niche market.

1. Introduction

The American Medical Association (AMA) officially recognized obesity as a chronic disease in 2008 [1]. It was a significant risk factor for various diseases such as type 2 diabetes, dyslipidemia, cancer, coronary heart disease, and hypertension [2]. Obesity is a state in which a large amount of lipid droplets accumulate, thus differentiating into a mature adipocyte [3]. The evidence suggests that visceral adipose tissue (VAT) is a highly active metabolic and endocrine organ that secretes several inflammatory cytokines, which influences not only the body-weight homeostasis, but also the metabolism of the liver, muscle, and cardiovascular systems [4]. Glycerol-3-phosphate dehydrogenase (GPDH) is an enzyme that appears to have an important role in the conversion of glycerol into triglyceride [5]. Many studies have reported a close relationship between obesity and oxidative stress [6,7]. Oxidative stress could play a significant role in the development of obesity by stimulating white adipose tissue deposition. Oxidative stress is associated with increased preadipocyte proliferation, adipocyte differentiation, and the size of mature adipocytes in vitro and in vivo [8,9,10].
Many natural dietary compounds (such as flavonoids, stilbene, diarylheptanoids, carotenoids, and phenolics) have exhibited several beneficial effects for the treatment of diseases [11]. Astaxanthin is a class of natural colorful pigments present in marine animals, which have a natural antioxidant and fat-soluble molecule. It is naturally found most abundantly in Haematococcus pluvialis, which accumulates high astaxanthin content under high stress conditions [12]. Olaizola et al. (2008) [13] indicated that astaxanthin possesses antioxidant activity several folds higher than those of other carotenoids and tocopherols. Recently, astaxanthin studies have focused on several biological functions, such as radical scavenging, singlet oxygen quenching, anti-carcinogenesis, anti-diabetic, anti-obesity, anti-inflammatory, and immune enhancement activities. Moreover, the outstanding antioxidant properties of astaxanthin are considered to contribute to the protection of organisms against obesity [14]. Furthermore, astaxanthin enhanced systemic fatty acid utilization, as indicated by reduced respiratory quotient in indirect calorimetry tests [15]. It can also inhibit endoplasmic reticulum stress and lipogenesis at the intracellular level [16]. Peroxisome proliferator-activated receptor (PPAR) has been found to be an important modulator of adipogenesis. PPARγ coordinately drives the expression of adipocyte-specific genes such as adipocyte fatty acid-binding protein 2 (aP2), fatty acid synthase (FAS), acetyl-CoA carboxylase (ACC), lipoprotein lipase (LPL), and cluster of differentiation 36 (CD 36), many of which characterize the final stages of differentiation [17]. Astaxanthin is a PPARγ antagonistic effect on adipocytes [18,19]. However, the literature regarding the effect of astaxanthin on the inhibition of lipid accumulation in 3T3-L1 adipocytes and the molecular mechanisms involved in the regulation of lipid accumulation remains unclear.

2. Results

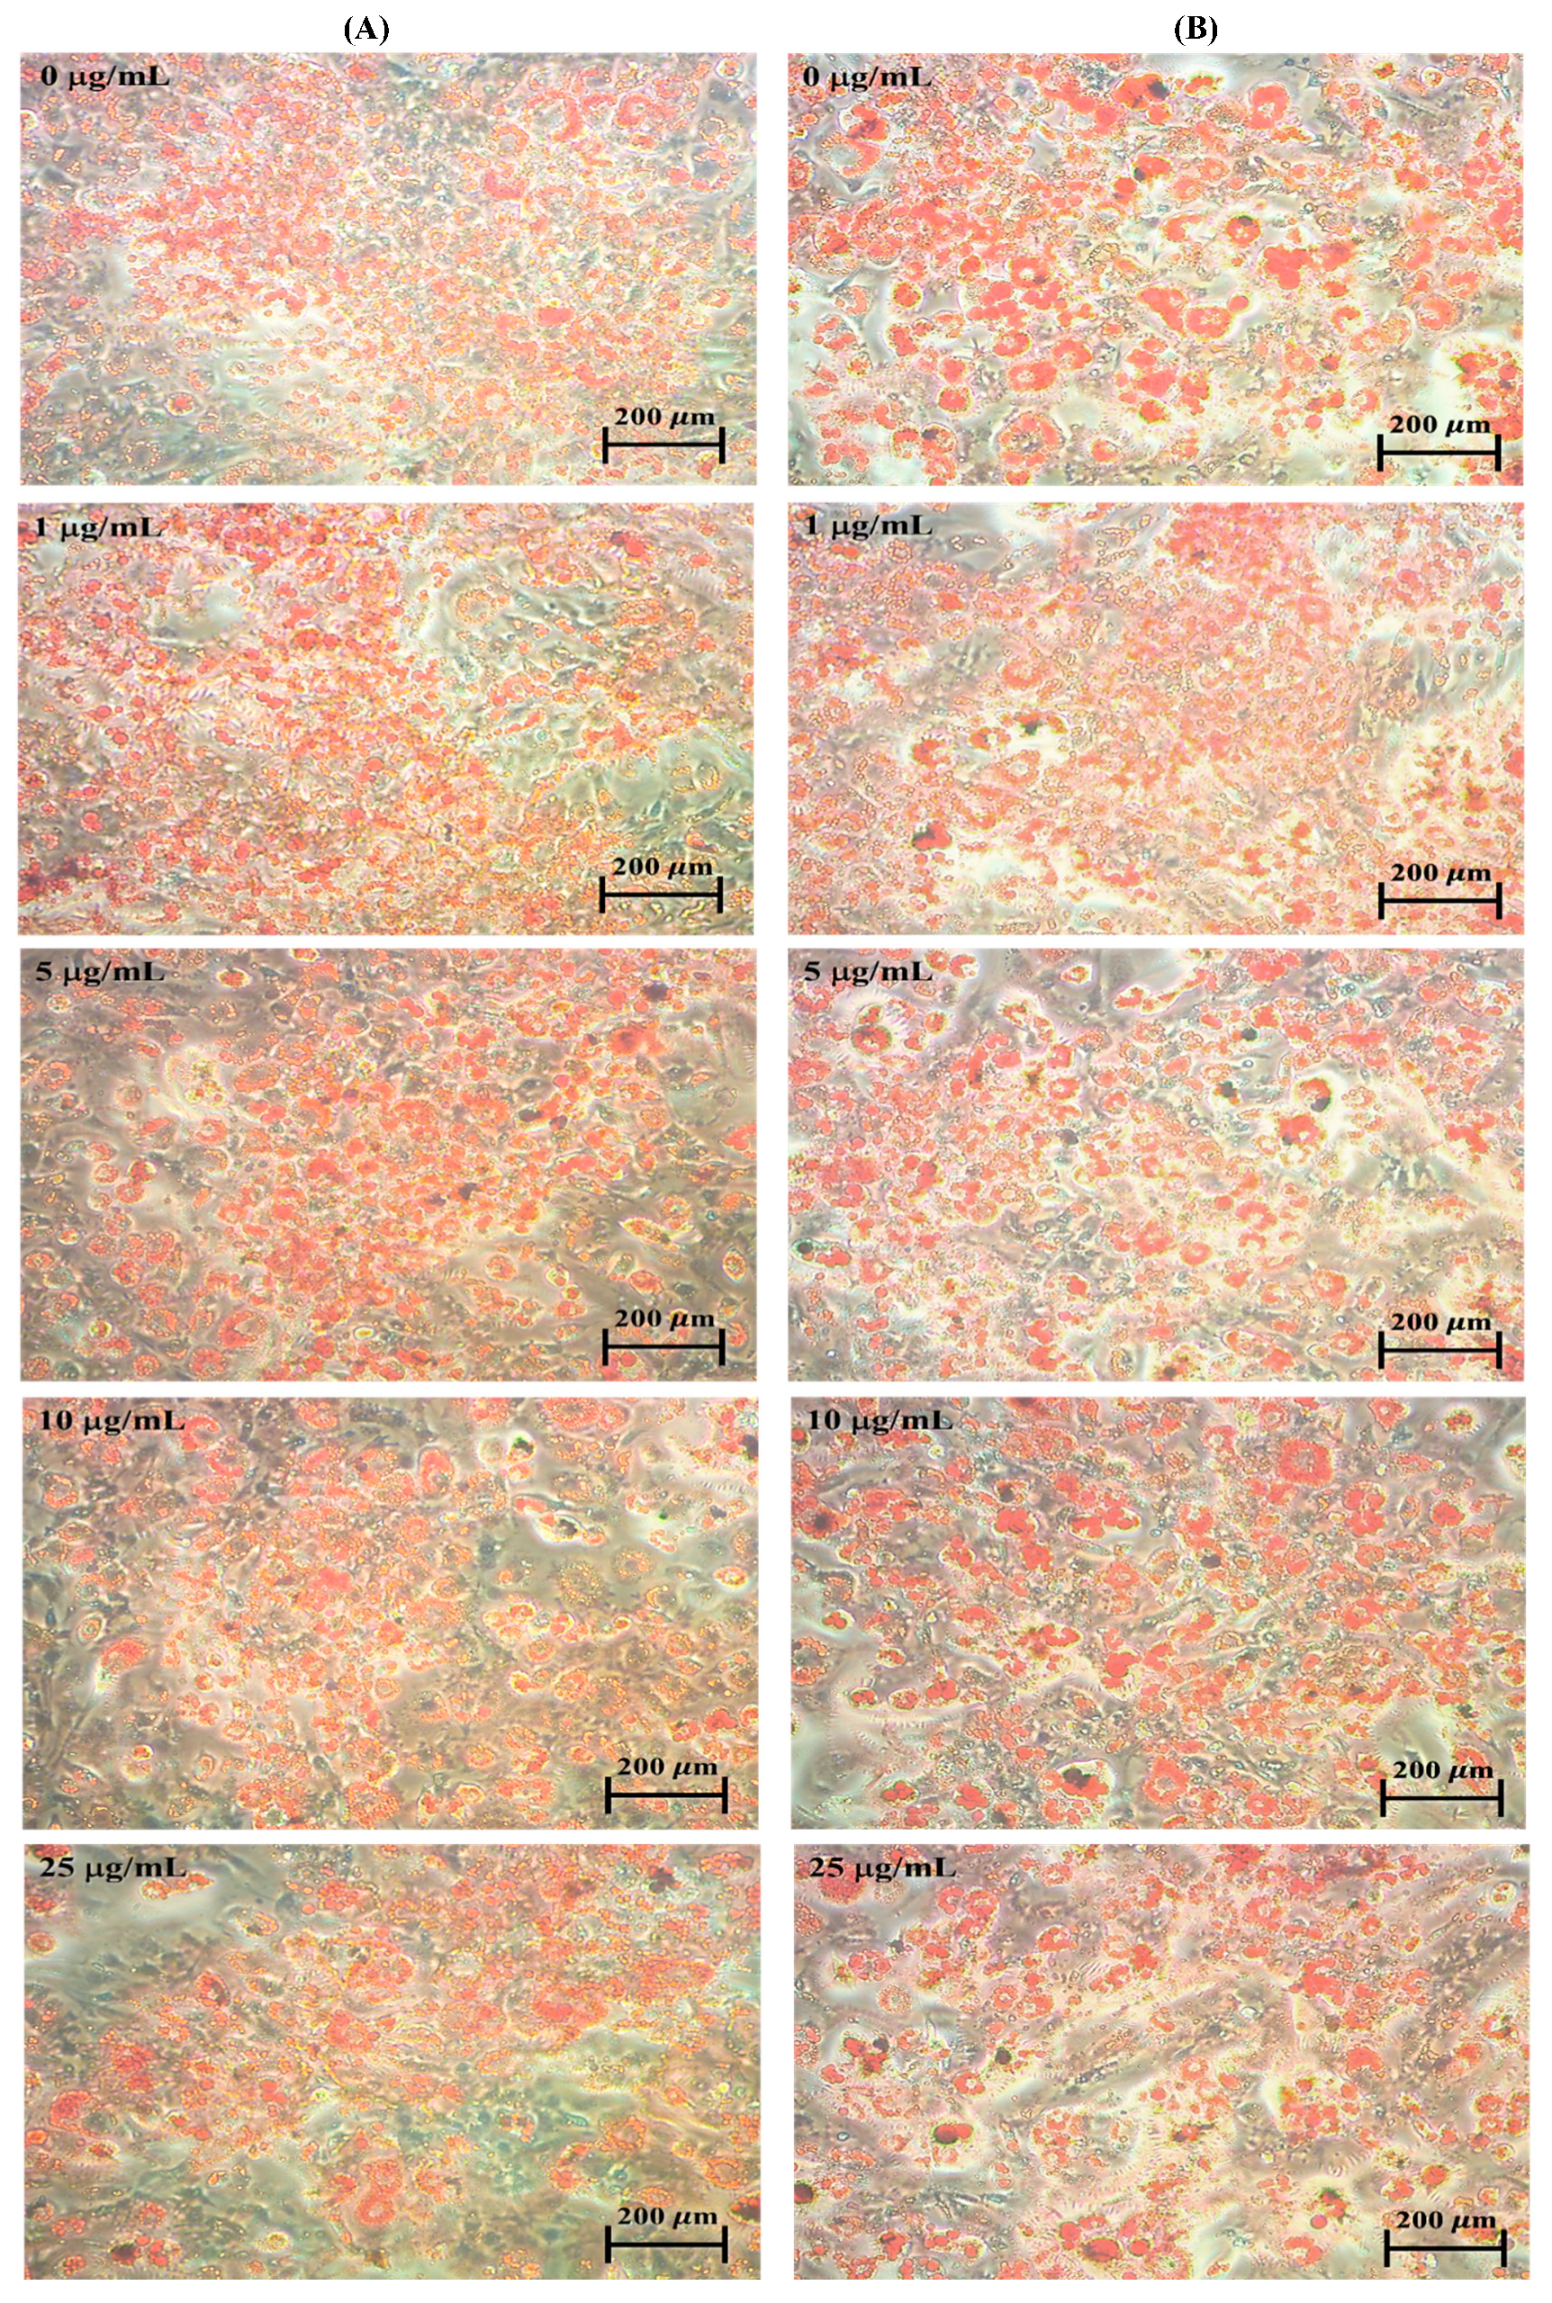
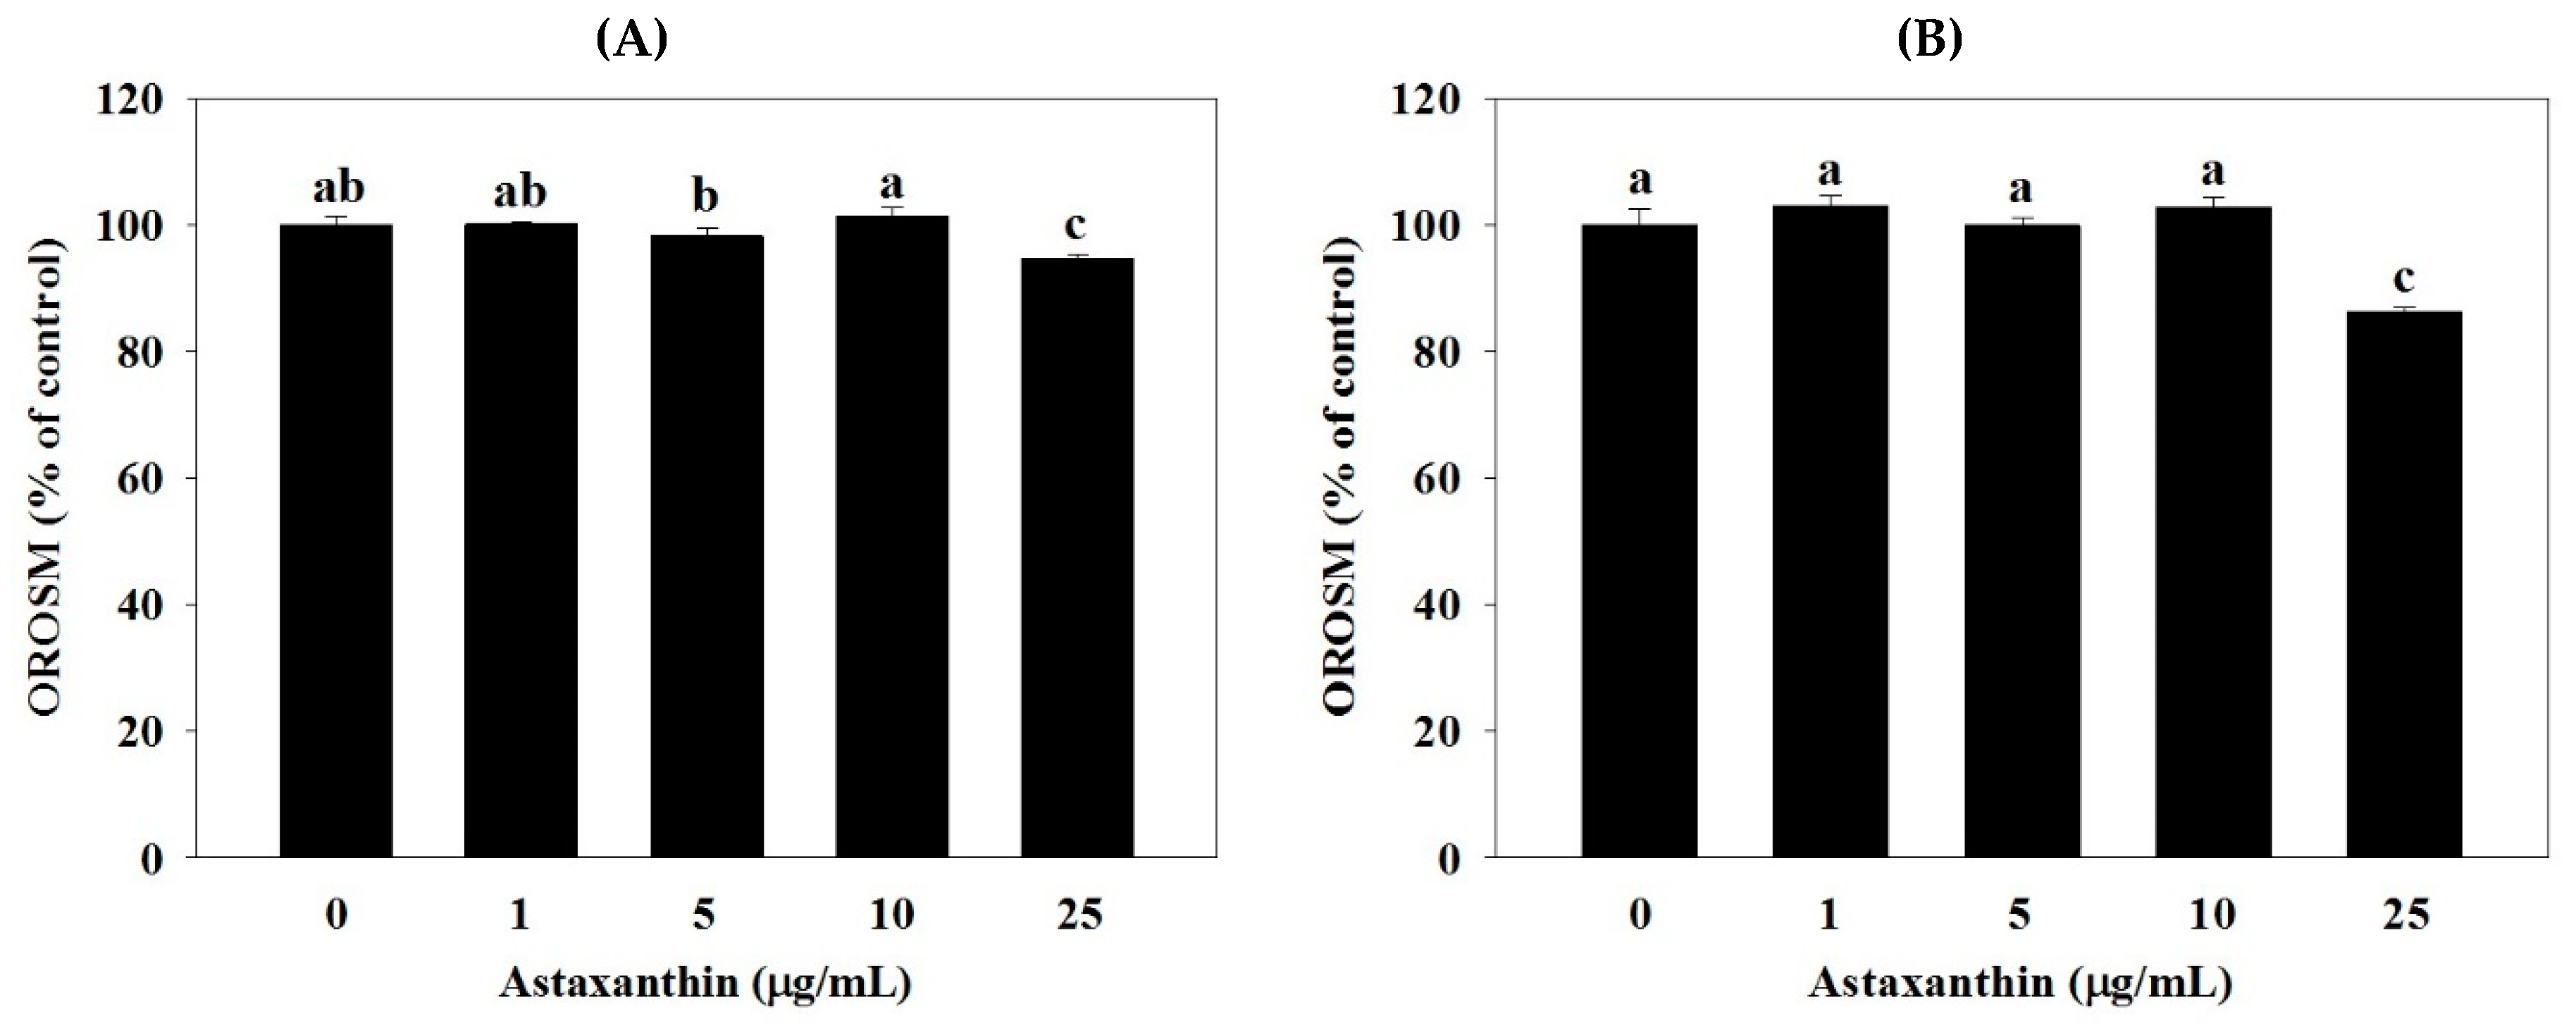
2.1. Effect of Astaxanthin on Oil Red O Stained Material (OROSM) in 3T3-L1 Adipocytes

Figure 1 and Figure 2 show the effect of astaxanthin on oil red stained material (OROSM) in 3T3-L1 adipocytes. Cell number analysis of 3T3-L1 was performed by OROSM after being treated with 0, 1, 5, 10, and 25 µg/mL astaxanthin for 24 and 48 h. As shown in Figure 1 and Figure 2, OROSM indicated that the astaxanthin (treated with 25 µg/mL for 24 and 48 h) had significantly decreased adipocyte numbers to 94.56% (24 h) and 86.21% (48 h), respectively (p < 0.05). Moreover, treatment with 1–10 µg/mL of astaxanthin showed no significant reduction in the level of OROSM at 24 and 48 h in 3T3-L1 adipocytes.

2.2. Effect of Astaxanthin on the Content of Intracellular Triglyceride in 3T3-L1 Adipocytes

The effect of astaxanthin on the inhibition of intracellular triglyceride in 3T3-L1 adipocytes is shown in Figure 3. The results demonstrated that astaxanthin caused an inhibition of intracellular triglyceride in the 3T3-L1 adipocytes. The data revealed that the astaxanthin (treated with 25 µg/mL for 24 h) significantly decreased the level of intracellular triglyceride in 3T3-L1 adipocytes (p < 0.05) (from 100% to 89.10%). Moreover, astaxanthin (1–25 µg/mL, 48 h) also significantly decreased the level of intracellular triglyceride in 3T3-L1 adipocytes (p < 0.05) to 79.24%, 65.59%, 80.08%, and 76.88%, respectively.

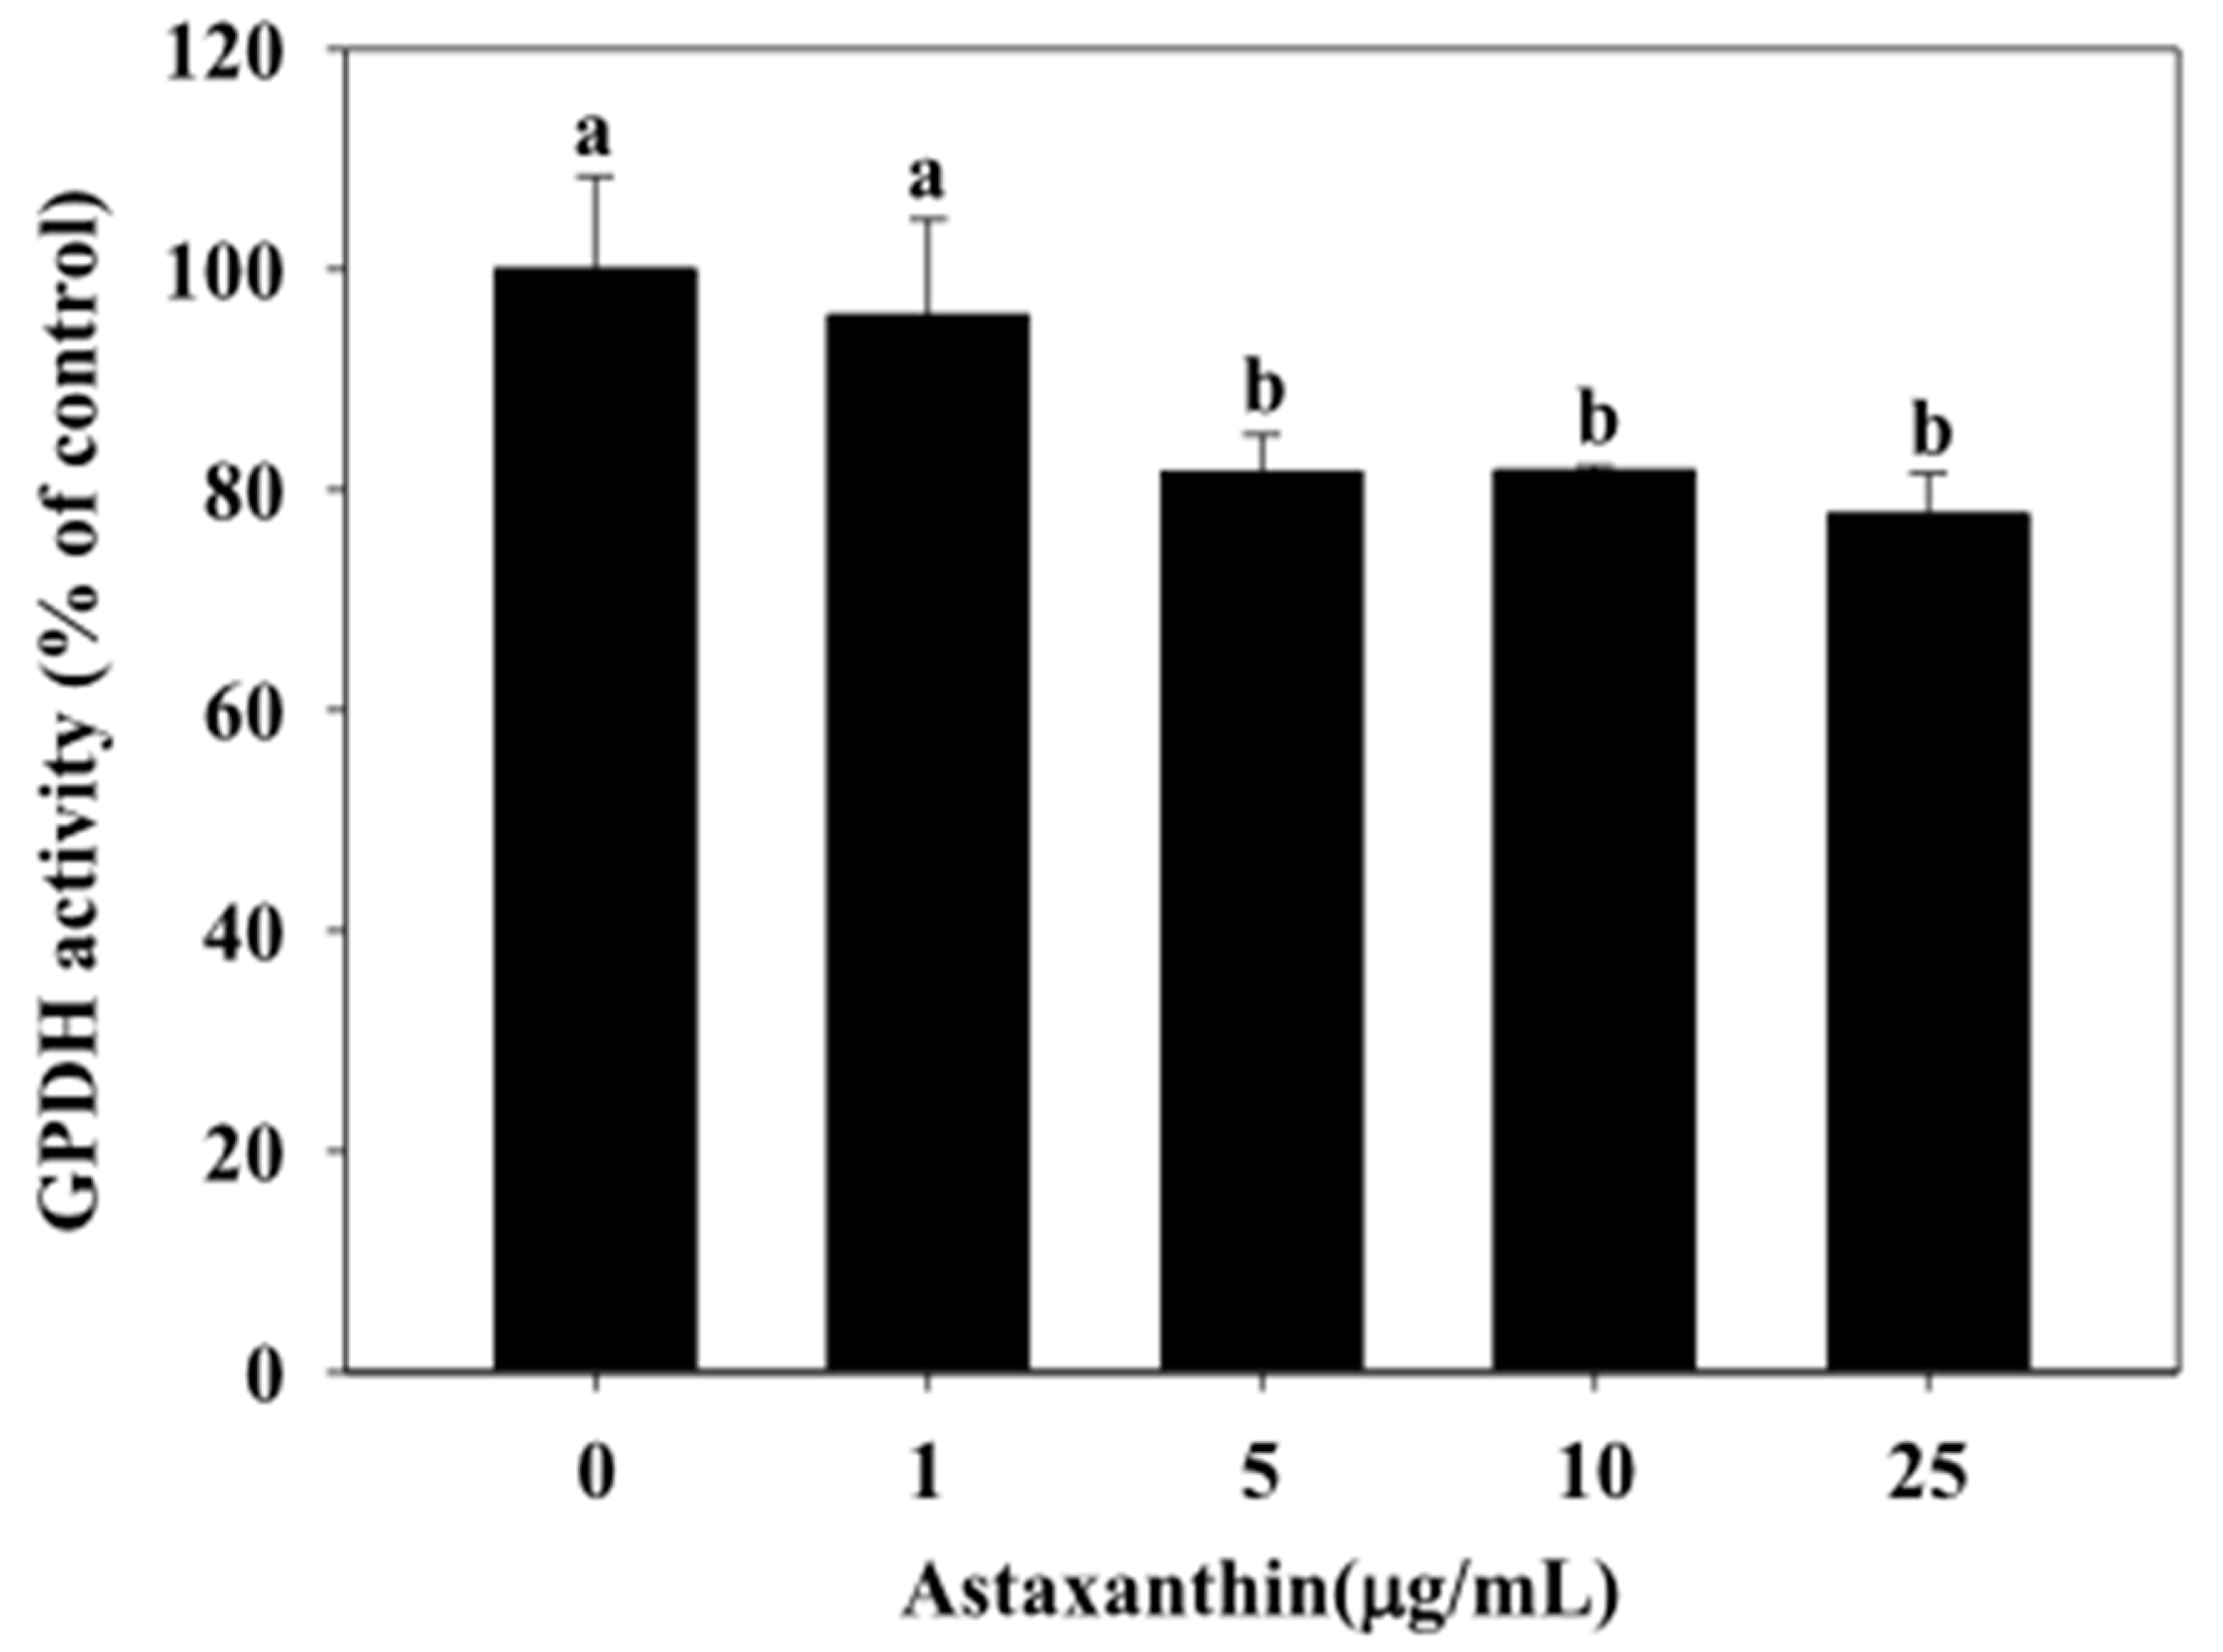
2.3. Effect of Astaxanthin on GPDH Activity in 3T3-L1 Adipocytes

The effect of astaxanthin on GPDH activity in 3T3-L1 adipocytes is shown in Figure 4. The results demonstrated that astaxanthin caused the inhibition of GPDH activity in 3T3-L1 adipocytes. Our data indicated that the astaxanthin (5, 10, and 25 µg/mL for 48 h) significantly decreased the GPDH activity in 3T3-L1 adipocytes (81.62%, 81.73%, and 77.79%, respectively) (p < 0.05).

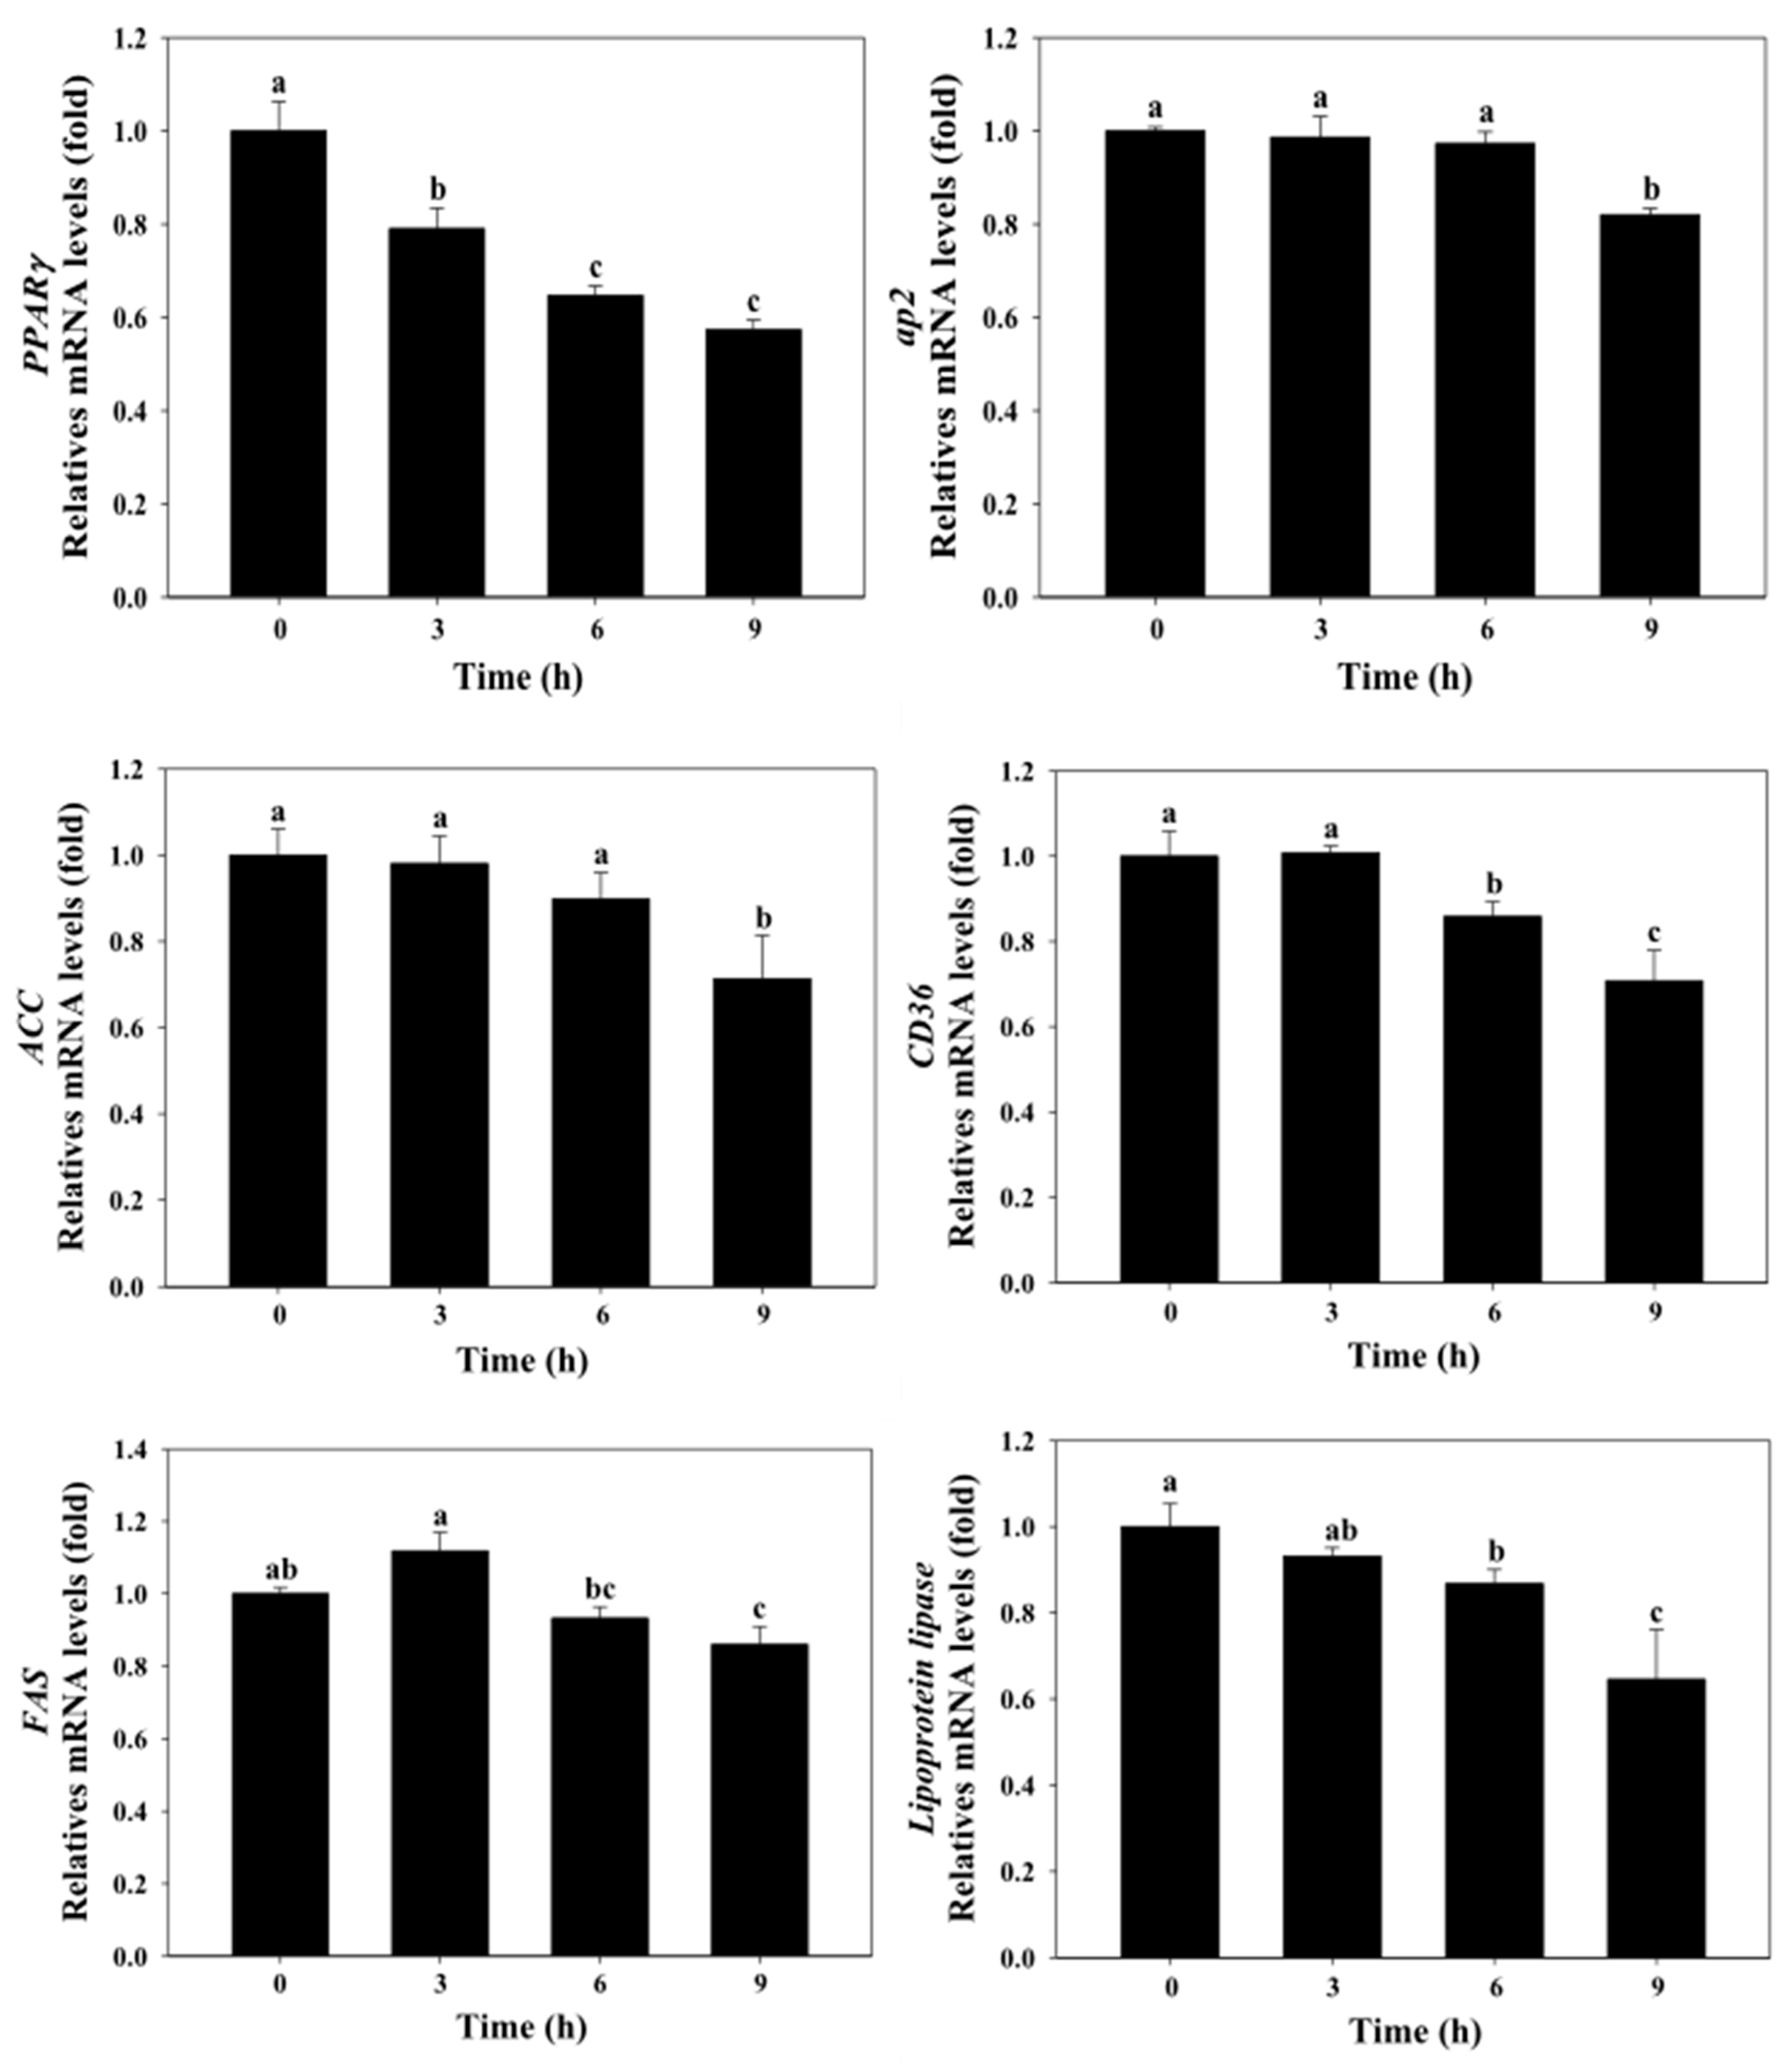
2.4. Effect of Astaxanthin on Gene Expression Levels of Fatty Acid Synthesis in 3T3-L1 Adipocytes

Figure 5 shows the effect of astaxanthin on fatty acid synthesis-related gene expressions levels of PPARγ, ACC, and FAS in 3T3-L1 adipocytes. Astaxanthin (25 µg/mL, 3–9 h) remarkably decreased the gene expression of PPARγ in 3T3-L1 adipocytes. The data also indicated that astaxanthin (25 µg/mL, 9 h) significantly decreased the gene expressions of ACC and FAS in 3T3-L1 adipocytes (p < 0.05).

2.5. Effect of Astaxanthin on Gene Expression Levels of Fatty Acid Transport in 3T3-L1 Adipocytes

Figure 5 shows the effect of astaxanthin on fatty acid transport-related gene expression levels of aP2, CD36, and LPL in 3T3-L1 adipocytes. Astaxanthin (25 µg/mL, 9 h) remarkably decreased the gene expression of aP2 in 3T3-L1 adipocytes. The data also indicated that Astaxanthin (25 µg/mL, 6–9 h) significantly decreased the gene expressions of CD36 and LPL in 3T3-L1 adipocytes (p < 0.05).

3. Discussion

Obesity has become a known globalized health issue. Accompanied by many negative effects on the human body, it is also a major contributing factor to many diseases. It is the result of energy intake exceeding energy expenditure over an extended period. [20]. Wang and Jones indicated that the decreased adipocytic lipogenesis is one of the mechanisms of proposed anti-obesity [21].
Astaxanthin is the most common carotenoid in marine organisms, such as algae and aquatic animals. Previous studies indicated that astaxanthin has multiple pharmacological properties including antioxidant, anti-inflammatory, anti-cancer activities, and anti-adiposity action [22]. Therefore, adipose tissue mass represents an attractive concept for combating obesity and associated metabolic diseases [23]. In the present study, we focused on the effect of astaxanthin on the inhibition of lipid accumulation in 3T3-L1 adipocytes. This inhibitory effect resulted from the repression of adipocyte-specific gene expressions. The OROSM was expressed relative to the numbers of adipocytes counted on comparable plates, decreased to 94.56% at 24 h and to 86.21% at 48 h in astaxanthin treated 3T3-L1 adipocytes (Figure 1 and Figure 2). Inoue et al. [18] demonstrated that the astaxanthin (10 μM) significantly reduced lipid accumulation of 3T3-L1 adipocytes by specifically inhibiting PPARγ transcriptional activity. Jia et al. [24] also showed that astaxanthin significantly reduced intracellular triglyceride and cholesterol when HepG2 cells were treated with 5 and 10 μM astaxanthin for 24 h.
GPDH is the predominant substrate for triglyceride synthesis in adipose tissue [25]. The results showed that exposure of 3T3-L1 adipocytes to astaxanthin caused the inhibition on intracellular triglyceride and GPDH activity in a dose-dependent manner (Figure 3 and Figure 4). Previously reports have proposed several strategies to improve lipid metabolism [21]. Price et al. (2012) [26] indicated the differences signaling pathways resveratrol treatment have at different doses. Therefore, astaxanthin could be a valuable component to improve obesity in optimal doses (5 µg/mL). PPARγ regulates fatty acid storage via activation of genes that stimulate lipid uptake and adipogenesis by fat cells [27]. Thus, overexpression of PPARγ induces lipid accumulation in adipose tissue. For gene expressions, astaxanthin significantly down-regulated the mRNA expression levels of PPARγ and lipogenesis genes (ACC and FAS). Our previous studies showed that astaxanthin inhibited the expressions of lipogenesis at mRNA levels in 3T3-L1 adipocytes (Figure 5). Zhao et al. [28] reported that carotenoids (such as bixin, lycopene, and β-carotene) significantly decreased lipid accumulation in 3T3-L1 adipocytes and markedly down-regulate the protein levels of PPARγ, FABP4, leptin, and ACC.
Activation of PPARγ by its ligands alone also leads to adipocyte differentiation and aP2 expression [29]. Adipocyte fatty acid binding protein (aP2) is a key mediator of intracellular transport and metabolism of fatty acids. Expression of peroxisome proliferator-activated receptor gamma (PPARγ) and CCAAT/enhancer binding protein alpha (C/EBPα) promotes induction of the adipocyte fatty acid binding protein (aP2) in 3T3-L1 adipocytes [30].
FAT/CD36 has an important role for long-chain fatty acids (LCFAs) as a transporter to facilitate the uptake of LCFAs in adipocytes [31]. CD36 expression is up-regulated by PPARγ during the differentiation of adipocyte and macrophage [32]. Our results show that astaxanthin significantly down-regulated the mRNA expression levels of adipocyte lipid-binding protein 2 (aP2) and cluster of differentiation 36 (CD36) (Figure 5).
Lipoprotein lipase (LPL) is the enzyme for the import of triglyceride-derived fatty acids by muscle for utilization and adipose tissue for storage [33]. Overexpression of lipoprotein lipase (LPL) led to profound localized lipid in endothelialized artery [34]. These results show that astaxanthin also down-regulated the mRNA expression of LPL (Figure 5).

4. Experimental Section

4.1. Materials

Astaxanthin (LemnaRed® astaxanthin crystal is manufactured via a fermentation process) was purchased from Lemnaceae Fermentation, Inc. (Taoyuan City, Taiwan). The crystal was compared with Sigma astaxanthin product and identified using high performance liquid chromatography (HPLC) chromatogram (Shimadzu Corporation, Kyoto, Japan) (Figure 6A,B). The wavelength of maximum absorbance is at 477 ± 3 nm and identified with standard product (Figure 6C) (Merck KGaA, Darmstadt, Germany). The total carotenoids content is approximately 93.3%. Total carotenoids contain 91.5% astaxanthin, 3.4% adonirubin, and 3.9% canthaxanthin. It is also worth noting that after the extraction process there is no caller DNA or protein remaining in the LemnaRed® astaxanthin crystal. In addition, astaxanthin in the LemnaRed® astaxanthin crystal is not esterified by fatty acids, and contains 86.3% (3S, 3S’)—all trans astaxanthin, 3.4% 13-cis astaxanthin, and 1.7% 9-cis astaxanthin (Figure 6D).

4.2. 3T3-L1 Cells Differentiation

3T3-L1 preadipocytes (BCRC 60159, cell passage number is 10) were purchased from the Bioresource Collection and Research Center (BCRC, Food Industry Research and Development Institute, Hsinchu, Taiwan). 3T3-L1 preadipocytes were planted into 6-well plates and maintained in DMEM supplemented with 10% bovine calf serum at 37 °C in a humidified 5% CO2 incubator. 3T3-L1 preadipocytes differentiation was induced by the adipogenic agents (0.5 mM 3-isobutyl-1-methylxanthine, 1 µM dexamethasone, and 1 µM insulin) and added to a culture medium. On day 8, differentiation media was removed from the 3T3-L1 adipocytes and normal culture medium was added, and freshly replaced every 48 h.

4.3. Oil Red O Staining

Intracellular lipid accumulation was measured using oil red O staining. The oil red O working solution was prepared as described by Ramirez Zacarias et al. [35]. After ten days of differentiation, the 3T3-L1 adipocytes culture to become mature 3T3-L1 adipocytes. Cells were incubated with 0, 1, 5, 10, and 25 µg/mL of astaxanthin for 24 and 48 h at 37 °C in a humidified 5% CO2 incubator. Cells were washed twice with phosphate buffered saline (PBS, pH 7.4) and then fixed with 10% neutral formalin for 20 min at room temperature. After the 10% neutral formalin was removed, 100% propylene glycol was added to each well for 3 min. Cells were decolorized with 60% propylene glycol before staining for 1 h with the oil red O working solution and then dried at 37 °C in an oven for 1 h. The staining dye of cells was extracted with isopropyl alcohol (1 mL/well) and measured spectrophotometrically at 510 nm in an ASYS UVM 340 microplate reader (Biochrom, Holliston, MA, USA). The OROSM was expressed on a per cell basis using the cell number determined from similar plates. The percentage of oil red O staining material (OROSM, %) relative to control wells containing cell culture medium without compounds was calculated as A510 nm [antioxidant]/A510 nm [control] × 100.

4.4. Intracellular Triglyceride Accumulation

After ten days of differentiation, the 3T3-L1 adipocytes culture to become mature 3T3-L1 adipocytes. Cells were incubated with 0, 1, 5, 10, and 25 µg/mL of astaxanthin for 24 and 48 h at 37 °C in a humidified 5% CO2 incubator. Cells were collected and lysed in lysis buffer (1% Triton X-100 in PBS). The content of total intracellular triglyceride in 3T3-L1 adipocytes was determined using a commercial triglyceride assay kit (DiaSys Diagnostic Systems GmbH, Holzheim, Germany). The content of total protein was determined by using a BioRad DC protein assay kit (Bio-Rad Laboratories, Hercules, CA, USA). Inhibition (%) was expressed as percent decrease in triglyceride content against control (0%).

4.5. Glycerol-3-phosphate Dehydrogenase (GPDH) Activity

After ten days of differentiation, the 3T3-L1 adipocytes culture to become mature 3T3-L1 adipocytes. Cells were incubated with 0, 1, 5, 10, and 25 µg/mL of astaxanthin for 24 and 48 h at 37 °C in a humidified 5% CO2 incubator. Cells were washed twice carefully with ice-cold PBS, and lysed in 25 mM Tris/1 mM EDTA (pH 7.5) for the measurement of glycerol-3-phosphate dehydrogenase (GPDH) specific activity. GPDH activity was determined according to the procedure of Wise and Green [5]. The content of total protein was determined by the BioRad DC protein assay kit (Bio-RadLaboratories, Hercules, CA, USA), which uses bovine serum albumin as a standard. Enzyme activity was expressed as units of activity/mg protein. GPDH activity is expressed as a percentage, with the value of control set at 100%.

4.6. RNA Extraction and Real-Time Reverse Transcription-Polymerase Chain Reaction

Total RNA was isolated from the 3T3-L1 cells using Trizol reagent (Invitrogen, Carlsbad, CA, USA) following the manufacture’s recommendations. The following primer pairs in 3T3-L1 adipocytes were used: GAPDH, 5′-gtatgactccactcacggcaaa-3′ (forward) and 5′-ggtctcgctcctggaagatg-3′ (reverse); PPARγ, 5′-ttttcaagggtgccagtttcgatcc-3′ (forward) and 5′-aatccttggccctctgagat-3′ (reverse); FAS, 5′-tgggttctagccagcagagt-3′ (forward) and 5′-taccaccagagaccgttatgc-3′ (reverse); ACC, 5′-gaatctcctggtgacaatgcttatt-3′ (forward) and 5′-ggtcttgctgagttgggttagct-3′ (reverse); aP2, 5′-catggccaagcccaacat-3′ (forward) and 5′-cgcccagtttgaaggaaatc-3′ (reverse); CD36, 5′-gcttgcaactgtcagcacat-3′ (forward) and 5′-gccttgctgtagccaagaac-3′ (reverse); LPL, 5′-atcggagaactgctcatgatga-3′ (forward) and 5′-cggatcctctcgatgacgaa-3′ (reverse). Real-time quantitative polymerase chain reaction (PCR) was performed with an SYBR GreenTM kit (QuantitectTM SYBR Green PCR; QIAGEN, Valencia, CA, USA). The cycling conditions were 15 min at 95 °C, 40 cycles of 15 s at 94 °C, 30 s at 51 °C, and 30 s at 72 °C. Relative quantification was performed using the ΔΔCt method [36].

4.7. Statistical Analysis

All of the data are expressed as means ± standard deviation. The data were analyzed using analysis of variance (ANOVA). Differences between groups were assessed using Duncan’s test. All statistical analyses of the data were performed using the SPSS software version 13.0 (SPSS Inc., Chicago, IL, USA). A p value of <0.05 was considered statistically significant.

5. Conclusions

This study indicates that astaxanthin could inhibit lipogenesis and lipid deposition in 3T3-L1 adipocytes. Our results indicate that astaxanthin could decrease the intracellular triglyceride, OROSM, and GPDH activity in 3T3-L1 adipocytes. Astaxanthin suppresses the gene expressions levels of lipogenesis (PPARγ, FAS, and ACC) and fatty acid transport (aP2, CD36, and LPL) in 3T3-L1 adipocytes. These findings suggest that astaxanthin have a potent antioxidant carotenoid and may provide a potential therapeutic approach for the treatment of obesity. However, further studies on the molecular action mechanisms as well as clinical investigations are strongly recommended.

Author Contributions

Conceptualization, M.-C.T. and C.-L.H.; Formal analysis, M.-C.T., S.-C.H., and W.-T.C.; Funding acquisition, M.-C.T. and W.-T.C.; Investigation, M.-C.T., S.-C.H., W.-T.C., S.-C.C. and C.-L.H.; Validation, W.-T.C.; Writing—original draft, M.-C.T., S.-C.H., and W.-T.C.; Writing—review and editing, S.-C.H., S.-C.C. and C.-L.H. All authors have read and agreed to the published version of the manuscript.

Funding

This research work was partially supported by grant 106AS-16.4.1-ST-a6 [from the Council of Agriculture, Executive Yuan, Taiwan, Republic of China] and MOST 106-2320-B-040-014 [from the Ministry of Science and Technology, Taiwan, Republic of China].

Conflicts of Interest

The authors declare no conflict of interest.

References

  1. Allison, D.B.; Downey, M.; Atkinson, R.L.; Billington, C.J.; Bray, G.A.; Eckel, R.H.; Finkelstein, E.A.; Jensen, M.D.; Tremblay, A. Obesity as a disease: A white paper on evidence and arguments commissioned by the Council of the Obesity Society. Obesity 2008, 16, 1161–1177. [Google Scholar] [CrossRef]
  2. WHO. World Health Organization Fact Sheet for World Wide Prevalence of Obesity. Available online: https://www.who.int/news-room/fact-sheets/detail/obesity-and-overweight (accessed on 1 April 2020).
  3. Spalding, K.L.; Arner, E.; Westermark, P.O.; Bernard, S.; Buchholz, B.A.; Bergmann, O.; Blomqvist, L.; Hoffstedt, J.; Näslund, E.; Britton, T.; et al. Dynamics of fat cell turnover in humans. Nature 2008, 453, 783–787. [Google Scholar] [CrossRef]
  4. Tarantino, G.; Finelli, C. What about non-alcoholic fatty liver disease as a new criterion to define metabolic syndrome? World J. Gastroenterol. 2013, 19, 3375–3384. [Google Scholar] [CrossRef]
  5. Wise, L.S.; Green, H. Participation of one isozyme of cytosolic glycerophosphate dehydrogenase in the adipose conversion of 3T3 cells. J. Biol. Chem. 1979, 254, 273–275. [Google Scholar] [PubMed]
  6. Olusi, S.O. Obesity is an independent risk factor for plasma lipid peroxidation and depletion of erythrocyte cytoprotective enzymes in humans. Int. J. Obes. Relat. Metab. Disord. 2002, 26, 1159–1164. [Google Scholar] [CrossRef] [Green Version]
  7. Ozata, M.; Mergen, M.; Oktenli, C.; Aydin, A.; Sanisoglu, S.Y.; Bolu, E.; Yilmaz, M.I.; Sayal, A.; Isimer, A.; Ozdemir, I.C. Increased oxidative stress and hypozincemia in male obesity. Clin. Biochem. 2002, 35, 627–631. [Google Scholar] [CrossRef] [PubMed]
  8. Furukawa, S.; Fujita, T.; Shimabukuro, M.; Iwaki, M.; Yamada, Y.; Nakajima, Y.; Nakayama, O.; Makishima, M.; Matsuda, M.; Shimomura, I. Increased oxidative stress in obesity and its impact on metabolic syndrome. J. Clin. Investig. 2004, 114, 1752–1761. [Google Scholar] [CrossRef]
  9. Lee, H.; Lee, Y.J.; Choi, H.; Ko, E.H.; Kim, J.W. Reactive oxygen species facilitate adipocyte differentiation by accelerating mitotic clonal expansion. J. Biol. Chem. 2009, 284, 10601–10609. [Google Scholar] [CrossRef] [Green Version]
  10. Higuchi, M.; Dusting, G.J.; Peshavariya, H.; Jiang, F.; Hsiao, S.T.; Chan, E.C.; Liu, G.S. Differentiation of human adipose-derived stem cells into fat involves reactive oxygen species and forkhead box o1 mediated upregulation of antioxidant enzymes. Stem Cells Dev. 2013, 22, 878–888. [Google Scholar] [CrossRef] [Green Version]
  11. Wu, J.C.; Lai, C.S.; Tsai, M.L.; Ho, C.T.; Wang, Y.J.; Pan, M.H. Chemopreventive effect of natural dietary compounds on xenobiotic-induced toxicity. J. Food Drug Anal. 2017, 25, 176–186. [Google Scholar] [CrossRef] [Green Version]
  12. Zhang, J.; Peng, C.A. Enhanced proliferation and differentiation of mesenchymal stem cells by astaxanthin-encapsulated polymeric micelles. PLoS ONE 2019, 14, e0216755. [Google Scholar] [CrossRef]
  13. Olaizola, M. The production and health benefits of astaxanthin. Mar. Nutraceuticals Funct. Foods 2008, 321–343. [Google Scholar] [CrossRef]
  14. Choi, H.D.; Kim, J.H.; Chang, M.J.; Kyu-Youn, Y.; Shin, W.G. Effects of astaxanthin on oxidative stress in overweight and obese adults. Phytother. Res. 2011, 25, 1813–1818. [Google Scholar] [CrossRef]
  15. Ikeuchi, M.; Koyama, T.; Takahashi, J.; Yazawa, K. Effects of astaxanthin in obese mice fed a high-fat diet. Biotechnol. Biochem. 2007, 71, 893–899. [Google Scholar] [CrossRef] [Green Version]
  16. Yang, J.P.; Shin, J.H.; Seo, S.H.; Kim, S.G.; Lee, S.H.; Shin, E.H. Effects of antioxidants in reducing accumulation of fat in hepatocyte. Int. J. Mol. Sci. 2018, 19, 2563. [Google Scholar] [CrossRef] [Green Version]
  17. Farmer, S.R. Transcriptional control of adipocyte formation. Cell Metab. 2006, 4, 263–273. [Google Scholar] [CrossRef] [Green Version]
  18. Inoue, M.; Tanabe, H.; Matsumoto, A.; Takagi, M.; Umegaki, K.; Amagaya, S.; Takahashi, J. Astaxanthin functions differently as a selective peroxisome proliferator-activated receptor γ modulator in adipocytes and macrophages. Biochem. Pharm. 2012, 84, 692–700. [Google Scholar] [CrossRef]
  19. Jia, Y.; Wu, C.; Kim, J.; Kim, B.; Lee, S.J. Astaxanthin reduces hepatic lipid accumulations in high-fat-fed C57BL/6J mice via activation of peroxisome proliferator-activated receptor (PPAR) alpha and inhibition of PPAR gamma and Akt. J. Nutr. Biochem. 2016, 28, 9–18. [Google Scholar] [CrossRef]
  20. Tseng, Y.H.; Cypess, A.M.; Kahn, C.R. Cellular bioenergetics as a target for obesity therapy. Nat. Rev. Drug Discov. 2010, 9, 465–482. [Google Scholar] [CrossRef] [Green Version]
  21. Wang, Y.W.; Jones, P.J. Conjugated linoleic acid and obesity control: Efficacy and mechanisms. Int. J. Obes. Relat. Metab. Disord. 2004, 28, 941–955. [Google Scholar] [CrossRef] [Green Version]
  22. Choi, C.I. Astaxanthin as a peroxisome proliferator-activated receptor (PPAR) modulator: Its therapeutic implications. Mar. Drugs 2019, 17, 242. [Google Scholar] [CrossRef] [PubMed] [Green Version]
  23. Seidell, J.C. Obesity, insulin resistance and diabetes-a worldwide epidemic. Br. J. Nutr. 2000, 83, S5–S8. [Google Scholar] [CrossRef] [PubMed] [Green Version]
  24. Jia, Y.; Kim, J.Y.; Jun, H.J.; Kim, S.J.; Lee, J.H.; Hoang, M.H.; Hwang, K.Y.; Um, S.J.; Chang, H.I.; Lee, S.J. The natural carotenoid astaxanthin, a PPAR-α agonist and PPAR-γ antagonist, reduces hepatic lipid accumulation by rewiring the transcriptome in lipid-loaded hepatocytes. Mol. Nutr. Food Res. 2012, 56, 878–888. [Google Scholar] [CrossRef]
  25. Tomiyama, K.; Nakata, H.; Sasa, H.; Arimura, S.; Nishio, E.; Watanabe, Y. Wortmannin, a specific phosphatidylinositol 3-kinase inhibitor, inhibits adipocytic differentiation of 3T3-L1 cells. Biochem. Biophys. Res. Commun. 1995, 212, 263–269. [Google Scholar] [CrossRef]
  26. Price, N.L.; Gomes, A.P.; Ling, A.J.; Duarte, F.V.; Martin-Montalvo, A.; North, B.J.; Agarwal, B.; Ye, L.; Ramadori, G.; Teodoro, J.S. SIRT1 is required for AMPK activation and the beneficial effects of resveratrol on mitochondrial function. Cell Metab. 2012, 15, 675–690. [Google Scholar] [CrossRef] [Green Version]
  27. Jones, J.R.; Barrick, C.; Kim, K.A.; Lindner, J.; Blondeau, B.; Fujimoto, Y.; Shiota, M.; Kesterson, R.A.; Kahn, B.B.; Magnuson, M.A. Deletion of PPARγ in adipose tissues of mice protects against high fat diet-induced obesity and insulin resistance. Proc. Natl. Acad. Sci. USA 2005, 102, 6207–6212. [Google Scholar] [CrossRef] [Green Version]
  28. Zhao, W.E.; Fan, J.; Gao, R.; Ngoc, N.B. Suppressive effects of carotenoids on proliferation and differentiation of 3T3-L1 preadipocytes. J. Food Nutr. Res. 2017, 5, 129–136. [Google Scholar]
  29. Pearson, S.L.; Cawthorne, M.A.; Clapham, J.C.; Dunmore, S.J.; Holmes, S.D.; Moore, G.B.T.; Smith, S.A.; Tadayyon, M. The thiazolidinedione insulin sensitiser, BRL 49653, increases the expression of PPAR and aP2 in adipose tissue of high-fat-fed rats. Biochem. Biophys. Res. Commun. 1996, 229, 752–757. [Google Scholar] [CrossRef]
  30. Sun, L.; Nicholson, A.C.; Hajjar, D.P.; Gotto, A.M., Jr.; Han, J. Adipogenic differentiating agents regulate expression of fatty acid binding protein and CD36 in the J744 macrophage cell line. J. Lipid Res. 2003, 44, 1877–1886. [Google Scholar] [CrossRef] [Green Version]
  31. Coburn, C.T.; Knapp, F.F., Jr.; Febbraio, M.; Beets, A.L.; Silverstein, R.L.; Abumrad, N.A. Defective uptake and utilization of long chain fatty acids in muscle and adipose tissues of CD36 knockout mice. J. Biol. Chem. 2000, 275, 32523–32529. [Google Scholar] [CrossRef] [Green Version]
  32. Tontonoz, P.; Nagy, L.; Alvarez, J.G.; Thomazy, V.A.; Evans, R.M. PPARγ monocyte/macrophage differentiation and uptake of oxidized LDL. Cell 1998, 93, 241–252. [Google Scholar] [CrossRef] [Green Version]
  33. Weinstock, P.H.; Levak-Frank, S.; Hudgins, L.C.; Radner, H.; Friedman, J.M.; Zechner, R.; Breslow, J.L. Lipoprotein lipase controls fatty acid entry into adipose tissue, but fat mass is preserved by endogenous synthesis in mice deficient in adipose tissue lipoprotein lipase. Proc. Natl. Acad. Sci. USA 1997, 94, 10261–10266, PMCID: PMC23350. [Google Scholar] [CrossRef] [Green Version]
  34. Wang, J.; Xian, X.; Huang, W.; Chen, L.; Wu, L.; Zhu, Y.; Fan, J.; Ross, C.; Hayden, M.R.; Liu, G. Expression of LPL in endothelial-intact artery results in lipid deposition and vascular cell adhesion molecule-1 upregulation in both LPL and ApoE-deficient mice. Arter. Thromb. Vasc. Biol. 2007, 27, 197–203. [Google Scholar] [CrossRef]
  35. Ramírez-Zacarías, J.L.; Castro-Muñozledo, F.; Kuri-Harcuch, W. Quantitation of adipose conversion and triglycerides by staining intracytoplasmic lipids with Oil red O. Histochemistry 1992, 97, 493–497. [Google Scholar] [CrossRef] [PubMed]
  36. Livak, K.J.; Schmittgen, T.D. Analysis of relative gene expression data using real-time quantitative PCR and the 2(-Delta Delta C(T)) Method. Methods 2001, 25, 402–408. [Google Scholar] [CrossRef]
Sample Availability: Samples are not available from the authors.
Figure 1. Effect of astaxanthin on cell morphological in 3T3-L1 adipocytes. 3T3-L1 adipocytes were stained with oil red O stained material (OROSM) after treatment with 0–25 μg/mL of astaxanthin for 24 h (A) and 48 h (B) at 37 °C in a 5% CO2 incubator. Original magnification: 200×.
Molecules 25 03598 g001
Figure 2. Effect of astaxanthin on OROSM in 3T3-L1 adipocytes. Percentage (%) is expressed as control at 100%. 3T3-L1 adipocytes were incubated with 0–25 μg/mL of astaxanthin for 24 h (A) and 48 h (B) at 37 °C in 5% CO2 incubator. The reported values are the means ± SD (n = 3). Mean values with different letters were significantly different (p < 0.05).
Molecules 25 03598 g002
Figure 3. Effect of astaxanthin on inhibition of intracellular triglyceride in 3T3-L1 adipocytes. Percentage (%) is expressed as control at 100%. 3T3-L1 adipocytes were incubated with 0–25 μg/mL of astaxanthin for 24 h (A) and 48 h (B) at 37 °C in 5% CO2 incubator. The reported values are the means ± SD (n = 3). Mean values with different letters were significantly different (p < 0.05).
Molecules 25 03598 g003
Figure 4. Effect of astaxanthin on glycerol-3-phosphate dehydrogenase (GPDH) activity in 3T3-L1 adipocytes. Percentage (%) is expressed as control at 100%. 3T3-L1 adipocytes were incubated with 0–25 μg/mL of astaxanthin for 48 h at 37 °C in 5% CO2 incubator. The reported values are the means ± SD (n = 3). Mean values with different letters were significantly different (p < 0.05).
Molecules 25 03598 g004
Figure 5. Effect of astaxanthin on gene expression levels of PPARγ, ACC, FAS, aP2, CD36, and LPL in 3T3-L1 adipocytes. The reported values are the means ± SD (n = 3). Mean values with different letters were significantly different (p < 0.05). 3T3-L1 adipocytes were treated with 25 μg/mL of astaxanthin for 0, 3, 6, and 9 h at 37 °C in a humidified 5% CO2 incubator. The values of PPARγ, ACC, FAS, aP2, CD36, and LPL mRNA were normalized to the value of GAPDH.
Molecules 25 03598 g005
Figure 6. High performance liquid chromatography (HPLC) chromatogram of astaxanthin (A) and standard (B). The absorption spectrum of astaxanthin from LemnaRed and standard using UV-VIS Spectrophotometer (C). Total carotenoids content of LemnaRed sample (D).
Molecules 25 03598 g006

