Towards Intelligent Drug Design System: Application of Artificial Dipeptide Receptor Library in QSAR-Oriented Studies

 , ,
, ,  and
and
Abstract
:
1. Introduction
2. Results and Discussion
2.1. Library of Docked Anticancer Active Triazine Derivatives
2.2. In Silico Evaluation of In Vitro Anticancer Activity Using CoMSA and SMV Approach
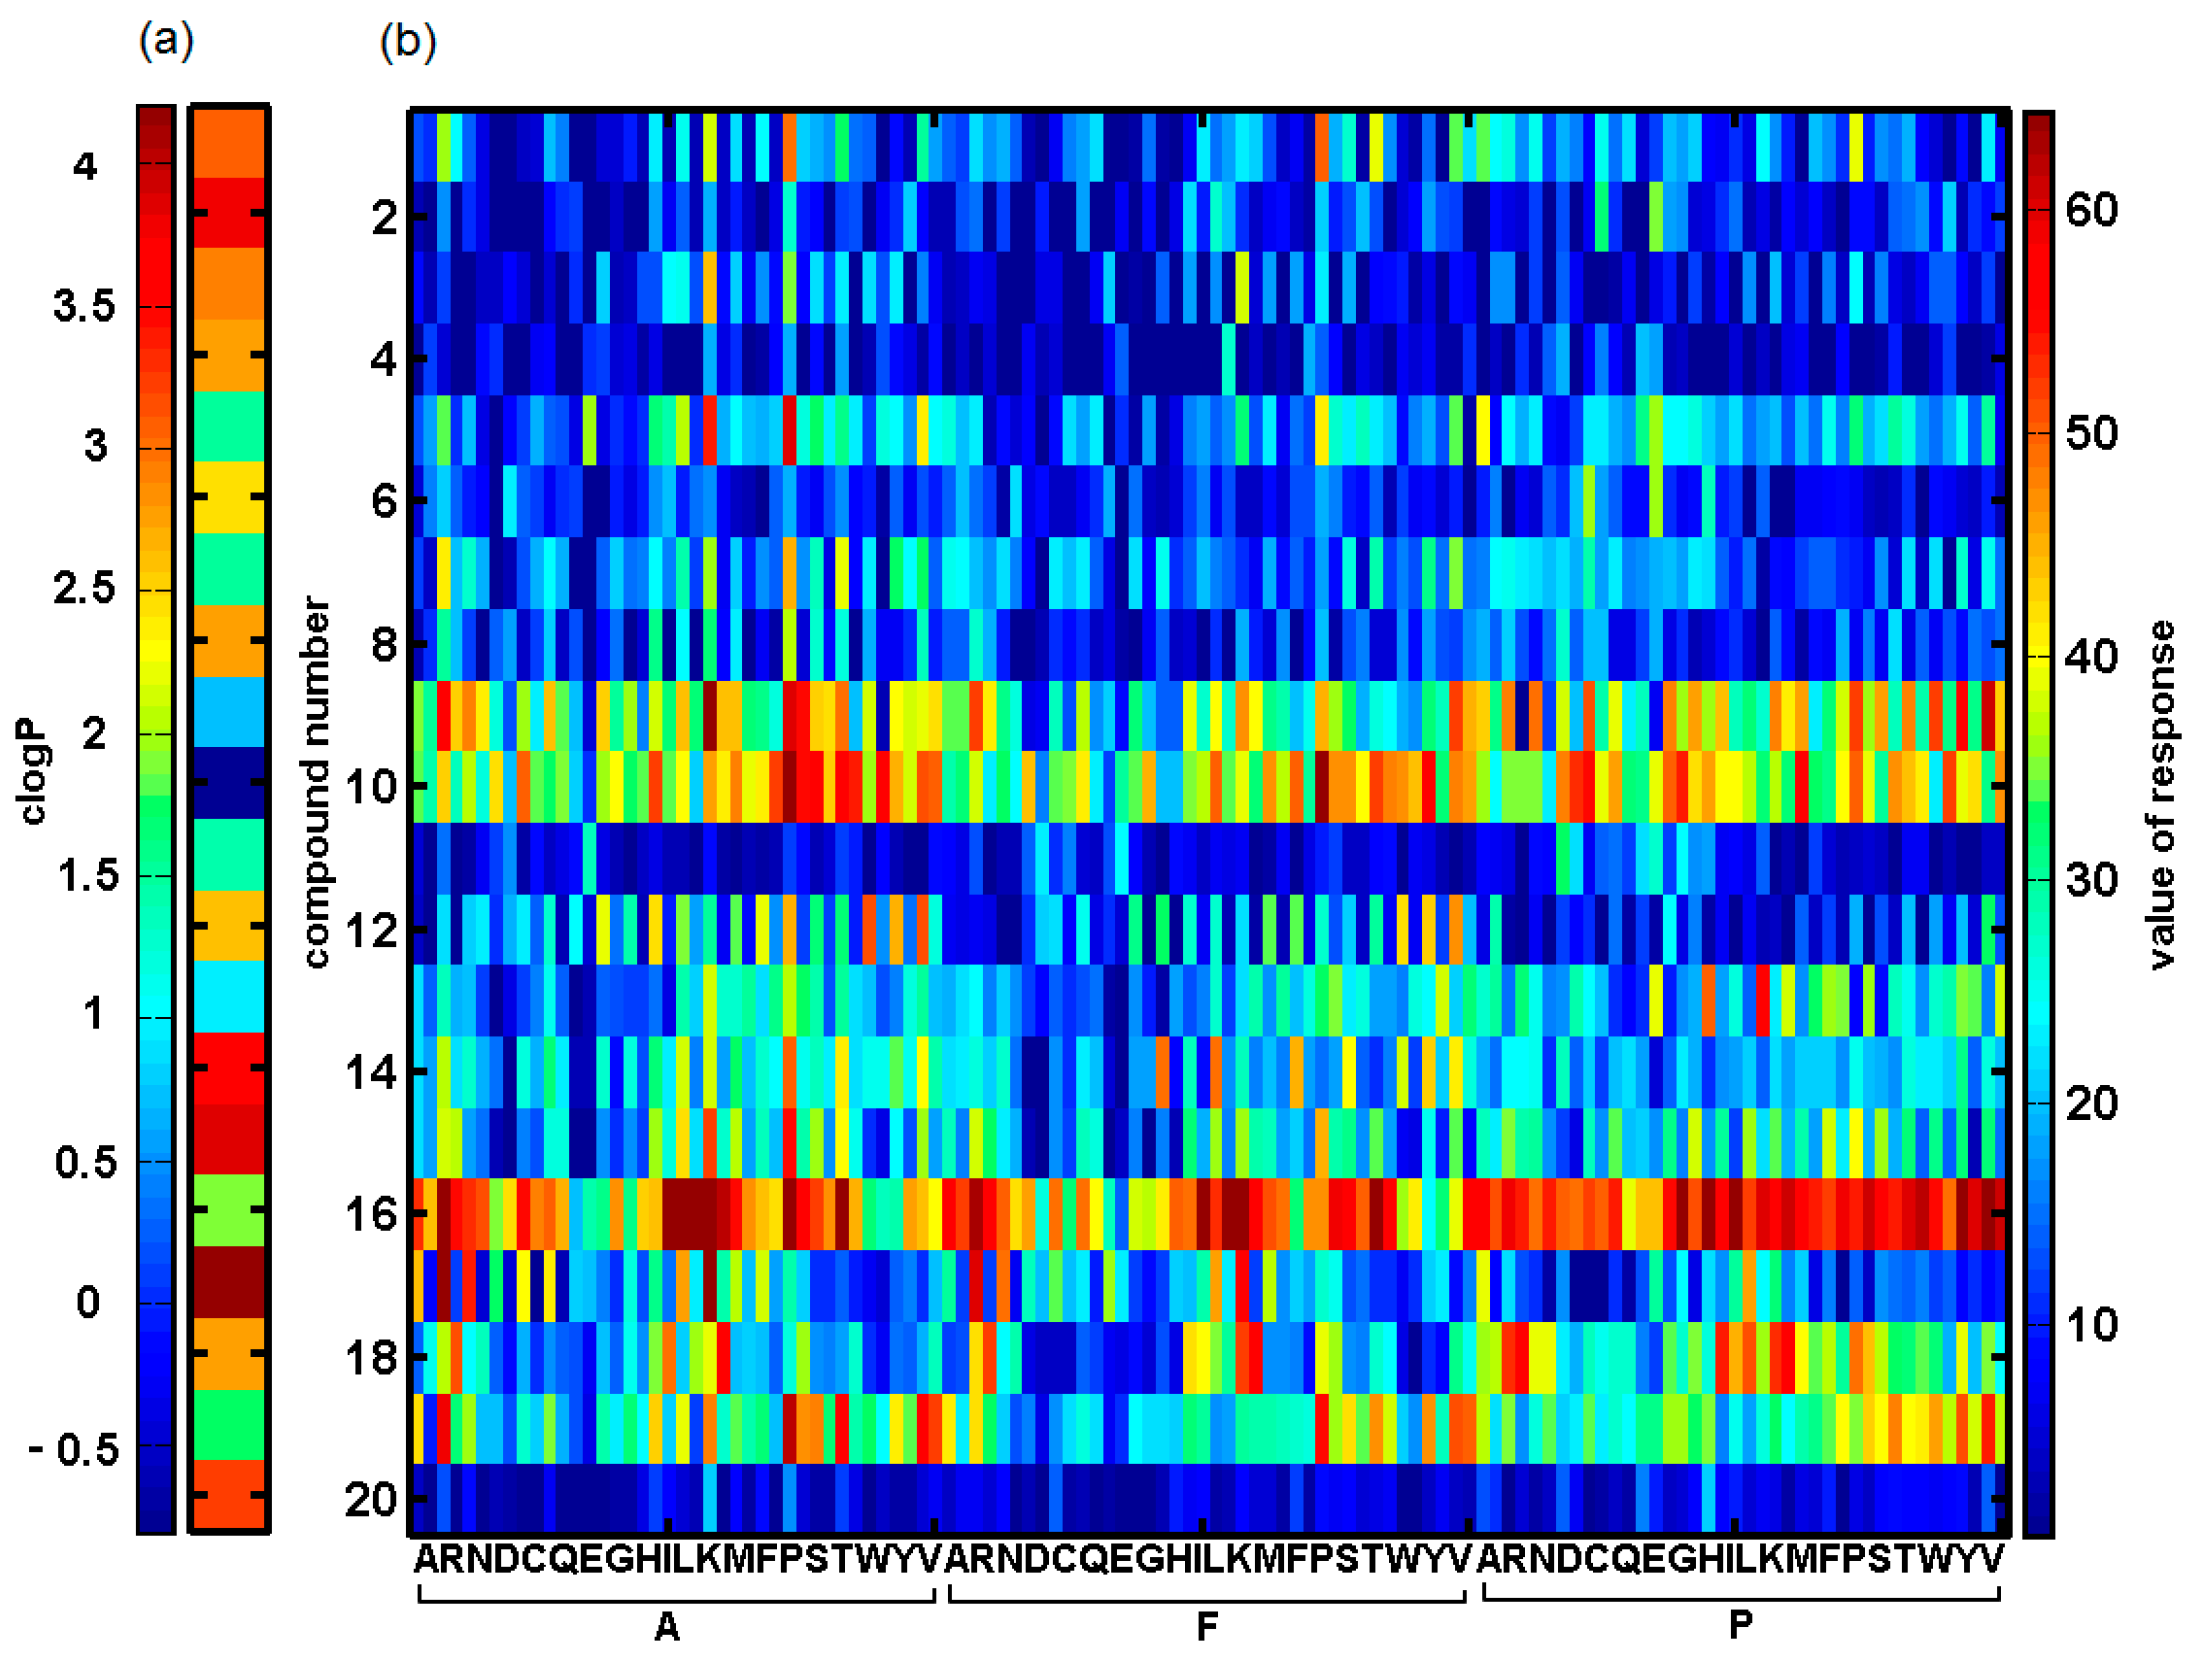
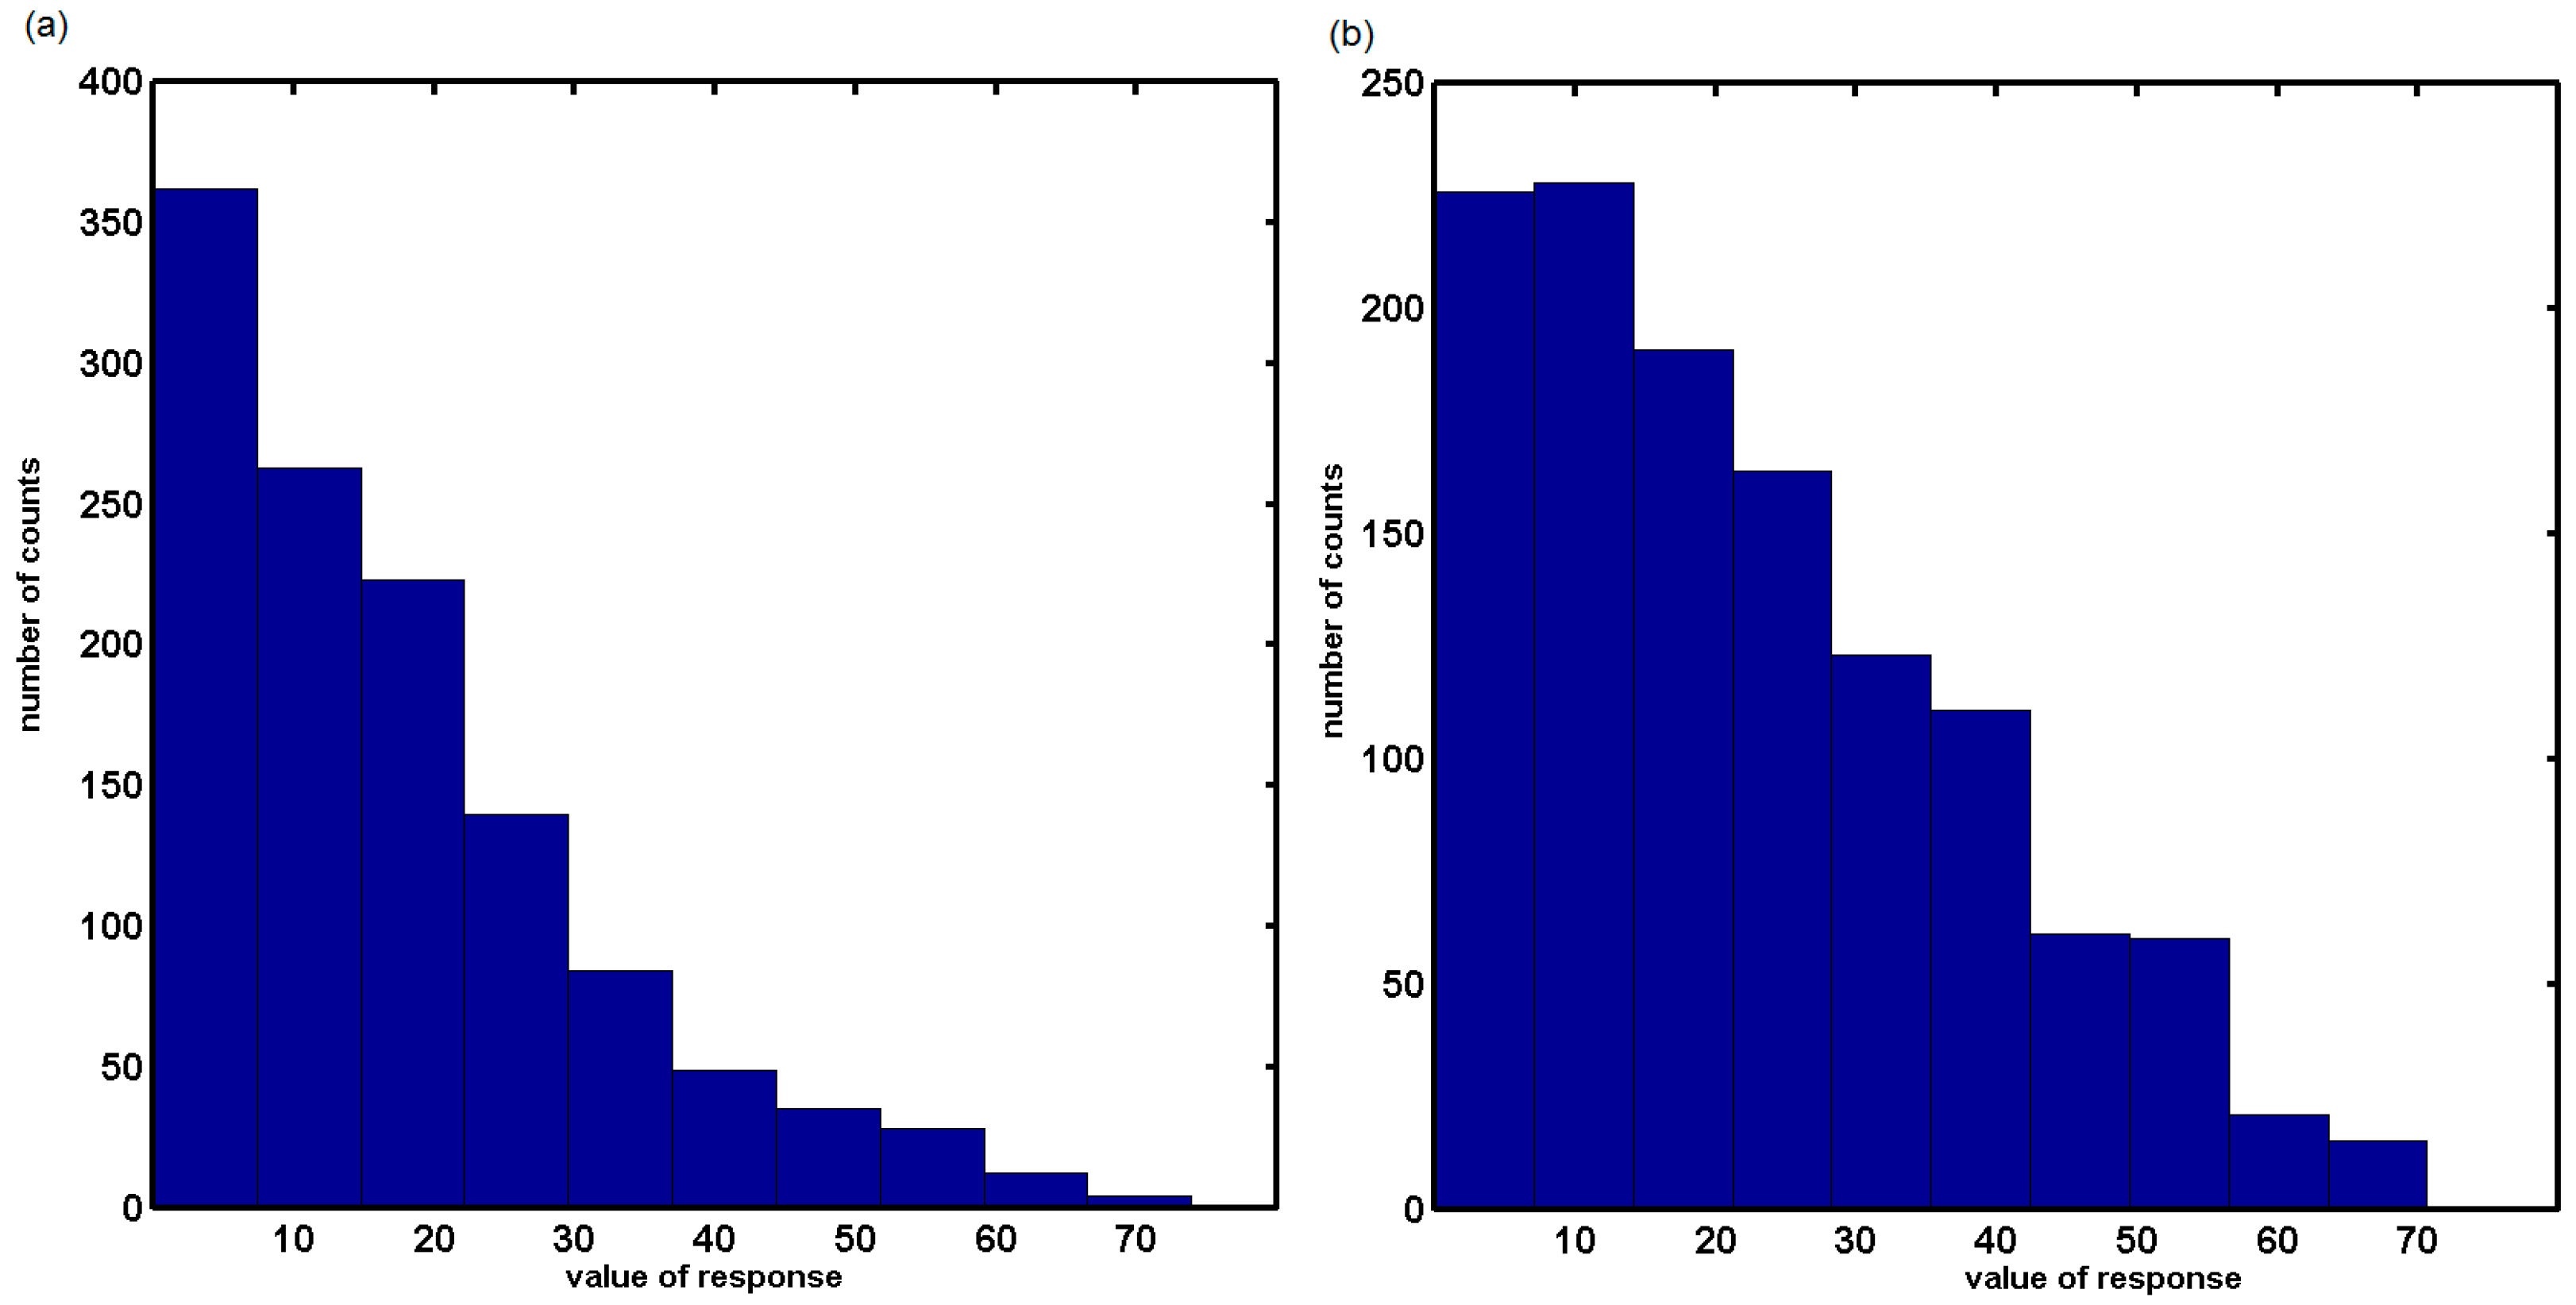
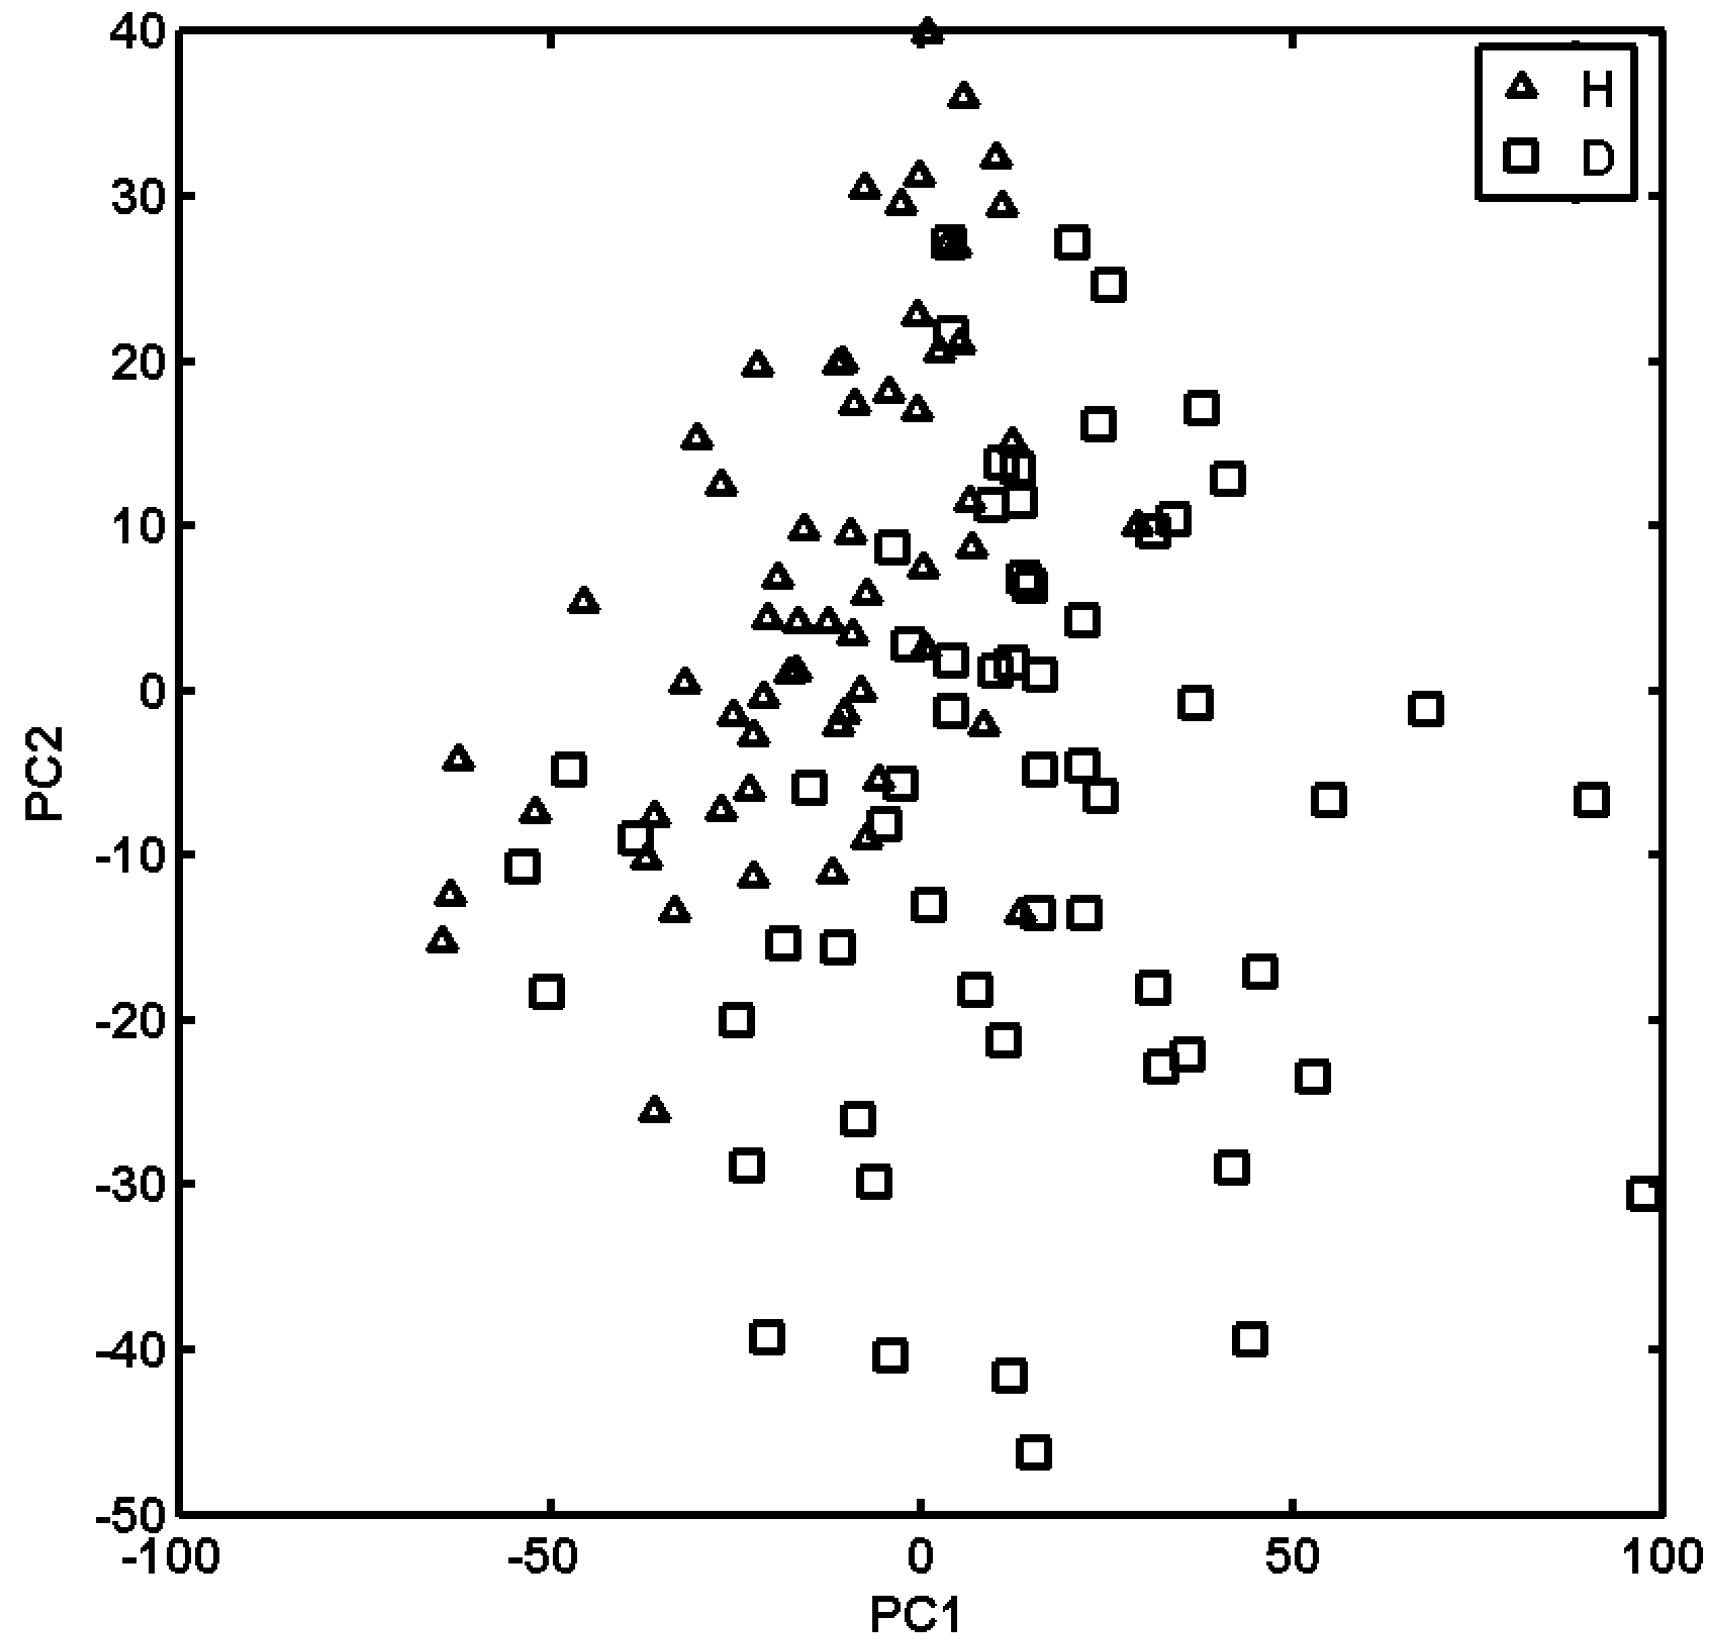
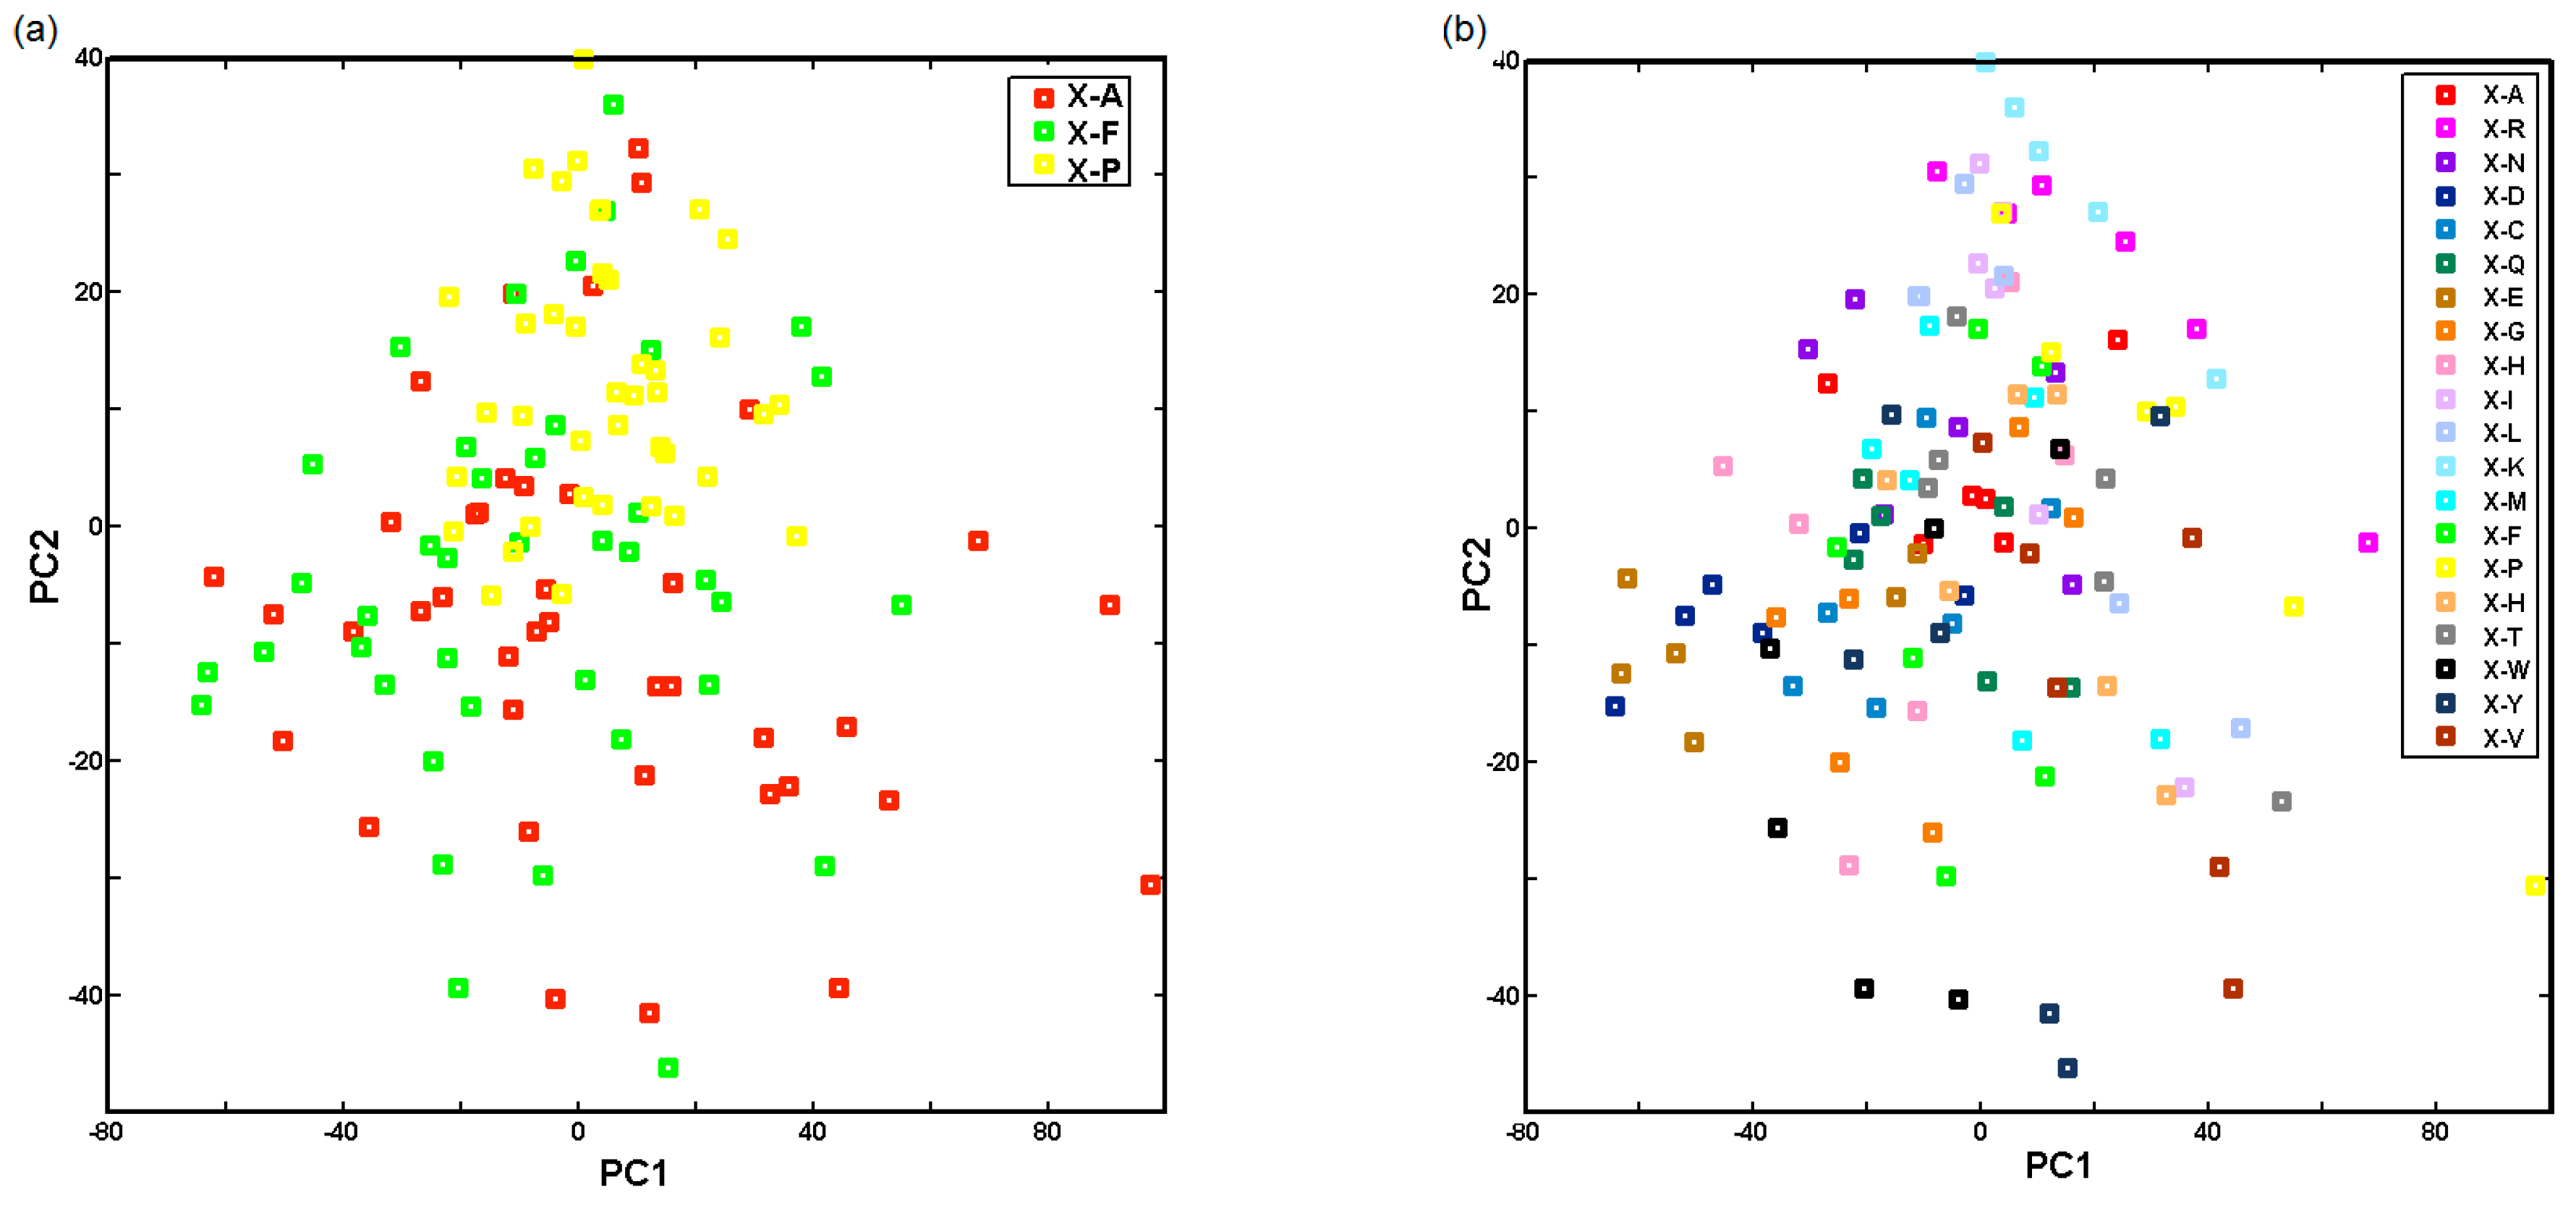
2.3. Probing Artificial Dipeptide Receptor Library
3. Experimental Section
3.1. CoMFA Analysis
3.2. CoMSA Analysis
3.3. PLS Analysis with Iterative Variable Elimination
- Stage 1. Standard PLS analysis with LOO-CV to assess the performance of the PLS model;
- Stage 2. Elimination of the matrix column with the lowest abs(mean(b)/std(b)) value;
- Stage 3. Standard PLS analysis of the new matrix without the column cancelled in stage 2;
- Stage 4. Recurrent repetition of stages 1–3 to maximize the LOO parameter.
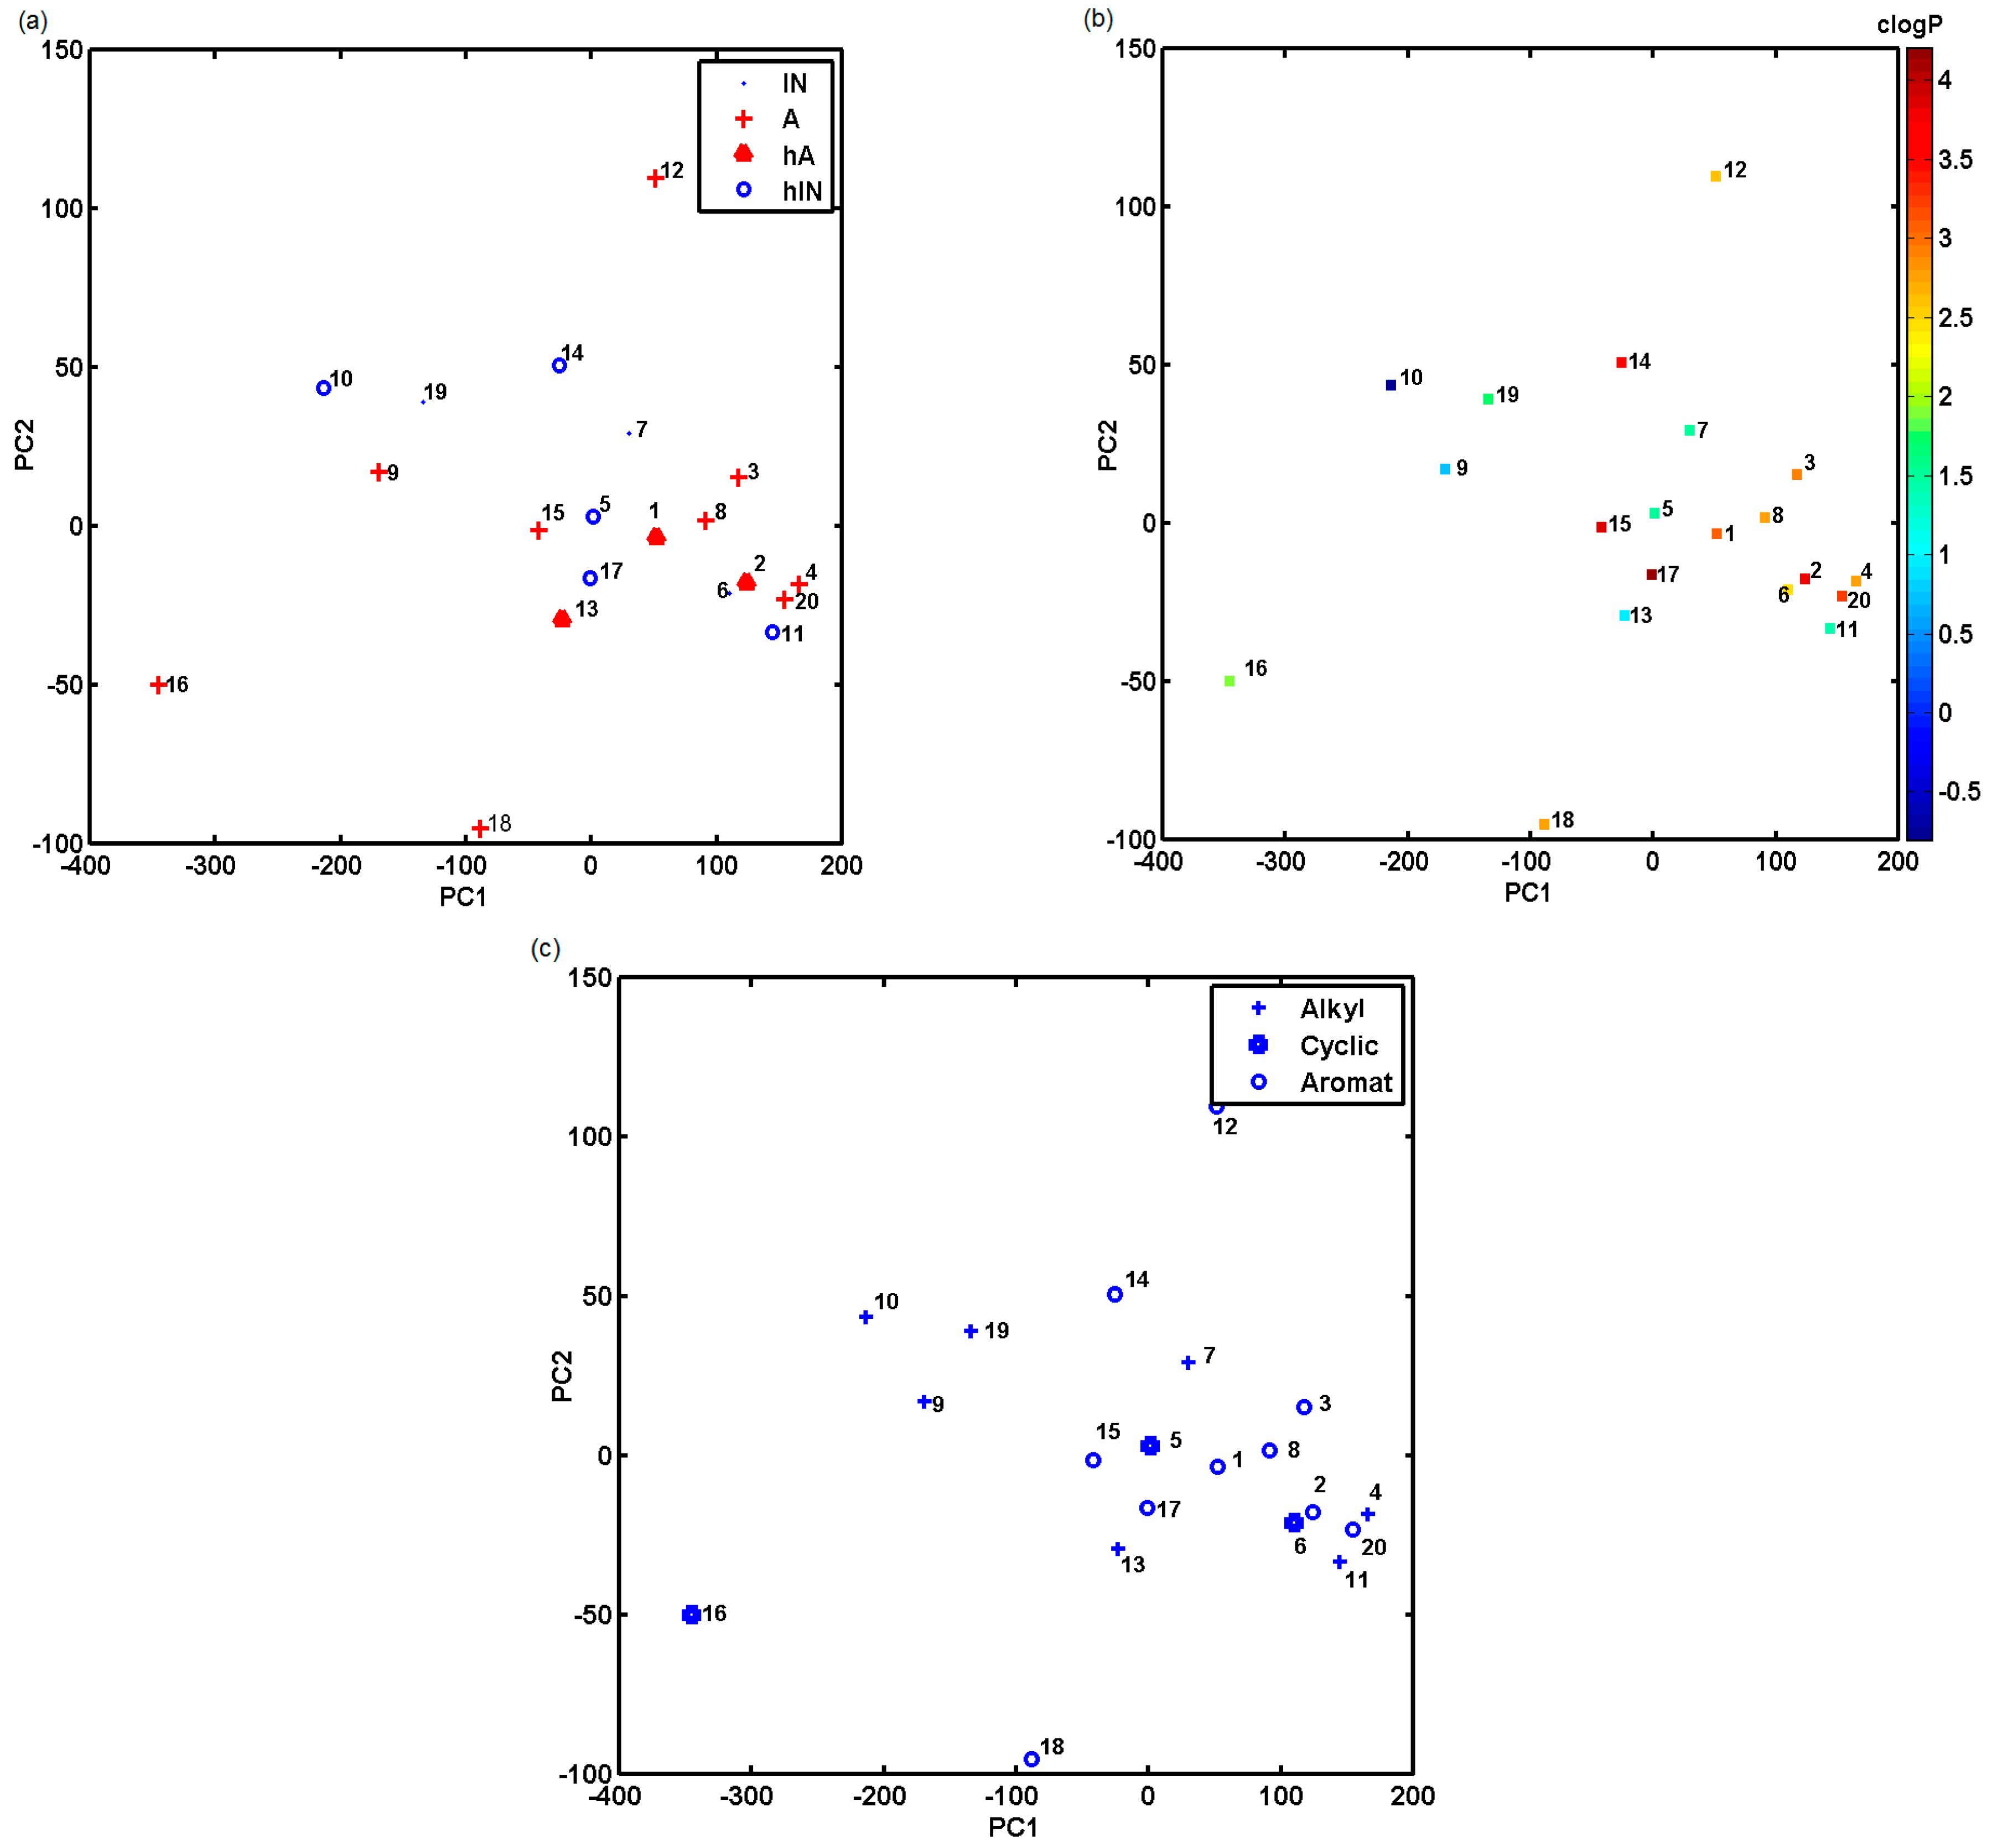
3.4. PCA Analysis
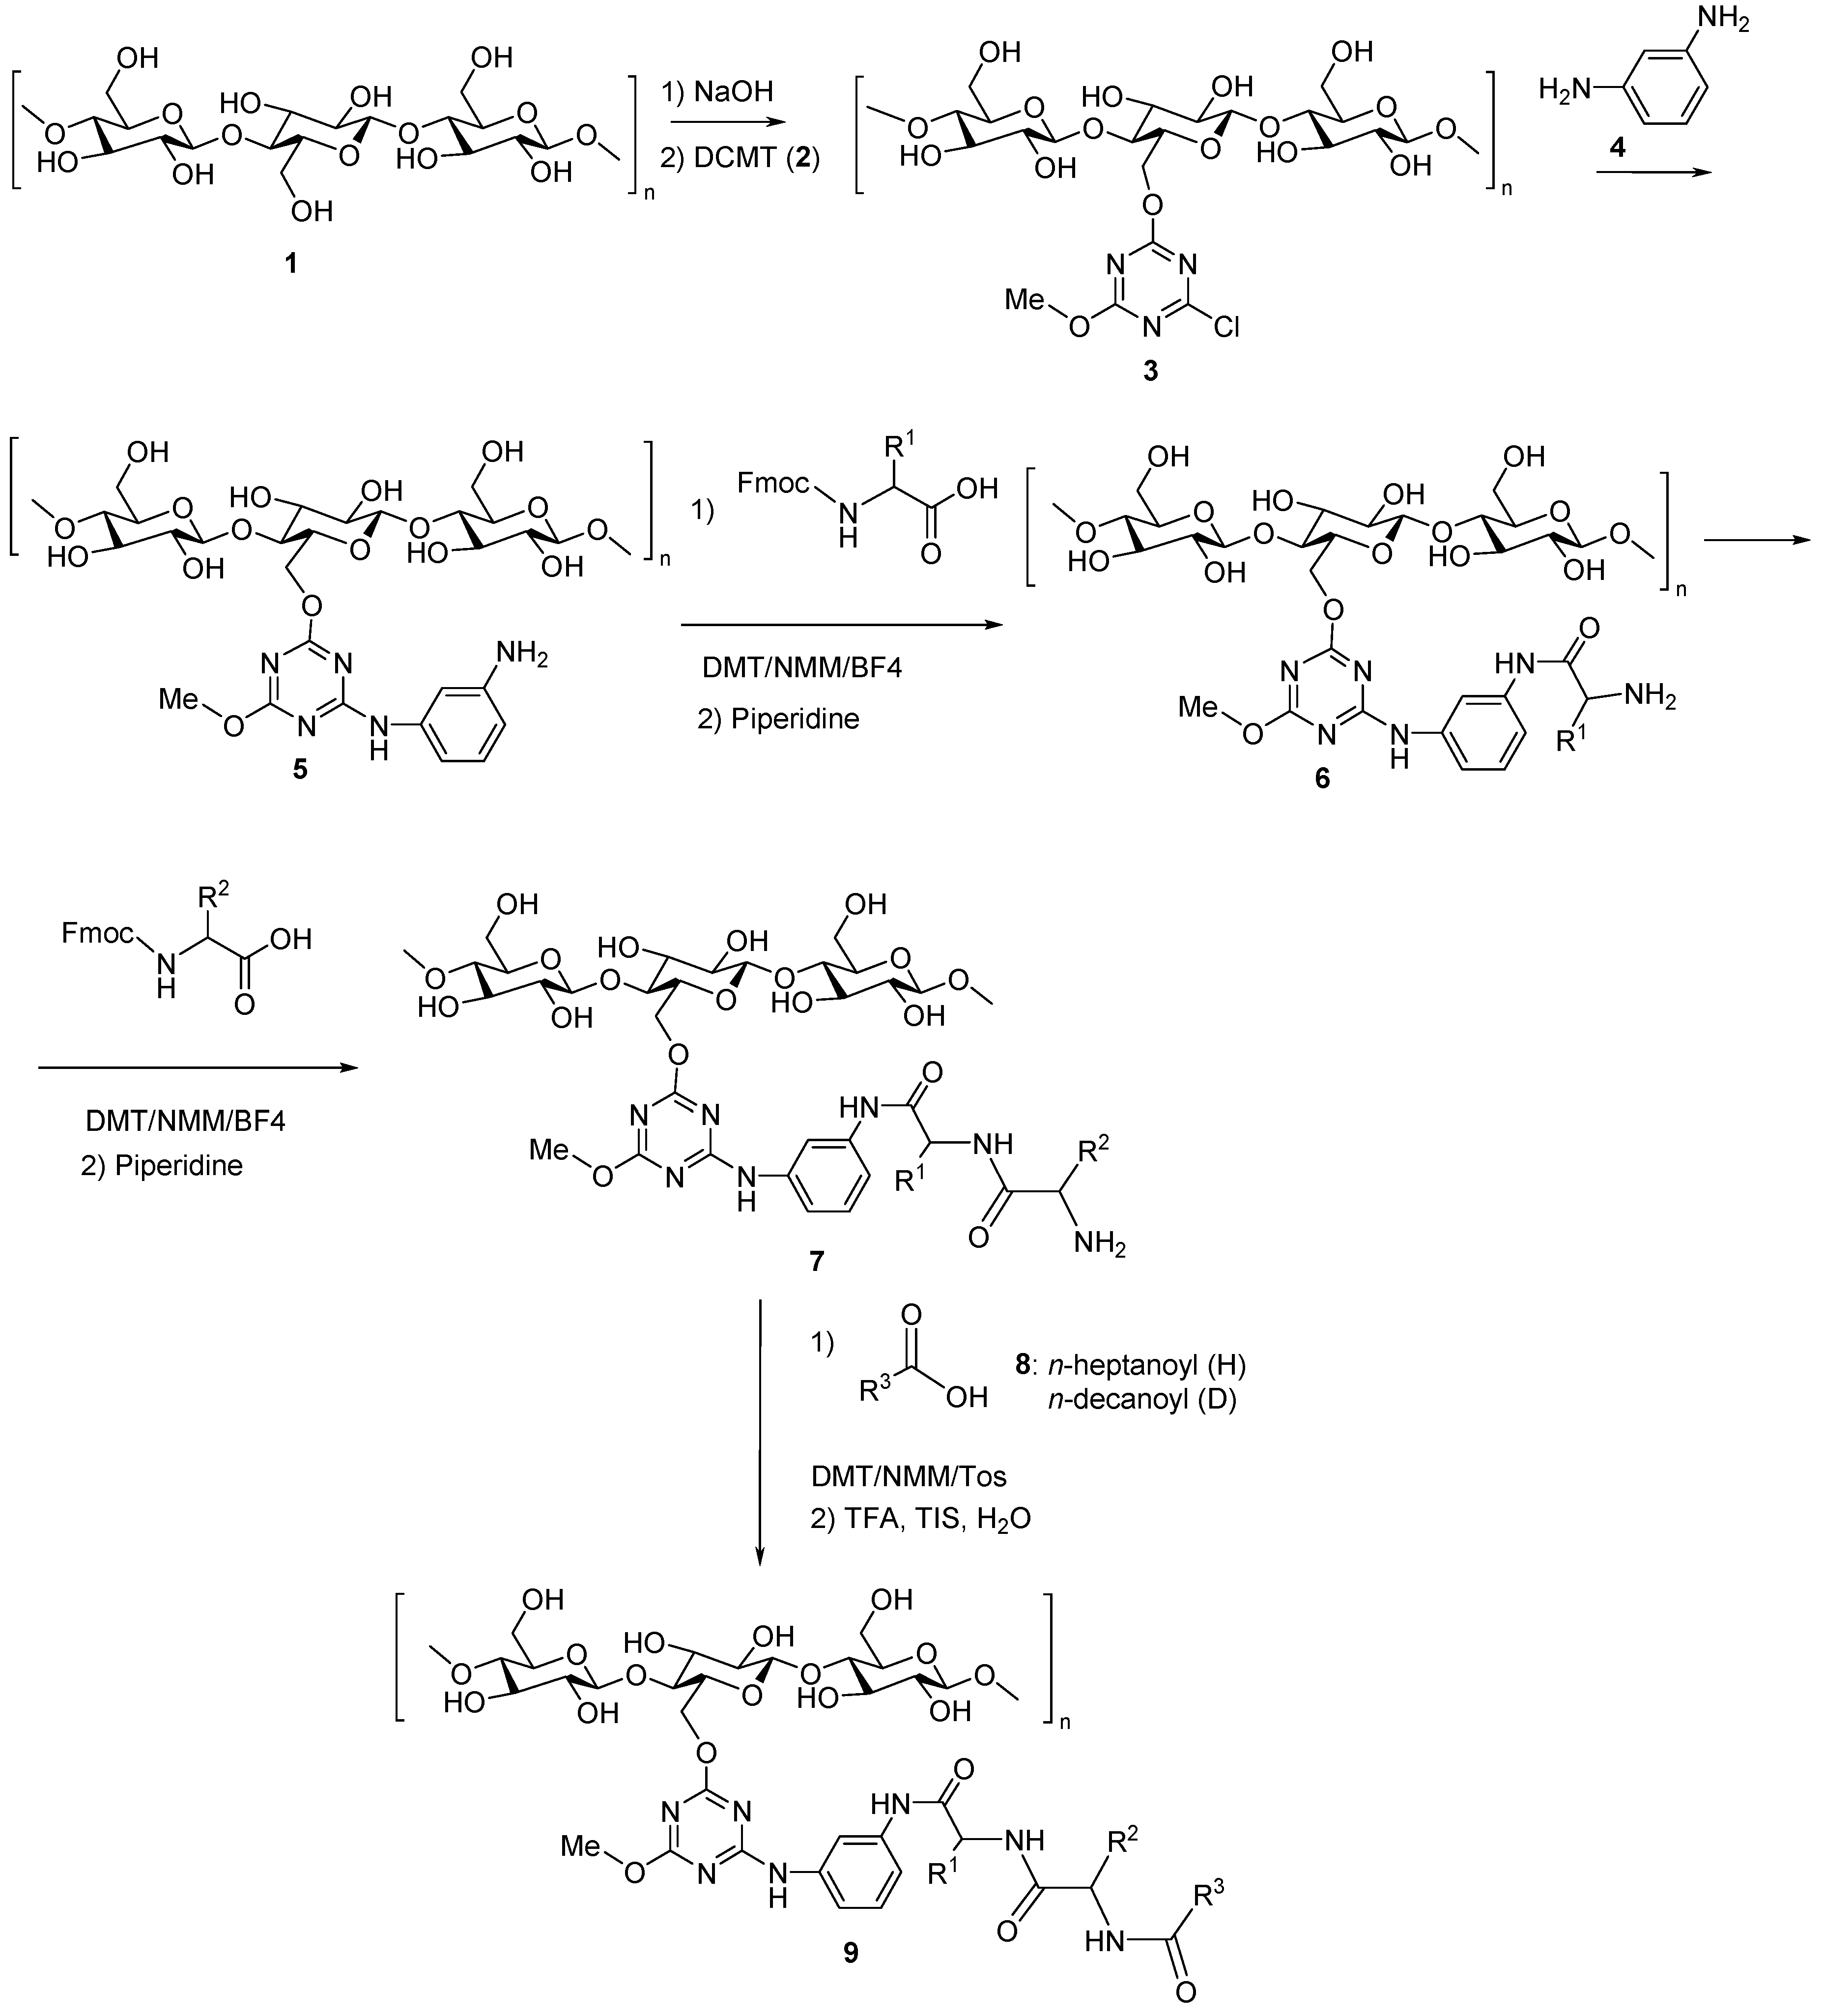
3.5. Artificial Dipeptide Receptor Library Synthesis
3.6. Anticancer Compounds Docking
3.7. Binding of Anticancer Active Ligands to Molecular Receptors Pockets
3.8. Model Builder & Molecular Modelling
4. Conclusions
Supplementary Materials
Author Contributions
Funding
Acknowledgments
Conflicts of Interest
References
- Hann, M.M.; Keserü, G.M. Finding the sweet spot: The role of nature and nurture in medicinal chemistry. Nat. Rev. Drug Discov. 2012, 11, 355–365. [Google Scholar] [CrossRef] [PubMed]
- Oprea, T.I. Property distribution of drug-related chemical databases. J. Comput. Aided Mol. Des. 2000, 14, 251–264. [Google Scholar] [CrossRef] [PubMed]
- Kapustikova, I.; Bąk, A.; Gonec, T.; Kos, J.; Kozik, V.; Jampilek, J. Investigation of hydro-lipophilic properties of N-alkoxyphenylhydroxynaphthalenecarboxamides. Molecules 2018, 23, 1635. [Google Scholar] [CrossRef] [PubMed]
- Devillers, J. Methods for building QSARs. Methods Mol. Biol. 2013, 930, 3–27. [Google Scholar] [PubMed]
- Veber, D.F.; Johnson, S.R.; Cheng, H.Y.; Smith, B.R.; Ward, K.W.; Kopple, K.D. Molecular properties that influence the oral bioavailability of drug candidates. J. Med. Chem. 2002, 45, 2615–2623. [Google Scholar] [CrossRef] [PubMed]
- Bak, A.; Kozik, V.; Smolinski, A.; Jampilek, J. In silico estimation of basic activity-relevant parameters for a set of drug absorption promoters. SAR QSAR Environ. Res. 2017, 28, 427–449. [Google Scholar] [CrossRef] [PubMed]
- Ghose, A.K.; Herbertz, T.; Salvino, J.M.; Mallamo, J.P. Knowledge-based chemoinformatic approaches to drug discovery. Drug Discov. Today 2006, 11, 1107–1114. [Google Scholar] [CrossRef] [PubMed]
- Zentgraf, M.; Steuber, H.; Koch, C.; La Motta, C.; Sartini, S.; Sotriffer, C.A.; Klebe, G. How reliable are current docking approaches for structure-based drug design? Lessons from aldose reductase. Angew. Chem. Int. Ed. Engl. 2007, 46, 3575–3580. [Google Scholar] [CrossRef] [PubMed]
- Mirsky, V.M.; Yatsimirsky, A.K. Artificial Receptors for Chemical Sensors; Wiley-VCH Verlag: Weinheim, Germany, 2011. [Google Scholar]
- Walczak, M.; Fraczyk, J.; Kaminski, Z.; Wietrzyk, J.; Filip-Psurska, B. Preliminary studies on application of library of artificial receptors for differentiation of metabolites in urine of healthy and cancer bearing mice. Acta Pol. Pharm. Drug Res. 2014, 71, 941–953. [Google Scholar]
- Bak, A.; Daszkowski, M.; Kamiński, Z.; Kiec-Kononowicz, K.; Kuder, K.; Fraczyk, J.; Kolesinska, B.; Polanski, J. Probing an artificial polypeptide receptor library using a series of novel histamine H3 receptor ligands. Comb. Chem. High Throughput Screen. 2014, 17, 141–156. [Google Scholar] [CrossRef] [PubMed]
- Fraczyk, J.; Malawska, B.; Kaminski, Z. The application of a library of artificial receptors formed by the self-organization of N-lipidated peptides immobilized on cellulose in studying the effects of the incorporation of a fluorine atom. J. Comb. Chem. 2009, 11, 446–451. [Google Scholar] [CrossRef] [PubMed]
- Fraczyk, J.; Kaminski, Z. Design, synthesis and application of a library of supramolecular structures formed by N-lipidated peptides immobilized on cellulose. J. Comb. Chem. 2008, 10, 934–940. [Google Scholar] [CrossRef] [PubMed]
- Huang, Y.; Li, L. DNA crosslinking damage and cancer—A tale of friend and foe. Transl. Cancer Res. 2013, 2, 144–154. [Google Scholar] [PubMed]
- Oronsky, B.T.; Reid, T.; Knox, S.J.; Scicinski, J.J. The scarlet letter of alkylation: A mini review of selective alkylating agents. Transl. Oncol. 2012, 5, 226–229. [Google Scholar] [CrossRef] [PubMed]
- Fraczyk, J.; Kolesinska, B.; Swiontek, M.; Lipinski, W.; Drozdowska, D.; Kaminski, Z. Synthesis of arylamino-1,3,5-triazines functionalized with alkylating 2-chloroethylamine fragment and studies of their cytotoxicity on the breast cancer MCF-7 cell line. Anticancer Agents Med. Chem. 2016, 16, 1435–1444. [Google Scholar] [CrossRef] [PubMed]
- Kolesinska, B.; Barszcz, K.; Drozdowska, D.; Wietrzyk, J.; Switalska, M.; Kaminski, Z. Synthesis of bifunctional hybrids of nitrogen mustards with melamine based potential inhibitors of enzymes involved in translation and transcription system and studies of their cytotoxicity. J. Enzym. Inhib. Med. Chem. 2012, 27, 619–627. [Google Scholar] [CrossRef] [PubMed]
- Cascioferro, S.; Parrino, B.; Spano, V.; Carbone, A.; Montalbano, A.; Barraja, P.; Diana, P.; Cirrincione, G. 1,3,5-Triazines: A promising scaffold for anticancer drugs development. Eur. J. Med. Chem. 2017, 142, 523–549. [Google Scholar] [CrossRef] [PubMed] [Green Version]
- Williams, D.; Jung, D.W.; Khersonsky, S.M.; Heidary, N.; Chang, Y.T.; Orlow, S.J. Identification of compounds that bind mitochondrial F1F0 ATPase by screening a triazine library for correction of albinism. Chem. Biol. 2004, 11, 1251–1259. [Google Scholar] [CrossRef] [PubMed]
- Pogorelcnik, B.; Janezic, M.; Sosic, I.; Gobec, S.; Solmajer, T.; Perdih, A. 4,6-Substituted-1,3,5-triazin-2(1H)-ones as monocyclic catalytic inhibitors of human DNA topoisomerase IIα targeting the ATP binding site. Bioorg. Med. Chem. 2015, 23, 4218–4229. [Google Scholar] [CrossRef] [PubMed]
- Ryu, B.J.; Kim, S.; Min, B.; Kim, K.Y.; Lee, J.S.; Park, W.J.; Lee, H.; Kim, S.H.; Park, S. Discovery and the structural basis of a novel p21-activated kinase 4 inhibitor. Cancer Lett. 2014, 349, 45–50. [Google Scholar] [CrossRef] [PubMed]
- Khakh, B.S.; North, R.A. P2X receptors as cell-surface ATP sensors in health and disease. Nature 2006, 442, 527–532. [Google Scholar] [CrossRef] [PubMed]
- Wewers, M.D.; Sarkar, A. P2X7 receptor and macrophage function. Purinergic Signal. 2009, 5, 189–195. [Google Scholar] [CrossRef] [PubMed] [Green Version]
- Kawano, A.; Tsukimoto, M.; Noguchi, T.; Hotta, N.; Harada, H.; Takenouchi, T.; Kitani, H.; Kojima, S. Involvement of P2X4 receptor in P2X7 receptor-dependent cell death of mouse macrophages. Biochem. Biophys. Res. Commun. 2012, 419, 374–380. [Google Scholar] [CrossRef] [PubMed]
- Golbraikh, A.; Tropsha, A. Beware of q2! J. Mol. Graph. Model. 2002, 20, 269–276. [Google Scholar] [CrossRef]
- Kubinyi, H. Hansch Analysis and Related Approaches; Wiley-VCH Verlag: Weinheim, Germany, 1993. [Google Scholar]
- Polanski, J.; Gieleciak, R.; Magdziarz, T.; Bak, A. GRID formalism for the comparative molecular surface analysis: Application to the CoMFA benchmark steroids, azo dyes, and HEPT derivatives. J. Chem. Inf. Comput. Sci. 2004, 44, 1423–1435. [Google Scholar] [CrossRef] [PubMed]
- Pizova, H.; Havelkova, M.; Stepankova, S.; Bak, A.; Kauerova, T.; Kozik, V.; Oravec, M.; Imramovsky, A.; Kollar, P.; Bobal, P.; et al. Proline-based carbamates as cholinesterase inhibitors. Molecules 2017, 22, 1969. [Google Scholar] [CrossRef] [PubMed]
- Nguyen, B.T.; Anslyn, E.V. Indicator-displacement assays. Coord. Chem. Rev. 2006, 250, 3118–3127. [Google Scholar] [CrossRef]
- Jiang, R.; Taly, A.; Grutter, T. Moving through the gate in ATP-activated P2X receptors. Trends Biochem. Sci. 2013, 38, 20–29. [Google Scholar] [CrossRef] [PubMed]
- Polanski, J.; Bak, A.; Gieleciak, R.; Magdziarz, T. Self-organizing neural networks for modeling robust 3D and 4D QSAR: Application to dihydrofolate reductase inhibitors. Molecules 2004, 9, 1148–1159. [Google Scholar] [CrossRef] [PubMed]
- Bak, A.; Polanski, J. A 4D-QSAR study on anti-HIV HEPT analogues. Bioorg. Med. Chem. 2006, 14, 273–279. [Google Scholar] [CrossRef] [PubMed]
- Bak, A.; Wyszomirski, M.; Magdziarz, T.; Smolinski, A.; Polanski, J. Structure-based modeling of dye-fiber affinity with SOM-4D-QSAR paradigm: Application to set of anthraquinone derivatives. Comb. Chem. High Throughput Screen. 2014, 17, 485–502. [Google Scholar] [CrossRef] [PubMed]
- Stanton, D.T. QSAR and QSPR model interpretation using partial least squares (PLS) analysis. Curr. Comput. Aided Drug Des. 2012, 8, 107–127. [Google Scholar] [CrossRef] [PubMed]
- Polanski, J.; Bak, A.; Gieleciak, R.; Magdziarz, T. Modeling robust QSAR. J. Chem. Inf. Model. 2006, 46, 2310–2318. [Google Scholar] [CrossRef] [PubMed]
- Bak, A.; Polanski, J. Modeling robust QSAR 3: SOM-4D-QSAR with iterative variable elimination IVE-PLS: Application to steroid, azo dye, and benzoic acid series. J. Chem. Inf. Model. 2007, 47, 1469–1480. [Google Scholar] [CrossRef] [PubMed]
- Gieleciak, R.; Magdziarz, T.; Bak, A.; Polanski, J. Modeling robust QSAR. 1. Coding molecules in 3D-QSAR—From a point to surface sectors and molecular volumes. J. Chem. Inf. Model. 2005, 45, 1447–1455. [Google Scholar] [CrossRef] [PubMed]
- Centner, V.; Massart, D.L.; de Noord, O.E.; de Jong, S.; Vandeginste, B.M.V.; Sterna, C. Elimination of uninformative variables for multivariate calibration. Anal. Chem. 1996, 68, 3851–3858. [Google Scholar] [CrossRef] [PubMed]
- Fukunishi, Y.; Nakamura, H. Definition of drug-likeness for compound affinity. J. Chem. Inf. Model. 2011, 51, 1012–1016. [Google Scholar] [CrossRef] [PubMed]
- Smolinski, A.; Drobek, L.; Dombek, V.; Bak, A. Modeling of experimental data on trace elements and organic compounds content in industrial waste dumps. Chemosphere 2016, 162, 189–198. [Google Scholar] [CrossRef] [PubMed]
- Frank, R. Segmented solid supports: My personal addiction to Merrifield’s solid phase synthesis. Int. J. Pept. Res. Ther. 2007, 1, 45–52. [Google Scholar] [CrossRef]
- Fraczyk, J.; Walczak, M.; Kaminski, Z. Cellulose template assembled synthetic peptides as molecular receptors. Curr. Protein Pept. Sci. 2016, 17, 117–126. [Google Scholar] [CrossRef] [PubMed]
- Kaminski, Z.; Kolesinska, B.; Kolesinska, J.; Sabatino, G.; Chelli, M.; Rovero, P.; Blaszczak, M.; Glowka, G.; Papini, A.M. N-triazinylammonium tetrafluoroborates. A new generation of efficient coupling reagents useful for peptide synthesis. J. Am. Chem. Soc. 2005, 127, 16912–16920. [Google Scholar] [CrossRef] [PubMed]
- Kolesinska, B.; Rozniakowski, K.K.; Fraczyk, J.; Relich, I.; Papini, A.M.; Kaminski, Z. The effect of counterion and tertiary amine on the efficiency of N-triazinylammonium sulfonates in solution and solid-phase peptide synthesis. Eur. J. Org. Chem. 2015, 2, 401–408. [Google Scholar] [CrossRef]
- Fraczyk, J.; Walczak, M.; Kaminski, Z.J. New methodology for automated SPOT synthesis of peptides on cellulose using 1,3,5-Triazine derivatives as linkers and as coupling reagents. J. Pep. Sci. 2018, 24. [Google Scholar] [CrossRef] [PubMed]
- CACTVS/csed Editor. Available online: http://www2.chemie.uni-erlangen.de/software/cactvs/tools.html (accessed on 26 July 2018).
- CORINA 3D Structure Generator. Available online: https://www.mn-am.com/products/corina (accessed on 26 July 2018).
- OpenBabel Chemistry Toolbox. Available online: http://openbabel.org/wiki/Main_Page (accessed on 26 July 2018).
- Sybyl-X, Version 2. Certara: Princeton, NJ, USA, 2012. Available online: https://www.certara.com (accessed on 26 July 2018).
- SONNIA Software. Available online: https://www.mn-am.com/products/sonnia (accessed on 26 July 2018).
- Matlab Programming Environment. Available online: https://www.mathworks.com/products/matlab.html (accessed on 26 July 2018).
Sample Availability: Samples of compounds are available from authors (experimental data—Beata Kolesinska, theoretical data—Andrzej Bak). |


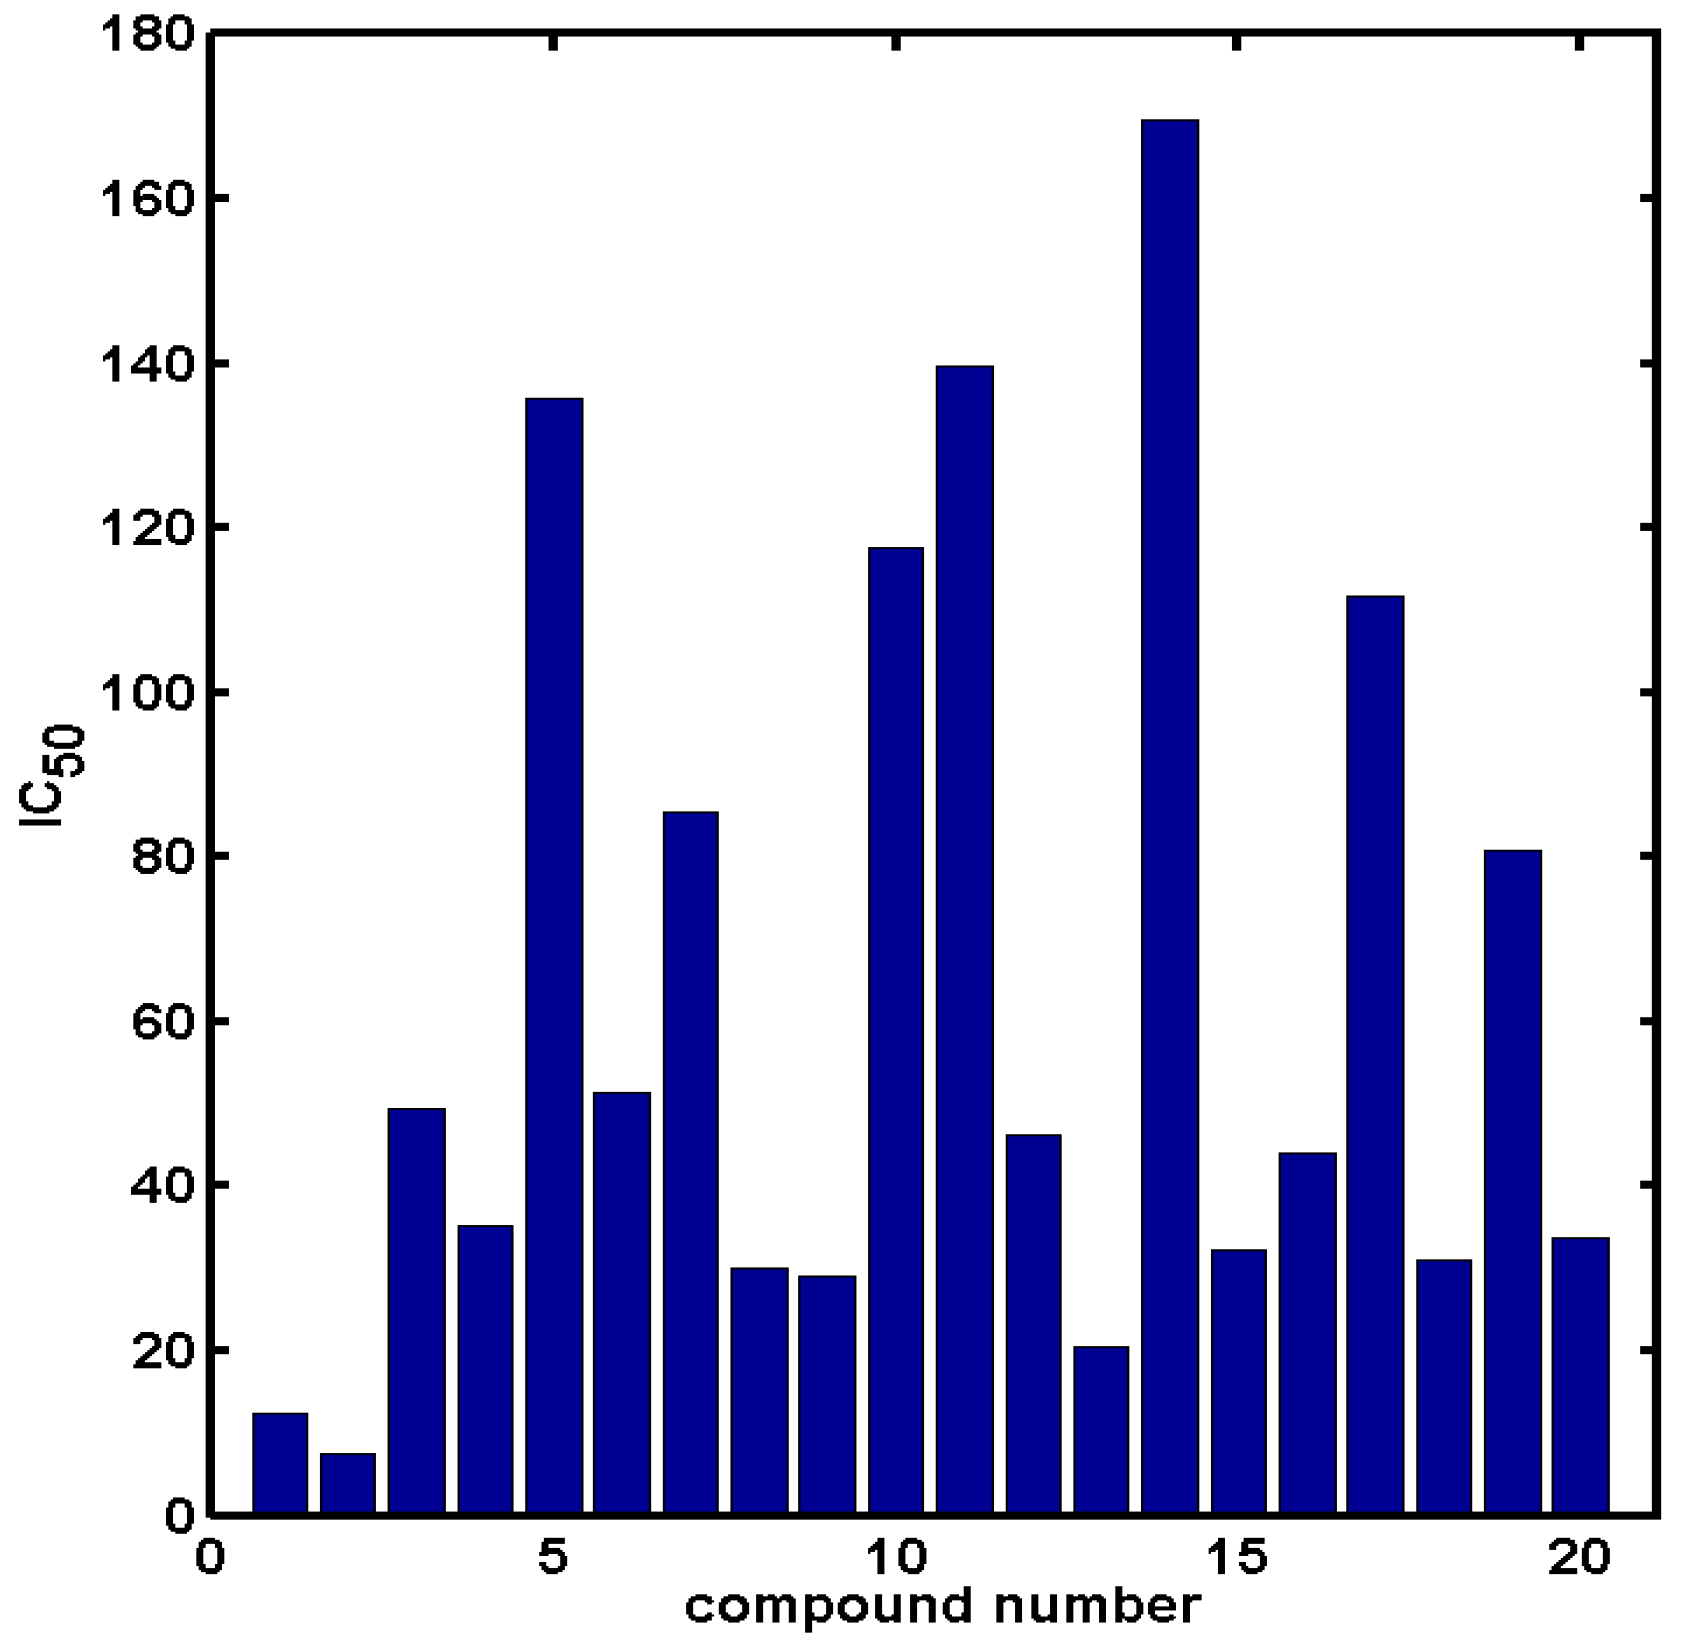
| Comp. | Compound Structure | IC50 [μM] | Comp. | Compound Structure | IC50 [μM] |
|---|---|---|---|---|---|
| 1 |  | 12.30 | 11 |  | 139.78 |
| 2 |  | 7.40 | 12 |  | 46.29 |
| 3 |  | 49.40 | 13 |  | 20.44 |
| 4 |  | 35.11 | 14 |  | 169.7 |
| 5 |  | 135.73 | 15 |  | 32.14 |
| 6 |  | 51.39 | 16 |  | 43.95 |
| 7 |  | 85.37 | 17 |  | 111.81 |
| 8 |  | 30.02 | 18 |  | 30.92 |
| 9 |  | 29.08 | 19 |  | 80.83 |
| 10 |  | 117.61 | 20 |  | 33.85 |
© 2018 by the authors. Licensee MDPI, Basel, Switzerland. This article is an open access article distributed under the terms and conditions of the Creative Commons Attribution (CC BY) license (http://creativecommons.org/licenses/by/4.0/).
Share and Cite
Bak, A.; Kozik, V.; Walczak, M.; Fraczyk, J.; Kaminski, Z.; Kolesinska, B.; Smolinski, A.; Jampilek, J. Towards Intelligent Drug Design System: Application of Artificial Dipeptide Receptor Library in QSAR-Oriented Studies. Molecules 2018, 23, 1964. https://doi.org/10.3390/molecules23081964
Bak A, Kozik V, Walczak M, Fraczyk J, Kaminski Z, Kolesinska B, Smolinski A, Jampilek J. Towards Intelligent Drug Design System: Application of Artificial Dipeptide Receptor Library in QSAR-Oriented Studies. Molecules. 2018; 23(8):1964. https://doi.org/10.3390/molecules23081964
Chicago/Turabian StyleBak, Andrzej, Violetta Kozik, Malgorzata Walczak, Justyna Fraczyk, Zbigniew Kaminski, Beata Kolesinska, Adam Smolinski, and Josef Jampilek. 2018. "Towards Intelligent Drug Design System: Application of Artificial Dipeptide Receptor Library in QSAR-Oriented Studies" Molecules 23, no. 8: 1964. https://doi.org/10.3390/molecules23081964