The Influence of Ca2+ and pH on the Interaction between PAHs and Molybdenite Edges


1
College of Materials and Mineral Resources, Xi’an University of Architecture and Technology, Xi’an 710055, China
2
JinDui Cheng Molybdenum Co., Ltd., Xi’an 710077, China
3
China Molybdenum Co., Ltd., Luanchuan 471500, China
4
School of Chemical Engineering, The University of Queensland, St. Lucia, Brisbane, QLD 4072, Australia
*
Authors to whom correspondence should be addressed.
Minerals 2017, 7(6), 104; https://doi.org/10.3390/min7060104
Submission received: 14 May 2017
/
Revised: 13 June 2017
/
Accepted: 14 June 2017
/
Published: 17 June 2017
Abstract
:Nonpolar hydrocarbon oils are widely used as collectors for floating molybdenite. However, they can only adsorb on molybdenite faces and not on molybdenite edges, resulting in limited molybdenite recovery, especially in processed water containing a high amounts of Ca2+. In this study, the influence of Ca2+ and pH on the adsorption of polycyclic aromatic hydrocarbons (PAHs), as part of composite collection on molybdenite edges, was studied. It was found that PAHs could only adsorb on molybdenite edges in the presence of Ca2+. Ca2+ reacted with molybdenite edges to form CaMoO4 precipitates. Then, CaMoO4 precipitates interacted with PAHs to form a structure of π–cation–π by (1) the cation–π interaction, (2) the π–π interaction and (3) the electrostatic interaction. It was also found that CaMoO4 precipitates on molybdenite edges promoted the adsorption of PAHs. The more the CaMoO4 precipitates, the easier the PAHs adsorption occurred. As a result, the high amount of Ca2+ and low pH enhanced the adsorption of PAHs on molybdenite edges. This study provides insights into reducing the deleterious effect of Ca2+ on fine molybdenite flotation.
1. Introduction
Molybdenite is anisotropic due to its layered structure [1,2]. It exhibits two types of surfaces, namely face and edge, resulting from the break of S–S molecular bonds (nonpolar faces) and the rupture of the strong covalent Mo–S bonds (polar edges), respectively. The face is hydrophobic, while the edge is hydrophilic. The anisotropic property of crystalline molybdenite is given in Table 1 [3].
Some studies show that the floatability of molybdenite particles depends on the relative surface exposure of hydrophobic faces and hydrophilic edges [4,5]. A greater proportion of molybdenite edges corresponds to a lower flotation recovery. In other words, with the particles size decreasing, the proportion of molybdenite edges increases and molybdenite flotation recovery decreases.
Fine molybdenite particles have a low face/edge ratio with a high exposure of edges [5]. The hydrophilic edges have a deleterious influence on molybdenite floatability. Nonpolar hydrocarbon oils (saturated hydrocarbons) such as kerosene, diesel oil, transformer oil and solar oil are normally used as molybdenite flotation collectors [6,7,8,9]. However, they only adsorb on the nonpolar face of molybdenite by hydrophobic interactions and van der Waals forces [10,11,12,13,14,15], because the surface energy of nonpolar hydrocarbon oils is similar to that of molybdenite faces. Therefore, the hydrophobicity of molybdenite edges cannot be improved by nonpolar hydrocarbon oils [16,17]. Some studies show that molybdenite edges could interact with some metal ions existing in flotation pulp, which reduces their hydrophobicity [17,18,19,20,21]. In particular, calcium ions were found to decrease the contact angle of molybdenite edges, and hence, exacerbate molybdenite flotation [17]. It has been documented that molybdenite edges are easily oxidized, but molybdenite faces are difficult to be oxidized in water at room temperature [4,21]. Therefore, the oxidation product (MoO42−) will preferentially occur on molybdenite edges and make molybdenite negatively charged, enhancing the adsorption of calcium ions by electrostatic interactions. Calcium ions may also react with the oxidation product (MoO42−) on molybdenite edges to form CaMoO4 precipitates [4,21].
In the past, the surfactant or xanthate was mixed with a nonpolar hydrocarbon oil to increase the molybdenite flotation [2,22,23,24,25,26]. The surfactant or xanthate could absorb on molybdenite edges to improve their hydrophobicity. However, they could also adsorb on other sulfide minerals, reducing the selectivity of molybdenite against other sulfide minerals in differential flotation. Studies to improve the hydrophobicity of molybdenite edges by other reagents are limited.
In this study, polycyclic aromatic hydrocarbons (PAHs) was used as a component of a composite collector to target molybdenite edges in a pure molybdenite system, based on the preliminary study showing that PAHs did improve the flotation of fine molybdenite particles at pH 7–8 when mixed with diesel. It should not work as an emulsifier of diesel since PAHs, a neutral, nonpolar molecule, only has a lipophilic group while Emulsifiers are surface-active, with both hydrophilic and lipophilic groups reducing oil–water interfacial tension [27]. In this study, the influence of Ca2+ and pH on the interaction between PAHs and molybdenite edges was studied by the ultraviolet-visible spectrophotometer measurement, zeta potential measurement and scanning electron microscopy and Energy Dispersive X-ray spectrometer (SEM–EDS) analysis. The adsorption of PAHs on molybdenite edges in the presence of Ca2+ was discussed.
2. Materials and Methods
2.1. Materials and Reagents
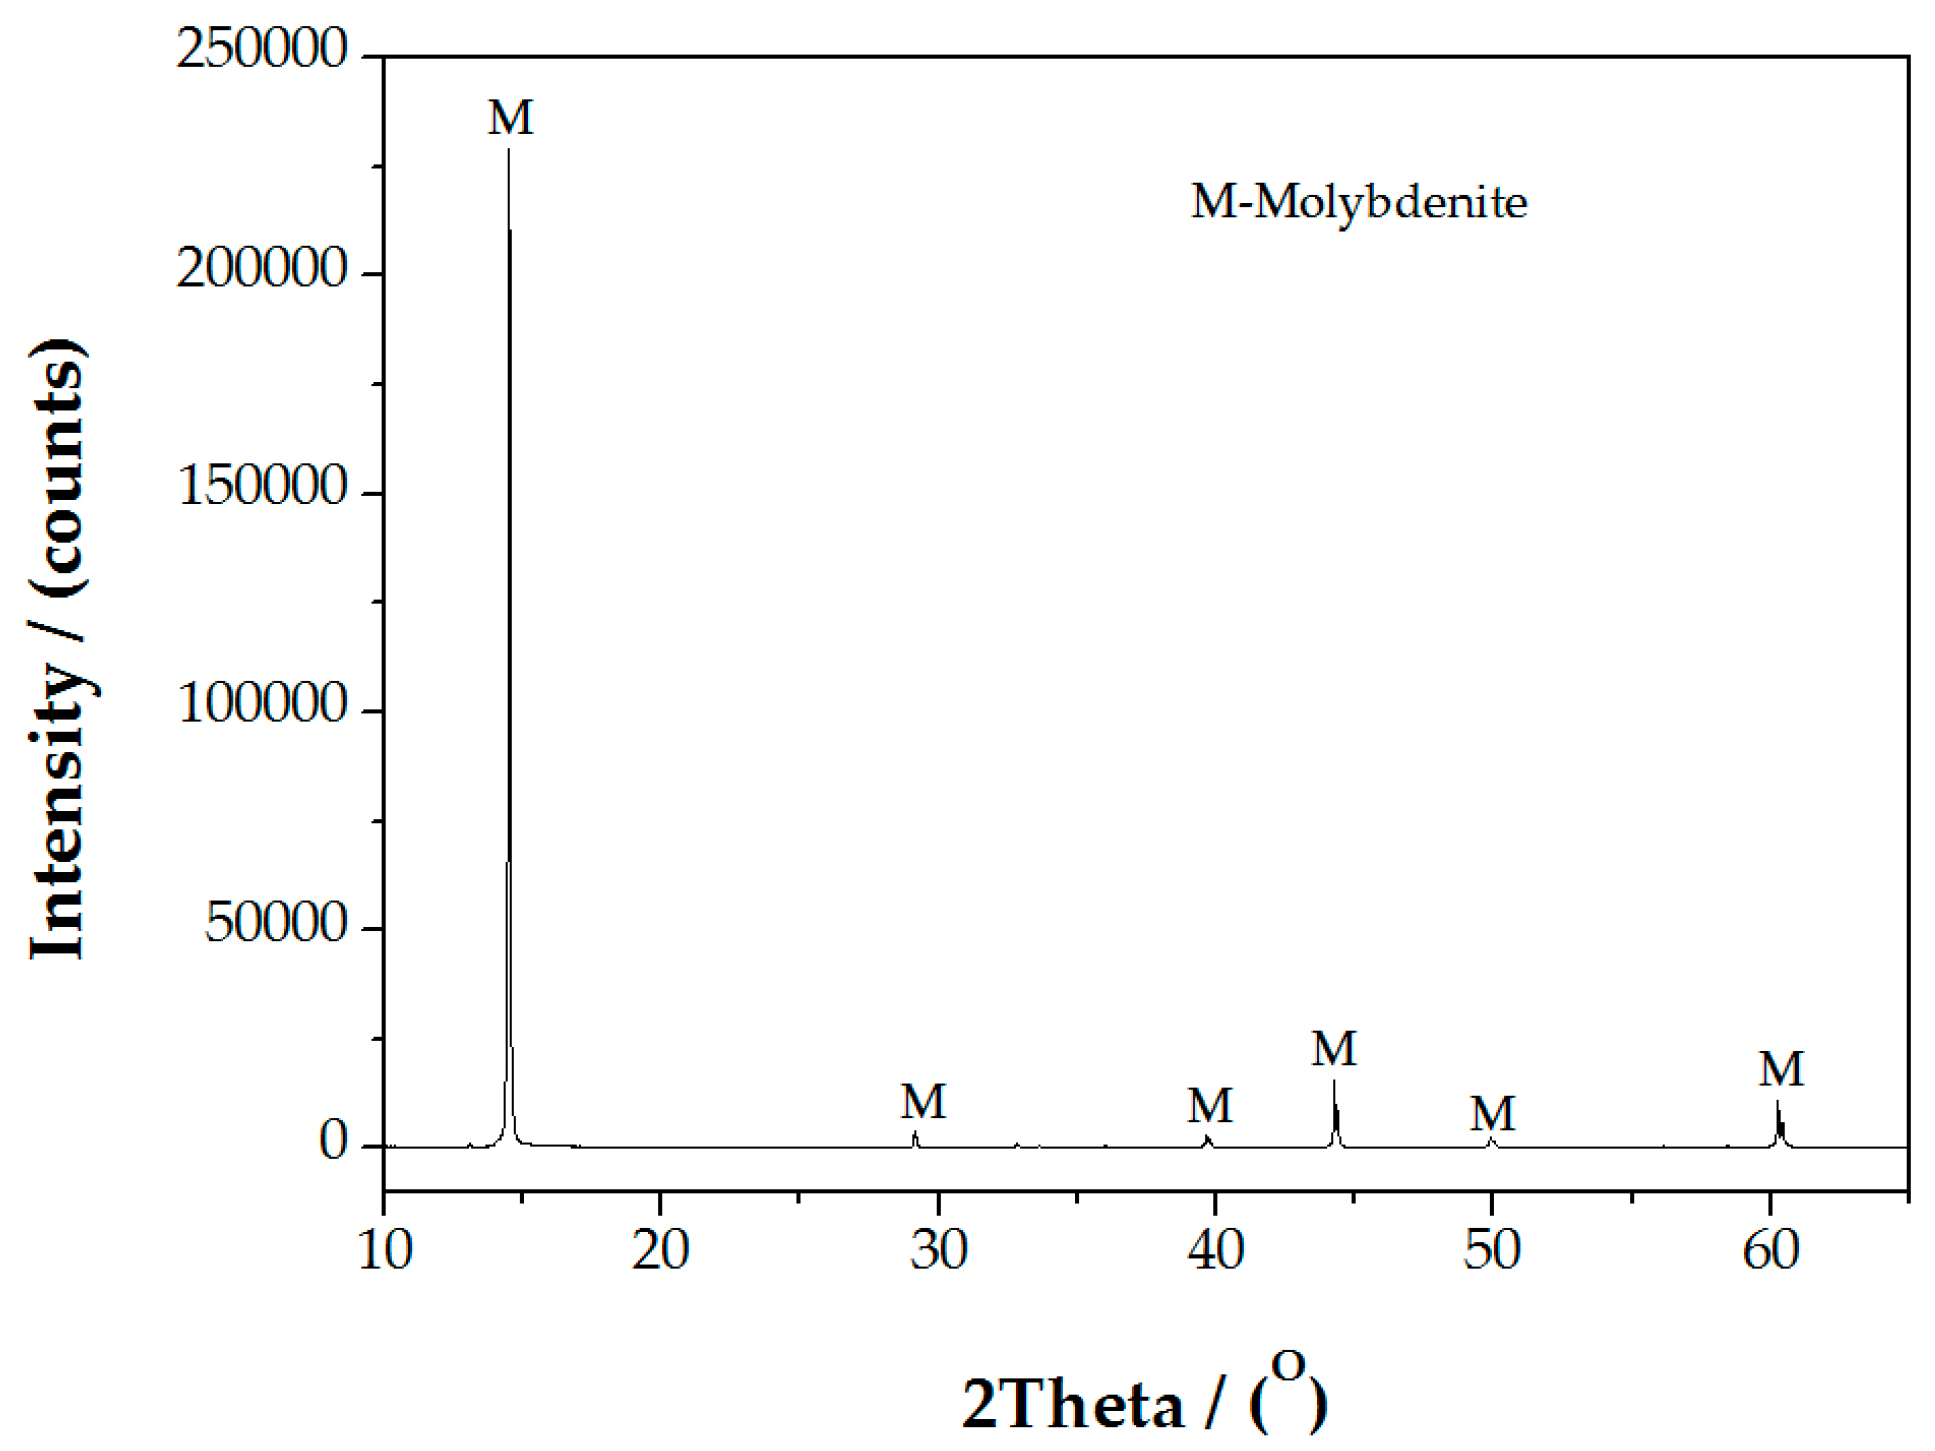
The pure molybdenite sample used in this study was obtained from the molybdenum–tungsten mine of Luanchuan in Henan Province, China. The molybdenite crystals were first selected by hand to obtain high-grade crystals for collectorless flotation, then crushed and ground in a porcelain ball mill before subjecting to collectorless flotation to further purify the molybdenite. Finally, the purified molybdenite was screened to obtain the −38 µm fraction for analyses. This material assayed 58 wt % Mo. The XRD result of the purified molybdenite sample shows 99 wt % molybdenite, as shown in Figure 1.
Diesel oil (DO) was used as a collector to target molybdenite faces. DO can only adsorb on the nonpolar face of molybdenite by hydrophobic interactions and van der Waals forces. DO cannot improve the hydrophobicity of molybdenite edges by adsorbing on the polar edge of molybdenite.
Polycyclic aromatic hydrocarbon (PAHs) which shows improved molybdenite flotation in the preliminary study when mixed with DO was examined in this study. It may adsorb on molybdenite edges. It has a general chemical formula of CnH2n−12 (14 ≥ n ≥ 10, n = 11 in this study). The typical molecule structure of PAHs is shown in Figure 2.
XLM is a mixture of DO and PAHs. It consists of 95 wt % DO and 5 wt % PAHs, the optimal DO and PAHs proportions identified in the previous study on molybdenite flotation. XLM produced a higher Molybdenite flotation recovery than DO or PAHs as a single collector. XLM was used in the whole experiment of this study to understand the adsorption of PAHs on molybdenite edges.
Calcium chloride and sodium chlorite were used for adjusting calcium and sodium concentrations. Na+ was used for a comparison with Ca2+. Sodium hydroxide was used to adjust solution pH. Distilled water and deionized water were also used in this study.
2.2. Ultraviolet-Visible Spectrophotometer Measurements
An ultraviolet-visible spectrophotometer (UV-2802S, Unico (Shanghai) Instruments Co., Ltd., Shanghai, China) was used to measure the concentration of PAHs remaining in the solution after the contact of molybdenite samples with XLM. The characteristic peak of PAHs appears at a wavelength of 220, 267, 275 and 283 nm [28,29]. Standard solutions of various concentrations of PAHs at 0.1, 0.2, 0.5, 1, 2, 4 and 10 mg/L were prepared to establish the standard absorption intensity of PAHs based on which the absorption intensity of the residual PAHs after adsorption on molybdenite was determined.
For the adsorption test, 0.2 g molybdenite and 100 mL Ca2+ solution were added to a 500 mL Erlenmeyer flask. They were mixed by a thermostatic oscillator for 5 min. Then, a 100 mL solution of 40 mg/L XLM was mixed by the thermostatic oscillator, and 2 mL solution was removed at a specified time interval. The supernatant was handled with ultrasonic treatment for 1 min after centrifugation. Then, the solution was analyzed by the UV-vis spectrophotometer. The adsorbed PAHs on molybdenite was calculated using the following equation:
where qt is the adsorption quantity (mg/g); m is the mass of mineral sample (g); V is solution volume (L); C0 and Ct are the solution concentration before and after the adsorption, respectively (mg/L). Five repeat adsorption tests were conducted and the average value was reported.
qt = (C0 − Ct) V/m
2.3. Zeta Potential Measurements
The suspension containing less than 5% molybdenite was dispersed for 15 min in the solution of Ca2+ at 0~2000 mg/L. The Ca2+ concentration of 0~2000 mg/L was only used in Zeta potential measurements in this study. Then, DO or XLM as a collector at a concentration of 20 mg/L was added after dispersing by a thermostatic oscillator for 3 min. The suspension was then transferred to a sample vessel for the zeta potential measurement at room temperature (20 °C). It should be noted that the purpose of this study was to understand the mechanism responsible for fine molybdenite flotation in the presence of a high amount of Ca2+ at pH 7~8, the optimum pH with PAHs, identified in the preliminary work. Therefore, the influence of the Ca2+ concentration on the zeta potential of molybdenite was only studied at pH 7 to be consistent with molybdenite flotation. Again, five repeat measurements were conducted and the average zeta potential value was reported.
2.4. Scanning Electron Microscopy and Energy Dispersive X-Ray Spectrometer (SEM-EDS) Analysis
The molybdenite sample 5 g was mixed in a Ca2+ solution of 800 mg/L for 10 min. The solids were then washed repeatedly by distilled water, dried and coated with carbon, and then analyzed by a Cams can CS44 scanning electron microscope (SEM) (Cam Scan CS44, Cam Scan Electron Optics, Ltd., Cambridge, UK) fitted with a Energy Dispersive X-ray spectrometer (EDS) (Cam Scan Electron Optics, Ltd., Cambridge, UK). SEM was used to map the surface topography, and identify molybdenite faces and edges, while EDS was used to provide elemental identification on molybdenite faces and edges.
2.5. Calcium Speciation
Calcium speciation was constructed to describe the chemical species that may be present over the range of experimental conditions. The following reactions were used to construct the calcium species diagram [27]:
3. Results and Discussion
3.1. Ultraviolet-Visible Spectrophotometer Measurements
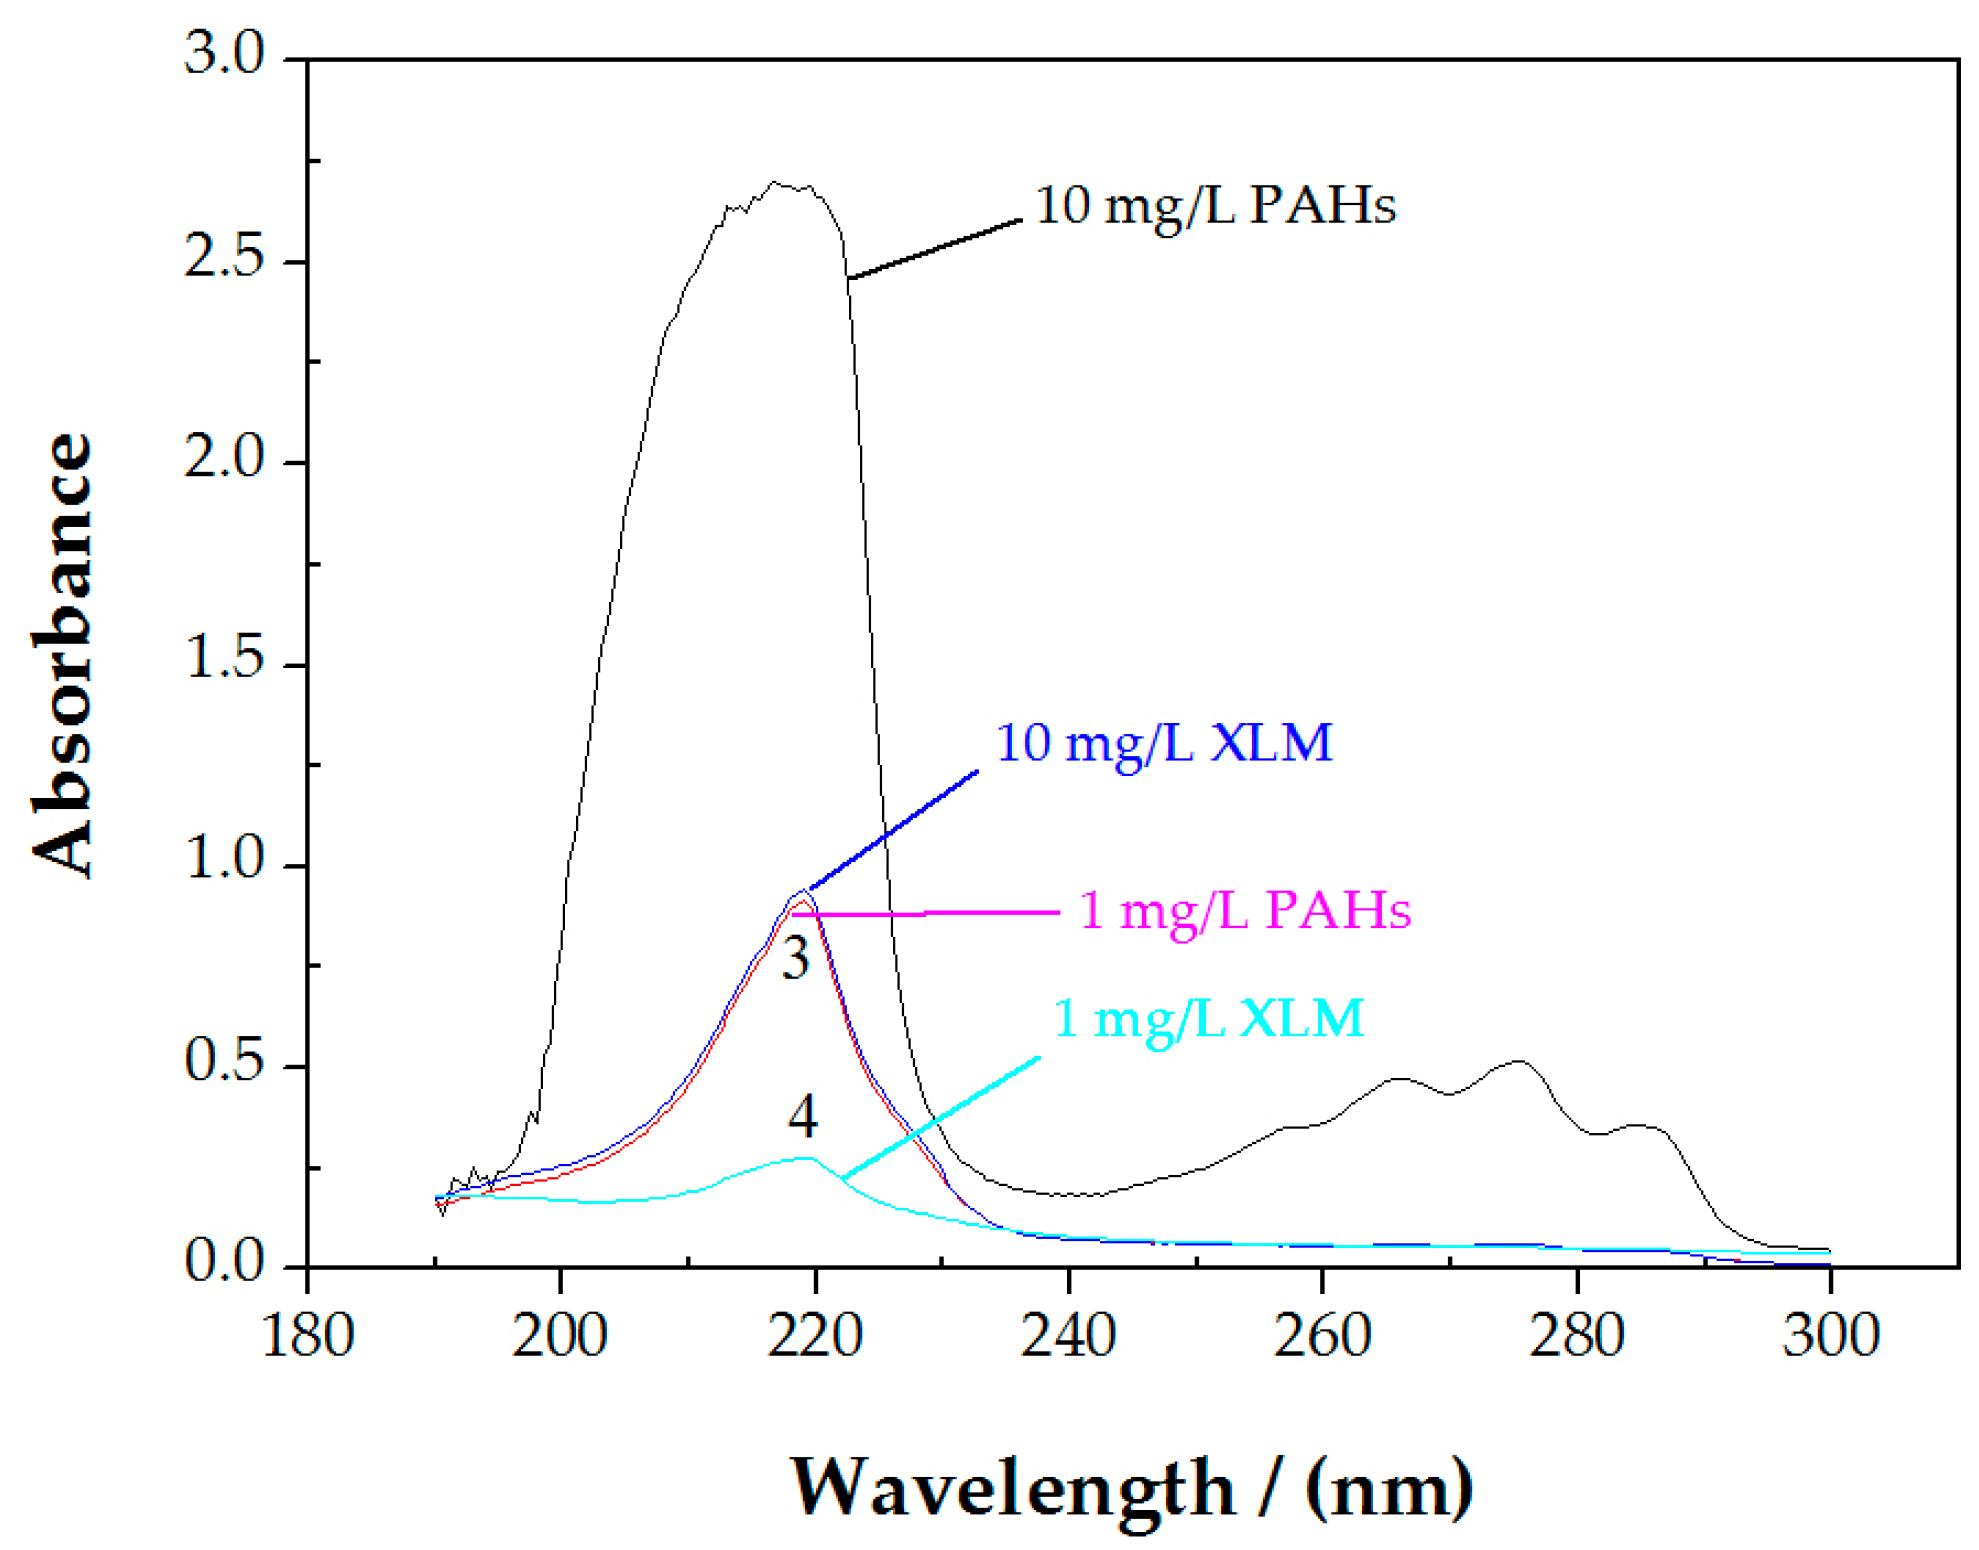
Figure 3 shows the UV-vis absorption spectra of PAHs and XLM at concentrations of 10 mg/L and 1 mg/L. The crest of PAHs absorption wave was around 219 nm, 267 nm, 275 nm and 285 nm at 10 mg/L PAHs, but only around 219 nm at 1 mg/L PAHs. The crest of XLM absorption wave at both 10 mg/L and 1 mg/L was around 219 nm, which represents PAHs in the composite collector. Therefore, the 219 nm was chosen for measuring the wavelength of PAHs in PAHs solutions and remaining in the solution after XLM interacted with the molybdenite sample in the subsequent study.
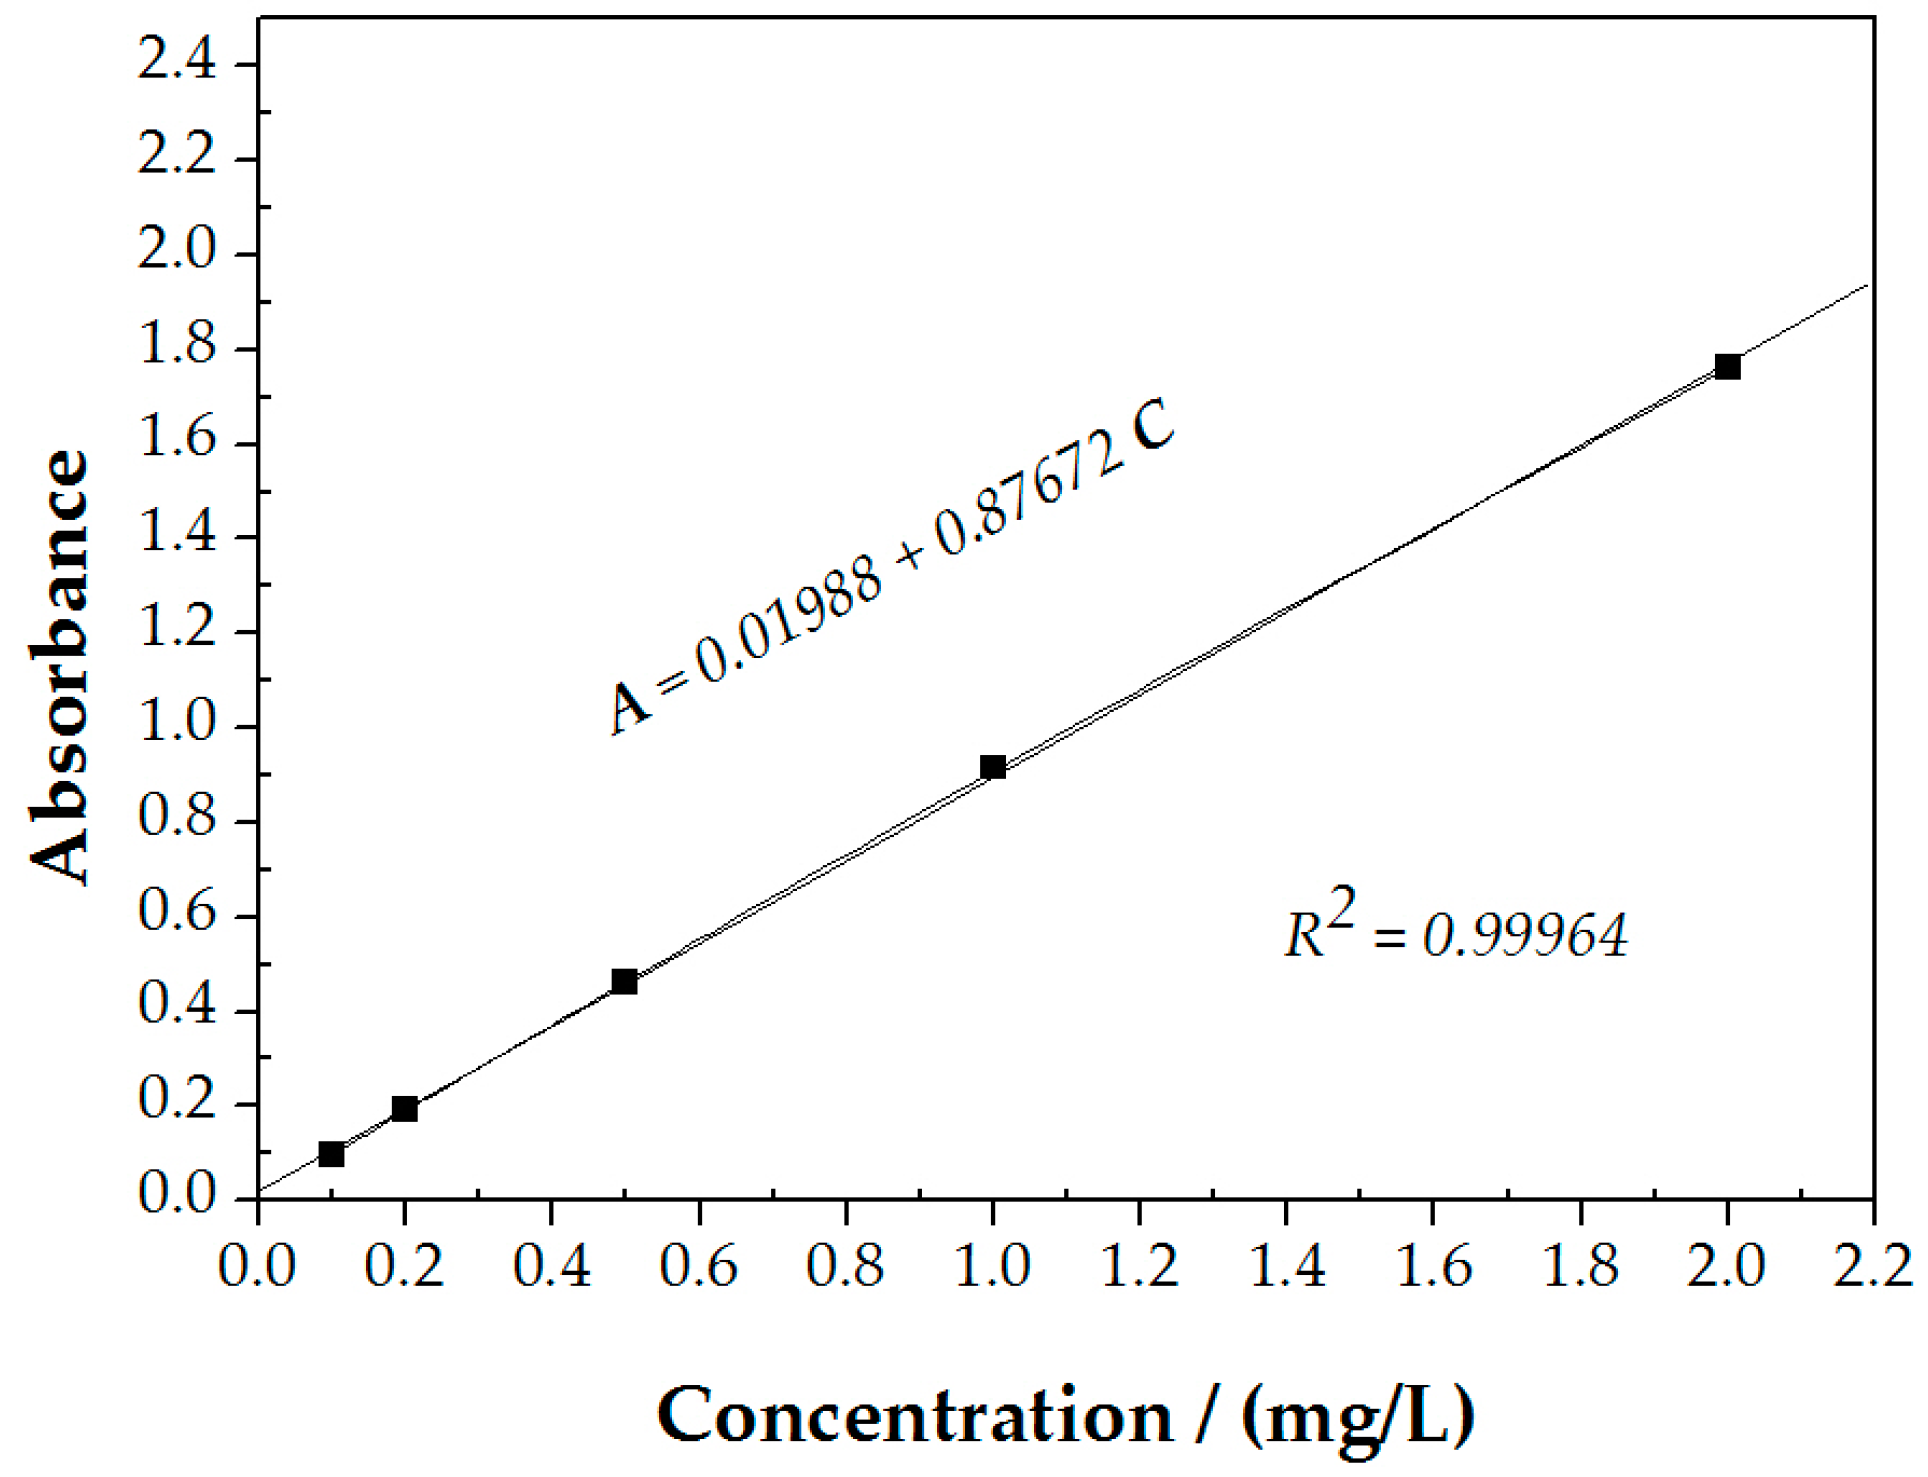
Standard solutions of various concentrations of PAHs were prepared to establish the standard absorption intensity of PAHs. Figure 4 shows the absorbance of PAHs as a function of its concentration. A linear relationship was obtained between the PAHs absorbance and its concentration:
A = 0.01988 + 0.87672C (Correlation coefficient R2 = 0.99964)
3.2. PAHs Adsorption on Molybdenite in the Presence of 800 mg/L Ca2+ or Na+
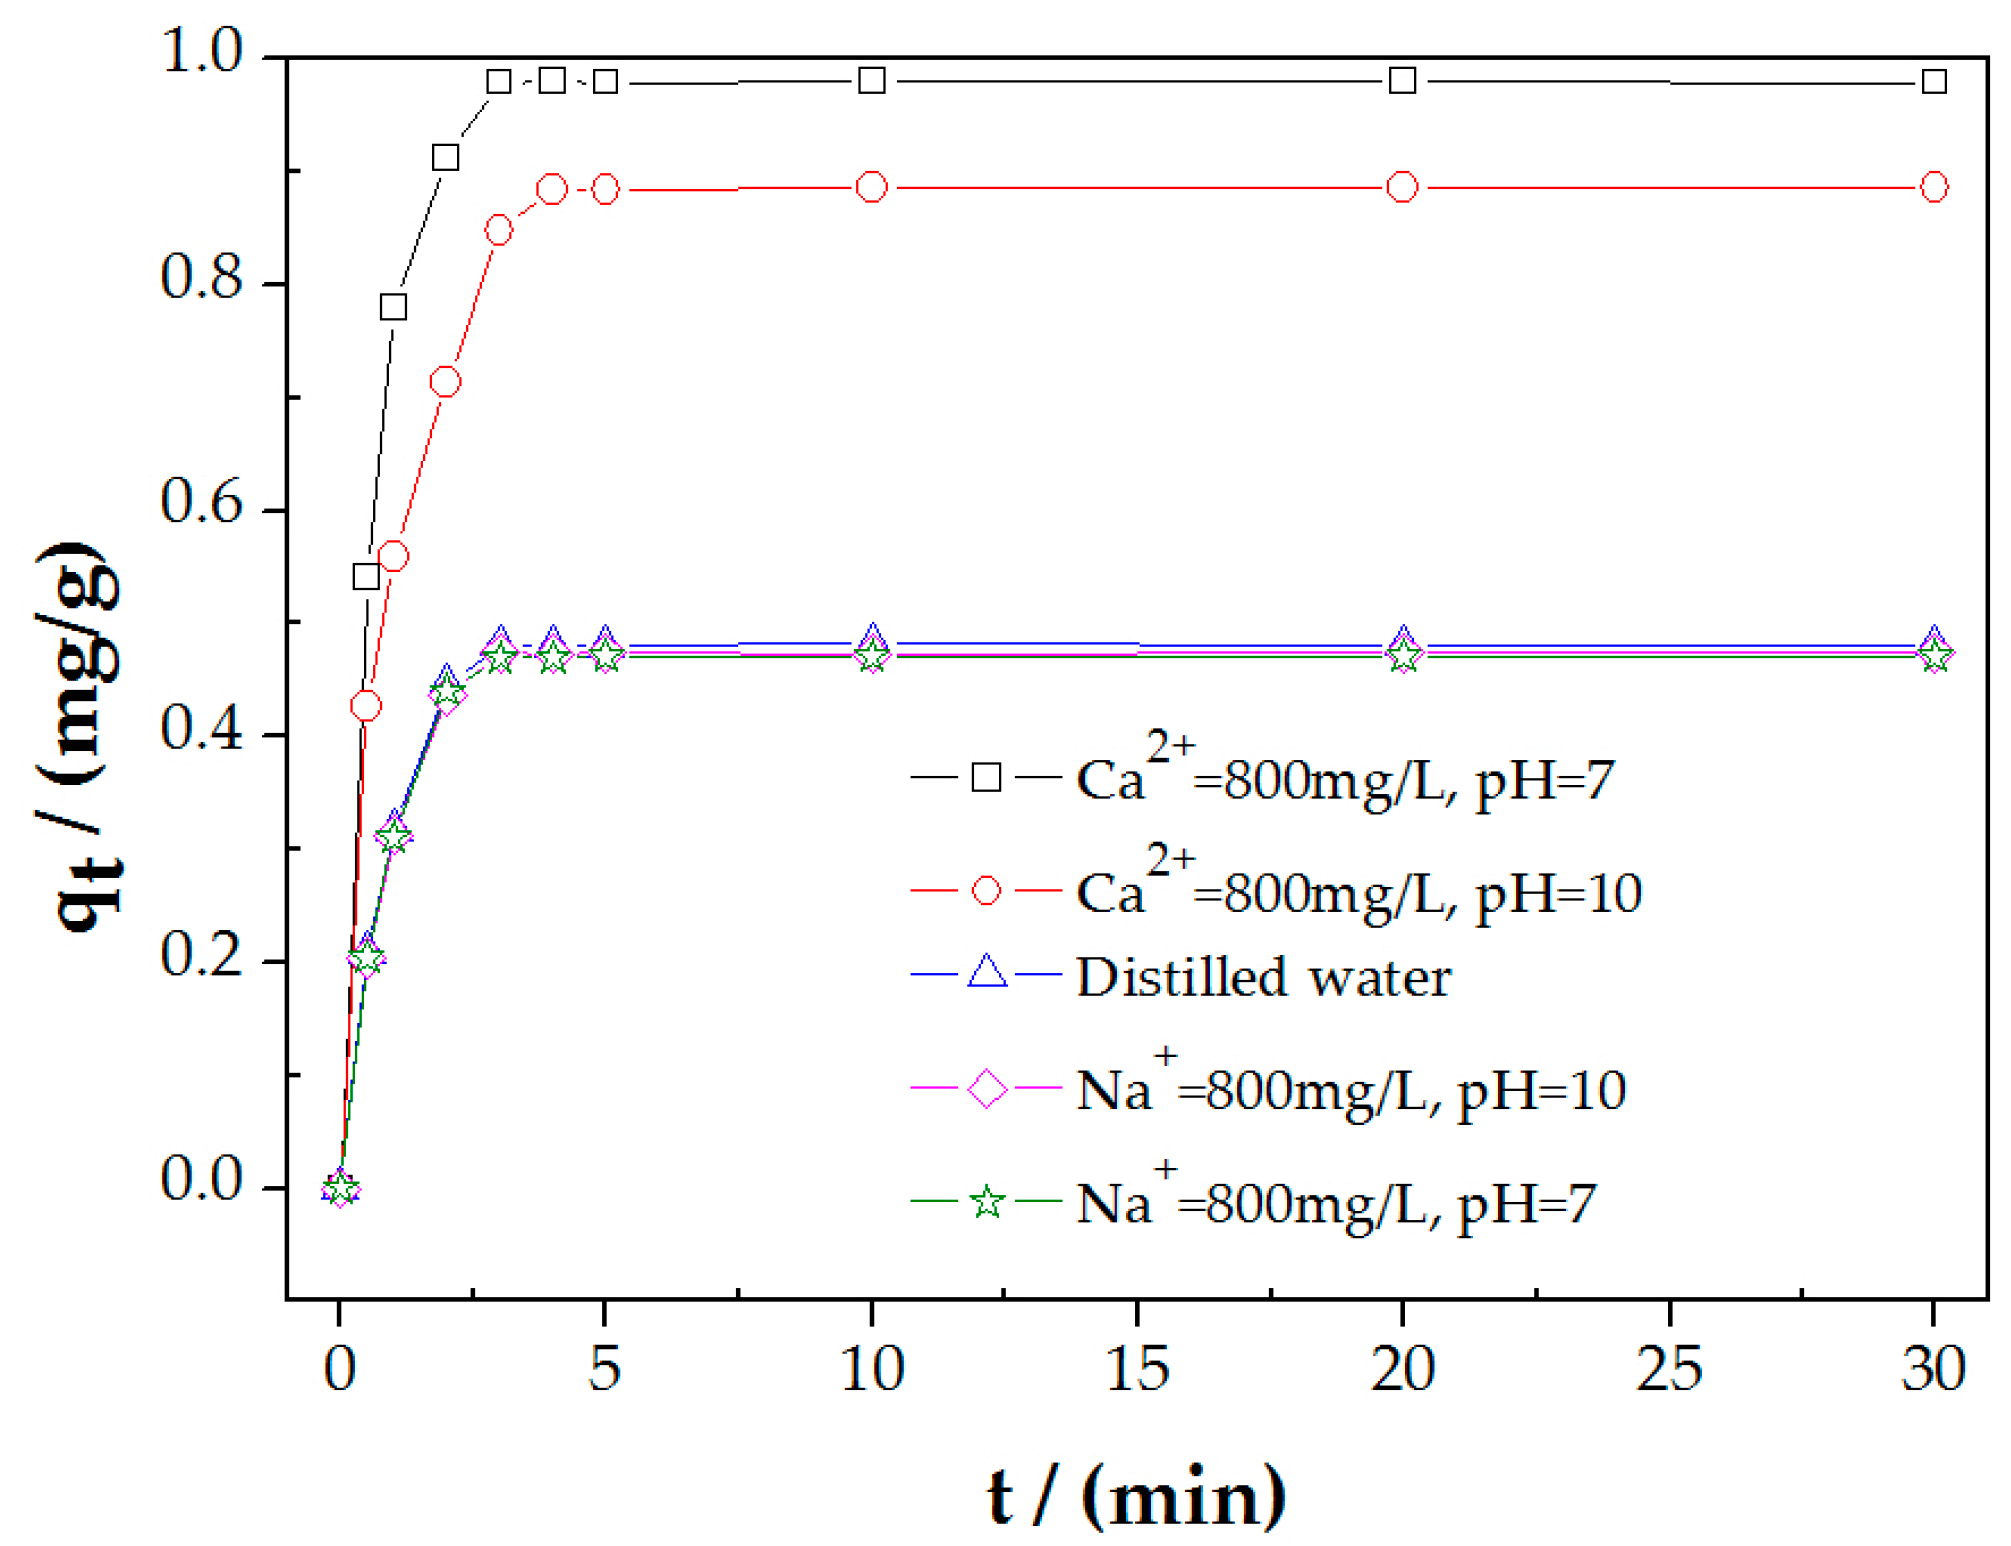
The molybdenite sample was treated with 20 mg/L XLM in deionized water and in the presence of 800 mg/L Ca2+ or Na+ and then the adsorption of PAHs on molybdenite was measured. The results are shown in Figure 5. In general, PAHs adsorption from XLM increased rapidly when the adsorption time was less than 1 min. Then, the increase slowed down and an equilibrium was reached at about 3 min of adsorption. PAHs adsorption was also affected by the type of cations and pH. In deionized water, the maximum PAHs adsorption was 0.481 mg/g at pH 7. Since PAHs are a neutral, nonpolar molecule, it may adsorb on molybdenite surfaces as DO. Figure 5 also shows that at 800 mg/L Na+, the maximum PAHs adsorption was 0.474 mg/g at pH 10 and 0.470 mg/g at pH 7. Compared with PAHs adsorption in deionized water, Na+ had little effect on PAHs adsorption. It is interesting to find that replacing Na+ by Ca2+ increased the maximum PAHs adsorption to 0.980 mg/g at pH 7 and 0.886 mg/g at pH 10, almost double the adsorption in deionized water. A higher pH decreased PAHs adsorption in the presence of Ca2+.
The adsorption test indicates that Ca2+ enhanced the adsorption of PAHs on molybdenite and the increased adsorption of PAHs was associated with the presence of Ca2+.
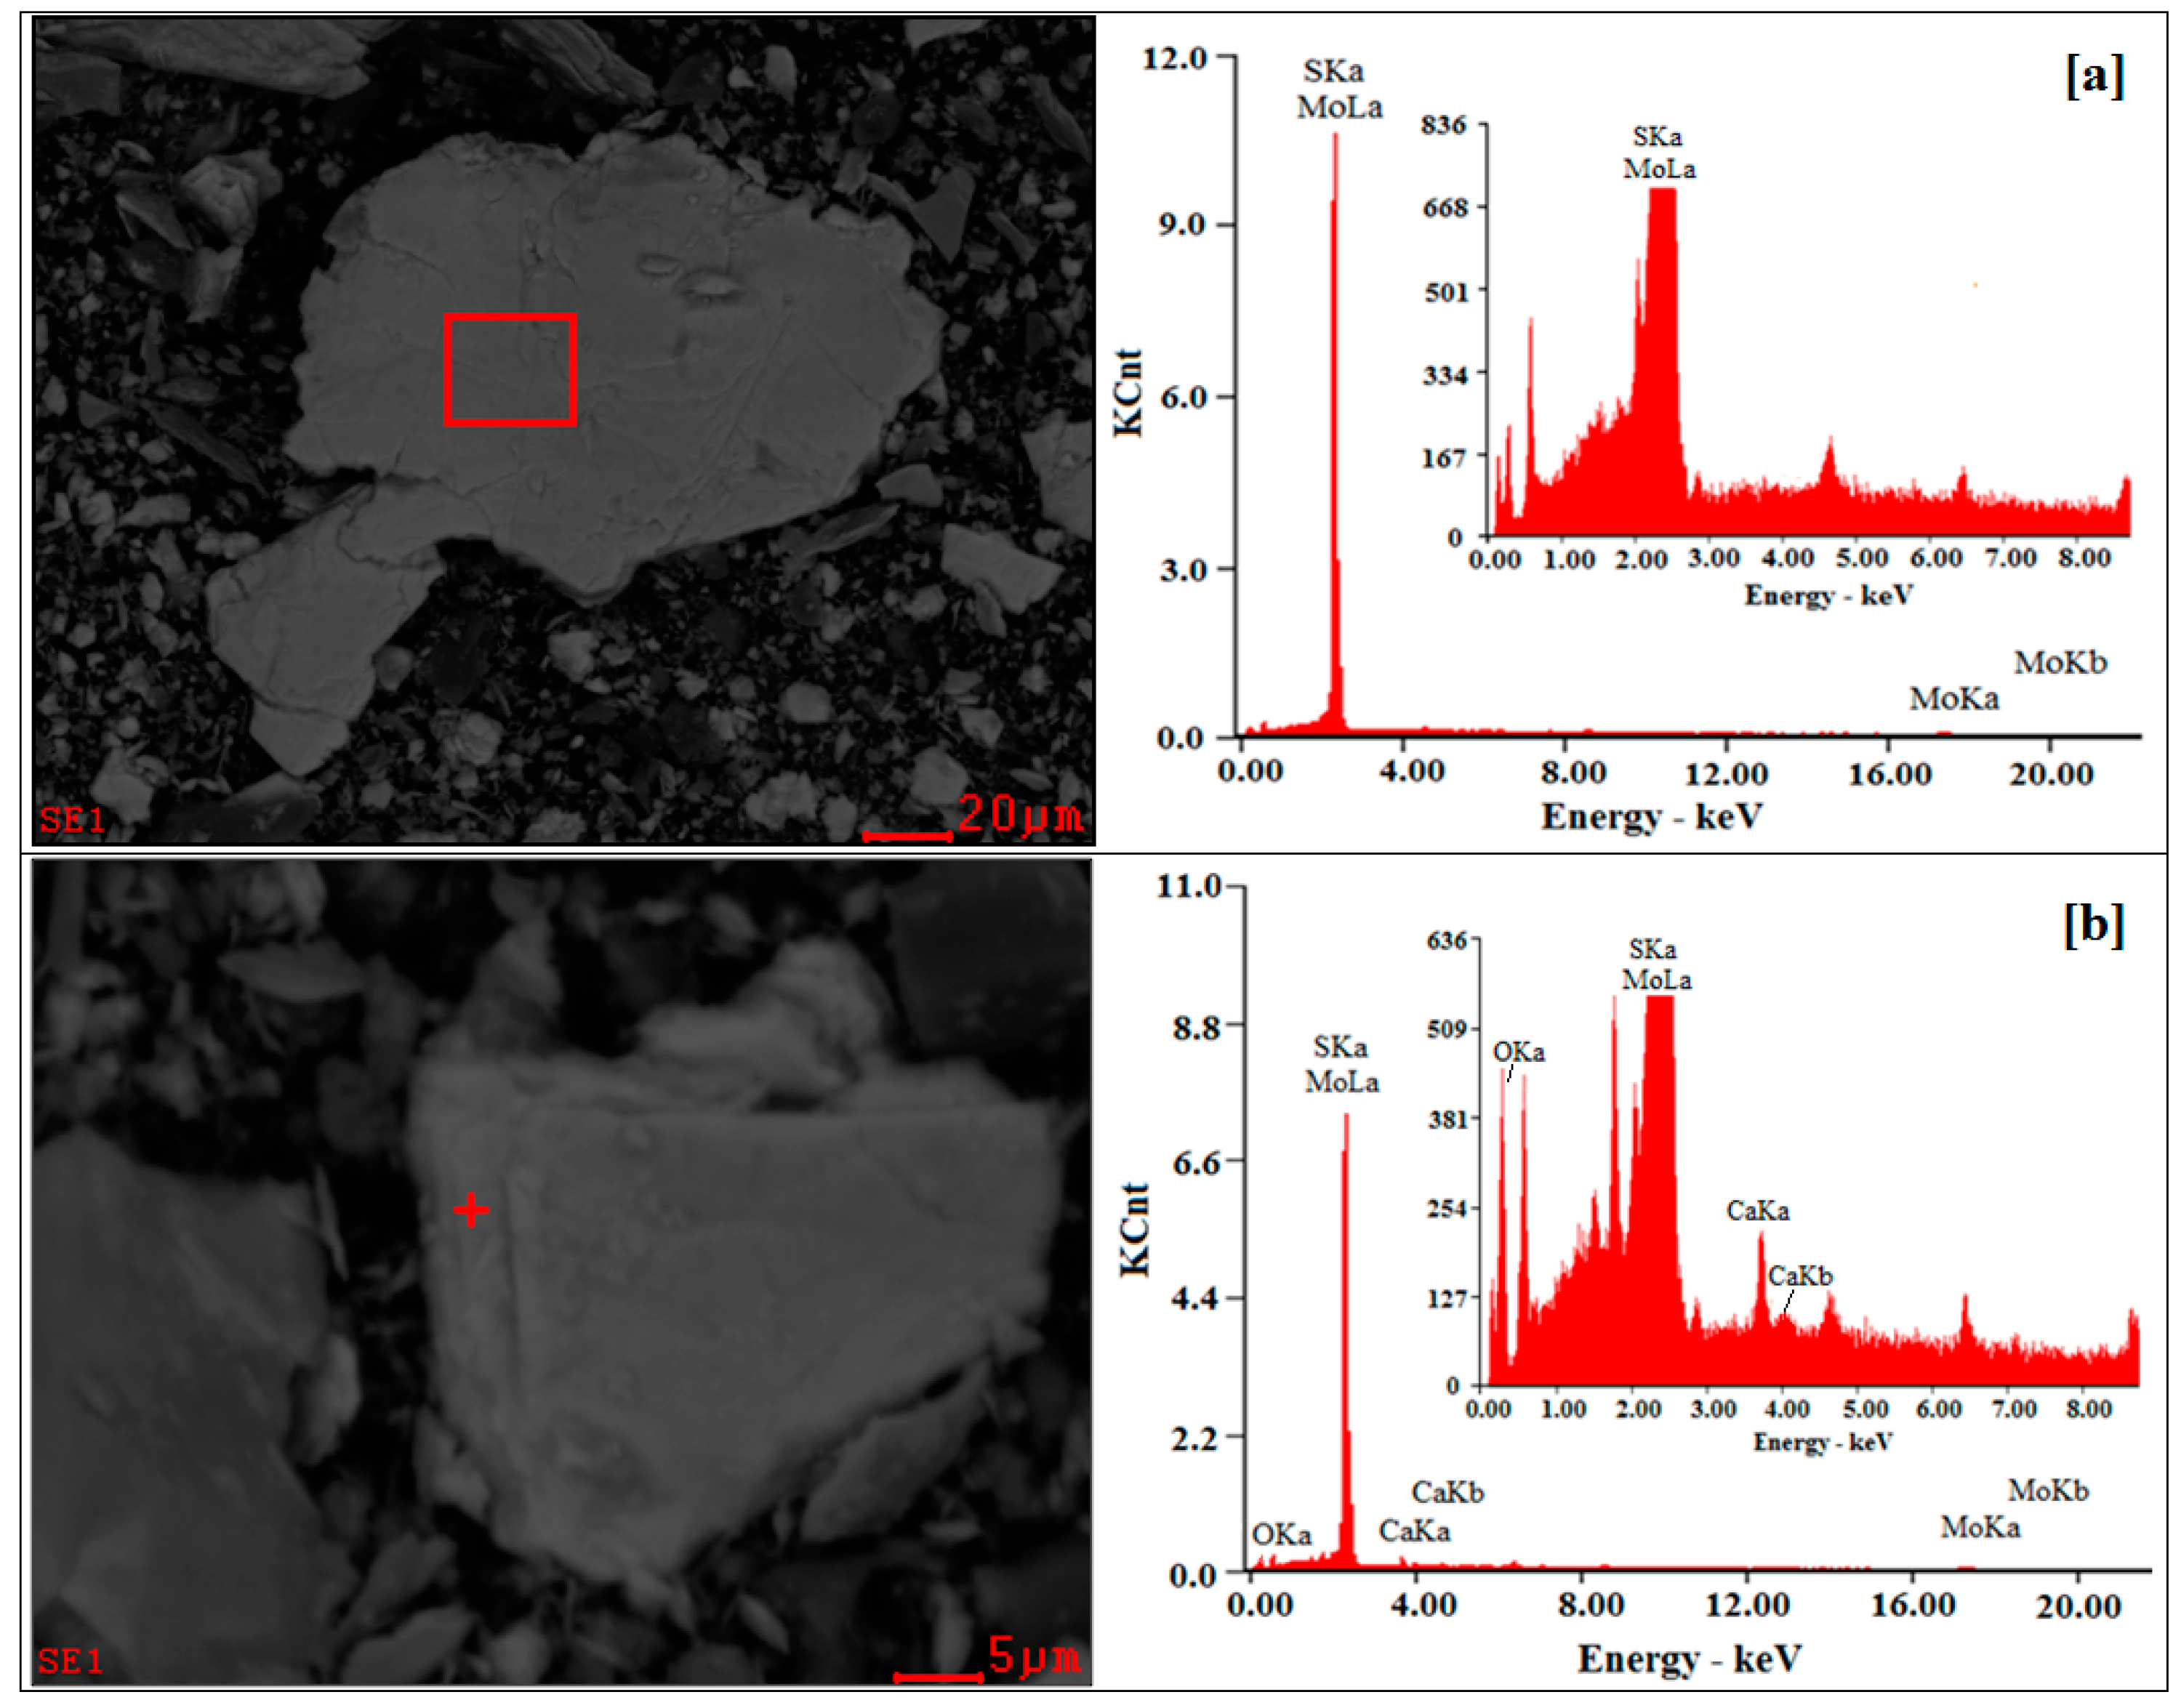
Figure 6a,b show SEM images together with EDS of molybdenite faces and edges after treated with 20 mg/L XLM in the presence of 800 mg/L Ca2+ at pH 7. It was observed that the elemental composition was different on molybdenite faces and edges. As shown in Figure 6a, only Mo and S existed on molybdenite faces. This indicates that Ca2+ did not adsorb on molybdenite faces. However, Figure 6b clearly shows the presence of O and Ca besides Mo and S on molybdenite edges. Clearly, Ca2+ did absorb on molybdenite edges. This is in agreement with previous studies [4,20] showing that the negative charge of molybdenite resulted from the oxidation of molybdenite edges, producing MoO42− and HMoO4−. Ca2+ may adsorb on molybdenite edges by electrostatic interactions and spontaneously react with MoO42− to form CaMoO4 precipitates. The standard free energy of formation (∆Gf0) is CaMoO4 is −1405.19 ± 1.60 kJ mol−1 [30]. CaMoO4 is also slightly soluble with the solubility of 4.099 × 10⁻³ g/100 g water at 20 °C. As a result, the formation of CaMoO4 is possible on the oxidized molybdenite edges in the presence of Ca2+. The following reactions are proposed to be responsible for the formation of CaMoO4:
The combination of Figure 5 and Figure 6 suggests that the increased PAHs adsorption on molybdenite by Ca2+ compared to that in deionized water is related to Ca2+ that is only adsorbed on molybdenite edges. Obviously PAHs may adsorb on molybdenite edges through Ca2+ and the formation of CaMoO4 precipitates may promote this adsorption. Since the presence of Ca2+ initiated PAHs adsorption on molybdenite edges, the influence of Ca2+ concentration and solution pH on PAHs adsorption was further studied.
3.3. The Influence of Ca2+ Concentration on PAHs Adsoptionon Molybdenite
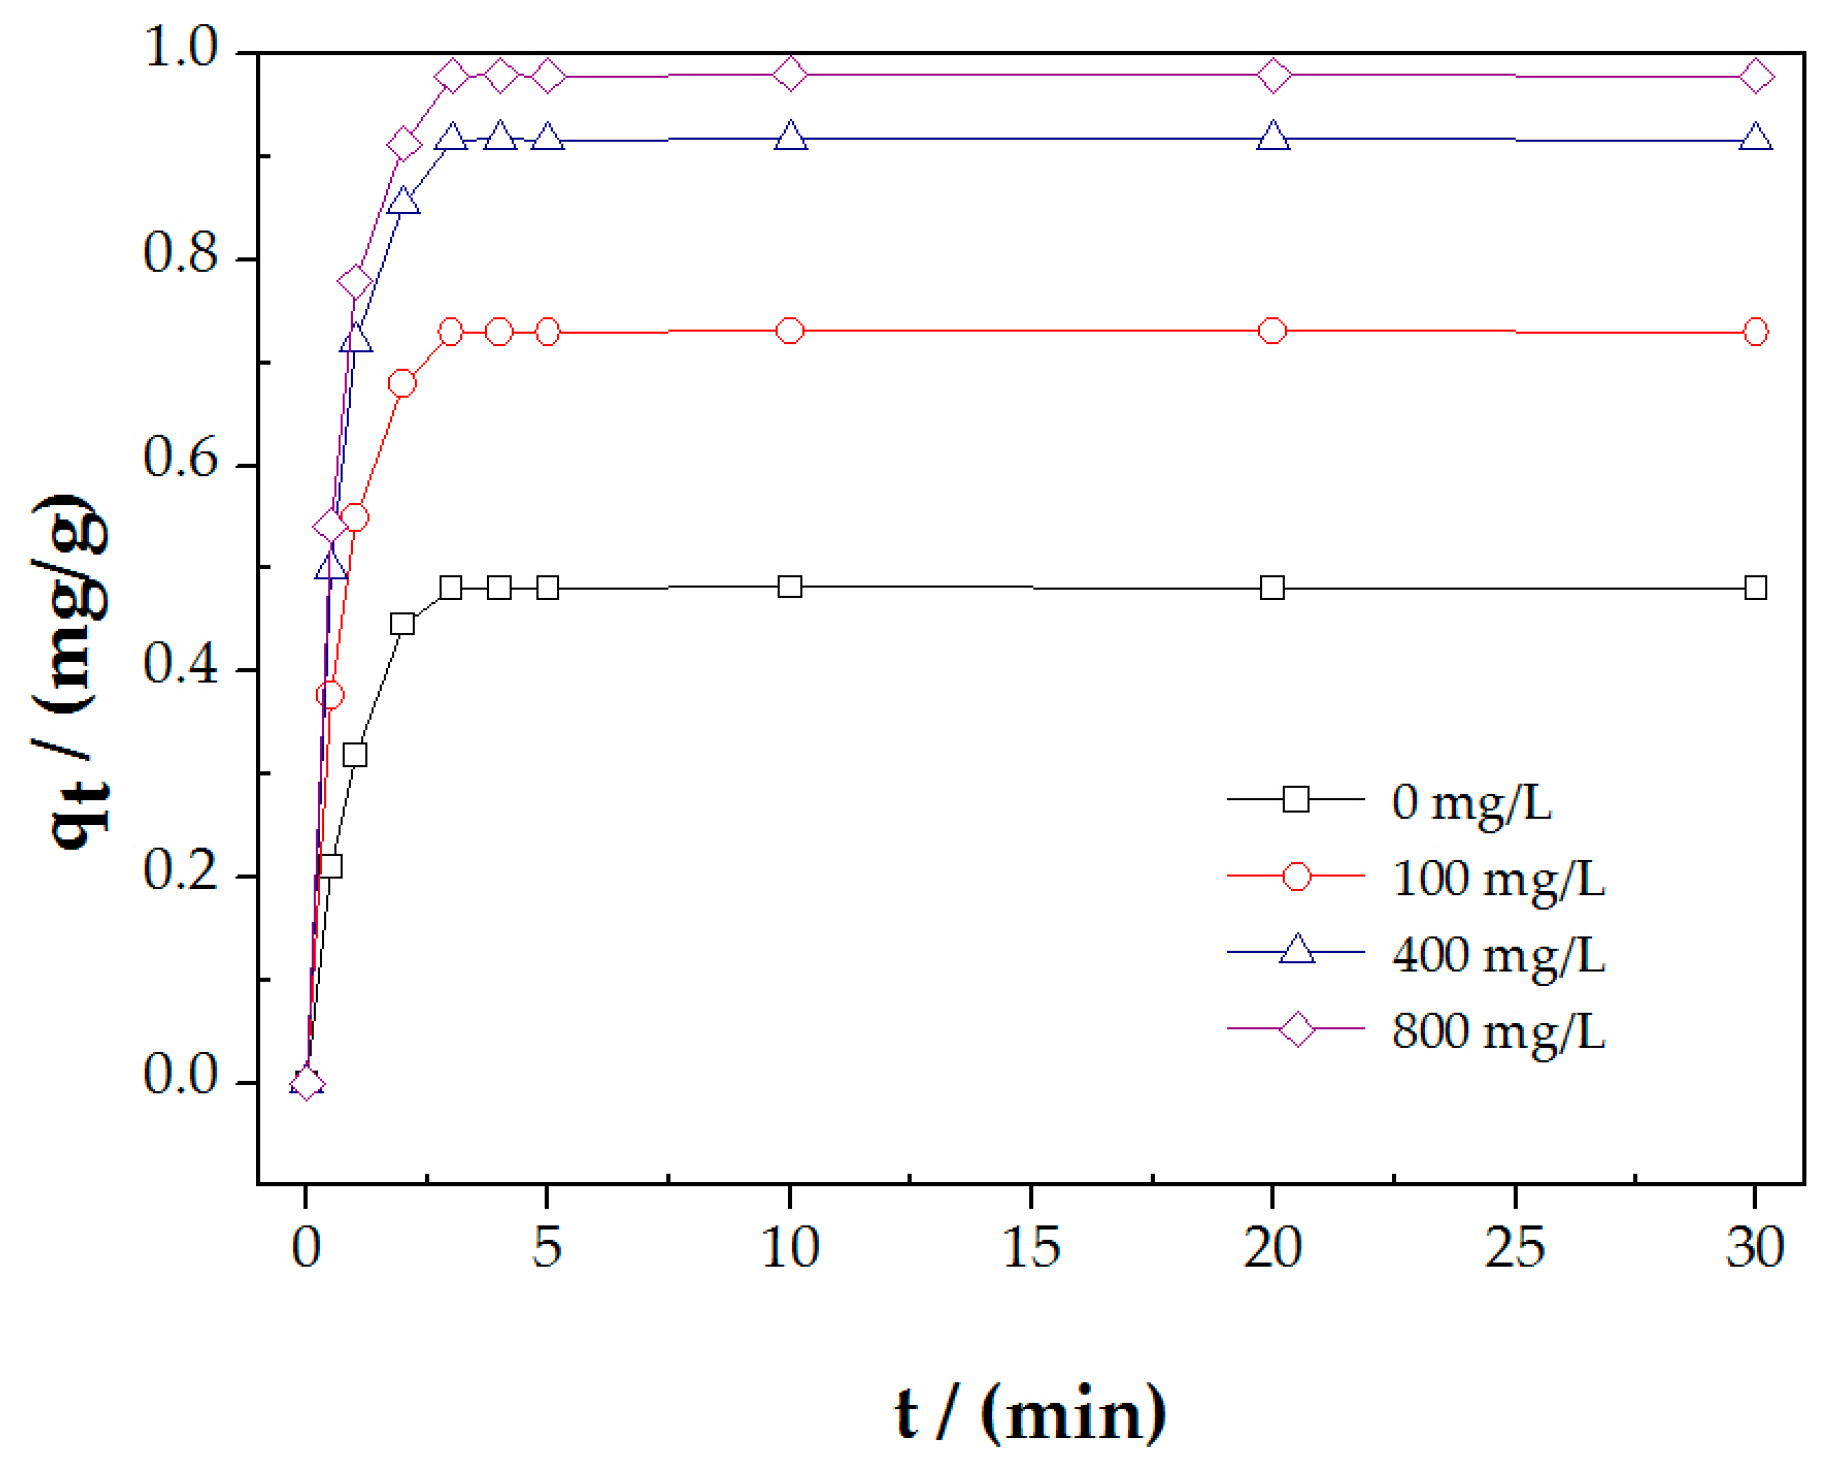
Figure 7 show PAHs adsorption on molybdenite after treated with 20 mg/L XLM as a function of Ca2+ concentration at pH 7. The maximum PAHs adsorption on molybdenite was 0.481, 0.730, 0.918 and 0.980 mg/g in the presence of 0, 100, 400 and 800 mg/L Ca2+, respectively. PAHs adsorption increased with the Ca2+ concentration, and this increase slowed down at Ca2+ concentrations greater than 400 mg/L. In fact, the higher the Ca2+ concentration, the easier the reaction (8) to form calcium molybdate and CaMoO4 precipitates, which promoted PAHs adsorption on molybdenite edges.
3.4. The Influence of pH on PAHs Adsoptionon Molybdenite
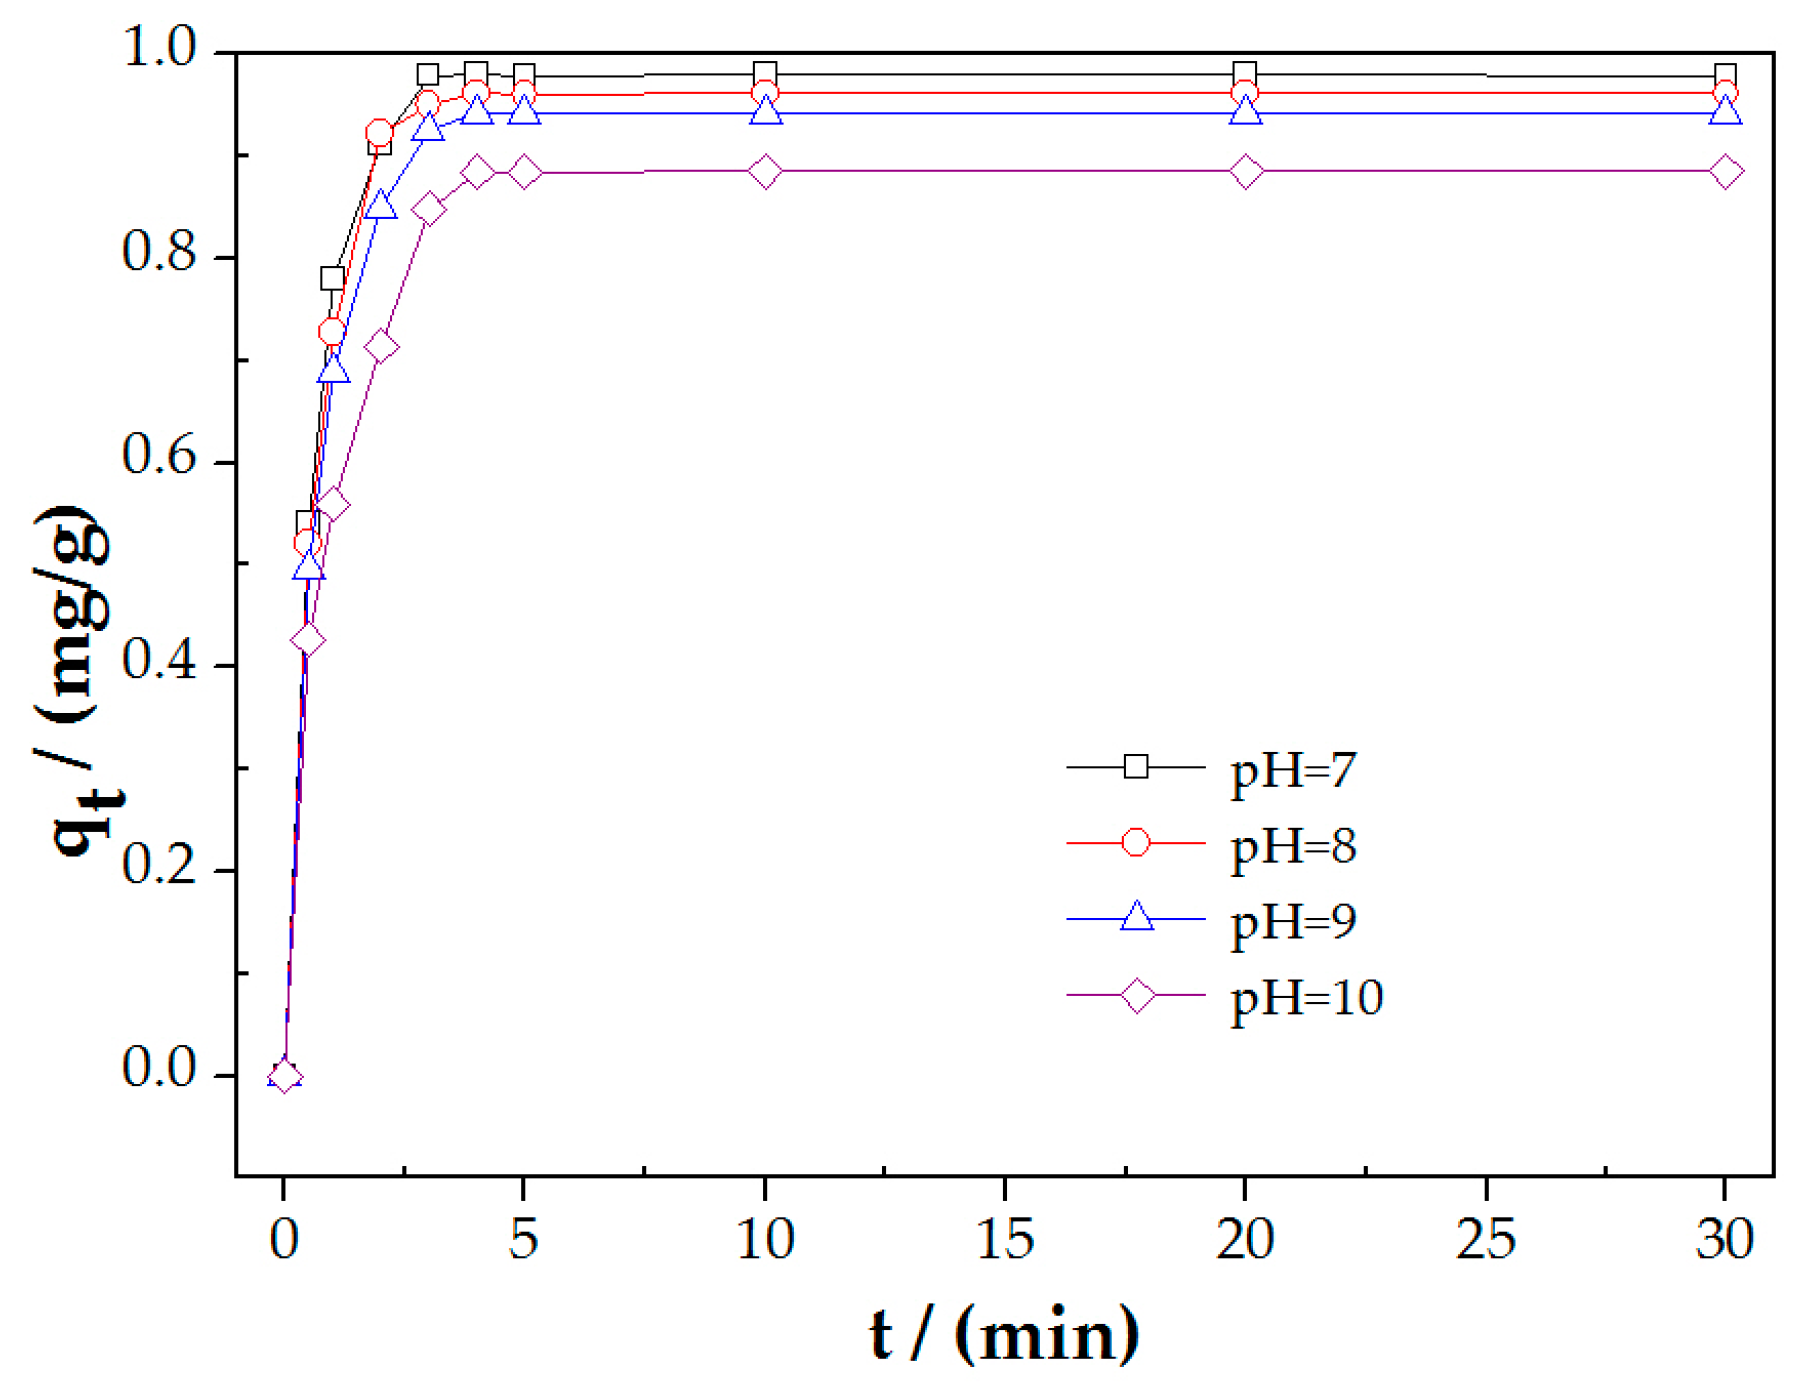
Figure 8 shows PAHs adsorption on molybdenite after treated with 20 mg/L XLM as a function of pH in the presence of 800 mg/L Ca2+. The maximum PAHs adsorption on molybdenite was 0.980, 0.961, 0.942 and 0.886 mg/g at pH 7, 8, 9 and 10, respectively. It can be seen that PAHs adsorption on molybdenite decreased with an increase in pH. At the pH greater than 8, this increase was slight.
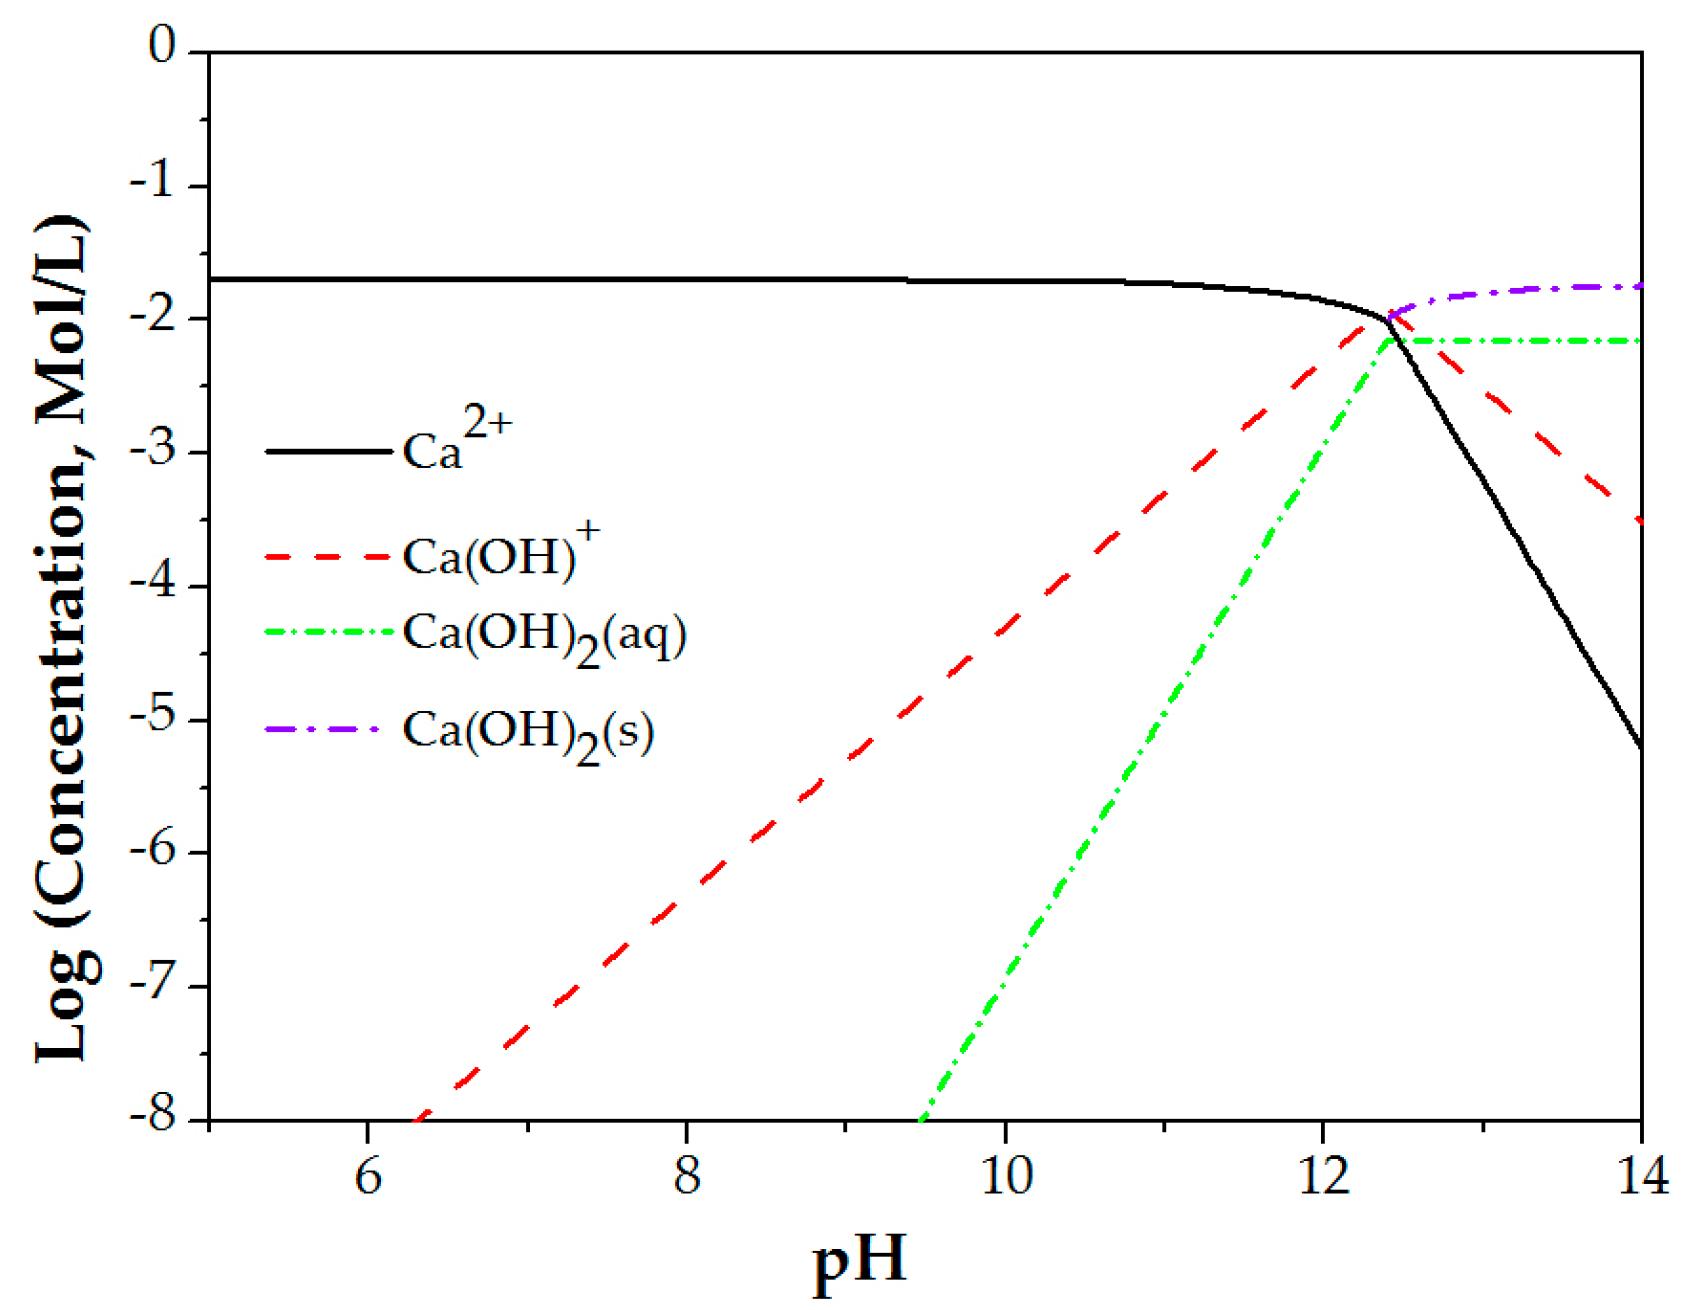
Figure 9 shows the distribution of calcium species as a function of pH at 800 mg/L total calcium. At pH below 6.2, the Ca2+ in the solution is relatively free to move around. However, at pH above 6.2, the free Ca2+ begins to react with hydroxyl ions, and hence, form a variety of hydroxyl compounds. Some of these hydroxyl compounds are Ca(OH)+, Ca(OH)2(aq) and Ca(OH)2(s). The concentration of these hydroxyl compounds increases with an increase in pH. The concentration of free Ca2+ reaches a maximum and then remains unchanged until pH 12. At pH above 12, the free Ca2+ concentration decreases substantially.
Since PAHs adsorption on molybdenite decreased with an increase in pH or the concentration of hydroxyl compounds, hydroxyl compounds may inhibit PAHs adsorption. It seems that these hydroxyl compounds may compete with Ca2+ for molybdenite edges. It confirms that it was Ca2+ that react with MoO42− to form CaMoO4 precipitates that promote PAHs adsorption on molybdenite edges.
3.5. Zeta Potential Measurements
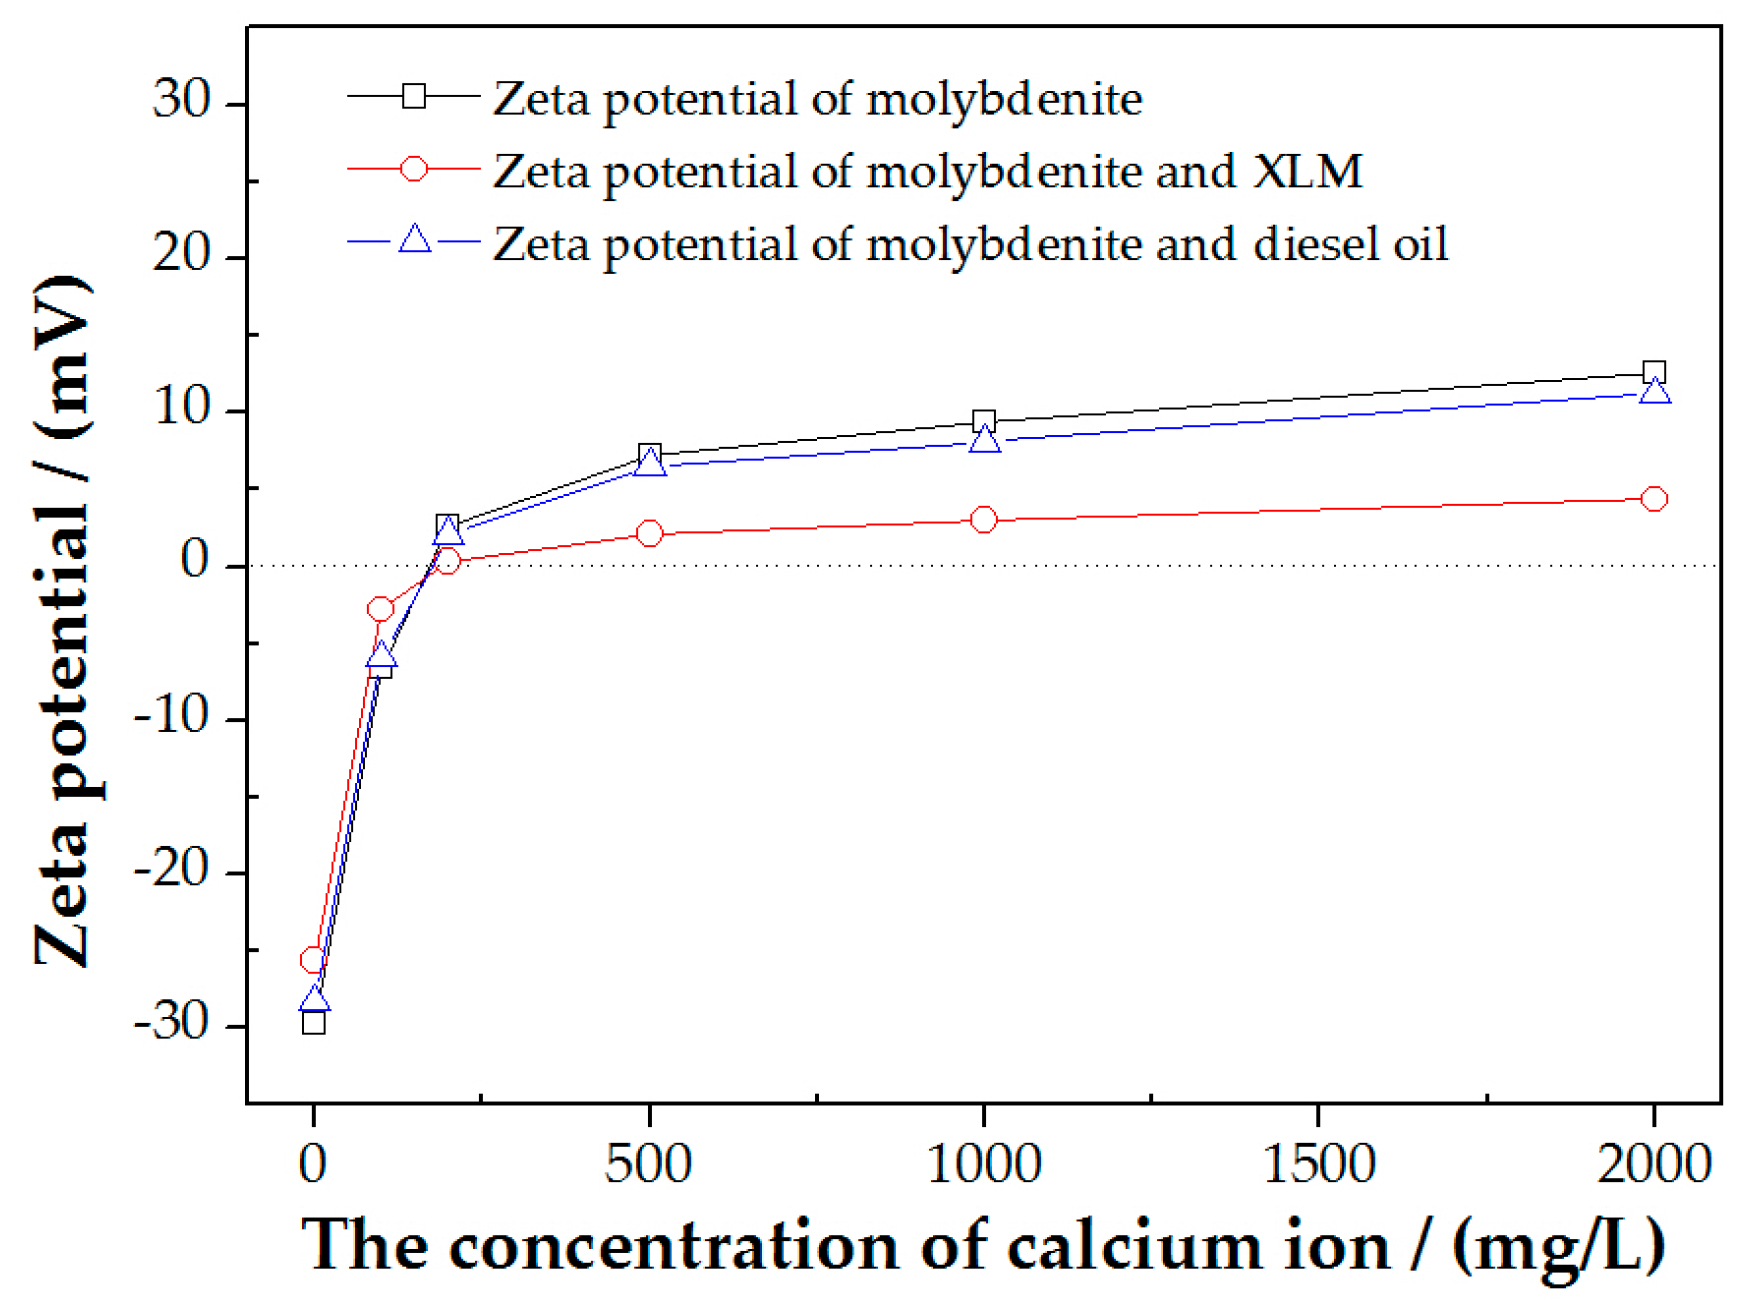
The zeta potential of molybdenite in the absence and presence 20 mg/L DO or XLM as a function of Ca2+ concentration was measured at pH 7, which would indicate the role PAHs as part of XLM played. The results are shown in Figure 10. The initial zeta potential of molybdenite was about −29 mV in all the three conditions without Ca2+ and increased with Ca2+ concentration. The zeta potential reversed to positive at 180 mg/L Ca2+. Figure 10 also shows that the presence of DO only slightly lowered the zeta potential of molybdenite, but the presence of XLM significantly lowed the zeta potential of molybdenite due to the existence of PAHs. For example, at 2000 mg/L Ca2+, the zeta potential of molybdenite was about 10 mV in the absence and presence of DO, but about 5 mV in the presence of XLM. Obviously, the 5 wt % PAHs in XLM contributed to the decrease of zeta potential probably due to the negatively charged π bonds. It has been reported that molybdate ions also have the π bonds [31,32]. It is likely that the cation–π interaction between PAHs and absorbed Ca2+ and the π–π interaction between PAHs and MoO42− take place on molybdenite edges supported by previous studies [33,34,35,36,37,38,39]. In fact, the cation–π interaction and the π–π interaction have been widely observed in biological systems [40].
This study indicates that the presence of CaMoO4 precipitates on molybdenite edges is the main reason that PAHs could adsorb on molybdenite edges. Firstly, Ca2+ could react with MoO42−, the oxidation product, on molybdenite edges to form CaMoO4 precipitates. Secondly, PAHs could adsorb on molybdenite edges by the cation–π interaction between PAHs and adsorbed Ca2+ and the π–π interaction between PAHs and MoO42− and the electrostatic interaction between PAHs and adsorbed Ca2+. The reactions responsible for the adsorption of PAHs on molybdenite edges were proposed as follows:
4. Conclusions
PAHs, as part of the composite collector, XLM, could adsorb on molybdenite edges in the presence of Ca2+. PAHs adsorption on molybdenite edges increased with Ca2+ concentration. It is possible that Ca2+ reactedwith molybdenite edges to form CaMoO4 precipitates, which promoted the adsorption of PAHs. The reaction of CaMoO4 precipitates with PAHs may form PAHs-Ca2+-MoO42− with a structure of π–cation–π by (1) the cation–π interaction between PAHs and adsorbed Ca2+, (2) the π–π interaction between PAHs and MoO42− and (3) the electrostatic interaction between PAHs and adsorbed Ca2+.
PAHs adsorption on molybdenite decreased with an increase in pH while the concentration of hydroxide compounds increased. It is possible that the hydroxide compounds competed with Ca2+ for molybdenite edges. The stronger the competitive adsorption, the less the CaMoO4 precipitates on molybdenite edges to promote PAHs adsorption.
Fine molybdenite particles have more edges with more CaMoO4 precipitates on molybdenite edges to reduce the hydrophobicity in the presence of a high amount of Ca2+. The addition of PAHs in XLM may allow the adsorption of PAHs on molybdenite edges in the presence of Ca2+, hence mitigating the deleterious effect of Ca2+ on fine molybdenite flotation.
Acknowledgments
We gratefully acknowledge the financial support provided by the National Natural Science Foundation of China (Grant No. 51404185), China Postdoctoral Science Foundation funded project (Grant No. 2016M592900XB) and Talent Fund of Xi'an University of Architecture and Technology (Grant No. RC1235).
Author Contributions
He Wan, Wei Yang, Tingshu He and Yongjun Peng conceived and designed the experiments; He Wan performed the experiments and analyzed the data; Jianbo Yang and Lin Guo contributed to the preparation of reagents/materials.
Conflicts of Interest
The authors declare no conflict of interest.
References
- Kelebek, S. Critical surface tension of wetting and of floatability of molybdenite and sulfur. J. Colloid Interface Sci. 1988, 124, 504–514. [Google Scholar] [CrossRef]
- Castro, S.; Lopez-Valdivieso, A.; Laskowski, J.S. Review of the flotation of molybdenite. Part I: Surface properties and floatability. Int. J. Miner. Process. 2016, 148, 48–58. [Google Scholar] [CrossRef]
- Krishnaswamy, P. Kinetics of the Aqueous Oxidation of Molybdenite and the Role of Crystal Anisotropy on the Electrochemical Mechanisms of the Process. Ph.D. Dissertation, University of California, Berkeley, CA, USA, 1981; pp. 11–12. [Google Scholar]
- Chander, S.; Fuerstenau, D.W. On the natural floatability of molybdenite. Trans. Am. Inst. Min. Metall. Eng. 1972, 252, 62–69. [Google Scholar]
- Yang, B.Q.; Song, S.X.; Lopez-Valdivieso, A. Effect of Particle Size on the Contact Angle of Molybdenite Powders. Miner. Process. Extr. Metall. Rev. 2014, 35, 208–215. [Google Scholar] [CrossRef]
- He, T.S.; Wan, H.; Song, N.P.; Guo, L. The influence of composition of nonpolar oil on flotation of molybdenite. Miner. Eng. 2011, 24, 1513–1516. [Google Scholar] [CrossRef]
- Smit, F.J.; Bhasin, A.K. Relationship of petroleum hydrocarbon characteristics and molybdenite flotation. Int. J. Miner. Process. 1985, 15, 19–40. [Google Scholar] [CrossRef]
- Crozier, R.D. Flotation reagent practice in primary and by-product molybdenite recovery. Min. Mag. 1979, 140, 174–178. [Google Scholar]
- Xia, Y.K.; Peng, F.F. Selection of frothers from residual organic reagents for copper-molybdenite sulfide flotation. Int. J. Miner. Process. 2007, 83, 68–75. [Google Scholar] [CrossRef]
- Kainuma, Y.; Uyeda, R. On the Structure of Adsorbed Organic Long-Chain Molecules on the Cleavage Surface of Molybdenite. J. Phys. Soc. Jpn. 1950, 5, 199–200. [Google Scholar] [CrossRef]
- Hoover, R.; Malhotra, D. Emulsion flotation of molybdenite. In Flotation—A. M. Gaudin Memorial; American Institute of Mining, Metallurgical, and Petroleum Engineers: New York, NY, USA, 1976; Volume 1, pp. 485–503. [Google Scholar]
- Groszek, A.J. Preferential adsorption of long-chain normal paraffins on MoS2, WS2 and graphite from n-heptane. Nature 1964, 104, 680. [Google Scholar] [CrossRef]
- Groszek, A.J. Preferential adsorption of compounds with long methylene chains on cast iron, graphite, boron nitride, and molybdenum disulfide. Tribol. Trans. 1966, 9, 67–76. [Google Scholar] [CrossRef]
- Groszek, A.J. Selective adsorption at graphite/hydrocarbon interfaces. Proc. Royal Soc. Lon. A Math. Phys. Eng. Sci. 1970, 314, 473–498. [Google Scholar] [CrossRef]
- Tabares, J.O.; Ortega, I.M.; Bahena, J.R.; López, A.S.; Pérez, D.V.; Valdivieso, A.L. Surface Properties and Floatability of Molybdenite. Proceedings of 2006 China-Mexico Workshop on Minerals Particle Technology, San Luis Potosi, Mexico, August 2006; pp. 115–124. [Google Scholar]
- Triffett, B; Bradshaw, D. The role of morphology and host rock lithology on the flotation behaviour of molybdenite at Kennecott Utah Copper. Proceedings of 9th International Congress for Applied Mineralogy: ICAM 2008, Brisbane, Australia, 8–10 September 2008; pp. 465–473. [Google Scholar]
- Zanin, M.; Ametov, I.; Grano, S.; Zhou, L.; Skinner, W. A study of mechanisms affecting molybdenite recovery in a bulk copper/molybdenum flotation circuit. Int. J. Miner. Process. 2009, 93, 256–266. [Google Scholar] [CrossRef]
- Muzenda, E. An investigation into the effect of water quality on flotation performance. World Acad. Sci. Eng. Technol. 2010, 69, 237–241. [Google Scholar]
- Levay, G.; Smart, R.S.C.; Skinner, W.M. The impact of water quality on flotation performance. J. South Afr. Inst. Min. Metall. 2001, 101, 69–75. [Google Scholar]
- Chen, J.M.; Liu, R.Q.; Sun, W.; Qiu, G.Z. Effect of mineral processing wastewater on flotation of sulfide mineral. Trans. Nonferrous Metal. Soc. China 2009, 19, 454–457. [Google Scholar] [CrossRef]
- Raghavan, S.; Hsu, L.L. Factors affecting the flotation recovery of molybdenite from porphyry copper ore. Int. J. Miner. Process. 1984, 12, 145–162. [Google Scholar] [CrossRef]
- Ronzio, R.A. The role of surfactants in the flotation of molybdenite at climax. J. Am. Oil Chem. Soc. 1970, 47, 504A. [Google Scholar] [CrossRef]
- Nishkov, I.; Beas, E.; Henriquez, C. Effect of Surfactant Oil Emulsification on the Flotation of Molybdenite for Porphyry Copper Ores. In Proceedings of the X Balkan Mineral Processing Congress, Varna, Bulgaria, 15–20 June 2003; pp. 205–211. [Google Scholar]
- Nishkov, I.; Lazarov, D.; Marinov, M.; Beas, E.; Henriquez, C. Surfactant-Hydrocarbon Oil Emulsions for Molybdenite Flotation. Proceedings of IV Meeting of the Southern Hemisphere on Mineral Techenology and III Latin-American Congreess on Froth Flotation, Concepción, Chile, 20–23 November 1994; pp. 319–329. [Google Scholar]
- Chander, S.; Fuerstenau, D.W. Electrochemical study of the molybdenite–potassium diethyldithiophosphate system. Trans. SME 1974, 265, 193–197. [Google Scholar]
- Chander, S.; Fuerstenau, D.W. The effect of potassium diethyldithiophosphate on the interfacial properties of molybdenite. Trans. IMM 1974, 83, C180–C185. [Google Scholar]
- Hirajim, T.; Suyantar, G.P.W.; Ichikaw, O.; Elmahdy, A.M.; Miki, H.; Sasaki, K. Effect of Mg2+ and Ca2+ as divalent seawater cations on the flotability of molybdenite and chalcopyrite. Miner. Eng. 2016, 96–97, 83–93. [Google Scholar] [CrossRef]
- Ogawa, K.; Harada, J.; Fujiwara, T.; Takahashi, H. UV–vis Absorption Spectra of Powdered Materials: Direct Measurements by Optical Waveguide Spectroscopy. Chem. Lett. 2004, 33, 1446–1447. [Google Scholar] [CrossRef]
- Hu, S.; Li, F.; Fan, Z. Preparation of Dihydroxy Naphthalene/TiO2 Complex via Surface Modification and Their Photocatalytic H2 Production Performances under Visible Light. Bull. Korean Chem. Soc. 2013, 34, 2056–2062. [Google Scholar] [CrossRef]
- Essington, M.E. Formation of calcium and magnesium molybdate complexes in dilute aqueous solutions. Soil Sci. Soc. Am. 1992, 56, 1124–1127. [Google Scholar] [CrossRef]
- Balan, A.; Santacruz, C.P.; Moutran, A.; Souza Ferreira, L.C.; Neshich, G.; Barbosa, J.A.R.G. Crystallographic structure and substrate-binding interactions of the molybdate-binding protein of the phytopathogen Xanthomonas axonopodis pv. citri. Biochim. Biophys. Acta 2008, 1784, 393–399. [Google Scholar] [CrossRef] [PubMed]
- Balan, A.; Santacruz, C.P.; Moutran, A.; Ferreira, R.C.C.; Medrano, F.J.; Pérez, C.A.; Ramos, C.H.I.; Ferreira, L.C.S. The molybdate-binding protein (ModA) of the plant pathogen Xanthomonas axonopodis pv. citri. Protein Expr. Purif. 2006, 50, 215–222. [Google Scholar] [CrossRef] [PubMed]
- Amunugama, R.; Rodgers, M.T. Cation–π interactions with a model for an extended π network absolute binding energies of alkali metal cation–naphthalene complexes determined by threshold collision-induced dissociation and theoretical studies. Int. J. Mass Spectrum. 2003, 227, 1–20. [Google Scholar] [CrossRef]
- Gong, Z.; Shen, H.Y.; Zhu, W.L.; Luo, X.M.; Chen, K.X.; Jiang, H.L. A computational study on electron transfer mechanism between alkaline earth metal atoms and cyclooctatetraene to form cation–π bonded complexes. Chem. Phys. Lett. 2006, 423, 339–343. [Google Scholar] [CrossRef]
- Hallowita, N.; Udonkang, E.; Ruan, C.H.; Frieler, C.E.; Rodgers, M.T. Inductive effects on cation–π interactions: Structures and bond dissociation energies of alkali metal cation–halobenzene complexes. Int. J. Mass Spectrum. 2009, 283, 35–47. [Google Scholar] [CrossRef]
- He, L.Y.; Cheng, J.G.; Wang, T.; Li, C.; Gong, Z.; Liu, H.; Zeng, B.B.; Jiang, H.L.; Zhu, W.L. Cation–π complexes formed between cyclooctatetraene and alkaline earth metals: Predicted and recorded NMR features. Chem. Phys. Lett. 2008, 462, 45–48. [Google Scholar] [CrossRef]
- Klippenstein, S.J.; Yang, C.N. Density functional theory predictions for the binding of transition metal cations to π systems: from acetylene to coronene and tribenzocyclyne. Int. J. Mass Spectrum. 2000, 201, 253–267. [Google Scholar] [CrossRef]
- Ruan, C.H.; Yang, Z.B.; Rodgers, M.T. Cation–π interactions with a π-excessive nitrogen heterocycle: Structures and absolute binding energies of alkali metal cation–pyrrole complexes. Int. J. Mass Spectrum. 2007, 267, 233–247. [Google Scholar] [CrossRef]
- Szumna, A.; Jurczak, J.; Urbańczyk-Lipkowska, Z. Competition between π–π stacking and hydrogen bonding in (1:2) picrates of 1,5-diamino-3-oxapentane, 1,8-diamino-3,6-dioxaoctane and 1,5-diamino-3-azapentane-solid state studies. J. Mol. Struct. 2000, 526, 165–175. [Google Scholar] [CrossRef]
- Cheng, J.G.; Luo, X.M.; Yan, X.H.; Li, Z.; Tang, Y.; Jiang, H.L.; Zhu, W.L. Research progress in cation–π interactions. Sci. China Ser. B Chem. 2008, 51, 709–717. [Google Scholar] [CrossRef]
Figure 1.
X-ray diffraction (XRD) analysis of the purified molybdenite sample.

Figure 2.
The typical molecule structure of polycyclic aromatic hydrocarbons (PAHs).

Figure 3.
The UV-vis absorption spectra of PAHs and XLM at concentrations of 10 mg/L and 1 mg/L.

Figure 4.
The absorbance of PAHs as a function of its concentration.

Figure 5.
PAHs adsorption on molybdenite in the presence of 800 mg/L Ca2+ or Na+ at pH 7 and 10.

Figure 6.
SEM images and EDS analysis of molybdenite faces and edges after treated with 20 mg/LDO in the presence of 800 mg/L Ca2+ at pH 7: (a) SEM images and EDS analysis of molybdenite faces; (b) SEM images and EDS analysis of molybdenite edges.
Figure 6.
SEM images and EDS analysis of molybdenite faces and edges after treated with 20 mg/LDO in the presence of 800 mg/L Ca2+ at pH 7: (a) SEM images and EDS analysis of molybdenite faces; (b) SEM images and EDS analysis of molybdenite edges.

Figure 7.
PAHs adsorption on molybdenite as a function of Ca2+ concentration at pH 7.

Figure 8.
PAHs adsorption on molybdenite as a function of pH in the presence of 800 mg/L Ca2+.

Figure 9.
The distribution of calcium species as a function of pH at 800 mg/L total calcium.

Figure 10.
The zeta potential of molybdenite in the absence and presence of XLM and diesel oil as a function of Ca2+ concentration at pH 7.
Figure 10.
The zeta potential of molybdenite in the absence and presence of XLM and diesel oil as a function of Ca2+ concentration at pH 7.


Table 1.
The anisotropic property of crystalline molybdenite [3].
Table 1.
The anisotropic property of crystalline molybdenite [3].
| Property | Basal Plane [0001] | Edge [0100] |
|---|---|---|
| Cleavage | Perfect | None |
| Hardness | 32 Kg/mm2 | 900 Kg/mm2 |
| Surface energy | 24 erg/cm2 | 700 erg/cm2 |
| Contact angle | 80° | 35° |
© 2017 by the authors. Licensee MDPI, Basel, Switzerland. This article is an open access article distributed under the terms and conditions of the Creative Commons Attribution (CC BY) license (http://creativecommons.org/licenses/by/4.0/).
Share and Cite
MDPI and ACS Style
Wan, H.; Yang, W.; He, T.; Yang, J.; Guo, L.; Peng, Y. The Influence of Ca2+ and pH on the Interaction between PAHs and Molybdenite Edges. Minerals 2017, 7, 104. https://doi.org/10.3390/min7060104
AMA Style
Wan H, Yang W, He T, Yang J, Guo L, Peng Y. The Influence of Ca2+ and pH on the Interaction between PAHs and Molybdenite Edges. Minerals. 2017; 7(6):104. https://doi.org/10.3390/min7060104
Chicago/Turabian StyleWan, He, Wei Yang, Tingshu He, Jianbo Yang, Lin Guo, and Yongjun Peng. 2017. "The Influence of Ca2+ and pH on the Interaction between PAHs and Molybdenite Edges" Minerals 7, no. 6: 104. https://doi.org/10.3390/min7060104
Note that from the first issue of 2016, this journal uses article numbers instead of page numbers. See further details here.