Article

The Effect of Pre-Oxidation on the Reducibility of Chromite Using Hydrogen: A Preliminary Study

1
Chemical Resource Beneficiation (CRB), Faculty of Natural and Agricultural Sciences, Potchefstroom Campus, North-West University, Private Bag X6001, Potchefstroom 2520, South Africa
2
Department of Material Science and Engineering, Norwegian University of Science and Technology (NTNU), Alfred Getz vei 2, 7034 Trondheim, Norway
3
Sintef Industry, 7465 Trondheim, Norway
4
Hydrogen South Africa (HySA) Infrastructure, Faculty of Engineering, Potchefstroom Campus, North-West University, Private Bag X6001, Potchefstroom 2520, South Africa
*
Author to whom correspondence should be addressed.
Minerals 2022, 12(7), 911; https://doi.org/10.3390/min12070911
Submission received: 27 May 2022 / Revised: 7 July 2022 / Accepted: 13 July 2022 / Published: 20 July 2022

Abstract

:
The majority of ferrochrome (FeCr) is produced through the carbothermic reduction of chromite ore. In recent years, FeCr producers have been pressured to curve carbon emissions, necessitating the exploration of alternative smelting methods. The use of hydrogen as a chromite reductant only yields water as a by-product, preventing the formation of carbon monoxide (CO)-rich off-gas. It is however understood that only the Fe-oxide constituency of chromite can be metalized by hydrogen, whereas the chromium (Cr)-oxide constituency requires significantly higher temperatures to be metalized. Considering the alternation of chromite’s spinel structure when oxidized before traditional smelting procedures, the effects on its reducibility using hydrogen were investigated. Firstly, the effect of hydrogen availability was considered and shown to have a significant effect on Fe metallization. Subsequently, spinel alternation induced by pre-oxidation promoted the hydrogen-based reducibly of the Fe-oxide constituency, and up to 88.4% of the Fe-oxide constituency was metallized. The Cr-oxide constituency showed little to no reduction. The increase in Fe-oxide reducibility was ascribed to the formation of an exsolved Fe2O3-enriched sesquioxide phase, which was more susceptible to reduction when compared to Fe-oxides present in the chromite spinel. The extent of Fe metallization of the pre-oxidized chromite was comparable to that of unoxidized chromite under significantly milder reduction conditions.

1. Introduction

Chromite ore, unit formula of (Mg, Fe2+)(Al, Cr, Fe3+)2O4, is the only commercially exploited source of new chromium (Cr) units [1,2,3]. Approximately 90 to 95% of chromite ore is utilized to produce several grades of ferrochrome (FeCr) [3,4,5]. FeCr, a crude alloy between Cr and iron (Fe), is produced through the energy-intensive carbothermic smelting of chromite ore [4,5]. Temperatures of 1600–1700 °C within the smelting zone are require to allow metallization and separation of the metal and slag phases [6]. Semi-closed and closed submerged arc furnaces (SAFs) are mainly used during the production of FeCr in South Africa. Direct current (DC) arc furnaces are also used but to a lesser extent [3]. For During smelting, the specific energy consumption of a furnace is affected by a variety of factors, e.g., feed material pre-screening, if a fraction of the Cr- and Fe-oxide content has been pre-reduced, and if the chromite charge is pre-heated. For instance, the energy consumption of a semi-closed SAF operating on unscreened feed materials can be as high as 4500 kWh/t FeCr produced, whereas a closed SAF operating on hot-fed pre-reduced chromite can be as low as 2000 kWh/t of FeCr. The pre-reduction of chromite ore before smelting is an effective technique to lower the energy consumption during chromite smelting, but requires a higher capital investment/operational costs [7].
Carbon-based reductants (e.g., coke, coal, or charcoal) are currently used as reductants during chromite smelting, depending on availability and furnace type [4,8]. For instance, coke is no longer a cost-effective reductant in South Africa as it has become expensive and difficult to source [9]. Due to increases in the cost of reductants and scarcity of high-carbon-content reductants, the incorporation of hydrogen as a reductant is becoming more and more attractive. This is especially true for developed countries, where renewable energy is relatively available. For instance, Norway has an abundance of renewable hydro-energy (which accounts for approximately 94% of its energy production) [10], which is not perplexed by supply–demand intermittence associated with solar and wind energy. Therefore, hydrogen can be produced on site from water, and consumed where needed. In this case, hydrogen does not necessarily need to be stored in large quantities and/or for extended periods. A cost–benefit study has yet to be conducted on the economic implications of partial replacement of C-reductants with hydrogen. From an environmental perspective, however, the use of hydrogen is preferred.
Nevertheless, the carbothermic smelting of chromite produces a significant amount of carbon monoxide (CO) in the off-gas. The CO-rich off-gas is flared on the top of furnace stacks to oxidize CO to carbon dioxide (CO2) before being released into the atmosphere [11,12]. The significant quantities of released CO2 is of an environmental concern. In closed SAFs, the volume of off-gas ranges from 2500 to 4000 Nm3/h per MW consumed or from 10,000 to 15,000 Nm3/ton of alloy. The off-gas volume originating from semi-closed SAFs is significantly higher due to air dilution and ranges between 4000 to 13,000 Nm3/h per MW consumed or 15,000 to 55,000 Nm3/ton of alloy [13].
Hydrocarbons, e.g., methane (CH4), and reformed natural gas (CO and H2), have been proven as alternative reductants for the production of FeCr via a solid–gas process [14,15]. In addition, the use of CaCl2 and Na3AlF6 have also been demonstrated as reductants and/or reduction-enhancing additives during chromite smelting [16,17]. The use of hydrogen was nevertheless considered here as a reductant to curve C-consumption and to avoid the use of Cl2- and F-containing compounds. Theoretically, the complete reduction of pure chromite (FeCr2O4) with hydrogen is shown in Reaction (1) [18]:
FeCr2O4 + 4H2(g) → Fe +2Cr + 4H2O(g) → K (1700 °C) = 2.74 × 10⁻⁷
Reaction (1) shows that only water is yielded as a by-product when hydrogen is used as a reductant. Though Reaction (1) is used for pure chromite, the reduction of naturally occurring chromite ore will proceed differently due to its isomorphic nature [19]. It is further noted that, thermodynamically, Cr-oxide would require extremely high temperatures to be metallized by hydrogen [20]. Considering that Reaction (1) includes both the metallization of Fe- and Cr-oxides, the equilibrium constant (K) at 1700 °C for Reaction (1) is very small and only approaches 0 at temperatures more than 3800 °C. The metallization of Fe- and Cr-oxides will not metallize simultaneously, and it is understood that Fe-oxides are less resistive to reduction when compared to Cr-oxide. Reaction (2) presents the metallization of the Fe-oxide fraction of chromite using hydrogen.
FeCr2O4 + H2(g) = Fe + Cr2O3 + H2O(g) → K (1700 °C) = 2.12 × 10⁻¹
Reaction (2) shows the reaction if only the Fe-oxide constituency of chromite is metallized. This K value is significantly larger than that of Reaction (1), which suggests that Reaction (2) is thermodynamically more favorable than Reaction (1). It is therefore evident that Fe- and Cr-oxide changes during processing may be considered separately on a thermodynamic level.
Davies et al. (2022) performed a fundamental investigation to show the behavior of chromite when exposed to hydrogen at elevated temperatures. These temperatures were however significantly lower than the temperatures in the smelting zone of a SAF. The authors showed that the Fe-oxide constituency of chromite could be selectively reduced to metallic Fe using hydrogen under relatively mild thermal conditions [20]. Up to 84% of the total Fe content was metalized (and subsequently removed via hot acid leaching) from the chromite spinel, while Cr metallization was insignificant. Fundamentally, it is possible to reduce chromite’s entire Fe constituency using hydrogen under certain conditions. However, the Fe reduction process should be considered from an economical perspective too. For instance, employing unrealistic reduction conditions (e.g., extreme reduction temperatures, prolonged reduction periods, and excessive hydrogen utilization) will likely not be a feasible option for the FeCr industry.
In this study, it was considered to include a pre-oxidation step before reduction using hydrogen. It is relatively well understood that the phase decomposition reaction in spinels proceeds via various mechanisms and can be defined by Reaction (3) [21].
(A)[B]2O4 = (AO) + [B2O3]
The decomposition products of pure chromite, FeCr2O4, at elevated temperatures are FeO, i.e., (AO), and Cr2O3, i.e., [B2O3]. However, considering that chromite is a solid solution of pure spinel end members, the decomposition products are not only affected by the mineral composition, but also by the oxygen partial pressure. Exposure to air at high temperatures in an excess of oxygen will oxidize the Fe2+ to Fe3+, resulting in a Fe2O3 phase [21].
Kapure et al. (2010) showed that the pre-oxidation of chromite increases the extent of Fe and Cr metallization during direct reduction using coal. The authors showed that Fe2+ present in the chromite spinel oxidized to Fe3+ during pre-oxidation, which then forms an exsolved sesquioxide Fe2O3 phase. In addition, the migration (and oxidation) of Fe2+ from tetrahedral to octahedral sites results in the formation of cation vacancies in the spinel structure. Both the Fe2O3 phase and cation vacancy formation promote the reducibility of the chromite ore while contributing to the formation of the slag phase during reduction [22]. Zhao and Hayes (2010) reported similar observations when pre-oxidized chromite pellets before employing solid-state reduction using CO. During the pre-oxidation process at 1000–1200 °C, Fe2+ was oxidized to Fe3+, which promoted the extent of subsequent Fe metallization [23]. Borra et al. (2010) made a similar observation [24].
Kleynhans et al. (2016) showed that the pre-oxidation of chromite significantly improved the extent of pre-reduction of chromite during the pre-reduction of pelletized chromite. The optimal pre-oxidation temperature (defined as the temperature at which maximum sesquioxide Fe2O3 formation and minimal eskolaite-type phase formation occurred) was determined to be 1000 °C. It was also shown that pre-oxidizing the chromite ore can lower the specific electricity consumption (SEC) of a SAF from 2.4 to 2.2 MWh/t. Additionally, the carbonaceous reductant required during smelting was reduced from 99.5 to 85.5 kg/t pellets [25].
Biswas et al. (2018) investigated pre-oxidized Indian chromite and found that the Fe2O3-enriched sesquioxide phase formation was controlled by the oxidation of Fe2+ to Fe3+ and that longer oxidation times (up to 120 min) and higher temperatures (up to 1000 °C) expedited Fe2+ oxidation [26]. Tathavakar et al. (2015) indicated that South African chromite decomposes into two phases, i.e., (Mg1−x,Fex)(Cr1−y,Aly)2O4 and (Fe1−a,Mga)(Cr1−b,Alb)2O4 [21]. Du Preez et al. (2019) confirmed the presence of the two phases, as well as the presence of free Fe2O3, in pre-oxidized chromite fines obtained from a large FeCr producer [27].
It is therefore relatively well understood that the reducibility of the Fe constituency of chromite by a C-based reductant can be expedited by chromite’s pre-oxidation. However, as far as the authors could assess, the use of hydrogen as a reductant of pre-oxidized chromite has yet to be reported in the peer-reviewed public domain. Therefore, the primary objective was to investigate the effects of pre-oxidation on the reducibility of chromite using hydrogen as a reductant. The secondary objectives were to determine the mildest reaction conditions required for optimal metallization.

2. Materials and Methods

2.1. Materials

A metallurgical-grade chromite ore sample was obtained from a large South Africa FeCr producer and was used as the case study ore. It is worth noting that China is classified as the largest stainless steel producer in the world, responsible for 54% of the world’s stainless steel supply in 2017. Chromite ore is essential for stainless steel production and the majority of chromite consumed by China’s stainless steel industry originated from South Africa (approximately 72% in 2017) [28]. Considering this, the results presented in this study are of international relevance.
A homogeneous and representative sample collection campaign was undertaken at a large South African FeCr smelter and sample collection for experimental work was applied here, as described by Du Preez et al. (2019) [27]. Previously, a detailed characterization of this case study ore was presented by Glastonbury et al. (2015) in a non-related study. Therefore, full characterization is not repeated here [29]. Of interest here is the Cr2O3 content of 44.2 wt% and the FeO (total Fe expressed as FeO) of 24.7 wt%. These values equate to an approximate Cr/Fe ratio of 1.58. This ratio was calculated from the Cr2O3 and total Fe contents, which were determined using inductively coupled plasma optical emission spectrometry (ICP-OES).
X-ray diffraction (XRD) of the respective ore revealed that the ore mainly comprised chromite (93.4 wt%) and siliceous gangue (i.e., 6.6 wt% enstatite). It is further worth noting that South African chromite has a relatively low Cr content of approximately 0.59–0.62 mol Cr in the octahedral sites, whereas chromite ores from Brazil, Turkey, and Kazakhstan contain 0.70–0.77 mol Cr. Due to the relatively low Cr content of South African ores, the remainder of octahedral sites is occupied by Al3+, which stabilized the spinel against reduction. In addition to this, Fe3+, which also occupies the octahedral sites of chromite, is relatively low at approximately 0.06 mol [30]. Similar to Al3+, Mg2+ occupying tetrahedral sites stabilized chromite against reduction [19]. Canaguier showed that Mg-containing chromite ((Fe, Mg)Cr2O4) was more resistant to reduction when compared to an Al-containing chromite (Fe(Cr,Al)2O4) [15].
Hydrogen, the reductant considered in this study, is currently mainly produced from non-renewable sources, e.g., coal, oil, and natural gas, while water electrolysis accounts for approximately 4% of the globally produced hydrogen [31]. Nevertheless, numerous processes can be employed for generating hydrogen, e.g., thermochemical [32,33], photocatalytic [34,35], photochemical [36,37], photo-electrochemical [38,39], metal and metal hydride hydrolysis [40,41,42,43,44,45,46,47,48], electrochemical [49,50,51,52,53,54], and ammonia and formic acid decomposition [55,56,57] processes, as well as various biological processes [58,59,60]. In this investigation, the hydrogen reductant was generated on-site at Hydrogen South Africa (HySA) Infrastructure, Potchefstroom, South Africa, through proton exchange membrane water electrolysis (PEMWE). A PEMWE stack was powered by photovoltaic energy and the produced hydrogen was stored as a pressurized gas. Therefore, the employed hydrogen is considered green hydrogen as it is generated from renewable energy and a renewable source. The generated hydrogen purity was >99.9%. The nitrogen (99% purity) used in this study was supplied by Afrox, South Africa. The chemicals Na2O2 (97%), Na2CO3 (99.5%), and HNO3 (>99.999%) were obtained from Sigma-Aldrich, Johannesburg, South-Africa.

2.2. Sizing of Chromite

As-received chromite ore was size-partitioned after being screened into the following size fractions, i.e., <106, 106 to 212, 212 to 425, and 425 to 850 µm. Chromite screening was performed using a Haver EML Digital Plus sieve shaker (Haver and Boecker, Oelde, Germany) and stainless steel Haver and Boecker sieves.
Particle size distribution of the screened chromite fractions was determined by laser diffraction particle sizing using a Malvern Mastersizer 3000 (ATA Scientific, Sydney, Australia). Samples were ultra-sonicated before measurements were taken and continuously agitated by mechanical stirring at 2400 rpm during analyses. Laser obscuration was maintained between 10 and 20%. Table 1 exhibits the d90, d50, and d10 values of as-received and size-fractioned chromite.

2.3. Reduction Procedure

A Carbolite CTF 12 vertical tube furnace (Carbolite Gero, Derbyshire, UK) with a maximum maintainable temperature of 1100 °C was used for all reduction procedures. This reduction temperature was selected as higher reduction temperatures could not be achieved using this furnace. It was however shown by Davies et al. (2022) that up to 84% Fe metallization was achieved at similar reduction temperatures [20]. A stable heating zone was created within the tube by placing ceramic heat shields at each end of the tube. Both tube ends were sealed with stainless steel caps which acted as a gas inlet and outlet. The thermocouple used to measure temperature was placed at the center of the heating zone, directly adjacent to the tube. The furnace was heated by a series of electrodes which were located alongside the tube.
Reduction was performed by placing 5 or 30 g of size-fractioned metallurgical-grade chromite ore (d90 of 133 to 778 µm) in a ceramic (99.8% Al2O3) boat crucible in the center of the furnace hot zone. The samples were then heated from room temperature to the maximum maintainable temperature of 1100 °C. The samples were heated at a rate of 5 °C/min which was the maximum allowable heating rate for the specifically fitted tube. After the maximum maintainable temperature was achieved, the temperature was kept constant for a duration of 60 to 180 min. The tube was continuously purged with N2 at a flow rate of 150 mL/min. It was necessary to avoid the presence of oxygen within the furnace considering that hydrogen has a self-ignition temperature of approximately 572–585 °C and a flammability range of 4–75 vol% in the air at standard atmospheric conditions [27,61,62,63]. Nevertheless, a 150 or 750 mL/min hydrogen flow, together with the N2 flow, was introduced at 600 °C to obtain an approximate 50 and 83 vol% hydrogen atmosphere, respectively, within the furnace tube. This atmosphere was maintained until 1100 °C was reached and maintained for up to 180 min. Thereafter, the hydrogen flow ceased, and the reduced samples were kept in the tube to cool to room temperature in a N2 atmosphere.

2.4. Pre-Oxidation Procedure

During the industrial preparation of oxidative sintered chromite pellets, referred to as steel belt sintering (developed by Outokumpu, process also referred to as Outotec process), pellets are typically heated to a temperature of 1400–1500 °C before the air is pulled through the pellet bed. By doing so, the carbon content present in the pellets, typically between 1–2 wt% reductant (typically coke), is ignited to allow silicates present in the pellets, i.e., typically refined bentonite or attapulgite clays, to melt. By doing so, chromite particles are bound together by these molten silicates [4,7]. This process affords pellets with the mechanical properties necessary for the ferrochrome smelting procedure, and the process is not implemented to maximized the pre-oxidation of chromite. Zhao and Hayes (2010) showed that the center of industrially produced pellets were un-oxidized, whereas chromite at the pellet boundary was oxidized [23]. Du Preez et al. (2019) heated pellets at a rapid rate from 900 to 1200 °C; the produced pellets had a matching oxidation pattern when compared to the oxidation pattern presented by Zhao and Hayes (2010) and Lughi et al. (2020) [23,27,64]. Therefore, it is accepted that the oxidative sintering process used by industry is not dedicated to chromite’s oxidation, and is rather employed to produce mechanically strong pellets.
In order to prepare chromite that can be used for mono-variance investigation, pre-oxidized chromite is generated with a representative extent of pre-oxidation. Heat transfer within laboratory scale furnaces is significantly better than industrial-scale furnaces, ensuring that pre-oxidized samples can be representative (i.e., all particles present in the samples are oxidized equally). Nevertheless, the oxidation mechanism pellets prepared by oxidative sintering, and the samples prepared in this study, are accepted to follow a similar mechanism, i.e., chromite spinel alteration as a result of heat treatment in an oxygen-containing atmosphere. The only difference was that chromite oxidized here was equally oxidized.
Kleynhans et al. (2016) showed that chromite pre-oxidized at >1000 °C started to be more resistive to pre-reduction. However, in the case of Kleynhans et al. (2016), pre-reduction was determined by considering the amount of metallized Cr and Fe. The authors reported that extensive pre-oxidation resulted in the formation of a Cr-oxide phase, which was more resistive to carbothermic reduction when compared to raw chromite [25]. An oxidation temperature of 1100 °C was therefore considered for evaluation, as this was the border temperature where Cr-oxide may be stabilized against carbothermic reduction. Nevertheless, it has been shown that Cr-oxide metallization using hydrogen is thermodynamically limiting and kinetically challenging [20]. Therefore, the 1100 °C pre-oxidation temperature was mainly selected to ensure optimal Fe-oxidation.
The chromite ore was oxidized in an Elite BRF15/5 chamber furnace (UK) equipped with a programmable temperature controller. A ceramic (99.8% Al2O3) square crucible containing 20 g of the specific size-fractioned metallurgical-grade chromite ore (d90 of 133 to 778 µm) was placed in the center of the furnace chamber. During oxidation, the sample was heated in the ambient atmosphere at a ramp rate of 5 °C/min. Each particle size fraction was heated from room temperature to 1100 °C. Oxidation times of 60, 120, and 240 min were considered here. Thereafter, the furnace was switched off and the sample was kept in the furnace and allowed to cool to room temperature.

2.5. Analytical Techniques

Scanning electron microscopy (SEM) equipped with an energy-dispersive X-ray spectrometer (EDX) was employed to determine the surface and subsurface characterization of unreduced, reduced, and pre-oxidized/reduced chromite particles in backscattered and secondary electron mode. An FEI Quanta 250 FEG SEM (Thermo Fisher Scientific, Waltham, MA, USA), incorporating an Oxford X-map EDX system operating at 15 kV and a working distance of 10 mm, was used. For subsurface analysis, treated chromite particles were mounted in resin, cross-sectioned, and polished using an SS20 Spectrum System Grinder polisher before being placed on Al stubs using carbon adhesive tape. All samples considered for SEM analysis were covered with an Emscope TB 500 carbon coater (Hertfordshire, UK).
XRD was employed to determine the crystalline phase analysis of bulk samples. A Rigaku D/MAX 2500 (Japan) rotating anode powder diffractometer with Cu Kα radiation (λKα1 1 = 1.5406 Å) at 40 kV was used. Furthermore, a current of 40 mA, a step scan of 0.034°, and a scan rate at 0.5 sec/step from 0.5 to 130° were used for the analysis. Phase identification was achieved using JADE v.3.9 with the ICDD and ICSD diffraction databases.
The extent of Fe metallization was determined after the reduction of chromite by solubilizing Fe through hot acid leaching. The treated chromite was leached using a 50 vol% H2SO4 (98%) solution at 90 °C for 60 min. Thereafter, the solubilized Fe contents were determined using ICP-OES. ICP-OES was performed using an Agilent 5110 ICP-OES Instrument (USA) coupled with a VistaChip II CCD detector. Ultraspec aqueous-certified single-element reference standards (Fe, Cr) obtained from De Bruyn Spectroscopic Solutions (South Africa) were employed to calibrate the instrument.
During size fractioning, gangue mineral (i.e., non-chromite, siliceous particles) particles could collect within a specific size range, and the total Cr and Fe contents of the respective size fraction were determined. Subsequently, the extent of Cr and Fe metallization was calculated as a function of the total Fe contents present in each size fraction. A Siebtechnik pulverizer was used to mill each size fraction. All parts of the pulverizer in contact with the chromite during milling were made of SiC to prevent Fe contamination during the milling procedure. Each sample was milled for 30 s to obtain a particle size distribution, of which 90% of the particles were below 75 µm. The total Cr and Fe contents were determined for each size fraction by high-temperature alkaline fusion using Na2O2 and Na2CO3. Alkaline fusion was performed on all size fractions by reacting 0.2 g of the milled chromite with 2 g of Na2O2 and 0.5 g of Na2CO3, respectively, in a zirconium crucible. The fused material was subsequently solubilized using a 20% mixture of 1:1 water:HNO3. The total Cr and Fe contents were then determined by ICP-OES.

2.6. Expressing the Extent of Metallization

Barnes et al. (1983) showed that the total % metallization (i.e., % M) can be determined using the following equation [8]:
%   M = Cr 0 +   Fe 0 Cr tot   +   Fe tot × 100
Here, Cr0 and Fe0 are the total amounts of metalized Cr and Fe, and Crtot and Fetot are the total Cr and Fe contents of the original chromite. In addition, Barnes et al. (1983) stated that the correlation between chromite’s metallization and reduction is non-linear due to the simultaneity of chromite’s metallization and reduction (e.g., Fe3+ → Fe2+ and Cr3+ → Cr0) [8].
Nevertheless, 100% reduction corresponds to 100% metallization, justifying a close similarity between the complete removal of oxygen and complete metallization [8]. The elements provided by Barnes et al. (1983) contributed to the knowledge obtained by Algie and Finn (1984) which proposed three stages of chromite reduction. Firstly, the Fe3+ is reduced to Fe2+ followed by its metallization. Then, after approximately 50% of the Fe2+ is metalized, metallization of Cr3+ is initiated. Finally, after the entire Fe-oxide content is reduced, about 60% of the Cr reduction is obtained [65,66].
The latter is only true for carbonaceous reduction of chromite and is attentively known and expressed in detail. In this investigation, focus was placed on the Fe and Cr metallization %, individually expressed through the following equation:
%   Fe   or   Cr   metallization = Solubilized   Fe   or   Cr Total   Fe   or   Cr   content × 100
where the metalized Fe and Cr fraction of the treated chromite (as determined by ICP-OES analysis) is expressed as the solubilized Fe and Cr value, which is divided by the total amount of Fe and Cr present in the untreated chromite ore. During size fractioning, it is likely that certain gangue material can accumulate in a certain size reaction, or that the distribution of such gangue materials will not be uniform over the size fractions considered here. Therefore, the total amount of Fe and Cr (presented in grams, determined by ICP-OES) present in 1 g of as-received and size-fractioned chromite ore is given in Table 2. All of the Fe and Cr metallization percentages presented in this study were determined using the values presented in Table 2.

3. Results and Discussion

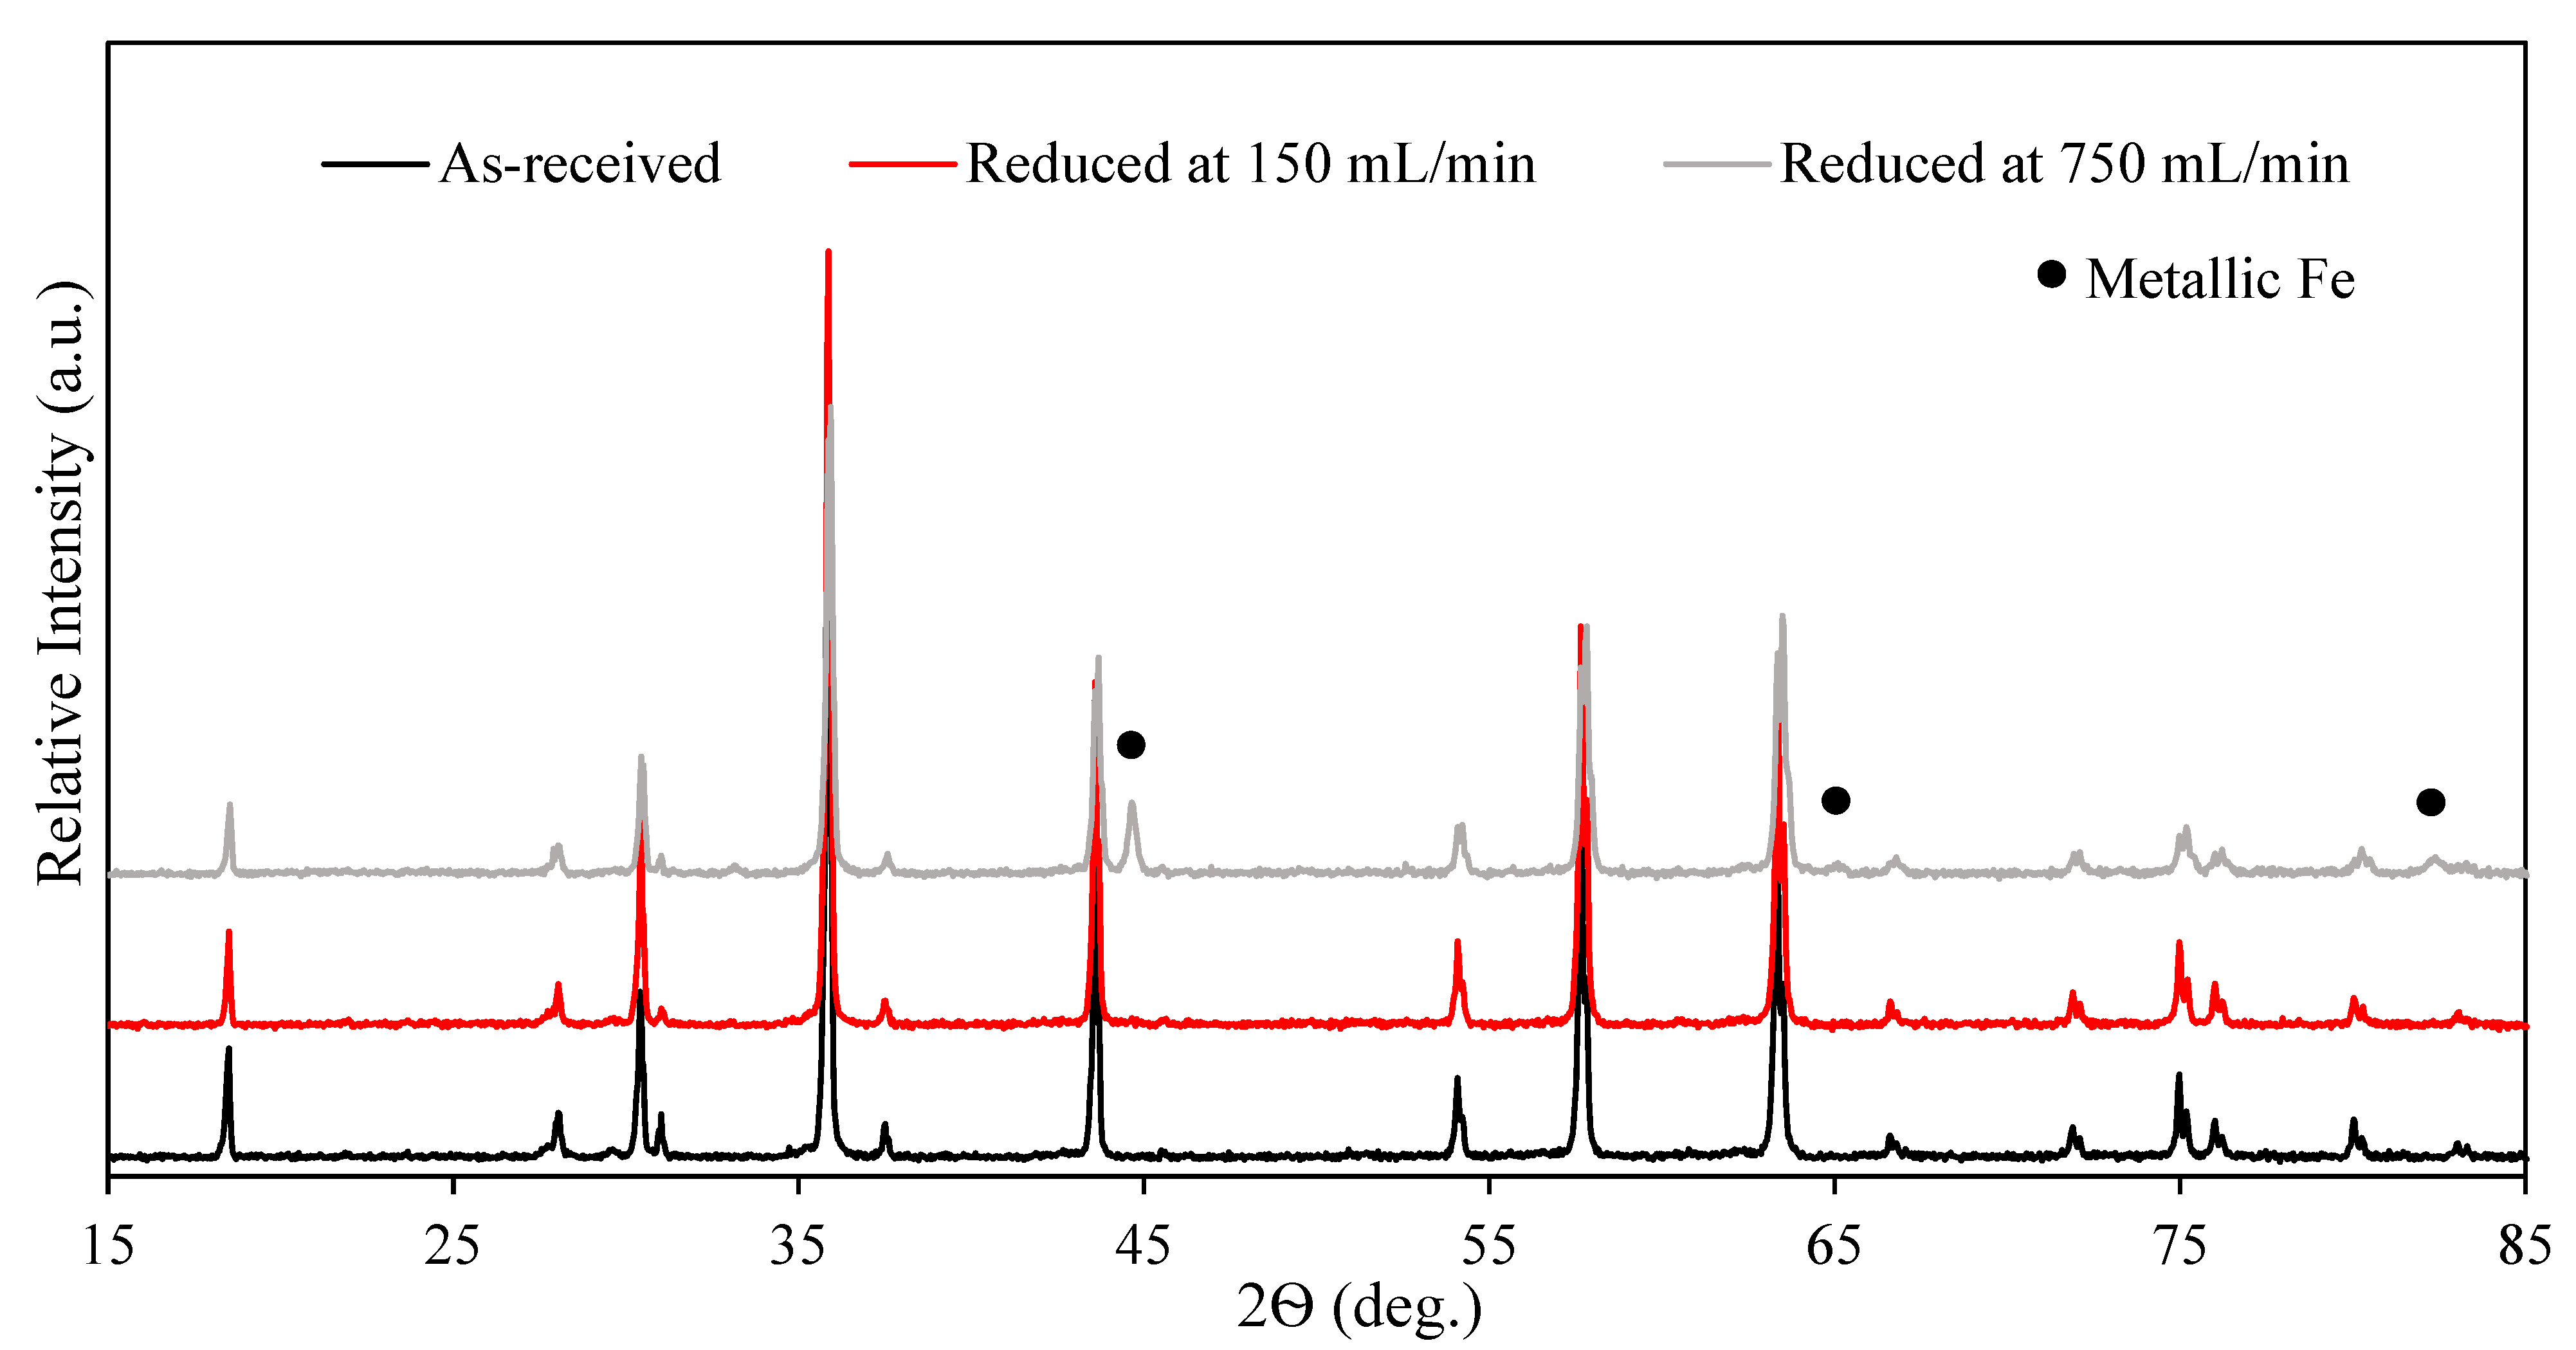
3.1. The Effect of Hydrogen Availability

To minimize the hydrogen consumption, the effect of the ratio between hydrogen (given as mL/min) and the sample size (measured in g) on metallization was considered. A hydrogen flow rate of 150 mL/min was maintained and the chromite ore sample sizes of 5 and 30 g were considered. The reduction process was performed at 1100 °C for 180 min and the results are presented in Figure 1.
Figure 1 shows that for both the 5 and 30 g samples, the Fe and Cr metallization % increased with a decrease in particle size. This observation is ascribed to the increase in the sample surface area, as the particle size decreased for a fixed amount of particulate matter. In addition, smaller particles can provide a shorter diffusion path for Fe migration from the center to the rim of the particle [66]. The unit cell parameter of chromite is 8.38 Å [67], making it possible for hydrogen (kinetic diameter of 2.89 Å) to penetrate the chromite spinel with a relative degree of ease [68]. It was however evident that the increase in particle size had an adverse effect on the reduction process.
Figure 1 further shows that the Cr metallization % was nearly unaffected by hydrogen and that the highest Cr metallization % (<0.07%) is significantly lower than the highest Fe metallization % (9.03%). Thus, considering the near-zero Cr metallization %, only the Fe-oxide constituency of chromite was reduced under the investigated conditions. This observation may be ascribed to the ionic diffusion mechanism proposed by Soykan et al. (1991), which suggested that Cr metallization only proceeds after the majority of Fe has metalized; this mechanism was however compiled for the carbothermic reduction of chromite [69]. The same is likely true for the reduction of chromite using hydrogen, even though the extent of Cr metallization will be significantly less when compared to C-based reduction.
Nevertheless, the Fe metallization % did not exceed 9.0 and 2.5% for the 5 and 30 g samples, respectively. The observed increase is ascribed to the availability of hydrogen for reduction given the hydrogen-to-chromite ratio (defined as the hydrogen flow rate per gram of chromite). Here, the use of this mass unit was considered due to the dissimilarities in the Fe and Cr content per size fraction of chromite. The effect of flow rate is conceptualized in the following text.
According to Boericke et al. (1945), the reduction of chromite using hydrogen proceeds slowly, even at >1300 °C. At temperatures <1300 °C, equilibrium could not be established with certainty. At low hydrogen flow, the measured water content was above the equilibrium value, possibly caused by the accumulation of water in colder locations in the reaction tube, causing the reduction reaction to slow down. Furthermore, at an elevated hydrogen flow, the water content was below the equilibrium value due to the low reaction rate [70].
A study by Chakraborty et al. (2010) showed that an increase in the flow rate of argon led to an increase in the carbonaceous reduction rate of chromite. The higher argon flow rate displaced evolved CO2 (the gaseous reaction product) from their immediate reaction sites. By doing so, the carbonaceous reductant could freely react with the surface of chromite particles. Hence, an increase in the hydrogen flow rate could displace water vapor from the immediate hydrogen–chromite reaction site, accelerating the reduction reaction [71]. In addition, Chu and Rahmel (1979) stated that Cr2O3 could only be reduced by dry hydrogen (above 1026 °C) in an oxygen-free atmosphere, assuming the continuous removal of in situ-generated water vapor from the reaction site [72].
The hydrogen flow rate was therefore increased from 150 to 750 mL/min to investigate the effect thereof on Fe and Cr metallization (Figure 2). The 150 mL/min results for the 5 g chromite ore batch (shown in Figure 1) were included in Figure 2 as a reference.
Figure 2 shows that the Fe and Cr metallization of samples reduced at 150 mL/min did not exceed 1.8 and 0.016%, respectively. The Fe and Cr metallization of samples reduced at 750 mL/min increased from 24.3 to 49.3% and 0.067 to 0.18%, respectively, for samples with decreasing d90 values of 778 to 133 µm.
It can further be seen from Figure 2 that the extent of Fe and Cr metallization increased with a decrease in particle size. The smallest size fraction (d90 of 133 µm) reduced at an elevated hydrogen flow rate of 750 mL/min obtained the highest Fe and Cr metallization % of 49.3 and 0.18%, respectively. The lowest Fe and Cr metallization % was determined at the largest size fraction (d90 of 778 µm), i.e., 24.3 and 0.067%, respectively. The effect of the hydrogen flow rate on the reduction of chromite, specifically the Fe-oxide constituency, coincided with observations made by Boericke et al. (1945), Chu and Rahmel (1979), and Chakraborty et al. (2010) [70,71,72].
XRD analysis was employed to characterize the mineralogical constituency of the samples reduced at 150 and 750 mL/min. Samples were reduced at 1100 °C for 60 min (Figure 3). The XRD pattern of as-received chromite was included in Figure 3 as a reference.
Figure 3 shows that the chromite reduced at 150 mL/min did not contain any prominent Fe peaks, which was anticipated considering the <1.9% Fe metallization (Figure 2). By increasing the flow rate from 150 to 750 mL/min, some Fe peaks were observed. Of particular interest was the absence of any other phases other than chromite and Fe. Similar results were obtained in a study conducted by Park et al. (2001). Only an Fe and Fe3C peak was detected by XRD of the sample subjected to reduction using a gas mixture of 10 vol% Ar, 55 vol% H2, and 35 vol% CH4 at 925 °C for 60 min. The presence of Fe3C was due to the presence of CH4 in the gas mixture, while only Fe and water vapor formed during reduction in the presence of pure hydrogen [73].
To further characterize the samples, SEM (Figure 4) and EDX analysis of the samples reduced at 150 and 750 mL/min provided a visual explanation of why the Fe metallization % increased with an increase in the hydrogen flow rate.
Compared to as-received chromite shown in Figure 4a, a remarkable change in the morphology of the chromite particles reduced at 150 (Figure 4b) and 750 mL/min (Figure 4c) hydrogen flow rates was observed. Furthermore, Figure 4b shows the presence of distinctive small globules on the surface of the chromite particle treated at 150 mL/min. Figure 4c shows that by increasing the flow rate from 150 to 750 mL/min, the globule count and intensity were expedited to the point where it forms a near-continuous layer.
To further characterize the surface of the hydrogen-treated chromite particles, the surface presented in Figure 4b was magnified and characterized by SEM-EDX. Hereafter, the particles were subjected to the acid leaching procedure and re-characterized. Figure 5 presents an enlarged view of the globules presented in Figure 4b before and after acid-leaching together with the points of interest considered for SEM-EDX analysis.
EDX analyses of the points of interest (marked Spectrum 1–3 in Figure 5a) revealed a Cr and Fe wt% of 6.06 and 74.16, respectively. The relatively low Fe content can however be ascribed to the likely detection of nearby bulk sample material. Nevertheless, the globule formation is ascribed to the migration of Fe ions from the chromite spinel to the particle surface, where it is present in its metallic form. Figure 5b presents a similar surface as shown in Figure 5a after employing the hot acid leaching procedure. It is evident that the globules were solubilized by acid leaching, and that only a structured surface remained. The reasoning for the specific structure is unclear and future research is required.
To better understand the effect of elevated hydrogen flow on the migration of Fe ions in the chromite spinel, particles reduced at 150 and 750 mL/min were cross-sectioned and investigated by SEM (Figure 6) and SEM-EDX (Table 3).
Table 3 shows that the average Cr/Fe ratio of Spectra 1–3 prepared from the indicated areas shown in Figure 6a is approximately 1.71, which corresponded with a Cr/Fe ratio of 1.77 reported in a study by Davies et al. (2022) which utilized the same ore [20]. Therefore, Spectra 1–3 represent chromite where no change in Fe is observed.
Unlike the chromite particle shown in Figure 6a, three distinctive layers formed within the chromite particle when reduced at 750 mL/min, as shown in Figure 6b. These layers were designated as the center (Area 1), transition phase (Area 2), and rim (Area 3).
Spectra 4–6 are located in Area 1 and have a low Cr/ Fe ratio of between 0.06–0.17. The low Cr/Fe ratio of Area 1 shows that the rim of the particle is enriched in Fe. More so, considering the relatively low O content, the Fe likely occurred in a metallic state. Spectra 7 and 8 were prepared from Area 2 and have an average Cr/Fe ratio of 3.93, which is significantly higher than the ratio of Area 1. The higher Cr/Fe ratio of Area 2 is indicative of the absence of Fe. Spectrum 9 is located in Area 3 and has a similar Cr/Fe ratio to Spectra 1–3. Therefore, Area 1 is representative of chromite which is not reduced by hydrogen.
Similar results were presented by Leikola et al. (2018) whereby chromite particles were reduced using 10:90 vol% CH4:H2 at 1100 °C for 20 min [74]. Furthermore, an investigation carried out by Davies et al. (2022) described the migration of Fe present in chromite particles after being reduced at 1100 °C for 30 min at a hydrogen flow rate of 1 L/min [20]. Davies et al. (2022) showed the formation of three distinctive layers similar to Figure 6b. Hence, no in-depth explanation regarding the Fe migration is given here. The migration of Fe is however summarized as Fe-oxides (presented as Fe2+ and Fe3+ occupying tetrahedral and octahedral sites, respectively) moving towards the particle grain where they occur as Fe0.
It is clear that the layer formation observed in Figure 6b is absent in Figure 6a, and the Cr/Fr ratio of approximately 1.71 indicates that the hydrogen flow rate of 150 mL/min did not reduce an appreciable amount of Fe-oxide. Hence, no metallic Fe layer was observed in Figure 6a. However, a metallic Fe layer was present on the surface of the chromite particle in Figure 6b because of surface and sub-surface Fe-oxide reduction and Fe migration.

3.2. Effect of Reduction Time

By increasing the hydrogen flow rate to 750 mL/min, an Fe metallization of 49.3% was achieved. However, the objective of the study was to achieve optimal Fe metallization. It was therefore considered to increase the reduction time, as metallization would likely increase if chromite particles were exposed to hydrogen for extended periods. To determine this, all size-fractioned chromite samples were reduced at 1100 °C for 60, 120, or 180 min (Figure 7).
According to Figure 7a,b a relatively insignificant change in the Fe and Cr metallization % was observed for the samples reduced for 60 and 120 min. However, samples reduced for 180 min showed a significant increase in metallization when compared to samples reduced for 120 min. The Fe and Cr metallization % for the smallest size fraction (d90 of 133 µm) increased from 39.0 to 92.1% and 0.1 to 2.0%, respectively, as the reduction time increased from 60 to 180 min. A similar trend was observed for all other size fractions (d90 of 160 to 778 µm). It is again worth noting the significant difference in the Fe and Cr metallization %.
It is also evident from Figure 7a,b that the increase in the Fe and Cr metallization % after 120 min was more significant for the size fractions with a d90 of 133 and 160 µm than for the size fractions with a d90 of 467 and 778 µm. As indicated earlier, the higher Fe and Cr metallization of smaller particles can be ascribed to the shorter diffusion path and larger surface area. This principle is made more evident as the effect of particle size is magnified here. To conclude, the reduction time has a significant effect on the Fe and Cr metallization after 120 min, while still not obtaining complete Fe metallization.

3.3. Effect of Pre-Oxidation

Relatively high Fe metallization was achieved in Section 3.2. It was however considered that 180 min of reduction would not be operationally or economically attractive on an industrial scale. Alternative means were therefore identified to promote Fe metallization and to minimize Cr metallization under milder conditions (i.e., shorter reduction periods) than the conditions considered thus far. Based on several studies [22,23,24,25,26,27], the pre-oxidation of chromite to promote the reducibility of Fe-oxides was considered. To exemplify the effect of pre-oxidation on Fe metallization, size-fractioned chromite (refer to d90 values, Table 1) was oxidized at 1100 °C for 60 min and reduced at 1100 °C for 60 min at a hydrogen flow rate of 750 mL/min. The Fe and Cr metallization percentages of pre-oxidized/reduced and reduced chromite particles are compared in Figure 8.
It can be seen from Figure 8 that the pre-oxidation of chromite was advantageous for the subsequent reduction reaction. For the size-fractioned chromite with a d90 of 133 µm, a relatively significant increase in the Fe metallization was observed, i.e., 49.3 and 77.5% for reduced and pre-oxidized/reduced chromite, respectively. The increase in Fe metallization ranged between 17.7 and 37.0%. The lowest increase was observed for the d90 of 778 µm, which is ascribed to the low surface area of the specific size fraction. The size fractions with a d90 of 467 and 260 µm showed an increase in Fe metallization of 35.8 and 37.0%, respectively. These increases exceeded that of the size fraction with a d90 of 133 µm, i.e., 49.3%. This observation is however ascribed to the fact that the Fe metallization of the unoxidized chromite with a d90 of 133 µm was already relatively high. It can therefore be concluded that the increase in Fe metallization of pre-oxidized chromite is optimized within the size range of 260–467 µm for experimental conditions considered in this study. All pre-oxidized/reduced size-fractioned chromite showed significant increases in Fe metallization. A similar trend was observed for Cr metallization, e.g., the percentage Cr metalized increased from 0.18 to 0.30% for the smallest size fraction (d90 of 133 µm). In addition, the 0.30% Cr metallization was the highest Cr metallization achieved.
The observed increase in Fe metallization may be ascribed to the transformation of the chromite spinel during pre-oxidation. The oxidizing atmosphere provides a natural driving force for an Fe2+ to Fe3+ phase change. It is relatively well understood that during the oxidation of chromite, an exsolved Fe2O3-rich sesquioxide phase forms in a Widmanstätten-like pattern. This Fe2O3 phase initially exists as a metastable γ-Fe2O3 (maghemite) exsolved precipitate and forms because of dislocations along the (111) chromite spinel plane. At temperatures greater than 600 °C and in the presence of oxygen, the γ-Fe2O3 phase changes to more stable hematite (Fe2O3) [21,22,24,27,29,75]. Additionally, cation vacancies form within the spinel during Fe3+-enriched phase formation [22,24]. Furthermore, the applied oxygen chemical potential also promotes the diffusion of Fe ions from the particle interior to the particle surface where the solid–gas interface is located. Ultimately, the formed Fe2O3 phase, together with the generated vacancies, improves the carbothermic reducibility of the chromite ore [22].
XRD was employed to characterize the mineralogical changes occurring during the pre-oxidation and/or reduction of chromite (Figure 9).
As can be seen from Figure 9, pre-oxidation resulted in the formation of an eskolaite-type phase. This observation coincided with results presented by Kleynhans et al. (2016) [25]. Nevertheless, Figure 9 further shows that the Fe peak intensity of the pre-oxidized and reduced sample was significantly higher than that for the reduced sample. Here, the beneficial effect of pre-oxidation on Fe metallization is emphasized. Davies et al. (2022) showed that the presence of the eskolaite-type phase (eskolaite–corundum solid solution, Cr1.4Al0.6O3) in hydrogen reduced chromite after hot acid leaching. The authors ascribed the presence of the eskolaite-type phase to the removal of the Fe from the chromite spinel [20].
To better understand the effect of pre-oxidation on the migration of Fe ions through the chromite particle, the pre-oxidized and pre-oxidized/reduced particles were cross-sectioned and investigated by SEM (Figure 10) and SEM-EDX (Table 4).
It is evident from Figure 10a that the Widmanstätten pattern formed within the chromite particle after being pre-oxidized at 1100 °C for 60 min. The presence of the Widmanstätten pattern suggests the formation of an exsolved Fe2O3 phase. This was however expected based on results presented elsewhere [22,24,27]. In Figure 10b, the Widmanstätten pattern is no longer visible after the particles were reduced. Rather, numerous randomly scattered white areas were observed within the particle.
An area close to the edge of the particle shown in Figure 10b (marked with a red circle) is shown in Figure 10c. According to EDX, the white areas (marked as Spectrum 1–3) were enriched in Fe. Table 4 shows that these areas had an average Cr/Fe ratio of 0.09, which was similar to the Cr/Fe of Area 3 in Table 3. Figure 10c further shows that the Fe-rich phase was more prominent when close to the particle edge, while the distribution of such phases within the particle interior was relatively less significant.
Considering the positioning and high Fe content of the white areas within the chromite particle, it could be ascribed to the formation of the Widmanstätten pattern. A similar observation was made by Zhao and Hayes (2010) while investigating the reducibility of pre-oxidized chromite pellets. The authors showed that metallization proceeded preferentially at sites where the Fe2O3-enriched sesquioxide phase was present, allowing metallization to proceed over the whole interior of the particle (not only at the rim of the particle) following the Widmanstätten pattern. Hence, the surface area available for metallization increased, allowing a shorter migration path for the oxides by not migrating to the rim of the particle. The Fe2O3-enriched sesquioxide phase, which cannot accommodate MgO, was the preferential nucleation and growth point for the metallic phase [23,75]. Moreso, the relatively low Al content (Table 4, Spectra 1–3) suggests the absence of Al2O3 from the sesquioxide phase, which promoted reducibility. It is however noted that EDX is a semi-quantitative analytic technique, and that the detected Mg and Al contents may be ascribed to their nearby presence, i.e., from the bulk material.
Figure 10b further shows that the metallic phase did not only occur at the particle rim but was beleaguered throughout the particles. This was considered a relatively critical observation as the effectiveness of the applied leaching procedure can be affected by the occurrence of metallic Fe inside the particle. The applied leaching procedure was, however, maintained for the sake of consistency. It is however noted that future studies must consider this when determining experimental procedures for total Fe removal of similarly prepared samples.
Nevertheless, Figure 10d shows that the leaching procedure removed Fe from the surface and near-surface area of the pre-oxidized/reduced particles, which is indicative of incomplete Fe removal. Figure 10c further shows that during the applied leaching procedure, Fe was solubilized up to 34.1 ± 4.9 µm into the particle.
To evaluate this, XRD analysis was applied to leach the pre-oxidized/reduced chromite samples and the reduced chromite samples (Figure 10). The patterns for leached and unleached reduced samples (Figure 4 and Figure 5) were included for comparative purposes.
Figure 11 shows that the leaching procedure removed the majority of Fe from the reduced chromite. Relatively significant metallic Fe peaks were observed for the leached pre-oxidized/reduced samples. This was however expected when considering Figure 10 and Table 4. Likely, prolonging the acid leaching method used in this study may not ensure the total removal of the metalized Fe content. As a prospect, size reduction (e.g., ball milling) of the hydrogen reduced chromite before acid leaching. It is further noted that the Fe (and Cr) metallization of pre-oxidized/reduced samples reported in this study is under-reported. The occurrence and extent of incomplete leaching are further conceptualized in the proceeding sections.

3.4. Effect of Pre-Oxidation Time

It is well known that the oxidation temperature has a significant influence on the reducibility of chromite [22,23,24,25,26]. Kleynhans et al. (2016) indicated that lower levels of reduction were obtained at oxidation temperatures above 1100 °C. Pre-oxidation temperatures >1000 °C resulted in the formation of an eskolaite-type phase between Cr2O3 and ɑ-Al2O3 [76]. Thermodynamically, the eskolaite-type phase is more resistive to reduction than naturally occurring chromite and is reduced at a slightly higher temperature [25]. Considering the stabilizing effect of the eskolaite-type phase on the reducibility of Cr, the effect of pre-oxidation parameters on Fe metallization was considered.
Size-fractioned chromite (refer to d90 values, Table 1) was subjected to pre-oxidation at 1100 °C for different durations (60, 120, and 240 min) and subsequently reduced at 1100 °C for 60 min at a hydrogen flow rate of 750 mL/min (Figure 12).
Figure 12 shows that pre-oxidation exceeding 60 min did not have an appreciable effect on the extent of Fe and Cr metallization; this was true for all size-fractioned chromite samples evaluated. The size fraction with a d90 of 133 and 266 µm had a comparable Fe metallization % and ranged between 77.5 (d90 of 133 µm, 60 min pre-oxidation) and 88.4% (d90 of 266 µm, 120 min pre-oxidation). The lowest Fe metallization % was achieved for the largest size fraction (d90 of 778 µm) which ranged between 42.1 and 51.7%.
It was however evident from Figure 12 that the Fe metallization % was not significantly affected by increasing the pre-oxidation time from 60 to 240 min. A study by Kapure et al. (2010) showed that exceeding 120 min of pre-oxidation at 900 °C did not have an appreciable effect on Fe and Cr metallization using a carbonaceous reductant [22]. Considering the results presented in Figure 12, it is evident that pre-oxidation >60 min did not promote Fe metallization. Shorter pre-oxidation times should be considered in future research, as shorter processing times can benefit from an economic perspective.

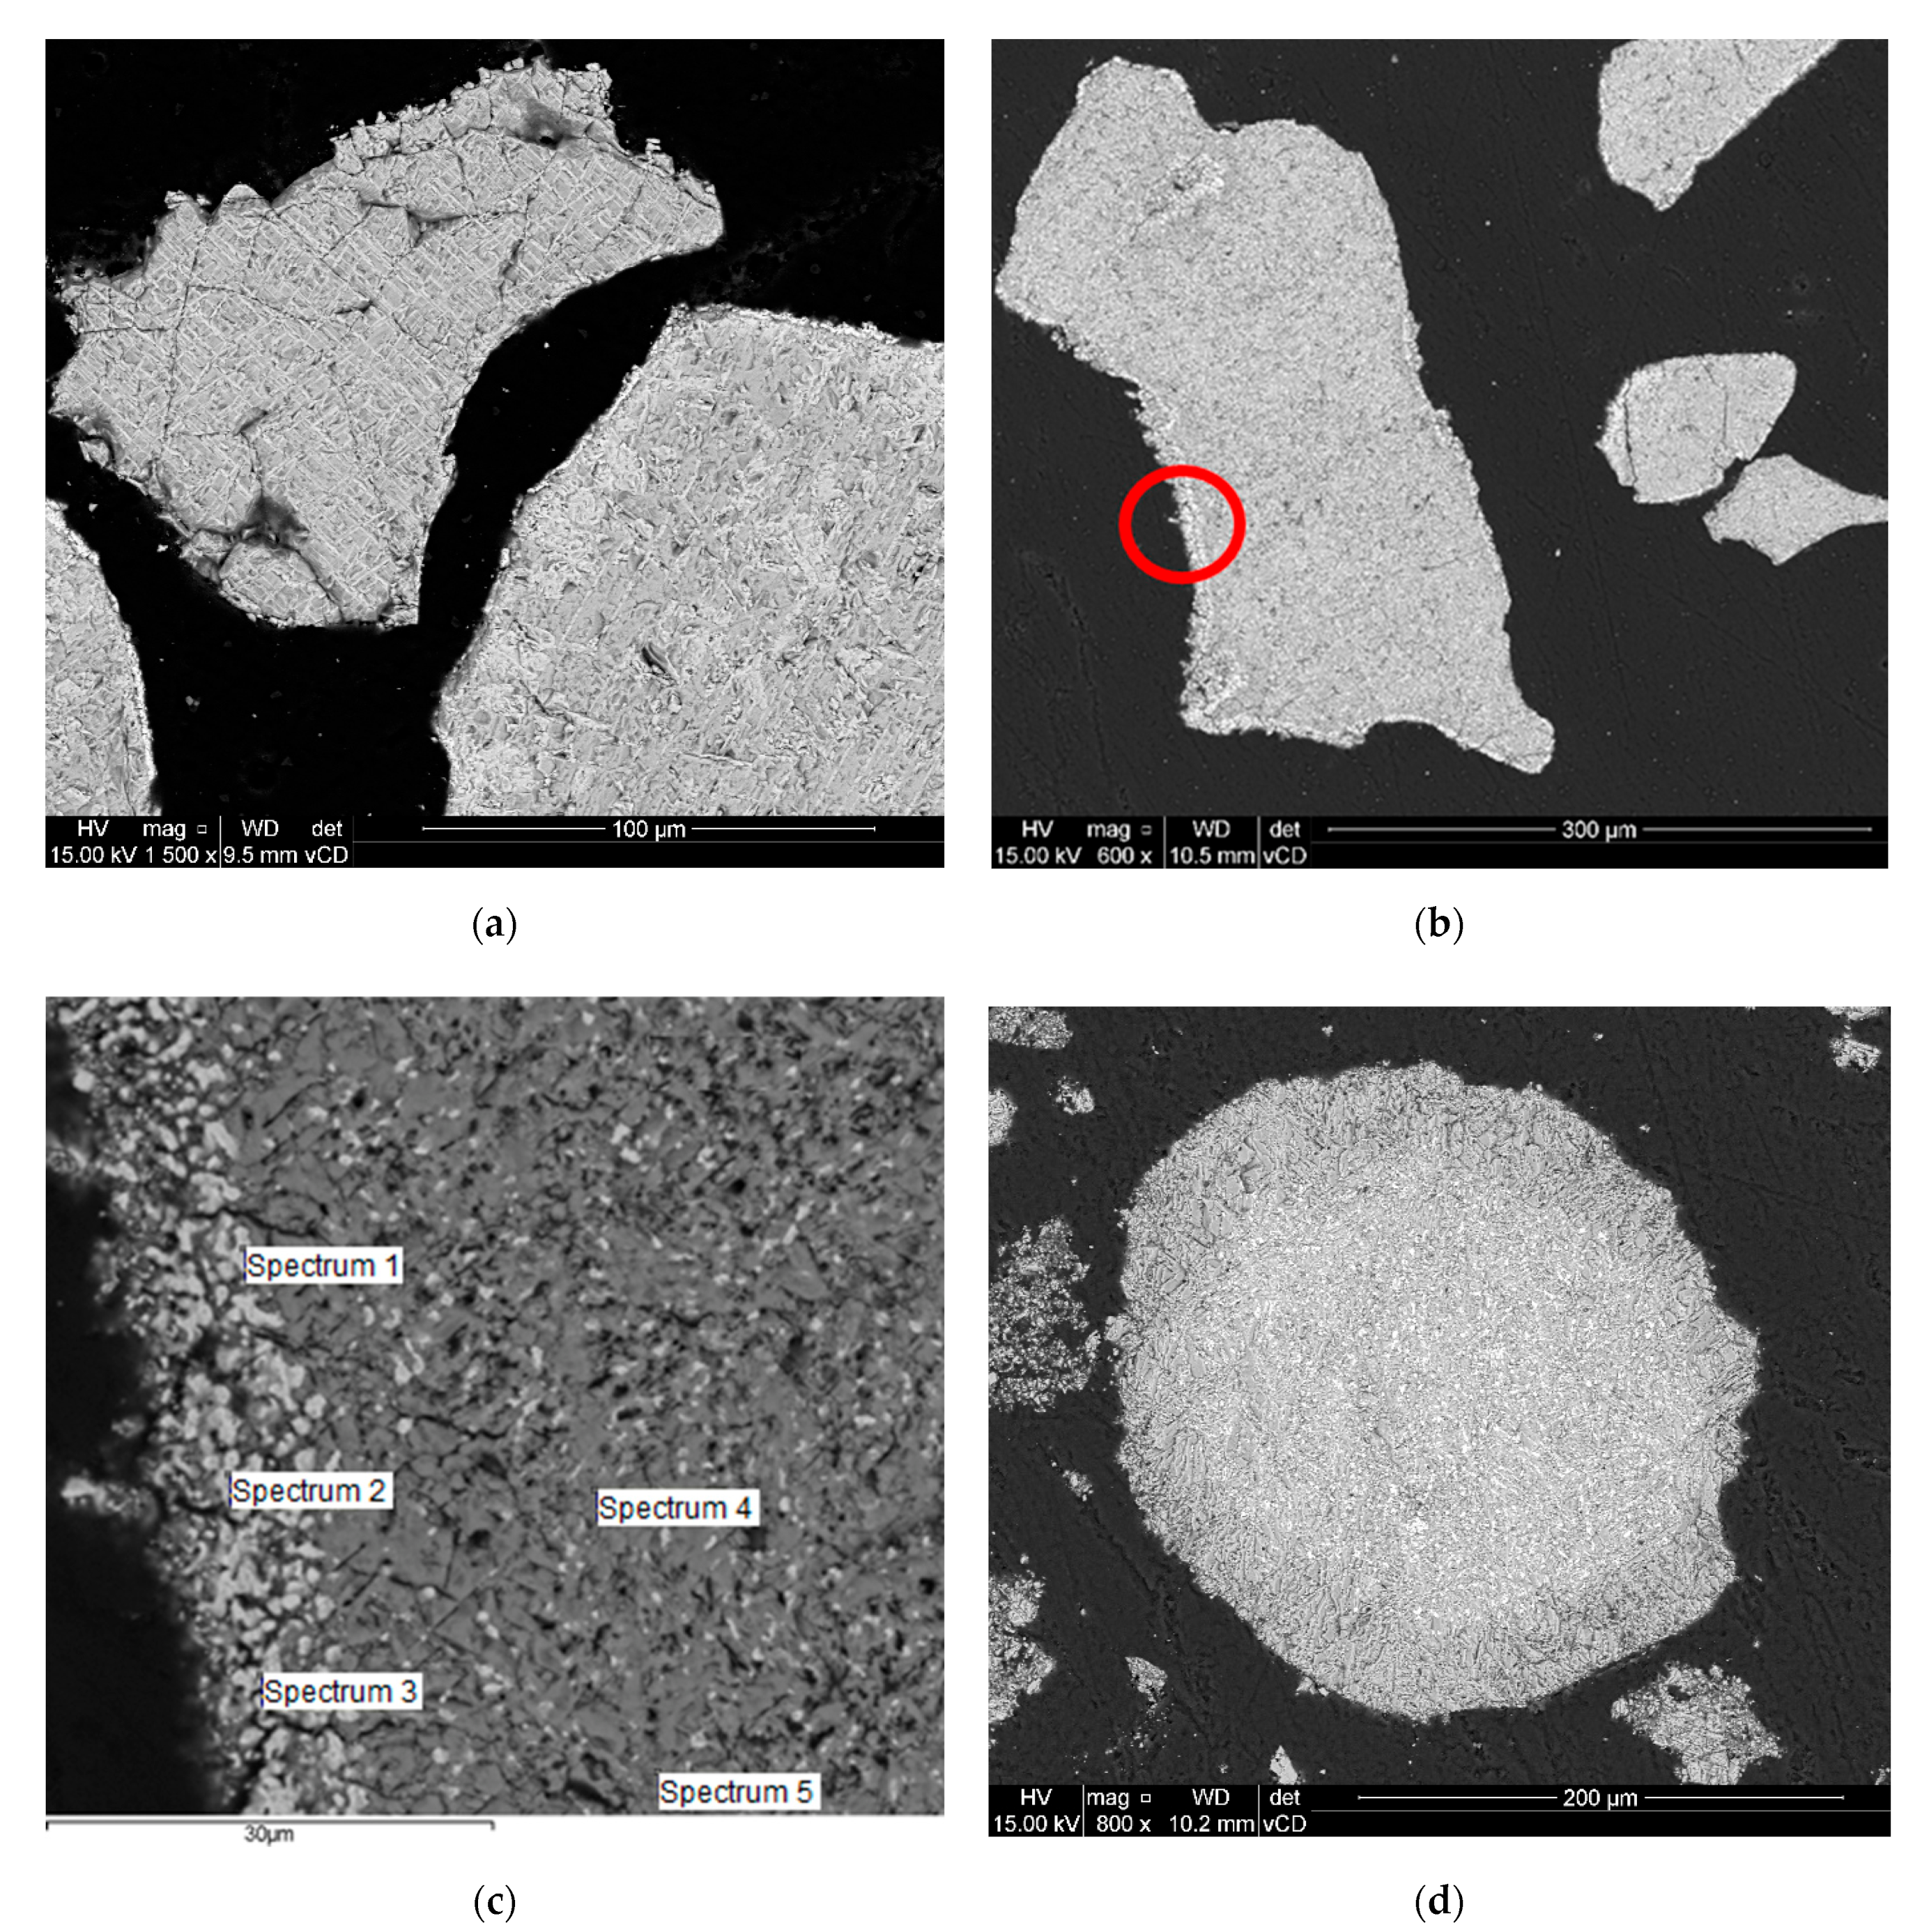
3.5. Effect of Pre-Oxidation and Leaching on Particle Integrity

During the handling of the materials in this study, a change in the chromite particle size was visually observed after the leaching procedure—more so for the leached pre-oxidized/reduced samples than for the leached reduced samples. To investigate this, SEM images of leached and unleached reduced and/or pre-oxidized samples were prepared. Pre-oxidation and reduction were performed at 1100 °C for 60 min. A 750 mL/min hydrogen flow rate was used during reduction.
Figure 13 suggests that the leaching process applied resulted in the structural degradation of the reduced and pre-oxidized/reduced chromite particles. When comparing the surface of the reduced particles (Figure 13a) to the leached counterpart (Figure 13b), numerous cracks and structural flaws can be observed; this suggests that, at the very least, the surface of the leached reduced particles deteriorated during the applied process.
From Figure 13d, it is clear that the pre-oxidized/reduced particles underwent significant deterioration when compared to Figure 13c, as a large fraction of particulate matter was observed after the leaching process. It is therefore likely that the leached pre-oxidized/reduced particles may require less energy to reduce the particle size to a d90 of 75 µm (pre-reduction)/d80 of 74 µm (oxidative sintering) required for pelletization before being smelted. It is however proposed that this observation be further investigated as it may likely form an important aspect when approaches to incorporate hydrogen-based reduction of chromite are developed.

4. Conclusions

In this study, we investigate the effect of pre-oxidation on the hydrogen reducibility of chromite. It is shown that by implementing pre-oxidation, higher Fe metallization was achieved under milder conditions when compared to unoxidized chromite. Using un-oxidized chromite, an Fe metallization of 92% was achieved by hydrogen-based reduction at 1100 °C for 180 min, while 84% was achieved for oxidized chromite reduced at 1100 °C and 60 min
Hydrogen-reduced unoxidized chromite revealed the formation of three distractive layers, which were characterized by an unreacted center, an Fe-deprived phase, and an Fe-enriched outer layer. A dissimilar reduction mechanism was observed when chromite was oxidized before reduction. The chromite oxidation resulted in the formation of an exsolved Fe2O3 phase throughout the particles, which was the preferred nucleation point for Fe metallization. Subsequent hydrogen reduction resulted in the formation of a relatively prominent Fe layer, as well as numerous Fe-enriched phases through the particle.
The Fe leaching procedure used showed that Fe0 present in the outer 34.1 ± 4.9 µm of the chromite particles was removed, while intra-particle Fe0 remained. This was considered an important observation as it can guide decision making during the development of a process that incorporates pre-oxidation and subsequent hydrogen reduction. Considering that the total Fe0 content was not removed by the hot acid leaching procedure employed here, it is likely that this value is under-reported.
Lastly, pre-oxidation of chromite results in the formation of an α-Al2O3-stabilized eskolaite-type phase, which is more resistant to reduction when compared to naturally occurring chromite. The formation of the eskolaite-type phase is however jointly ascribed to the removal of Fe from the chromite spinel due to subjecting chromite to oxidation.

Author Contributions

Conceptualization, S.P.d.P. and J.D.; methodology, S.P.d.P. and J.D.; software, J.D. and S.P.d.P.; validation, S.P.d.P., M.T., E.R. and J.P.B.; formal analysis, J.D.; investigation, J.D., S.P.d.P.; resources, S.P.d.P., J.P.B. and D.B.; data curation, J.D.; writing—original draft preparation, J.D.; writing—review and editing, J.D., M.T., E.R., S.P.d.P.; visualization, J.D.; supervision, S.P.d.P.; project administration, S.P.d.P. and M.T.; funding acquisition, M.T. and D.B. All authors have read and agreed to the published version of the manuscript.

Funding

This study and APC was funded by the Research Council of Norway (RCN) as the Thanos project (INPART Project 309475) and is gratefully acknowledged. The Department of Science and Innovation (DSI), South Africa, and HySA Infrastructure Centre of Competence, South Africa, are also gratefully acknowledged for their financial support through the KP5 program.

Conflicts of Interest

The authors declare no conflict of interest.

References

  1. Feary, J.; Cullinan, P. Heavy Metals. In Reference Module in Biomedical Sciences [Internet]; Elsevier: Amsterdam, The Netherlands, 2019. [Google Scholar]
  2. Beukes, J.; Dawson, N.; Van Zyl, P. Theoretical and practical aspects of Cr (VI) in the South African ferrochrome industry. J. S. Afr. Inst. Min. Metall. 2010, 110, 743–750. [Google Scholar]
  3. du Preez, S.P.; Beukes, J.P.; Van Dalen, W.; van Zyl, P.; Paktunc, D.; Loock-Hattingh, M. Aqueous solubility of Cr(VI) compounds in ferrochrome bag filter dust and the implications thereof. Water SA 2017, 43, 298. [Google Scholar] [CrossRef] [Green Version]
  4. Riekkola-Vanhanen, M. Finnish Expert Report on Best Available Techniques in Ferrochromium Production. 1999. Available online: https://helda.helsinki.fi/bitstream/handle/10138/40531/FE_314.pdf?sequence=1 (accessed on 2 November 2021).
  5. du Preez, S.P.; Beukes, J.P.; van Zyl, P.G.; Tangstad, M.; Tiedt, L.R. Silicon Carbide Formation Enhanced by In-Situ-Formed Silicon Nitride: An Approach to Capture Thermal Energy of CO-Rich Off-Gas Combustion. Met. Mater. Trans. A 2018, 49, 3151–3163. [Google Scholar] [CrossRef] [Green Version]
  6. Beukes, J.P.; du Preez, S.; van Zyl, P.; Paktunc, D.; Fabritius, T.; Päätalo, M.; Cramer, M. Review of Cr(VI) environmental practices in the chromite mining and smelting industry—Relevance to development of the Ring of Fire, Canada. J. Clean. Prod. 2017, 165, 874–889. [Google Scholar] [CrossRef]
  7. Basson, J.; Daavittila, J. High carbon ferrochrome technology. In Handbook of Ferroalloys; Elsevier: Amsterdam, The Netherlands, 2013; pp. 317–363. [Google Scholar]
  8. Barnes, A.; Finn, C.; Algie, S. The prereduction and smelting of chromite concentrate of low chromium-to-iron ratio. J. S. Afr. Inst. Min. Metall. 1983, 83, 49–54. [Google Scholar]
  9. Erwee, M.; Swanepoel, S.; Reynolds, Q. The importance of controlling the chemistry of pre-oxidized chromite pellets for Submerged Arc Furnace FeCr smelting: A study on furnace Si control. In Proceedings of the 16th International Ferro-Alloys Congress (INFACON XVI), Virtual, 27–29 September 2021. [Google Scholar]
  10. Alfredsen, K.; Amundsen, P.-A.; Hahn, L.; Harrison, P.M.; Helland, I.P.; Martins, E.G.; Twardek, W.M.; Power, M. A synoptic history of the development, production and environmental oversight of hydropower in Brazil, Canada, and Norway. Hydrobiologia 2022, 849, 269–280. [Google Scholar] [CrossRef]
  11. du Preez, S.P.; Beukes, J.P.; van Zyl, P. Cr(VI) Generation During Flaring of CO-Rich Off-Gas from Closed Ferrochromium Submerged Arc Furnaces. Met. Mater. Trans. A 2015, 46, 1002–1010. [Google Scholar] [CrossRef] [Green Version]
  12. Du Preez, S. Cr (VI) Generation during Flaring of Off-Gas from Closed Ferrochromium Submerged Arc Furnaces. Ph.D. Thesis, North-West University, Potchefstroom, South Africa, 2014. [Google Scholar]
  13. Niemelä, P.; Krogerus, H.; Oikarinen, P. Formation, characteristics and utilisation of CO-gas formed in ferrochromium smelting. In Proceedings of the Tenth International Ferro Alloys Congress, Cape Town, South Africa, 1–4 February 2004; pp. 68–77. [Google Scholar]
  14. Winter, F. Production of Chromium Iron Alloys Directly from Chromite Ore. U.S. Patent 15,027,479, 25 August 2016. [Google Scholar]
  15. Canaguier, V. Synthesis and Reduction-Carburization of (Fe, Mg)(Cr, Al)2O4 Composite Spinel Solid Solution with CH4. Ph.D. Thesis, Norwegian University of Science and Technology, Trondheim, Norway, 2018. [Google Scholar]
  16. Yu, D.; Paktunc, D. Calcium Chloride-Assisted Segregation Reduction of Chromite: Influence of Reductant Type and the Mechanism. Minerals 2018, 8, 45. [Google Scholar] [CrossRef] [Green Version]
  17. Sokhanvaran, S.; Paktunc, D.; Barnes, A. NaOH-assisted direct reduction of Ring of Fire chromite ores, and the associated implications for processing. J. S. Afr. Inst. Min. Metall. 2018, 118, 581–588. [Google Scholar] [CrossRef]
  18. Anacleto, N.; Ostrovski, O. Solid-state reduction of chromium oxide by methane-containing gas. Met. Mater. Trans. A 2004, 35, 609–615. [Google Scholar] [CrossRef]
  19. Suzuki, A.M.; Yasuda, A.; Ozawa, K. Cr and Al diffusion in chromite spinel: Experimental determination and its implication for diffusion creep. Phys. Chem. Miner. 2008, 35, 433–445. [Google Scholar] [CrossRef]
  20. Davies, J.; Paktunc, D.; Ramos-Hernandez, J.J.; Tangstad, M.; Ringdalen, E.; Beukes, J.P.; Bessarabov, D.G.; Du Preez, S.P. The Use of Hydrogen as a Potential Reductant in the Chromite Smelting Industry. Minerals 2022, 12, 534. [Google Scholar] [CrossRef]
  21. Tathavakar, V.D.; Antony, M.P.; Jha, A. The physical chemistry of thermal decomposition of South African chromite minerals. Met. Mater. Trans. A 2005, 36, 75–84. [Google Scholar] [CrossRef]
  22. Kapure, G.; Tathavadkar, V.; Rao, C.; Rao, S.; Raju, K. Coal based direct reduction of preoxidized chromite ore at high temperature. In Proceedings of the 12th International Ferro-Alloys Congress (INFACON XII), Helsinki, Finland, 6–9 June 2010; pp. 293–301. [Google Scholar]
  23. Zhao, B.; Hayes, P. Effects of oxidation on the microstructure and reduction of chromite pellets. In Proceedings of the 12th International Ferro-Alloys Congress (INFACON XII), Helsinki, Finland, 6–9 June 2010; pp. 263–273. [Google Scholar]
  24. Borra, C.R.; Kapure, G.; Tathavadkar, V. Investigation of pre-oxidation of Sukinda Chromite Ore. Tata Search 2010, 1, 145–148. [Google Scholar]
  25. Kleynhans, E.; Neizel, B.; Beukes, J.; van Zyl, P. Utilisation of pre-oxidised ore in the pelletised chromite pre-reduction process. Miner. Eng. 2016, 92, 114–124. [Google Scholar] [CrossRef]
  26. Biswas, A.; Konar, B.; Kapure, G.U.; Sahu, N.; Paliwal, M. Pre-oxidation treatment of Indian chromite ores: Kinetics and phase transformation behavior relevant to ferrochrome manufacturing and pelletization. Miner. Process. Extr. Met. 2018, 130, 31–41. [Google Scholar] [CrossRef]
  27. du Preez, S.P.; Beukes, J.P.; Paktunc, D.; van Zyl, P.; Jordaan, A. Recycling pre-oxidized chromite fines in the oxidative sintered pellet production process. J. S. Afr. Inst. Min. Metall. 2019, 119, 207–215. [Google Scholar] [CrossRef] [Green Version]
  28. Pariser, H.; Backeberg, N.; Masson, O.; Bedder, J. Changing nickel and chromium stainless steel markets—A review. J. S. Afr. Inst. Min. Metall. 2018, 118, 563–568. [Google Scholar] [CrossRef] [Green Version]
  29. Glastonbury, R.; Beukes, J.P.; van Zyl, P.; Sadikit, L.; Jordaan, A.; Campbell, Q.; Stewart, H.; Dawson, N. Comparison of physical properties of oxidative sintered pellets produced with UG2 or metallurgical-grade South African chromite: A case study. J. S. Afr. Inst. Min. Metall. 2015, 115, 699–706. [Google Scholar] [CrossRef]
  30. Ringdalen, E.; Olsen, S.E. The effect of chromite ore mineralogy on reduction mechanisms and reducibility. Infacon 1998, 8, 147–152. [Google Scholar]
  31. Balat, M. Potential importance of hydrogen as a future solution to environmental and transportation problems. Int. J. Hydrogen Energy 2008, 33, 4013–4029. [Google Scholar] [CrossRef]
  32. Pandey, B.; Prajapati, Y.K.; Sheth, P.N. Recent progress in thermochemical techniques to produce hydrogen gas from biomass: A state of the art review. Int. J. Hydrogen Energy 2019, 44, 25384–25415. [Google Scholar] [CrossRef]
  33. Canavesio, C.; Nassini, D.; Nassini, H.E.; Bohé, A.E. Study on an original cobalt-chlorine thermochemical cycle for nuclear hydrogen production. Int. J. Hydrogen Energy 2019, 45, 26090–26103. [Google Scholar] [CrossRef]
  34. Falch, A.; Kriek, R.J. Laser induced H2 production employing Pt-TiO2 photocatalysts. J. Photochem. Photobiol. A Chem. 2013, 271, 117–123. [Google Scholar] [CrossRef]
  35. Zhang, J.; Xing, C.; Shi, F. MoS2/Ti3C2 heterostructure for efficient visible-light photocatalytic hydrogen generation. Int. J. Hydrogen Energy 2020, 45, 6291–6301. [Google Scholar] [CrossRef]
  36. Ziming, C.; Fuqiang, W.; Huaxu, L.; Shengpeng, H.; Bo, L.; Jianyu, T.; Hongyang, L. Photon-absorption-based explanation of ultrasonic-assisted solar photochemical splitting of water to improve hydrogen production. Int. J. Hydrogen Energy 2018, 43, 14439–14450. [Google Scholar] [CrossRef]
  37. Liu, W.-S.; Perng, T.-P. Ta2O5 hollow fiber composed of internal interconnected mesoporous nanotubes and its enhanced photochemical H2 evolution. Int. J. Hydrogen Energy 2019, 44, 17688–17696. [Google Scholar] [CrossRef]
  38. Patel, P.P.; Ghadge, S.D.; Hanumantha, P.J.; Datta, M.K.; Gattu, B.; Shanthi, P.M.; Kumta, P.N. Active and robust novel bilayer photoanode architectures for hydrogen generation via direct non-electric bias induced photo-electrochemical water splitting. Int. J. Hydrogen Energy 2018, 43, 13158–13176. [Google Scholar] [CrossRef]
  39. Manwar, N.R.; Borkar, R.G.; Khobragade, R.; Rayalu, S.S.; Jain, S.L.; Bansiwal, A.K.; Labhsetwar, N.K. Efficient solar photo-electrochemical hydrogen generation using nanocrystalline CeFeO3 synthesized by a modified microwave assisted method. Int. J. Hydrogen Energy 2017, 42, 10931–10942. [Google Scholar] [CrossRef]
  40. Du Preez, S.P. Hydrogen Generation by Means of Hydrolysis Using Activated Al-In-Bi-Sn Composites for Electrochemical Energy Applications. Int. J. Electrochem. Sci. 2017, 12, 8663–8682. [Google Scholar] [CrossRef]
  41. du Preez, S.P.; Bessarabov, D. Hydrogen generation of mechanochemically activated Al Bi In composites. Int. J. Hydrogen Energy 2017, 42, 16589–16602. [Google Scholar] [CrossRef]
  42. du Preez, S.P.; Bessarabov, D.G. Hydrogen generation by the hydrolysis of mechanochemically activated aluminum-tin-indium composites in pure water. Int. J. Hydrogen Energy 2018, 43, 21398–21413. [Google Scholar] [CrossRef]
  43. du Preez, S.; Bessarabov, D.G. The effects of bismuth and tin on the mechanochemical processing of aluminum-based composites for hydrogen generation purposes. Int. J. Hydrogen Energy 2019, 44, 21896–21912. [Google Scholar] [CrossRef]
  44. Du Preez, S. Material Aspects Pertaining to Hydrogen Production from Aluminum: Opinion. Res. Dev. Mater. Sci. 2019, 44, 21896–21912. [Google Scholar] [CrossRef]
  45. Du Preez, S.P. Hydrogen Generation by the Reaction of Mechanochemically Activated Aluminium and Water. Ph.D. Thesis, North-West University, Potchefstroom, South Africa, 2019. [Google Scholar]
  46. du Preez, S.; Bessarabov, D. On-demand hydrogen generation by the hydrolysis of ball-milled aluminum composites: A process overview. Int. J. Hydrogen Energy 2021, 46, 35790–35813. [Google Scholar] [CrossRef]
  47. Davies, J.; Du Preez, S.P.; Bessarabov, D.G. The Hydrolysis of Ball-Milled Aluminum–Bismuth–Nickel Composites for On-Demand Hydrogen Generation. Energies 2022, 15, 2356. [Google Scholar] [CrossRef]
  48. Davies, J.; du Preez, S.P.; Bessarabov, D.G. On-Demand Hydrogen Generation by the Hydrolysis of Ball-Milled Aluminum–Bismuth–Zinc Composites. Materials 2022, 15, 1197. [Google Scholar] [CrossRef]
  49. Bessarabov, D.; Human, G.; Kruger, A.J.; Chiuta, S.; Modisha, P.M.; du Preez, S.P.; Oelofse, S.P.; Vincent, I.; Van Der Merwe, J.; Langmi, H.W.; et al. South African hydrogen infrastructure (HySA infrastructure) for fuel cells and energy storage: Overview of a projects portfolio. Int. J. Hydrogen Energy 2017, 42, 13568–13588. [Google Scholar] [CrossRef]
  50. Phillips, R.; Dunnill, C.W. Zero gap alkaline electrolysis cell design for renewable energy storage as hydrogen gas. RSC Adv. 2016, 6, 100643–100651. [Google Scholar] [CrossRef] [Green Version]
  51. Falch, A.; Badets, V.A.; Labrugère, C.; Kriek, R.J. Co-sputtered PtxPdyAlz thin film electrocatalysts for the production of hydrogen via SO2(aq) electro-oxidation. Electrocatalysis 2016, 7, 376–390. [Google Scholar] [CrossRef]
  52. Vincent, I.; Bessarabov, D. Low cost hydrogen production by anion exchange membrane electrolysis: A review. Renew. Sustain. Energy Rev. 2018, 81, 1690–1704. [Google Scholar] [CrossRef]
  53. Vincent, I.; Kruger, A.; Bessarabov, D. Development of efficient membrane electrode assembly for low cost hydrogen production by anion exchange membrane electrolysis. Int. J. Hydrogen Energy 2017, 42, 10752–10761. [Google Scholar] [CrossRef]
  54. Merwe, J.v.d.; Uren, K.; Schoor, G.v.; Bessarabov, D. A study of the loss characteristics of a single cell PEM electrolyser for pure hydrogen production. In Proceedings of the 2013 IEEE International Conference on Industrial Technology (ICIT), Cape Town, South Africa, 25–28 February 2013; pp. 668–672. [Google Scholar]
  55. Chiuta, S.; Everson, R.C.; Neomagus, H.; Bessarabov, D.G. Hydrogen production from ammonia decomposition over a commercial Ru/Al2O3 catalyst in a microchannel reactor: Experimental validation and CFD simulation. Int. J. Hydrogen Energy 2016, 41, 3774–3785. [Google Scholar] [CrossRef]
  56. Chiuta, S.; Everson, R.C.; Neomagus, H.W.; Bessarabov, D.G. Performance evaluation of a high-throughput microchannel reactor for ammonia decomposition over a commercial Ru-based catalyst. Int. J. Hydrogen Energy 2015, 40, 2921–2926. [Google Scholar] [CrossRef]
  57. Chiuta, S.; Everson, R.C.; Neomagus, H.W.; van der Gryp, P.; Bessarabov, D.G. Reactor technology options for distributed hydrogen generation via ammonia decomposition: A review. Int. J. Hydrogen Energy 2013, 38, 14968–14991. [Google Scholar] [CrossRef]
  58. Sekoai, P.T.; Ouma, C.N.M.; du Preez, S.P.; Modisha, P.; Engelbrecht, N.; Bessarabov, D.G.; Ghimire, A. Application of nanoparticles in biofuels: An overview. Fuel 2019, 237, 380–397. [Google Scholar] [CrossRef]
  59. Sekoai, P.T.; Engelbrecht, N.; du Preez, S.P.; Bessarabov, D. Thermophilic Biogas Upgrading via ex Situ Addition of H2 and CO2 Using Codigested Feedstocks of Cow Manure and the Organic Fraction of Solid Municipal Waste. ACS Omega 2020, 5, 17367–17376. [Google Scholar] [CrossRef]
  60. Sekoai, P.T.; Daramola, M.O.; Mogwase, B.; Engelbrecht, N.; Yoro, K.O.; du Preez, S.P.; Mhlongo, S.; Ezeokoli, O.T.; Ghimire, A.; Ayeni, A.O.; et al. Revising the dark fermentative H2 research and development scenario—An overview of the recent advances and emerging technological approaches. Biomass Bioenergy 2020, 140, 105673. [Google Scholar] [CrossRef]
  61. du Toit, M.H.; Avdeenkov, A.V.; Bessarabov, D. Reviewing H2 Combustion: A Case Study for Non-Fuel-Cell Power Systems and Safety in Passive Autocatalytic Recombiners. Energy Fuels 2018, 32, 6401–6422. [Google Scholar] [CrossRef]
  62. du Preez, S.; Jones, D.; Warwick, M.; Falch, A.; Sekoai, P.; Quaresma, C.M.D.N.; Bessarabov, D.; Dunnill, C. Thermally stable Pt/Ti mesh catalyst for catalytic hydrogen combustion. Int. J. Hydrogen Energy 2020, 45, 16851–16864. [Google Scholar] [CrossRef]
  63. du Preez, S.; Jones, D.; Bessarabov, D.; Falch, A.; Quaresma, C.M.D.N.; Dunnill, C. Development of a Pt/stainless steel mesh catalyst and its application in catalytic hydrogen combustion. Int. J. Hydrogen Energy 2019, 44, 27094–27106. [Google Scholar] [CrossRef]
  64. Lughi, V.; Lenaz, D.; Bonifacio, A.; Princivalle, F.; Sergo, V.; Parisi, F. A Raman spectroscopy study of the oxidation processes in synthetic chromite FeCr2O4. Cer. Int. 2020, 46, 29382–29387. [Google Scholar] [CrossRef]
  65. Algie, S.H.; Finn, C.W.P. Reaction Mechanisms in the Reduction of Winterveld Chrome Spinel with Graphite and Carbon; Council for Mineral Technology: Randburg, South Africa, 1984. [Google Scholar]
  66. Hazar-Yoruç, A.B. Reduction mechanism of chromite spinel with carbon. Min. Metall. Explor. 2007, 24, 115–120. [Google Scholar] [CrossRef]
  67. Shepherd, P.H. Chromite Crystal Structure and Chemistry Applied as an Exploration Tool. Master’s Thesis, The University of Western Ontario, London, ON, Canada, 2015. Available online: https://ir.lib.uwo.ca/etd/2685 (accessed on 27 December 2021).
  68. Mehio, N.; Dai, S.; Jiang, D.-E. Quantum Mechanical Basis for Kinetic Diameters of Small Gaseous Molecules. J. Phys. Chem. A 2014, 118, 1150–1154. [Google Scholar] [CrossRef]
  69. Soykan, O.; Eric, R.H.; King, R.P. Kinetics of the reduction of bushveld complex chromite ore at 1416 °C. Metall. Mater. Trans. A 1991, 22, 801–810. [Google Scholar] [CrossRef]
  70. Boericke, F.; Bangert, W. Equilibrium in the Reduction of Ferrous Chromite by Hydrogen and Energy Requirements in the Selective Reduction of Iron in Chromite; US Department of the Interior, Bureau of Mines: Washington, DC, USA, 1945; Volume 3813. [Google Scholar]
  71. Chakraborty, D.; Ranganathan, S.; Sinha, S. Carbothermic Reduction of Chromite Ore Under Different Flow Rates of Inert Gas. Metall. Mater. Trans. A 2009, 41, 10–18. [Google Scholar] [CrossRef]
  72. Chu, W.F.; Rahmel, A. The kinetics of the reduction of chromium oxide by hydrogen. Metall. Mater. Trans. A 1979, 10, 401–407. [Google Scholar] [CrossRef]
  73. Park, E.; Ostrovski, O.; Zhang, J.; Thomson, S.; Howe, R. Characterization of phases formed in the iron carbide process by X-ray diffraction, Mössbauer, X-ray photoelectron spectroscopy, and Raman spectroscopy analyses. Metall. Mater. Trans. A 2001, 32, 839–845. [Google Scholar] [CrossRef]
  74. Leikola, M.; Taskinen, P.; Eric, R. Reduction of Kemi chromite with methane. J. S. Afr. Inst. Min. Metall. 2018, 118, 575–580. [Google Scholar] [CrossRef] [Green Version]
  75. Pan, J.; Yang, C.; Zhu, D. Solid State Reduction of Preoxidized Chromite-iron Ore Pellets by Coal. ISIJ Int. 2015, 55, 727–735. [Google Scholar] [CrossRef] [Green Version]
  76. Bondioli, F.; Ferrari, A.M.; Leonelli, C.; Manfredini, T.; Linati, L.; Mustarelli, P. Reaction Mechanism in Alumina/Chromia (Al2O3-Cr2O3) Solid Solutions Obtained by Coprecipitation. J. Am. Ceram. Soc. 2000, 83, 2036–2040. [Google Scholar] [CrossRef]
Figure 1. The effect of sample mass exposed to hydrogen on Fe and Cr metallization during reduction. Both chromite batches (5 g and 30 g) of all size-fractioned (d90 of 133 to 778 µm) samples were reduced at 1100 °C for 180 min at a hydrogen flow rate of 150 mL/min.
Minerals 12 00911 g001
Figure 2. The effect of hydrogen flow rate on Fe and Cr metallization. Size-fractioned samples (d90 of 133 to 778 µm) were reduced at 1100 °C for 60 min.
Minerals 12 00911 g002
Figure 3. XRD patterns of the as-received chromite ore, and samples reduced at 150 and 750 mL/min hydrogen flow rates at 1100 °C for 60 min.
Minerals 12 00911 g003
Figure 4. Secondary electron SEM micrographs of the surface of as-received chromite particles (a) reduced at a 150 mL/min (b) and 750 mL/min (c) hydrogen flow rate. Samples were reduced at 1100 °C for 60 min.
Minerals 12 00911 g004
Figure 5. Backscattered electron SEM micrographs of the globules observed on the surface of a chromite particle reduced at a hydrogen flow rate of 150 mL/min (a) and a similar surface after acid leaching (b).
Minerals 12 00911 g005
Figure 6. Backscattered electron SEM micrograph of chromite particles reduced at 1100 °C for 60 min at a 150 (a) and 750 mL/min (b) hydrogen flow rate.
Minerals 12 00911 g006
Figure 7. Effect of reduction time on the Fe (a) and Cr (b) metallization. All size-fractioned chromite samples were reduced at 1100 °C for 60, 120, or 180 min at a 750 mL/min hydrogen flow rate.
Minerals 12 00911 g007
Figure 8. The effects of pre-oxidation (1100 °C for 60 min) on the Fe and Cr metallization of samples reduced at 1100 °C for 60 min at a hydrogen flow rate of 750 mL/min.
Minerals 12 00911 g008
Figure 9. XRD patterns of the as-received chromite ore, samples reduced at 750 mL/min hydrogen flow rates, and samples pre-oxidized (1100 °C for 60 min) and reduced (1100 °C at a 750 mL/min hydrogen flow rate for 60 min).
Minerals 12 00911 g009
Figure 10. Backscattered electron SEM micrograph of chromite particles pre-oxidized at 1100 °C for 60 min (a) and subsequently reduced at 1100 °C for 60 min at a hydrogen flow rate of 750 mL/min (b,c) presents a similar particle as shown in (b) at a higher magnification (encircled) and (d) a pre-oxidized/reduced particle after leaching.
Minerals 12 00911 g010
Figure 11. XRD patterns of leached (L) and unleached (UL) reduced and pre-oxidized/reduced samples. Pre-oxidation was performed at 1100 °C for 60 min and reduction was performed at 1100 °C for 60 min at a hydrogen flow rate of 750 mL/min.
Minerals 12 00911 g011
Figure 12. The effect of pre-oxidation time on Fe (a) and Cr (b) metallization. Size-fractioned samples were pre-oxidized at 1100 °C for 60, 120, and 240 min and subsequently reduced at 1100 °C for 60 min at a hydrogen flow rate of 750 mL/min.
Minerals 12 00911 g012
Figure 13. Backscattered SEM images of reduced chromite particles before (a) and after (b) leaching, and pre-oxidized/reduced chromite particles before (c) and after (d) leaching.
Minerals 12 00911 g013
Table 1. D90, d50, and d10 (µm) of as-received and size-fractioned chromite.
Size EquivalentAs-ReceivedSieve Sizes (µm)
<106106 to 212212 to 425425 to 850
d90455133260467778
d5025384178335569
d1013251122238416
Table 2. Total amount of Fe and Cr present per in the as-received chromite and the size-fractioned chromite ores.
As-ReceivedSize-Fractioned Chromite Ore
Size equivalent d90 (µm)455778467260133
g Fe/g chromite ore0.1860.1890.1840.1960.199
g Cr/g chromite ore0.3020.3130.2950.3130.289
Table 3. Microanalyses by SEM-EDX (wt%) of chromite particles shown in Figure 6. The samples were reduced at 1100 C for 60 min at a hydrogen flow rate of 150 or 750 mL/min. The Cr/Fe ratio and hydrogen flow rate are indicated.
SpectrumDesignationDetected Element (wt%)Cr/FeHydrogen Flow Rate (mL/min)
OMgAlCrFe
1n/a38.606.017.7630.0617.571.71150
238.396.027.6330.3017.661.72
340.726.247.828.5516.691.71
4Area 18.810.395.995.1079.710.06750
51.420.050.025.7192.80.06
616.782.943.411.0665.830.17
7Area 241.257.857.9334.158.823.87
840.598.058.3234.48.653.98
9Area 340.335.87.6329.1817.061.71
Table 4. Microanalyses by SEM-EDX (wt%) of chromite particle shown in Figure 10c. The sample was pre-oxidized at 1100°C for 60 min and subsequently reduced at 1100 °C for 60 min at a hydrogen flow rate of 750 mL/min.
SpectrumDescriptionDetected Element (wt%)
OMgAlTiCrFeCr/Fe
1White area9.372.352.38-8.477.50.12
26.20.891.63-5.5585.730.06
38.151.212.61-7.3180.710.09
4Grey area42.284.0912.461.0434.365.775.95
542.0810.219.71-30.667.344.18
Publisher’s Note: MDPI stays neutral with regard to jurisdictional claims in published maps and institutional affiliations.

