
Potassic-Hastingsite from the Kedrovy District (East Siberia, Russia): Petrographic Description, Crystal Chemistry, Spectroscopy, and Thermal Behavior

 , , and
Abstract
:1. Introduction
2. Materials and Methods
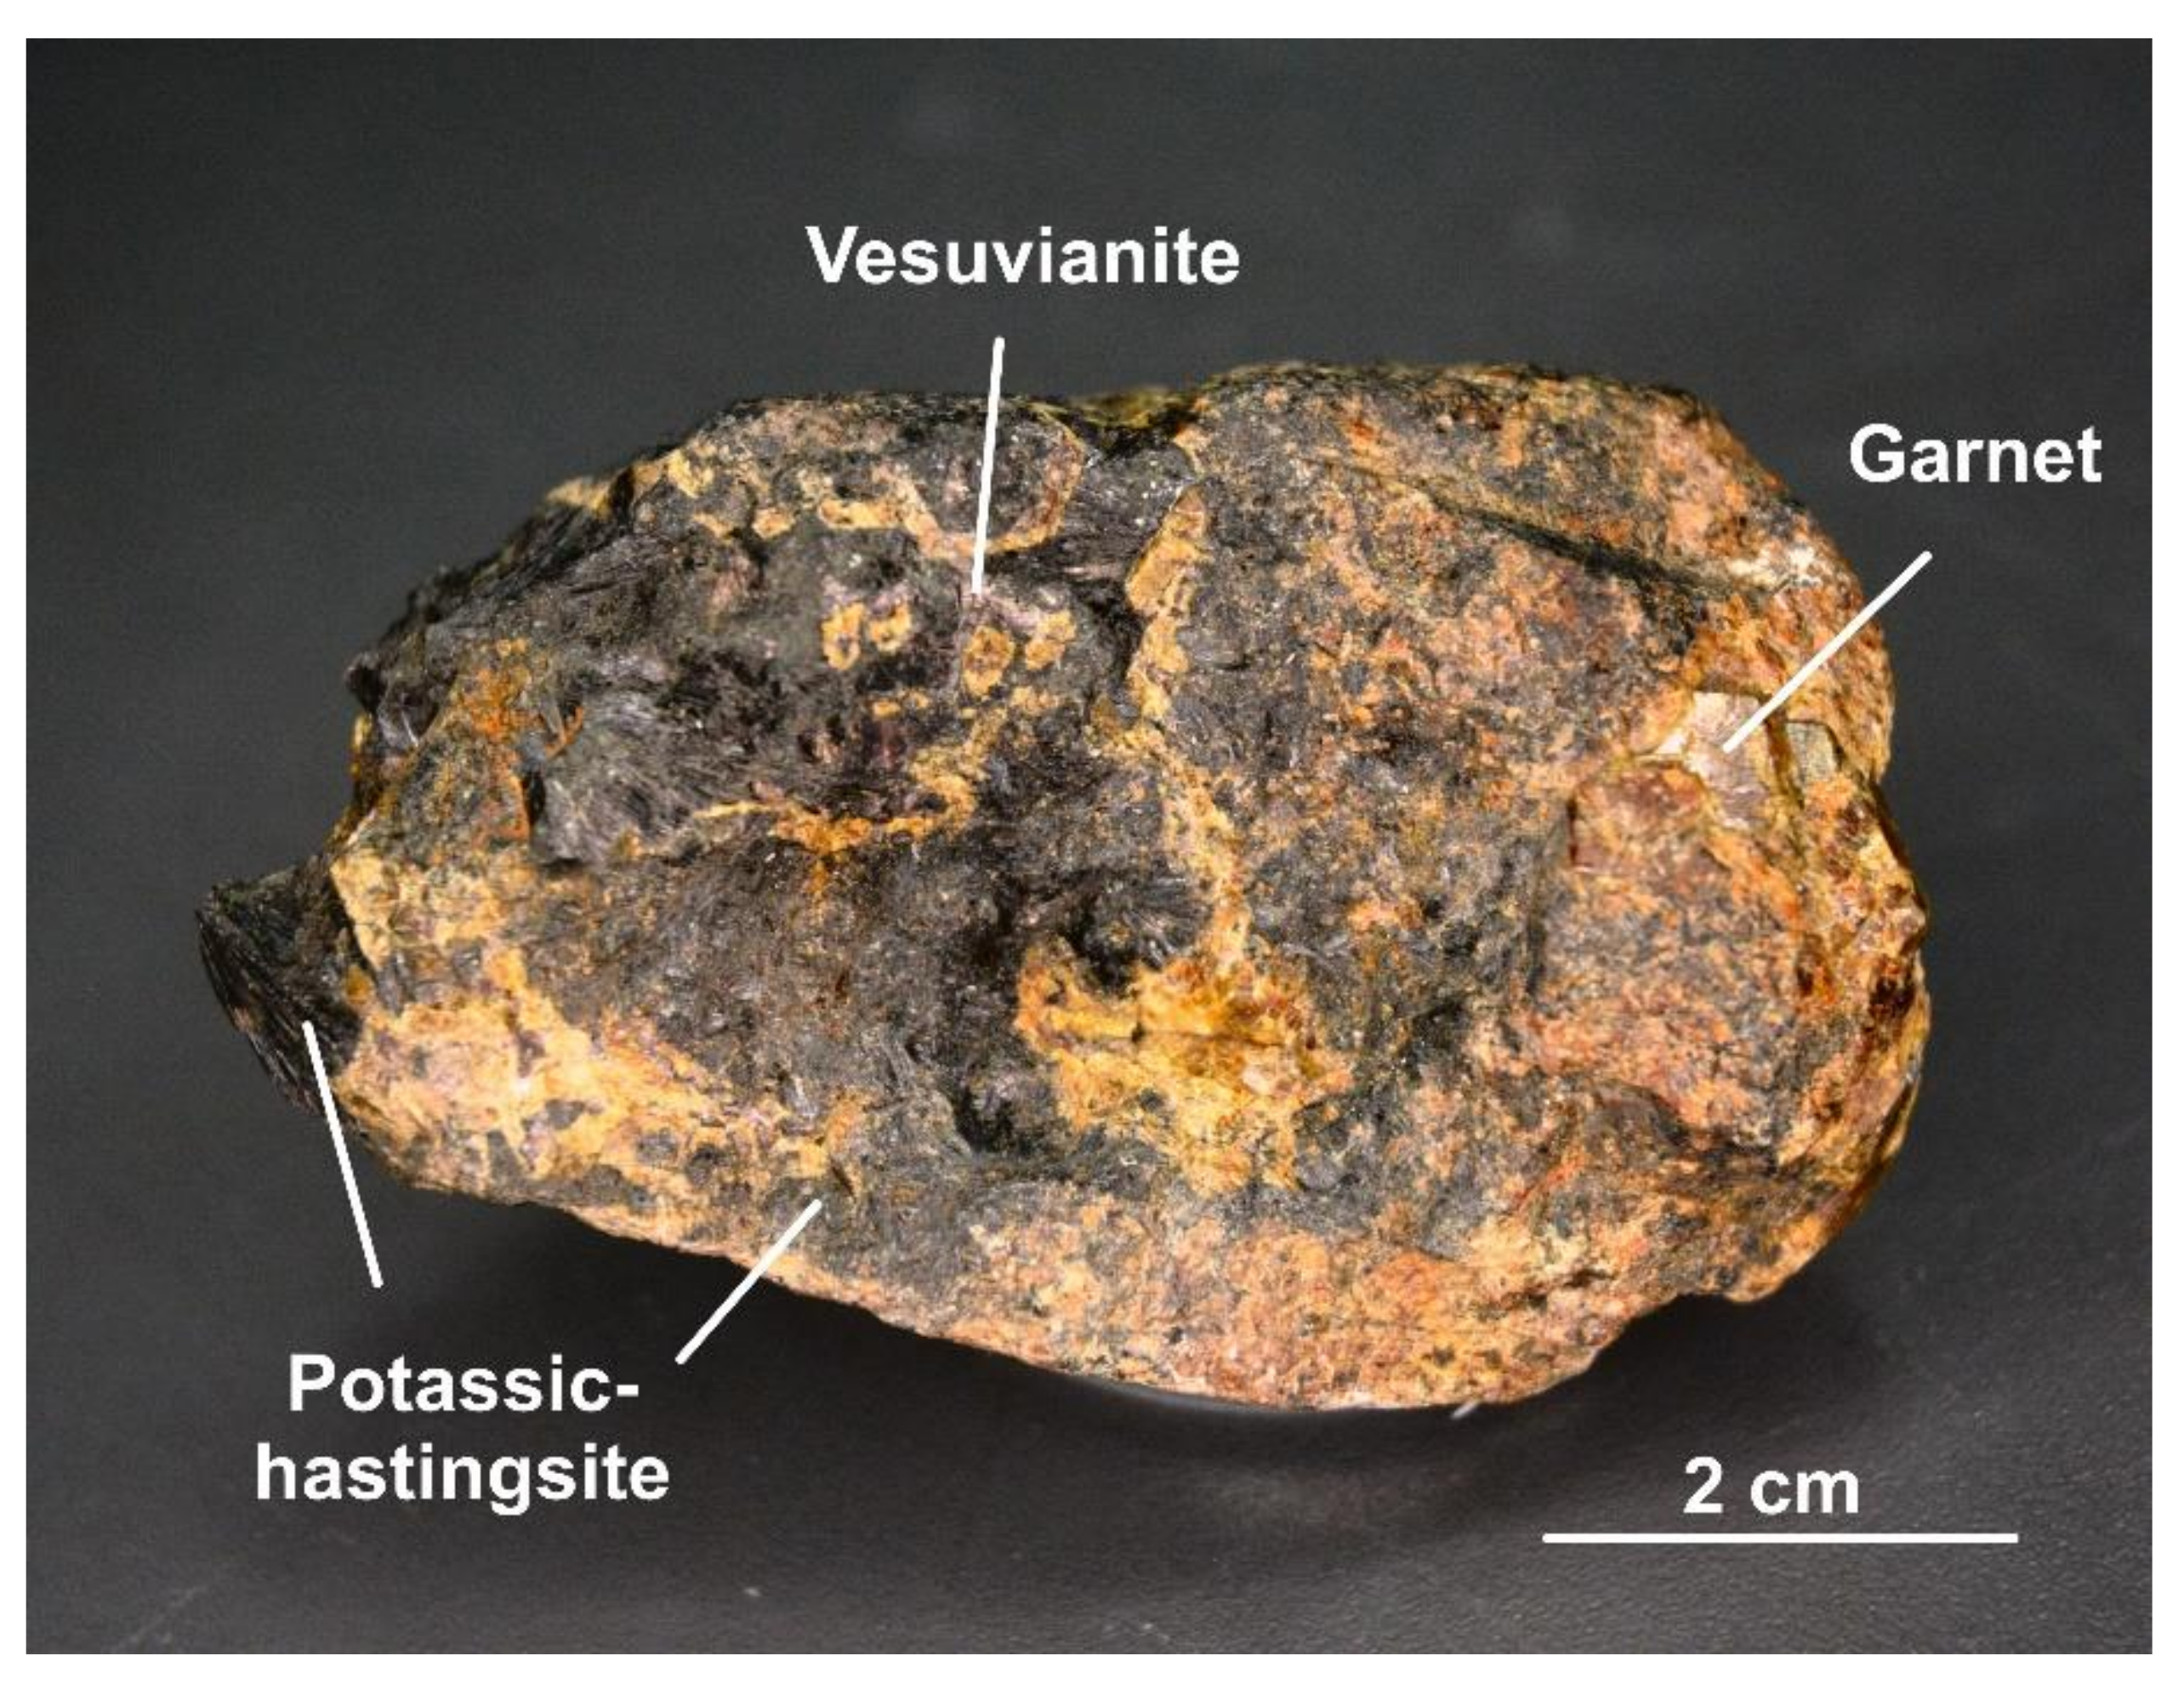
2.1. Sample Description
2.2. Chemical Analysis
2.3. Structural Analysis
2.4. Spectroscopy Study
3. Results
3.1. Petrographic Analysis
3.2. Chemical Composition and Structure Description
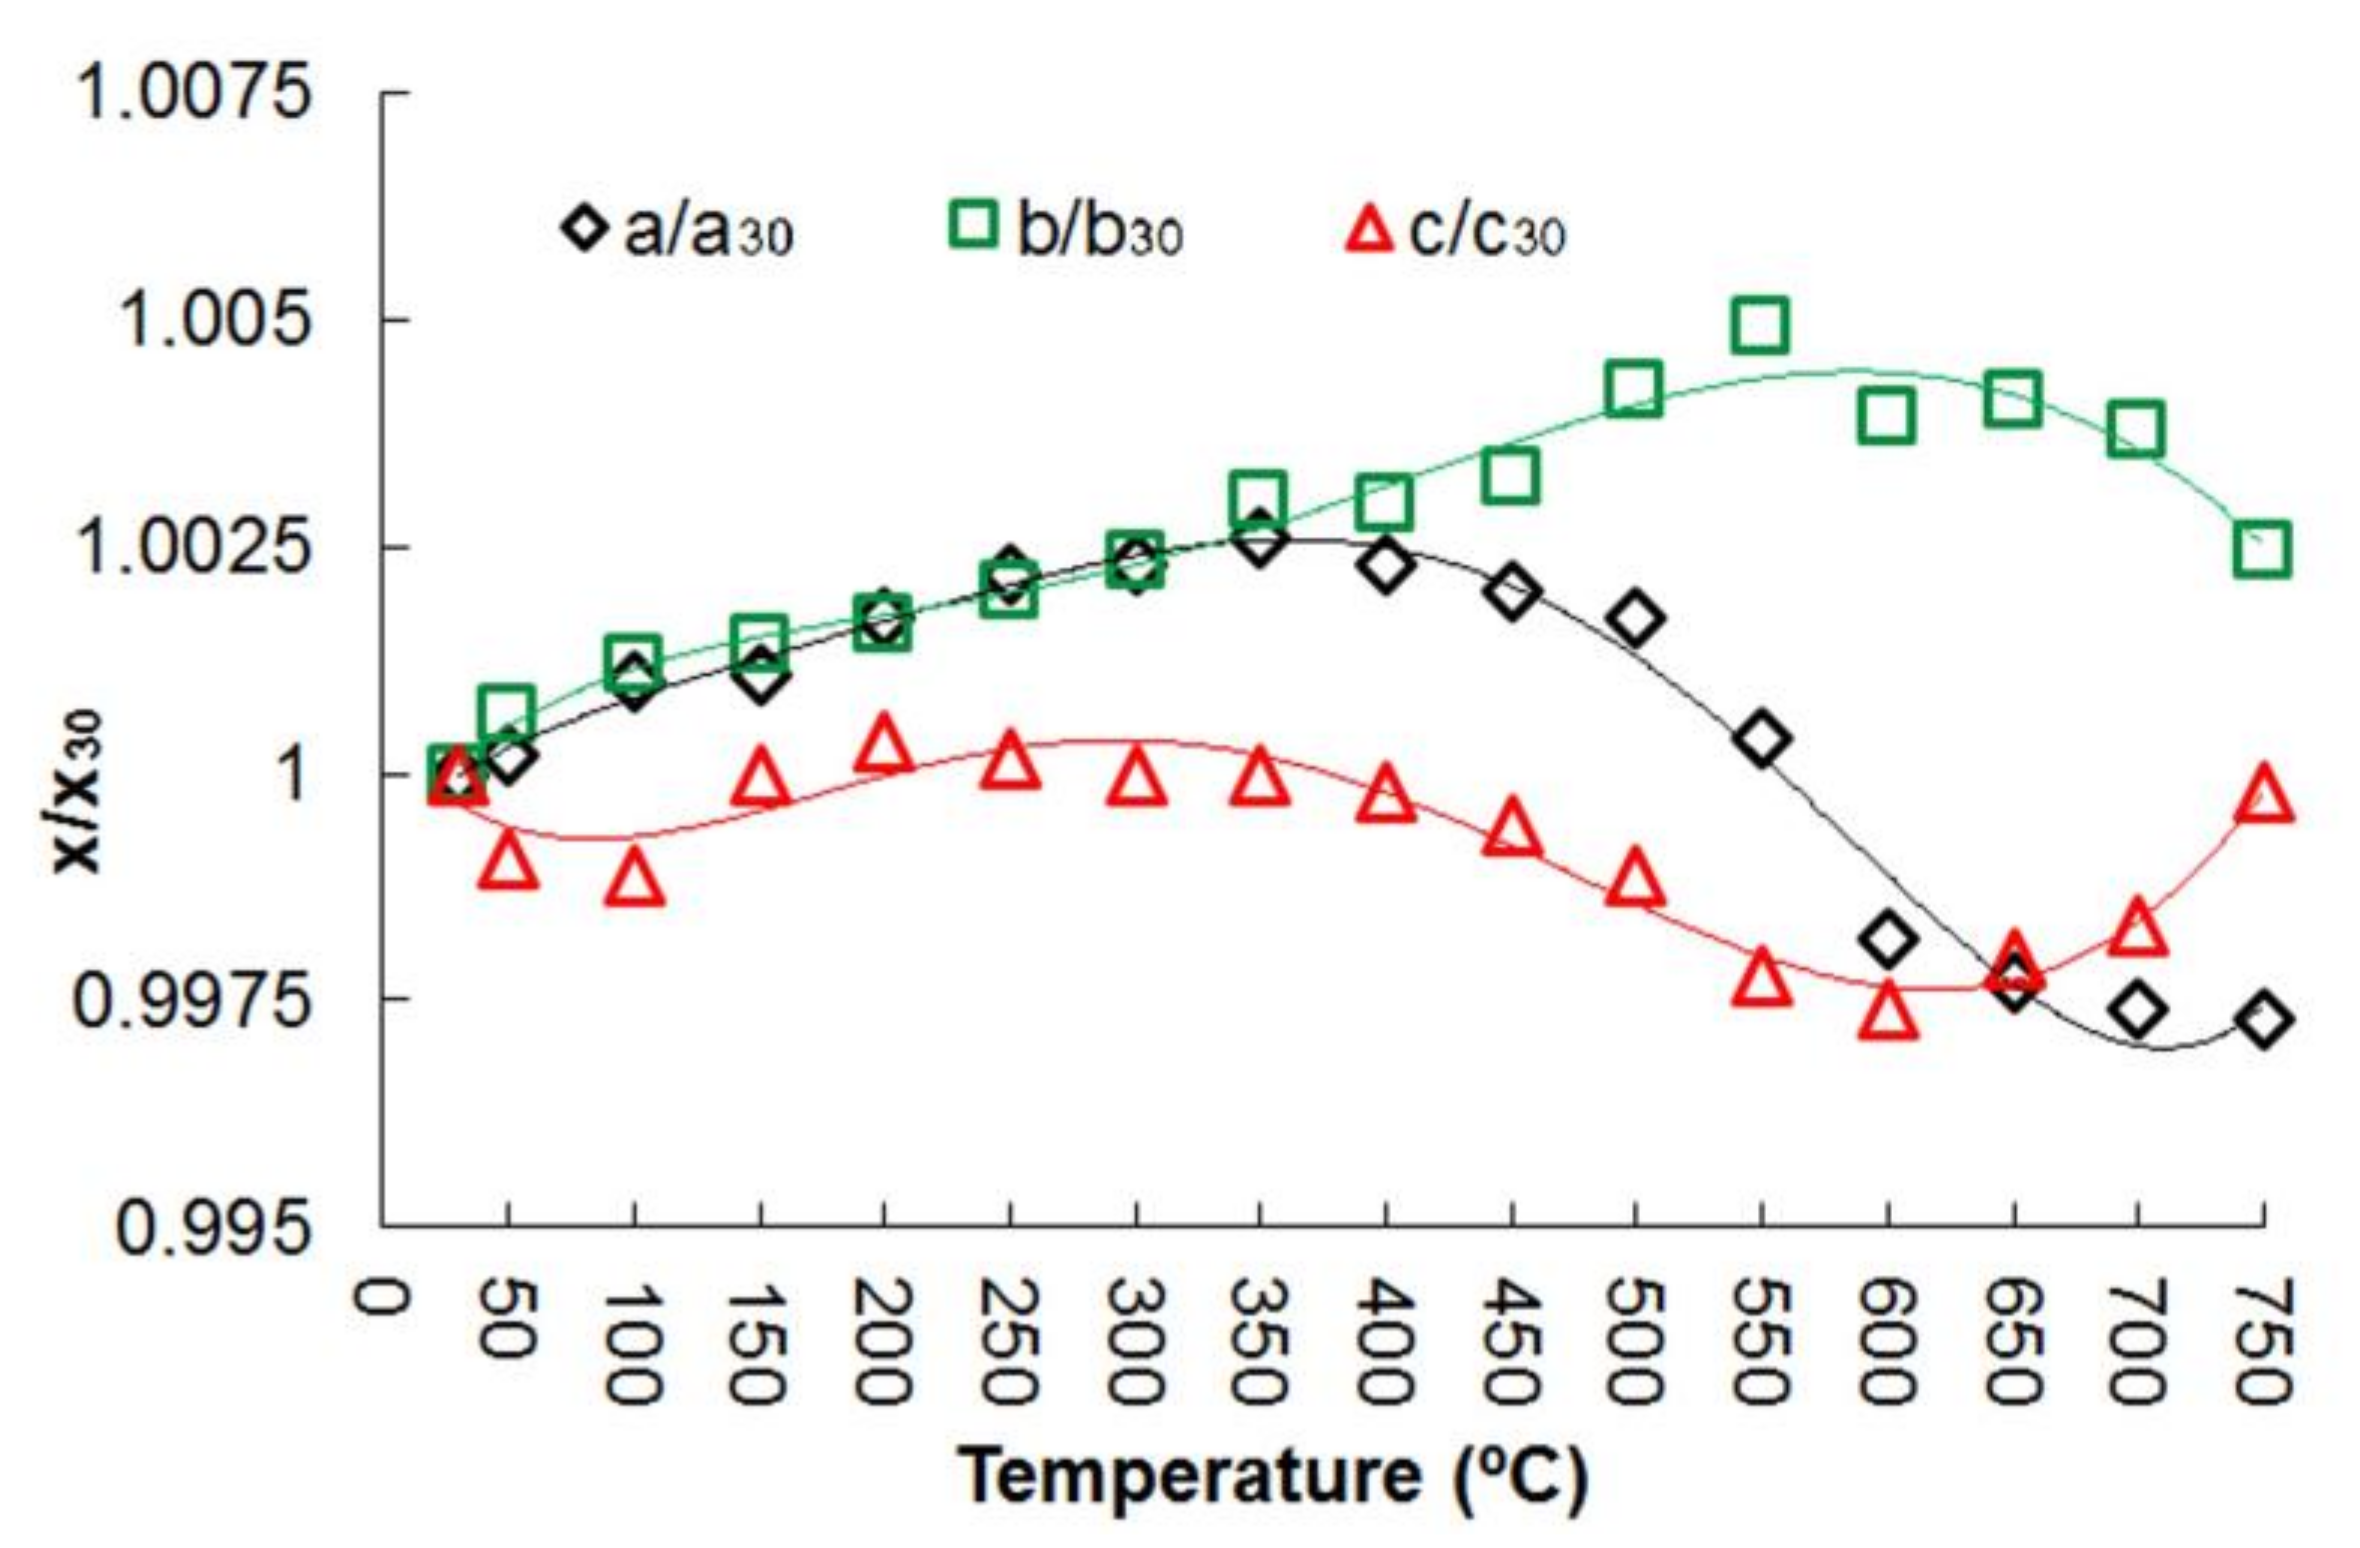
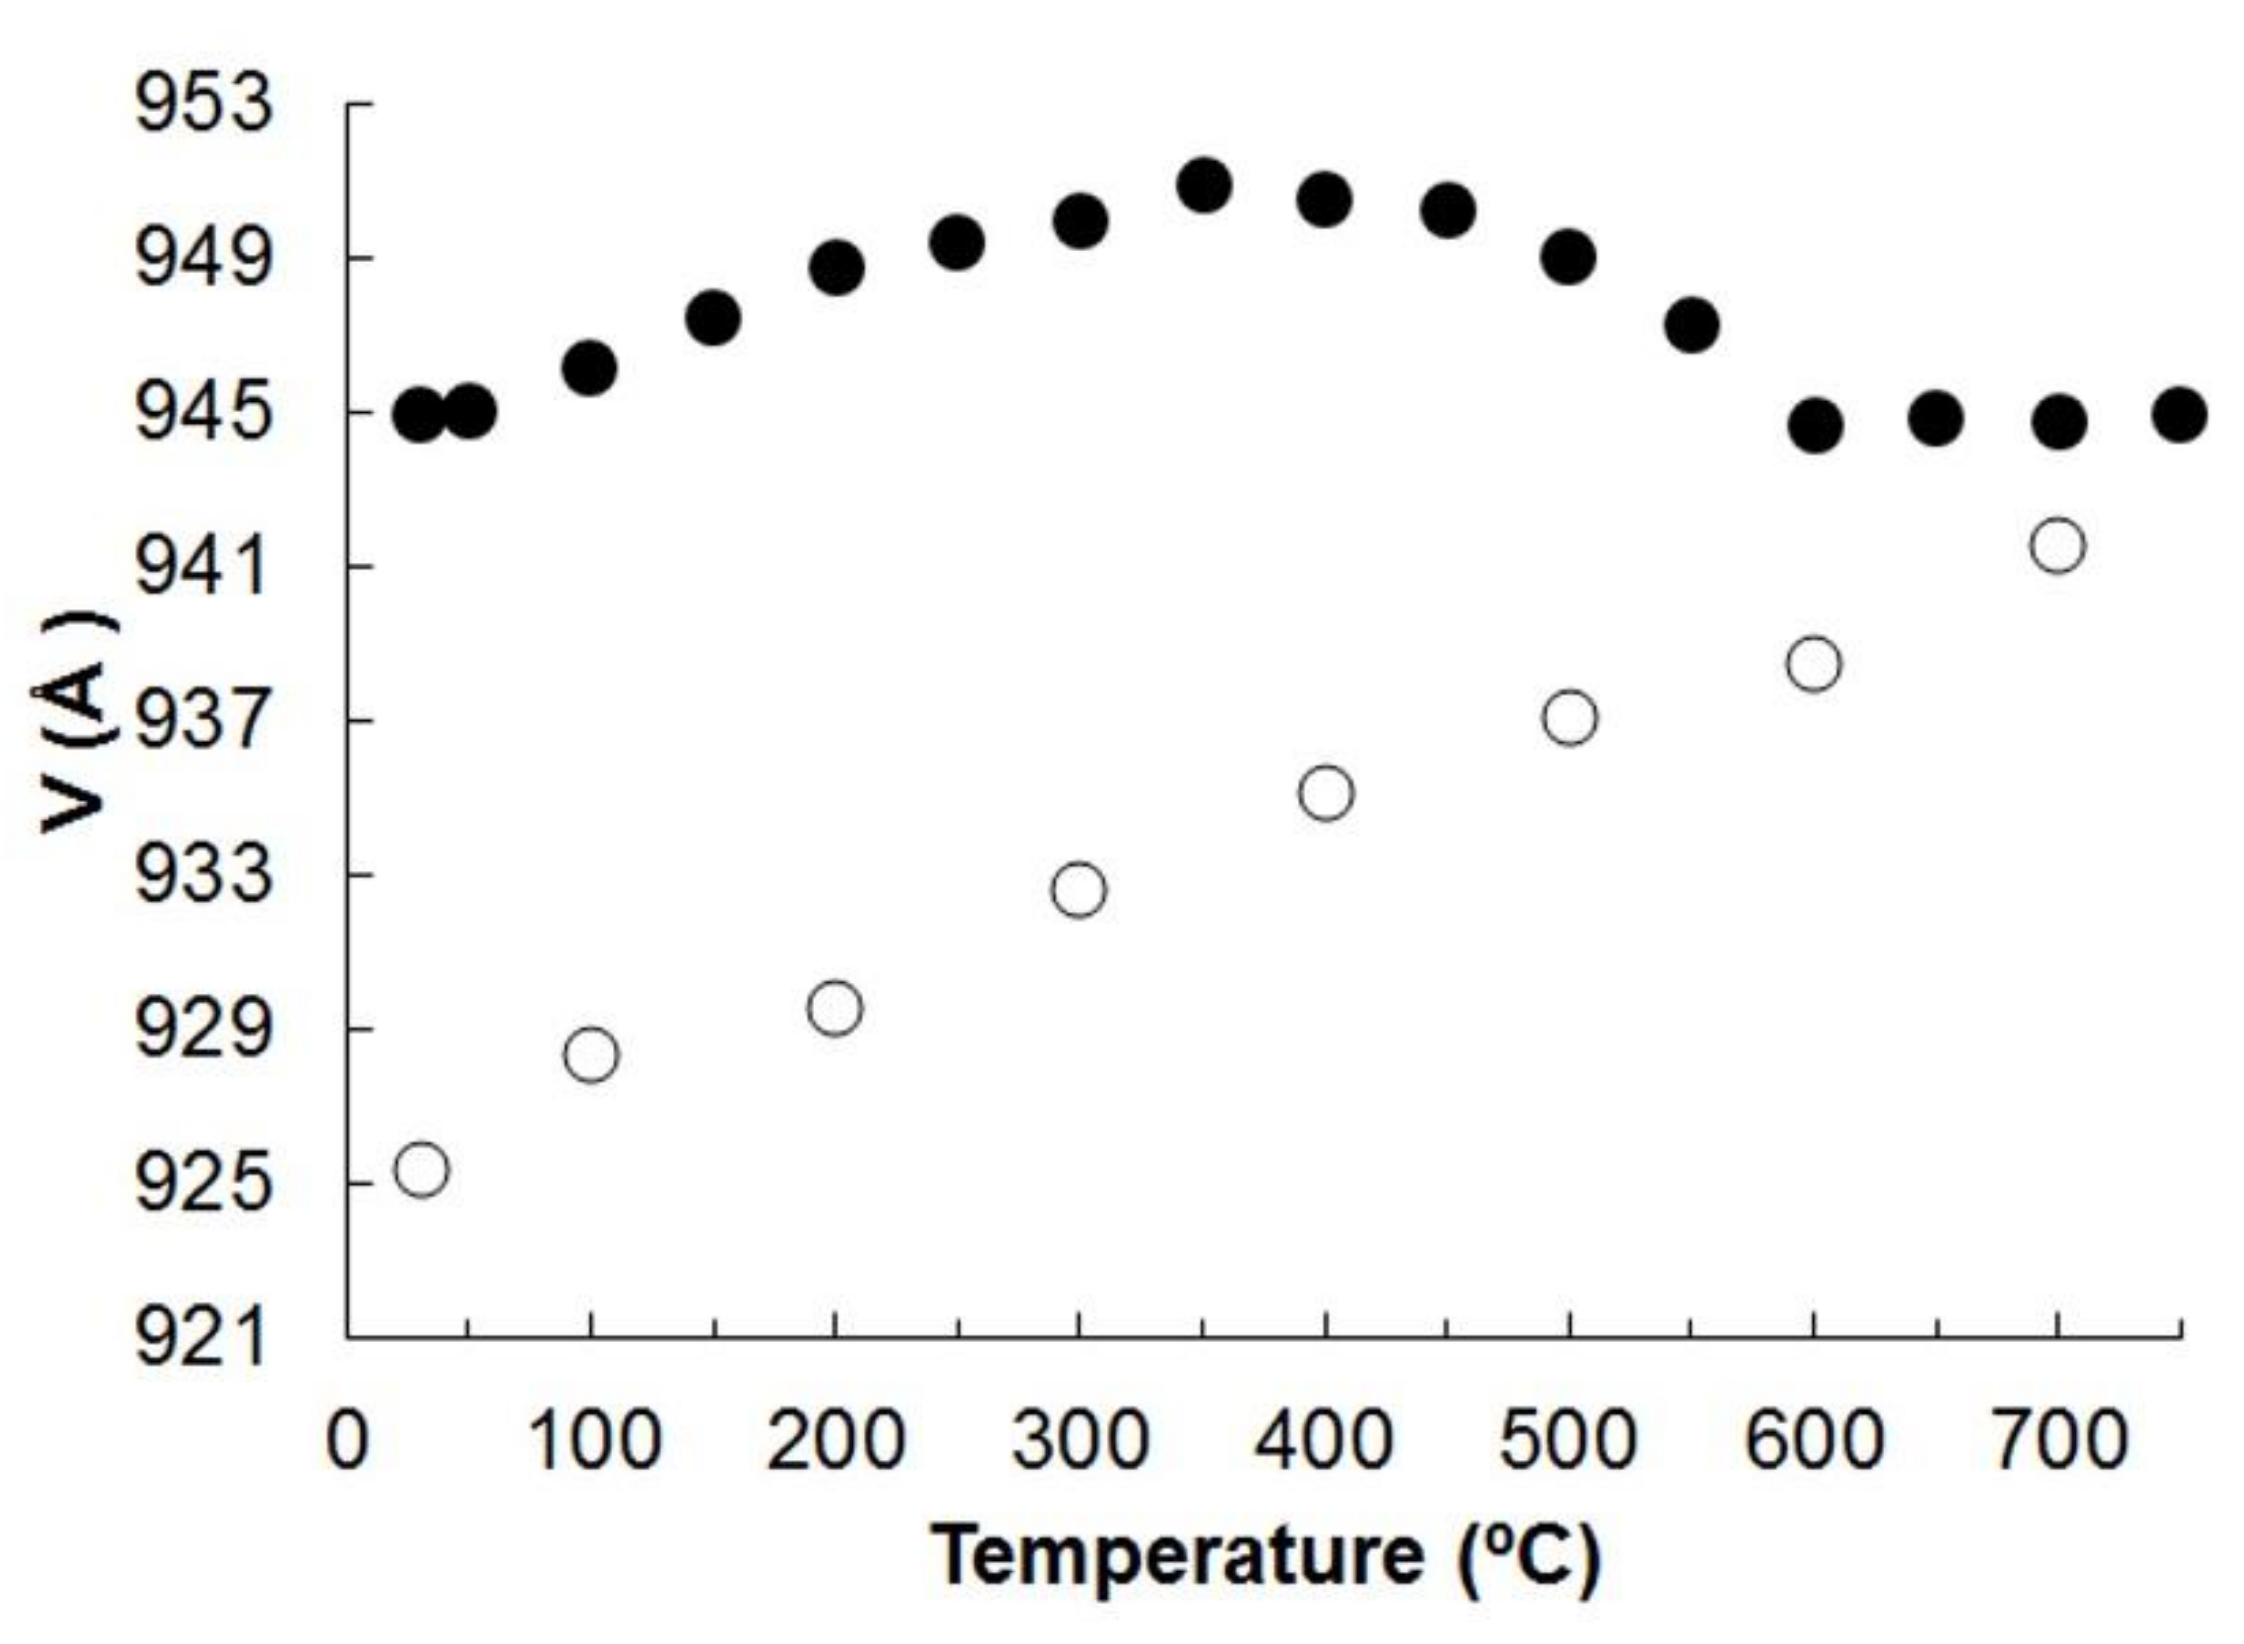
3.3. In Situ HTXRPD
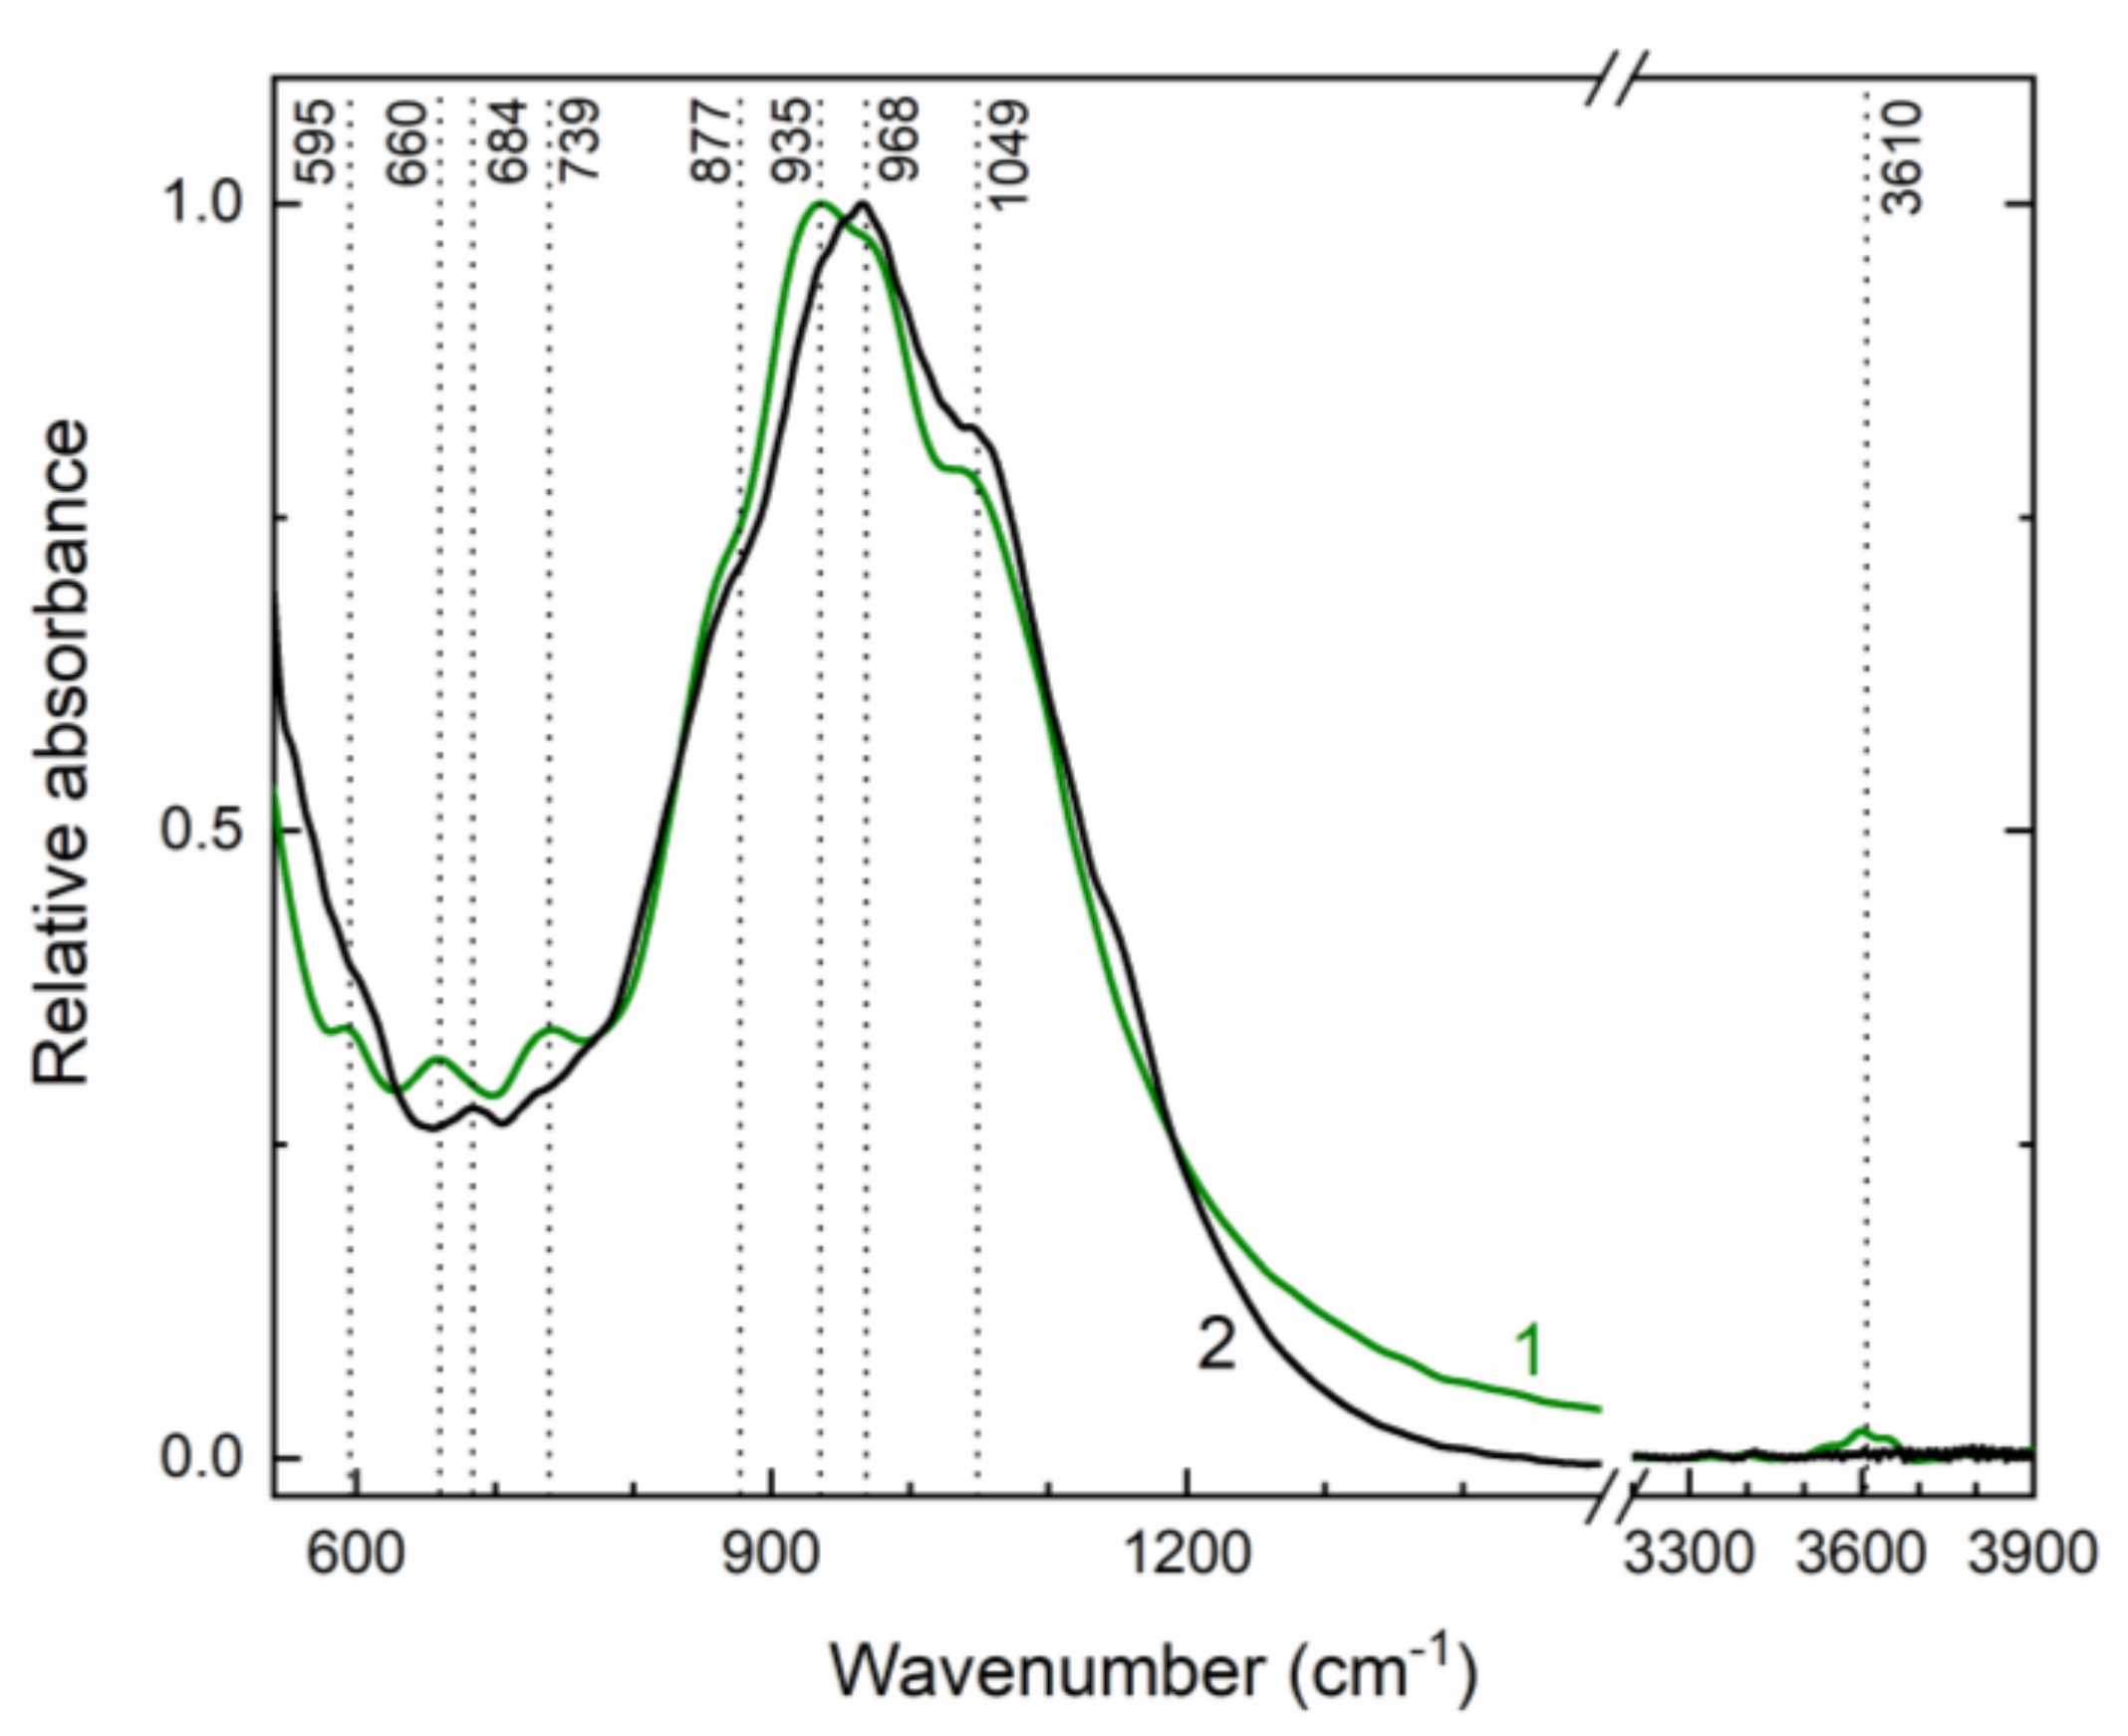
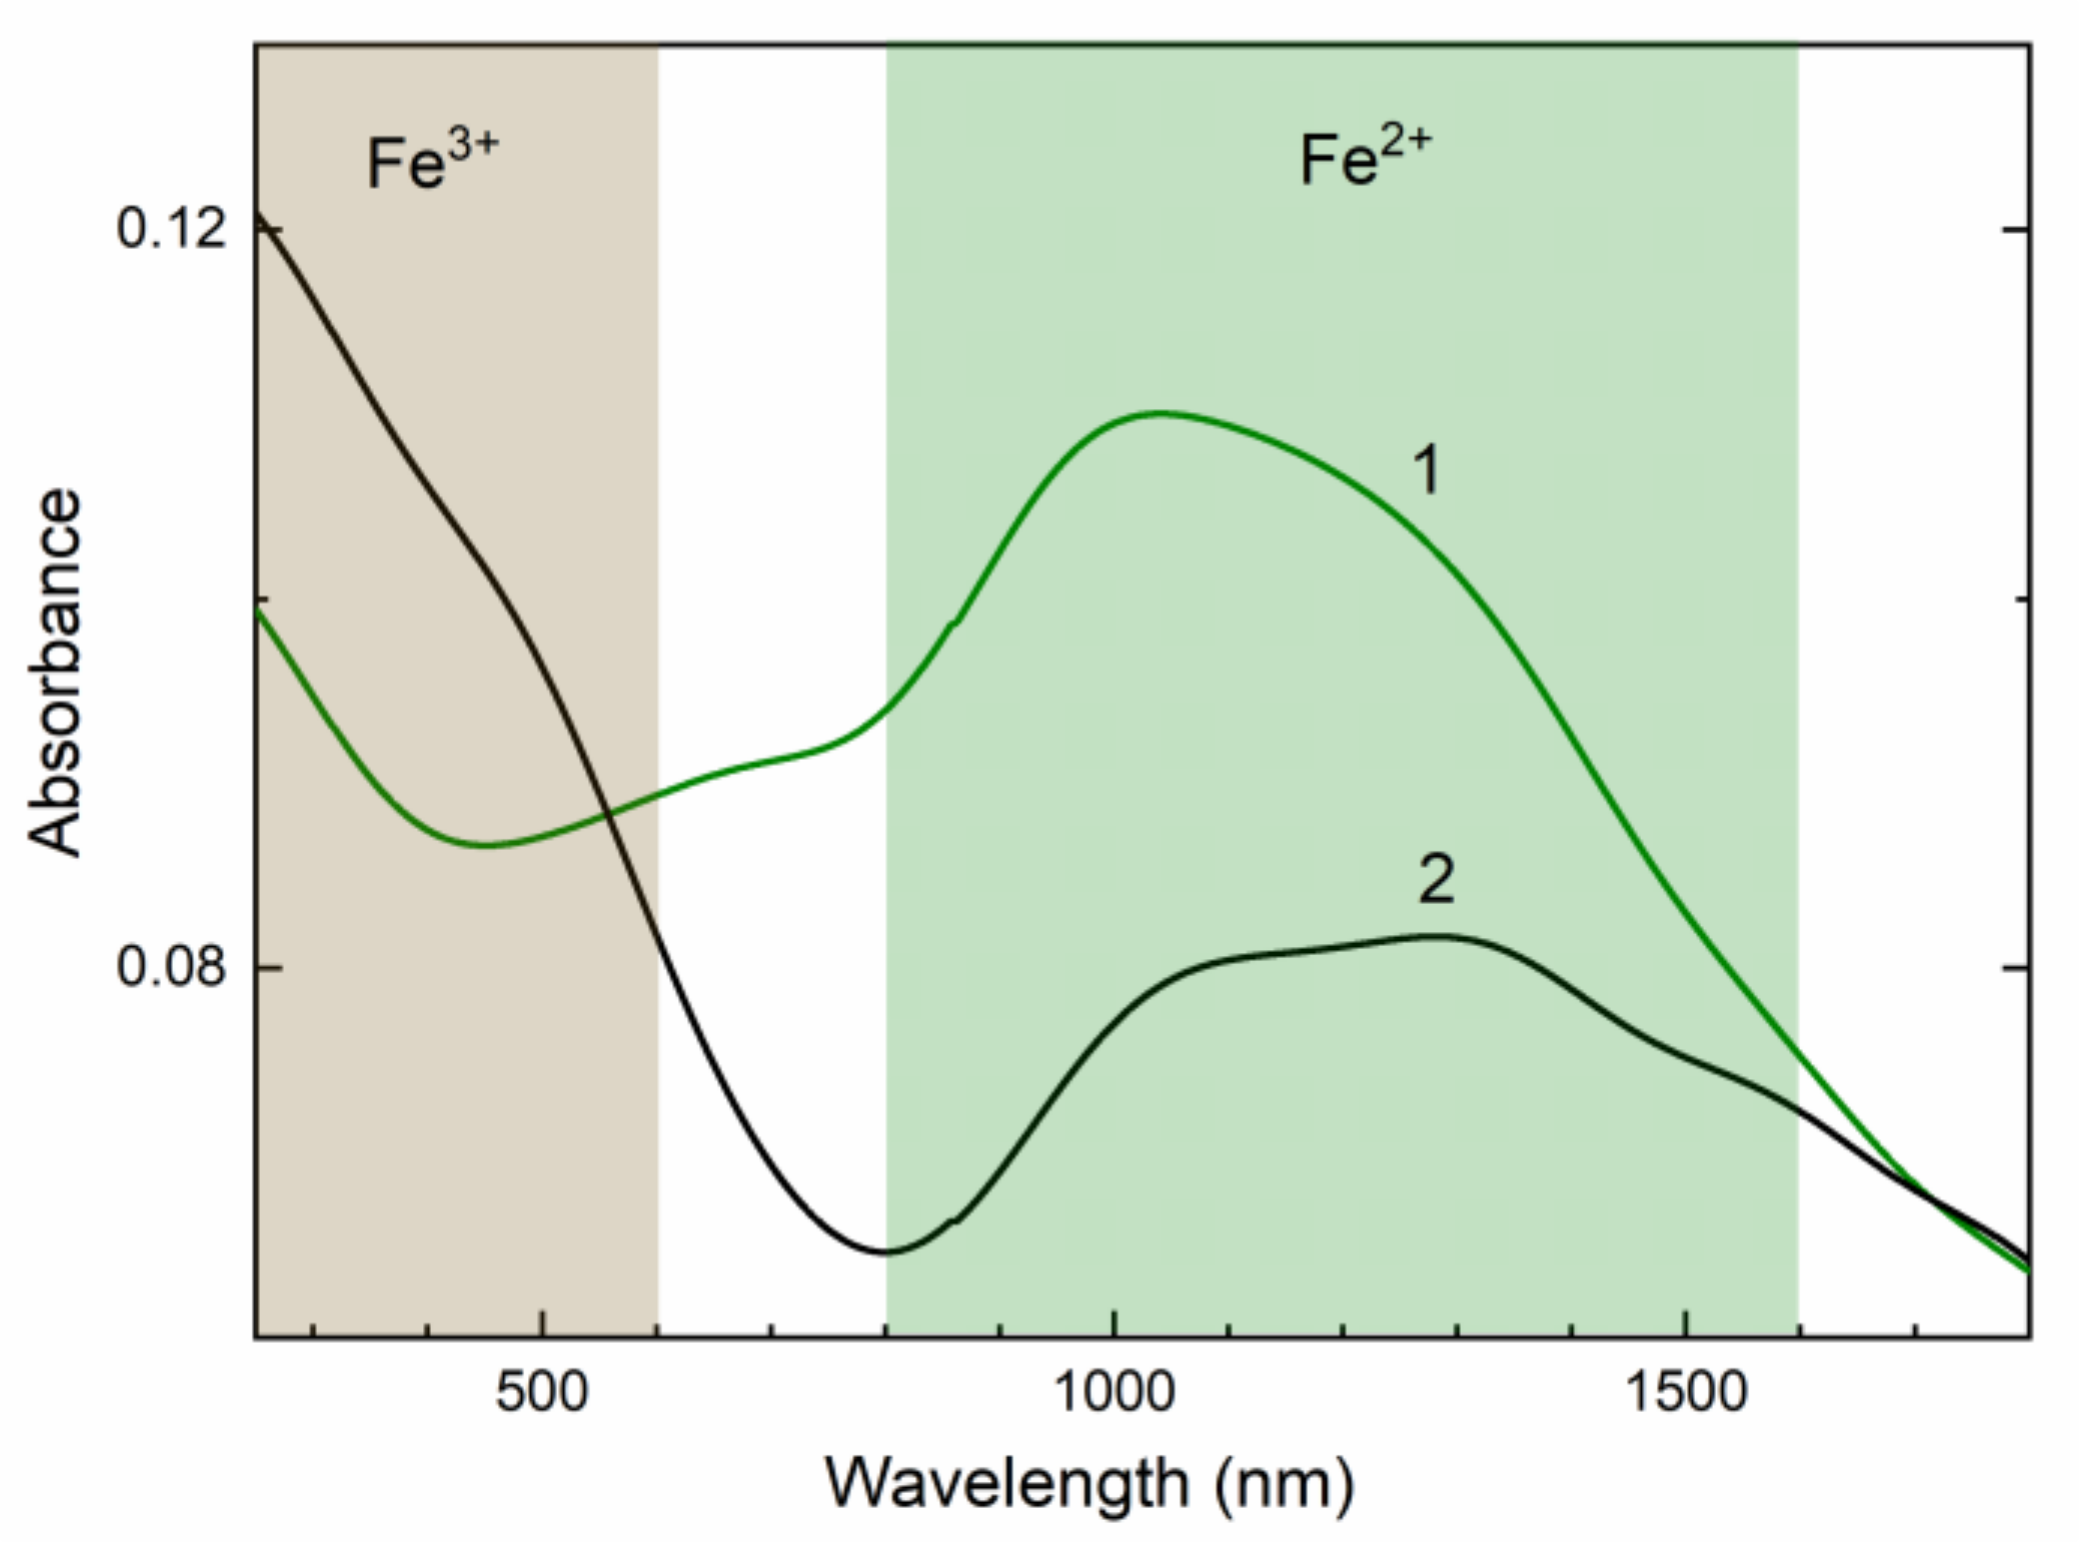
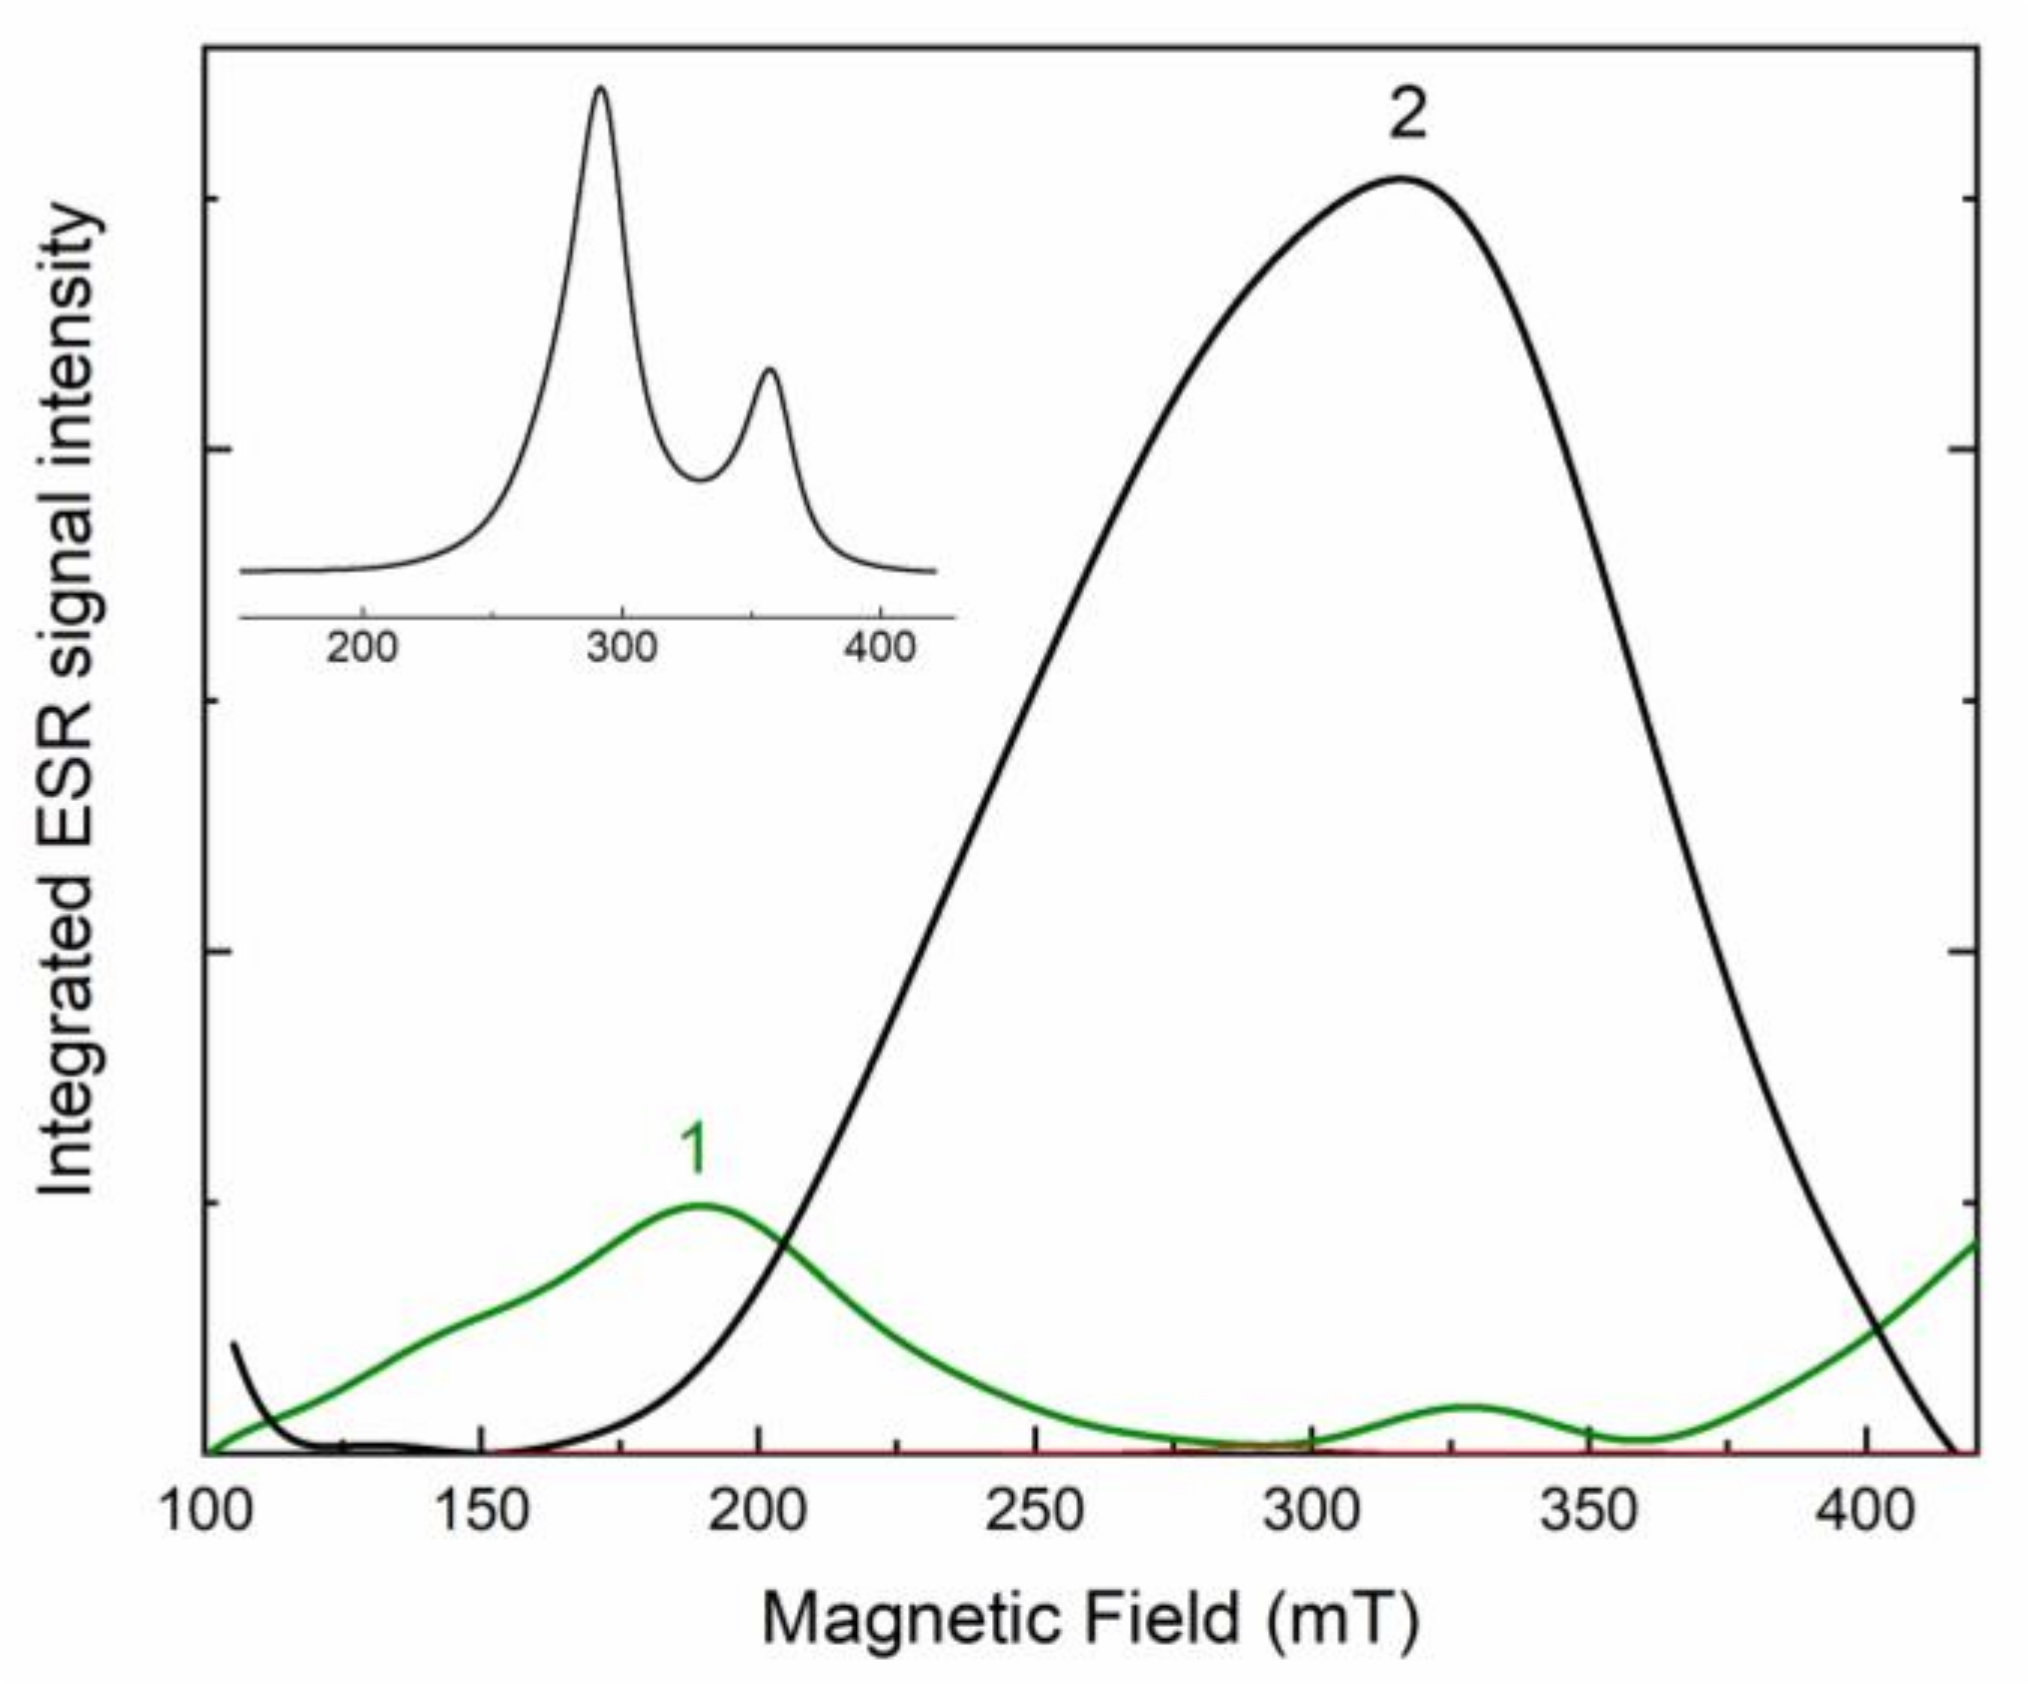
3.4. Spectroscopy
4. Discussion
4.1. Chrystal Chemical Features
4.2. Thermal Behavior and Spectroscopic Properties
5. Conclusions
Supplementary Materials
Author Contributions
Funding
Data Availability Statement
Acknowledgments
Conflicts of Interest
References
- Hawthorne, F.C.; Oberti, R. Classification of the amphiboles. Rev. Mineral. Geochem. 2007, 67, 55–88. [Google Scholar] [CrossRef]
- Leake, B.E.; Woolley, A.R.; Arps, C.E.S.; Birch, W.D.; Gilbert, M.C.; Grice, J.D.; Hawthorne, F.C.; Kato, A.; Kisch, H.J.; Krivovichev, V.G.; et al. Nomenclature of amphiboles: Report of the Subcommittee on amphiboles of the International Mineralogical Association Commission on New Minerals and Mineral Names. Mineral. Mag. 1997, 61, 295–321. [Google Scholar] [CrossRef]
- Hawthorne, F.C.; Oberti, R.; Harlow, G.E.; Maresch, W.V.; Martin, R.F.; Schumacher, J.C.; Welch, M.D. Nomenclature of the amphibole supergroup. Am. Mineral. 2012, 97, 2031–2048. [Google Scholar] [CrossRef]
- Adams, F.D.; Harrington, B.J. On a new alkali hornblende and a titaniferous andradite from the nepheline-syenite of Dungannon, Hastings County, Ontario. Am. J. Sci. 1896, 151, 210–218. [Google Scholar]
- Makino, K.; Tomita, K. Cation distribution in the octahedral sites of hornblendes. Am. Mineral. 1989, 74, 1097–1105. [Google Scholar]
- Makino, K.; Tomota, K.; Suwa, K. Effect of chlorine on the crystal structure of a chlorine-rich hastingsite. Mineral. Mag. 1993, 57, 677–685. [Google Scholar] [CrossRef] [Green Version]
- Dick, L.A.; Robinson, G.W. Chlorine-bearing potassian hastingsite from a sphalerite skarn in southern Yukon. Can. Mineral. 1979, 17, 25–26. [Google Scholar]
- Suwa, K.; Enami, M.; Horiuchi, T. Chlorine-rich potassium hastingsite from West Ongul Island, Lutzow-Holm Bay, East Antarctica. Mineral. Mag. 1987, 51, 709–714. [Google Scholar] [CrossRef]
- Žáček, V. Potassium hastingsite and potassichhastingsite from garnet—Hedenbergite skarn at Vlastějovice, Czech Republic. Neues Jahrb. Mineral.-Abh. 2007, 184, 161–168. [Google Scholar] [CrossRef]
- Ren, G.; Li, G.; Shi, J.; Gu, X.; Fan, G.; Yu, A.; Liu, Q.; Shen, G. Potassic-hastingsite, KCa2(Fe2+4Fe3+)(Si6Al6)O22(OH)2, from the Keshiketeng Banner, Inner Mongolia, China: Description of the neotype and its implication. Mineral. Petrol. 2020, 114, 403–412. [Google Scholar] [CrossRef]
- Lupulescu, M.V.; Rakovan, J.; Dyar, M.D.; Robinson, G.W.; Hughes, J.M. Fluoro-potassichastingsite from the Greenwood mine, Orange county, New York: A new end-member calcic amphibole. Can. Mineral. 2009, 47, 909–916. [Google Scholar] [CrossRef]
- Krutov, G.A. Dashkesanite—A new chlorine-containing amphibole of the hastingsite group. Izvest. AN USSR Geol. Ser. 1936, 2–3, 341–373. (In Russian) [Google Scholar]
- Pekov, I.V.; Chukanov, N.V.; Nefedova, M.E.; Pushcharovsky, D.Y.; Rastsvetaeva, R.K. Chloro-potassichastingsite (K,Na)Ca2(Mg,Fe2+)4Fe3+[Si6Al2O22](OH,Cl)2: Revalidation and the new name of dashkesanite. Zap. RMO 2005, 6, 31–36. (In Russian) [Google Scholar]
- Billings, M. The chemistry, optics and genesis of the hastingsite group of amphiboles. Am. Mineral. 1928, 13, 287–296. [Google Scholar]
- Walitzi, E.M.; Walter, F. Verfeinerung der keistallstruktur eines basaltischen magnesio-hastingsites. Z. Kristallogr. 1981, 156, 197–208. (In German) [Google Scholar] [CrossRef]
- Martin, R.F.; Alarie, É.; Minarik, W.G.; Wáczek, Z.; McCammon, C.A. Titanium-rich magnesio-hastingsite macrocrysts in a camptonite dike, Lafarge quarry, Montreal island, Québec: Early crystallization in a pseudo-unary system. Can. Mineral. 2016, 54, 65–78. [Google Scholar] [CrossRef]
- Shiraishi, K.; Oba, T.; Suzuki, M.; Ishikawa, K. Subsilic magnesian potassium-hastingsite from the Prince Olav Coast, East Antarctica. Mineral. Mag. 1994, 58, 621–627. [Google Scholar] [CrossRef]
- Korinevsky, V.G.; Korinevsky, E.V. Potassic-magnesiohastingsite (K,Na)Ca2(Mg,Fe2+)4(Fe3+,Al,Ti)[Si6Al2O22](OH,Cl)2—The new mineral species of amphiboles. Zap. RMO 2006, 2, 49–57. (In Russian) [Google Scholar]
- Bojar, H.-P.; Walter, F. Fluoro-magnesiohastingsite from Dealul Uroi (Hunedoara county, Romania): Mineral data and crystal structure of a new amphibole end-member. Eur. J. Mineral. 2006, 18, 503–508. [Google Scholar] [CrossRef] [Green Version]
- Aksenov, S.; Chukanov, N.V. The crystal structure of a fluorine-dominant titanium calcium amphibole from the Eifel paleovolcanic area, Germany. Z. Kristallogr. 2016, 231, 385–390. [Google Scholar] [CrossRef]
- Zaitsev, A.N.; Avdontseva, E.Y.; Britvin, S.N.; Demény, A.; Homonnay, Z.; Jeffries, T.E.; Keller, J.; Krivovichev, V.G.; Markl, G.; Platonova, N.V.; et al. Oxo-magnesio-hastingsite, NaCa2(Mg2Fe3+3)(Al2Si6)O22O2, a new anhydrous amphibole from the Deeti volcanic cone, Gewgory rift, northern Tanzania. Mineral. Mag. 2013, 77, 2773–2792. [Google Scholar] [CrossRef]
- Oberti, R.; Zema, M.; Boiocchi, M.; Tarantino, S.; Welch, M.D. HT-induced processes in monoclinic and orthorhombic amphiboles and their effects on thermodynamic models. Geophys. Res. Abstr. EGU2011 2011, 13, 11183. [Google Scholar]
- Tribaudino, M.; Hovis, G.L.; Almer, C.; Leaman, A. Thermal expansion of minerals in the amphibole supergroup. Am. Mineral. 2022, in press. [Google Scholar] [CrossRef]
- Drugov, G.M.; Sizykh, A.I.; Bulanov, V.A. Geological models of mica-bearing junction of the Slyudanskaya and Sogdioddonskaya groups of deposits in the Mamsk province. Bull. Irkutsk State Univ. Ser. Earth Sci. 2015, 13, 58–77. [Google Scholar]
- Whitney, D.L.; Evans, B.W. Abbreviations for names of rock-forming minerals. Am. Mineral. 2010, 95, 185–187. [Google Scholar] [CrossRef]
- Verkaeren, J. Les grenats biréfringents des skarns à magnétite de San Leone (Sardaigne SW). Bull. Soc. Franc. Mineral. Cristallogr. 1971, 94, 492–499. (In French) [Google Scholar] [CrossRef]
- Lessing, P.; Standish, R.P. Zoned garnet from Crested Butte, Colorado. Am. Mineral. 1973, 58, 840–842. [Google Scholar]
- Takeuchi, Y.; Haga, N. Optical anomaly and structure of silicate garnets. Proc. Jpn. Acad. 1976, 52, 228–231. [Google Scholar] [CrossRef]
- Yang, S.-Y.; Zhang, R.-X.; Jiang, S.-Y.; Xie, J. Electron probe microanalysis of variable oxidation state oxides: Protocol and pitfalls. Geostand. Geoanal. Res. 2018, 42, 131–137. [Google Scholar] [CrossRef]
- Finkelshtein, A.L.; Chubarov, V.M. X-ray fluorescence determination of FeO/Fe2O3tot ratio in igneous rocks. X-ray Spectrom. 2010, 39, 17–21. [Google Scholar] [CrossRef]
- Chubarov, V.M.; Finkelshtein, A.L. Determination of divalent iron content in igneous rocks of ultrabasic, basic and intermediate compositions by a wavelength-dispersive X-ray fluorescence spectrometric method. Spectrochim. Acta B 2015, 107, 110–114. [Google Scholar] [CrossRef]
- Chubarov, V.M.; Amosova, A.A.; Finkelshtein, A.L. Determination of iron and sulfur valence state in coal ashes by wavelength-dispersive X-ray fluorescence spectrometric technique. Spectrochim. Acta B 2020, 163, 105745. [Google Scholar] [CrossRef]
- Chubarov, V.M.; Finkelshtein, A.L.; Suvorova, L.F.; Kostrovitsky, S.I. Determination of iron valence state in picroilmenites by electron probe microanalysis and x-ray fluorescence analysis. Zap. RMO 2012, 141, 83–91. (In Russian) [Google Scholar]
- Bruker APEX2. Version 2014.11-0; Bruker AXS Inc.: Madison, WI, USA, 2014. [Google Scholar]
- CrysAlis, PRO. Version 1.171.35.21; Agilent Technologies Ltd.: Yarnton, UK, 2018. [Google Scholar]
- Betteridge, P.W.; Carruthers, J.R.; Cooper, R.I.; Prout, K.; Watkin, D.J. Crystals version 12: Software for guided crystal structure analysis. J. App. Cryst. 2003, 36, 1487. [Google Scholar] [CrossRef]
- Oberti, R.; Hawthorne, F.C.; Cannillo, E.; Cámara, F. long-range order in amphiboles. Rev. Mineral. Geochem. 2007, 67, 125–171. [Google Scholar] [CrossRef]
- Hawthorne, F.; Oberti, R. Amphiboles: Crystal structure. Rev. Mineral. Geochem. 2007, 67, 1–54. [Google Scholar] [CrossRef]
- Momma, K.; Izumi, F. VESTA 3 for three-dimensional visualization of crystal, volumetric and morphology data. J. Appl. Cryst. 2011, 44, 1272–1276. [Google Scholar] [CrossRef]
- Bruker: Topas V4. General Profile and Structure Analysis Software For Powder Diffraction Data; Bruker AXS Inc.: Karlsruhe, Germany, 2008. [Google Scholar]
- Langreiter, T.; Kahlenberg, V. TEV—A program for the determination of the thermal expansion tensor from diffraction data. Crystals 2015, 5, 143–153. [Google Scholar] [CrossRef]
- Locock, A.J. An Exel spreadsheet to classify chemical analyses of amphiboles following the IMA 2012 recommendations. Comput. Geosci. 2014, 62, 1–11. [Google Scholar] [CrossRef]
- Robinson, K.; Gibbs, G.V.; Ribbe, P.H. Quadratic elongation: A quantitative measure of distortion in coordination polyhedra. Science 1971, 172, 567–570. [Google Scholar] [CrossRef]
- Renner, B.; Lehmann, G. Correlation of angular and bond length distortions in TO4 units in crystals. Z. Kristallogr. 1986, 175, 43–59. [Google Scholar] [CrossRef]
- Gagnè, O.C.; Hawthorne, F.C. Comprehensive derivation of bond-valence parameters for ion pairs involving oxygen. Acta Cryst. 2015, B71, 562–578. [Google Scholar] [CrossRef] [PubMed] [Green Version]
- Breese, N.E.; O’Keeffe, M. Bond-valence parameters for solid. Acta Cryst. 1991, B47, 192–197. [Google Scholar] [CrossRef]
- Oberti, R.; Ungaretti, L.; Cannillo, E.; Hawthorne, F. The mechanism of Cl incorporation in amphibole. Am. Mineral. 1993, 78, 746–752. [Google Scholar]
- Oberti, R.; Ungaretti, L.; Cannillo, E.; Hawthorne, F.; Memmi, I. Temperature-dependent Al order-disorder in the tetrahedral double chain of C2/m amphiboles. Eur. J. Mineral. 1995, 7, 1049–1063. [Google Scholar] [CrossRef]
- Oberti, R.; Boiocchi, M.; Zema, M. Thermoelasticity, cation exchange, and deprotonation in Fe-rich holmquistite: Toward a crystal-chemical model for the high-temperature behavior of orthorhombic amphiboles. Am. Mineral. 2019, 104, 1829–1839. [Google Scholar] [CrossRef]
- Oberti, R.; Boiocchi, M.; Zema, M.; Hawthorne, F.; Redhammer, G.; Susta, U.; Della Ventura, G. The high-temperature behavior of riebeckite: Expansivity, deprotonation, selective Fe oxidation and a novel cation disordering scheme for amphiboles. Eur. J. Mineral. 2018, 30, 437–449. [Google Scholar] [CrossRef]
- Della Ventura, G.; Mihailova, B.; Susta, U.; Castelli Guidi, M.; Marcelli, A.; Schlüter, J.; Oberti, R. The dynamics of Fe oxidation in riebeckite: A model for amphiboles. Am. Mineral. 2018, 103, 1103–1111. [Google Scholar] [CrossRef]
- Oberti, R.; Boiocchi, M.; Zema, M.; Della Ventura, G. Synthetic potassic-ferro-richterite: 1. Composition, crystal structure refinement, and HT behavior by in operando single-crystal X-ray diffraction. Can. Mineral. 2016, 54, 353–369. [Google Scholar] [CrossRef]
- Della Ventura, G.; Susta, U.; Bellatreccia, F.; Marcelli, A.; Redhammer, G.; Oberti, R. Deprotonation of Fe-domonant amphiboles: Single-crystal HT-FTIR spectroscopic studies of synthetic potassic-ferro-richterite. Am. Mineral. 2017, 102, 117–125. [Google Scholar] [CrossRef]
- Iezzi, G.; Della Ventura, G.; Hawthorne, F.C.; Pedrazzi, G.; Robert, J.L.; Novembre, D. The (Mg,Fe2+) substitution in ferri-clinoholmquistite, □ Li2(Mg,Fe2+)3Fe3+2O22(OH)2. Eur. J. Mineral. 2005, 17, 733–740. [Google Scholar] [CrossRef]
- Ishida, K. Assignment of infrared OH-stretching bands in calcic amphiboles through deuteration and heat treatment. Am. Mineral. 2006, 91, 871–879. [Google Scholar] [CrossRef]
- Burns, R.G.; Strens, R.G.J. Infrared study of the hydroxyl bonds in clinoamphiboles. Science 1966, 153, 890–892. [Google Scholar] [CrossRef]
- Della Ventura, G. Recent developments in the synthesis and characterization of amphiboles. Synthesis and crystal chemistry of richterite. Trends Mineral. 1992, 1, 153–192. [Google Scholar]
- Ishida, K. Identification of infrared OH librational bands of talc-willemseite solid solutions and Al (IV)-free amphiboles through deuteration. Mineral. J. 1990, 15, 93–104. [Google Scholar] [CrossRef] [Green Version]
- Sergeeva, A.V.; Zhitova, E.S.; Nuzhdaev, A.A.; Zolotarev, A.A.; Bocharov, V.N.; Ismagilova, R.M. Infrared and Raman spectroscopy of ammoniovoltaite, (NH4)2Fe2+5Fe3+3Al(SO4)12(H2O)18. Minerals 2020, 10, 781. [Google Scholar] [CrossRef]
- Bogdanov, A.; Kaneva, E.; Shendrik, R. New insights into the crystal chemistry of elpidite, Na2Zr[Si6O15]·3H2O and (Na1+yCax□1−x−y)Σ=2Zr[Si6O15]·(3−x)H2O, and ab initio modeling of IR spectra. Materials 2021, 14, 2160. [Google Scholar] [CrossRef] [PubMed]
- Omori, K. Analysis of the infrared absorption spectrum of diopside. Am. Mineral. 1971, 56, 1607–1616. [Google Scholar]
- Burns, R.G. Mineralogical Application of Crystal Field Theory; Cambridge University Press: Cambridge, UK, 1993. [Google Scholar] [CrossRef] [Green Version]
- Goldman, D.S.; Rossman, G.R.; Dollase, W.A. Channel constituents in cordierite. Am. Mineral. 1977, 62, 1144–1157. [Google Scholar]
- Taran, M.N.; Langer, K. Electronic absorption spectra of Fe2+ ions in oxygen-based rock-forming minerals at temperatures between 297 and 600 K. Phys. Chem. Miner. 2001, 28, 199–210. [Google Scholar] [CrossRef]
- Fontana, I.; Lauria, A.; Spinolo, G. Optical absorption spectra of Fe2+ and Fe3+ in aqueous solutions and hydrated crystals. Phys. Status Solidi B 2007, 244, 4669–4677. [Google Scholar] [CrossRef]
- Abragam, A.; Bleaney, B. Electron Paramagnetic Resonance of Transition Ions; Oxford University Press: Oxford, UK, 2012. [Google Scholar]
- Shongwe, M.S.; Al-Rahbi, S.H.; Al-Azani, M.A.; Al-Muharbi, A.A.; Al-Mjeni, F.; Matoga, D.; Gismelseed, A.; Al-Omari, I.; Yousif, A.; Adams, H.; et al. Coordination versatility of tridentate pyridyl aroylhydrazones towards iron: Tracking down the elusive aroylhydrazono-based ferric spin-crossover molecular materials. Dalton Trans. 2012, 41, 2500. [Google Scholar] [CrossRef] [PubMed]
- Skogby, H.; Rossman, G.R. OH– in pyroxene; an experimental study of incorporation mechanisms and stability. Am. Mineral. 1989, 74, 1059–1069. [Google Scholar]
- Burt, D.M. Metasomatic zoning in Ca-Fe-Si exoskarns. In Geochemical Transport And Kinetics; Hofmann, A.W., Giletti, H.S., Yoder, H.S., Jr., Yund, R.A., Eds.; Carnegie Institution of Washington: Washington, DC, USA, 1974; Volume 634, pp. 287–293. [Google Scholar]
- Pertsev, N.N. Skarns as magmatic and as postmagmatic formations. Int. Geol. Rev. 1974, 16, 572–582. [Google Scholar] [CrossRef]
- Burt, D.M. Mineralogy and petrology of skarn deposits. Soc. Ital. Mineral. Petrol. Rend. 1977, 33, 859–873. [Google Scholar]
- Meinert, L.D.; Dipple, G.M.; Nicolescu, S. World skarn deposits. Econ. Geol. 2005, 100, 299–336. [Google Scholar] [CrossRef]
- Einaudi, M.T.; Burt, D.M. Introduction; terminology, classification, and composition of skarn deposits. Econ. Geol. 1982, 77, 745–754. [Google Scholar] [CrossRef]
- Meinert, L.D. Skarns and Skarn Deposits. Geosci. Can. 1992, 19, 145–162. [Google Scholar]
- Alaminia, Z.; Mehrabi, B.; Razavi, S.M.H.; Tecce, F. Mineral chemistry, petrogenesis and evolution of the Ghorveh-Seranjic skarn, Northern Sanandaj Sirjan Zone, Iran. Mineral. Petrol. 2020, 114, 15–38. [Google Scholar] [CrossRef]


| Name (Year of Naming) | Chemical Formula | Type Locality | Ref. | Abbr. |
|---|---|---|---|---|
| Hastingsite (1896) | NaCa2(Fe2+4Fe3+)(Si6Al2)O22(OH)2 | Dungannon Township, Hastings County, Ontario, Canada. | [4,5,6] | Hs |
| Potassic-hastingsite (2020) | KCa2(Fe2+4Fe3+)(Si6Al2)O22(OH)2 | Keshiketeng Banner, Inner Mongolia, China | [7,8,9,10] | K-Hs |
| Potassic-fluoro-hastingsite (2009) | KCa2(Fe2+4Fe3+)(Si6Al2)O22F2 | Greenwood mine, Town of Tuxedo, New York, USA | [11] | K-F-Hs |
| Potassic-chloro-hastingsite (2005) | KCa2(Fe2+4Fe3+)(Si6Al2)O22Cl2 | Dashkesan Co-Fe deposit, Dashkesan district, Azerbaijan | [12,13] | K-Cl-Hs |
| Magnesio-hastingsite (1928) | NaCa2(Mg4Fe3+)(Si6Al2)O22(OH)2 | Mont Royal, Monreal, Quebec, Canada | [14,15,16] | Mg-Hs |
| Potassic-magnesio-hastingsite (2006) | KCa2(Mg4Fe3+)(Si6Al2)O22(OH)2 | Ylmenogorsky complex, South Urals, Russia | [17,18] | K-Mg-Hs |
| Magnesio-fluoro-hastingsite (2006) | NaCa2(Mg4Fe3+)(Si6Al2)O22F2 | Uroi Hill, Simeria, Hunedoara, Romania | [19,20] | Mg-F-Hs |
| Oxo-magnesio-hastingsite (2013) | NaCa2(Mg2Fe3+3)(Si6Al2)O22O2 | Deeti volcanic cone, Gregory rif, northern Tanzania | [21] | O-Mg-Hs |
| Crystal Data | Data Collection | ||
|---|---|---|---|
| Crystal system | Monoclinic | Theta range | 2.226° to 38.221° |
| Space group | C2/m | Reflection measured | 40,291 |
| Temperature (K) | 293 | Independent reflections | 2568 |
| a (Å) | 9.9724(3) | Rmerging [R(int)] (%) | 3.70 |
| b (Å) | 18.2968(4) | hmin, hmax | −17, 17 |
| c (Å) | 5.3573(1) | kmin, kmax | −31, 31 |
| β (°) | 104.945(3) | lmin, lmax | −9, 9 |
| V (Å3) | 944.44(4) | Refinement | |
| Z | 2 | Reflections used in the refinement (I > 3σ(I)) | 1851 |
| Radiation type | X-ray, λ = 0.7107 Å | N. of refined parameters | 124 |
| Crystal shape | tabular | Ra [on F] (%) | 2.71 |
| Crystal dimensions (mm) | 0.14 × 0.10 × 0.08 | Rwb [on F] (%) | 2.92 |
| Crystal color | brownish-black | Goof c | 1.0726 |
| Calculated density (g/cm3) | 3.485 | Δρmin/Δρmax (e−/Å3) | −0.79/0.88 |
| Mineral | Skarn Formation Stages | |||||||
|---|---|---|---|---|---|---|---|---|
| Late Hydrosilicatic Stage | Hydrothermal Stage | |||||||
| Garnet (grossular-andradite) | ||||||||
| Apatite | ||||||||
| Amphibole (potassic-hastingsite) | ||||||||
| Calcite | ||||||||
| Vesuvianite1 | ||||||||
| Quartz | ||||||||
| Vesuvianite2 | ||||||||
| Sulfides | ||||||||
| Epidote | ||||||||
| Zoisite | ||||||||
| Constituent | K-Hs, Kedrovy District, Russia This study | K-Hs, Yukon, Canada [7] | K-Hs, Keshiketeng Banner, China [10] | K-Hs, Vlastějovice, Czech Republic [9] | K-Hs, West Ongul Island, East Antarctica [8] | K-Cl-Hs, Dashkesan, Azerbaidjan [13] | K-F-Hs, Greenwood mine, USA [11] | Mg-Hs, Lafarge Quarry, Canada [16] | Mg-F-Hs, Eifel, Rheinland-Pfalz, Germany [20] | Mg-F-Hs, Uroi Hill, Romania [19] | K-Mg-Hs, Ylmenogorsky Complex, South Urals, Russia [18] | K-Mg-Hs, Prince Olav Coast, East Antarctica [17] | O-Mg-Hs, Deeti Volcanic Cone, Northern Tanzania [21] |
|---|---|---|---|---|---|---|---|---|---|---|---|---|---|
| SiO2 | 36.62(63) | 37.36(46) | 35.02 | 37.32 | 35.52 | 35.62 | 40.49 | 39.53 | 40.02 | 40.77 | 36.28 | 39.43 | 41.89 |
| Al2O3 | 10.64(8) | 11.60(30) | 10.69 | 12.70 | 11.94 | 11.13 | 10.29 | 14.61 | 11.81 | 13.11 | 16.37 | 14.31 | 10.75 |
| Na2O | 0.96(9) | 1.27(20) | 0.06 | 1.07 | 0.80 | 1.07 | 1.24 | 1.99 | 2.45 | 1.79 | 1.05 | 0.96 | 2.84 |
| MgO | 0.96(8) | 0.98(26) | 0.23 | 3.83 | 4.44 | 2.91 | 6.68 | 14.07 | 15.24 | 18.70 | 10.23 | 9.02 | 14.79 |
| K2O | 2.21(10) | 2.15(14) | 2.79 | 3.05 | 3.27 | 3.04 | 2.93 | 2.25 | 1.60 | 1.17 | 3.34 | 3.07 | 1.74 |
| CaO | 11.05(9) | 11.28(22) | 11.35 | 11.38 | 11.32 | 10.72 | 11.13 | 11.89 | 12.28 | 13.99 | 11.84 | 12.23 | 11.76 |
| TiO2 | 0.20(8) | 0.29(9) | 0.35 | 0.43 | 0.77 | 0.43 | 0.11 | 3.64 | 5.38 | 1.21 | 1.47 | 1.03 | 3.96 |
| V2O3 | n.d. | n.d. | n.d. | n.d. | n.d. | n.d. | 0.03 | n.d. | b.d.l. | n.d. | b.d.l. | n.d. | trace |
| Cr2O3 | b.d.l. | 0.08(9) | 0.03 | n.d. | n.d. | n.d. | 0.01 | 0.03 | b.d.l. | n.d. | n.d. | 0.02 | trace |
| MnO | 0.37(6) | 0.37(12) | 0.43 | 0.18 | 0.30 | 0.40 | 0.20 | 0.09 | b.d.l. | n.d. | 0.45 | 0.45 | 0.08 |
| FeO | 27.66(52) | 25.70(2) | 26.08 | 20.81 | 19.73 | 23.48 | 19.80 | 5.45 | n.d. | n.d. | 8.76 | 8.38 | n.d. |
| Fe2O3 | 6.92(51) | 6.55(2) | 7.33 | 6.64 | 7.44 | 7.80 | 4.49 | 4.76 | 9.16 | 6.44 | 7.29 | 9.88 | 11.25 |
| BaO | n.d. | n.d. | n.d. | n.d. | n.d. | n.d. | n.d. | n.d. | b.d.l. | n.d. | 0.92 | n.d. | n.d. |
| F | 0.17(5) | n.d. | 0.00 | 0.35 | 0.19 | 0.14 | 2.23 | 0.09 | 2.36 | 4.39 | n.d. | 0.20 | n.d. |
| Cl | 2.08(17) | 2.35(39) | 2.79 | 0.24 | 3.27 | 4.68 | 0.61 | 0.02 | b.d.l. | n.d. | 0.5 | 0.10 | n.d. |
| Sum | 99.84 | 99.98 | 97.15 | 98.00 | 98.99 | 101.42 | 100.24 | 98.42 | 100.3 | 101.57 | 98.50 | 99.08 | 99.06 |
| O = F2 | 0.07 | - | - | 0.15 | 0.82 | 1.12 | 1.08 | 0.04 | -0.99 | 1.84 | - | 0.11 | - |
| O = Cl | 0.47 | 0.53 | 0.67 | 0.05 | - | - | 0.1 | - | |||||
| Total | 99.30 | 99.45 | 96.48 | 97.80 | 98.17 | 100.30 | 99.16 | 98.38 | 99.31 | 99.73 | 98.40 | 98.97 | 99.06 |
| Mineral | A | B | C | T | O | W |
|---|---|---|---|---|---|---|
| K-Hs, Kevrovy district, Russia This study | K0.46Na0.29 | Ca1.95Na0.03Mn0.02 | Fe2+3.49Fe3+1.15Mg0.24Al0.06Mn0.04Ti0.02 | Si6.01Al1.99 | O22 | (OH)1.33Cl0.58F0.09 |
| K-Hs, Yukon, Canada [7] | K0.45Na0.40 | Ca1.97Na0.03 | Fe2+3.51Fe3+0.81Al0.32Mg0.24Mn0.05Ti0.03Cr0.01 | Si6.09Al1.91 | O22 | (OH)1.38Cl0.62 |
| K-Hs, Keshiketeng Banner, China [10] | K0.61Na0.20Ca0.07 | Ca2.00 | Fe2+3.72Fe3+0.94Al0.12Mg0.06Mn0.06Ti0.04Ni0.01 | Si5.97Al2.03 | O22 | (OH)1.14Cl0.86 |
| K-Hs, Vlastějovice, Czech Republic [9] | K0.62Na0.28 | Ca1.95Na0.05 | Fe2+2.79Mg0.92Fe3+0.80Al0.38Ti0.05Mn0.03 | Si5.98Al2.02 | O22 | (OH)1.71F0.18Cl0.06 |
| K-Hs, West Ongul Island, East Antarctica [8] | K0.69Na0.26 | Ca1.99 | Fe2+2.71Mg1.09Fe3+0.92Al0.15Ti0.10Mn0.04 | Si5.84Al2.16 | O22 | (OH)0.95Cl0.91F0.10O0.04 |
| K-Cl-Hs, Dashkesan, Azerbaidjan [13] | K0.64Na0.34 | Ca1.90 | Fe2+3.25Fe3+0.97Mg0.72Mn0.06Al0.06Ti0.05 | Si5.89Al2.11 | O22 | Cl1.31(OH)0.60F0.07O0.02 |
| K-F-Hs, Greenwood mine, USA [11] | K0.59Na0.25 | Ca1.87Na0.13 | Fe2+2.60Mg1.56Fe3+0.53Al0.26Mn0.03Ti0.01 | Si6.36Al1.64 | O22 | F1.11(OH)0.73Cl0.16 |
| Mg-Hs, Lafarge Quarry, Canada [16] | Na0.57K0.42Ca0.01 | Ca1.88Fe2+0.11Na0.02Mn0.01 | Mg3.10Fe2+0.57Fe3+0.53Ti0.41Al0.39Mn0.02 | Si5.85Al2.15 | O22 | (OH)1.36O0.59F0.04Cl0.01 |
| Mg-F-Hs, Eifel, Rheinland-Pfalz, Germany [20] | Na0.65K0.30 | Ca1.95Na0.05 | Mg3.36Fe3+0.87Fe2+0.13Ti0.60 | Si5.92Al2.08 | O22 | F1.11O0.89 |
| Mg-F-Hs, Uroi hill, Romania [19] | Na0.50K0.22Ca0.17 | Ca2.00 | Mg4.03Fe3+0.70Al0.13Ti0.13 | Si5.89Al2.11 | O22 | F2.00 |
| K-Mg-Hs, Ylmenogorsky complex, South Urals, Russia [18] | K0.65Na0.31Ba0.04 | Ca1.93Mn0.06Ba0.01 | Mg2.32Fe2+1.12Fe3+0.84Al0.47Ti0.17 | Si5.53Al2.47 | O22 | (OH)1.93Cl0.13 |
| K-Mg-Hs, Prince Olav Coast, East Antarctica [17] | K0.85Na0.11Ca0.02 | Ca1.98Mn0.02 | Mg1.92Fe2+1.20Fe3+1.11Al0.64Ti0.13Mn0.01 | Si5.64Al2.36 | O22 | (OH)1.36O0.48F0.12Cl0.04 |
| O-Mg-Hs, Deeti volcanic cone, Northern Tanzania [21] | Na0.67K0.33 | Ca1.87Na0.14Mn0.01 | Mg3.27Fe3+1.25Ti0.44Al0.08 | Si6.20Al1.80 | O22 | O1.40(OH)0.60 |
| Site | Atom | x/a | y/b | z/c | Occ. | Ueq |
|---|---|---|---|---|---|---|
| A | K+ | 0 | 0.5 | 0 | 0.524(1) | 0.0499 |
| A2 | K+ | 0 | 0.4728(7) | 0 | 0.037(1) | 0.0499 |
| M1 | Fe2+ | 0 | 0.09259(2) | 0.5 | 1 | 0.0144 |
| M2 | Fe2+, Fe3+, Mg2+ | 0 | 0.17915(2) | 0 | 0.99(1) | 0.119 |
| M3 | Fe2+ | 0 | 0 | 0 | 1 | 0.0136 |
| M4 | Ca2+ | 0 | 0.28067(2) | 0.5 | 1 | 0.0158 |
| T1 | Si4+, Al3+ | 0.27837(4) | 0.08558(2) | 0.29999(8) | 1 | 0.0110 |
| T2 | Si4+ | 0.29083(4) | 0.17265(2) | 0.80998(7) | 1 | 0.0108 |
| O1 | O2− | 0.1057(1) | 0.09079(6) | 0.2138(2) | 1 | 0.0143 |
| O2 | O2− | 0.1218(1) | 0.17736(6) | 0.7320(2) | 1 | 0.0138 |
| O3 | O2−, F− | 0.1092(5) | 0 | 0.7087(4) | 0.68(1) | 0.0135 |
| Cl− | 0.1623(2) | 0 | 0.7358(3) | 0.31(1) | 0.0154 | |
| O4 | O2− | 0.3688(1) | 0.24841(6) | 0.7935(2) | 1 | 0.0159 |
| O5 | O2− | 0.3467(1) | 0.13651(6) | 0.1003(2) | 1 | 0.0155 |
| O6 | O2− | 0.3423(1) | 0.12116(6) | 0.5967(2) | 1 | 0.0162 |
| O7 | O2− | 0.3331(2) | 0 | 0.2953(3) | 1 | 0.0195 |
| T1 Site | T2 Site | A Site | |||
|---|---|---|---|---|---|
| T1-O1 | 1.667(1) | T2-O2 | 1.631(1) | A-O5 (×4) | 3.048(1) |
| T1-O5 | 1.689(1) | T2-O4 | 1.603(1) | A-O6 (×4) | 3.210(1) |
| T1-O6 | 1.684(1) | T2-O5 | 1.650(1) | A-O7 (×2) | 2.576(2) |
| T1-O7 | 1.660(1) | T2-O6 | 1.661(1) | <A-O> | 3.018(3) |
| <T1-O> | 1.675(3) | <T2-O> | 1.636(4) | ||
| Vp (Å3) | 50.300 | ||||
| O1-T1-O5 | 110.49(5) | O2-T2-O4 | 115.13(6) | BLD (%) | 5.866 |
| O1-T1-O6 | 110.59(6) | O2-T2-O5 | 109.73(6) | A2 site | |
| O1-T1-O7 | 111.71(7) | O2-T2-O6 | 109.64(6) | A2-O5 (×2) | 2.614(25) |
| O5-T1-O6 | 105.54(8) | O4-T2-O5 | 110.36(6) | A2-O6 (×2) | 2.856(19) |
| O5-T1-O7 | 108.85(7) | O4-T2-O6 | 102.27(6) | A2-O7 (×2) | 2.635(7) |
| O6-T1-O7 | 109.44(7) | O5-T2-O6 | 109.39(6) | <A2–O> | 2.702(48) |
| <O-T1-O> | 109.4(2) | <O-T2-O> | 109.4(1) | M3 site | |
| M3-O1 (×4) | 2.135(1) | ||||
| T1-O7-T1 | 141.15(12) | T1-O5-T2 | 136.49(7) | M3-O3 (×2) | 2.121(4) |
| M3–Cl3 (×2) | 2.409(3) | ||||
| Vt (Å3) | 2.407 | Vt (Å3) | 2.233 | <M3-O6> | 2.130(5) |
| BLD (%) | 0.684 | BLD (%) | 1.176 | <M3-O5Cl> | 2.178(3) |
| TAV | 4.6077 | TAV | 16.9950 | <M3-O4Cl2> | 2.226(5) |
| TQE | 1.0011 | TQE | 1.0044 | M4 site | |
| M1 site | M2 site | M4-O2 (×2) | 2.412(1) | ||
| M1-O1 (×2) | 2.073(1) | M2-O1 (×2) | 2.101(1) | M4-O4 (×2) | 2.351(1) |
| M1-O2 (×2) | 2.156(1) | M2-O2 (×2) | 2.107(1) | M4-O5 (×2) | 2.744(1) |
| M1-O3 (×2) | 2.163(1) | M2-O4 (×2) | 1.986(1) | M4-O6 (×2) | 2.527(1) |
| M1–Cl3 (×2) | 2.456(1) | <M2-O> | 2.065(3) | <M4-O> | 2.508(3) |
| <M1-O6 > | 2.131(3) | ||||
| <M1-O5Cl> | 2.180(3) | Vo (Å3) | 11.611 | Vp (Å3) | 26.509 |
| <M1-O4Cl2> | 2.228(3) | BLD (%) | 2.532 | BLD (%) | 5.069 |
| OAV | 23.3661 | ||||
| M1–M2 | 3.1119(2) | OQE | 1.0078 | A–A2 | 0.498(13) |
| M1–M3 | 3.1694(2) | A2–A2 | 1.00(3) | ||
| M2–M3 | 3.2779(4) | O3–Cl3 | 0.511(3) | ||
| T1 | T2 | A | A2 | M1 | M2 | M3 | M4 | ∑ | |
|---|---|---|---|---|---|---|---|---|---|
| O1 | 0.897 | 0.395[×2] | 0.371[×2] | 0.344[×4] | 2.007 | ||||
| O2 | 0.984 | 0.328[×2] | 0.366[×2] | 0.291[×2] | 1.969 | ||||
| O3 | 0.323[×2] (×2) | 0.355[×2] | 1.001 | ||||||
| Cl3 | 0.343[×2] (×2) | 0.389[×2] | 1.075 | ||||||
| O4 | 1.055 | 0.480[×2] | 0.337[×2] | 1.872 | |||||
| O5 | 0.847 | 0.936 | 0.081[×4] | 0.241[×2] | 0.129[×2] | 1.993–2.153 | |||
| O6 | 0.858 | 0.909 | 0.054[×4] | 0.131[×2] | 0.219[×2] | 2.040–2.117 | |||
| O7 | 0.912(×2) | 0.265[×2] | 0.228[×2] | 2.089–2.052 | |||||
| ∑ | 3.515 | 3.884 | 1.070 | 1.200 | 2.092–2.132 | 2.434 | 2.086–2.154 | 1.952 |
Publisher’s Note: MDPI stays neutral with regard to jurisdictional claims in published maps and institutional affiliations. |
© 2021 by the authors. Licensee MDPI, Basel, Switzerland. This article is an open access article distributed under the terms and conditions of the Creative Commons Attribution (CC BY) license (https://creativecommons.org/licenses/by/4.0/).
Share and Cite
Kaneva, E.; Radomskaya, T.; Shendrik, R.; Chubarov, V.; Danilovsky, V. Potassic-Hastingsite from the Kedrovy District (East Siberia, Russia): Petrographic Description, Crystal Chemistry, Spectroscopy, and Thermal Behavior. Minerals 2021, 11, 1049. https://doi.org/10.3390/min11101049
Kaneva E, Radomskaya T, Shendrik R, Chubarov V, Danilovsky V. Potassic-Hastingsite from the Kedrovy District (East Siberia, Russia): Petrographic Description, Crystal Chemistry, Spectroscopy, and Thermal Behavior. Minerals. 2021; 11(10):1049. https://doi.org/10.3390/min11101049
Chicago/Turabian StyleKaneva, Ekaterina, Tatiana Radomskaya, Roman Shendrik, Victor Chubarov, and Victoria Danilovsky. 2021. "Potassic-Hastingsite from the Kedrovy District (East Siberia, Russia): Petrographic Description, Crystal Chemistry, Spectroscopy, and Thermal Behavior" Minerals 11, no. 10: 1049. https://doi.org/10.3390/min11101049