Some Complementary Data about the Spectroscopic Properties of Manganese Ions in Spodumene Crystals


1
Institute of Earth Sciences, Faculty of Natural Science, University of Silesia, 41-200 Sosnowiec, Poland
2
Institute of Low Temperature and Structure Research, Polish Academy of Sciences, 50–422 Wrocław, Poland
3
August Chełkowski Institute of Physics, Faculty of Science and Technology, University of Silesia, 141–500 Chorzów, Poland
*
Author to whom correspondence should be addressed.
Minerals 2020, 10(6), 554; https://doi.org/10.3390/min10060554
Submission received: 19 May 2020
/
Revised: 10 June 2020
/
Accepted: 15 June 2020
/
Published: 19 June 2020
(This article belongs to the Section Crystallography and Physical Chemistry of Minerals & Nanominerals)
Abstract
:The color change of the pink and colorless LiAlSi2O6 spodumene crystal due to irradiation and heating is explained. The hypothesis about the change of Mn3+ to Mn4+ after irradiation was rejected. For the studied crystals, it was shown that both Mn2+ and Mn3+ occupy the M2 (not the M1) crystal site. Spodumene crystals which are primary pink (kunzite) contain Mn3+ (and Mn2+) at the M1 site. By contrast, those that become pink due to irradiation and heating contain Mn3+ and Mn2+ at the M2 site. The emission band of the former is 625 nm, and for the latter, it is 591 nm.
1. Introduction
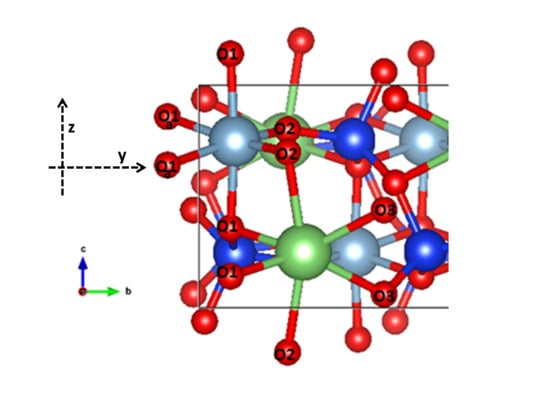
Spodumene (LiAlSi2O6) is a member of the clinopyroxene group which contains chains of corner-sharing SiO4 groups running along the c-axis and interconnected by chains of edge-sharing AlO6 octahedra and irregularly shaped polyhedra of six-fold coordinated lithium ions. It is monoclinic with space group C2h6 (C2/c) and unit cell parameters are a = 9.479 Å, b = 8.403 Å, c = 5.223 Å and β = 110.14° [1]. Li and Al occupy the special Wyckoff position 4e with site symmetry 2 (C2), while Si and O are on the general Wyckoff position 8f with site symmetry 1 (C1). The sketch of spodumene structure is presented in Figure 1. Octahedrally coordinated Al3+ ions occupy M1 sites and <Al-O ≥1.923 Å. Six-fold coordinated Li+ ions occupy M2 sites and <Li-O ≥2.214 Å. The M1 (Al3+) cation is coordinated by four O1 and two O2 atoms; the M2 (Li+) cation is coordinated by two O1, two O2 and two O3 atoms. O3 oxygen is a bridging oxygen as it is bonded to two silicon atoms. O1 and O2 oxygen are both non-bridging. The quadratic elongation and bond angle variance are equal to 1.0148 and 44.0518 deg.2 and 1.2157 and 542.8684 deg.2 for the M1 and M2 sites, respectively [2], so the M2 site is larger and more distorted than M1, although the distortion index (bond length) for these sites is almost the same: 0.0388. These values were calculated from structural data [1]. Quadratic elongation parameters, bond angle variance of octahedral angles and standard deviation are defined as <λ> = , and where li and l0 are individual and average the Me-O bonds lengths and θi individual O-Me-O angles, respectively [2]. Distortion index (bond length) index was proposed by Brown and Shannon [3] as .
Gem-quality spodumene crystals are pink-to-lilac, emerald green, pale greenish-yellow, pale violet-blue, pale green and colorless. Some of the color varieties are customary names, such as kunzite (pink), hiddenite (Cr-emerald green) or triphane (colorless to yellow). Emerald green spodumene crystals are well known from Hiddenite, North Carolina and San Diego (USA); pink-to lilac from Pala, California (USA); and other colored and colorless varieties from, e.g., Laghman, Konar and Nuristan Provinces (Afghanistan), Skardu District (Pakistan), Minas Gerais (Brazil) and Siberia (Russia). The main elements which cause the spodumene colorization are Mn, Cr, Fe and V. Their presence and effect on the color of spodumene crystals are usually confirmed by the results of electron and Mossbauer spectroscopy.
The following scientific reports, among the many, are most important to explaining the spectroscopic properties of Fe-ions in spodumene crystals [4,5,6,7,8,9,10,11]. Cr-spodumene crystals have been described by Cohen and Janezic 1983 (fide [12,13,14,15]). As the natural spodumene crystals, in which the content of vanadium is greater or even equal to the content of chromium, are not known [16], it should be considered fact that the absorption bands V2+ ion should be close to those of Cr3+. It is widely accepted that Cr3+ occupies the M1 site, as does Fe3+, while Fe2+ occupies both the M1 and M2 sites.
There are also numerical reports on the spectroscopy of manganese ions in spodumene crystals. Chandrasekhar and White [17] proposed the presence of Mn2+ the M1 site, while [14] demonstrated that Mn2+ ions occupy, in spodumene, the larger M2 site. It was postulated by [5] that if the Mn2+ ions are present in sites M1 and M2, the crystal is colorless; by contrast, when Mn3+ ions occupy site M1 and Mn2+ are in site M2, the crystal has pink color. Finally, for a reverse occupation scheme, i.e., Mn3+ ion in site M2 and Mn2+ ion in site M1, the color is green. Recently, the influences of lattice defects on luminescence properties of Mn2+, known as persistent luminescence, have also been presented [11].
In this work, we present complementary spectroscopic data focused on two issues:
- (1)
- For Mn2+: what is the lattice site of Mn2+ and what are the crystal-field parameters of this ion?
- (2)
- For Mn3+: the problem of color change during irradiation and heating?
Except Cr-emerald green spodumene, the color of other spodumene varieties has been described as unstable, changing under irradiation and heating. It was shown [18,19] that the colorless spodumene crystal after irradiation changes to green or pink (lilac). Nassau [20] proposed that the change involving the conversion of the pink (Mn3+) to deep green (Mn4+), is due to oxidation-reduction with Fe3+: with the reverse process occurring upon exposure to light. The green spodumene crystal after optical bleaching or heating up to 250 °C changes its color to the pink (lilac) and this change is reversible. Heating above 500 °C causes spodumene to become colorless. Three bands at 530 (strong), 430 and 680 nm (weak) were measured on the absorption spectrum of primary pink spodumene from Pala Mine District (San Diego, California). After irradiation, the band at 650 nm dominates, as does the absorption band in ultraviolet, while after heating (250 °C), the band at 540 nm is visible again, together with bands at 625 and 675 nm. The intensities of the latter two increased compare to the intensity of 540 nm band [18]. It was concluded that these effects correspond to the change of valence of the manganese from Mn3+ for pink crystal to Mn4+ for green.
For primary and irradiated pink spodumene from Minas Gerais (Brazil), it was also hypothesized [21,22] that due to irradiation, the valence state of Mn3+ is not changed to Mn4+, but instead, some other lattice defects are formed and Mn3+ crystal site becomes more distorted. The thesis was put by [23] that Mn3+ in spodumene crystal occupies the site with effective tetragonal distortion, most probably the M1 site, and this site has become more distorted as a result of irradiation. Consequently, the color is changed from pink to green but returns when the irradiated crystal has been heated [18,21]. For primary pink spodumene, [21] measured three weak bands at 11,100 cm−1 (900 nm), 12,000 cm−1 (833 nm) and 22,000 cm−1 (454 nm) and one intense at 18,600 cm−1 (537 nm), while for irradiated green, the bands at 10,500 cm−1 (952 nm), 15,600 cm−1 (641 nm) and 21,500 cm−1 (465 nm) were measured. Souza et al. [22] supported the opinion that after irradiation of spodumene crystals, the valence state of manganese was not changed, while the bands at 630 and 470 nm are related to formed lattice defects, not to manganese ions; their intensities increase with the dose of irradiation and not with the percentage of Mn content.
From a summary of the above opinions, it is evident that the crystals of pink spodumene have slightly different absorption spectra. The reason of their coloration is certainly Mn3+. However, this ion may occupy the M1 or M2 site in spodumene crystal lattice, and a different number of other lattice defects may be present in it.
The main research objectives of this paper were to verify:
- (a)
- Whether Mn3+ in spodumene crystal changes into Mn4+ after irradiation;
- (b)
- How the crystal-field splitting parameter (Dq) and crystal-field stabilization energy (CFSE) of Mn3+ change after irradiation and what the symmetry of Mn3+ site is (tetragonal or monoclinic);
- (c)
- Whether Mn3+ exists in the M1 or the M2 site; which one is the case for natural crystals, and which one is for artificial pink spodumene crystals?
2. Materials and Methods
Spodumene crystals of various colors were studied by us and an afterglow effect for them was shown [11]. In this paper, we present new spectroscopic results concerning four samples: a pink crystal (sample 3) from Langham Province (Afghanistan); a pale yellow crystal (sample 13) and a colorless one (sample 14) from Nuristan Province (Afghanistan); and finally, another colorless spodumene from Skardu District (Pakistan).
The Si and Al contents were determined using an electron-microprobe analyzer (CAMECA sx100; 15 kV, 40–50 nA). The following lines and standards were used: SiKα, (diopside) and AlKα (orthoclase). Corrections were made using the PAP procedure provided by CAMECA. The results calculated for an average of 10 measuring points are presented in Table 1. The concentrations of trace elements were measured by ICP-MS method at the ACMA Lab (Canada). The Li2O3 content was calculated to be close the sum of major oxides SiO2, Al2O3, Na2O, FeO and MnO. Because Na, Fe and Mn content were in the amount of several hundred ppm, their oxides were added to the sum of the main components. It was not considered appropriate to use as much as 15 g of the sample for ICP-MS determination of the main elements. This would require the destruction of a significant part of the crystal. The Li content was only calculated, and not measured directly. The results are listed in Table 1. It lists only the trace elements whose contents were at least 2 times higher than the method detection limit.
The spodumene crystals were irradiated for 24 h by X-ray from a Cu-anticathode (U = 40 kV and I = 30 mA). The irradiated crystals were heated in air for 2 h at 250 °C.
Non-polarized absorption spectra of spodumene 3 and 14 were measured at room temperature and low (7K) temperatures using a Cary-Varian Model 2300 spectrophotometer in the spectral range from 1000 nm (10,000 cm−1) to 340 nm (30,000 cm−1). Steady time-luminescence spectra were determined at room temperature using a Jobin-Yvon (SPEX) FLUORLOG 3-12 spectrofluorimeter with a 450 W xenon lamp, a double-grating monochromator and a Hamamatsu 928 photomultiplier. Both emission and excitation measurements were spectra were measured with the electric vector E parallel to each of two crystallographic axes on each (100), (001) and (010) surface. The three different excitation spectra ~γ, α and β were measured at room temperature, where α, β and γ are the indicatrix axes, and the crystal. These orientations, beam directions and polarizations are as described by the Porto notation. Measurements at low temperature were made using a Physik LPD3000 laser (pumped by a Lambda Physik LPX100 excimer laser).
3. Results and Discussion
3.1. Chemistry of Studied Spodumene Crystals
The Mn and Fe contents in the studied samples are close to the values known from other research. The pink spodumene sample from Afghanistan studied by [23] contains 700 ppm of Mn. In another pink spodumene sample [17], 600 ppm of Mn, 900 ppm of Fe and trace amounts of Ca, Mg, Be and Na were found. In the pink spodumene from Minas Gerais (Brazil), Mn content (460 ± 10 ppm) was greater than the Fe content (165 ± 8 ppm) [21]. Moreover, large concentrations (in arbitrary units) of Na, K, Ti and Mg were detected [24]. In samples studied here, besides Mn and Fe, only Na content stands out. In the oldest reference [18] for spodumene crystals from Pala, California, the Mn content was several thousand ppm. However, this content was found in colorless, yellow and green varieties in probably equally value. It can be said that the essence of the pink color of spodumene crystals is not the total manganese content, but whether and how many ions of this element have valence (3+).
Among samples studied by us, the colorless crystal (sample. 36a) stands out with the smallest amounts of trace elements. As was shown in [11], it features a large number of lattice defects. However, these defects are short-lived, as the emission from them has been measured only for short-term excitation.
3.2. Irradiation and Heating Effect
The absorbed dose of X-ray used in our research was estimated to be 0.4 Gy, so it was negligibly small compared to those of used by [21,22,24]. As previously mentioned [22], due to gamma irradiation with high dose up to 1 kGy, the intensity of bands at 630 and 470 nm strongly increases with the dose of irradiation and not with the percentage of Mn content. A change in the color of the spodumene was usually observed after irradiation and annealing at 250 °C. Paper [23] shows that the crystals subjected to irradiation and then annealing at T = 700 °C become colorless. This means that almost all Mn3+ has changed to Mn2+.
As it was for shown earlier [11], the pink spodumene crystal (3), upon being irradiated, changed color to green, but after heating (250 °C/2h), reverted to pink. Similarly, the colorless crystal (14), when irradiated, changed color to green, and after heating (250 °C/2h), to pink. The pale yellow crystal (13) turned bright green when irradiated but reverted to pale yellow after heating (250 °C/2h). The colorless crystal (sample 36a) after X-ray exposure did become colored. For all studied spodumene crystals, some lattice defects have been present and their number increased after irradiation [11]. Due to irradiation, some part of Mn2+ changes to Mn3+, but this valence state was not permanent for sample 13, in contrast with samples 3 and 14. In the first one, the lattice defect did not stabilize Mn3+. The valence change of Mn2+ to Mn3+ under irradiation may be permanent (as with crystal 14) or unstable, as with the second sample. According to [11], sample 13 contained significantly more lattice defects than samples 14 and 3, and these defects were not located near the Mn2+ ions, because no energy transfer effect has been observed. For this reason, the valence of Mn3+ was not permanent. The situation was opposite for crystals 3 and 14. The number of lattice defects and their proximity to Mn3+ made the created valence (3+) permanent.
3.3. Spectroscopy of Mn2+ in Spodumene
Divalent manganese is one of the most common and well-known activators of minerals’ luminescence. For all minerals, and an overwhelming number of synthetic phosphors, this ion occurs as high-spin complex possessing the unique electronic configuration (t2g)3(eg)2 with a single occupation of all five d orbitals and zero crystal field stabilization energy (CFSE). The ground term is 6S and the excited terms in order of increasing energy are: 4G, 4P, 4D, 1I and 4F. Due to the crystal field, the terms split into levels. For example, the first excited term 4G split into levels 4T2g and 4T1g, whose energy strongly depends on crystal-field force Dq, and two levels 4A1 and 4Eg, whose energies are independent of Dq. As the energies of levels 4A1 and 4Eg states are expected to be equal, these states are often described as the (4Eg4A1) state.
Only the luminescence of Mn2+ was measured for studied crystals. The results are given in Figure 2a–f. Nonetheless, for pink spodumene (sample 3), an additional line was measured at 690.7 nm and identified as the R1 line of Cr3+. The luminescence spectra measured at room temperature contained a wide 4T1(4G) → 6A1(6S) band at 591 nm. With a lowering of the temperature (7K), the emission band shifts towards longer wavelengths (Figure 2a) due to the shortening of the Mn–O distance. The intensity of luminescence depends on the Mn-content (Figure 2b,c, Table 1). The emission bands are symmetrical; their main full width at half maximum was 1920 cm−1 at room temperature and 1760 cm−1 at 7 K due to reduction of the coupling with lattice vibrations. The luminescence excitation spectrum of spodumene measured for the 591 nm emission is shown in Figure 2d,e.
In the visible region, there are five transitions between the ground and excited states of Mn2+ which are measured as υ1–υ5 bands listed below in the order of increasing energy:
Based on the position of υ1–υ5 bands and using the above equations, the B, C and Dq parameters could be calculated. Usually, the B parameter is calculated first, from the difference between the υ5 and υ3 bands; then, parameter C from these bands; and finally, Dq, calculated from υ2 or υ1 transitions. However, if υ3 and/or υ5 band are not a single band, but rather split, then such calculations may carry a significant error.
The measured υ1–υ5 excitation bands are presented in Table 2, together with the calculated values of energy transitions. The calculations were made according to the above equations and to Curie et al. [25] approximation. This theory [25] takes into account the difference in the covalence of t2 and e orbitals and explains the splitting of 4E,4A14A1 state for Mn2+ in octahedral and tetrahedral site coordination. The normalization parameters are Nt, Ne and ε, where . Note the Racah–Treesa parameter α and the seniority parameter β have been included. As the υ3 band of 6A1(S) → 4E,4A(4G) transition is not a single band, at the first approximation the Racah parameter was calculated from barycenter of it. Then, the energy of 4A1(4G) is calculated as , while energies of 4E(4G, 4D) are the eigenvalues of the matrix: , and similar to the matrix for 4T1 and 4T2 [25]. The results obtained by calculations following the theory of [24] are in better agreement with experimental results than those based on the theories of Tanabe–Sugano (Table 2). However, even the former are still not satisfactory to us. It means that the low symmetry of Mn2+-O6 polyhedra caused much greater splitting of 4E4A(4G) level (Figure 2d, Table 2).
Additionally, the Mn–O bond is largely ionic, as the nephelauxetic parameter β (β = Bin complex/Bfree ion) is equal to 0.88. The splitting of 4E4A(4G) level for samples 3, 13 and 14 is almost the same (415–420 cm−1) but slightly greater for crystal 36a (440 cm−1). It is a crystal with a lot of lattice defects but little content of trace elements [11]. Irradiation and heating did not change the values of υ1–υ5 excitation bands.
Current results are close to those calculated by [14], i.e., 10Dq = (6000 ± 300) cm−1, B = 857 cm−1 and C = 3200 cm−1, and indicate that Mn2+ occupies the larger M2 (Li) site in the studied spodumene crystal. For the other sample of pink spodumene [17], a single emission band of Mn2+ has been measured at 16,000 cm−1 (i.e., 625 nm). The thesis was put forward that Mn2+ occupies the M1 (Al) site. It is hard to disagree with that conclusion. The greater emission wavelength (625 nm) compared to our results (591 nm) corresponds to a larger Dq value; i.e., a smaller Mn-O distance; i.e., the M1 site.
It can therefore be concluded that the Mn2+ occupancy of the M1 or the M2 site shows signs of variability or even randomness.
In [17], the polarization dependence of emission intensity was shown. Such analysis allows the determination of the orientation of the emission dipole P, the components of which are aligned parallelly to the crystallographic axes a, b and c. The following equation have been used:
where θ is an angle between the direction of the oscillator and the c-axis, and ϕ is an angle on the ab plane between the projection of dipole on this plane and the a-axis, which are retrieved as Cartesian coordinates from the spherical coordinates (radius r, polar angle θ, azimuthal angle φ). The polarization intensities are proportional to the squares of the direction cosines. Chandrasekhar and White [17] obtained θ = 34.0° and ϕ = 45.8°. For all studied spodumene crystals (primary ones and those subjected to irradiation and heating), the polarization scheme is as given above.
From our measurements (Figure 2e), the intensities for Pa, Pb and Pc in arbitrary units are 2.5 × 10⁴, 0.16 × 10⁴ and 4.4 × 10⁴, respectively. Based on the results presented in Figure 2e, the angles θ = 18.2° and ϕ = 37.8° were estimated; these values are clearly different from data obtained by Chandrasekhar and White [17].
3.4. Spectroscopy of Mn3+ in Spodumene
Mn3+ is a mineral component that can be responsible for a red to violet or pink color on the one hand and yellow or green and blue on the other. The polarized or un-polarized spectra measured for red and purple crystals contain the main 5Eg → 5T2g transition band at 535–565 nm. The yellow or green crystals comprise two bands at 450 and 630 nm. The crystal-field splitting parameter 10Dq for Mn-bearing minerals varies from 19,800 cm−1 to 12,000 cm−1 [12,26,27]. So far, the Mn3+ crystal-site symmetry in minerals was considered as tetragonal (D4h or C4v), trigonal (D3h) or monoclinic (C2).
The pink spodumene crystal (sample 3), upon being irradiated, changed color to green, but after heating, reverted to pink. Similarly, the colorless crystal (sample 14), when irradiated, changed color to green, and after heating, to pink (Figure 3).
The emission of Mn3+ has not been measured for our pink spodumene (sample 3), nor have references been found that provide Mn3+ luminescence data for such crystals. The luminescence spectra of Mn3+ in minerals and synthetic materials have been measured rarely [27]. A strong Jahn–Teller effect introduces various channels for nonradiative relaxation and the quenching of manganese luminescence. The luminescence quenching properties of Fe-ion are well known. However, for the studied samples, the amount of Fe is too low to have any meaningful effect. For the crystal with the highest Fe and Mn content (sample 13) with a uniform distribution of these elements in crystals, Mn and Fe ions are present in every 17-unit cell, so an energy transfer between them is almost impossible. Thus, the main reason for it may be the low Mn content in pink spodumene crystals. All emission spectra of pink spodemene show the emission band of Mn2+, and sometimes, those of lattice defects [11].
- (a)
- First question: does Mn3+ in the studied spodumene samples change its valence due to irradiation?
The absorption spectra of the natural and irradiated crystals (sample 3 and 3 irr.), measured at a low temperature, are shown in Figure 4a. The concentration of Mn in the crystal was rather small (459 ppm), similar to that reported by [28], but at least 10 times smaller than that reported by [18]. For the pink spodumene crystal, absorption bands at 400 (very weak), 529, 585 (weak), 624 and 1630 nm (very weak) have been measured. After irradiation and the change of color from pink to green, absorption bands appeared at 447, 536, 588 (weak) and 628 nm. The absorption spectrum of irradiated pink spodumene resembles that of the primary pink crystal, the only difference being a shift to longer wavelengths. Contrary to [5,18,21], no drastic changes, such as the disappearance of 540 nm band and the appearance the band at 640 nm have been observed.
The primary colorless crystal (sample 14) became green due to irradiation, and after heating at 250 °C per 2 h, it turned pink. This has been confirmed in Figure 4b. The spectra for this sample are very similar to the spectra of sample 3 (Figure 4a). The only difference is the absorption coefficient and a small, negligible difference of maxima bands values. Sample no 14 contains more Mn than sample 3, but only a small part of Mn changed valence to Mn3+. However, unlike sample 13, this change is permanent.
Due to irradiation, when the primary color of crystal sample 3 changes from pink to green, some point defects may cause variation in the local surroundings of Mn2+, so the double emission band was measured (Figure 4c). Said effect is not present in the spectra of irradiated sample 14. Irradiation of crystal sample 14 caused a change in the valence of manganese from (2+) to (3+) (Figure 3) and increased the number of lattice defects. Many of them were formed in the close vicinity of Mn3+ and balanced its extraordinary charge. Therefore, after heating, some of them remained Mn3+, and the remainder returned to valence (2+). This is not only seen as a change of crystal color, but also as a reduction in the intensity of the Mn2+ luminescence for this sample (Figure 2b).
It should be recalled here that for the pink spodumene of unknown origin but with a similar amount of Mn and Fe, one distinct and one weak band at 18,870 cm−1 (529 nm) and 23,260 cm−1 (423 nm) were measured [17]. It looks similar to the current spectrum (Figure 4a). These bands had been identified as coming from 6A1 → 4T1g and 6A1 → 4T2g transitions of Mn2+. However, this was incorrect for two reasons:
Firstly, a sharp, characteristic band of 6A1 → 4A1g,4Eg(4G) transition has not been measured, but it should clearly be seen between 400 and 450 nm from [19], its Figure 68, [29,30] and spectra published by minerals.gps.caltech.edu.
Second, it was demonstrated ([31] and cited therein) that for Mn-beating silicates, the molar absorption coefficient ε of Mn3+ bands is 5–30 times higher than that of Mn2+ bands. It is therefore very likely that the absorption spectrum presented by [17] corresponds to Mn3+.
For synthetic materials doped with Mn4+, absorption bands measured at 310–330 nm and 480–500 nm are the results of 4A2 → 4T1(4F) and 4T2(4F) transitions, respectively [32,33,34]. The emission band of Mn4+ has been measured for different synthetic crystals at 670–690 nm as narrow R lines reflecting the 2E → 4A2 transition with, in some cases at room temperature, a broad band reflecting the 4T2 → 4A2 transition [35,36,37,38]. The narrow emission line measured at 690.7 nm (Figure 2a–c and Figure 4c) was the Cr3+ emission line which corresponds to 2E → 4A2 transition, and was measured only for primary sample 3. As a result of irradiation and heating, a large number of lattice defects were formed in the spodumene crystal, so the emission band of Mn2+ became wider, and in its wing, the R-line was not visible.
The bands listed above have been measured on neither absorption nor emission spectra of irradiated pink spodumene. It can therefore be concluded that in the studied pink spodumene crystal, Mn3+ did not change to Mn4+. In the irradiated crystal, only Mn3+ and Mn2+ are present.
Due to the irradiation, the Mn3+-O distances increased and crystal-field strength decreased. The change of bond length due to X-rays is known [39]. For spodumene crystal, it was shown [40] that the HOMO (highest occupied molecular orbital) essentially comprises O atom electrons and that electrons on HOMO levels would easily transfer and participate in other systems for bonding. The range of allowed energy of 2p oxygen electrons is large enough to contain electrons from slightly shifted oxygens. According to our research, the effect of X-rays was as intense as in [39], because it lasted 24 h, not 20 h. Thus, it has been proven that under the irradiation, the valence of the manganese ion did not change from 3 to 4, but the Mn-O bond lengths were changed, which caused a change in color.
- (b)
- Second issue: what is the effective symmetry of the crystal field—tetragonal, as was proposed by Ito et al. [21], or monoclinic?
The assignment of measured bands to electronic transitions is not unambiguous.
For the primary crystal, the absorption bands at 529, 585 (weak) and 626 nm could be recognized due to transitions of Mn3+ occupying the crystal site of tetragonal a of low symmetry, most probably C2v or C2.
If Mn3+ is presence in tetragonal field, two bands in visible region should be indicated. According to [41], the Dq, Dt and Ds parameters were calculated (Table 3) from the energy of transitions:
- υ1: 5B1g(5E) →5A1g(5E) – 1630 nm, i.e., 6135 cm−1 = 4 · Ds + 5 · Dt
- υ2: 5B1g(5E) →5B2g(5T2) – 624 nm, i.e., 16,025 cm−1 = 10 · Dq
- υ3: 5B1g(5E) →5Eg(5T2) – 529 nm, i.e., 18,904 cm−1 = 3 · Ds − 5 · Dt + 10 · Dq
The crystal field stabilization energy (CFSE) equals = 11,083 cm−1; i.e., 131.88 kJ/mol. This is less than for pink and purple vesuvianite and for Mn3+ beryllium [26,27]. Due to irradiation, the CFSE (Table 3) changed to 11,029 cm−1, i.e., 131.20 kJ/mol—meaning a 0.5% decrease, as should happen for a reversible process. This difference could be also expressed in equivalent temperature and is equal to ΔT = 78 K. However, this does not correspond to our experimental results. The color change took place only after heating in T = 250 °C. According to [21] data, for the primary lilac crystal CFSE = 16,910 cm−1, i.e., 202.28 kJ/mol (2.096 eV), and for the irradiated green crystal, CFSE = 14,610 cm−1, i.e., 174.77 kJ/mol (1.811 eV), meaning a 13.6% decrease. This difference, too, can be expressed in equivalent temperature and is equal to 3300 K. The change in CFSE is too large for a reversible process.
The calculation of tetragonal distortion of crystal site from spectroscopic data was proposed [42]. From the Dq and Dt parameters, the Dq(z) and Dq(xy) parameters can be calculated from: and [21].
The Dq(z) and Dq(xy) parameters are associated with the z-axis and xy-axes or equatorial ligands, respectively. The significant difference between Dq(xy) and Dq(z) implies that the tetragonal distortion of this site is quite large. Using the approximation of ligand-field theory, we have Dq∝(1/r)5, where r is the M–O bond length. Hence, the r(xy)/r(z) = (Dq(z)/Dq(xy))1/5 could be calculated (Table 3). For samples studied by [21], this ratio approaches 1, as bond length in z direction decreased, while in the x, y direction, it increased (Table 3). In [21] for the M1 site, directions x, y and z were chosen as in Figure 5. Configurational isomerism (trans-cis of M-O bonds) was considered to be more important than the similarity of bond lengths. The longest bonds are M1–O1a, and the shortest M1–O2.
In view of our experimental results, the thesis of tetragonal crystal site stabilizing d4 ion does not hold up, as Dq(z):Dq(xy) is greater than 1. Moreover, contrary to Ito et al. [21], bonds in z, x and y directions increase. From Figure 5, it is clear that the M2 site cannot have fourfold axis symmetry along z direction, because the nature of O3 and that of O1 oxygen are different. O3 oxygens are bridging, while O1 oxygens are non-bridging. This leads us to an additional conclusion that in the studied spodumene, Mn3+ does not occupy a site with tetragonal symmetry.
For d4 ions in C2v symmetry sites, considering four absorption bands involving the bands at 628 nm and 440 nm as connected with Mn3+, the following transitions could be proposed:
- υ1: 5B1(5E) → 5A1(5Eg) were not observed and a value of 6000 cm−1 can be assumed for it;
- υ2: 5B1(5E) → 5A1(5T2g) at 624 nm (16,025 cm−1) and 628 nm (15,923 cm−1);
- υ3: 5B1(5E) → 5B2(5T2g) at 529 nm (18,904 cm−1) and 536 nm (18,657 cm−1);
- υ4: 5B1(5E) → 5A2(5T2g) at 440 nm (22,727 cm−1) and 447 nm (22,371 cm−1).
For the primary crystal, 10Dq = 16,218 cm−1, CFSE = 12,290 cm−1, i.e., 147.02 kJ/mol (1.524 eV), and after irradiation, 10Dq = 15,984, CFSE = 12,112 cm−1, i.e., 144.89 kJ/mol (1.502 eV). Due to irradiation, 10Dq and CFSE decreased, this time by 1.4%. This difference could again be expressed in equivalent temperature and is equal to ΔT = 255 K, which is confirmed by the experimental results we obtained.
The results presented above and those by Ito et al. [21] show that Mn3+ can occupy site with monoclinic site symmetry only.
- (c)
- Does Mn3+ exist in M1 or M2 site?
At first, it may be noted that the known spectra of pink spodumene differ slightly. For the pink spodumene from Minas Gerais, Brazil [6,21,23,24], the 530 nm band appears as the only one or is clearly more intense than the 630 nm band. Meanwhile, for samples from Pala, California [18] or Afghanistan [11,17], the 530 nm band does not stand out as much more intense than the others. Perhaps in the first one, Mn3+ occupies M1 (Al) site, since the absorption spectrum is typical of axial symmetry, while in the second sample, Mn3+ is present in site M2 (Li) with lower symmetry.
Differences in ionic radii of Li+, Al3+, Mn2+ and Mn3+ (0.076, 0.054, 0.083 and 0.065 nm, respectively) [22] indicate that the substitution of manganese ion for Li+ is geometrically more favorable. Such a substitution was found in the γ-LiAlO2 single crystal [43] in which both Al and Li are coordinated by four oxygen. Mn2+ was located in LiO4 tetrahedron. The larger size favor and greater deformation favored this development. As a result of this low symmetry (C2), the excitation band 4E4A was split into two bands at 417 and 428 nm, so the splitting was pretty large (674 cm−1). For the spodumene crystals, the excitation band 4E4A was split into two bands at 408 nm, i.e., 24,510 cm−1 and 415 nm, i.e., 24,096 cm−1, so the splitting has value 414 cm−1 (Table 2, Figure 2e). However, Mn2+ → Li+ substitution must be compensated by the creation of Li+ vacancies, randomly distributed in the volume of the samples. After irradiation, when Mn2+ changes to Mn3+, a greater number of electron defects should be created. Radiation quite easily removes electron from the weak bond O2-. The low symmetry of the crystal field caused the absorption spectra to be similar to those at Figure 4a,b. That was also very likely the case for the pink spodumene from Pala [18], its Figure 2b.
On the other hand, the Mn2+ and Mn3+ substitution for Al3+ occurs often in minerals. Substitution of Mn3+ for Al3+ in the M1 site does not require any charge balance. If, during crystal growth, manganese is introduced into a spodumene crystal as Mn3+, then it most likely occupies the M1 site. Now, due to the higher symmetry of the crystal field, one can expect an absorption spectrum similar to those of beryllium [26,27] or to those of the spodumene from Minas Gerais, Brazil [21,24]. It seems logical to assume that in this case, the majority of manganese ions have (3+) valence. In this case, it is the emission of this ion which should predominate, not that of Mn2+. We do not have such a spodumene crystal, nor do we know of any references about Mn3+ emission in spodumene. Only the emission of Mn2+ is measured. For example, [17] measured the pink spodumene emission band of Mn2+ at 625 nm and assigned it to the M1 site.
On the other hand, it has been shown in previous works [14] and in the current study that Mn2+ in spodumene prefers the M2 site. Such a substitution requires either cation vacancies or additional electron centers. Mn2+ occupying the M2 site can easily change its valence to (3+) after irradiation and heating, as was observed for spodumene crystal 14.
For the pink spodumene crystal studied here (sample 3), it can be seen that only a part of the manganese has a valence (3+); the rest remained as ions (2+). The Mn3+ occupying the M2 site requires the presence of even more electron defects than the original Mn2+. In addition, defects must somehow arise in its vicinity. It can therefore be assumed that the number of Mn3+ in the M2 site will not be significant. The resulting pink color will not be very intense and can easily be lost.
The M1 cation is coordinated by four O1 and two O2 atoms, and the M2 cation is coordinated by two O1, two O2 and two O3 atoms. In terms of classical Pauling bond strengths, O1 is approximately charge-balanced, O2 is highly underbonded and O3 is highly overbonded. The apparent charge imbalances are largely eliminated by variations in cation–oxygen bond distances: for example, bonds to the underbonded O2 oxygen atoms are typically shortened, whereas those to the overbonded O3 atoms are lengthened. Changing the Mn-O length is therefore easier for the M2 site than for M1. Such changes in the length of bonds do not cause significant changes in the CFSE value. For this reason, they are probably more common.
4. Conclusions
The presented results and discussion allow one to formulate the following conclusions:
- After X-ray irradiation, over 24 h, the spodumene crystals, whether colorless or pink, changed their color to green, but without changing the Mn3+ valence to Mn4+. Therefore, the presence of Mn4+ in the irradiated sample was excluded.
- It is very likely that Mn3+ occupies the M2 site of monoclinic symmetry. According to the absorption transitions, the changes in 10Dq and in CFSE values for the irradiated crystal are not very significant, and the color change process can be reversed.
- Mn3+ can occupy the M1 site if is introduced into a spodumene lattice during crystal growth. The absorption spectrum of such a crystal exhibited one distinct band at 530–540 nm, and the emission of the Mn2+ present in this site is measured at 625 nm.
- For other pink spodumene crystals, the absorption spectra as at Figure 4a,b are appropriate for manganese ions (2+) and (3+) present in the M2 site, and its coloration was caused artificially. Such crystals initially contained only Mn2+. Some of these ions changed their valence to (3+) due to irradiation and heating.
- Spodumene is a crystal that easily changes color from pink to green and can easily create optically active point defects in it. For this reason, it can be used in optics as a material with the possibility of modulating emission colors.
Author Contributions
Conceptualization, M.C.; investigation/measurements, M.C., R.L., M.K.-G. and A.W.; resources, M.C.; original draft preparation, M.C.; writing—review and editing, M.C.; visualization, M.C., R.L. and A.W. All authors have read and agreed to the published version of the manuscript.
Funding
This research project was supported by working Group of Faculty of Natural Science, Institute of Earth Sciences, University of Silesia WNO/INoZ/2020_ZB02.
Conflicts of Interest
The authors declare no conflict of interest.
References
- Tribaudino, M.; Nestola, F.; Prencipe, M.; Rundolf, H. A single-crystal neutron-diffraction investigation of spodumene at 54 K. Can. Mineral. 2003, 41, 521–527. [Google Scholar] [CrossRef] [Green Version]
- Robinson, K.; Gibbs, G.; Ribbe, P.H. Quadratic elongation: A quantitative measure of distortion in coordination polyhedra. Science 1971, 172, 567–570. [Google Scholar] [CrossRef] [PubMed]
- Brown, I.D.; Shannon, R.D. Empirical bond-strength-bond-length curves for oxides. Acta Crystall. 1973, A29, 266–282. [Google Scholar] [CrossRef]
- Bakhin, A.I.; Manapov, R.A. Investigation of clinopyroxenes by optical and Mössbauer spectroscopy. Geochem. Int. 1976, 13, 81–88. (In Russian) [Google Scholar]
- Platonov, A.N.; Taran, M.N.; Balitsky, V.S. Nature of Colour of Gems; Niedra: Moscow, Russia, 1984. (In Russian) [Google Scholar]
- Fuju, A.T.; Isotani, S. Optical absorption study of five varieties of spodumene. An. Acad. Bras. Ciênc. 1988, 60, 127–135. [Google Scholar]
- De Grave, E.; Van Alboom, A.; Eeckhout, S.G. Electronic and magnetic properties of a natural aegirine as observed from its Mössbauer spectra. Phys. Chem. Miner. 1998, 25, 378–388. [Google Scholar] [CrossRef]
- Schmidbauer, E.; Kunzmann, T. Electrical conductivity, thermopower and 57Fe Mössbauer spectroscopy of aegirine (NaFeSi2O6). Phys. Chem. Miner. 2004, 31, 102–114. [Google Scholar] [CrossRef]
- Filip, J.; Novák, M.; Beran, A.; Zbořil, R. Crystal chemistry and OH defect concentrations in spodumene from different granitic pegmatites. Phys. Chem. Miner. 2006, 32, 733–746. [Google Scholar] [CrossRef]
- Katerinopoulou, A.; Grodzicki, M.; Tippelt, G. Mössbauer spectroscopy and molecular orbital calculations on iron bearing omphacite. Miner. Petrol. 2013, 107, 281–287. [Google Scholar] [CrossRef]
- Czaja, M.; Lisiecki, R.; Kądziołka-Gaweł, M.; Winiarski, A.; Krzykawski, T. The afterglow effect of Mn-bearing natural LiAlSi2O6 spodumene crystals. Opt. Mater. 2019, 96, 109321. [Google Scholar] [CrossRef]
- Burns, R. Mineralogical Applications of Crystal Field Theory; Cambridge University Press: Cambridge, UK, 1993. [Google Scholar]
- Khomenko, V.M.; Platonov, A.N. Electronic absorption spectra of Cr3+ ions in natural clinopyroxenes. Phys. Chem. Miner. 1985, 11, 261–265. [Google Scholar] [CrossRef]
- Walker, G.; El Jaer, A.; Sherlock, R.; Glynn, T.J.; Czaja, M.; Mazurak, Z. Luminescence spectroscopy of Cr3+ and Mn2+ in spodumene (LiAlSi2O6). J. Lumin. 1997, 72–74, 27–280. [Google Scholar] [CrossRef]
- O’Bannon, E.; Williams, Q. A Cr3+ luminescence study of spodumene: Effects of site geometry, phase transition, and a level-crossing. Am. Mineral. 2016, 101, 1406–1413. [Google Scholar] [CrossRef]
- Chadwick, K.M.; Shen, A.H.; Laurs, B.M.; Simmons, W.B.; Falser, A.U. Cr/V-bearing green spodumene from Afghanistan. Gems. Gemol. 2007, 43, 265. [Google Scholar]
- Chandrasekhar, B.K.; White, W.B. Polarized luminescence spectra of kunzite. Phys. Chem. Miner. 1992, 18, 433–440. [Google Scholar] [CrossRef]
- Claffy, E.W. Composition, tenebrescence and luminescence of spodumene minerals. Am. Mineral. 1953, 38, 919–931. [Google Scholar]
- Platonov, A.N. Priroda Okraski Minieralow; Naukova Dumka: Kiev, Ukraine, 1976. (In Russian) [Google Scholar]
- Nassau, K. The Physics and Chemistry of Color—The Fifteen Causes of Color; John Wiley and Sons: NewYork, NY, USA, 1983; pp. 201–202. [Google Scholar]
- Ito, A.S.; Isotani, S. Heating effects on the optical absorption spectra of irradiated, natural spodumene. Radiat. Effects Defects Solids 1991, 116, 307–314. [Google Scholar] [CrossRef]
- Souza, S.O.; Watanabe, S.; Lima, A.F.; Lalic, M.V. Thermoluminescence mechanism in lilac luminescence. Acta Phys. Pol. Ser. A 2007, 112, 1001–1006. [Google Scholar] [CrossRef]
- Schmitz, B.; Lehmann, G. Color Centers of Manganese in Natural Spodumene LiAlSi2O6. Ber. Bunsenges. Phys. Chem. 1975, 79, 1044–1049. [Google Scholar] [CrossRef]
- Oliveira, R.A.P.; Mello, A.C.S.; Lima, H.R.B.R.; Santos Campos, S.; Souza, S.O. Radiation detection using the color changes of lilac spodumene. In Proceedings of the International Nuclear Atlantic Conference—INAC 2009, Rio de Janeiro, RJ, Brazil, 27 September–2 October 2009; ISBN 978-85-99141-03-8. [Google Scholar]
- Curie, D.; Barthou, C.; Canny, B. Covalent bonding of Mn2+ ions in octahedral and tetrahedral coordination. J. Chem. Phys. 1974, 61, 3048–3062. [Google Scholar] [CrossRef]
- Fridrichová, J.; Bačík, P.; Ertl, A.; Wildner, M.; Dekan, J.; Miglierini, M. Jahn-Teller distortion of Mn3+-occupied octahedra in red beryl from Utah indicated by optical spectroscopy. J. Mol. Struct. 2018, 1152, 79–86. [Google Scholar] [CrossRef]
- Czaja, M.; Lisiecki, R.; Chrobak, A.; Sitko, R.; Mazurak, Z. The absorption-and luminescence spectra of Mn3+ in beryl and vesuvianite. Phys. Chem. Miner. 2018, 45, 475–488. [Google Scholar] [CrossRef] [Green Version]
- Isotani, S.; Watari, K.; Mizukami, A.; Bonventi, W., Jr.; Ito, A.S. UV optical absorption analysis of spodumene crystals from Brazil. Physica B 2007, 391, 322–330. [Google Scholar] [CrossRef]
- Manning, P.G. Absorption spectra of the manganese bearing chain silicates pyroxmangite, rhodonite, bustamite and serandite. Can. Mineral. 1968, 9, 348–357. [Google Scholar]
- Manning, P.G. Racah parameters and their relationship to lengths and covalencies of Mn2+- and Fe3+-oxygen bonds in silicates. Can. Mineral. 1970, 10, 677–688. [Google Scholar]
- Smith, G.; Halenius, U.; Langer, K. Low temperature spectral studies of Mn3+- bearing andalusite and epidote type minerals in the range 30,000–5000 cm. Phys. Chem. Miner. 1982, 8, 136–142. [Google Scholar] [CrossRef]
- Stedman, G.E. Interpretation of the Crystal Field for V2+, Cr3+, and Mn4+ in Corundum. J. Chem. Phys. 1969, 51, 4123–4125. [Google Scholar] [CrossRef]
- Suchocki, A.; Allen, J.D.; Powell, R.C. Spectroscopy and four-wave mixing in Li4Ge5O12:Mn4+ crystals. Phys. Rev. B 1987, 36, 6729–6734. [Google Scholar] [CrossRef]
- Brik, M.G.; Sildos, I.; Berkowski, M.; Suchocki, A. Spectroscopic and crystal field studies of YAlO3 single crystals doped with Mn ions. J. Phys. Condens. Matter. 2009. [Google Scholar] [CrossRef]
- Zhydachevskii, Y.; Galanciak, D.; Kobyakov, S.; Berkowski, M.; Kamińska, A.; Suchocki, A.; Zakharko, Y.; Durygin, A. Photoluminescence studies of Mn4+ ions in YAlO3 crystals at ambient and high pressure. J. Phys. Condens. Matter. 2006, 18, 11385–11396. [Google Scholar] [CrossRef]
- Gaft, M.; Stręk, W.; Nagli, L.; Panczer, G.; Rossman, G.R.; Marciniak, L. Laser-induced time-resolved luminescence of natural sillimanite Al2SiO5 and syntheticAl2SiO5 activated by chromium. J. Lumin. 2012, 132, 2855–2862. [Google Scholar] [CrossRef]
- Cao, R.; Zhang, F.; Cao, C.; Yu, X.; Liang, A.; Guo, S.; Xue, H. Synthesis and luminescence properties of CaAl2O4:Mn4+ phosphor. Opt. Mater. 2014, 38, 53–56. [Google Scholar] [CrossRef]
- Erdem, U.; Esra, Ö.; Kalaycioglu Ozpozan, N.; Karacaoglu, E. Thermoluminescence and photoluminescence properties of Mn4+, Pr3+,4+, Nd4+ and Eu3+ in MgAl2Si2O8. J. Lumin. 2016, 173, 73–81. [Google Scholar] [CrossRef]
- Yu, K.M.; Walukiewicz, W.; Muto, S.; Jin, H.C. The effects of x-ray induced structural changes on the microstructure of a-Si after thermal crystallization. Appl. Phys. Lett. 1999, 75, 2032–2034. [Google Scholar] [CrossRef]
- He, G.C.; Xiang, H.M.; Jiang, W.; Kang, Q.; Chen, J.H. First-principles theory on electronic structure and floatability of spodumene. Rare. Met. 2014, 33, 742–748. [Google Scholar] [CrossRef]
- Sherman, D.M.; Vergo, N. Optical spectrum, site occupancy, and oxidation state of Mn in montmorillonite. Am. Mineral. 1988, 73, 140–144. [Google Scholar]
- Shannon, R.D. Revised effective ionic radii and systematic studies of interatomic distances in halides and chalcogenides. Acta Crystallogr. A 1976, 32, 751–767. [Google Scholar] [CrossRef]
- Brik, M.G.; Teng, H.; Lin, H.; Zhou, S.; Avram, N.M. Spectroscopic and crystal field studies of LiAlO2:Mn2+ single crystals. J. Alloys Compd. 2010, 506, 4–9. [Google Scholar] [CrossRef]
Figure 1.
Sketch of spodumene structure on (010) using Vesta 3 program and American Mineralogist Crystal Structure Database. (a) Double c unit; (b) M1 polyhedron only; (c) M2 polyhedron only. SiO4 tetrahedrons—light brown color; M1 octahedrons—blue color; M2 octahedrons—green color; O1 atoms—magenta balls; O2 atoms—red balls; O3 atoms—brown balls; Si atoms—yellow balls; Al atoms—blue balls; and Li atoms—pale green balls.

Figure 2.
(a) Emission spectra of Mn2+ for sample 3, T = 300 K and T = 7 K. (b) Emission spectra of studied samples, T = 7 K. (c) Emission spectra of of Mn2+ for samples 3 and 14, primary and irradiated and heated, T = 7 K. (d) Polarized excitation spectra of Mn2+ for sample 3, T = 300 K. (e) Polarized excitation spectra of Mn2+ for sample 3, T = 7 K. (f) Polarized emission spectra of Mn2+ for sample 3, T = 300 K.


Figure 3.
Studied samples before and after irradiation and heating.

Figure 4.
(a) Absorption spectra of primary and irradiated sample 3 measured at T = 7 K. (b) Absorption spectra of irradiated and heated sample 14 measured at T = 7 K. (c) Emission spectra of primary and irradiated sample 3 measured at T = 7 K.
Figure 4.
(a) Absorption spectra of primary and irradiated sample 3 measured at T = 7 K. (b) Absorption spectra of irradiated and heated sample 14 measured at T = 7 K. (c) Emission spectra of primary and irradiated sample 3 measured at T = 7 K.

Figure 5.
The sketch of the crystal structure of spodumene projected down a axis, made on the base [1].
Figure 5.
The sketch of the crystal structure of spodumene projected down a axis, made on the base [1].


Table 1.
The chemical compositions of the studied samples.
| Oxide Content | Sample 3 | Sample 14 | Sample 13 | Sample 36a |
|---|---|---|---|---|
| Major chemical constituents (wt%) | ||||
| SiO2 a | 64.510 | 64.48 | 64.46 | 64.44 |
| Al2O3 a | 27.280 | 27.25 | 27.19 | 27.28 |
| Li2O * | 8.016 | 7.970 | 7.885 | 8.028 |
| Na2O3 b | 0.110 | 0.13 | 0.11 | 0.090 |
| FeO b | 0.025 | 0.09 | 0.27 | 0.130 |
| MnO b | 0.059 | 0.079 | 0.085 | 0.032 |
| Trace element contents from ICP-MS (ppm) | ||||
| Element (MDL **) | ||||
| Mn (2) | 459 | 612 | 663 | 250 |
| Fe (20) | 200 | 700 | 2100 | 200 |
| Be (1) | 16 | 17 | 16 | 15 |
| Sc (0.1) | 0.9 | 1.1 | 1.1 | 1.1 |
| Na (20) | 820 | 990 | 840 | 660 |
| Sc (0.1) | 0.9 | 1.1 | 1.1 | 1.1 |
| Ti (10) | 20 | 30 | 20 | 20 |
| Cr (1) | 3 | 4 | 4 | 4 |
| Cu (0.02) | 2.27 | 0.74 | 0.61 | 1.52 |
| Zn (0.2) | 1.3 | 17.5 | 11.4 | 26.3 |
| Ga (0.1) | 67.87 | 64.80 | 64.93 | 46.18 |
| Rb (0.1) | 3.3 | 4.4 | 0.2 | 0.5 |
| Cd (0.02) | 0.07 | 0.06 | 0.14 | 0.10 |
| Sn (0.1) | 109.7 | 157.2 | 132.5 | 129.0 |
| Cs (0.1) | 4.3 | 1.0 | 0.3 | 0.7 |
| W (0.1) | >200 | 15.5 | 0.7 | 11.1 |
| Pb (0.02) | 0.93 | 0.26 | 0.49 | 1.39 |
| sum (from Be to Pb) | 1251 | 1305 | 1094 | 918 |
a From EPMA; b from ICP-MS; * calculated to clos sum to 100%; ** MDL, method detection limit.
Table 2.
Measured and calculated energies of absorption transitions of Mn2+ ion.
| Bands | Transitions | Energy of Transitions | |||
|---|---|---|---|---|---|
| Measured at T = 300 K | Calculated (cm−1) | ||||
| (nm) | (cm−1) | Tanabe-Sugano a | Curie et al. [25] b | ||
| υ1 | 6A1(S) → 4T1g(4G) | 483 | 20,700 | 15,686 | 19,040 |
| υ2 | 6A1(S) → 4T2g(4G) | 431 | 23,200 | 19,139 | 20,855 |
| υ3 | 6A1(S) → 4Eg(4G) | 408 | 24,510 | 24,038 | 23,400 |
| υ3 | 6A1(S) → 4A1g(4G) | 415 | 24,096 | 23,185 | |
| Δ(4A, 4E) | 414 | 215 | |||
| υ4 | 6A1(S) → 4T2g(D) | 360 | 27,777 | ? | 28,650 |
| υ5 | 6A1(S) → 4Eg(D) | 333 | 30,030 | 30,300 | 32,800 |
a B = 856 cm−1, C = 3095 cm−1, 10Dq = 2022 cm−1; b B = 844 cm−1, C = 3190 cm−1, 10Dq = 5200 cm−1, Nt2Ne2 = 0.975, Δ(4A, 4E) = 215 cm−1.
Table 3.
Spectroscopic parameters of Mn3+ in tetragonal site symmetry.
| Spectroscopic Parameters | Spodumene Crystals | ||||
|---|---|---|---|---|---|
| Units | Current Study | [21] | |||
| (3) Pink Primary | (3) Green X-ray Irradiated | Lilac Primary | Green γ−Irradiated | ||
| 5B1g(5E) →5A1g(5E) | (nm) | 1630 | 1630 | 870 | 952 |
| (cm−1) | 6135 | 6135 | 11,500 | 10,500 | |
| 5B1g(5E) →5B2g(5T2) | (nm) | 624 | 628 | 537 | 641 |
| (cm−1) | 16,025 | 15,923 | 18,600 | 15,600 | |
| 5B1g(5E) →5Eg(5T2) | (nm) | 529 | 536 | 454 | 465 |
| (cm−1) | 18,904 | 18,656 | 22,000 | 21.500 | |
| Dq | (cm−1) | 1603 | 1592 | 1860 | 1560 |
| CSFE | 11,083 | 11,025 | 16,910 | 14,610 | |
| Dt | 197 | 213 | 597 | 226 | |
| Ds | 1288 | 1267 | 2129 | 2343 | |
| Dq(z) | 1833 | 1592 | 1164 | 1296 | |
| Dq(xy) | 1488 | 1219 | 2208 | 1692 | |
| - | 1.04 | 1.05 | 0.879 | 0.948 | |
© 2020 by the authors. Licensee MDPI, Basel, Switzerland. This article is an open access article distributed under the terms and conditions of the Creative Commons Attribution (CC BY) license (http://creativecommons.org/licenses/by/4.0/).
Share and Cite
MDPI and ACS Style
Czaja, M.; Lisiecki, R.; Kądziołka-Gaweł, M.; Winiarski, A. Some Complementary Data about the Spectroscopic Properties of Manganese Ions in Spodumene Crystals. Minerals 2020, 10, 554. https://doi.org/10.3390/min10060554
AMA Style
Czaja M, Lisiecki R, Kądziołka-Gaweł M, Winiarski A. Some Complementary Data about the Spectroscopic Properties of Manganese Ions in Spodumene Crystals. Minerals. 2020; 10(6):554. https://doi.org/10.3390/min10060554
Chicago/Turabian StyleCzaja, Maria, Radosław Lisiecki, Mariola Kądziołka-Gaweł, and Antoni Winiarski. 2020. "Some Complementary Data about the Spectroscopic Properties of Manganese Ions in Spodumene Crystals" Minerals 10, no. 6: 554. https://doi.org/10.3390/min10060554
Note that from the first issue of 2016, this journal uses article numbers instead of page numbers. See further details here.