Article

TAL Effector Repertoires of Strains of Xanthomonas phaseoli pv. manihotis in Commercial Cassava Crops Reveal High Diversity at the Country Scale

by
Carlos A. Zárate-Chaves
1,2,
Daniela Osorio-Rodríguez
2,
Rubén E. Mora
3,
Álvaro L. Pérez-Quintero
1,
Alexis Dereeper
1,
Silvia Restrepo
4,
Camilo E. López
3,
Boris Szurek
1 and
Adriana Bernal
2,*
1
PHIM, CIRAD, INRAe, IRD, Montpellier SupAgro, University of Montpellier, 34090 Montpellier, France
2
Laboratorio de Interacciones Moleculares de Microorganismos Agrícolas, Departamento de Ciencias Básicas, Universidad de los Andes, Bogotá 111711, Colombia
3
Manihot Biotec, Departamento de Biología, Universidad Nacional de Colombia, Bogotá 111321, Colombia
4
Laboratorio de Micologíay Fitopatología de la Universidad de los Andes (LAMFU), Departamento de Ciencias Básicas, Universidad de los Andes, Bogotá 111711, Colombia
*
Author to whom correspondence should be addressed.
Microorganisms 2021, 9(2), 315; https://doi.org/10.3390/microorganisms9020315
Submission received: 15 November 2020 / Revised: 17 December 2020 / Accepted: 24 December 2020 / Published: 4 February 2021

Abstract

:
Transcription activator-like effectors (TALEs) play a significant role for pathogenesis in several xanthomonad pathosystems. Xanthomonas phaseoli pv. manihotis (Xpm), the causal agent of Cassava Bacterial Blight (CBB), uses TALEs to manipulate host metabolism. Information about Xpm TALEs and their target genes in cassava is scarce, but has been growing in the last few years. We aimed to characterize the TALE diversity in Colombian strains of Xpm and to screen for TALE-targeted gene candidates. We selected eighteen Xpm strains based on neutral genetic diversity at a country scale to depict the TALE diversity among isolates from cassava productive regions. RFLP analysis showed that Xpm strains carry TALomes with a bimodal size distribution, and affinity-based clustering of the sequenced TALEs condensed this variability mainly into five clusters. We report on the identification of 13 novel variants of TALEs in Xpm, as well as a functional variant with 22 repeats that activates the susceptibility gene MeSWEET10a, a previously reported target of TAL20Xam668. Transcriptomics and EBE prediction analyses resulted in the selection of several TALE-targeted candidate genes and two potential cases of functional convergence. This study provides new bases for assessing novel potential TALE targets in the Xpm–cassava interaction, which could be important factors that define the fate of the infection.

1. Introduction

Transcription activator-like effectors (TALEs) play a significant role for pathogenesis and virulence in several xanthomonads. Disruption or knocking out of some TALE encoding genes significantly affects the virulence of the pathogen or even abolishes pathogenicity [1,2,3,4,5,6,7,8,9,10,11,12]. This family of effectors shares a particular structure evolved to selectively bind plant host promoters and recruit the RNA polymerase complex in order to initiate transcription of downstream genes [13,14]. TALE proteins include a signal for translocation through the type III secretion system (T3SS) [15], nuclear localization signals (NLS) [16] and an acidic transcriptional activation domain (AAD) to promote transcription in the host cell [17]. The central region of the effector contains modular tandem repeats mainly composed of 33–35 amino acids [18,19] whose sequence varies primarily at residues 12th and 13th (so-called “repeat variable diresidue”, RVD). RVDs interact with DNA bases with a nucleotide recognition preference [20,21,22,23,24], ruling the DNA sequence recognition. Sequences targeted by TALEs are usually located within or near the promoter of target genes, and are termed Effector Binding Elements (EBEs) [1]. After secretion, TALEs interact with host transcription factors like TFIIAγ subunits, to induce polymerase II–dependent transcription [25].
Many host genes targeted by TALEs have been described for the rice-Xanthomonas oryzae pathovars oryzae (Xoo) and oryzicola (Xoc), but data are also available for wheat [26], citrus, cotton, pepper, tomato, and cassava-interacting Xanthomonas (reviewed by [4]). TALE targets whose activation during infection is promoting host disease are defined as susceptibility (S) genes, many of which are nutrient transporters. For example, TALE-mediated activation of SWEET sugar transporters in rice, cotton and cassava leads to promotion of virulence potentially through nutrient hijacking [10,27,28], while activation of sulfate transporter OsSULTR3;6 in rice may alter redox status or osmotic equilibrium to interfere with defense signaling and induce water-soaking [3]. In wheat, induction by TAL8 of Xanthomonas translucens pv. undulosa of a gene involved in abscisic acid regulation alters water management in favor of the pathogen [26]. Other S genes include plant transcription factors, which control more complex host cellular processes through multiple indirect targets [2,6,9,10,12]. In pepper, AvrsBs3-dependent activation of upa20, a basic helix-loop-helix (bHLH) family member, induces hypertrophy [12], while AvrHah1-dependent activation of bHLH3 and bHLH6 upregulates cell wall-degrading enzymes [10]. In citrus, PthA4-mediated (and its functional equivalents) activation of the transcription factor CsLOB1, results in pustule development, which may be dependent on activation of DNA-interacting secondary targets [2,29].
Xanthomonas phaseoli pv. manihotis (Xpm), previously known as Xanthomonas axonopodis pv. manihotis [30], is a Gram-negative vascular pathogen responsible for Cassava Bacterial Blight (CBB). CBB has been reported in all the continents where cassava is grown [31]. As other xanthomonads, Xpm uses a suite of effectors to manipulate physiological processes in host plant cells. Xpm has up to 24 effectors that are translocated to the host cytoplasm through the T3SS (termed type III effectors), including members of the TALE family [32]. Population diversity studies using TALE1Xam (a.k.a pthB) as a probe showed that all isolates from Latin-American and African Xpm collections carry TALEs [33,34,35,36,37]. Illumina-based genomic sequencing of more than 60 Xpm strains later confirmed that all strains contain at least one TALE [32,38]. Full Xpm TALE sequence is available for only eight effectors [8,39,40], and only two complete Xpm TALomes (whole set of TALEs present in a strain) have been reported so far [8,39].
Information about Xpm TALEs and their target genes in cassava has been growing in the last years. The first TALE characterized in Xpm is TALE1Xam (contains 14 repeats), which has an important role in pathogenicity [40], but whose targets remain unknown [8,39,40,41]. Cohn and coworkers [8] deciphered the contribution of each of the five TALEs of strain Xam668, showing that mutant strains for TAL14Xam668 and TAL20Xam668 significantly affected pathogen fitness characterized by reduction of bacterial growth and/or symptom formation. Importantly they also demonstrated that TAL20Xam668 induces the S gene MeSWEET10a, which codes for a clade-III sugar transporter from the SWEET family.
Studying cassava pathogens is highly relevant since this crop is one of the most important starchy root crops for food security in America, Africa and Asia [42]. The annual worldwide production of cassava is estimated to 270 million tons and serves as a staple food for more than 800 million people, mainly in tropical countries. This and its tolerance to drought, make it an important food security crop [43,44]. CBB is the most devastating bacterial disease of cassava, causing losses that range from 12% to 100% [31] depending on environmental conditions [45,46], with incidences ranging between 25% and 100% [46,47]. CBB symptoms include angular leaf spotting, blight, wilt, gum exudation, vascular necrosis, stem canker and dieback (reviewed by [48]). In Colombia, CBB was first described in 1971 [35]. More recently, Trujillo and coworkers described the genetic structure of Xpm populations in the most prominent cassava production regions, showing high susceptibility of the most common cultivars grown and a complex pathogen population structure in some of these regions [49,50].
Science-based crop resistance improvement and disease tackling require a compilation of knowledge to understand the cellular and molecular bases of plant-pathogen interactions. As Xanthomonas pathogenicity notably relies on TALEs, knowledge on diversity and function of these effectors, in conjunction with resistance (R) proteins, are a cornerstone for resistance breeding in the affected crops [51,52,53,54]. Among the mechanisms of resistance associated with TALEs [55], recessive resistance is mediated by loss-of-susceptibility (LoS) alleles, where alternative alleles of an S gene that does not possess the EBE on the promoter sequence prevent the recognition and upregulation of the S gene (reviewed by [53]). As previously stated, only one S gene has been described for cassava (MeSWEET10a) as a direct target of TALE20Xam668 [8]. No LoS alleles, executor genes or TALE-recognizing nucleotide-binding leucine-rich repeat (NLR) receptors in cassava have been reported so far. In this work we aimed to characterize the TALE diversity of one of the best characterized Xpm populations in the world. We sequenced the repeat regions of 46 TALEs from 18 Xpm strains, including the complete TALomes from seven strains. We also aimed to determine functional diversity of the potential TALE-targeted genes and to propose candidates that could contribute to a better understanding of this pathosystem. The TALE-affinity analyses, host target prediction, and transcriptomics on cassava plants inoculated with the pathogen resulted in potential novel targets that might be relevant for pathogenesis. This study expands our understanding of the complex interactions between Xpm and cassava by picturing the TALE diversity in the context of this pathosystem.

2. Materials and Methods

2.1. Bacterial Strains, Plant Material, Culture Conditions and Media

All Xanthomonas phaseoli pv. manihotis strains were previously collected in diversity studies of this pathogen from our group (Laboratorio de Micología y Fitopatología de la Universidad de los Andes, Universidad de los Andes, Colombia). All the selected strains were pathogenic to the highly CBB-susceptible variety 60444. Isolates from two geographically distant cassava productive regions in Colombia were selected through maximization of differences of neutral genetic diversity. Additionally, two strains, one per region, isolated at least one decade before the collection dates of most isolates, were selected as reference strains. Bacteria were streaked on YPG (yeast extract 5 gL−1, peptone 5 gL−1, glucose 5 gL−1, agar-agar 15 gL−1) solid media [35] and incubated for 48 h at 28 °C or grown in Phi broth (yeast extract 1 gL−1, peptone 10 gL−1, casaminoacids 1 gL−1) [35] at 28 °C, under constant shaking at 220 rpm for 24 h. Cassava cuttings from the cultivar 60444 were planted on individual peat pots and grown under greenhouse conditions (27 °C ± 5 °C; photoperiod 12:12, relative humidity >60%). Bacterial inoculations were performed on 3-month old plants. In vitro-grown plants from the same cultivar were grown as described elsewhere [56].

2.2. Aggressiveness Assays and Bacterial Growth Curves

Bacterial aggressiveness was quantified as the leaf lesion area formed by Xpm upon inoculation of 3-month-old cassava plants. Bacteria were cultured in liquid media and washed with 10 mM MgCl2 sterile solution. Cell density was adjusted to an OD600 of 0.2 (c.a. 2 × 10⁸ cfu/mL). Adjusted bacterial suspensions were inoculated by placing a 10-µL drop of inoculum over a 2-mm (Ø) hole made with a cork borer through the leaf tissue. Plants were kept in a greenhouse under the same conditions described above. Lesions were individually photographed at 15 days post-inoculation (dpi) in a stereoscope and areas were measured using Image-J software (version 1.48) [57]. Each treatment was inoculated once in three individual plants, and the aggressiveness assay was replicated three times.
Bacterial growth in planta was assessed as described elsewhere [58] except that inoculations were performed on the variety 60444 and 0, 5, and 10 dpi were evaluated. Each treatment was inoculated once in three different plants and the bacterial growth assessment was replicated two times.

2.3. Genomic DNA Extraction, Restriction Fragment Length Polymorphism (RFLP), and Southern Blot Analysis

A single colony of each Xpm strain was grown on Phi broth overnight. DNA was extracted from 2-mL bacterial pellets using the GeneluteTM Bacterial Genomic DNA kit (Sigma-Aldrich, St. Louis, MO, USA) according to manufacturer’s instructions. Genomic DNA concentration was determined by gel quantification and spectrophotometry on a NanoDropTM 1000 (Thermo Fisher Scientific, Waltham, MA, USA). Ten micrograms of each genomic DNA were digested with 120 units of BamHI-HF (NEB, Ipswich, MA, USA) sequentially added (3 times 40 units) over a 24-h incubation period. BamHI-digested DNA was precipitated using sodium acetate and ethanol [59] and then resuspended in TE solution. Electrophoresis of digested DNA was performed on a 0.8% agarose gel on 0.5× TBE (Thermo Fisher Scientific, Waltham, MA, USA); migration was performed at a constant power of 5 Watts for 20 h, in a cold room and with periodic buffer renewal. DNA blotting was performed according to Roche’s instruction manual for Digoxigenin application to filter hybridization [60]. The probe was synthesized from a conserved portion of the TALE1Xam (from nucleotide 2909 to 3409) DNA contained in pF3, a pBluescript derivative with a 5.4-kb fragment from CFBP1851 plasmid p44 containing the full TALE1Xam gene [35]. The probe was labeled with digoxigenin by means of the Random Primed DNA Labeling kit (Roche Diagnostics GmbH, Mannheim, Germany). Luminescent detection was achieved using chloro-5-substituted adamantyl-1, 2-dioxetane phosphate (CSPD) according to manufacturer’s instructions. Chemiluminescent images were acquired on the ChemiDoc XRS + System (BioRad, Hercules, CA, USA) with the Chemi Hi Resolution protocol and signal accumulation mode.

2.4. Isolation and Sequencing of TALEs

The isolation of TALE genes was achieved by two different approaches. The first one consisted of PCR amplification of the central repeat region using GoTaq polymerase (Promega, Madison, WI, USA) and subsequent cloning into pGEM®-T easy (Promega, Madison, WI, USA). Amplification was performed using 200 nM of primers 427 Fw (5′-CGGTGGAGGCAGTGCATG-3′) and 428 Rv (5′-ATCAGGGCGAGATAACTGGGC-3′); 1× GoTaq Green buffer, 1.5 mM MgCl2; 100 µM dNTPs, 20 mM betaine, 0.025 GoTaq polymerase units/µL and a total amount of 40 ng of template DNA in a final volume of 20 µL. PCR conditions were as follows: Initial denaturation at 94 °C for 3 min; then 25 cycles of 94 °C for 40 s, 60 °C for 40 s, and 72 °C for 3 min and 30 s. Cloning into pGEM®-T easy was performed according to manufacturer’s instructions. Ligation products were electroporated into E. coli DH5α cells. Screen of clones harboring inserts was performed using blue/white screening on LB agar using 5-bromo-4-chloro-3-indolyl-β-D-galactopyranoside (X-gal) and a PCR-based confirmation (as described above).
The second approach was based on direct cloning of TALE genes into pBlueScript. RFLP data was used to calculate the position of each TALE in the electrophoresed BamHI-digested DNA. For each strain, 70 µg of DNA were digested. Electrophoresis was carried out in a 0.8% agarose gel on 1× TAE; migration was performed at a constant power of 5 Watts for 5 h at room temperature. Gels were stained using a 3× GelRed (Biotium, Fremont, CA, USA) pool. Gels were quickly visualized in a ChemiDoc XRS+ System (BioRad, Hercules, CA, USA), regions where the expected TALE bands were excised and recovered using the Zymoclean™ Gel DNA Recovery Kit (ZymoResearch, Irvine, CA, USA) according to manufacturer’s instructions. pBlueScript was digested with BamHI-HF (NEB, Ipswich, MA, USA) and dephosphorylated with Antarctic Phosphatase (NEB, Ipswich, MA, USA) according to manufacturer’s instructions. Eluted DNA was ligated with the prepared vector with T4 DNA ligase (Thermo Fisher Scientific, Waltham, MA, USA) at 22 °C overnight. Transformation of ligations, screening and confirmation were performed as described earlier.
Sequencing of isolated TALE genes was carried out by standard Sanger chemistry (Macrogen Inc., Seoul, Korea) and the assembly of reported fragments was performed using the Geneious software (version R11). In the case of TALE genes obtained by PCR, they were only considered accurate if they were found in at least two rounds of independent amplifications and cloning, or if they were also cloned directly from digested DNA.

2.5. TALE Characterization and Clustering

Assembled TALE sequences were treated and classified in variants using an in-house script on R (version 3.6.1). TALEs were clustered by predicted DNA binding specificity using FuncTAL software (version 1.1) [61]; default parameters were used. TALEs were also clustered by nucleotide repeat composition using DisTAL software (version 1.1) [61]; default parameters were used.

2.6. In-Vitro Plant Inoculation and Cassava RNA Extraction

Xpm strains were cultured in liquid media and prepared, as described earlier. Inocula were adjusted to an OD600 of 0.02 (ca. 2 × 10⁷ cfu/mL) in a 10-mM MgCl2 solution. In-vitro propagated plants were inoculated with bacterial suspensions or mock solution (10-mM MgCl2) with a swab on axial and abaxial surfaces of punctured leaves (nine needle punctures per leaf); each treatment was inoculated on three leaves per plant and on three different plants. Tissue surrounding inoculated punctures was collected at 50 hpi using a 3-mm diameter cork borer. Total RNA was extracted with the Invitrap Spin plant RNA minikit (STRATEC, Birkenfeld, Germany), using the RP buffer per manufacturer’s instructions. Total RNAs were treated with RNase-free DNase I (Thermo Fisher Scientific, Waltham, MA, USA) and quality was controlled with the RNA 6000 Nano Kit (Agilent, Santa Clara, CA, USA).

2.7. RNA Sequencing and Transcriptome Analysis

Barcoded, paired-end (150-bp inserts) libraries were constructed with the TruSeq RNA Library Prep Kit (Illumina, Vancouver, British Columbia, Canada), per manufacturer’s instructions. RNA libraries were pooled and sequenced on four flow cells of the NextSeq500 System. RNAseq analyses were performed using the Kallisto pseudo-mapper [62] and EdgeR [63] for differential expression analysis by comparing against the mock-inoculated treatment on R (version 3.6.1). GO-term enrichment analyses were performed using the topGO package [64].

2.8. TALE Target Prediction and Candidate Analysis

TALE targets were predicted using four different software: TALVEZ [65], TAL Effector Nucleotide Targeter 2.0 (TALENT 2.0) [66], TALgetterLong [67] and PrediTALE [68]. The Manihot esculenta promoterome (1-kb sequences preceding annotated translational start sites) was extracted from Phytozome’s cassava genome version 6.1 [69], by means of the Biomart tool, and it was used as input for target prediction. All the algorithms were run using the default parameters. Output data were merged and compared on R (version 3.6.1) using an in-house script.

2.9. Semi-Quantitative and Quantitative RT-PCR

Xpm strains were cultured in liquid media and prepared as described earlier. Bacterial inoculum was adjusted to an OD600 of 0.5 (c.a. 5 × 10⁸ ufc/mL) in a 10-mM MgCl2 solution. Bacterial suspensions or the mock solution (10-mM MgCl2) were infiltrated into leaves of 3-month old adult plants grown from stakes, by means of a needleless syringe; each treatment was inoculated on one leaflet per plant and on three different individuals. Infiltrated tissue was collected at 50 hpi in sterile tubes containing RNA-free glass beads, samples were frozen with liquid nitrogen and ground by vortexing. Total RNA was extracted as described earlier. cDNA synthesis was performed with the High-Capacity cDNA Reverse Transcription Kit (Applied Biosystems, Walthman, MA, USA), per manufacturer’s instructions. Semi-quantitative RT-PCRs were performed with a 20-µL reaction mix per tube containing 1× of 5× GoTaq Green Buffer, 1.5 mM of MgCl2, 100 µM of a dNTP mix, 0.2 µM of each primer, 5 ng/µL of cDNA, and 0.025 U/µL of GoTaq polymerase (Promega, Madison, WI, USA). Amplification was programmed as follows: one step at 95 °C for 3 min, followed by a variable number of cycles (20 to 28, as needed) of 95 °C for 30 s, 60 °C for 40 s, and 72 °C for 30 s. Amplicons were resolved in 1% agarose gels on 0.5× TBE. RT-qPCRs were performed on a 7500 Fast & 7500 Real-Time PCR System. Each well contained 10 µL of the following reaction mix: 1× of 2× SsoFastTM EvaGreen Supermix with Low ROX (BioRad, Hercules, CA USA), 300 nM of each primer, and 20 ng/µL of cDNA. PCR cycling was as follows: one step at 95 °C for 30 s, followed by 40 cycles of 95 °C for 5 s, and 60 °C for 30 s; data was acquired during the second step of each cycle. The melting curve was evaluated from 65 °C to 95 °C. Primers for reference and candidate genes are summarized in Table 1.

2.10. Statistical Analysis and Packages

All the statistical analyses were performed in R (version 3.6.1). Aggressiveness data was analyzed using an in-house script through a linear mixed model—packages lme4 [59] and multcomp [60]- for log-transformed data, where strain was used as predictor variable with fixed effects, and replicates in time were included as the random effect. All the statistical comparisons were performed at a 0.95 significance level. Correlation analyses were performed by using ggpubr [70]. RT-qPCR data were analyzed using pcr package [71], where a two-tailed t-test (alpha 0.05) was applied to the normalized expression values (normalized by using tubulin gene as reference) of each target gene in the inoculated treatment versus the mock-inoculated treatment. Boxplots, barplots, dotplots, and heatmaps were created with ggplot2 [72], gplots [73] package. EBEs were depicted in the promoter contexts by using the gggenes package [74] or Geneious software (version R11). Distance-based trees were modified on Geneious software (version R11).

3. Results

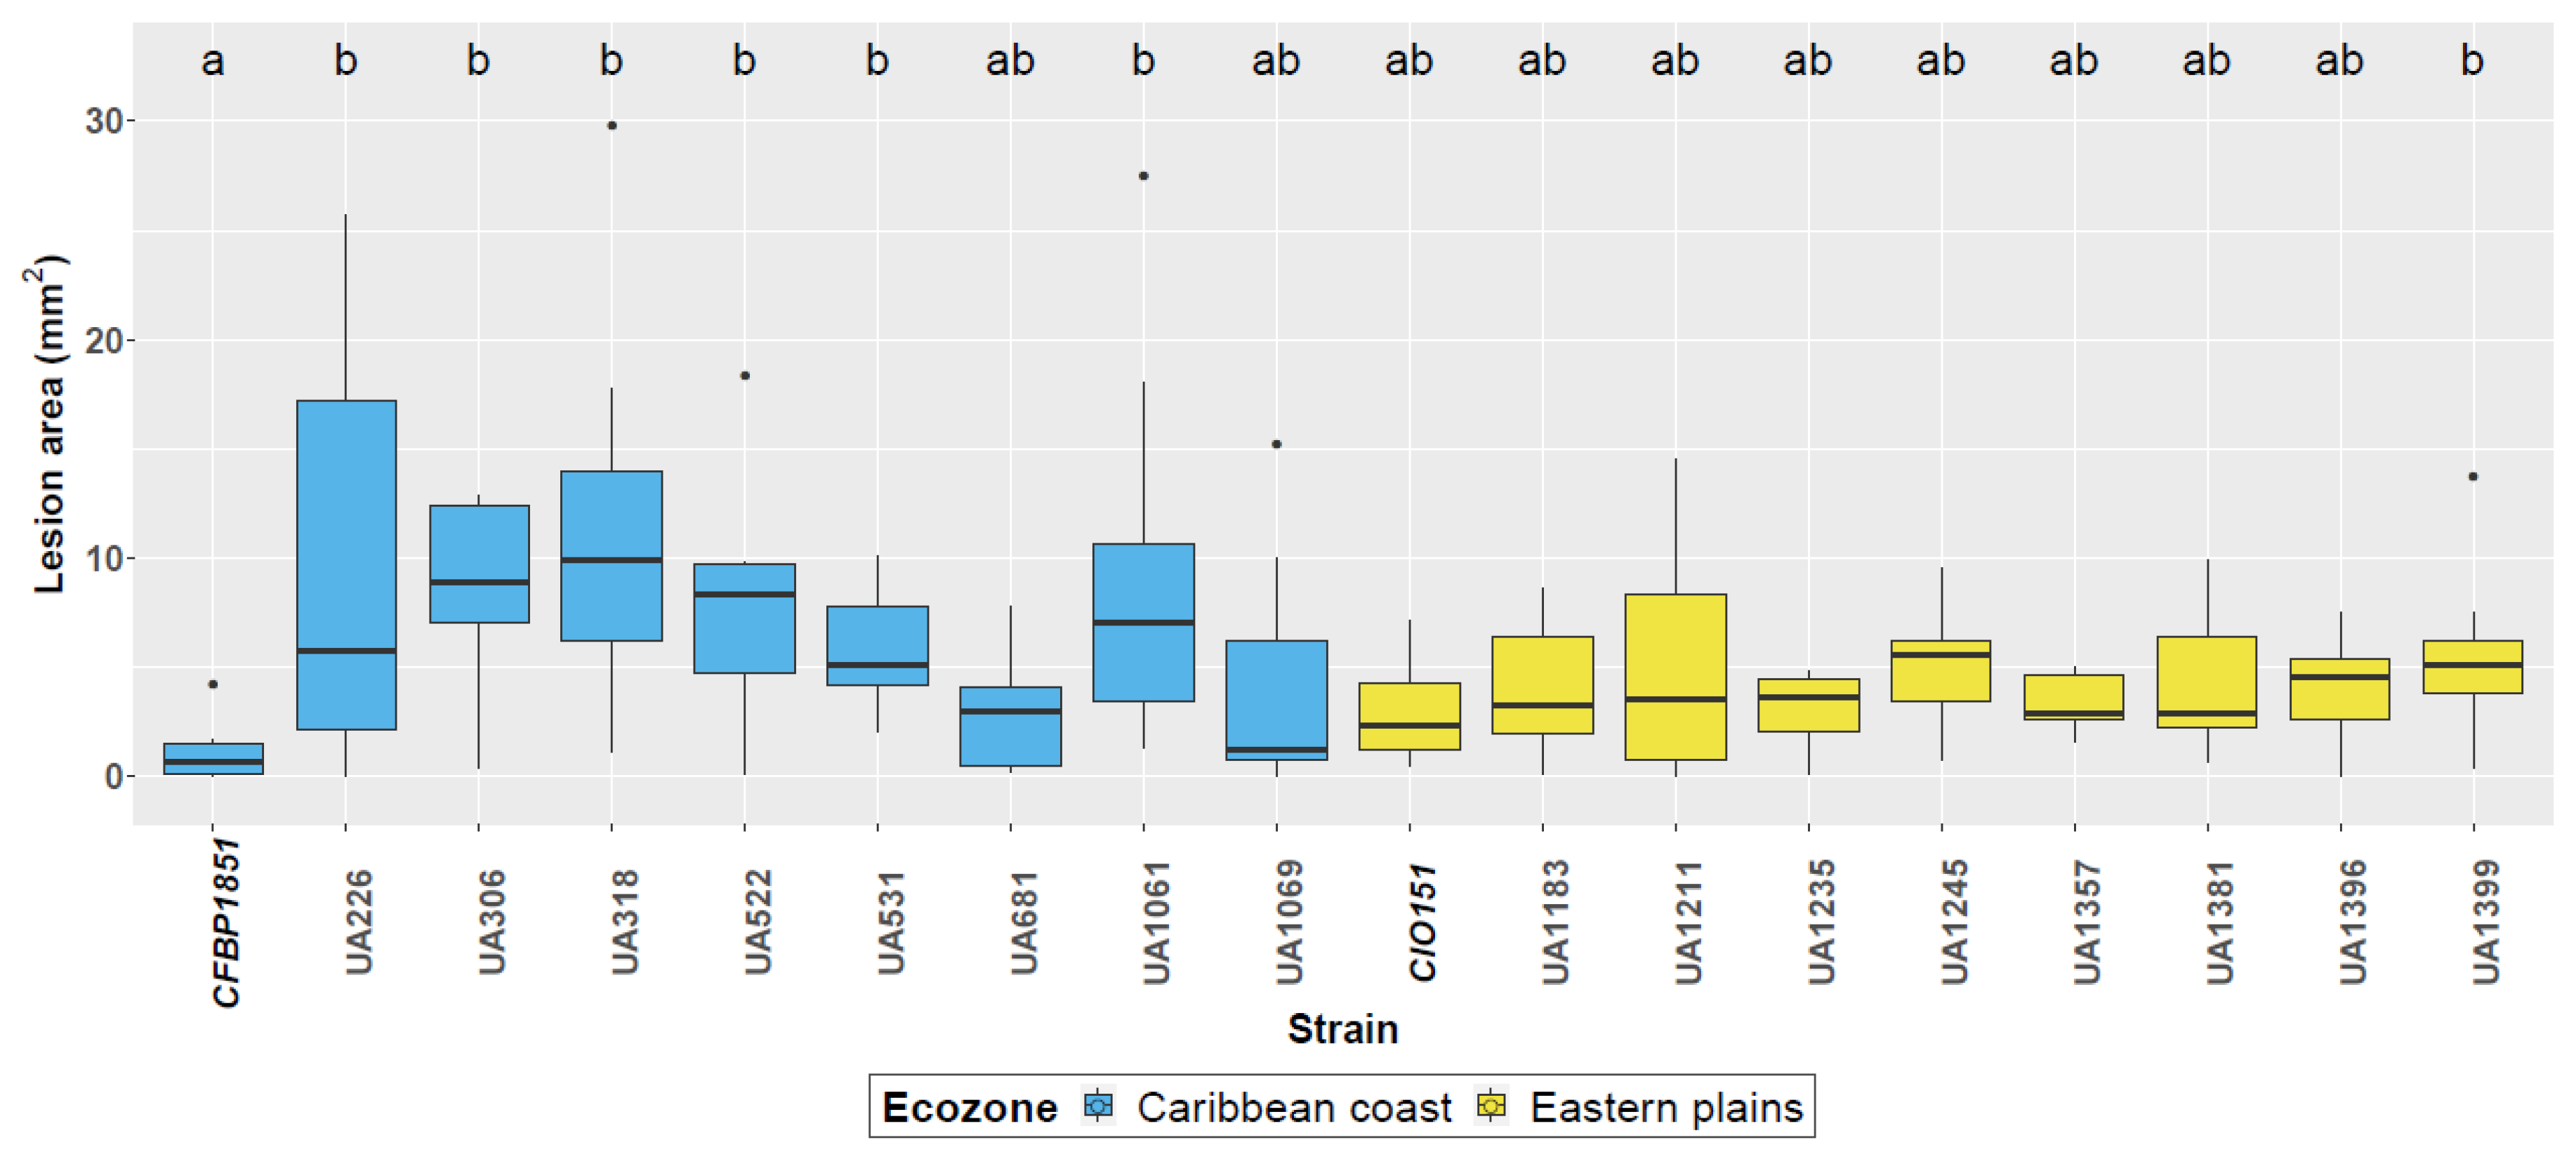
3.1. Aggressiveness of Selected Xpm Strains Is Homogeneous on Cassava Cultivar 60444

Xpm Colombian strains were selected based on three criteria: year of collection, the edaphoclimatic zone (ECZ) of CBB-endemic cassava-growing lands [35], and previous AFLP- and MLVA-based diversity information [49,50]. From the two geographically distant ECZs, which harbor genetically differentiated Xpm populations [50], a total of 18 strains representative of the Colombian Xpm diversity were selected (Table 2 and Supplementary Figure S1). It is also worth noting that strains UA318 and UA681 were previously used in mapping studies for QTL of resistance in cassava against CBB [75]. Also, a subset of them was sequenced by Illumina (strains CIO151, CFBP1851, UA226, and UA306) [32,38], and/or pathotyped on a set of cassava varieties (strains UA226, UA306, UA318, UA531 and UA681) [50].
Aggressiveness of the strains was evaluated based on leaf lesion area on cassava adult plants from the cultivar 60444 at 15 dpi (Figure 1). All the strains were pathogenic and caused symptomatic infections, with water-soaked angular lesions and necrosis in some parts of the tissues. The biological variation among treatments was considerably high. However, lesion areas caused by isolates from the Eastern plain region show narrower inter-quartile ranges (IQRs) for most of the treatments when compared to Caribbean coast strains, which would point to a lower variability in aggressiveness for these strains. The reference strain from the Caribbean coast, CFBP1851, consistently caused the smallest lesions on 60444, while largest lesions were observed with strains UA318 and UA1061. However, due to the considerable variance, little could be inferred from this analysis, except that Xpm aggressiveness on 60444 seems to achieve homogeneous levels after 15 dpi and cannot be correlated with the AFLP- and VNTR-based genetic neutral diversity used as a criterion to select strains.

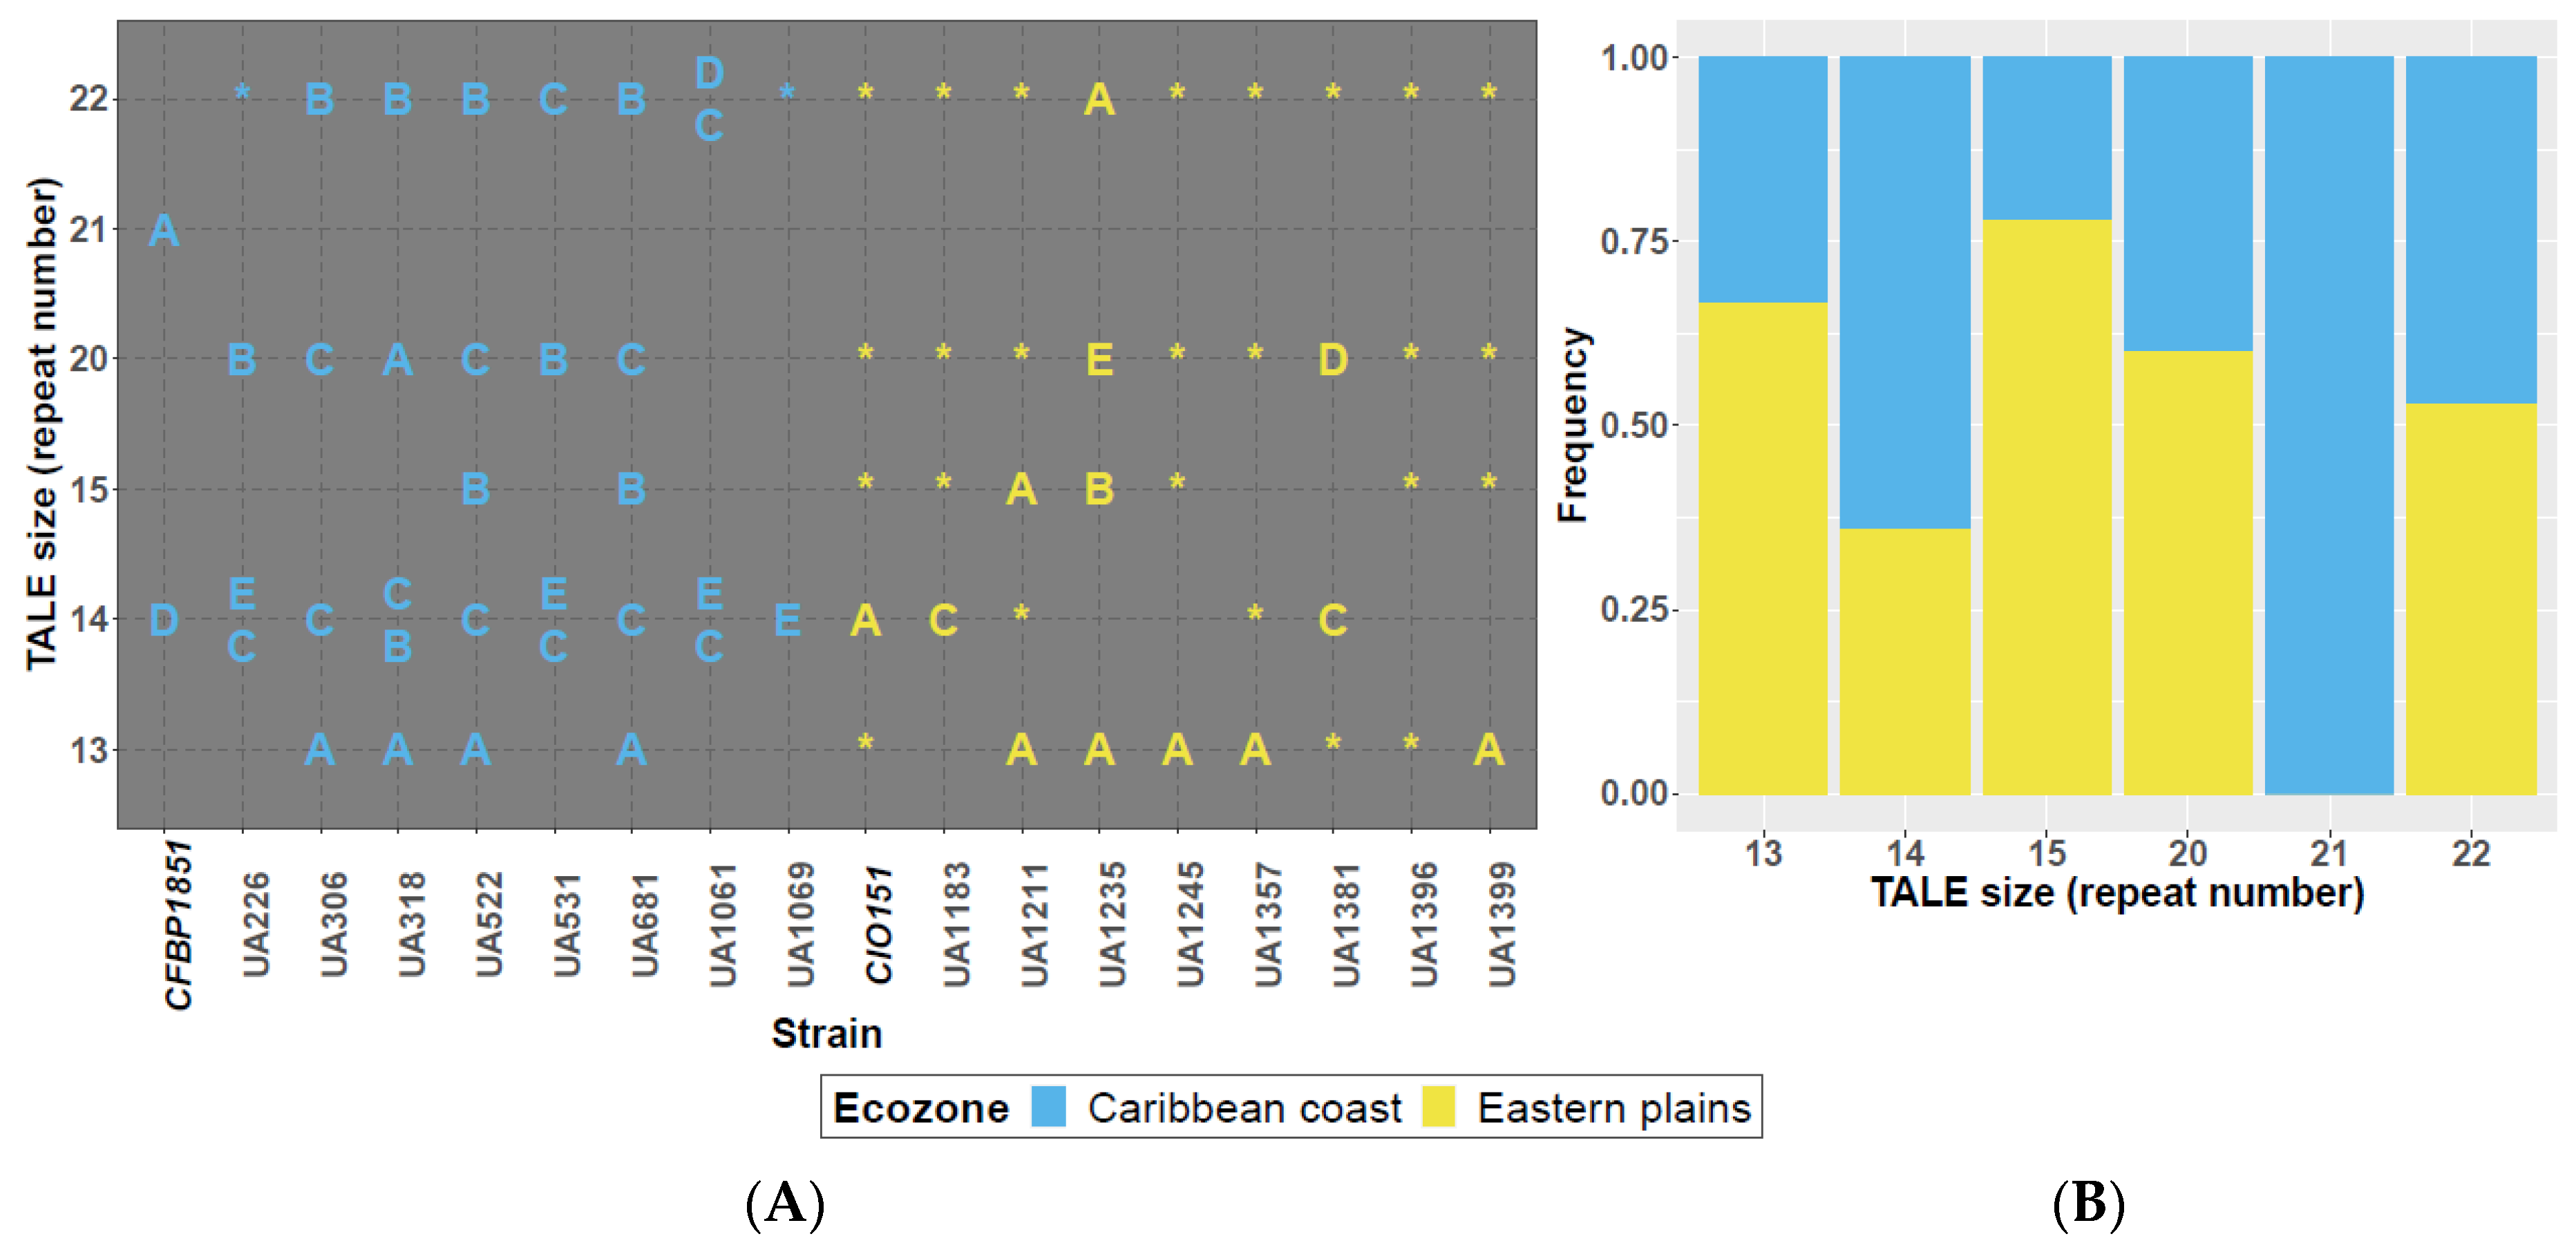
3.2. RFLP Analysis Highlights TALome Patterns with Two to Six TALEs Per Strain and Restricted Size Ranges

RFLP analysis was performed using a 504-bp probe corresponding to a segment of the C-terminal region of the TALE1Xam gene (a.k.a pthB). Figure 2A shows TALome patterns, where each band observed in the RFLP blot is represented by a letter or a star. Among the 18 tested strains, TALomes are consistently composed by effectors with 13, 14, 15, 20 or 22 apparent repeats, while bands corresponding to effectors sizes ranging from 16 to 19 repeats are completely absent (bimodal size distribution). RFLP analysis was followed by cloning and sequencing of most of the TALE genes present in the studied Xpm strains. From the 73 bands observed in the blot (Supplementary Figure S2), we were able to sequence 46 genes. TALE genes will be named according to their predicted number of repeats (e.g., TALE20 has 19.5 repeats). Variants are indicated in Figure 2A through letter codes according to RVD sequence classes of TALEs with the same repeat number. Gene names included the suffix Xpm. However, for the sake of readability of this document, suffix will be obviated. Eighteen RVD-based variants were found.
As shown in Figure 2, eighteen different TALE variants were detected in the Colombian strains. Thirteen of them are novel variants, whereas five are variants that were previously reported in Xpm (namely, TALE14C, TALE14D, TALE15B, and TALE22A [32,40]). Variants TALE21A, TALE14A, and TALE14D were only observed in the reference strains, collected in the 90s, a possible indication of TALE selection through time. TALE22 variants are the most commonly distributed (present in 17 out of 18 strains), followed by TALE20 and TALE14 variants (15 and 14 out of 18 strains, respectively). Interestingly, distribution of sizes according to the source edaphoclimatic zone (Figure 2A,B) indicates a bias on the TALome content for TALE13, TALE14, and TALE15 variants. TALE14 variants are more widespread among isolates from the Caribbean coast, while TALE13 and TALE15 variants are more frequently found among strains from Eastern plains. A statistically relevant correlation between the absence of TALE14 and the presence of TALE15 variants was found by Spearman correlation test (Rho = −0.535, p-value = 0.022), but it was not significant for TALE13 vs. TALE14 variants (Rho = −0.378, p-value = 0.122). Correlations between TALE presence and aggressiveness data were also tested, but no significant associations were found (data not shown). At RVD sequence level, TALE13 has a unique widespread variant, while TALE15 shows two variants differentiated by only one RVD (change of the nucleotides that code for a NN to a NS in the RVD of the twelfth repeat; NN12NS). TALE14, TALE20, and TALE22 showed at least four variants each by the coding sequence of at least one RVD and a maximum of 11, 6, and 13 RVDs, respectively. Table 3 details the RVD sequences of sequenced TALE variants.

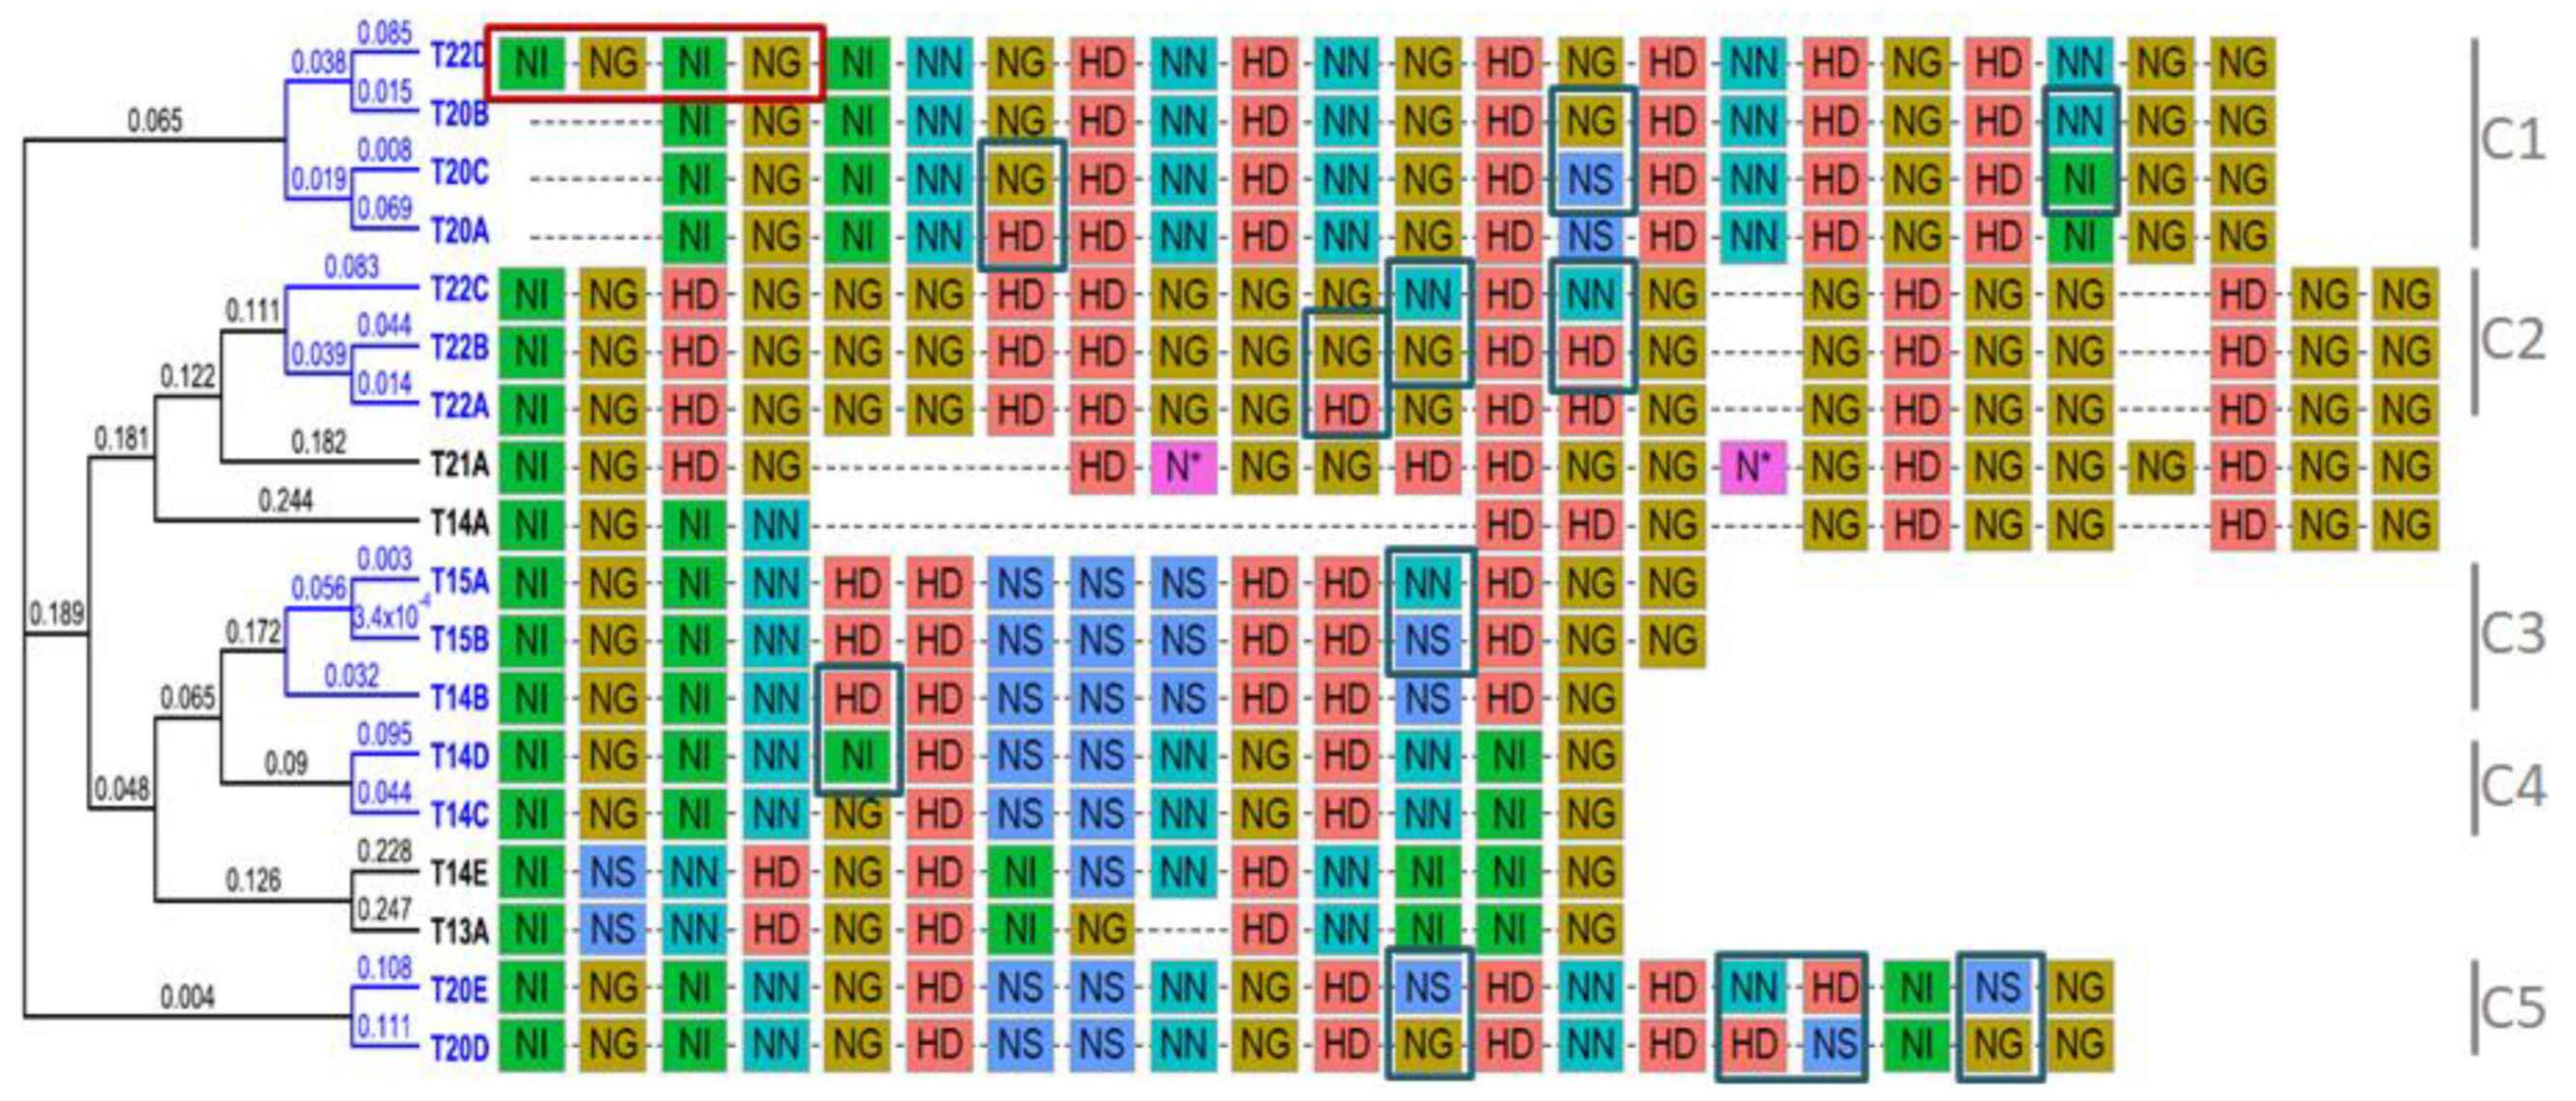
3.3. Five TALE Clusters with Similar Predicted DNA-Binding Affinities

To investigate potential DNA-binding affinities and redundant functions for TALE variants found among these isolates, we used the program FuncTAL. FuncTAL clusters TALEs based on correlations between potential target DNA sequences predicted from each RVD string [61]. Figure 3 shows the dendrogram that resulted from the analysis of the 18 TALE variants reported in Table 3. The color code used to represent RVD types in the analyzed TALEs highlights interesting general features: (i) the first repeat invariably contains NI as RVD, and most of the effectors initiate the repeat sequence with a NI-NG-NI-NN repeat block; (ii) the last half-repeat is consistently NG, and the repeat region of the majority of variants ends with an NG-NG repeat block; (iii) NG is the most frequent RVD in Xpm TALEs while N* is only present in one effector extracted from reference strain CFBP1851, and (iv) repeats with NS tend to be generally restricted to central positions along the repeat array.
Blue terminal branches on the dendrogram highlight five binding affinity clusters (a maximum of 3 individual RVD mismatches between each pair of compared RVD strings), which cover most of the variants for TALE15, TALE20 and TALE22 (Figure 3). In general, TALE variants in the same affinity group have the same number of RVDs. However, two out of the five clusters include variants with different number of repeats, and the alignment of RVDs shows that this is due to duplication/deletion of whole repeats at the beginning or end of the repeat region. Among them, TALE22D variant shares the whole RVD sequence with TALE20B variant, which indicates that this novel TALE might also promote transcription of the S gene MeSWEET10a. It is also worth noting that variants TALE20D and TALE20E exhibit a considerable number of differences relative to A, B and C variants, and instead show similarities to TALE15 and TALE14 variants. On the other hand, black terminal branches point to TALE variants whose predicted affinities are considerably different to the rest and cannot be grouped, suggesting that they do not share EBEs with TALEs from any of the clusters.
In parallel, a repeat-based phylogeny was constructed using the software DisTAL [61] (Supplementary Figure S3). Results show nearly the same clustering patterns as observed with FuncTAL, but TALE20, TALE21, and TALE22 variants are grouped into one big clade, while TALE15 and TALE14 variants (except for TALE14E) constitute another big clade. The nucleotide versions of TALE13A and TALE14E variants form a big clade that seem to be at the origin of the two above-mentioned clusters.

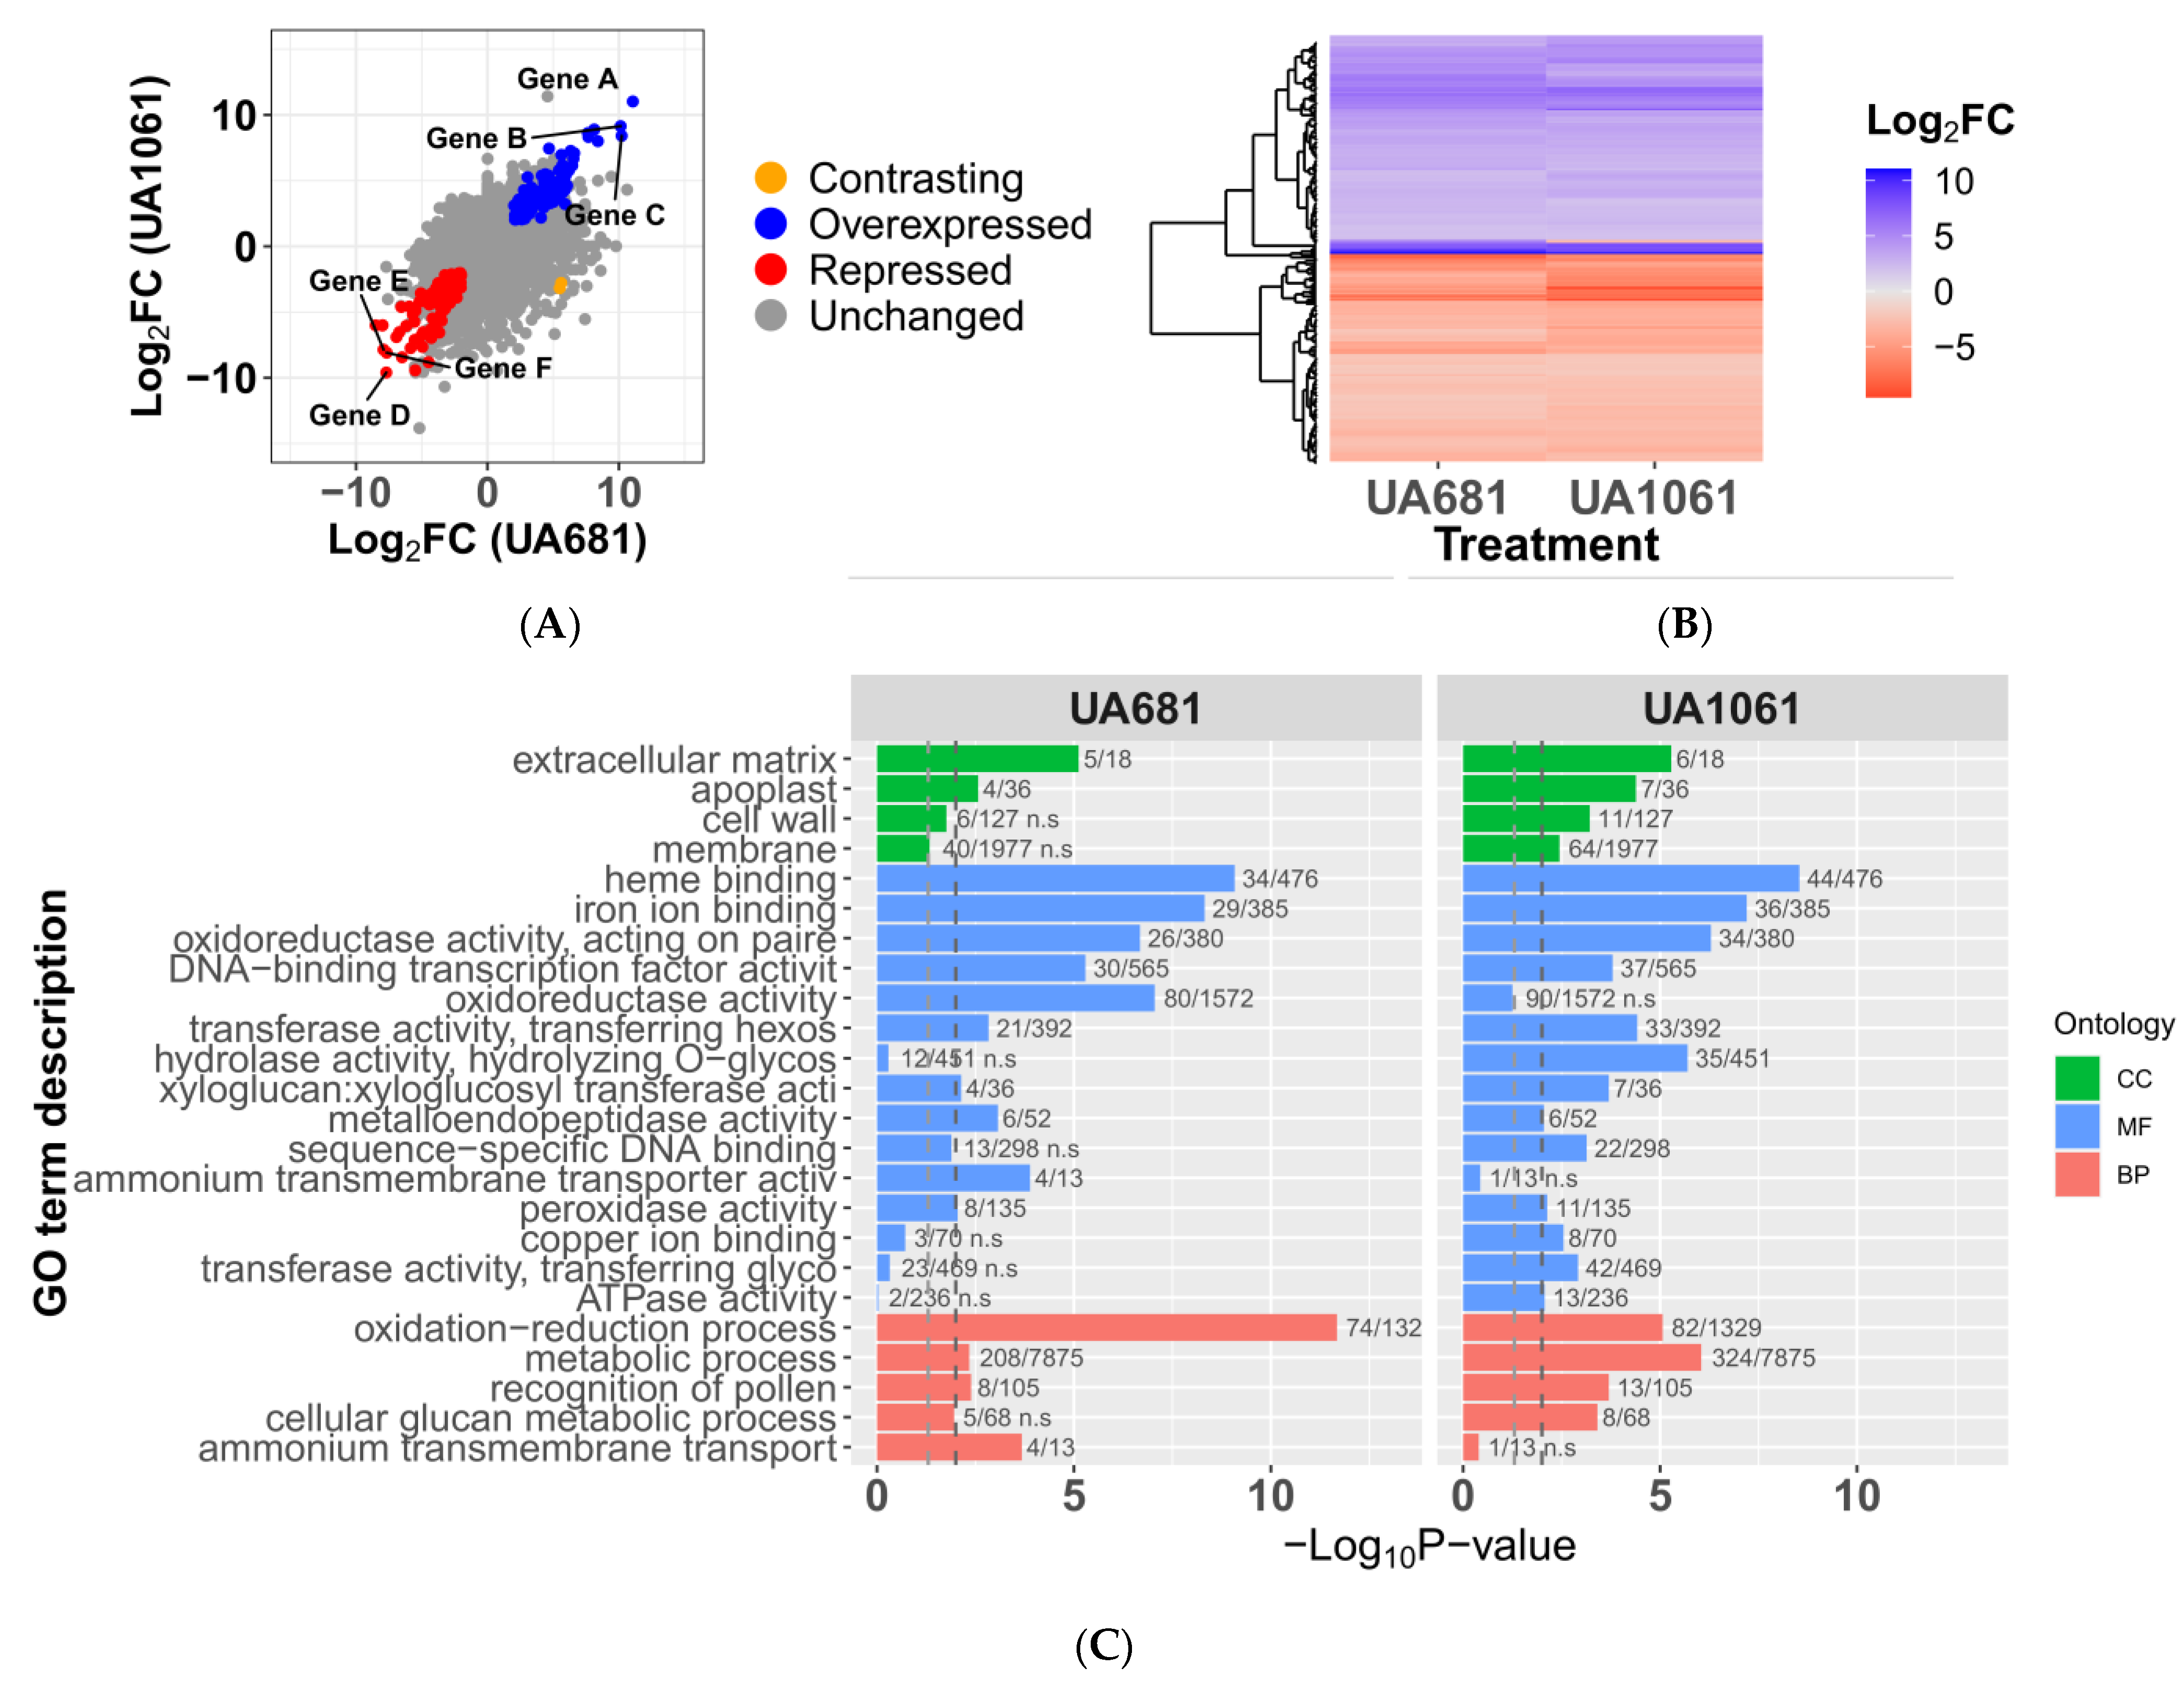
3.4. Expression Profiles of Plants Inoculated with UA681 and UA1061 Are Highly Similar

To gain insights into the cassava genes targeted by the TALomes of Colombian Xpm, we performed RNA-seq experiments of cassava leaves challenged with strains UA681 and UA1061. These strains were selected because their TALomes are fully sequenced (Figure 2), and they collectively contain eight different TALE variants, allowing to cover four out of the five binding affinity clusters (see Figure 3), as well as the “orphan” variants TALE13A and TALE14E. Moreover, strain UA1061 lacks a TALE20 variant but it is as aggressive as others that contain TALE20, therefore, we aimed at investigating alternative explanations for this aggressiveness that could provide insight into the pathogenesis of Xpm. To this end, a mock solution (10-mM MgCl2) or Xpm strains were inoculated into two-month old cassava plants propagated in-vitro, and tissue was harvested at 50 hpi. As illustrated in Figure 4A, expression profiles are remarkably similar and some of the most up- (Log2FoldChange ≥ 2 and p-value < 0.001) and down-regulated (Log2FoldChange ≤ −2 and p-value < 0.001) genes are shared by both treatments (upregulated genes Manes.06G123400, Manes.17G063800, Manes.07G120000; downregulated genes Manes.17G042600, Manes.05G151100, Manes.18G029800). However, treatment with UA681 significantly affected the transcription level of 588 genes, while UA1061 significantly affected that of 1021 genes. When analyzed as a whole, most of the differentially expressed genes (DEGs) shared by both treatments show the same transcriptomic profile (271 out of 273 genes, Figure 4B). The top three upregulated DEGs common to both treatments are Manes.06G123400, Manes.17G063800 and Manes.07G120000 which respectively encode the S gene MeSWEET10a, an oxidoreductase 2OG-Fe II oxygenase family protein, and a wall-associated receptor kinase galacturonan-binding. The top three common downregulated DEGs encode a tyrosinase (Manes.17G042600), a cytochrome P450 71B21-related protein (Manes.05G151100) and a protein that belongs to the mitochondrial calcium uniporter family (Manes.18G029800). The Gene Ontology (GO) term enrichment analysis (Fisher’s test, α = 0.01) performed on shared DEGs (Figure 4C) shows that, as defined by cell compartment, most of the differential transcriptional activity accounts for proteins that localize to the cell membrane or the apoplast. Moreover, the molecular function and biological process classifications point towards a response that involves a significant number of genes altering cell redox status, glucan metabolism, and nitrogen transport.

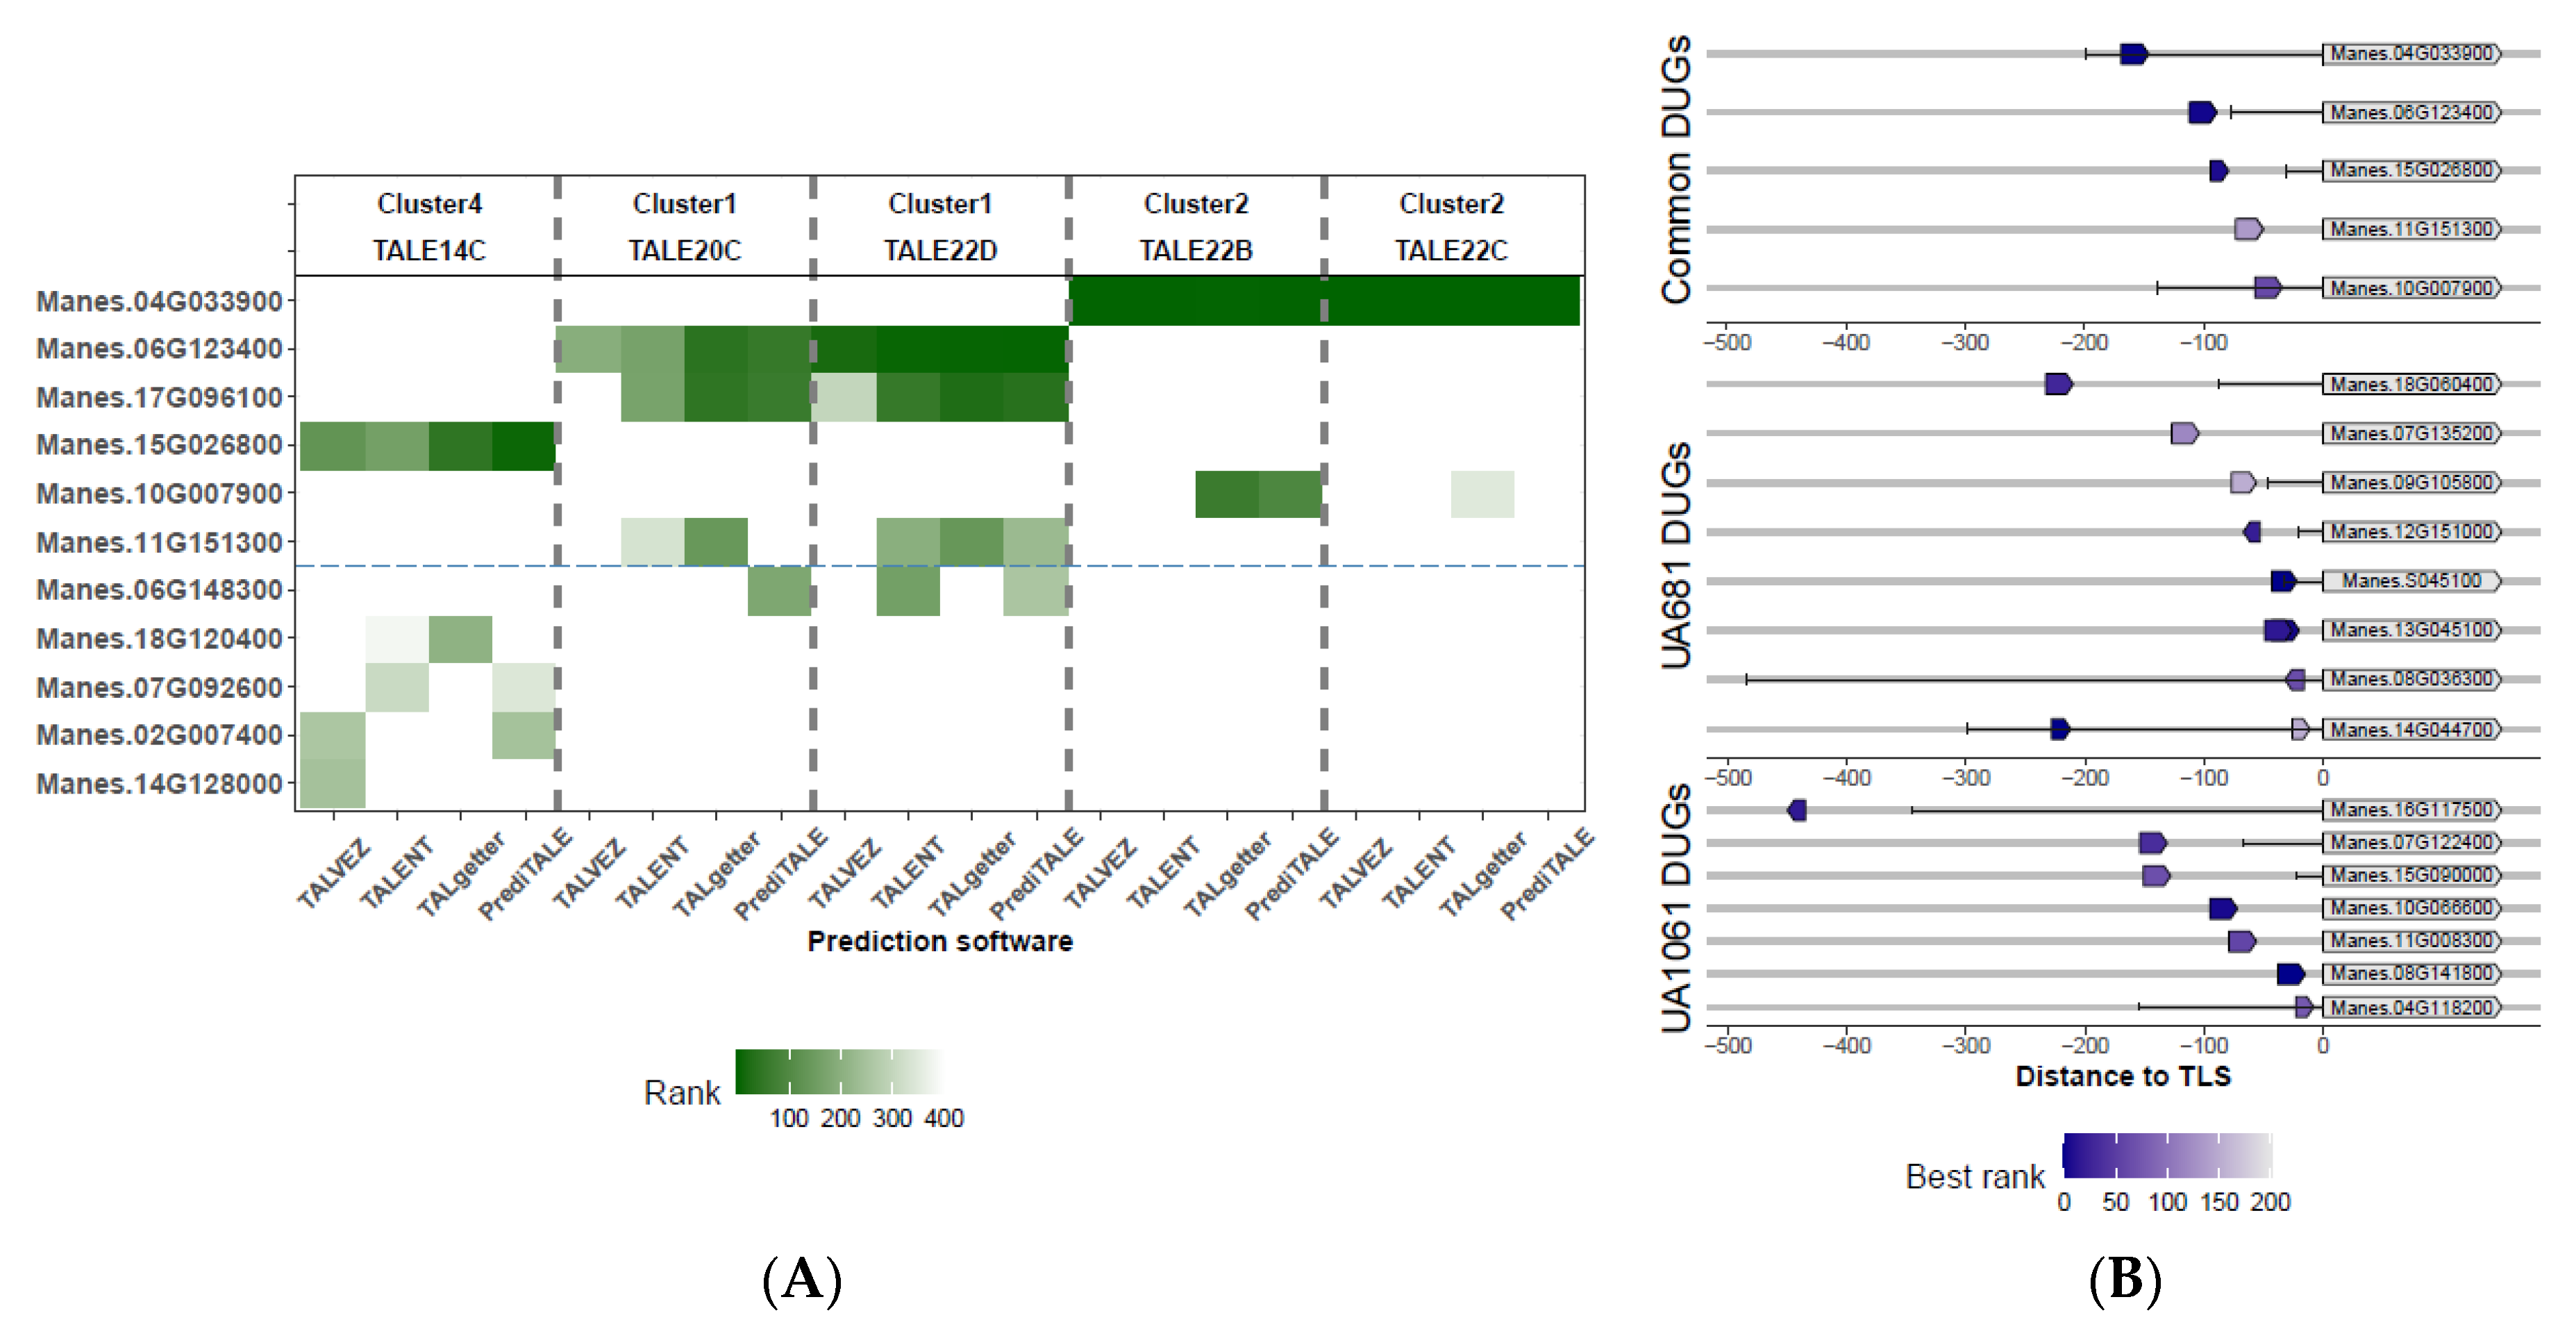
3.5. Potential TALE Targets Are Involved in the Manipulation of Host Cell Redox Status and Nutrient Transport

Correlation of inoculated host gene expression profiles with EBE prediction is a powerful approach to find genes targeted by TALEs. The promoterome (defined as the 1-kb regions that flank annotated translational start sites) of cassava inbred line AM560-2 [76] was used as input to predict the EBEs of each of the 18 TALE variants discovered in this study. We used four different on-line available software: TALVEZ [77], TAL Effector Nucleotide Targeter 2.0 (TALENT) [78], TALgetter [65], and PrediTALE [66]. The output of each program was restricted to the first 400 results and the rank of each predicted EBE was used as a homogenized score to enable comparisons. We cross-referenced the DUGs with the set of predictions for the TALomes of each inoculated strain. Results for UA1061 show that from the 320 DUGs, only 36 were predicted to have at least one EBE on the promoter region, while for UA681 the ratio was 69 out of 396.
The study of common DEGs could shed light on potential hubs used by the pathogen to manipulate the host. When predictions for the two TALomes and transcriptomics from plants inoculated with both strains were compared, we detected six candidate genes (Figure 5A, first six genes from the top to the bottom of the figure) with high-quality EBE predictions whose transcription could be upregulated by TALEs from clusters 1, 2, and 4 (see threshold in Figure 5A). Table 4 details the annotation and the prediction quality obtained for the proposed candidates. In the analysis of individual TALomes (Supplementary Figure S4), a clear signature prediction/expression for probable candidates was observed for 19 additional genes in the case of UA681, and 7 additional genes for UA1061 (see Table 4). Distance to the translation start site and orientation of EBEs are two factors known to affect transcriptional activation rate driven by TALEs [3,67]. Cernadas and coworkers [3] found that EBEs in real targets ranked consistently on the first 200 predictions, and their distance to annotated transcriptional start site (TSS) generally ranged between 152 bp upstream and 63 bp downstream; being this latter parameter the most predictive descriptor. We applied a second filter by using information of EBE rank among predictors (best prediction) and distance to TSS (when available) and translational start site (TLS) to further classify potential real EBEs. Figure 5B shows EBE predictions in the promoter context of the retained candidates. Twenty candidate genes (see Table 4) out of the 34 and their predicted EBEs fell into the predictor ranges, and only three of them are located on the minus strand (reverse orientation). Among these candidates, we found potential novel targets that were not found in previous studies [8,39,41] and could be directly linked to defense regulation, like two different Abscisic Acid Receptor PYL4 encoding genes (Manes.10G007900, Manes.07G135200), a Rho GTPase-Activating Protein Ren1 encoding gene (Manes.18G060400), and an ammonium transporter (Manes.08G141800) among others.
Since predictions were based on the well-annotated cassava genome from inbred line AM560-2, we blasted the candidate genes against the recently published genome from variety 60444 [68] to extract the corresponding promoters and check for EBE presence. Among the 34 candidates, exact EBE matches were found for 29 of them, and imperfect matches (from 1 to 3 mismatches) for three more genes. Predicted EBEs for Manes.S013800 (coding for a peptidase of plants and bacteria) and Manes.04G096600 (coding for a Xyloglucan:Xyloglucosyl Transferase) were not found in the 60444 promoters. All the EBE predictions, except for two cases (Manes.09G134100 and Manes.04G109300), were found in similar positions relative to TLS, with a maximum shift of 30 bp (Supplementary Table S1).
To explore the effect of potential candidates on transcriptome modification from a functional point of view, a GO term enrichment analysis for each transcriptome was run keeping only DUGs that contained EBEs for the corresponding TALome (Supplementary Figure S5). For strain UA681, there is a significant (Fisher’s test, α = 0.01) term enrichment mainly for molecular functions and biological processes related to oxidoreductase activity, indicating that TALEs might be involved in host cell redox status manipulation. However, the analysis does not show the same landscape for plants inoculated with UA1061, where none of the categories (cell compartment, molecular function, and biological process) seemed to be significantly enriched. Nevertheless, the ammonium transport is shown as a differential characteristic possibly linked to TALE activity from UA1061 TALome.

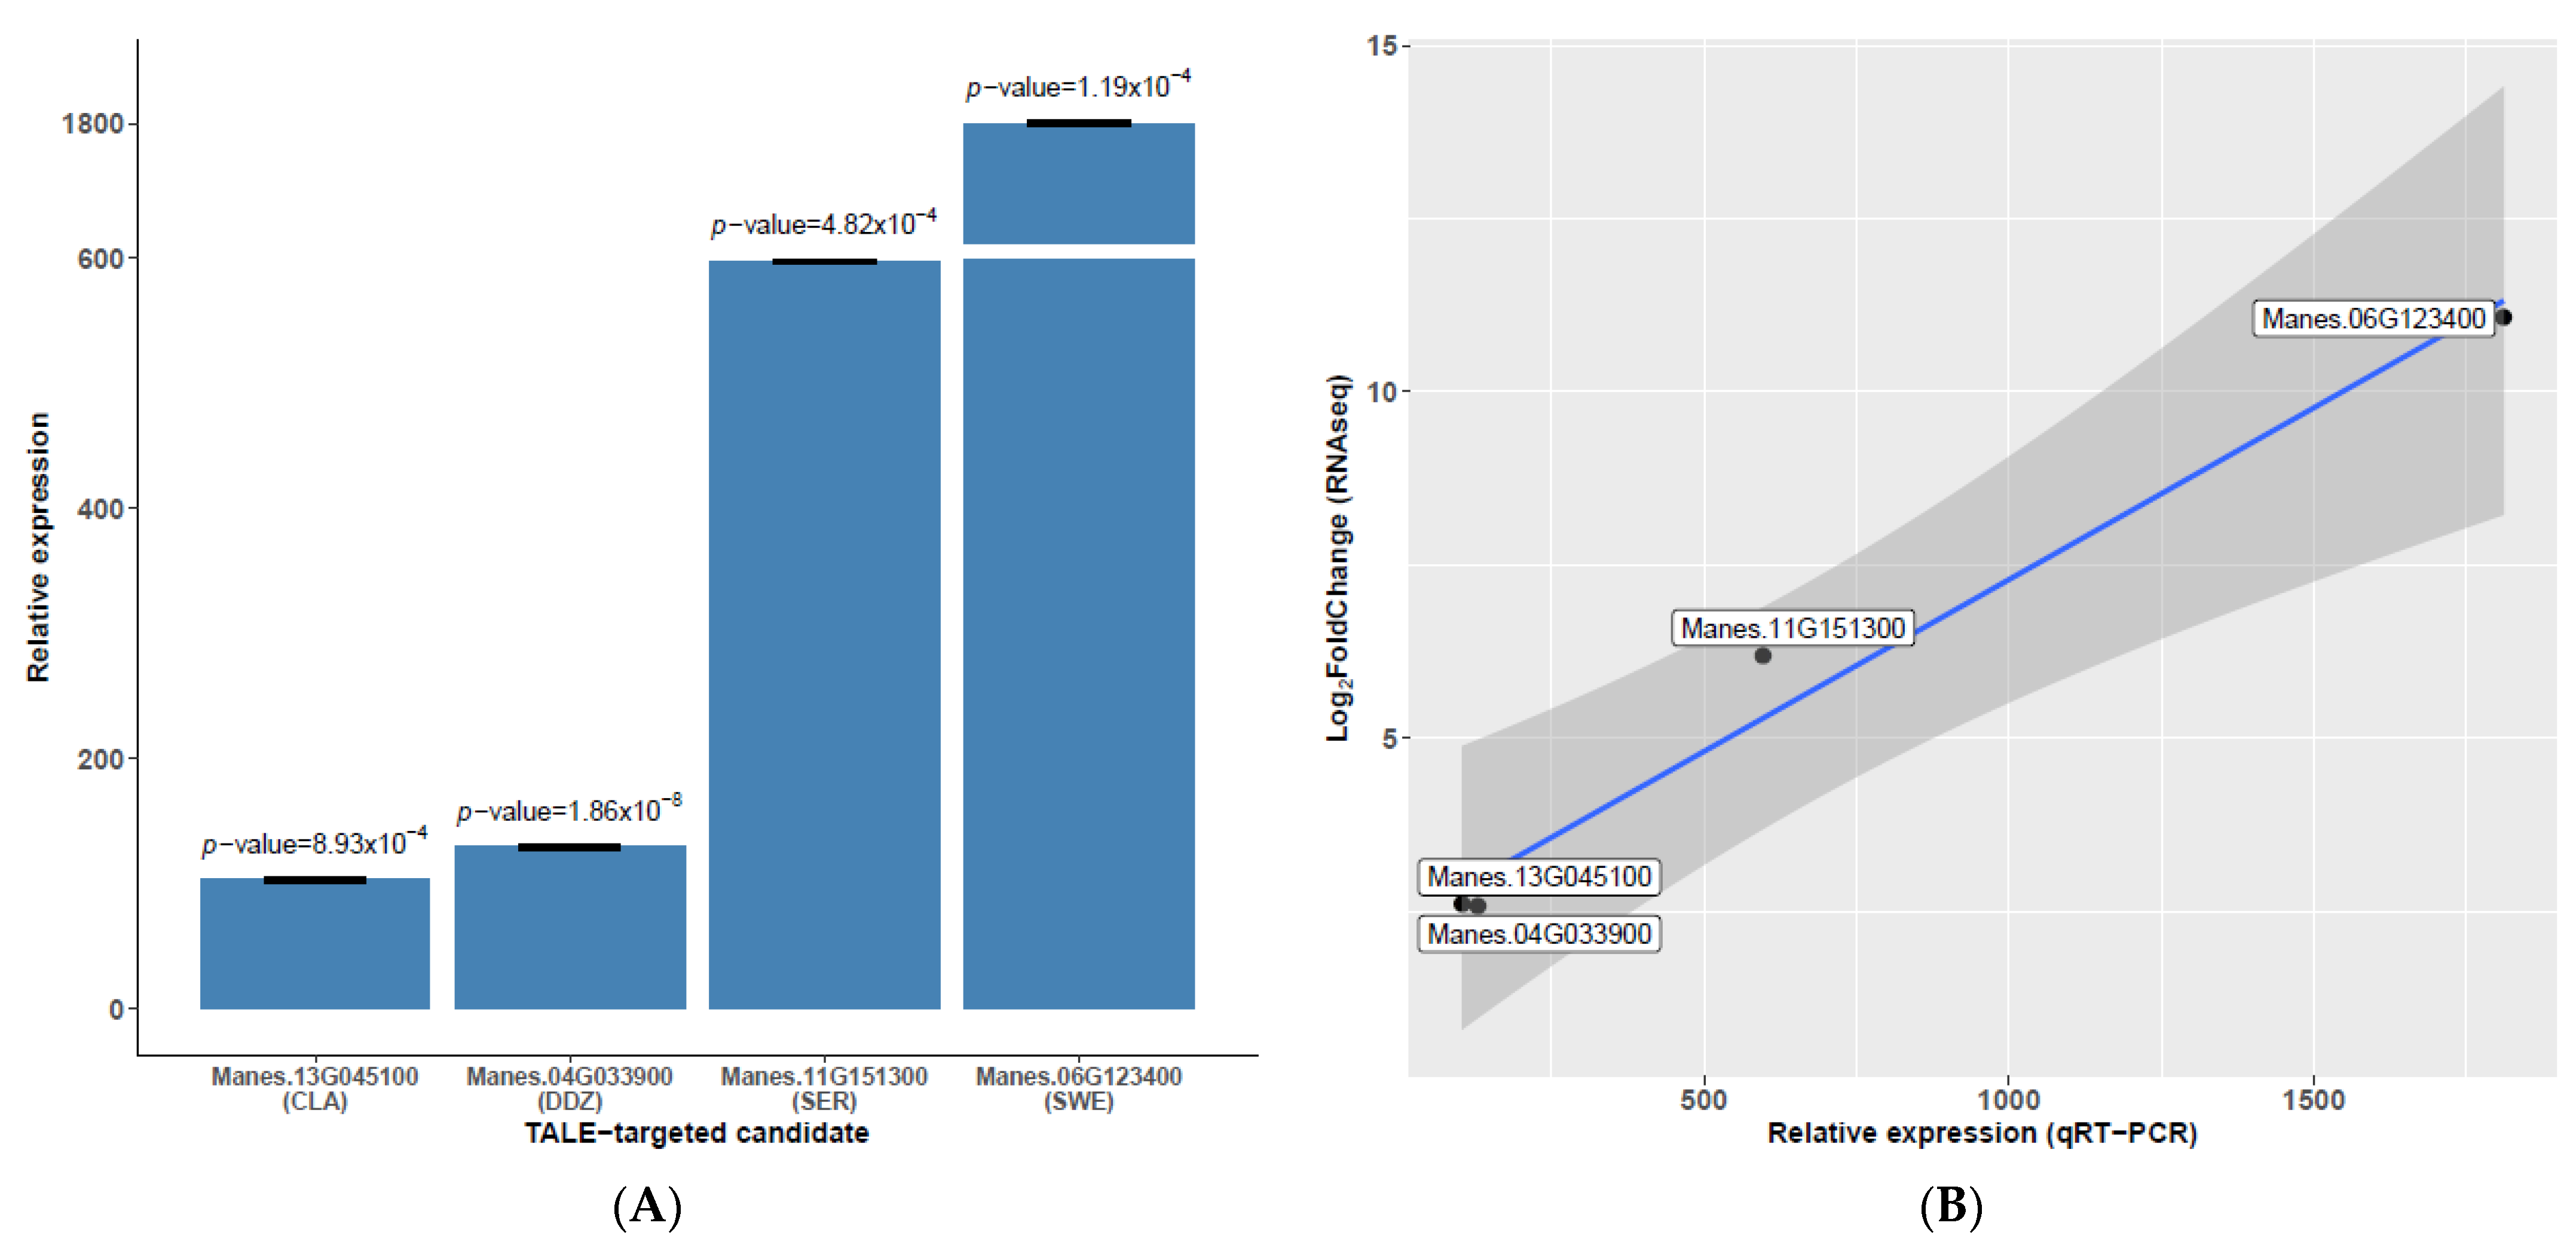
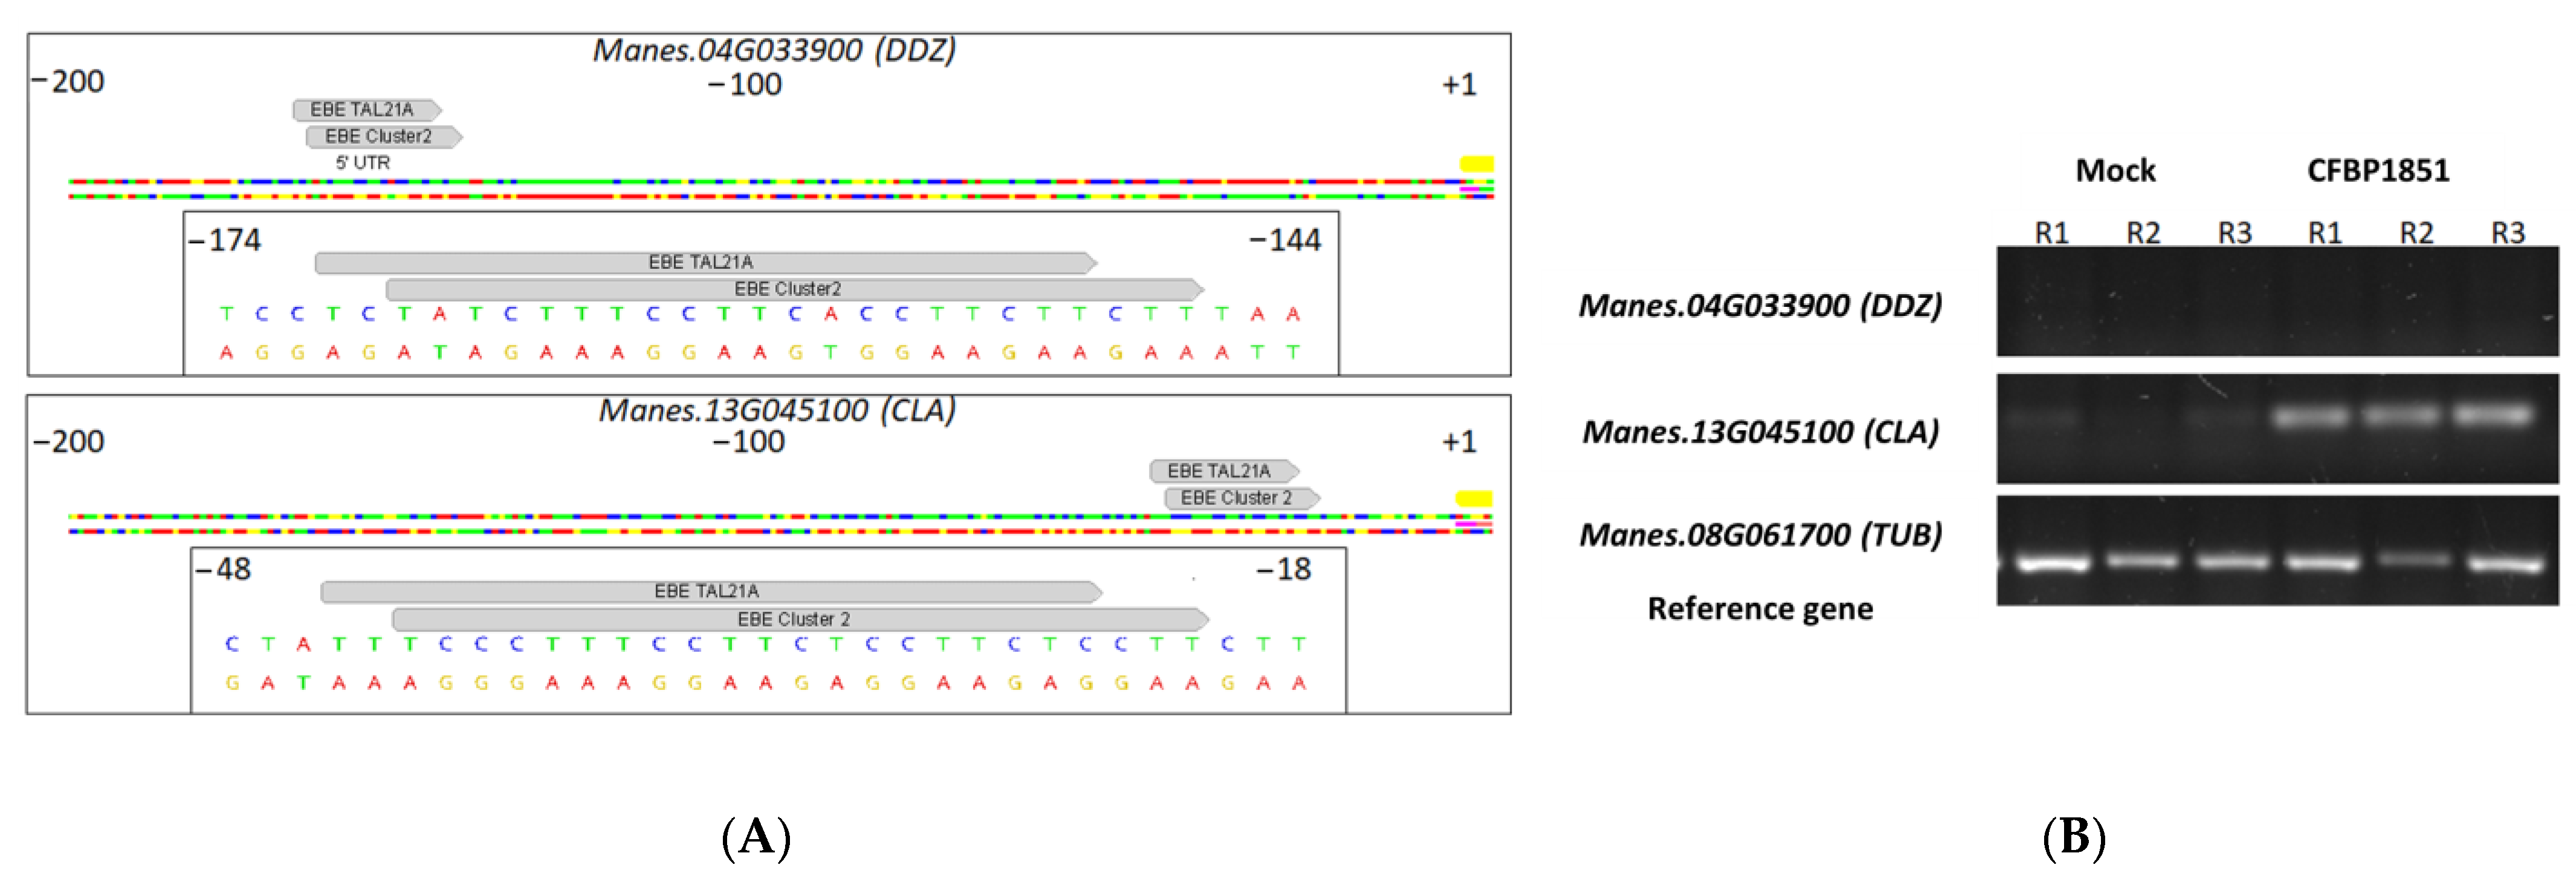
3.6. Candidate Gene Expression Profiles Are in Agreement with Trends Observed in RNAseq and Previous Reports

We confirmed the expression profile of some candidates through RT-qPCR with RNA extracted (at 50 hpi) from adult plants inoculated with UA681. The candidate genes were Manes.13G045100, Manes.04G033900, Manes.11G151300, Manes.06G123400. The four candidates have strong predictions; but first two genes have fold-changes near 2 (threshold to define upregulated genes), while the latter two have large fold-changes (6.19 and 11.06, respectively). Relative overexpression is statistically significant (Figure 6A), and expression patterns are well correlated between RNAseq data and RT-qPCR data (Figure 6B). Cohn and colleagues [8,39] demonstrated the TALE-dependent overexpression of 28 cassava genes in the Xam668-cassava infection context. RVD sequences of the TALEs of the UA681 strain are very similar to the ones present in Xam668: TAL13, TAL14 and TAL15 have the same RVD sequence, while TAL20 differs in 4 central RVDs and TAL22 shows the HD11NG change. Cross-reference of validated targets with the set of common and UA681 DUGs shows that 19 of these validated candidates are present in this set of transcriptionally activated genes, but only seven of them had predicted EBEs. Previously unreported candidates found in this study might be specifical targets of TAL20C and TAL22B variants. The last column of Table 4 shows the validated candidates and which TALE is potentially responsible for their transcriptional activation.

3.7. Potential Functional Convergence within TALome Members and Among Expanded TALome

Functional convergence among TALEs is defined as two or more distantly related TALEs targeting the same gene, using the same, overlapped or completely different EBEs. This feature can be assessed at two different levels: (i) intra-TALome, for genes that are targeted by at least two TALEs expressed by the same bacterium (functional redundancy) and (ii) among the TALE variants present in the bacterial population. We did not find any cases of intra-TALome functional convergence. However, analyses extended to all the TALEs isolated in this study allowed us to track potential cases of functional convergence. Due to marked similarities between the affinity of clusters 1 and 5 (both harboring TALE20 variants), these convergence analyses did not take them as individual clusters. This analysis considered only DUGs (from UA681 or UA1061 treatments) with EBE for two or more TALEs from different clusters and resulted in eight candidates (Supplementary Table S2). The gene Manes.04G033900, which encodes a Dof Domain, Zinc Finger Protein, showed the strongest evidence for convergence. This gene was upregulated in both treatments and has been already validated as an actual target for TALE22Xam668 [8]. Theoretically, this gene is targeted by TALEs from cluster 2 (TALE22A, TALE22B and TALE22C) and TALE21A. Likewise, a second validated target for TALE22Xam668, upregulated in both RNAseq treatments and with EBE predictions for TALE21A, Manes.13G045100 (coding for a Clavata3/ESR (CLE)-Related Protein), was found among the potential candidates. EBE predictions for TALE21A are almost totally overlapped with EBE predictions for cluster 2, sharing 20 base pairs in both cases (Figure 7A). Since predictions are well-supported and these genes were already validated as real TALE22 targets, we decided to test activation of these genes by inoculating cassava leaves with strain CFBP1851, a strain that lacks TALE22 variants but contains TALE21A. RNA was extracted after 72 hpi (since aggressiveness of this strain is considerably low. See Figure 1) and semiquantitative RT-PCR was performed on the derived cDNA. Figure 7B shows results for both genes. Strain CFBP1851 was able to differentially upregulate gene Manes.13G045100 when compared to the mock-inoculated treatment, indicating that this is probably a case of TALE convergence (still, activation by a non-TALE factor cannot be ruled out with this experiment). However, transcripts from gene Manes.04G033900 were not detected by the RT-PCR in plants treated with CFBP1851, indicating that TALEs from this strain are not able to activate this target.

4. Discussion

This study started with a selection of Xpm strains based on neutral genetic diversity at a country scale that allowed us to depict the TALE variation among strains isolated from different cassava productive regions over different years in Colombia. Southern blot analysis showed that Xpm strains carry TALomes with a bimodal size distribution, and sequence analysis showed thirteen novel TALE variants. Sequence clustering by predicted DNA-binding affinity allowed us to condense this variability into five clusters and four unrelated TALE variants. A complementary transcriptomic approach allowed us to move from diversity to function and to screen host genes that might act as CBB susceptibility determinants. Transcriptomics showed that redox processes and nutrient transport are upregulated during infection, and some of the involved genes are potentially targeted by TALEs. Importantly, our results also suggest that TALEs different from TALE20 might activate the transcription of MeSWEET10a and potentially confer aggressiveness to those strains lacking TALE20 in Xpm populations. This study sets new bases for assessing unidentified TALE targets in the Xpm-cassava interaction, which could be important factors that define the fate of the infection.
TALEs play major roles in the pathogenesis of several xanthomonads (reviewed by [4]), mainly by conferring bacteria the ability to create a favorable niche in the plant vascular system. In some cases, Xanthomonas spp. pathogenicity is drastically altered by the activity of a given TALE [69,79]. Bart and coworkers [32] found a positive trend between the number of TALEs per TALome vs. aggressiveness and virulence assessed in 18 strains of Xpm. In our study, we profiled the aggressiveness of 18 Xpm strains and found that only CFBP1851 shows reduced capacity to cause lesions. Interestingly, this strain does not carry TALE20 or any TALE20 variant that could activate the S gene MeSWEET10a [8], which could explain reduced aggressiveness. Strains UA1061 and UA1069 also lack this TALE variant, but their aggressiveness is average. However, UA1061 possess two variants of TALE22, one of them with an RVD sequence similar to that of the TALE20B variant plus a duplication of the first two repeats (Figure 2 and Figure 3). This new TALE22 variant (TALE22D) could explain the fact that strain UA1061, and potentially UA1069, do not have a decrease in aggressiveness even if they lack TALE20 variants. The DisTAL analysis (Supplementary Figure S3) indicates that TALE22D shares ancestry with TALE20B, and, based on the transcriptomic profile of UA1069-inoculated plants and the EBE predictions, this TALE seems to be able to induce MeSWEET10a. However, despite the reduced ability of CFBP1851 to cause symptoms, it still induces water-soaked lesions, indicating that there might be mechanisms that do not rely on MeSWEET10a transcriptional activation to promote water soaking, yet less efficiently.
As seen in Southern blot analysis, Xpm TALomes are characterized by a limited and bimodal range of variant sizes. This bimodal size distribution could be explained by a recent acquisition of TALEs from two different ancestors or the fixation of two useful alleles that then diverged. Our data favors the second hypothesis since the repeat-based phylogeny (Supplementary Figure S3) shows two clades that group TALEs by size, both emerging from the TALE13 variants. This is probably why there are shared repeat block patterns between the two TALE size groups (Figure 3). Ferreira and collaborators [80] created a TALE-based phylogeny with 122 coding sequences from Xanthomonas spp. TALEs. Xanthomonas phaseoli pv. phaseoli and Xanthomonas citri pv. fuscans, two pathovars closely related to Xpm, show unimodal and continuous TALE size distribution that ranges from 18 to 23 repeats [81]. N-, C-terminal and TALE flanking region analysis suggests that these TALE variants come from a unique common ancestor [81]. X. campestris (Xc) exhibits a more complex TALE size distribution which however seems to be even from 11 to 22 repeats. Yet, analysis of N-, C-terminal and repeats indicate that Xc TALEs emerged from two different ancestors [82], where smaller TALEs (variants with 12, 14 and 15 repeats) have structurally different repeats from larger TALEs with 21 and 22 repeats. Since N- and C-terminal sequences are not available in our study and repeat structure is highly homogeneous, we could not perform such analyses.
TALE sequence diversity was assessed by potential DNA-binding affinity using FuncTAL [61], resulting in five DNA affinity groups and four orphan (non-clustered) effectors. Among them, there are several examples of deletion/duplication, like the case of TALE22D from cluster 1 (discussed earlier), TALE14B in the cluster 3 and TALE13A when compared to TALE14E (see Figure 3). Repeat recombination patterns are also observed; for example, TALE14A variant shows the most common starting RVD block NI-NG-NI-NN, but the remaining block of ten RVDs can be found in TALE22A and B variants. Repeat swaps (non-synonymous point mutations affecting the RVD) seem to be a key variability driver for TALE diversity in Xpm, since all the clusters show at least two variants with one to four swaps (see Figure 3). These evolutionary mechanisms for TALEs have been well documented [83,84], and several examples of deletion/duplication, repeat swap and recombination can be found among Xanthomonas spp. TALEs [6,81,82].
To elucidate the effects of this functional diversity, we selected two strains whose TALomes covered most of the TALE diversity. Strains UA681 and UA1061 were inoculated in 60,444 varieties to obtain a transcriptomic snapshot of the infection. Briefly, plant response to infection with either of the strains shows a marked alteration of oxidoreductase activity, DNA-transcription factor activity, interaction with metals such as iron and copper, and carbon catabolism. Muñoz-Bodnar and collaborators compared the transcriptomic profiles of cassava plants from the variety MCOL2215 inoculated with two Xpm strains with contrasting virulence [41]. In that study, Xpm transcriptomic profiles did not significantly differ and showed a transcriptional alteration of genes related to catabolic processes, cellular glucan metabolism, transcription regulation and response to oxidative stress, among other categories. A transcriptomic study in Xanthomonas oryzae pv. oryzicola (Xoc) showed altered expression of genes involved in catalytic and oxidoreductase activities, which suggest an active reactive oxygen species detoxification and cellular redox status control [3]. Taken together, this indicates that alteration of the redox environment and catabolic processes are common to the compatible interactions between Xanthomonas spp. and their hosts, highlighting their relevance in pathogenesis.
The analysis of the DUGs coupled to EBE predictions resulted in several candidates that could be important for Xpm pathogenesis. Some of these candidate genes were previously validated as actual targets of Xpm TALEs (see Table 4), which supports our findings. The sugar transporter encoding MeSWEET10a is a DUG highly overexpressed in both treatments (UA681 and UA1061), and it has been shown to play a key role in symptom formation and bacterial growth in planta [8]. Our data provide indirect evidence that the new TALE20-derived TALE22D variant is functional and capable of targeting this important S gene. In this regard, we explored if the addition of these two repeats at the beginning would negatively affect the predicted DNA-binding affinity on the already known EBE (EBE for TAL20: TATAAACGCTTCTCGCCCATC). Results show that the two nucleotides located right before the EBE for TAL20 are the same first two nucleotides of the EBE (EBE for TAL22D: TATATAAACGCTTCTCGCCCATC), allowing then a perfect match for the new variant. We foresee that these changes might affect TALE-driven induction dynamics, but it is difficult to establish if these will result beneficial for the molecular interaction. Repeats located near to the N-terminal region contribute more to the specific DNA recognition and are more important to the overall affinity of the TALE-DNA interaction [85,86], but, paradoxically, increasing the number of repeats results in lower specificity due to more off-target activation [87]. What implications this change could have in the intensity of binding induction of the gene or in the adaptation of the pathogen to mutations in the promoter needs to be determined. A comparison of MeSWEET10a induction in plants treated with strains expressing these two TALE variants would indicate if this mutation has a significant impact on transcriptional activity of the S gene, and the search for this novel variant among populations would shed light on evolutionary dynamics of major TALEs.
The ammonium transporter encoding gene Manes.08G141800 is one of the most interesting candidates targeted by this new TALE variant. Grewal and coworkers demonstrated that rice response after a few hours of being inoculated with Xanthomonas oryzae pv. oryzae, a vascular pathogen responsible for the bacterial leaf blight in rice, encompasses the transcriptional alteration of several transporters, including ammonium transporters. Activity of these transporters change ion fluxes and affect the membrane potential, disturbing uptake of other channels and altering activation of defense response. In this regard, they point out that ammonium transporter activity affects K+ uptake by cells, which would lead to modified cation balances [88]. It is possible that these ammonium transporters have an analogous effect to that hypothesized for the sulfate transporter coding gene OsSULTR3;6 induced by Tal2g in the Xoc-rice pathosystem [3]. The expression of these genes might allow the bacteria to alter antioxidant capacity through ion leaking, which would result in interference with redox signaling and defense or in the promotion of water soaking through alteration of osmotic equilibrium.
Functional redundancy by convergence has been demonstrated for TALEs in other pathosystems. In those cases, important susceptibility genes are targeted by two or more TALEs that have potentially evolved from different ancestors and converge on EBEs present in the same promoter region [1,7,53,89,90,91]. Our data suggested that candidate genes Manes.04G033900 and Manes.13G045100 are targeted by TALE22 variants (which was already validated by Cohn and coworkers [8]) and also by the TALE21A variant found in CFBP1851, through overlapped EBEs. Our RT-PCR results indicate that Manes.13G045100 is actually upregulated in planta after inoculation with CFBP1851 strain (Figure 7B), showing that this is a potential case of functional convergence and a possible relevant target for the pathogen. However, even if at a first glance TALE21A variant has important structural differences when compared to TALE22 variants, DisTAL analysis indicates that variant TALE21A is very close to TALE22 variants, which would reflect the history of close evolving effectors that maintain affinities. Manes.13G045100 encodes for a CLAVATA3/ESR (CLE) peptide, a protein family of ligands involved in definition of cell fate with a key role in cellular division control in the shoot apical meristem [92,93]. This ligand family has been shown to be important in symbiotic processes through the regulation of nodule formation, and in pathogenic interactions where phytopathogens hijack the CLE-mediated developmental signaling pathway to improve fitness and colonization rate (reviewed by [94]). Nematodes Globodera rostochiensis [95] and Heterodera glycines [96] secrete effectors that mimic CLE functions which allow them to reprogram cell growth at the point of infection. To our knowledge, there are no reports of phytopathogenic bacteria using this pathway as a virulence factor, but there are other examples of cell fate-related transcriptional factors, UPA20 and UPA7 [12,97], which are also transcriptionally activated by TALEs (AvrBs3). Taking all this into consideration, validation and further studies on this TALE target could shed light on new host susceptibility pathways.

5. Conclusions

This work describes for the first time the TALE variability on Xpm populations. TALome sequences allowed us to make some evolutionary and functional inferences on TALE biology for the Xpm-cassava pathosystem. Functional clustering of TALEs unveiled traces of recombination, repeat swaps and repeat duplication/deletion. Transcriptomics indicate that new TALE20-derived TALE22D variant preserves the ability to activate the S gene MeSWEET10a. RNAseq with two Xpm strains showed that common up- and down-regulated genes have virtually the same behavior in terms of expression magnitude and regulation, and differentially expressed genes fall consistently in oxidoreductase and catabolic activity categories. Our results pinpoint new potential TALE targets that could have a role in pathogenesis. Further studies are needed to validate the TALE-dependent activation of these targets through the use of mutant strains inactivated in these TALEs and characterize their role during infection using artificial TALEs.

Supplementary Materials

The following are available online at https://www.mdpi.com/2076-2607/9/2/315/s1, Figure S1: Two edaphoclimatic zones (ECZs) where cassava is grown in Colombia and strain origins. The blue region corresponds to the Caribbean coast ECZ delimited as two departments: Córdoba and Sucre. The yellow region corresponds to the Eastern plains ECZ delimited as two departments: Casanare and Meta. Black dots show municipalities where strains were collected. The list of strains from each ECZ includes the collection date in parentheses. Figure S2: Southern blots for the characterized strains. The upper panel shows lanes for strains from the Caribbean coast and strains isolated from the department Meta (Eastern plains). The lower panel shows lanes for the strains from the department Casanare (Eastern plains). The ID of each strain is marked above each lane. MWM = molecular weight marker; TALE1Xam = pF3 vector containing TALE1Xam. This vector was also digested with BamHI and loaded into each gel as a positive control and size indicator. The molecular weight marker is presented as seen in the stained gel to estimate sizes. Figure S3: Repeat-based phylogeny created by DisTAL. Unrooted cladogram showing the phylogenetic relationship among nucleotide variants according to nucleotide composition of repeats after masking positions coding for RVDs. Labels indicate the variant classification according to the RVD string (T stands for TALE) and the strain where the gene was isolated. Colors are related to the clusters defined in Figure 3: blue = Cluster 1, magenta = Cluster 2, red = Cluster 3, cyan = Cluster 4, yellow = Cluster 5; orphans are all in black. Values on branches correspond to distances obtained from pair-wise alignments for repeat-based coded TALEs calculated by DisTAL. Figure S4: TALE-targeted candidate prediction for A) UA681 and B) UA1061 DUGs. These heatmaps show the best optioned candidates and their EBE-prediction quality from each software used. Top labels indicate the TALE variant that is predicted to bind each gene and the DNA-binding affinity cluster where it belongs. Rank indicates the position of the prediction (which is a reflect of the score) among the set of the top 400 predictions. Genes over the dashed horizontal line are considered as the best optioned candidates (see text). Figure S5: Selective GO-term enrichment analysis showing the cellular component (CC), molecular function (MF) and biological process (BP) categories that are significantly enriched with DEGs carrying EBEs on their promoters in UA681- or UA1061-treated plants. Discontinuous lines show the p-value thresholds corresponding to 0.05 (blue) and 0.01 (dark gray). Table S1. EBE position comparison between the promoter context of genes reported for varieties AM560-2 and 60444 genomes. Table S2. Potential cases of functional convergence among DUGs with predicted EBEs. Candidates are sorted from the top to the bottom according to the EBE prediction quality. Table S3. ID and short description of GO Terms displayed on Figure 4 and Figure S5. The order of GO Terms matches the order displayed on the y-axis of both figures.

Author Contributions

D.O.-R. performed strain selection, isolation, and sequencing of a number of TALEs; R.E.M. carried out the RNAseq experiments in in-vitro plants; Á.L.P.-Q. analyzed the RNAseq data and provided advice on TALVEZ and QueTAL suite use; A.D. processed the RNAseq data and cross-referenced this information with prediction data for further analyses. C.A.Z.-C. performed aggressiveness assessments, isolation, and sequencing of TALEs, data processing and analyses, and wrote the initial draft of the article; A.B. conceived the project, secured funding, directed experiments, and helped draft the manuscript in collaboration with C.E.L. and B.S.; S.R., C.E.L., B.S. and A.B. wrote and reviewed sections of the manuscripts. All authors have read and agreed to the published version of the manuscript.

Funding

This research was funded by the Colombian Ministry of Sciences (Former Colciencias), through project No. 315-2013; by Universidad de los Andes and its Basic Sciences funding through multiple research projects (seed project NUMBER assigned to CAZ and Project No. INV-2019-84-1855 assigned to AB); the Research Program on Roots, Tubers and Bananas, and the Agropolis Foundation (project #1403-073). CAZ was supported by a doctoral fellowship awarded by the Insitut de Recherche pour le Développement.

Data Availability Statement

Publicly available datasets were analyzed in this study. TALE nucleotide sequences can be found at GenBank under accession numbers MW413757-MW413802. RNA-Seq data can be found in the SRA database under the BioProject No. PRJNA688032, BioSample No. SAMN17167922 (https://www.ncbi.nlm.nih.gov/sra/PRJNA688032).

Acknowledgments

The Xanthomonas strains were collected and investigated under the contract for access to genetic resources from the Colombian Environmental Ministry Number 261 or 2019 with Universidad de los Andes. We acknowledge the contribution of undergraduate students from Universidad de los Andes Luisa Jaimes Niño and María Camila Buitrago during their internships. We also thank Adolfo Amezquita for statistical advice.

Conflicts of Interest

The authors declare no conflict of interest.

References

  1. Antony, G.; Zhou, J.; Huang, S.; Li, T.; Liu, B.; White, F.; Yang, B. Rice xa13 Recessive Resistance to Bacterial Blight Is Defeated by Induction of the Disease Susceptibility Gene Os-11N3. Plant Cell 2010, 22, 3864–3876. [Google Scholar] [CrossRef] [PubMed] [Green Version]
  2. Hu, Y.; Zhang, J.; Jia, H.; Sosso, D.; Li, T.; Frommer, W.B.; Yang, B.; White, F.F.; Wang, N.; Jones, J.B. Lateral organ boundaries 1 is a disease susceptibility gene for citrus bacterial canker disease. Proc. Natl. Acad. Sci. USA 2014, 111, E521–E529. [Google Scholar] [CrossRef] [PubMed] [Green Version]
  3. Cernadas, R.A.; Doyle, E.L.; Niño-Liu, D.O.; Wilkins, K.E.; Bancroft, T.; Wang, L.; Schmidt, C.L.; Caldo, R.; Yang, B.; White, F.F.; et al. Code-Assisted Discovery of TAL Effector Targets in Bacterial Leaf Streak of Rice Reveals Contrast with Bacterial Blight and a Novel Susceptibility Gene. PLoS Pathog. 2014, 10, e1003972. [Google Scholar] [CrossRef] [PubMed]
  4. Perez-Quintero, A.L.; Szurek, B. A Decade Decoded: Spies and Hackers in the History of TAL Effectors Research. Annu. Rev. Phytopathol. 2019, 57, 459–481. [Google Scholar] [CrossRef] [PubMed]
  5. Yang, B.; Sugio, A.; White, F.F. Os8N3 is a host disease-susceptibility gene for bacterial blight of rice. Proc. Natl. Acad. Sci. USA 2006, 103, 10503–10508. [Google Scholar] [CrossRef] [PubMed] [Green Version]
  6. Tran, T.T.; Pérez-Quintero, A.L.; Wonni, I.; Carpenter, S.C.D.; Yu, Y.; Wang, L.; Leach, J.E.; Verdier, V.; Cunnac, S.; Bogdanove, A.J.; et al. Functional analysis of African Xanthomonas oryzae pv. oryzae TALomes reveals a new susceptibility gene in bacterial leaf blight of rice. PLoS Pathog. 2018, 14, e1007092. [Google Scholar] [CrossRef]
  7. Yu, Y.; Streubel, J.; Balzergue, S.; Champion, A.; Boch, J.; Koebnik, R.; Feng, J.; Verdier, V.; Szurek, B. Colonization of Rice Leaf Blades by an African Strain of Xanthomonas oryzae pv. oryzae Depends on a New TAL Effector That Induces the Rice Nodulin-3 Os11N3 Gene. Mol. Plant-Microbe Interact. 2011, 24, 1102–1113. [Google Scholar] [CrossRef] [Green Version]
  8. Cohn, M.; Bart, R.S.; Shybut, M.; Dahlbeck, D.; Gomez, M.; Morbitzer, R.; Hou, B.-H.; Frommer, W.B.; Lahaye, T.; Staskawicz, B.J. Xanthomonas axonopodis Virulence Is Promoted by a Transcription Activator-Like Effector–Mediated Induction of a SWEET Sugar Transporter in Cassava. Mol. Plant-Microbe Interact. 2014, 27, 1186–1198. [Google Scholar] [CrossRef] [Green Version]
  9. Sugio, A.; Yang, B.; Zhu, T.; White, F.F. Two type III effector genes of Xanthomonas oryzae pv. oryzae control the induction of the host genes OsTFIIAγ1 and OsTFX1 during bacterial blight of rice. Proc. Natl. Acad. Sci. USA 2007, 104, 10720–10725. [Google Scholar] [CrossRef] [Green Version]
  10. Schwartz, A.R.; Morbitzer, R.; Lahaye, T.; Staskawicz, B.J. TALE-induced bHLH transcription factors that activate a pectate lyase contribute to water soaking in bacterial spot of tomato. Proc. Natl. Acad. Sci. USA 2017, 114, E897–E903. [Google Scholar] [CrossRef] [Green Version]
  11. Cox, K.L.; Meng, F.; Wilkins, K.E.; Li, F.; Wang, P.; Booher, N.J.; Carpenter, S.C.D.; Chen, L.-Q.; Zheng, H.; Gao, X.; et al. TAL effector driven induction of a SWEET gene confers susceptibility to bacterial blight of cotton. Nat. Commun. 2017, 8, 15588. [Google Scholar] [CrossRef] [PubMed]
  12. Kay, S.; Hahn, S.; Marois, E.; Hause, G.; Bonas, U. A Bacterial Effector Acts as a Plant Transcription Factor and Induces a Cell Size Regulator. Science 2007, 318, 648–651. [Google Scholar] [CrossRef] [PubMed] [Green Version]
  13. Boch, J.; Bonas, U. Xanthomonas AvrBs3 Family-Type III Effectors: Discovery and Function. Annu. Rev. Phytopathol. 2010, 48, 419–436. [Google Scholar] [CrossRef] [PubMed]
  14. Bogdanove, A.J.; Schornack, S.; Lahaye, T. TAL effectors: Finding plant genes for disease and defense. Curr. Opin. Plant Biol. 2010, 13, 394–401. [Google Scholar] [CrossRef]
  15. Szurek, B.; Rossier, O.; Hause, G.; Bonas, U. Type III-dependent translocation of the Xanthomonas AvrBs3 protein into the plant cell. Mol. Microbiol. 2002, 46, 13–23. [Google Scholar] [CrossRef]
  16. Yang, Y.; Gabriel, D.W. Xanthomonas avirulence/pathogenicity gene family encodes functional plant nuclear targeting signals. Mol. Plant. Microbe Interact. 1995, 8, 627–631. [Google Scholar] [CrossRef]
  17. Zhu, W.; Yang, B.; Chittoor, J.M.; Johnson, L.B.; White, F.F. AvrXa10 Contains an Acidic Transcriptional Activation Domain in the Functionally Conserved C Terminus. Mol. Plant-Microbe Interact. 1998, 11, 824–832. [Google Scholar] [CrossRef] [Green Version]
  18. Deng, D.; Yan, C.; Wu, J.; Pan, X.; Yan, N. Revisiting the TALE repeat. Protein Cell 2014, 5, 297–306. [Google Scholar] [CrossRef] [Green Version]
  19. Schandry, N.; Jacobs, J.M.; Szurek, B.; Perez-Quintero, A.L. A cautionary TALE: How plant breeding may have favoured expanded TALE repertoires in Xanthomonas. Mol. Plant Pathol. 2018, 19, 1297–1301. [Google Scholar] [CrossRef] [Green Version]
  20. Mak, A.N.-S.; Bradley, P.; Bogdanove, A.J.; Stoddard, B.L. TAL effectors: Function, structure, engineering and applications. Curr. Opin. Struct. Biol. 2013, 23, 93–99. [Google Scholar] [CrossRef] [Green Version]
  21. Mak, A.N.-S.; Bradley, P.; Cernadas, R.A.; Bogdanove, A.J.; Stoddard, B.L. The Crystal Structure of TAL Effector PthXo1 Bound to Its DNA Target. Science 2012, 335, 716–719. [Google Scholar] [CrossRef] [PubMed] [Green Version]
  22. Deng, D.; Yan, C.; Pan, X.; Mahfouz, M.; Wang, J.; Zhu, J.-K.; Shi, Y.; Yan, N. Structural basis for sequence-specific recognition of DNA by TAL effectors. Science 2012, 335, 720–723. [Google Scholar] [CrossRef] [PubMed] [Green Version]
  23. Moscou, M.J.; Bogdanove, A.J. A Simple Cipher Governs DNA Recognition by TAL Effectors. Science 2009, 326, 1501. [Google Scholar] [CrossRef] [PubMed]
  24. Boch, J.; Scholze, H.; Schornack, S.; Landgraf, A.; Hahn, S.; Kay, S.; Lahaye, T.; Nickstadt, A.; Bonas, U. Breaking the code of DNA binding specificity of TAL-type III effectors. Science 2009, 326, 1509–1512. [Google Scholar] [CrossRef] [PubMed]
  25. Yuan, M.; Ke, Y.; Huang, R.; Ma, L.; Yang, Z.; Chu, Z.; Xiao, J.; Li, X.; Wang, S. A host basal transcription factor is a key component for infection of rice by TALE-carrying bacteria. eLife 2016, 5, e19605. [Google Scholar] [CrossRef]
  26. Peng, Z.; Hu, Y.; Zhang, J.; Huguet-Tapia, J.C.; Block, A.K.; Park, S.; Sapkota, S.; Liu, Z.; Liu, S.; White, F.F. Xanthomonas translucens commandeers the host rate-limiting step in ABA biosynthesis for disease susceptibility. Proc. Natl. Acad. Sci. USA 2019, 116, 20938–20946. [Google Scholar] [CrossRef] [Green Version]
  27. Chen, L.-Q.; Hou, B.-H.; Lalonde, S.; Takanaga, H.; Hartung, M.L.; Qu, X.-Q.; Guo, W.-J.; Kim, J.-G.; Underwood, W.; Chaudhuri, B.; et al. Sugar transporters for intercellular exchange and nutrition of pathogens. Nature 2010, 468, 527–532. [Google Scholar] [CrossRef] [Green Version]
  28. El Kasmi, F.; Horvath, D.; Lahaye, T. Microbial effectors and the role of water and sugar in the infection battle ground. Curr. Opin. Plant Biol. 2018, 44, 98–107. [Google Scholar] [CrossRef]
  29. Duan, S.; Jia, H.; Pang, Z.; Teper, D.; White, F.; Jones, J.; Zhou, C.; Wang, N. Functional characterization of the citrus canker susceptibility gene CsLOB1. Mol. Plant Pathol. 2018, 19, 1908–1916. [Google Scholar] [CrossRef] [Green Version]
  30. Constantin, E.C.; Cleenwerck, I.; Maes, M.; Baeyen, S.; Van Malderghem, C.; De Vos, P.; Cottyn, B. Genetic characterization of strains named as Xanthomonas axonopodis pv. dieffenbachiae leads to a taxonomic revision of the X. axonopodis species complex. Plant Pathol. 2016, 65, 792–806. [Google Scholar] [CrossRef]
  31. CABI. Xanthomonas axonopodis pv. manihotis (cassava Bacterial Blight). Available online: www.cabi.org/isc (accessed on 1 October 2020).
  32. Bart, R.; Cohn, M.; Kassen, A.; McCallum, E.J.; Shybut, M.; Petriello, A.; Krasileva, K.; Dahlbeck, D.; Medina, C.; Alicai, T.; et al. High-throughput genomic sequencing of cassava bacterial blight strains identifies conserved effectors to target for durable resistance. Proc. Natl. Acad. Sci. USA 2012, 109, E1972–E1979. [Google Scholar] [CrossRef] [Green Version]
  33. Restrepo, S.; Valle, T.L.; Duque, M.C.; Verdier, V. Assessing genetic variability among Brazilian strains of Xanthomonas axonopodis pv. manihotis through restriction fragment length polymorphism and amplified fragment length polymorphism analyses. Can. J. Microbiol. 1999, 45, 754–763. [Google Scholar] [CrossRef]
  34. Restrepo, S.; Vélez, C.M.; Verdier, V. Measuring the Genetic Diversity of Xanthomonas axonopodis pv. manihotis Within Different Fields in Colombia. Phytopathology 2000, 90, 683–690. [Google Scholar] [CrossRef] [Green Version]
  35. Restrepo, S.; Verdier, V. Geographical Differentiation of the Population of Xanthomonas axonopodis pv. manihotis in Colombia. Appl. Environ. Microbiol. 1997, 63, 4427–4434. [Google Scholar] [CrossRef] [PubMed] [Green Version]
  36. Verdier, V.; Restrepo, S.; Mosquera, G.; Duque, M.C.; Gerstl, A.; Laberry, R. Genetic and pathogenic variation of Xanthomonas axonopodis pv. manihotis in Venezuela. Plant Pathol. 2001, 47, 601–608. [Google Scholar] [CrossRef] [Green Version]
  37. Gonzalez, C.; Restrepo, S.; Tohme, J.; Verdier, V. Characterization of pathogenic and nonpathogenic strains of Xanthomonas axonopodis pv. manihotis by PCR-based DNA fingerprinting techniques. Fems Microbiol. Lett. 2002, 215, 23–31. [Google Scholar] [CrossRef]
  38. Arrieta-Ortiz, M.L.; Rodríguez-R, L.M.; Pérez-Quintero, Á.L.; Poulin, L.; Díaz, A.C.; Arias Rojas, N.; Trujillo, C.; Restrepo Benavides, M.; Bart, R.; Boch, J.; et al. Genomic survey of pathogenicity determinants and VNTR markers in the cassava bacterial pathogen Xanthomonas axonopodis pv. manihotis strain CIO151. PLoS ONE 2013, 8, e79704. [Google Scholar] [CrossRef]
  39. Cohn, M.; Morbitzer, R.; Lahaye, T.; Staskawicz, B.J. Comparison of gene activation by two TAL effectors from Xanthomonas axonopodis pv. manihotis reveals candidate host susceptibility genes in cassava. Mol. Plant Pathol. 2016, 875–889. [Google Scholar] [CrossRef] [PubMed] [Green Version]
  40. Castiblanco, L.F.; Gil, J.; Rojas, A.; Osorio, D.; Gutiérrez, S.; Muñoz-Bodnar, A.; Perez-Quintero, A.L.; Koebnik, R.; Szurek, B.; López, C.; et al. TALE1 from Xanthomonas axonopodis pv. manihotis acts as a transcriptional activator in plant cells and is important for pathogenicity in cassava plants. Mol. Plant Pathol. 2012, 14, 84–95. [Google Scholar] [CrossRef] [PubMed]
  41. Munoz-Bodnar, A.; Pérez-Quintero, A.; Gomez-Cano, F.; Gil, J.; Michelmore, R.; Bernal, A.; Szurek, B.; Lopez, C. RNAseq analysis of cassava reveals similar plant responses upon infection with pathogenic and non-pathogenic strains of Xanthomonas axonopodis pv. manihotis. Plant Cell Rep. 2014, 33, 1901–1912. [Google Scholar] [CrossRef]
  42. Aristizábal, J.; Sánchez, T. Guía Técnica para Producción y Análisis de Almidón de Yuca; FAO: Roma, Italy, 2007. [Google Scholar]
  43. FAO. Save and Grow: Cassava, a Guide to Sustainable Production Intensification; FAO: Roma, Italy, 2013; ISBN 978-92-5-107641-5. [Google Scholar]
  44. Parmar, A.; Sturm, B.; Hensel, O. Crops that feed the world: Production and improvement of cassava for food, feed, and industrial uses. Food Secur. 2017, 9, 907–927. [Google Scholar] [CrossRef]
  45. Lozano, J.C. Cassava Bacterial Blight: A Manageable Disease. Plant Dis. 1986, 70, 1089. [Google Scholar] [CrossRef]
  46. Wydra, K.; Verdier, V. Occurrence of cassava diseases in relation to environmental, agronomic and plant characteristics. Agric. Ecosyst. Environ. 2002, 93, 211–226. [Google Scholar] [CrossRef]
  47. Abaca, A.; Kiryowa, M.; Awori, E.; Andema, A.; Dradiku, F.; Moja, A.; Mukalazi, J. Cassava Pests and Diseases’ Prevalence and Performance as Revealed by Adaptive Trial Sites in North Western Agro-Ecological Zone of Uganda. J. Agric. Sci. 2013, 6. [Google Scholar] [CrossRef]
  48. López, C.E.; Bernal, A.J. Cassava Bacterial Blight: Using Genomics for the Elucidation and Management of an Old Problem. Trop. Plant Biol. 2012, 5, 117–126. [Google Scholar] [CrossRef]
  49. Trujillo, C.; Arias-Rojas, N.; Poulin, L.; Medina, C.; Tapiero, A.; Restrepo, S.; Koebnik, R.; Bernal, A. Population typing of the causal agent of cassava bacterial blight in the Eastern Plains of Colombia using two types of molecular markers. BMC Microbiol. 2014, 14, 161. [Google Scholar] [CrossRef] [Green Version]
  50. Trujillo, C.; Ochoa, J.C.; Mideros, M.F.; Restrepo, S.; Lopez, C.; Bernal, A. A complex population structure of the cassava pathogen Xanthomonas axonopodis pv. manihotis in recent years in the Caribbean Region of Colombia. Microb. Ecol. 2014, 68, 155–167. [Google Scholar] [CrossRef]
  51. Blanvillain-Baufumé, S.; Reschke, M.; Solé, M.; Auguy, F.; Doucoure, H.; Szurek, B.; Meynard, D.; Portefaix, M.; Cunnac, S.; Guiderdoni, E.; et al. Targeted promoter editing for rice resistance to Xanthomonas oryzae pv. oryzae reveals differential activities for SWEET14-inducing TAL effectors. Plant Biotechnol. J. 2017, 15, 306–317. [Google Scholar] [CrossRef] [Green Version]
  52. Oliva, R.; Ji, C.; Atienza-Grande, G.; Huguet-Tapia, J.C.; Perez-Quintero, A.; Li, T.; Eom, J.-S.; Li, C.; Nguyen, H.; Liu, B.; et al. Broad-spectrum resistance to bacterial blight in rice using genome editing. Nat. Biotechnol. 2019, 37, 1344–1350. [Google Scholar] [CrossRef] [Green Version]
  53. Hutin, M.; Pérez-Quintero, A.L.; Lopez, C.; Szurek, B. MorTAL Kombat: The story of defense against TAL effectors through loss-of-susceptibility. Front. Plant Sci. 2015, 6, 535. [Google Scholar] [CrossRef] [Green Version]
  54. Shantharaj, D.; Römer, P.; Figueiredo, J.F.L.; Minsavage, G.V.; Krönauer, C.; Stall, R.E.; Moore, G.A.; Fisher, L.C.; Hu, Y.; Horvath, D.M.; et al. An engineered promoter driving expression of a microbial avirulence gene confers recognition of TAL effectors and reduces growth of diverse Xanthomonas strains in citrus. Mol. Plant Pathol. 2017, 18, 976–989. [Google Scholar] [CrossRef] [PubMed]
  55. Zhang, J.; Yin, Z.; White, F. TAL effectors and the executor R genes. Front. Plant Sci. 2015, 6, 641. [Google Scholar] [CrossRef] [PubMed]
  56. Mora, R.; Rodriguez, M.; Gayosso, L.; López, C. Using in vitro plants to study the cassava response to Xanthomonas phaseoli pv. manihotis infection. Trop. Plant Pathol. 2019. [Google Scholar] [CrossRef]
  57. Schneider, C.A.; Rasband, W.S.; Eliceiri, K.W. NIH Image to ImageJ: 25 Years of image analysis. Nat. Methods 2012, 9, 671–675. [Google Scholar] [CrossRef]
  58. Medina, C.A.; Reyes, P.A.; Trujillo, C.A.; Gonzalez, J.L.; Bejarano, D.A.; Montenegro, N.A.; Jacobs, J.M.; Joe, A.; Restrepo, S.; Alfano, J.R.; et al. The role of type III effectors from Xanthomonas axonopodis pv. manihotis in virulence and suppression of plant immunity. Mol. Plant Pathol. 2018, 19, 593–606. [Google Scholar] [CrossRef] [Green Version]
  59. Sambrook, J.R.D.W. Molecular Cloning: A Laboratory Manual, 3rd ed.; Cold Spring Harbor Laboratory Press: New York, NY, USA, 2001. [Google Scholar]
  60. Eisel, D.; Seth, O.; Grünewald-Janho, S.; Kruchen, B.; Rüger, B. DIG Application Manual for Filter Hybridization; Roche Applied Science: Mannheim, Germany, 2008. [Google Scholar]
  61. Pérez-Quintero, A.L.; Lamy, L.; Gordon, J.L.; Escalon, A.; Cunnac, S.; Szurek, B.; Gagnevin, L. QueTAL: A suite of tools to classify and compare TAL effectors functionally and phylogenetically. Front. Plant Sci. 2015, 6, 545. [Google Scholar] [CrossRef] [Green Version]
  62. Bray, N.L.; Pimentel, H.; Melsted, P.; Pachter, L. Near-optimal probabilistic RNA-seq quantification. Nat. Biotechnol. 2016, 34, 525–527. [Google Scholar] [CrossRef]
  63. Robinson, M.D.; McCarthy, D.J.; Smyth, G.K. edgeR: A Bioconductor package for differential expression analysis of digital gene expression data. Bioinformatics 2009, 26, 139–140. [Google Scholar] [CrossRef] [Green Version]
  64. Rahnenfuhrer, J.; Alexa, A. TopGO: Enrichment Analysis for Gene Ontology; R Package Version 2.38.1. 2019. Available online: https://bioconductor.org/packages/release/bioc/manuals/topGO/man/topGO.pdf (accessed on 1 October 2020).
  65. Grau, J.; Wolf, A.; Reschke, M.; Bonas, U.; Posch, S.; Boch, J. Computational Predictions Provide Insights into the Biology of TAL Effector Target Sites. PLoS Comput. Biol. 2013, 9, e1002962. [Google Scholar] [CrossRef] [Green Version]
  66. Erkes, A.; Mücke, S.; Reschke, M.; Boch, J.; Grau, J. PrediTALE: A novel model learned from quantitative data allows for new perspectives on TALE targeting. PLoS Comput. Biol. 2019, 15, e1007206. [Google Scholar] [CrossRef] [Green Version]
  67. Wang, L.; Rinaldi, F.C.; Singh, P.; Doyle, E.L.; Dubrow, Z.E.; Tran, T.T.; Pérez-Quintero, A.L.; Szurek, B.; Bogdanove, A.J. TAL Effectors Drive Transcription Bidirectionally in Plants. Mol. Plant 2017, 10, 285–296. [Google Scholar] [CrossRef] [PubMed] [Green Version]
  68. Kuon, J.-E.; Qi, W.; Schläpfer, P.; Hirsch-Hoffmann, M.; von Bieberstein, P.R.; Patrignani, A.; Poveda, L.; Grob, S.; Keller, M.; Shimizu-Inatsugi, R.; et al. Haplotype-resolved genomes of geminivirus-resistant and geminivirus-susceptible African cassava cultivars. BMC Biol. 2019, 17, 75. [Google Scholar] [CrossRef] [PubMed] [Green Version]
  69. Lin, H.-C.; Chang, Y.-A.; Chang, H. A pthA homolog from a variant of Xanthomonas axonopodis pv. citri enhances virulence without inducing canker symptom. Eur. J. Plant Pathol. 2013, 137, 677–688. [Google Scholar] [CrossRef]
  70. Kassambara, A. ggpubr: “ggplot2” Based Publication Ready Plots; R Package Version 0.2.4. 2019. Available online: https://cran.r-project.org/web/packages/ggpubr/index.html (accessed on 1 October 2020).
  71. Ahmed, M.; Kim, D.R. pcr: An R package for quality assessment, analysis and testing of qPCR data. PeerJ 2018, 6, e4473. [Google Scholar] [CrossRef] [PubMed]
  72. Wickham, H. ggplot2: Elegant Graphics for Data Analysis; Springer: New York, NY, USA, 2016; ISBN 978-3-319-24277-4. [Google Scholar]
  73. Warnes, G.R.; Bolker, B.; Bonebakker, L.; Gentleman, R.; Huber, W.; Liaw, A.; Lumley, T.; Maechler, M.; Magnusson, A.; Moeller, S.; et al. gplots: Various R Programming Tools for Plotting Data; R Package Version 3.0.1.2. 2020. Available online: https://cran.r-project.org/web/packages/gplots/index.html (accessed on 1 October 2020).
  74. Wilkins, D. gggenes: Draw Gene Arrow Maps in “ggplot2”; R Package Version 0.4.0. 2019. Available online: http://cran.wustl.edu/web/packages/gggenes/gggenes.pdf (accessed on 1 October 2020).
  75. Soto-Sedano, J.C.; Mora-Moreno, R.E.; Mathew, B.; Léon, J.; Gómez-Cano, F.A.; Ballvora, A.; López-Carrascal, C.E. Major Novel QTL for Resistance to Cassava Bacterial Blight Identified through a Multi-Environmental Analysis. Front. Plant Sci. 2017, 8, 1169. [Google Scholar] [CrossRef] [PubMed]
  76. Bredeson, J.V.; Lyons, J.B.; Prochnik, S.E.; Wu, G.A.; Ha, C.M.; Edsinger-Gonzales, E.; Grimwood, J.; Schmutz, J.; Rabbi, I.Y.; Egesi, C.; et al. Sequencing wild and cultivated cassava and related species reveals extensive interspecific hybridization and genetic diversity. Nat. Biotechnol. 2016, 34, 562–570. [Google Scholar] [CrossRef] [PubMed] [Green Version]
  77. Pérez-Quintero, A.L.; Rodriguez-R, L.M.; Dereeper, A.; López, C.; Koebnik, R.; Szurek, B.; Cunnac, S. An Improved Method for TAL Effectors DNA-Binding Sites Prediction Reveals Functional Convergence in TAL Repertoires of Xanthomonas oryzae Strains. PLoS ONE 2013, 8, e68464. [Google Scholar] [CrossRef]
  78. Doyle, E.L.; Booher, N.J.; Standage, D.S.; Voytas, D.F.; Brendel, V.P.; VanDyk, J.K.; Bogdanove, A.J. TAL Effector-Nucleotide Targeter (TALE-NT) 2.0: Tools for TAL effector design and target prediction. Nucleic Acids Res. 2012, 40, W117–W122. [Google Scholar] [CrossRef] [Green Version]
  79. Ye, G.; Hong, N.; Zou, L.-F.; Zou, H.-S.; Zakria, M.; Wang, G.-P.; Chen, G.-Y. tale-Based Genetic Diversity of Chinese Isolates of the Citrus Canker Pathogen Xanthomonas citri subsp. citri. Plant Dis. 2013, 97, 1187–1194. [Google Scholar] [CrossRef] [Green Version]
  80. Ferreira, R.M.; de Oliveira, A.C.P.; Moreira, L.M.; Belasque, J.; Gourbeyre, E.; Siguier, P.; Ferro, M.I.T.; Ferro, J.A.; Chandler, M.; Varani, A.M. A TALE of Transposition: Tn3-Like Transposons Play a Major Role in the Spread of Pathogenicity Determinants of Xanthomonas citri and Other Xanthomonads. mBio 2015, 6. [Google Scholar] [CrossRef] [Green Version]
  81. Ruh, M.; Briand, M.; Bonneau, S.; Jacques, M.-A.; Chen, N.W.G. Xanthomonas adaptation to common bean is associated with horizontal transfers of genes encoding TAL effectors. BMC Genom. 2017, 18, 670. [Google Scholar] [CrossRef] [PubMed]
  82. Denancé, N.; Szurek, B.; Doyle, E.L.; Lauber, E.; Fontaine-Bodin, L.; Carrère, S.; Guy, E.; Hajri, A.; Cerutti, A.; Boureau, T.; et al. Two ancestral genes shaped the Xanthomonas campestris TAL effector gene repertoire. New Phytol. 2018, 219, 391–407. [Google Scholar] [CrossRef] [PubMed] [Green Version]
  83. Erkes, A.; Reschke, M.; Boch, J.; Grau, J. Evolution of Transcription Activator-Like Effectors in Xanthomonas oryzae. Genome Biol. Evol. 2017, 9, 1599–1615. [Google Scholar] [CrossRef] [PubMed]
  84. Schandry, N.; de Lange, O.; Prior, P.; Lahaye, T. TALE-Like Effectors Are an Ancestral Feature of the Ralstonia solanacearum Species Complex and Converge in DNA Targeting Specificity. Front. Plant Sci. 2016, 7, 1225. [Google Scholar] [CrossRef] [PubMed] [Green Version]
  85. Meckler, J.F.; Bhakta, M.S.; Kim, M.-S.; Ovadia, R.; Habrian, C.H.; Zykovich, A.; Yu, A.; Lockwood, S.H.; Morbitzer, R.; Elsäesser, J.; et al. Quantitative analysis of TALE–DNA interactions suggests polarity effects. Nucleic Acids Res. 2013, 41, 4118–4128. [Google Scholar] [CrossRef] [Green Version]
  86. Wan, H.; Hu, J.; Li, K.; Tian, X.; Chang, S. Molecular Dynamics Simulations of DNA-Free and DNA-Bound TAL Effectors. PLoS ONE 2013, 8, e76045. [Google Scholar] [CrossRef] [Green Version]
  87. Guilinger, J.P.; Pattanayak, V.; Reyon, D.; Tsai, S.Q.; Sander, J.D.; Joung, J.K.; Liu, D.R. Broad specificity profiling of TALENs results in engineered nucleases with improved DNA-cleavage specificity. Nat. Methods 2014, 11, 429–435. [Google Scholar] [CrossRef] [Green Version]
  88. Grewal, R.K.; Gupta, S.; Das, S. Xanthomonas oryzae pv. oryzae triggers immediate transcriptomic modulations in rice. BMC Genom. 2012, 13, 49. [Google Scholar] [CrossRef] [Green Version]
  89. Yang, B.; White, F.F. Diverse Members of the AvrBs3/PthA Family of Type III Effectors Are Major Virulence Determinants in Bacterial Blight Disease of Rice. Mol. Plant-Microbe Interact. 2004, 17, 1192–1200. [Google Scholar] [CrossRef] [Green Version]
  90. Streubel, J.; Pesce, C.; Hutin, M.; Koebnik, R.; Boch, J.; Szurek, B. Five phylogenetically close rice SWEET genes confer TAL effector-mediated susceptibility to Xanthomonas oryzae pv. oryzae. New Phytol. 2013, 200, 808–819. [Google Scholar] [CrossRef]
  91. Zhou, J.; Peng, Z.; Long, J.; Sosso, D.; Liu, B.; Eom, J.-S.; Huang, S.; Liu, S.; Vera Cruz, C.; Frommer, W.B.; et al. Gene targeting by the TAL effector PthXo2 reveals cryptic resistance gene for bacterial blight of rice. Plant J. 2015, 82, 632–643. [Google Scholar] [CrossRef] [PubMed]
  92. Betsuyaku, S.; Sawa, S.; Yamada, M. The Function of the CLE Peptides in Plant Development and Plant-Microbe Interactions. Arab. Book/Am. Soc. Plant Biol. 2011, 9, e0149. [Google Scholar] [CrossRef] [PubMed] [Green Version]
  93. Strabala, T.J.; O’donnell, P.J.; Smit, A.-M.; Ampomah-Dwamena, C.; Martin, E.J.; Netzler, N.; Nieuwenhuizen, N.J.; Quinn, B.D.; Foote, H.C.C.; Hudson, K.R. Gain-of-function phenotypes of many CLAVATA3/ESR genes, including four new family members, correlate with tandem variations in the conserved CLAVATA3/ESR domain. Plant Physiol. 2006, 140, 1331–1344. [Google Scholar] [CrossRef] [PubMed] [Green Version]
  94. Yamaguchi, Y.L.; Ishida, T.; Sawa, S. CLE peptides and their signaling pathways in plant development. J. Exp. Bot. 2016, 67, 4813–4826. [Google Scholar] [CrossRef] [Green Version]
  95. Guo, Y.; Ni, J.; Denver, R.; Wang, X.; Clark, S.E. Mechanisms of molecular mimicry of plant CLE peptide ligands by the parasitic nematode Globodera rostochiensis. Plant Physiol. 2011, 157, 476–484. [Google Scholar] [CrossRef] [Green Version]
  96. Wang, X.; Mitchum, M.G.; Gao, B.; Li, C.; Diab, H.; Baum, T.J.; Hussey, R.S.; Davis, E.L. A parasitism gene from a plant-parasitic nematode with function similar to CLAVATA3/ESR (CLE) of Arabidopsis thaliana. Mol. Plant Pathol. 2005, 6, 187–191. [Google Scholar] [CrossRef]
  97. Marois, E.; Van den Ackerveken, G.; Bonas, U. The Xanthomonas Type III Effector Protein AvrBs3 Modulates Plant Gene Expression and Induces Cell Hypertrophy in the Susceptible Host. Mol. Plant-Microbe Interact. 2002, 15, 637–646. [Google Scholar] [CrossRef] [Green Version]
Figure 1. Aggressiveness of selected Xpm strains. Lesion areas in squared millimeters are displayed for each strain. Strains used as reference for each region (CFBP1851 and CIO151) are bolded and italicized in the x-axis. Boxes for strains isolated in the Caribbean coast region are colored in blue, while boxes for strains isolated in the Eastern plains are colored in dark yellow. Boxplots were constructed with measurements from three biological replicates with three replicates each. A linear mixed model was fitted to the log10 transformed data, with replicates of the experiment as random effect, which showed to be near to zero. Different letters indicate significant differences according to a post-hoc Tukey’s test (α = 0.05).
Microorganisms 09 00315 g001
Figure 2. RFLP analysis, sequenced TALE gene variants and distribution. (A) TALome representation based on RFLP analysis and sequencing. Each band observed in the RFLP blot indicates the presence of at least one TALE gene. Cloned and sequenced TALE gene variants were first classified according to their size in terms of repeat number and then a letter was assigned to each variant according to the translated RVD sequence. Different letters in a row indicate different RVD strings for each TALE size. TALE genes that were only detected based on the RFLP analysis are indicated with a star. Reference strains of each ecozone are shown bolded and italicized in the x-axis. (B) TALE size prevalence according to regions. Frequencies are based on the size and number of bands observed on the RFLP analysis.
Microorganisms 09 00315 g002
Figure 3. RVD sequence clustering based on predicted DNA-binding affinity. FuncTAL was used to estimate distances based on the predicted TALE affinity. The dendrogram on the left shows the estimated relationship, where numbers represent the distance between the position weight matrices calculated for each TALE. In branch labels, T stands for TALE. Blue branches limit each cluster, and black terminal branches indicate that the corresponding effector was not clustered (orphans). Central alignments depict RVD strings for each TALE variant, where each box represents a repeat with its RVD. Boxes are colored according to RVD type. Dotted lines show gaps inserted by the alignment procedure. Labels on the right indicate tags of clusters as defined by blue branches. The red square shows a possible duplication of the first two repeats, blue squares show repeat swaps between TALE variants.
Microorganisms 09 00315 g003
Figure 4. Overview of RNAseq data and GO-term enrichment for differentially expressed genes. (A) Comparison of cassava gene expression profiles observed at 50 hpi of 60444 plants inoculated with Xpm strains UA681 and UA1061; mock-inoculated plants were used to determine the differentially expressed genes in each case. Plot shows the shared differentially upregulated genes (DUGs) in blue and differentially down-regulated genes (DDGs) in red, while a gene that has a contrasting transcriptional behavior between the two bacterial treatments is marked in yellow. Marked genes correspond to the three shared DUGs and DDGs with most extreme response magnitudes: A: Manes.06G123400; B: Manes.17G063800; C: Manes.07G120000; D: Manes.17G042600; E: Manes.05G151100; F: Manes.18G029800. (B) Heatmap of the shared DUGs and DDGs transcriptional behavior. (C) GO-term enrichment analysis showing the cellular component (CC), molecular function (MF) and biological process (BP) categories that are significantly enriched in the differentially expressed genes in UA681- or UA1061-treated plants. The corresponding GO term IDs are summarized in the Supplementary Table S3. Discontinuous lines show the p-value thresholds corresponding to 0.05 (blue) and 0.01 (dark gray).
Microorganisms 09 00315 g004
Figure 5. Differentially upregulated genes with predicted EBEs and their promoter context. (A) Shared DUGs with EBE predictions for TALE variants or TALE clusters shared by both strains. The heatmap shows the best candidates and the EBE-prediction quality from each software. Top labels indicate the TALE variant predicted to bind each gene and the DNA-binding affinity cluster where it belongs. Rank indicates the position of the prediction (based on the score) among the set of the top 400 predictions. Genes over the dashed line are considered as the best optioned candidates (see text). (B) Promoter context and predicted EBE position for candidates retained after the second filter (see text above). Genes are represented by gray arrows, while EBEs are represented by short arrows with a color code according to prediction quality. Direction of short arrows indicates if EBEs are located in the plus (pointing to right) or the minus (pointing to left) strands. Transcription start sites (as annotated on Phytozome’s cassava genome v6.1) are marked as vertical black lines connected to the translational start site with a solid black line to represent the 5′-UTR.
Microorganisms 09 00315 g005
Figure 6. RT-qPCR validation of expression profile for selected genes. (A) Relative expression of four DUGs in UA681-inoculated vs. mock-inoculated plants. Main bars show the average of three independent replicates, and error bars show standard deviation. Note that y-axis has been broken to allow visualization of less expressed genes. p-values correspond to a two-tailed t-test (α = 0.05) comparing normalized expression in the UA681-inoculated and mock-inoculated treatments. X axis shows gene identifiers and a three-letter code to denote each gene. (B) Relative expression tested by RT-qPCR plotted against RNAseq profiles for the selected candidates. White boxes show the gene identifiers.
Microorganisms 09 00315 g006
Figure 7. EBE predictions and semiquantitative RT-PCR in the context of a convergent activation of two candidates by two different TALEs. (A) Overlapping EBEs for TALE21A and TALE variants of the cluster 2 in the context of promoters for Manes.04G033900 and Manes.13G045100 genes. Each case is displayed as an overview and a zoom on the region of interest. EBEs are shown as gray arrows pointing to the right. CDS is represented as a yellow band, while 5-UTR region (only annotated for Manes.04G033900) is shown as a gray band. TSS or TSL was centered on the nucleotide number 1000, so coordinates are a reflect of this setting. (B) Semiquantitative RT-PCR for genes Manes.04G033900 and Manes.13G045100 on cDNA from cassava leaves inoculated with CFBP1851 or with a 10-mM MgCl2 solution (Mock). R1, R2 and R3 are independent replicates of the inoculation. Tubuline (TUB—Manes.08G061700) was used as the reference gene for normalization.
Microorganisms 09 00315 g007
Table 1. Primers used for RT-qPCR assays.
Target Gene aTypeSequence (5′→3′)Reference
Candidate gene: Manes.06G123400
(MeSWEET10a)
FwTCCTCACCTTGACTGCGGTG[8]
RvAGCACCATCTGGACAATCCCA
Candidate gene: Manes.04G033900
(Dof domain, zinc finger)
FwAAAGTGCCCAAGAGGTGGTGThis study
RvGCCTTTCACTTGAAGCTGGG
Candidate gene: Manes.13G045100
(Clavata3/ESR CLE-related protein)
FwCCACGACGAACTTTCACCCAThis study
RvCGCTGGGAACTTCATGAGCT
Candidate gene: Manes.11G151300
(Serine carboxypeptidase)
FwGCCCCAACTGTTAGATTTGTGGThis study
RvGGTGACCAGCTTCATACACCTT
Candidate gene: Manes.15G052000
(Beta-glucosidase)
FwTTGAAGATATGCTCAACGACACGThis study
RvCGTCTGCTCCGTTCCTGATA
Reference gene: Manes.08G061700.1
(Tubulin beta-6 chain)
FwGGAAAGATGAGCACCAAGGA[56]
RvACCAGTATACCAGTGCAAGAAG
a Gene ID for Phytozome’s Cassava genome annotation version 6.1, main functional annotation is indicated in parentheses.
Table 2. General characteristics of the Xpm strains selected in this study.
StrainRegion of Origin
(ECZ a)
Location of OriginYear of IsolationAFLP-Based Haplotype bEstimated Number of
TALEs c
CFBP1851Caribbean coast (ECZ 1)nd19743 *2
CIO151Eastern plains (ECZ 2)Meta19953 *5
UA226 Caribbean coast (ECZ1)Chinú20085 *3
UA306 Caribbean coast (ECZ 1)Palmitos20087 *4
UA318Caribbean coast (ECZ 1)Ciénaga de oro20083 *4
UA522Caribbean coast (ECZ 1)Chinú20094 *5
UA531Caribbean coast (ECZ 1)Chinú20095 *3
UA681Caribbean coast (ECZ 1)Chinú20098 *5
UA1061Caribbean coast (ECZ 1)Chinú20095 *2
UA1069Caribbean coast (ECZ 1)Chinú20095 *2
UA1183Eastern plains (ECZ 2)Villavicencio20111 **5
UA1211Eastern plains (ECZ 2)Granada20112 **5
UA1235Eastern plains (ECZ 2)Villavicencio20113 **5
UA1245Eastern plains (ECZ 2)Villavicencio20113 **5
UA1357Eastern plains (ECZ 2)Orocué20128 **4
UA1381Eastern plains (ECZ 2)Orocué20126 **4
UA1396Eastern plains (ECZ 2)Orocué20127 **5
UA1399Eastern plains (ECZ 2)Orocué20127 **5
a Previously described in [35]. b Numbers were arbitrarily assigned to clades of distance trees from data reported by [49] (*) or [50] (**). Since analyses were performed separately, clade numbers from [49,50] are not shared. c Number of TALE bands determined by RFLP. nd, no data.
Table 3. Translated RVD strings of the TALE gene variants sequenced in this study.
VariantRVD SequenceOccurrencesStrains
TALE13ANI-NS-NN-HD-NG-HD-NI-NG-HD-NN-NI-NI-NG9UA306, UA318, UA522, UA681, UA1211, UA1235, UA1245, UA1357, UA1399
TALE14ANI-NG-NI-NN-HD-HD-NG-NG-HD-NG-NG-HD-NG-NG1CIO151
TALE14BNI-NG-NI-NN-HD-HD-NS-NS-NS-HD-HD-NS-HD-NG1UA318
TALE14CNI-NG-NI-NN-NG-HD-NS-NS-NN-NG-HD-NN-NI-NG9UA226, UA306, UA318, UA522, UA531, UA681, UA1061, UA1183, UA1381
TALE14DNI-NG-NI-NN-NI-HD-NS-NS-NN-NG-HD-NN-NI-NG1CFBP1851
TALE14ENI-NS-NN-HD-NG-HD-NI-NS-NN-HD-NN-NI-NI-NG4UA226, UA531, UA1061, UA1069
TALE15ANI-NG-NI-NN-HD-HD-NS-NS-NS-HD-HD-NN-HD-NG-NG1UA1211
TALE15BNI-NG-NI-NN-HD-HD-NS-NS-NS-HD-HD-NS-HD-NG-NG3UA522, UA681, UA1235
TALE20ANI-NG-NI-NN-HD-HD-NN-HD-NN-NG-HD-NS-HD-NN-HD-NG-HD-NI-NG-NG1UA318
TALE20BNI-NG-NI-NN-NG-HD-NN-HD-NN-NG-HD-NG-HD-NN-HD-NG-HD-NN-NG-NG2UA226, UA531
TALE20CNI-NG-NI-NN-NG-HD-NN-HD-NN-NG-HD-NS-HD-NN-HD-NG-HD-NI-NG-NG3UA306, UA522, UA681
TALE20DNI-NG-NI-NN-NG-HD-NS-NS-NN-NG-HD-NG-HD-NN-HD-HD-NS-NI-NG-NG1UA1381
TALE20ENI-NG-NI-NN-NG-HD-NS-NS-NN-NG-HD-NS-HD-NN-HD-NN-HD-NI-NS-NG1UA1235
TALE21ANI-NG-HD-NG-HD-N*-NG-NG-HD-HD-NG-NG-N*-NG-HD-NG-NG-NG-HD-NG-NG1CFBP1851
TALE22ANI-NG-HD-NG-NG-NG-HD-HD-NG-NG-HD-NG-HD-HD-NG-NG-HD-NG-NG-HD-NG-NG1UA1235
TALE22BNI-NG-HD-NG-NG-NG-HD-HD-NG-NG-NG-NG-HD-HD-NG-NG-HD-NG-NG-HD-NG-NG4UA306, UA318, UA522, UA681
TALE22CNI-NG-HD-NG-NG-NG-HD-HD-NG-NG-NG-NN-HD-NN-NG-NG-HD-NG-NG-HD-NG-NG2UA531, UA1061
TALE22DNI-NG-NI-NG-NI-NN-NG-HD-NN-HD-NN-NG-HD-NG-HD-NN-HD-NG-HD-NN-NG-NG1UA1061
Table 4. Candidate gene targets for TALEs present in strains UA681 and UA1061 with good to excellent EBE predictions.
Target Gene ID aAnnotations aEBE Prediction Quality cRetained After Second Filter? eResponsible for Activation (Ref)
T13A (NC b)T14E (NC b)T14C (C4 b)T15B (C3 b)T20C (C1 b)T22D (C1 b)T22B (C2 b)T22C (C2 b)
Common DUGsManes.04G033900Dof Domain, Zinc Finger Protein EEYesTAL22 [8]
Manes.06G123400Bidirectional Sugar Transporter Sweet10 VGE YesTAL20 [8]
Manes.17G096100No Data VGVG No
Manes.15G026800Membrane-Associated Kinase Regulator E YesTAL14 [8]
Manes.10G007900Abscisic Acid Receptor PYL4 GFYes
Manes.11G151300Serine Carboxypeptidase S10 FG YesTAL14 [8]
DUGs for UA681Manes.15G04120012s Seed Storage Protein VG No
Manes.18G060400Rho GTPase-Activating Protein Ren1 E Yes
Manes.13G045100Clavata3/ESR (CLE)-Related Protein E YesTAL22 [8]
Manes.S045100Class IV Chitinase E Yes
Manes.04G109300Oxidoreductase, 2OG-Fe (II) Oxygenase Family Protein FVG No
Manes.06G159100Ring Finger Domain (ZF-Ring_2)/Wall-Associated Receptor Kinase C-TerminalF G No
Manes.09G134100mlo Protein E No
Manes.14G044700Protein Containing an AP2 Domain FE YesTAL15 [8]
Manes.04G096600Xyloglucan:Xyloglucosyl Transferase VG d No
Manes.17G038600No Data E No
Manes.05G118500No DataG FF No
Manes.02G120700Protein Containing a Tetratricopeptide Repeat (TPR_16)G No
Manes.12G151000No DataVG Yes
Manes.09G105800Protein Containing a Myb-Like DNA-Binding Domain and a Myb-CC Type Transfactor, LHEQLE Motif G Yes
Manes.18G074600No Data G No
Manes.S013800Basic Secretory Protein Family/Peptidase of Plants and Bacteria G d No
Manes.06G057400Equilibrative Nucleoside Transporter G No
Manes.07G135200Abscisic Acid Receptor PYL4 G Yes
Manes.04G053400Galactolipase/Phospholipase A (1) F G No
Manes.08G036300Calcium-Dependent Protein Kinase G Yes
DUGs for UA1061Manes.07G122400No Data VGYes
Manes.08G141800Ammonium Transporter 1 E Yes
Manes.11G008300Member Of ‘GDXG’ Family of Lipolytic Enzymes VG Yes
Manes.10G0666002-Hydroxyisoflavanone Dehydratase E Yes
Manes.16G117500No Data VG Yes
Manes.13G136600Coniferyl-Alcohol Glucosyltransferase E No
Manes.04G118200Protein of Unknown Function (Duf642) G d Yes
Manes.15G090000Homeobox-Leucine Zipper Protein ATHB-52 G YesTAL14 [8]
a Gene identifiers and annotations were extracted from Phytozome’s cassava genome version 6.1. b T stands for TALE. The bracketed alphanumeric code corresponds to the cluster number derived from FuncTAL analysis (Section 3.3 and Figure 3). NC, non-clustered; C1 to C4, cluster 1 through 4. c The quality of EBE prediction for a given candidate was calculated as the sum of the four determined ranks (one per software). Totals were then categorized as E (Excellent, combined rank = 1 to 400), VG (Very Good, combined rank = 401 to 800), G (Good, combined rank = 801 to 1200), and F (Fair, combined rank = 1201 to 1600). d These EBE predictions were not found in the corresponding 60444 promoter sequence. e EBE distance to TSS/TLS between 152 bp and 63 bp.
Publisher’s Note: MDPI stays neutral with regard to jurisdictional claims in published maps and institutional affiliations.

