
Relationships among Fecal, Air, Oral, and Tracheal Microbial Communities in Pigs in a Respiratory Infection Disease Model

 , , ,
, , ,
Abstract
:1. Introduction
2. Materials and Methods
3. Results
4. Discussion
5. Conclusions
Supplementary Materials
Author Contributions
Funding
Institutional Review Board Statement
Informed Consent Statement
Data Availability Statement
Acknowledgments
Conflicts of Interest
References
- McCormack, U.M.; Curiao, T.; Buzoianu, S.G.; Prieto, M.L.; Ryan, T.; Varley, P.; Crispie, F.; Magowan, E.; Metzler-Zebeli, B.U.; Berry, D.; et al. Exploring a Possible Link between the Intestinal Microbiota and Feed Efficiency in Pigs. Appl. Environ. Microbiol. 2017, 83, e00380-17. [Google Scholar] [CrossRef] [PubMed] [Green Version]
- Argüello, H.; Estellé, J.; Leonard, F.; Crispie, F.; Cotter, P.D.; O’Sullivan, O.; Lynch, H.; Walia, K.; Duffy, G.; Lawlor, P.G.; et al. Influence of the intestinal microbiota on colonization resistance to Salmonella and the shedding pattern of naturally exposed pigs. mSystems 2019, 4, e00021-19. [Google Scholar] [CrossRef] [PubMed] [Green Version]
- Zwirzitz, B.; Pinior, B.; Metzler-Zebeli, B.; Handler, M.; Gense, K.; Knecht, C.; Ladinig, A.; Dzieciol, M.; Wetzels, S.U.; Wagner, M.; et al. Microbiota of the Gut-Lymph Node Axis: Depletion of Mucosa-Associated Segmented Filamentous Bacteria and Enrichment of Methanobrevibacter by Colistin Sulfate and Linco-Spectin in Pigs. Front. Microbiol. 2019, 10, 599. [Google Scholar] [CrossRef] [PubMed]
- Belkaid, Y.; Harrison, O.J. Homeostatic Immunity and the Microbiota. Immunity 2017, 46, 562–576. [Google Scholar] [CrossRef] [PubMed] [Green Version]
- Niederwerder, M.C. Role of the microbiome in swine respiratory disease. Vet. Microbiol. 2017, 209, 97–106. [Google Scholar] [CrossRef]
- Pollock, J.; Hutchings, M.R.; Hutchings, K.E.K.; Gally, D.L.; Houdijk, J.G.M. Changes in the Ileal, but Not Fecal, Microbiome in Response to Increased Dietary Protein Level and Enterotoxigenic Escherichia coli Exposure in Pigs. Appl. Environ. Microbiol. 2019, 85, e01252-19. [Google Scholar] [CrossRef] [Green Version]
- Kim, H.B.; Isaacson, R.E. The pig gut microbial diversity: Understanding the pig gut microbial ecology through the next generation high throughput sequencing. Vet. Microbiol. 2015, 177, 242–251. [Google Scholar] [CrossRef]
- Chen, C.; Huang, X.; Fang, S.; Yang, H.; He, M.; Zhao, Y.; Huang, L. Contribution of Host Genetics to the Variation of Microbial Composition of Cecum Lumen and Feces in Pigs. Front. Microbiol. 2018, 9, 2626. [Google Scholar] [CrossRef]
- Zhao, W.; Wang, Y.; Liu, S.; Huang, J.; Zhai, Z.; He, C.; Ding, J.; Wang, J.; Wang, H.; Fan, W.; et al. The dynamic distribution of porcine microbiota across different ages and gastrointestinal tract segments. PLoS ONE 2015, 10, e0117441. [Google Scholar] [CrossRef] [Green Version]
- Han, G.G.; Lee, J.Y.; Jin, G.D.; Park, J.; Choi, Y.H.; Kang, S.K.; Chae, B.J.; Kim, E.B.; Choi, Y.J. Tracing of the fecal microbiota of commercial pigs at five growth stages from birth to shipment. Sci. Rep. 2018, 8, 6012. [Google Scholar] [CrossRef] [Green Version]
- Kim, H.B.; Borewicz, K.; White, B.A.; Singer, R.S.; Sreevatsan, S.; Tu, Z.J.; Isaacson, R.E. Longitudinal investigation of the age-related bacterial diversity in the feces of commercial pigs. Vet. Microbiol. 2011, 153, 124–133. [Google Scholar] [CrossRef] [PubMed]
- Alain, B.P.E.; Chae, J.P.; Balolong, M.P.; Bum Kim, H.; Kang, D.K. Assessment of fecal bacterial diversity among healthy piglets during the weaning transition. J. Gen. Appl. Microbiol. 2014, 60, 140–146. [Google Scholar] [CrossRef] [PubMed] [Green Version]
- Kubasova, T.; Davidova-Gerzova, L.; Babak, V.; Cejkova, D.; Montagne, L.; Le-Floc’h, N.; Rychlik, I. Effects of host genetics and environmental conditions on fecal microbiota composition of pigs. PLoS ONE 2018, 13, e0201901. [Google Scholar] [CrossRef] [PubMed]
- Wang, X.; Tsai, T.; Deng, F.; Wei, X.; Chai, J.; Knapp, J.; Apple, J.; Maxwell, C.V.; Lee, J.A.; Li, Y.; et al. Longitudinal investigation of the swine gut microbiome from birth to market reveals stage and growth performance associated bacteria. Microbiome 2019, 7, 109. [Google Scholar] [CrossRef] [PubMed] [Green Version]
- Slifierz, M.J.; Friendship, R.M.; Weese, J.S. Longitudinal study of the early-life fecal and nasal microbiotas of the domestic pig. BMC Microbiol. 2015, 15, 184. [Google Scholar] [CrossRef] [Green Version]
- Liu, S.; Zhao, L.; Zhai, Z.; Zhao, W.; Ding, J.; Dai, R.; Sun, T.; Meng, H. Porcine Epidemic Diarrhea Virus Infection Induced the Unbalance of Gut Microbiota in Piglets. Curr. Microbiol. 2015, 71, 643–649. [Google Scholar] [CrossRef]
- Costa, M.O.; Chaban, B.; Harding, J.C.; Hill, J.E. Characterization of the fecal microbiota of pigs before and after inoculation with “Brachyspira hampsonii”. PLoS ONE 2014, 9, e106399. [Google Scholar] [CrossRef]
- Borewicz, K.A.; Kim, H.B.; Singer, R.S.; Gebhart, C.J.; Sreevatsan, S.; Johnson, T.; Isaacson, R.E. Changes in the Porcine Intestinal Microbiome in Response to Infection with Salmonella enterica and Lawsonia intracellularis. PLoS ONE 2015, 10, e0139106. [Google Scholar] [CrossRef]
- Leite, F.L.L.; Singer, R.S.; Ward, T.; Gebhart, C.J.; Isaacson, R.E. Vaccination Against Lawsonia intracellularis Decreases Shedding of Salmonella enterica serovar Typhimurium in Co-Infected Pigs and Alters the Gut Microbiome. Sci. Rep. 2018, 8, 2857. [Google Scholar] [CrossRef] [Green Version]
- Wang, Q.; Cai, R.; Huang, A.; Wang, X.; Qu, W.; Shi, L.; Li, C.; Yan, H. Comparison of Oropharyngeal Microbiota in Healthy Piglets and Piglets with Respiratory Disease. Front. Microbiol. 2018, 9, 3218. [Google Scholar] [CrossRef] [Green Version]
- Prickett, J.R.; Zimmerman, J.J. The development of oral fluid-based diagnostics and applications in veterinary medicine. Anim. Health Res. Rev. 2010, 11, 207–216. [Google Scholar] [CrossRef] [PubMed]
- Prickett, J.; Simer, R.; Christopher-Hennings, J.; Yoon, K.-J.; Evans, R.B.; Zimmerman, J.J. Detection of porcine reproductive and respiratory syndrome virus infection in porcine oral fluid samples: A longitudinal study under experimental conditions. J. Vet. Diagn. Investig. 2008, 20, 156–163. [Google Scholar] [CrossRef] [Green Version]
- Prickett, J.R.; Kim, W.; Simer, R.; Yoon, K.-J.; Zimmerman, J.J. Oral-fluid samples for surveillance of commercial growing pigs for porcine reproductive and respiratory syndrome virus and porcine circovirus type 2 infections. J. Swine Health Prod. 2008, 16, 86–91. [Google Scholar]
- Murase, K.; Watanabe, T.; Arai, S.; Kim, H.; Tohya, M.; Ishida-Kuroki, K.; Vo, T.H.; Nguyen, T.P.B.; Nakagawa, I.; Osawa, R.; et al. Characterization of pig saliva as the major natural habitat of Streptococcus suis by analyzing oral, fecal, vaginal, and environmental microbiota. PLoS ONE 2019, 14, e0215983. [Google Scholar] [CrossRef] [PubMed]
- Siqueira, F.M.; Perez-Wohlfeil, E.; Carvalho, F.M.; Trelles, O.; Schrank, I.S.; Vasconcelos, A.T.R.; Zaha, A. Microbiome overview in swine lungs. PLoS ONE 2017, 12, e0181503. [Google Scholar] [CrossRef] [PubMed]
- Pena Cortes, L.C.; LeVeque, R.M.; Funk, J.; Marsh, T.L.; Mulks, M.H. Development of the tonsillar microbiome in pigs from newborn through weaning. BMC Microbiol. 2018, 18, 35. [Google Scholar] [CrossRef] [PubMed]
- Thacker, E.; Halbur, P.; Ross, R.; Thanawongnuwech, R.; Thacker, B. Mycoplasma hyopneumoniae potentiation of Porcine Reproductive and Respiratory Syndrome Virus-induced pneumonia. J. Clin. Microbiol. 1999, 37, 620–627. [Google Scholar] [CrossRef] [PubMed] [Green Version]
- Pieters, M.; Pijoan, C.; Fano, E.; Dee, S. An assessment of the duration of Mycoplasma hyopneumoniae infection in an experimentally infected population of pigs. Vet. Microbiol. 2009, 134, 261–266. [Google Scholar] [CrossRef]
- Pieters, M.; Maes, D. Mycoplasmosis. In Diseases of Swine; Zimmerman, J., Karriker, L., Ramirez, A., Schwartz, K., Stevenson, G., Zhang, J., Eds.; Wiley: Hoboken, NJ, USA, 2019; pp. 863–883. [Google Scholar]
- Sponheim, A.; Alvarez, J.; Fano, E.; Schmaling, E.; Dee, S.; Hanson, D.; Wetzell, T.; Pieters, M. Comparison of the sensitivity of laryngeal swabs and deep tracheal catheters for detection of Mycoplasma hyopneumoniae in experimentally and naturally infected pigs early and late after infection. Vet. Microbiol. 2020, 241, 108500. [Google Scholar] [CrossRef]
- Kraemer, J.G.; Aebi, S.; Oppliger, A.; Hilty, M. The Indoor-Air Microbiota of Pig Farms Drives the Composition of the Pig Farmers’ Nasal Microbiota in a Season-Dependent and Farm-Specific Manner. Appl. Environ. Microbiol. 2019, 85, e03038-18. [Google Scholar] [CrossRef] [Green Version]
- Kraemer, J.G.; Ramette, A.; Aebi, S.; Oppliger, A.; Hilty, M. Influence of Pig Farming on the Human Nasal Microbiota: Key Role of Airborne Microbial Communities. Appl. Environ. Microbiol. 2018, 84, e02470-17. [Google Scholar] [CrossRef] [Green Version]
- Kristiansen, A.; Saunders, A.M.; Hansen, A.A.; Nielsen, P.H.; Nielsen, J.L. Community structure of bacteria and fungi in aerosols of a pig confinement building. FEMS Microbiol. Ecol. 2012, 80, 390–401. [Google Scholar] [CrossRef]
- Mbareche, H.; Veillette, M.; Pilote, J.; Letourneau, V.; Duchaine, C. Bioaerosols Play a Major Role in the Nasopharyngeal Microbiota Content in Agricultural Environment. Int. J. Environ. Res. Public Health 2019, 16, 1375. [Google Scholar] [CrossRef] [Green Version]
- Lehtoranta, L.; Hibberd, A.A.; Reimari, J.; Junnila, J.; Yeung, N.; Maukonen, J.; Crawford, G.; Ouwehand, A.C. Recovery of Vaginal Microbiota After Standard Treatment for Bacterial Vaginosis Infection: An Observational Study. Microorganisms 2020, 8, 875. [Google Scholar] [CrossRef]
- Vangroenweghe, F.; Karriker, L.; Main, R.; Christianson, E.; Marsteller, T.; Hammen, K.; Bates, J.; Thomas, P.; Ellingson, J.; Harmon, K.; et al. Assessment of litter prevalence of Mycoplasma hyopneumoniae in preweaned piglets utilizing an antemortem tracheobronchial mucus collection technique and a real-time polymerase chain reaction assay. J. Vet. Diagn. Investig. 2015, 27, 606–610. [Google Scholar] [CrossRef] [Green Version]
- Simner, P.J.; Miller, H.B.; Breitwieser, F.P.; Pinilla Monsalve, G.; Pardo, C.A.; Salzberg, S.L.; Sears, C.L.; Thomas, D.L.; Eberhart, C.G.; Carroll, K.C. Development and Optimization of Metagenomic Next-Generation Sequencing Methods for Cerebrospinal Fluid Diagnostics. J. Clin. Microbiol. 2018, 56, e00472-18. [Google Scholar] [CrossRef] [Green Version]
- Chaban, B.; Albert, A.; Links, M.G.; Gardy, J.; Tang, P.; Hill, J.E. Characterization of the upper respiratory tract microbiomes of patients with pandemic H1N1 influenza. PLoS ONE 2013, 8, e69559. [Google Scholar] [CrossRef] [Green Version]
- R Core Team. R: A Language and Environment for Statistical Computing; R Foundation for Statistical Computing: Vienna, Austria, 2019. [Google Scholar]
- Callahan, B.J.; McMurdie, P.J.; Rosen, M.J.; Han, A.W.; Johnson, A.J.; Holmes, S.P. DADA2: High-resolution sample inference from Illumina amplicon data. Nat. Methods 2016, 13, 581–583. [Google Scholar] [CrossRef] [Green Version]
- Callahan, B. Silva Taxonomic Training Data Formatted for DADA2 (Silva Version 132); Zenodo: Genève, Switzerland, 2018. [Google Scholar] [CrossRef]
- Oksanen, J.; Blanchet, F.G.; Friendly, M.; Kindt, R.; Legendre, P.; McGlinn, D.; Minchin, P.R.; O’Hara, R.B.; Simpson, G.L.; Solymos, P.; et al. Vegan: Community Ecology Package, R Package Version 2.5-6; Vienna, Austria, 2019. Available online: https://cran.r-project.org; https://github.com/vegandevs/vegan (accessed on 1 August 2020).
- Friedman, J.; Hastie, T.; Tibshirani, R. Regularization paths for generalized linear models via coordinate descent. J. Stat. Softw. 2010, 33, 1–22. [Google Scholar] [CrossRef] [Green Version]
- Microsoft; Ooi, H. glmnetUtils: Utilities for “glmnet”. 1.1.5. 2020. Available online: https://cran.r-project.org/web/packages/glmnetUtils/index.html (accessed on 1 August 2020).
- Mandal, S.; Van Treuren, W.; White, R.A.; Eggesbo, M.; Knight, R.; Peddada, S.D. Analysis of composition of microbiomes: A novel method for studying microbial composition. Microb. Ecol. Health Dis. 2015, 26, 27663. [Google Scholar] [CrossRef] [Green Version]
- Knights, D.; Kuczynski, J.; Charlson, E.S.; Zaneveld, J.; Mozer, M.C.; Collman, R.G.; Bushman, F.D.; Knight, R.; Kelley, S.T. Bayesian community-wide culture-independent microbial source tracking. Nat. Methods 2011, 8, 761–763. [Google Scholar] [CrossRef] [PubMed] [Green Version]
- Gehlenborg, N. UpSetR: A More Scalable Alternative to Venn and Euler Diagrams for Visualizing Intersecting Sets. 1.4.0. 2019. Available online: http://github.com/hms-dbmi/UpSetR (accessed on 1 August 2020).
- Lex, A.; Gehlenborg, N. Points of view: Sets and intersections. Nat. Methods 2014, 11, 779. [Google Scholar] [CrossRef]
- Finotello, F.; Mastrorilli, E.; Di Camillo, B. Measuring the diversity of the human microbiota with targeted next-generation sequencing. Brief. Bioinform. 2018, 19, 679–692. [Google Scholar] [CrossRef]
- Ravi, A.; Halstead, F.D.; Bamford, A.; Casey, A.; Thomson, N.M.; van Schaik, W.; Snelson, C.; Goulden, R.; Foster-Nyarko, E.; Savva, G.M.; et al. Loss of microbial diversity and pathogen domination of the gut microbiota in critically ill patients. Microb. Genom. 2019, 5, e000293. [Google Scholar] [CrossRef]
- Tan, Z.; Dong, W.; Ding, Y.; Ding, X.; Zhang, Q.; Jiang, L. Changes in cecal microbiota community of suckling piglets infected with porcine epidemic diarrhea virus. PLoS ONE 2019, 14, e0219868. [Google Scholar] [CrossRef] [Green Version]
- Yan, Z.F.; Lin, P.; Wang, Y.S.; Gao, W.; Li, C.T.; Kook, M.C.; Yi, T.H. Niastella hibisci sp. nov., isolated from rhizosphere soil of mugunghwa, the Korean national flower. Int. J. Syst. Evol. Microbiol. 2016, 66, 5218–5222. [Google Scholar] [CrossRef]
- Zhang, J.; Gu, T.; Zhou, Y.; He, J.; Zheng, L.Q.; Li, W.J.; Huang, X.; Li, S.P. Terrimonas rubra sp. nov., isolated from a polluted farmland soil and emended description of the genus Terrimonas. Int. J. Syst. Evol. Microbiol. 2012, 62, 2593–2597. [Google Scholar] [CrossRef]
- Roos, L.R.; Surendran Nair, M.; Rendahl, A.K.; Pieters, M. Mycoplasma hyorhinis and Mycoplasma hyosynoviae dual detection patterns in dams and piglets. PLoS ONE 2019, 14, e0209975. [Google Scholar] [CrossRef] [Green Version]
- Macedo, N.; Rovira, A.; Torremorell, M. Haemophilus parasuis: Infection, immunity and enrofloxacin. Vet. Res. 2015, 46, 128. [Google Scholar] [CrossRef] [Green Version]
- Pors, S.E.; Hansen, M.S.; Christensen, H.; Jensen, H.E.; Petersen, A.; Bisgaard, M. Genetic diversity and associated pathology of Pasteurella multocida isolated from porcine pneumonia. Vet. Microbiol. 2011, 150, 354–361. [Google Scholar] [CrossRef] [Green Version]
- Surendran Nair, M.; Eucker, T.; Martinson, B.; Neubauer, A.; Victoria, J.; Nicholson, B.; Pieters, M. Influence of pig gut microbiota on Mycoplasma hyopneumoniae susceptibility. Vet. Res. 2019, 50, 86. [Google Scholar] [CrossRef] [PubMed] [Green Version]
- Ubeda, C.; Bucci, V.; Caballero, S.; Djukovic, A.; Toussaint, N.C.; Equinda, M.; Lipuma, L.; Ling, L.; Gobourne, A.; No, D.; et al. Intestinal microbiota containing Barnesiella species cures vancomycin-resistant Enterococcus faecium colonization. Infect. Immun. 2013, 81, 965–973. [Google Scholar] [CrossRef] [PubMed] [Green Version]
- Suo, C.; Yin, Y.; Wang, X.; Lou, X.; Song, D.; Wang, X.; Gu, Q. Effects of lactobacillus plantarum ZJ316 on pig growth and pork quality. BMC Vet. Res. 2012, 8, 89. [Google Scholar] [CrossRef] [PubMed] [Green Version]
- Pieters, M.; Daniels, J.; Rovira, A. Comparison of sample types and diagnostic methods for in vivo detection of Mycoplasma hyopneumoniae during early stages of infection. Vet. Microbiol. 2017, 203, 103–109. [Google Scholar] [CrossRef]
- Ober, R.A.; Thissen, J.B.; Jaing, C.J.; Cino-Ozuna, A.G.; Rowland, R.R.R.; Niederwerder, M.C. Increased microbiome diversity at the time of infection is associated with improved growth rates of pigs after co-infection with porcine reproductive and respiratory syndrome virus (PRRSV) and porcine circovirus type 2 (PCV2). Vet. Microbiol. 2017, 208, 203–211. [Google Scholar] [CrossRef]
- Niederwerder, M.C.; Jaing, C.J.; Thissen, J.B.; Cino-Ozuna, A.G.; McLoughlin, K.S.; Rowland, R.R. Microbiome associations in pigs with the best and worst clinical outcomes following co-infection with porcine reproductive and respiratory syndrome virus (PRRSV) and porcine circovirus type 2 (PCV2). Vet. Microbiol. 2016, 188, 1–11. [Google Scholar] [CrossRef] [Green Version]
- Schachtschneider, K.M.; Yeoman, C.J.; Isaacson, R.E.; White, B.A.; Schook, L.B.; Pieters, M. Modulation of systemic immune responses through commensal gastrointestinal microbiota. PLoS ONE 2013, 8, e53969. [Google Scholar] [CrossRef]


| Sample Type | M. hyopneumoniae Detection | Total Number of Samples | |
|---|---|---|---|
| Positive | Negative | ||
| Tracheal fluids | 59 | 14 | 73 |
| Oral fluids | 1 | 7 | 8 |
| Air | 0 | 12 | 12 |
| Rank/Sample Type | Tracheal Fluids | Feces | Oral Fluids | Air | |
|---|---|---|---|---|---|
| Positive * | Negative * | ||||
| 1 | Mycoplasma (14.1) | Actinobacillus (10.1) | Clostridium (24.3) | Clostridium (8.6) | Clostridium (32) |
| 2 | Actinobacillus (7.3) | Streptococcus (10.1) | Akkermansia (12.1) | Terrisporobacter (5.7) | Terrisporobacter (9.8) |
| 3 | Streptococcus (7.1) | Clostridium (7.5) | Streptococcus (12.1) | Phascolarctobacterium (5.5) | Turicibacter (9.1) |
| 4 | Clostridium (6.2) | Prevotellaceae NK3B31 group (4.2) | Lactobacillus (7.4) | Leptotrichia (5.4) | Lactobacillus (7.2) |
| 5 | Prevotellaceae NK3B31 group (3) | Lactobacillus (3.7) | Turicibacter (6.7) | Streptococcus (5) | Streptococcus (6.4) |
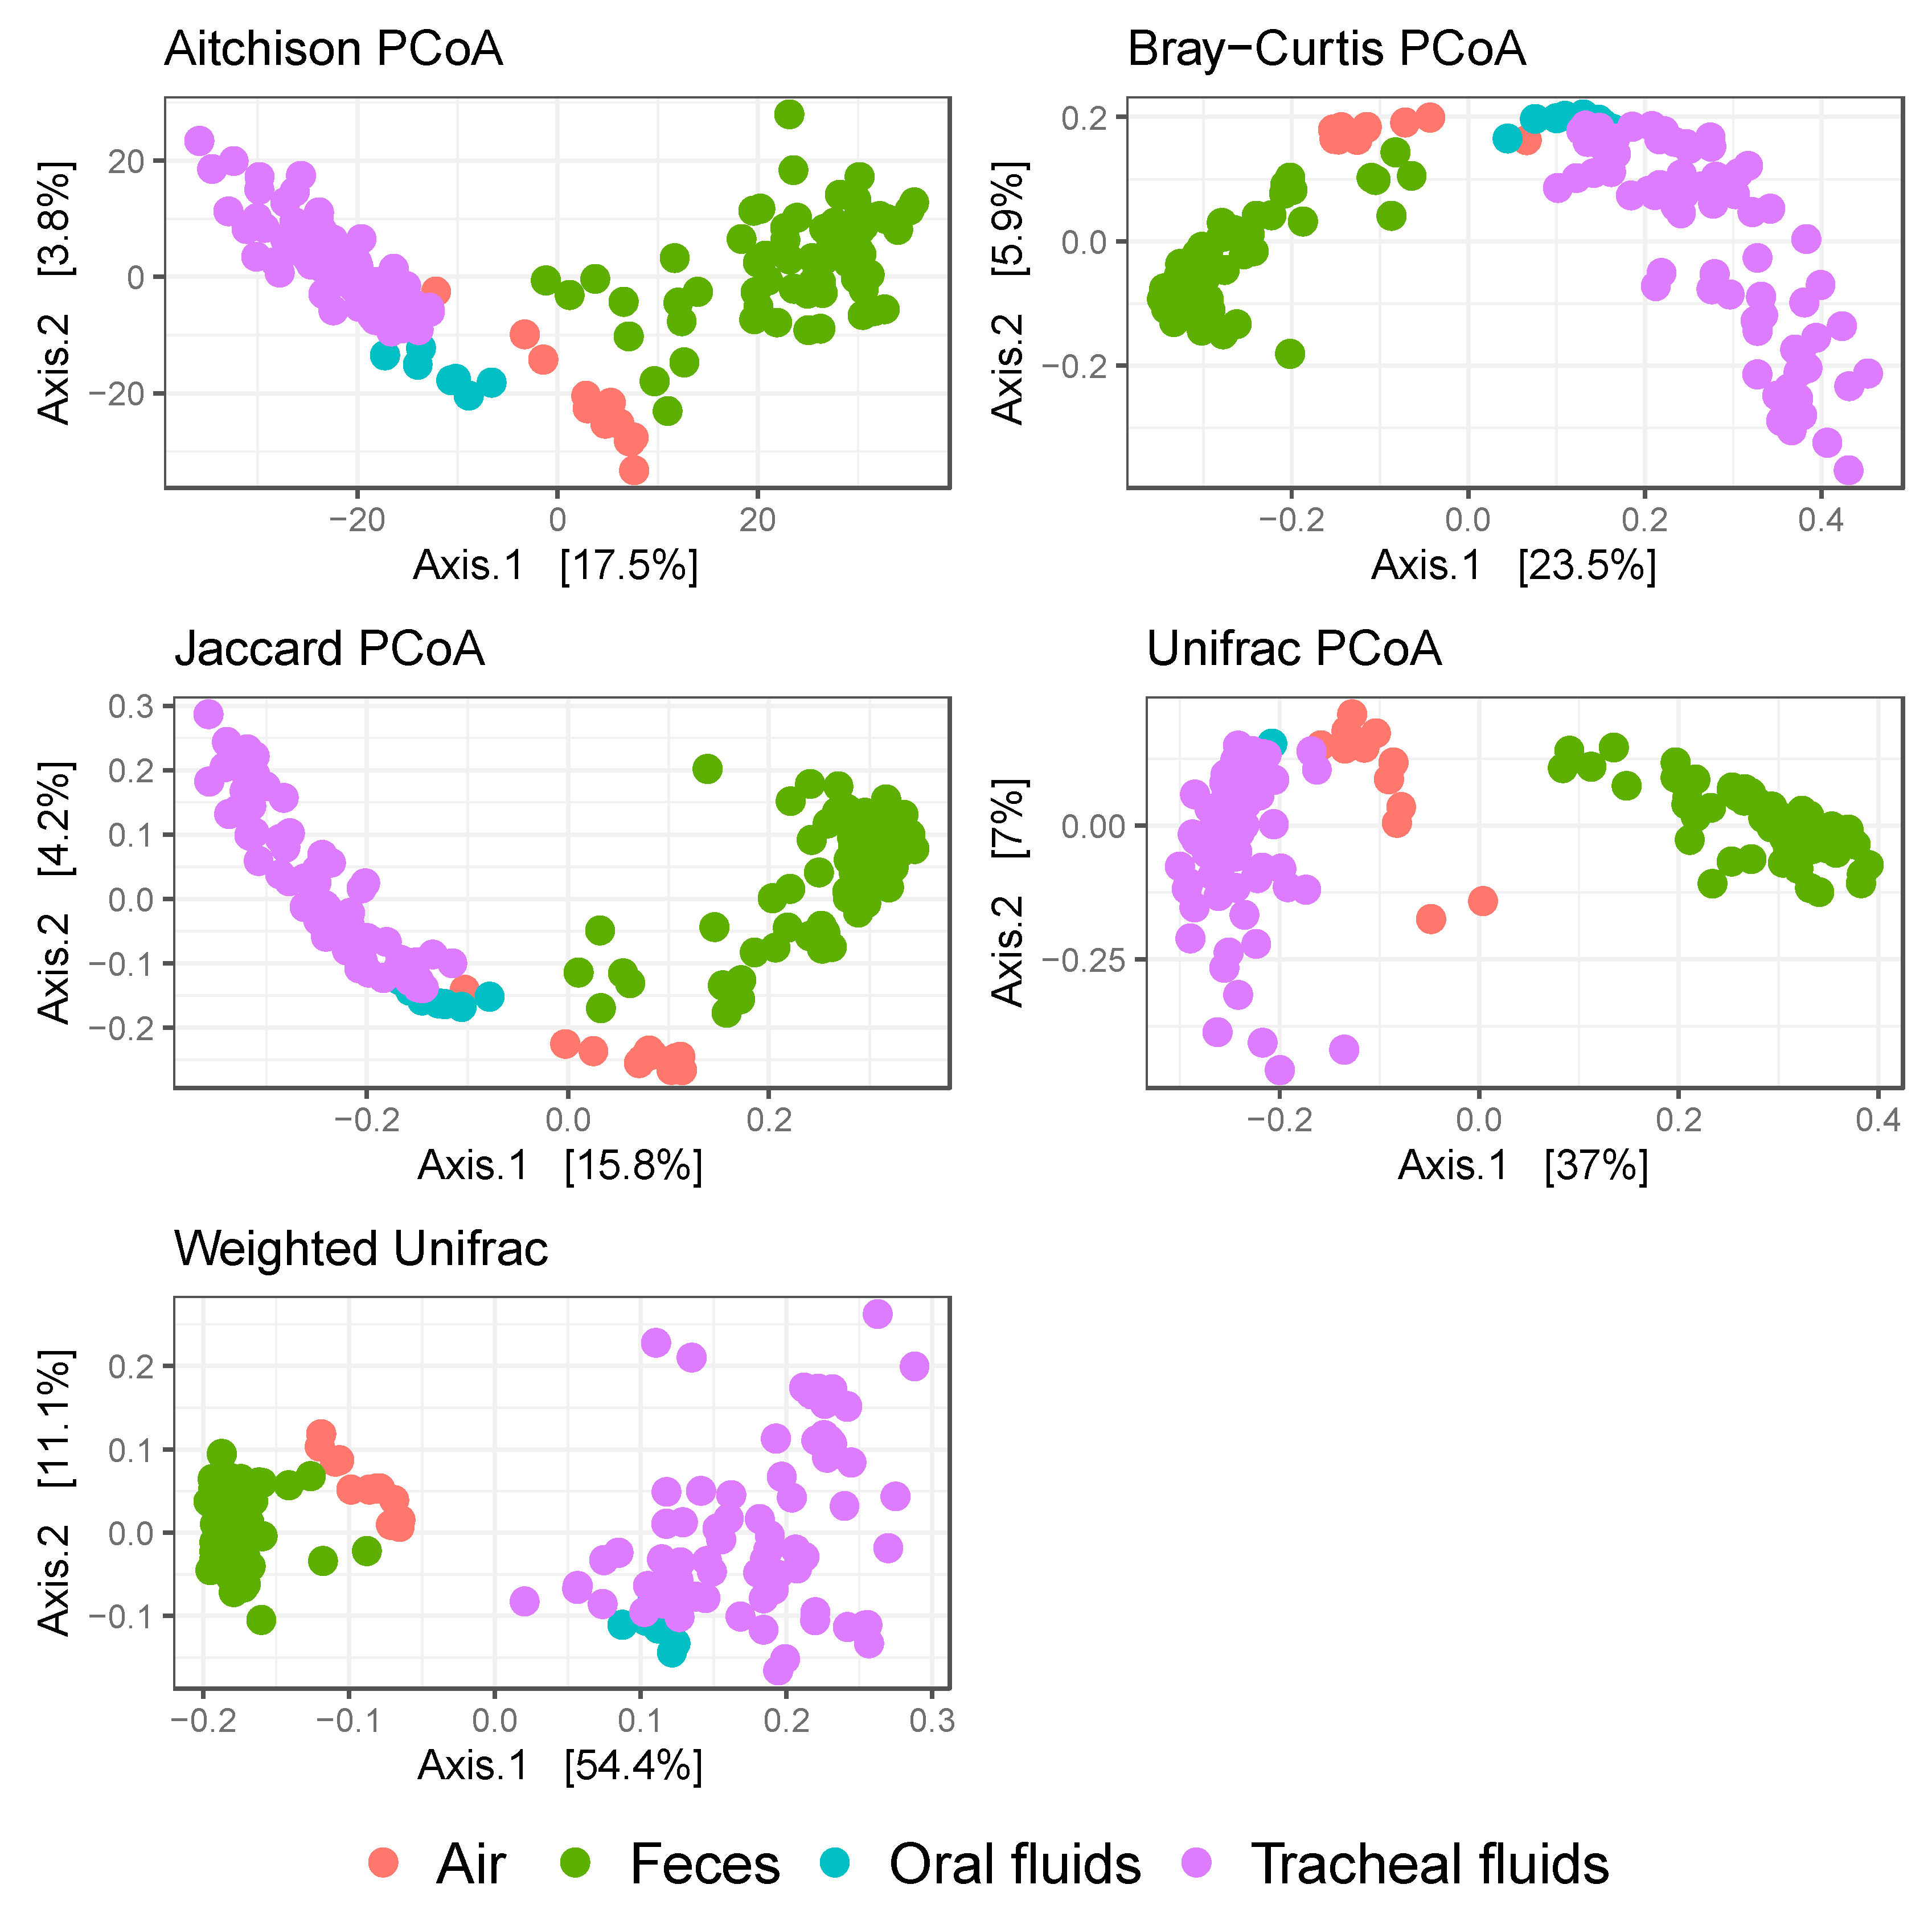
| Effect/Dissimilarity Index | Aitchison | Bray–Curtis | Jaccard | Unifrac | Weighted Unifrac |
|---|---|---|---|---|---|
| Sample type | |||||
| R2 | 0.18 | 0.24 | 0.16 | 0.39 | 0.55 |
| p | 0.001 | 0.001 | 0.001 | 0.001 | 0.001 |
| Interaction term | |||||
| R2 | 0.02 | 0.02 | 0.02 | 0.01 | 0.03 |
| p | 0.092 | 0.028 | 0.055 | 0.211 | 0.01 |
| Source | Minimum | Median | Mean | Maximum |
|---|---|---|---|---|
| Air | ||||
| Positive | 0.003 | 0.08 | 0.11 | 0.35 |
| Negative | 0.001 | 0.14 | 0.17 | 0.38 |
| Overall | 0.001 | 0.09 | 0.12 | 0.38 |
| Feces | ||||
| Positive | 0.001 | 0.03 | 0.03 | 0.1 |
| Negative | 0.001 | 0.04 | 0.04 | 0.08 |
| Overall | 0.001 | 0.03 | 0.04 | 0.1 |
| Oral Fluids | ||||
| Positive | 0.004 | 0.03 | 0.04 | 0.15 |
| Negative | 0.001 | 0.03 | 0.04 | 0.08 |
| Overall | 0.001 | 0.03 | 0.04 | 0.15 |
Publisher’s Note: MDPI stays neutral with regard to jurisdictional claims in published maps and institutional affiliations. |
© 2021 by the authors. Licensee MDPI, Basel, Switzerland. This article is an open access article distributed under the terms and conditions of the Creative Commons Attribution (CC BY) license (http://creativecommons.org/licenses/by/4.0/).
Share and Cite
Valeris-Chacin, R.; Sponheim, A.; Fano, E.; Isaacson, R.; Singer, R.S.; Nerem, J.; Leite, F.L.; Pieters, M. Relationships among Fecal, Air, Oral, and Tracheal Microbial Communities in Pigs in a Respiratory Infection Disease Model. Microorganisms 2021, 9, 252. https://doi.org/10.3390/microorganisms9020252
Valeris-Chacin R, Sponheim A, Fano E, Isaacson R, Singer RS, Nerem J, Leite FL, Pieters M. Relationships among Fecal, Air, Oral, and Tracheal Microbial Communities in Pigs in a Respiratory Infection Disease Model. Microorganisms. 2021; 9(2):252. https://doi.org/10.3390/microorganisms9020252
Chicago/Turabian StyleValeris-Chacin, Robert, Amanda Sponheim, Eduardo Fano, Richard Isaacson, Randall S. Singer, Joel Nerem, Fernando L. Leite, and Maria Pieters. 2021. "Relationships among Fecal, Air, Oral, and Tracheal Microbial Communities in Pigs in a Respiratory Infection Disease Model" Microorganisms 9, no. 2: 252. https://doi.org/10.3390/microorganisms9020252