Adaptive Micromixer Based on the Solutocapillary Marangoni Effect in a Continuous-Flow Microreactor

 , , , and
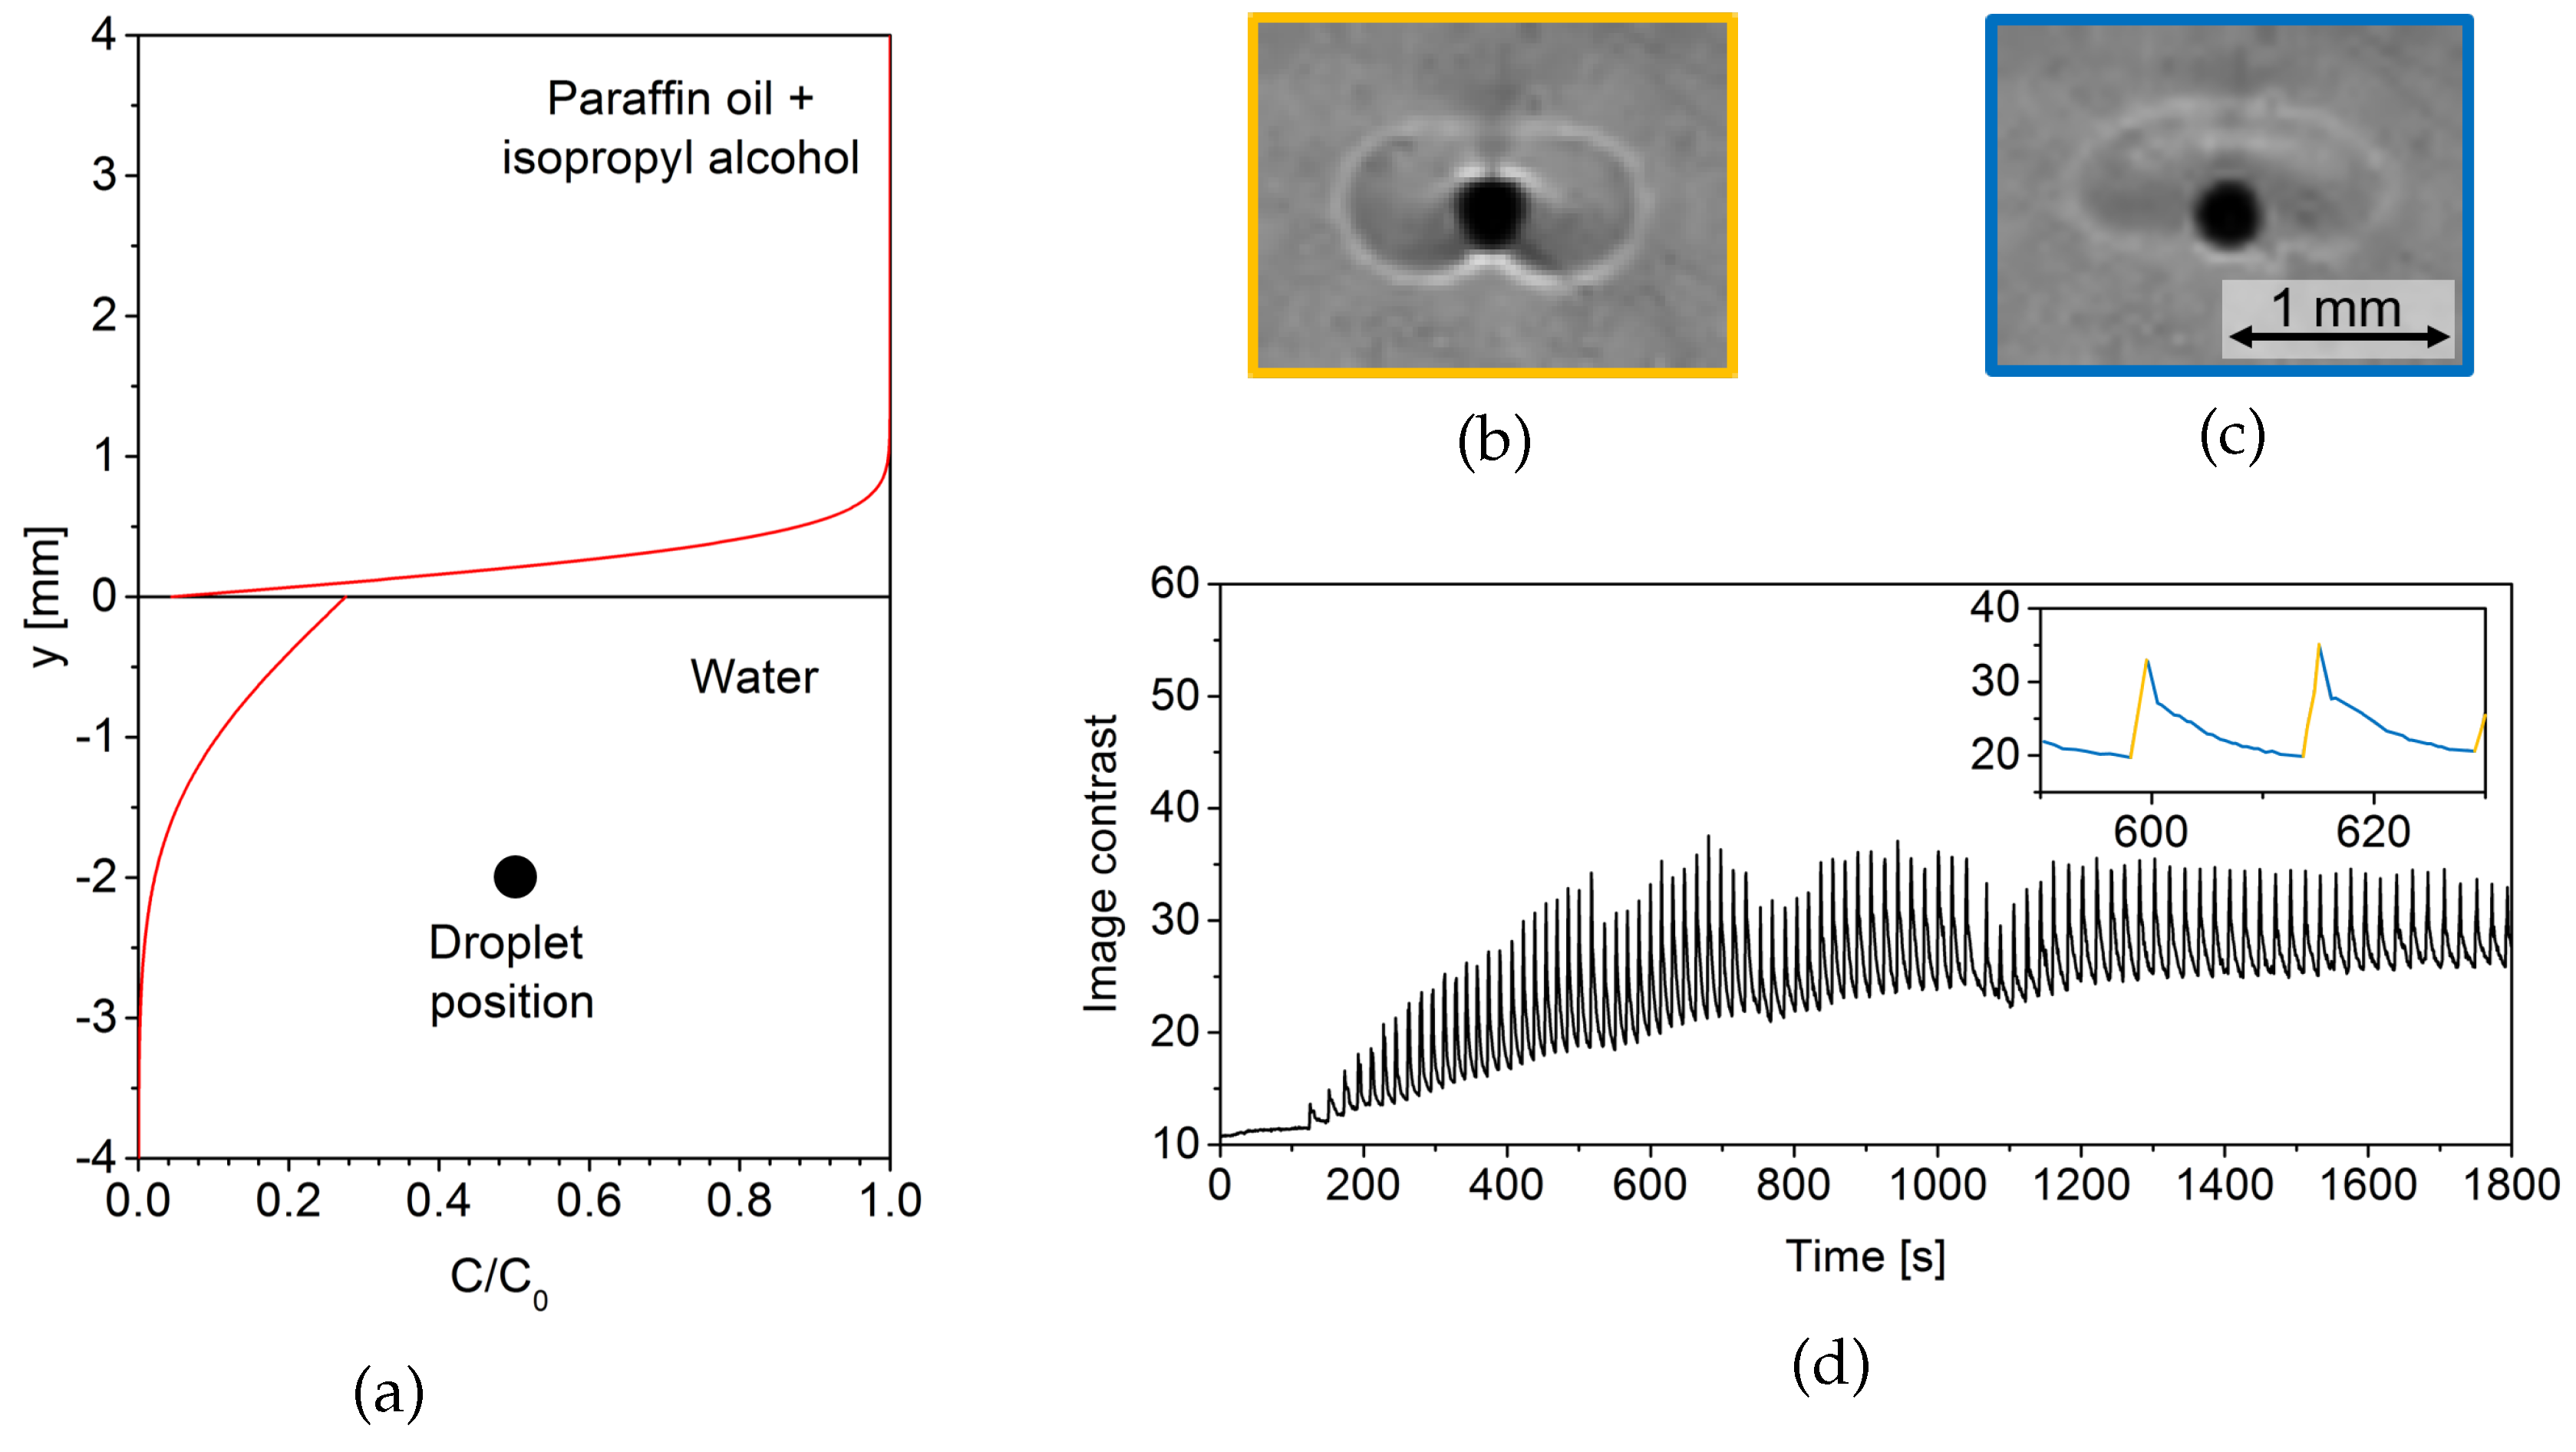
Abstract
:1. Introduction
- high productivity due to the absence of the loading-unloading stage, as well as cleaning of the reactor after each batch
- uniformity and stability of the process ensuring easy control
- stable consumption of reagents and energy due to the small volume of the reactor zone
- increase in output by the replication of the production line
2. Experimental Observations of Relaxation Oscillations
2.1. Liquid–Liquid System
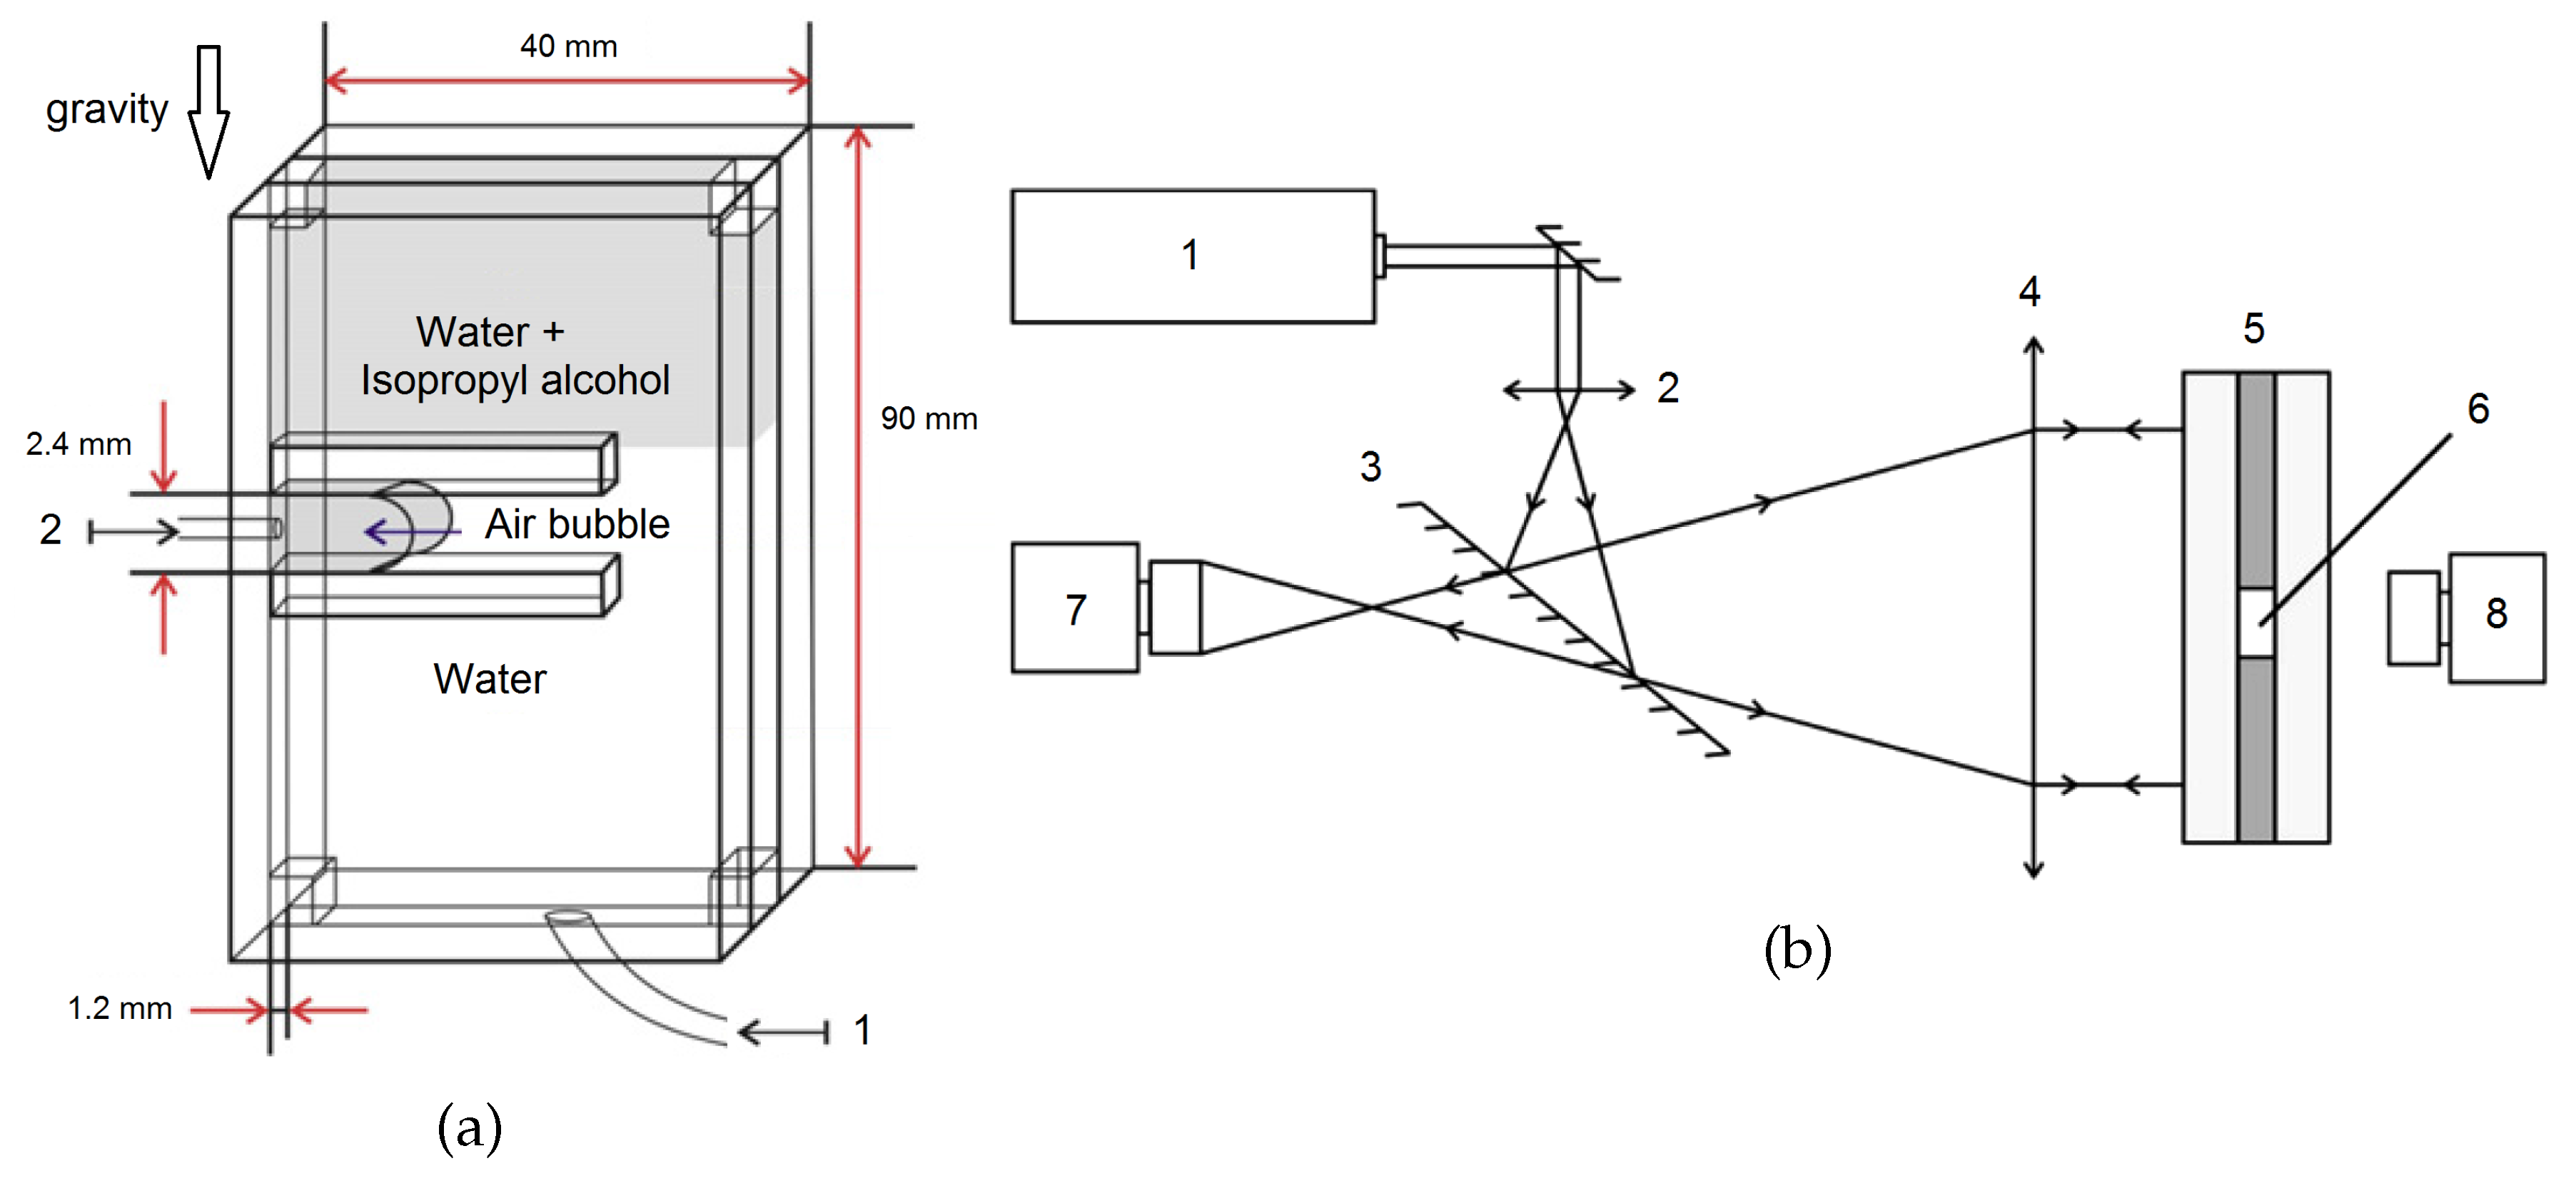
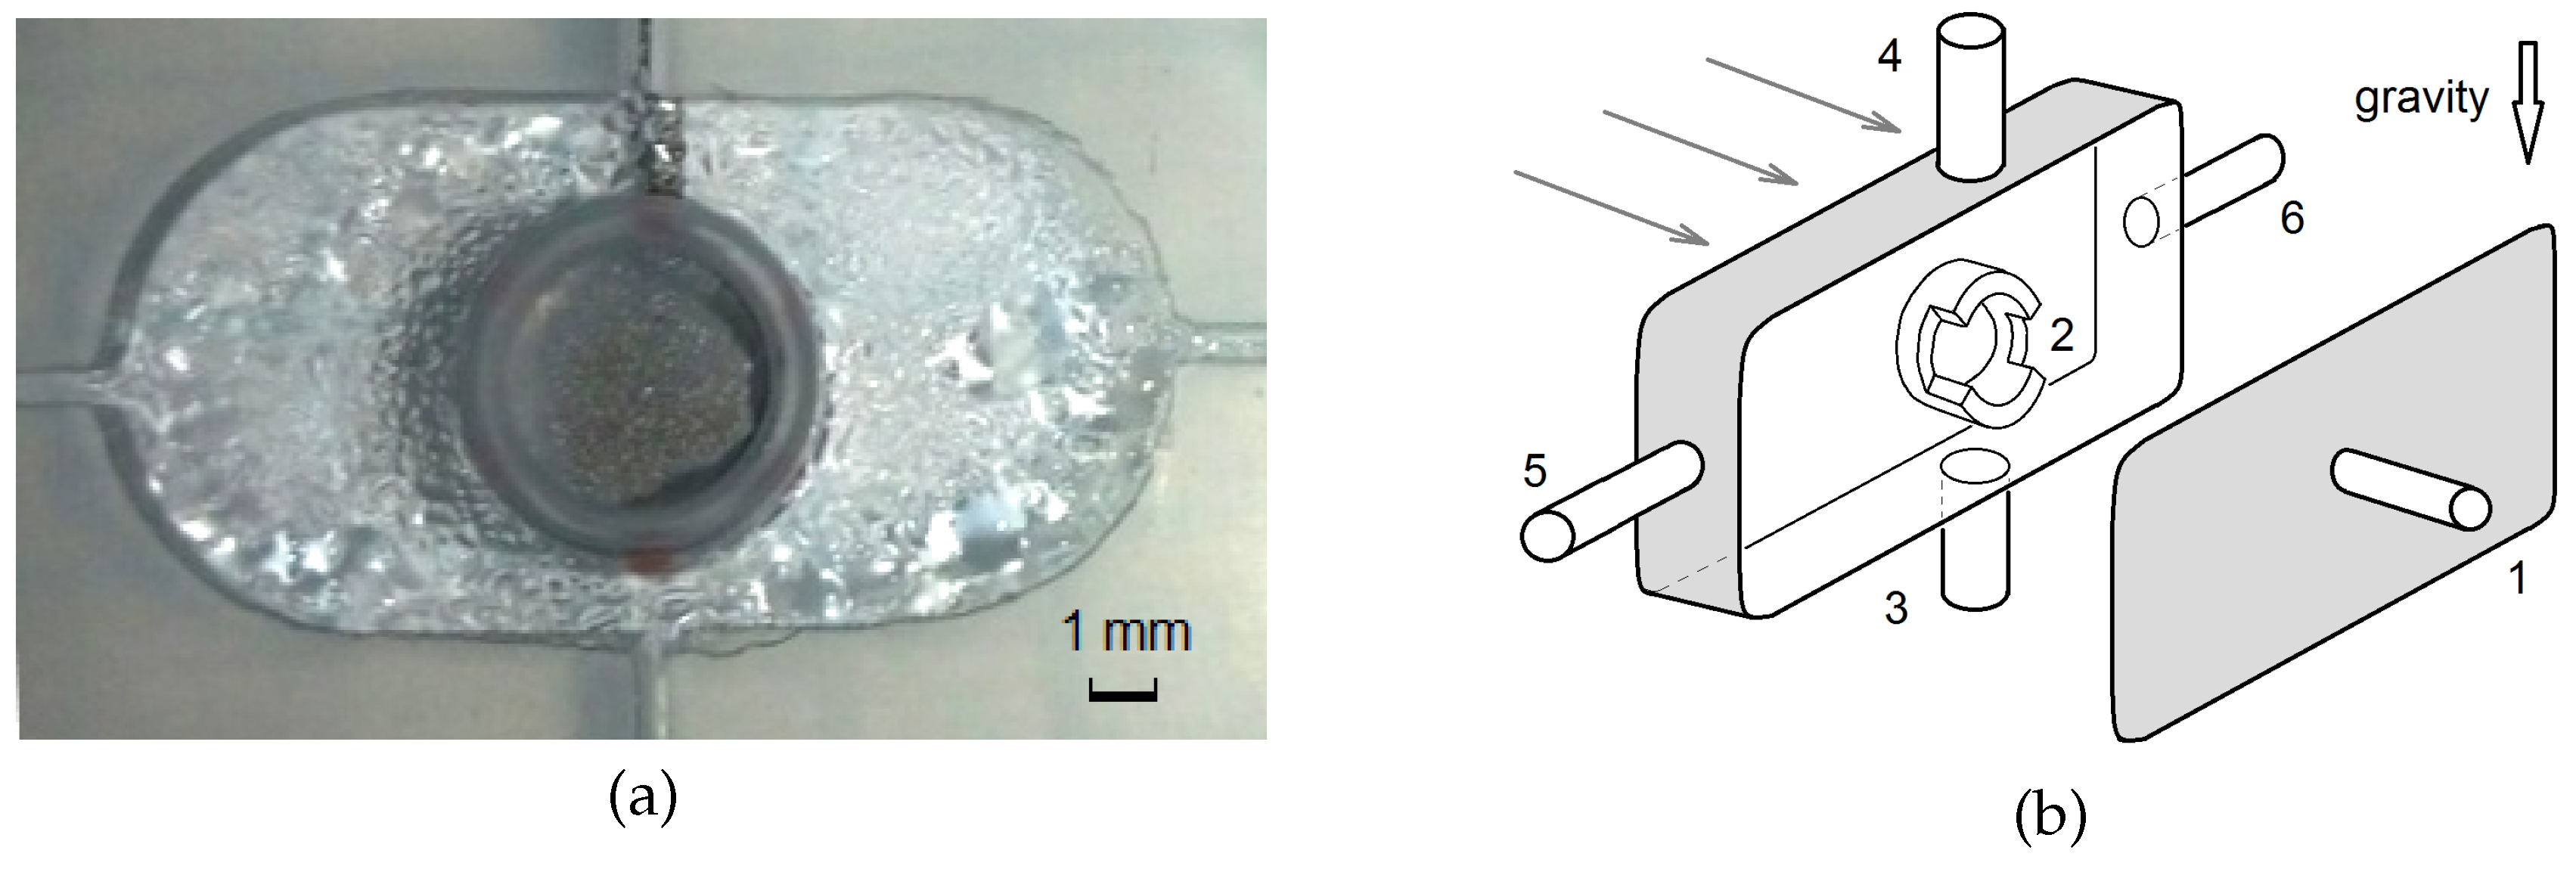
2.1.1. Experimental Setup
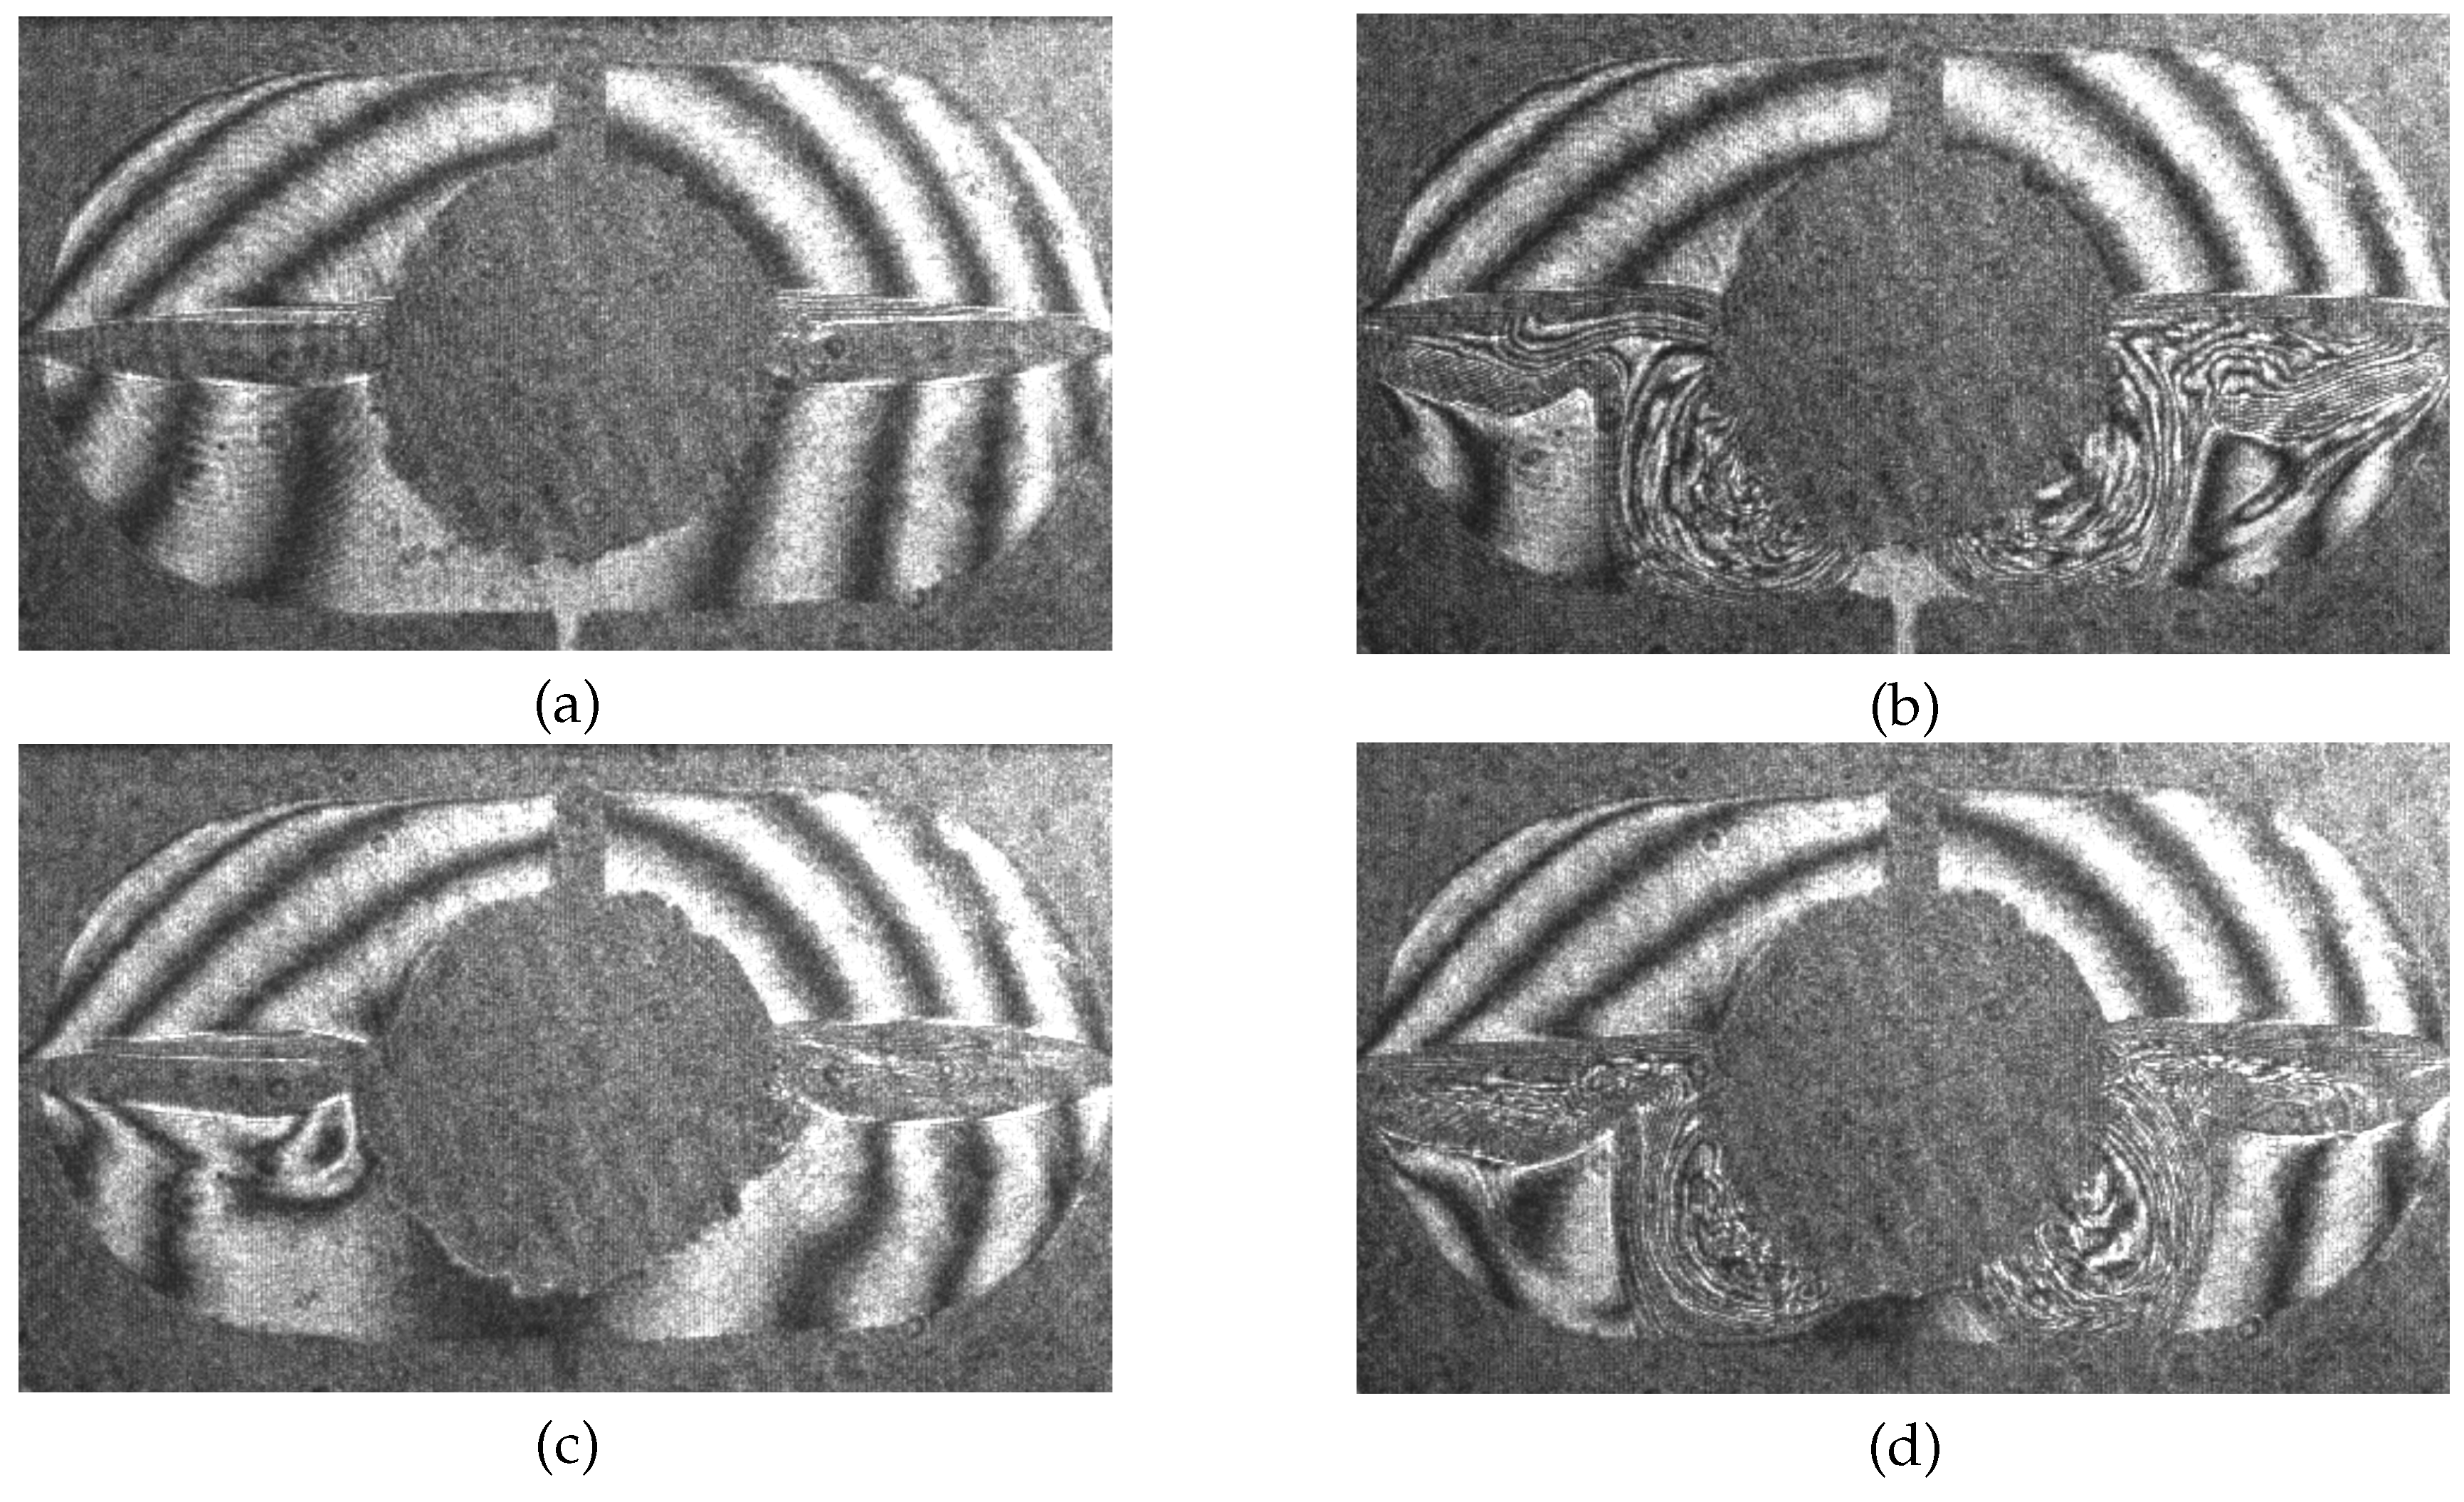
2.1.2. Experimental Results
2.2. Air–Liquid System
2.2.1. Experimental Setup
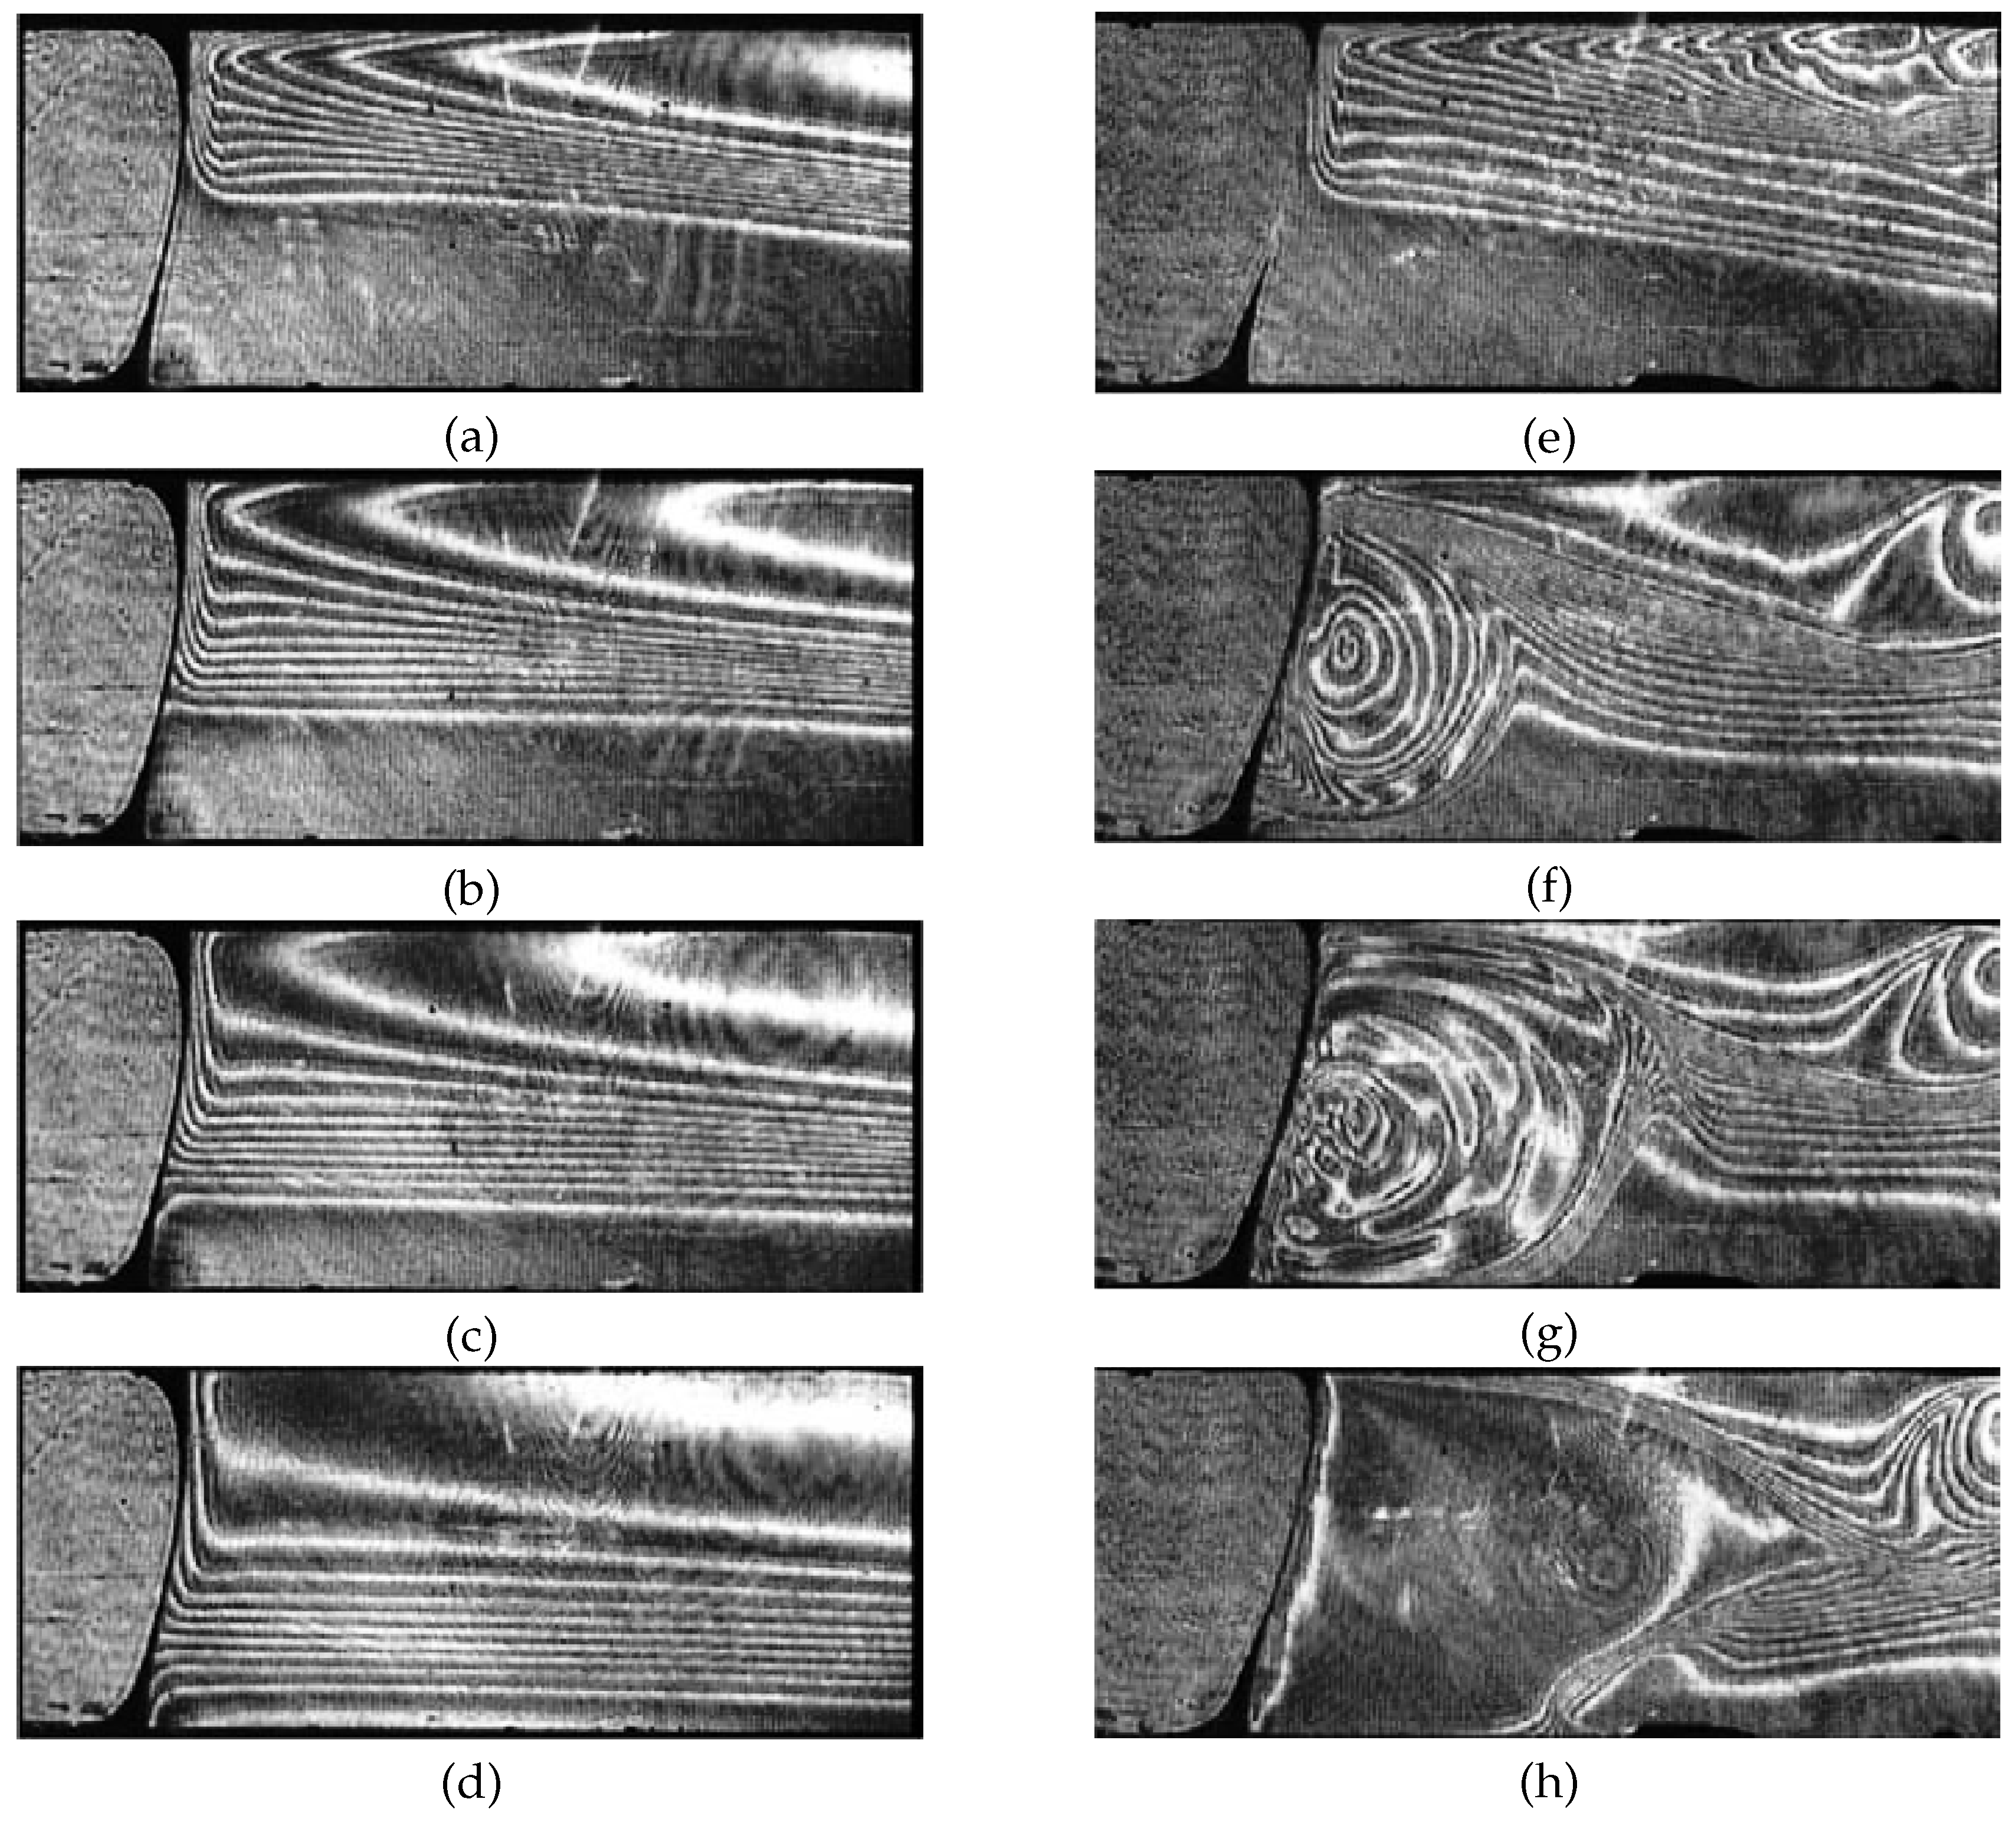
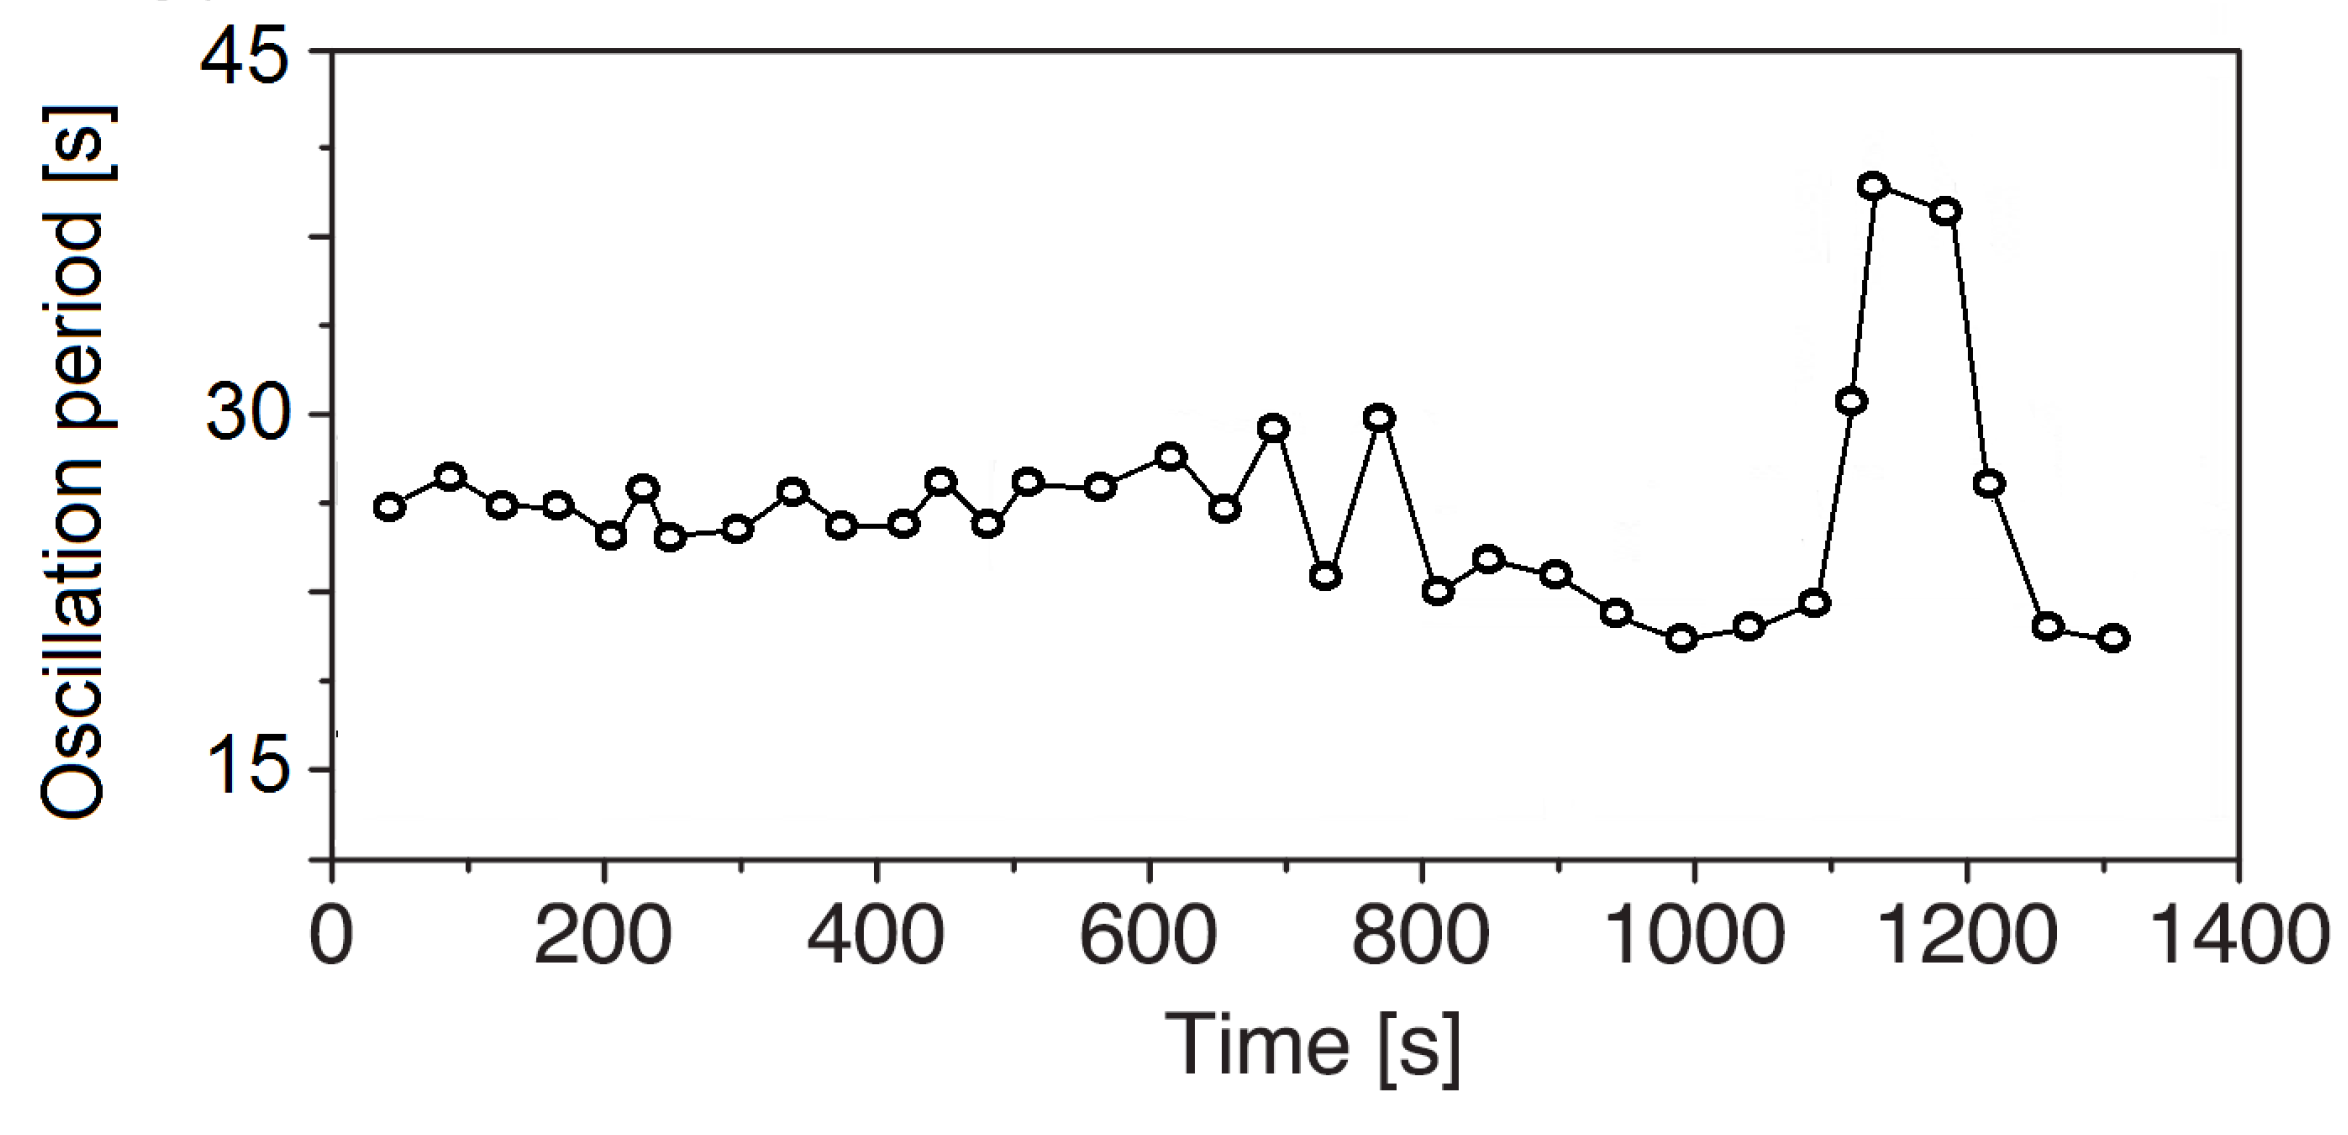
2.2.2. Experimental Results
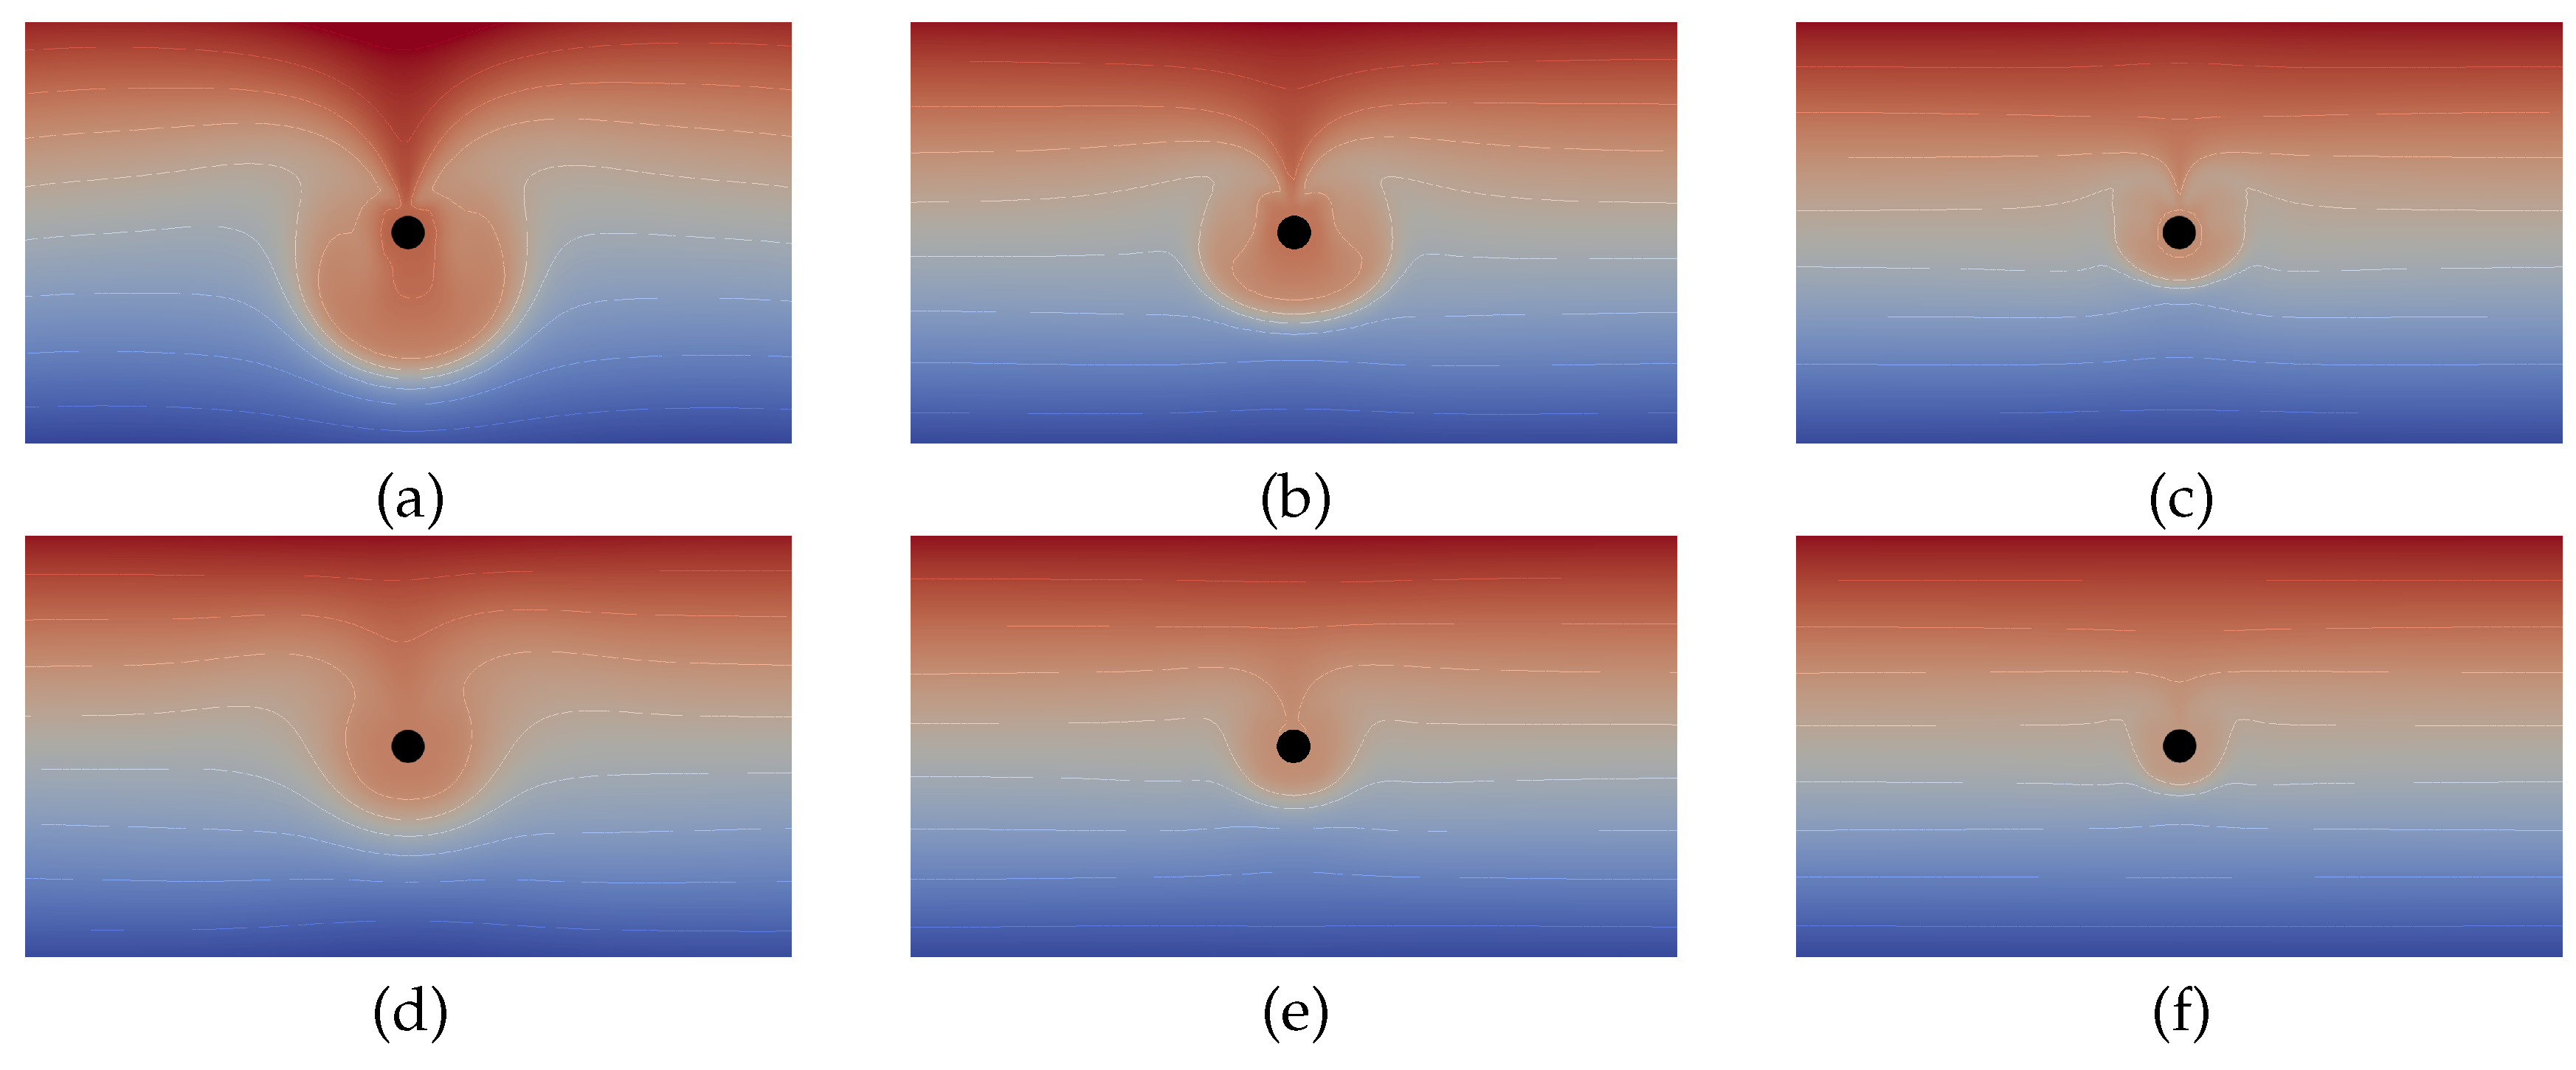
3. Numerical Simulations
3.1. Mathematical Model
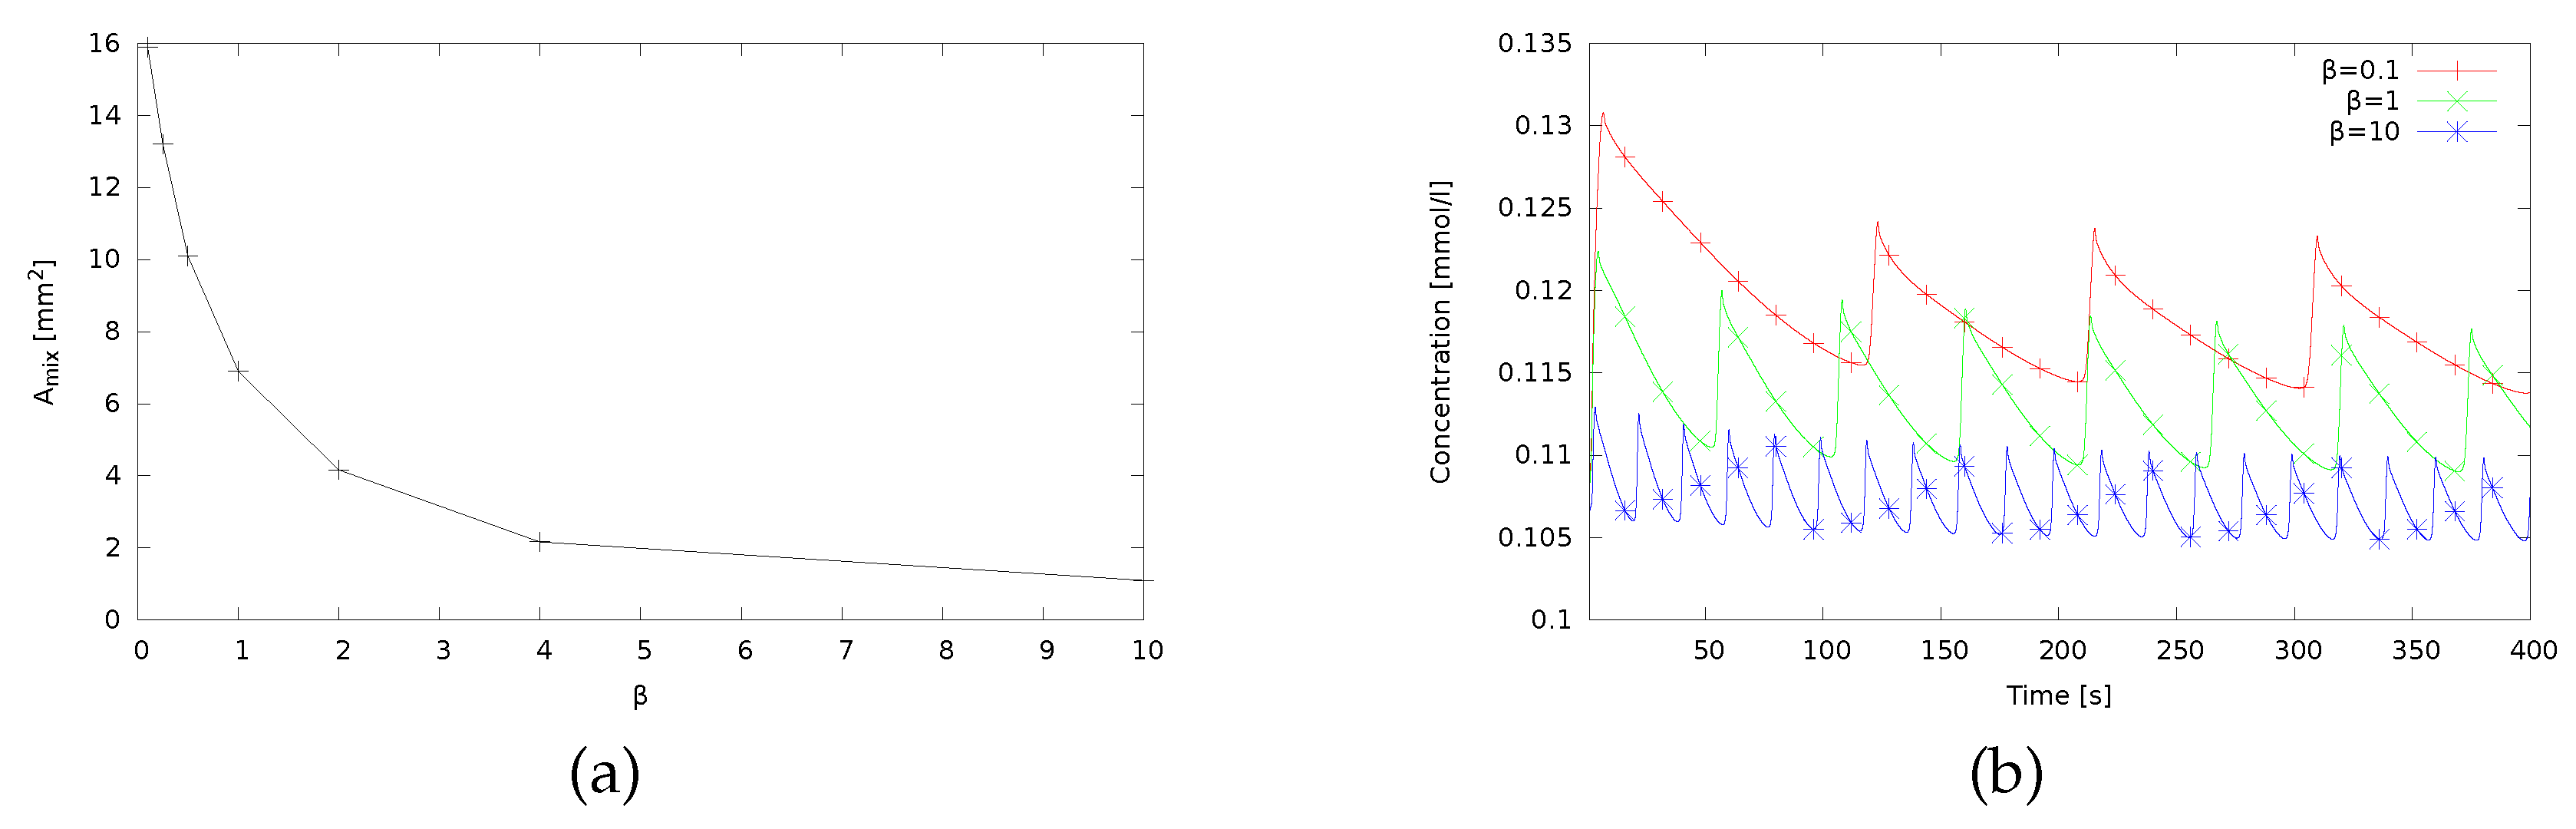
3.2. Numerical Results
4. Micromixer Using a Single Bubble Inside the Reactor
5. Discussion and Conclusions
Author Contributions
Funding
Conflicts of Interest
References
- Avnir, D.; Kagan, M.L. The evolution of chemical patterns in reactive liquids, driven by hydrodynamic instabilities. Chaos 1995, 5, 589–601. [Google Scholar] [CrossRef] [PubMed]
- Bees, M.A.; Pons, A.J.; Sorensen, P.G.; Sagues, F. Chemoconvection: A chemically driven hydrodynamic instability. J. Chem. Phys. 2001, 114, 1932–1943. [Google Scholar] [CrossRef]
- Almarcha, C.; Trevelyan, P.M.J.; Grosfils, P.; De Wit, A. Chemically Driven Hydrodynamic Instabilities. Phys. Rev. Lett. 2010, 104, 044501. [Google Scholar] [CrossRef] [PubMed]
- Reschetilowski, W. (Ed.) Microreactors in Preparative Chemistry; Wiley-VCH: Weinheim, Germany, 2013; p. 352. [Google Scholar]
- Jensen, K.F. Microreaction engineering—Is small better? Chem. Eng. Sci. 2001, 56, 293–303. [Google Scholar] [CrossRef]
- Hessel, V.L.; Holger-Schonfeld, F. Micromixers—A review on passive and active mixing principles. Chem. Eng. Sci. 2005, 60, 2479–2501. [Google Scholar] [CrossRef]
- Mascia, S.; Heider, P.L.; Zhang, H.; Lakerveld, R.; Benyahia, B.; Barton, P.I.; Braatz, R.D.; Cooney, C.L.; Evans, J.M.B.; Jamison, T.F.; et al. End-to-end continuous manufacturing of pharmaceuticals: Integrated synthesis, purification, and final dosage formation. Angew. Chem. Int. Ed. 2013, 52, 12359–12363. [Google Scholar] [CrossRef] [PubMed]
- Newman, S.G.; Jensen, K.F. The role of flow in green chemistry and engineering. Green Chem. 2013, 15, 1456–1472. [Google Scholar] [CrossRef]
- Filipponi, P.; Ostacolo, C.; Novellino, E.; Pellicciari, R.; Gioiello, A. Continuous Flow Synthesis of Thieno [2,3-c]isoquinolin-5(4H)-one Scaffold: A Valuable Source of PARP-1 Inhibitors. Org. Process Res. Dev. 2014, 18, 1345–1353. [Google Scholar] [CrossRef]
- Baumann, M.; Baxendale, I.R. The synthesis of active pharmaceutical ingredients (APIs) using continuous flow chemistry. Beilstein J. Org. Chem. 2015, 52, 1194–1219. [Google Scholar] [CrossRef] [PubMed] [Green Version]
- Pellegatti, L.; Sedelmeier, J. Synthesis of Vildagliptin Utilizing Continuous Flow and Batch Technologies. Org. Process Res. Dev. 2015, 19, 551–554. [Google Scholar] [CrossRef]
- Martin, A.D.; Siamaki, A.R.; Belecki, K.; Gupton, B.F. A flow-based synthesis of telmisartan. J. Flow Chem. 2015, 5, 145–147. [Google Scholar] [CrossRef] [Green Version]
- Wegner, J.; Ceylan, S.; Kirschning, A. Ten key issues in modern flow chemistry. Chem. Commun. 2011, 47, 4583–4592. [Google Scholar] [CrossRef] [PubMed]
- Nieves-Remacha, M.J.; Kulkarni, A.A.; Jensen, K.F. Hydrodynamics of liquid-liquid dispersion in an Advanced-Flow Reactor. Ind. Eng. Chem. Res. 2012, 51, 16251–16262. [Google Scholar] [CrossRef]
- Ju, J.; Warrick, J. Passive micromixer using by convection and surface tension effects with air-liquid interface. BioChip J. 2013, 7, 361–366. [Google Scholar] [CrossRef] [PubMed] [Green Version]
- Sinz, D.K.; Hanyak, M.; Darhuber, A.A. Self-induced surfactant transport along discontinuous liquid–liquid interfaces. J. Phys. Chem. Lett. 2013, 4, 1039–1043. [Google Scholar] [CrossRef] [PubMed]
- Yamada, T.; Ono, N. A study on micromixing utilizing Marangoni effect induced on gas–liquid free interfaces. J. Micro Nano-Manuf. 2015, 3, 021003. [Google Scholar] [CrossRef]
- Cheng, W.L.; Erbay, C.V.; Sadr, R.; Han, H. Dynamic Flow Characteristics and Design Principles of Laminar Flow Microbial Fuel Cells. Micromachines 2018, 9, 479. [Google Scholar] [CrossRef] [PubMed]
- Stroock, A.D.; Dertinger, S.K.W.; Ajdari, A.; Mezić, I.; Stone, H.A.; Whitesides, G.M. Chaotic Mixer for Microchannels. Science 2002, 295, 647. [Google Scholar] [CrossRef] [PubMed]
- Abbas, Y.; Miwa, J.; Zengerle, R.; von Stetten, F. Active Continuous-Flow Micromixer Using an External Braille Pin Actuator Array. Micromachines 2013, 4, 80–89. [Google Scholar] [CrossRef] [Green Version]
- Mavrogiannis, N.; Desmond, M.; Ling, K.; Fu, X.; Gagnon, Z. Microfluidic Mixing and Analog On-Chip Concentration Control Using Fluidic Dielectrophoresis. Micromachines 2016, 7, 214. [Google Scholar] [CrossRef] [PubMed]
- Cai, Z.; Xiang, J.; Chen, H.; Wang, W. A Rapid Micromixer for Centrifugal Microfluidic Platforms. Micromachines 2016, 7, 89. [Google Scholar] [CrossRef] [PubMed]
- Malgaretti, P.; Pagonabarraga, I.; Joanny, J.-F. Bistability, Oscillations, and Bidirectional Motion of Ensemble of Hydrodynamically Coupled Molecular Motors. Phys. Rev. Lett. 2017, 119, 168101. [Google Scholar] [CrossRef] [PubMed]
- Eckert, K.; Grahn, A. Plume and finger regimes driven by an exothermic interfacial reaction. Phys. Rev. Lett. 1999, 82, 4436–4439. [Google Scholar] [CrossRef]
- Bratsun, D.; De Wit, A. On Marangoni convective patterns driven by an exothermic chemical reaction in two-layer systems. Phys. Fluids 2004, 16, 1082–1096. [Google Scholar] [CrossRef] [Green Version]
- Shi, Y.; Eckert, K. A novel Hele–Shaw cell design for the analysis of hydro-dynamic instabilities in liquid-liquid systems. Chem. Eng. Sci. 2008, 63, 3560–3563. [Google Scholar] [CrossRef]
- Bratsun, D.; De Wit, A. Buoyancy-driven pattern formation in reactive immiscible two-layer systems. Chem. Eng. Sci. 2011, 66, 5723–5734. [Google Scholar] [CrossRef] [Green Version]
- Eckert, K.; Acker, M.; Tadmouri, R.; Pimienta, V. Chemo-Marangoni convection driven by an interfacial reaction: Pattern formation and kinetics. Chaos Interdiscip. J. Nonlinear Sci. 2012, 22, 037112. [Google Scholar] [CrossRef] [PubMed]
- Bratsun, D.A. On Rayleigh-Bénard mechanism of alignment of salt fingers in reactive immiscible two-layer systems. Microgravity Sci. 2014, 26, 293–303. [Google Scholar] [CrossRef]
- Schwarzenberger, K.; Eckert, K.; Odenbach, S. Relaxation oscillations between Marangoni cells and double diffusive fingers in a reactive liquid–liquid system. Chem. Eng. Sci. 2012, 68, 530–540. [Google Scholar] [CrossRef]
- Eckert, K.; Shi, Y.; Schwarzenberger, K. Meniscus asymmetry and chemo-Marangoni convection in capillaries. Chem. Eng. Technol. 2017, 40, 2067–2074. [Google Scholar] [CrossRef]
- Mizev, A. Influence of an adsorption layer on the structure and stability of surface tension driven flows. Phys. Fluids 2005, 17, 122107. [Google Scholar] [CrossRef]
- Kostarev, K.; Shmyrov, A.; Zuev, A.; Viviani, A. Convective and diffusive surfactant transfer in multiphase liquid systems. Exp. Fluids 2011, 51, 457–470. [Google Scholar] [CrossRef]
- Schwarzenberger, K.; Köllner, T.; Linde, H.; Boeck, T.; Odenbach, S.; Eckert, K. Pattern formation and mass transfer under stationary solutal Marangoni instability. Adv. Colloid Interface Sci. 2014, 206, 344–371. [Google Scholar] [CrossRef] [PubMed]
- Birikh, R.V.; Denisova, M.O.; Kostarev, K.G. Development of concentration-capillary convection on an interfacial surface. Fluid. Dyn. 2015, 50, 361–370. [Google Scholar] [CrossRef]
- Schwarzenberger, K.; Aland, S.; Domnick, H.; Odenbach, S.; Eckert, K. Relaxation oscillations of solutal Marangoni convection at curved interfaces. Colloids Surf. A Physicochem. Eng. Aspects 2015, 481, 633–643. [Google Scholar] [CrossRef]
- Crank, J. The Mathematics of Diffusion; Clarendon Press: Oxford, UK, 1975; 414p. [Google Scholar]
- Grahn, A. Two-dimensional numerical simulations of Marangoni-Bénard instabilities during liquid-liquid mass transfer in a vertical gap. Chem. Eng. Sci. 2006, 61, 3586–3592. [Google Scholar] [CrossRef]
- Boos, W.; Thess, A. Thermocapillary flow in a Hele–Shaw cell. J. Fluid Mech. 1997, 352, 305–330. [Google Scholar] [CrossRef]
- Teigen, K.E.; Song, P.; Lowengrub, J.; Voigt, A. A diffuse-interface method for two-phase flows with soluble surfactants. J. Comput. Phys. 2011, 230, 375–393. [Google Scholar] [CrossRef] [PubMed] [Green Version]


© 2018 by the authors. Licensee MDPI, Basel, Switzerland. This article is an open access article distributed under the terms and conditions of the Creative Commons Attribution (CC BY) license (http://creativecommons.org/licenses/by/4.0/).
Share and Cite
Bratsun, D.; Kostarev, K.; Mizev, A.; Aland, S.; Mokbel, M.; Schwarzenberger, K.; Eckert, K. Adaptive Micromixer Based on the Solutocapillary Marangoni Effect in a Continuous-Flow Microreactor. Micromachines 2018, 9, 600. https://doi.org/10.3390/mi9110600
Bratsun D, Kostarev K, Mizev A, Aland S, Mokbel M, Schwarzenberger K, Eckert K. Adaptive Micromixer Based on the Solutocapillary Marangoni Effect in a Continuous-Flow Microreactor. Micromachines. 2018; 9(11):600. https://doi.org/10.3390/mi9110600
Chicago/Turabian StyleBratsun, Dmitry, Konstantin Kostarev, Alexey Mizev, Sebastian Aland, Marcel Mokbel, Karin Schwarzenberger, and Kerstin Eckert. 2018. "Adaptive Micromixer Based on the Solutocapillary Marangoni Effect in a Continuous-Flow Microreactor" Micromachines 9, no. 11: 600. https://doi.org/10.3390/mi9110600