
Effects of Heat-Moisture-Treated High-Amylose Rice Flour on Body Weight, Lipid Metabolism, and Gut Microbiome Composition in Obese Rats

 , and
, and
Abstract
:1. Introduction
2. Materials and Methods
2.1. Materials
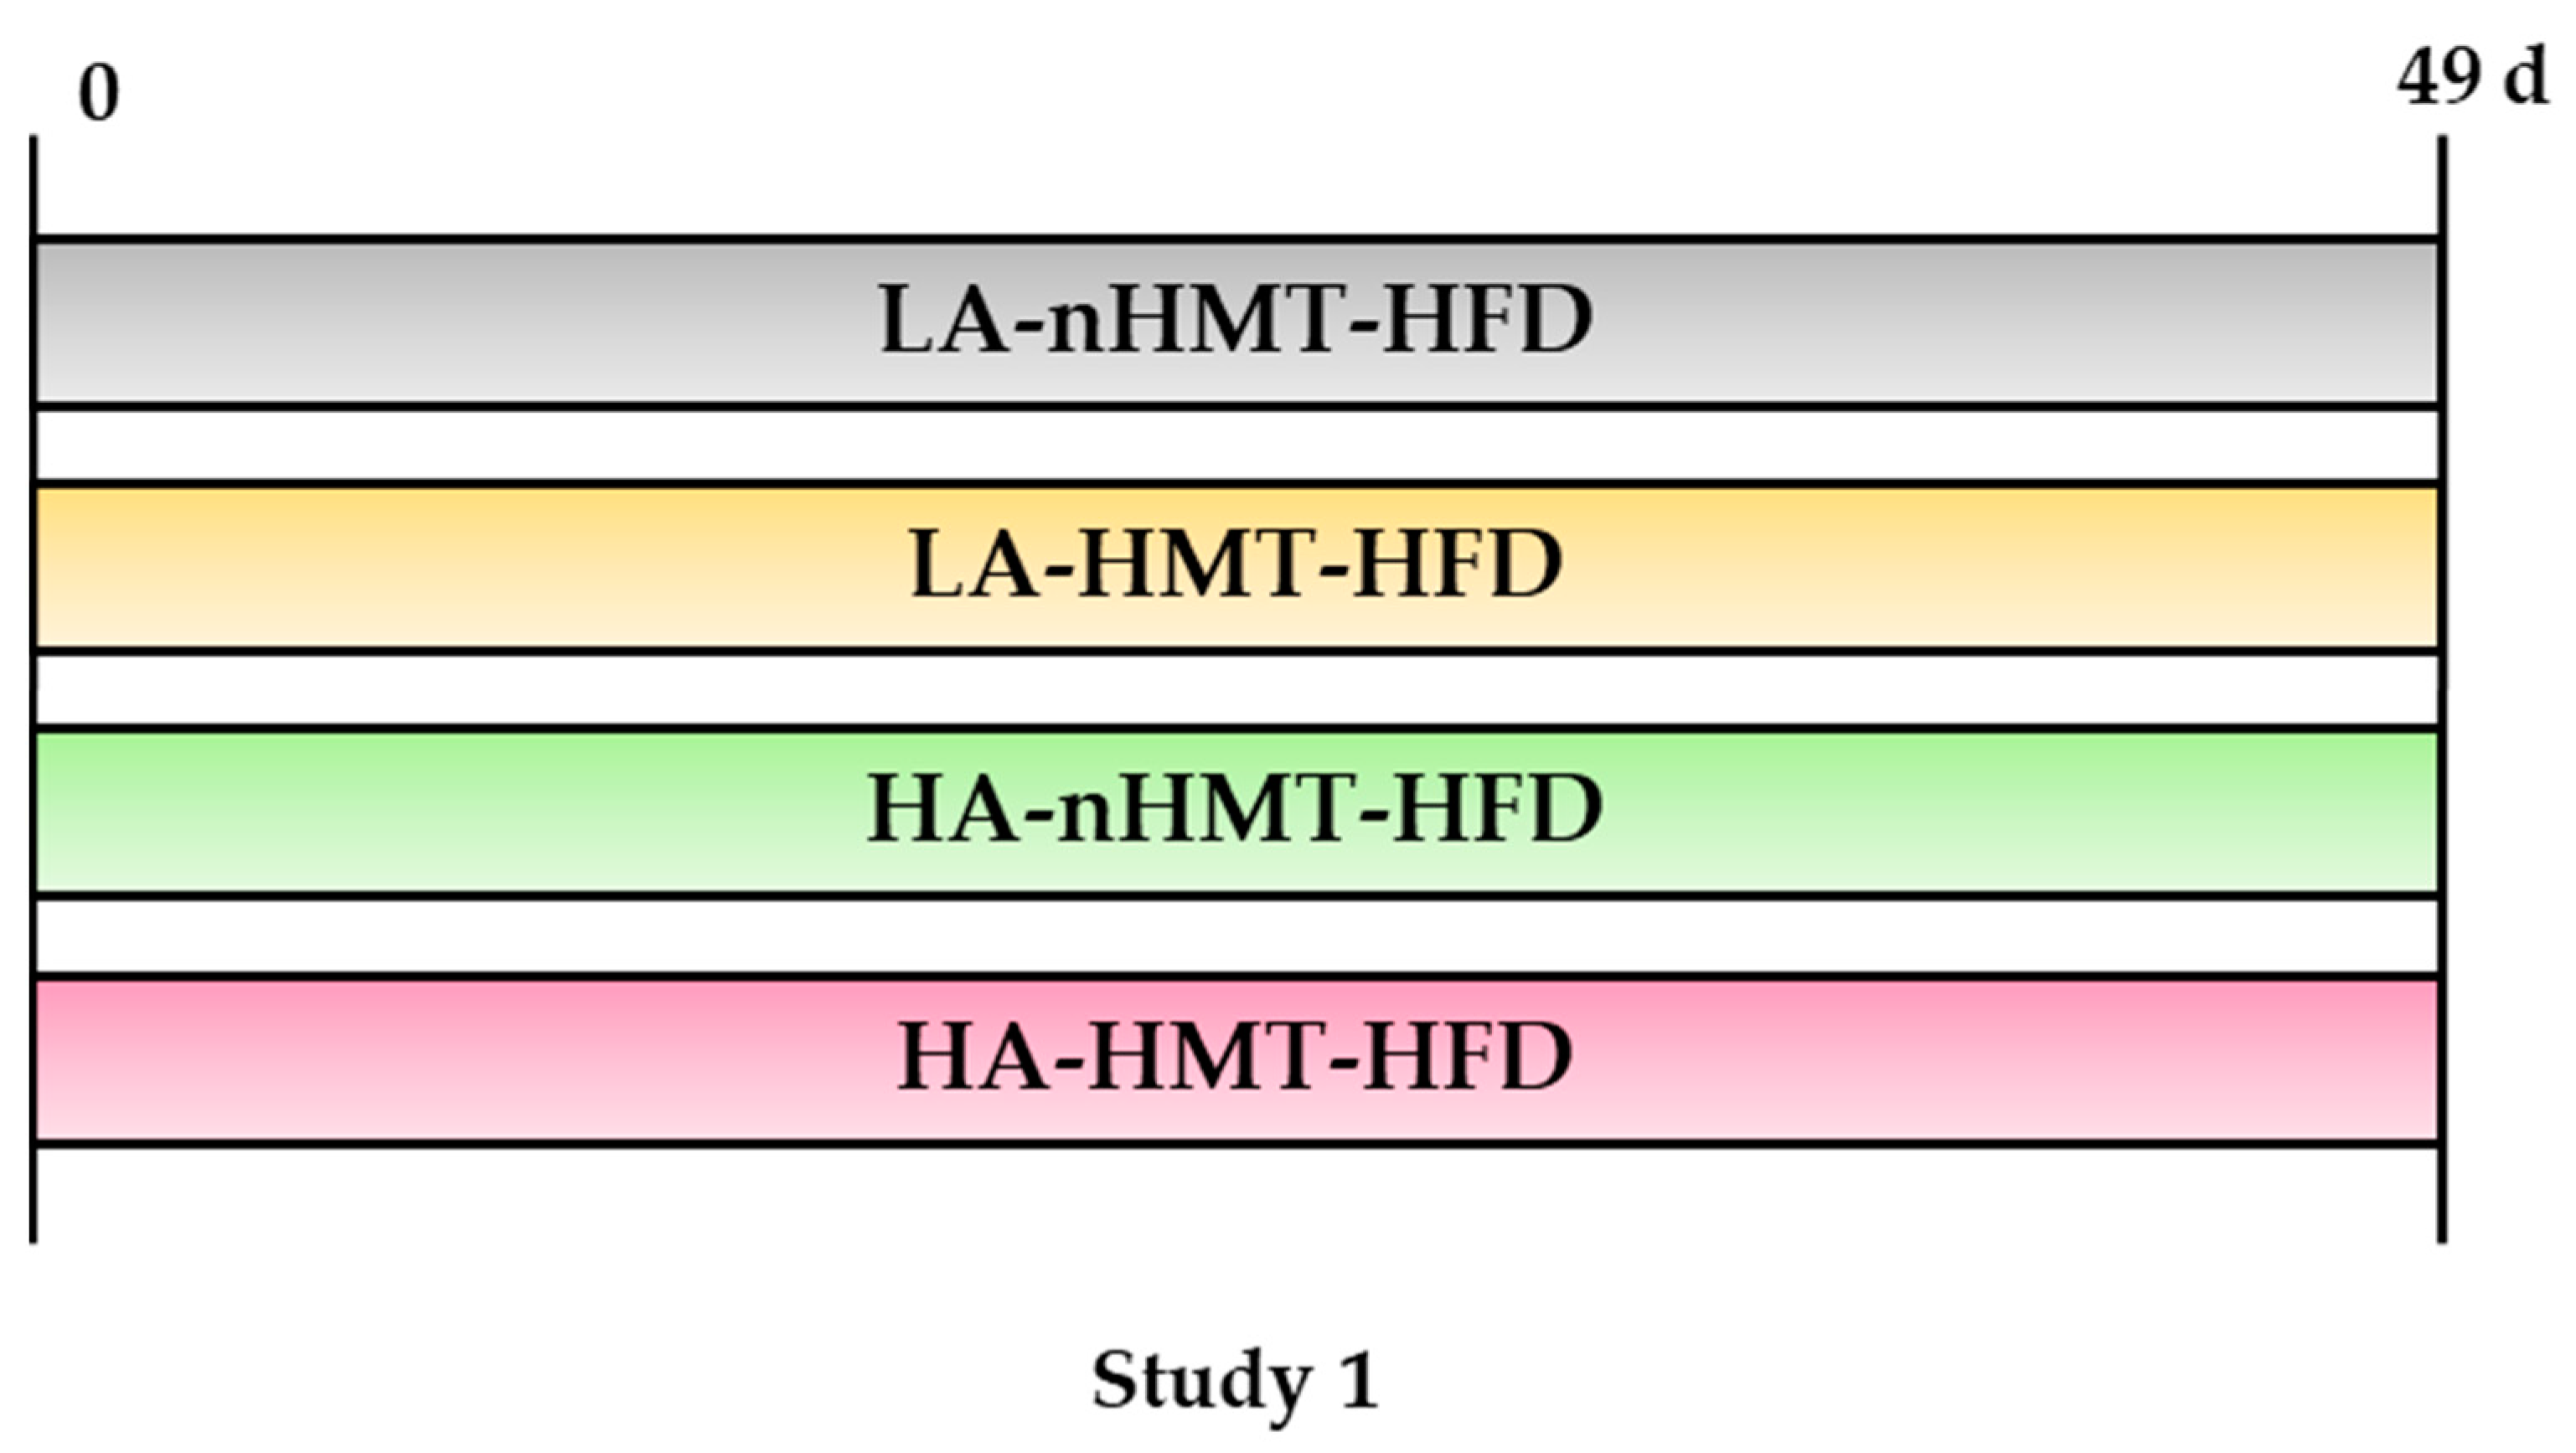
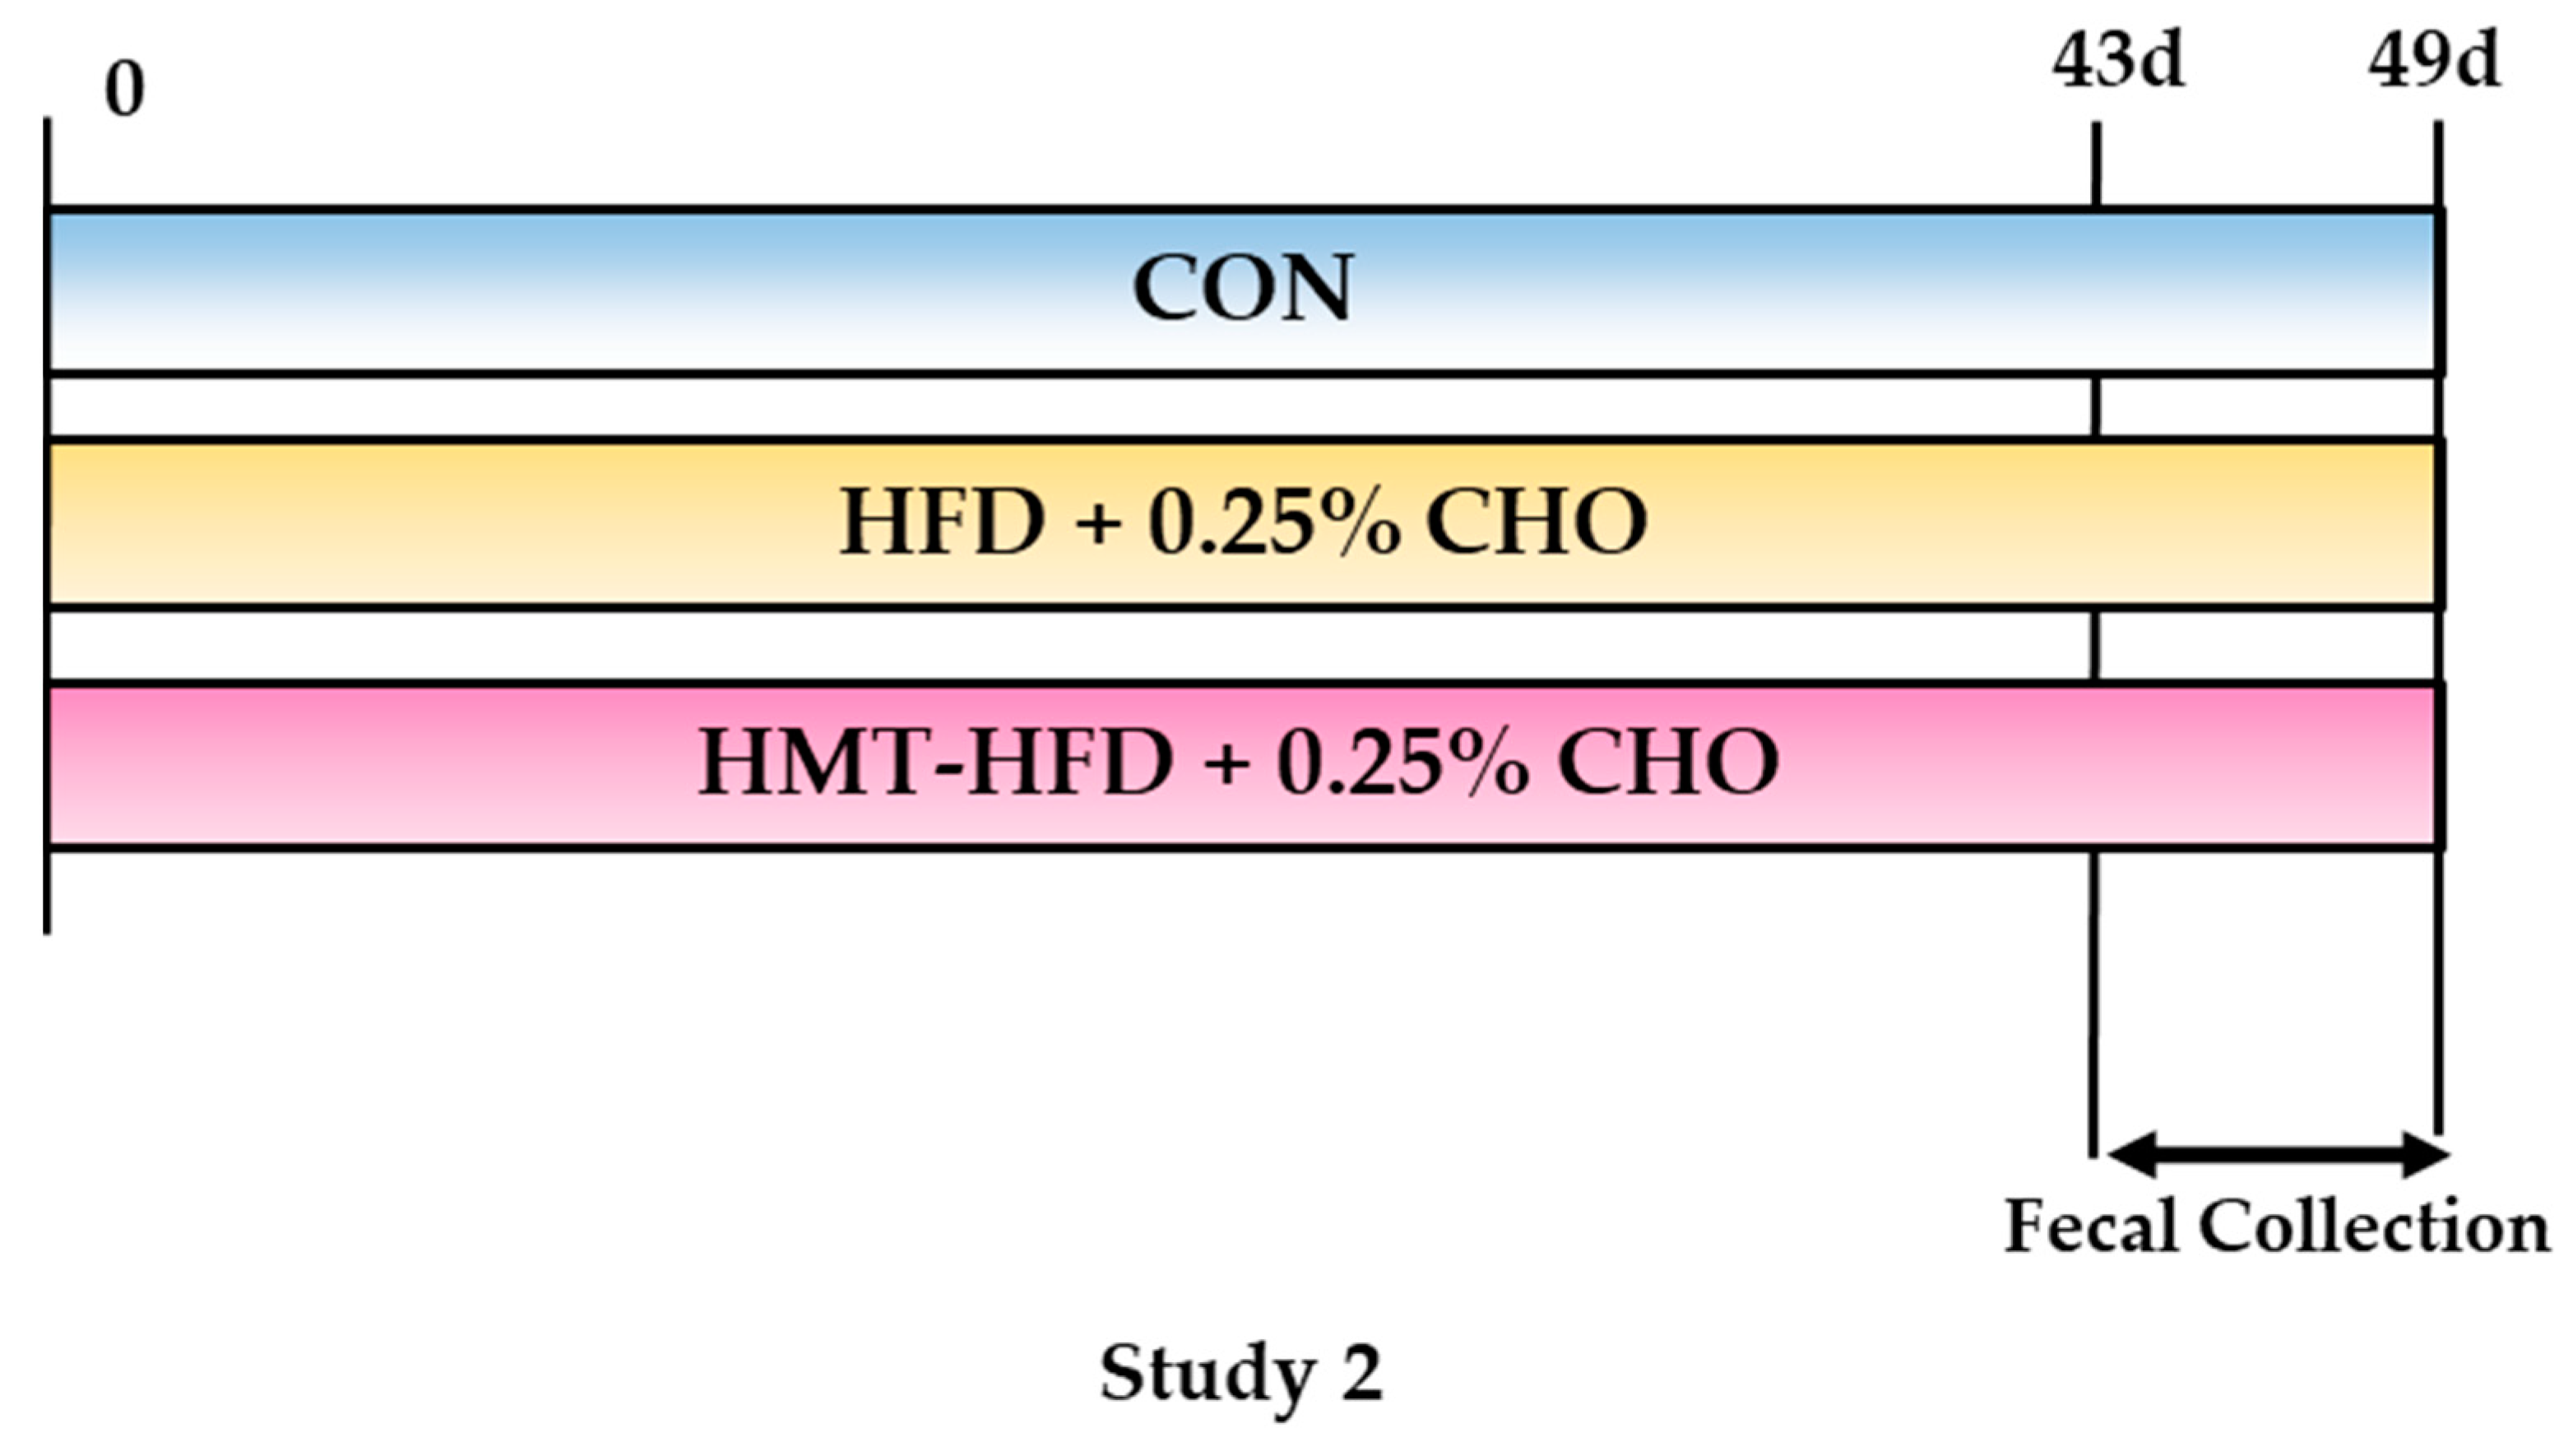
2.2. Study Designs
2.2.1. Study 1
2.2.2. Study 2
2.3. Biochemical Tests
2.4. RNA Extraction
2.5. DNA Microarray and Functional Analyses
2.6. Real-Time Quantitative Polymerase Chain Reaction (RT-qPCR)
2.7. Metabolome Analysis
2.8. Cecal Bacterial DNA Extraction and Metagenome Analysis
2.9. Statistical Analysis
3. Results
3.1. Results of Study 1
3.1.1. Food Intake and Body Weight Changes in Study 1
3.1.2. Final Body Weight, Organ and Tissue Masses, and Blood and Tissue Biochemical Parameters in Study 1
3.2. Results of Study 2
3.2.1. Food Intake and Body Weight Changes in Study 2
3.2.2. Final Body Weight, Organ and Tissue Masses, and Blood and Tissue Biochemical Parameters in Study 2
3.2.3. Biomarkers of Lipid Metabolism
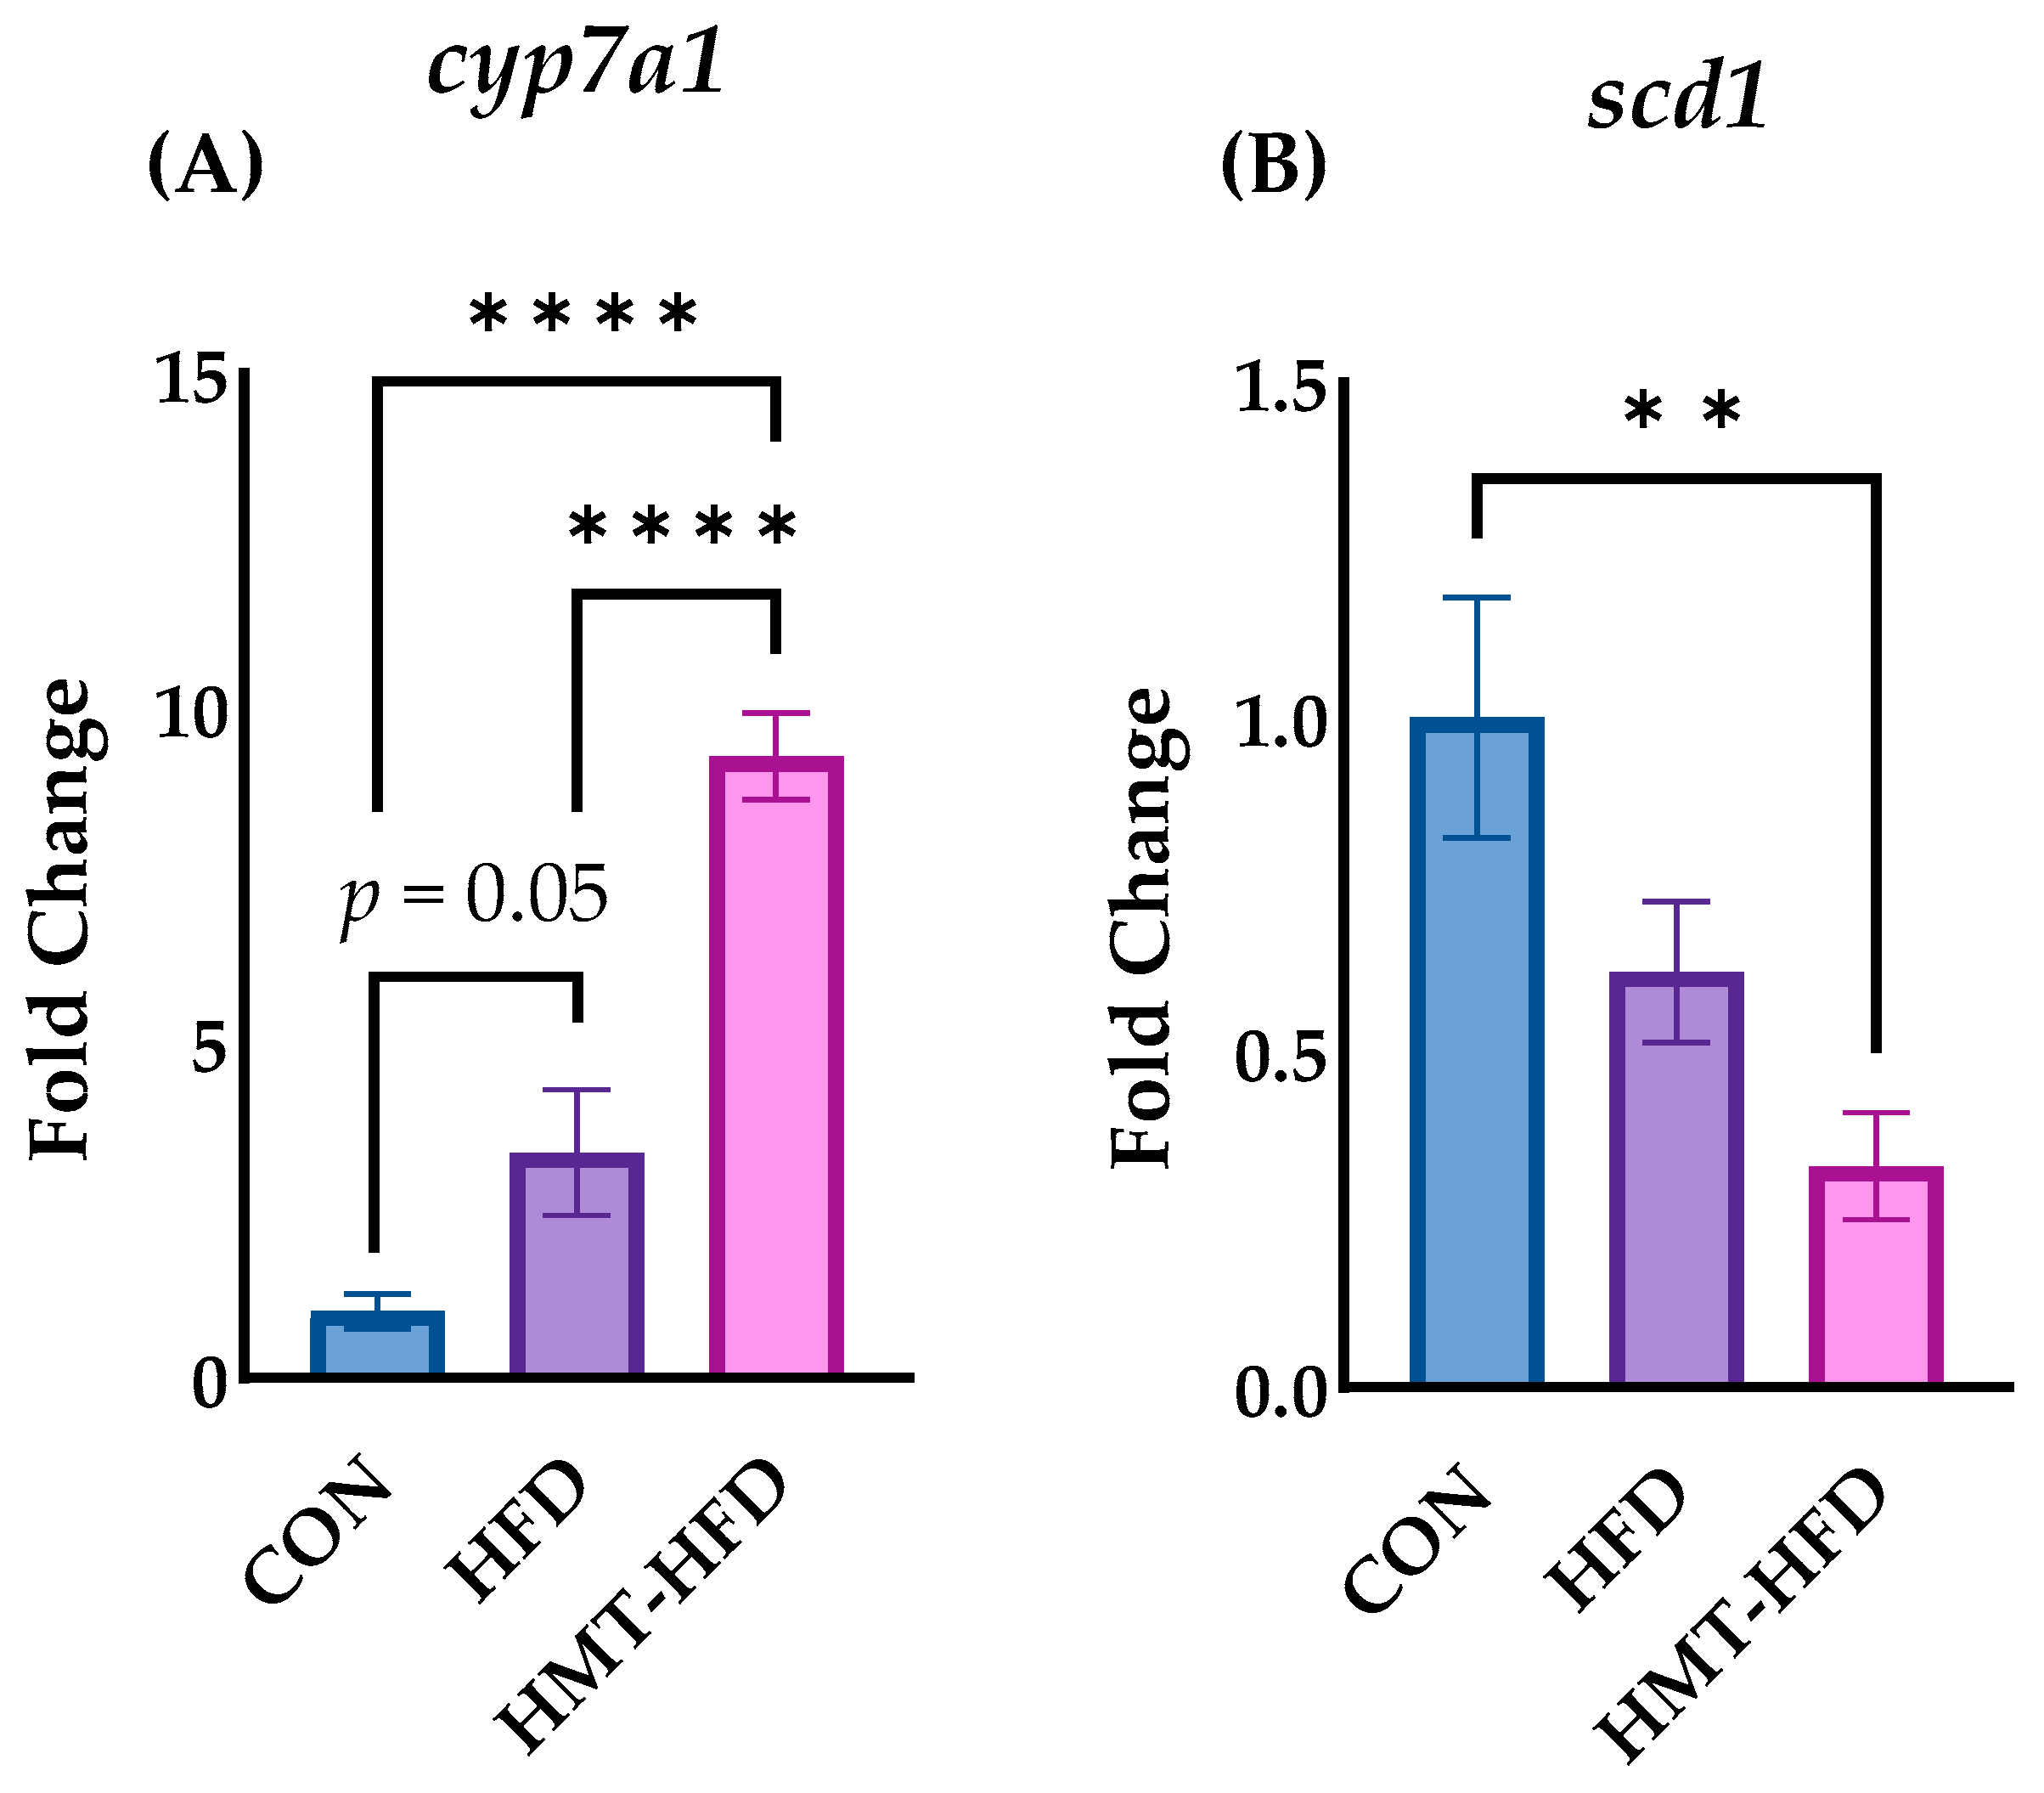
3.2.4. DNA Microarray Results, IPA Pathway Enrichment Analyses Based on Transcriptome Results in Liver, and RT-PCR
3.2.5. Microbial Community Composition and Alpha Diversity
4. Discussion
Author Contributions
Funding
Institutional Review Board Statement
Informed Consent Statement
Data Availability Statement
Conflicts of Interest
References
- Wittwer, J.A.; Golden, S.H.; Joseph, J.J. Diabetes and CVD Risk: Special Considerations in African Americans Related to Care. Curr. Cardiovasc. Risk Rep. 2020, 14, 15. [Google Scholar] [CrossRef]
- Neuhouser, M.L. The Importance of Healthy Dietary Patterns in Chronic Disease Prevention. Nutr. Res. 2019, 70, 3–6. [Google Scholar] [CrossRef] [PubMed]
- Tian, S.; Sun, Y. Influencing Factor of Resistant Starch Formation and Application in Cereal Products: A Review. Int. J. Biol. Macromol. 2020, 149, 424–431. [Google Scholar] [CrossRef]
- DeMartino, P.; Cockburn, D.W. Resistant Starch: Impact on the Gut Microbiome and Health. Curr. Opin. Biotechnol. 2020, 61, 66–71. [Google Scholar] [CrossRef]
- Dobranowski, P.A.; Stintzi, A. Resistant Starch, Microbiome, and Precision Modulation. Gut Microbes 2021, 13, 1926842. [Google Scholar] [CrossRef]
- Snelson, M.; Kellow, N.J.; Coughlan, M.T. Modulation of the Gut Microbiota by Resistant Starch as a Treatment of Chronic Kidney Diseases: Evidence of Efficacy and Mechanistic Insights. Adv. Nutr. 2019, 10, 303–320. [Google Scholar] [CrossRef]
- Di Rosa, C.; De Arcangelis, E.; Vitelli, V.; Crucillà, S.; Angelicola, M.; Trivisonno, M.C.; Khazrai, Y.M. Effect of Three Bakery Products Formulated with High-Amylose Wheat Flour on Post-Prandial Glycaemia in Healthy Volunteers. Foods 2023, 12, 319. [Google Scholar] [CrossRef]
- Gu, F.; Li, C.; Hamaker, B.R.; Gilbert, R.G.; Zhang, X. Fecal Microbiota Responses to Rice RS3 Are Specific to Amylose Molecular Structure. Carbohydr. Polym. 2020, 243, 116475. [Google Scholar] [CrossRef] [PubMed]
- Wu, F.; Yang, N.; Touré, A.; Jin, Z.; Xu, X. Germinated Brown Rice and Its Role in Human Health. Crit. Rev. Food Sci. Nutr. 2013, 53, 451–463. [Google Scholar] [CrossRef]
- da Rosa Zavareze, E.; Dias, A.R.G. Impact of Heat-Moisture Treatment and Annealing in Starches: A Review. Carbohydr. Polym. 2011, 83, 317–328. [Google Scholar] [CrossRef]
- Van Hung, P.; Vien, N.L.; Phi, N.T.L. Resistant Starch Improvement of Rice Starches under a Combination of Acid and Heat-Moisture Treatments. Food Chem. 2016, 191, 67–73. [Google Scholar] [CrossRef] [PubMed]
- Zheng, B.; Wang, H.; Shang, W.; Xie, F.; Li, X.; Chen, L.; Zhou, Z. Understanding the Digestibility and Nutritional Functions of Rice Starch Subjected to Heat-Moisture Treatment. J. Funct. Foods 2018, 45, 165–172. [Google Scholar] [CrossRef] [Green Version]
- da Rosa Zavareze, E.; Storck, C.R.; de Castro, L.A.S.; Schirmer, M.A.; Dias, A.R.G. Effect of Heat-Moisture Treatment on Rice Starch of Varying Amylose Content. Food Chem. 2010, 121, 358–365. [Google Scholar] [CrossRef]
- Mopuri, R.; Kalyesubula, M.; Rosov, A.; Edery, N.; Moallem, U.; Dvir, H. Improved Folch method for liver-fat quantification. Front. Vet. Sci. 2021, 7, 594853. [Google Scholar] [CrossRef]
- Sui, Z.; Yao, T.; Ye, X.; Bao, J.; Kong, X.; Wu, Y. Physicochemical Properties and Starch Digestibility of In-Kernel Heat-Moisture-Treated Waxy, Low-, and High-Amylose Rice Starch. Starch-Stärke 2017, 69, 1600164. [Google Scholar] [CrossRef]
- Lee, C.J.; Kim, Y.; Choi, S.J.; Moon, T.W. Slowly digestible starch from heat-moisture treated waxy potato starch: Preparation, structural characteristics, and glucose response in mice. Food Chem. 2012, 133, 1222–1229. [Google Scholar] [CrossRef]
- Yagi, M.; Takabe, W.; Wickramasinghe, U.; Okuda, F.; Kom, M.; Fujimura, A.; Yonei, Y. Effect of Heat-Moisture-Treated High-Amylose Corn Starch-Containing Food on Postprandial Blood Glucose. Glycative Stress Res. 2018, 5, 151–162. [Google Scholar]
- Wu, T.Y.; Tsai, S.J.; Sun, N.N.; Dai, F.J.; Yu, P.H.; Chen, Y.C.; Chau, C.F. Enhanced Thermal Stability of Green Banana Starch by Heat-Moisture Treatment and Its Ability to Reduce Body Fat Accumulation and Modulate Gut Microbiota. Int. J. Biol. Macromol. 2020, 149, 486–495. [Google Scholar] [CrossRef]
- Liu, X.; Ogawa, H.; Ando, R.; Nakakuki, T.; Kishida, T.; Ebihara, K. Heat-Moisture Treatment of High-Amylose Corn Starch Increases Dietary Fiber Content and Lowers Plasma Cholesterol in Ovariectomized Rats. J. Food Sci. 2007, 72, S652–S658. [Google Scholar] [CrossRef]
- Chambers, K.F.; Day, P.E.; Aboufarrag, H.T.; Kroon, P.A. Polyphenol Effects on Cholesterol Metabolism via Bile Acid Biosynthesis, CYP7A1: A Review. Nutrients 2019, 11, 2588. [Google Scholar] [CrossRef] [Green Version]
- Pullinger, C.R.; Eng, C.; Salen, G.; Shefer, S.; Batta, A.K.; Erickson, S.K.; Kane, J.P. Human Cholesterol 7α-Hydroxylase (CYP7A1) Deficiency Has a Hypercholesterolemic Phenotype. J. Clin. Investig. 2002, 110, 109–117. [Google Scholar] [CrossRef] [PubMed]
- Liu, X.; Ogawa, H.; Kishida, T.; Ebihara, K. The Effect of High-Amylose Cornstarch on Lipid Metabolism in OVX Rats Is Affected by Fructose Feeding. J. Nutr. Biochem. 2010, 21, 89–97. [Google Scholar] [CrossRef] [PubMed]
- Li, M.; Wang, J.; Wang, F.; Strappe, P.; Liu, W.; Zheng, J.; Zhang, Y. Microbiota Fermentation Characteristics of Acylated Starches and the Regulation Mechanism of Short-Chain Fatty Acids on Hepatic Steatosis. Food Funct. 2021, 12, 8659–8668. [Google Scholar] [CrossRef]
- Chu, K.; Miyazaki, M.; Man, W.C.; Ntambi, J.M. Stearoyl-Coenzyme A Desaturase 1 Deficiency Protects against Hypertriglyceridemia and Increases Plasma High-Density Lipoprotein Cholesterol Induced by Liver X Receptor Activation. Mol. Cell. Biol. 2006, 26, 6786–6798. [Google Scholar] [CrossRef] [PubMed] [Green Version]
- Jaceldo-Siegl, K.; Lütjohann, D.; Sirirat, R.; Mashchak, A.; Fraser, G.E.; Haddad, E. Variations in Dietary Intake and Plasma Concentrations of Plant Sterols across Plant-Based Diets among North American Adults. Mol. Nutr. Food Res. 2017, 61, 1600828. [Google Scholar] [CrossRef]
- Jojima, T.; Sakurai, S.; Wakamatsu, S.; Iijima, T.; Saito, M.; Tomaru, T.; Aso, Y. Empagliflozin Increases Plasma Levels of Campesterol, a Marker of Cholesterol Absorption, in Patients with Type 2 Diabetes: Association with a Slight Increase in High-Density Lipoprotein Cholesterol. Int. J. Cardiol. 2021, 331, 243–248. [Google Scholar] [CrossRef]
- Kempen, H.; Glatz, J.F.; Leuven, J.G.; van der Voort, H.A.; Katan, M.B. Serum Lathosterol Concentration Is an Indicator of Whole-Body Cholesterol Synthesis in Humans. J. Lipid Res. 1988, 29, 1149–1155. [Google Scholar] [CrossRef]
- Matsumura, T.; Ishigaki, Y.; Nakagami, T.; Akiyama, Y.; Ishibashi, Y.; Ishida, T.; Shoji, T. Relationship between Diabetes Mellitus and Serum Lathosterol and Campesterol Levels: The CACHE Study DM Analysis. J. Atheroscler. Thromb. 2022, 30, 735–753. [Google Scholar] [CrossRef]
- Nielsen, T.S.; Bendiks, Z.; Thomsen, B.; Wright, M.E.; Theil, P.K.; Scherer, B.L.; Marco, M.L. High-Amylose Maize, Potato, and Butyrylated Starch Modulate Large Intestinal Fermentation, Microbial Composition, and Oncogenic miRNA Expression in Rats Fed a High-Protein Meat Diet. Int. J. Mol. Sci. 2019, 20, 2137. [Google Scholar] [CrossRef] [Green Version]
- Hu, J.; Zheng, P.; Qiu, J.; Chen, Q.; Zeng, S.; Zhang, Y.; Zheng, B. High-amylose corn starch regulated gut microbiota and serum bile acids in high-fat diet-induced obese mice. Int. J. Mol. Sci. 2022, 23, 5905. [Google Scholar] [CrossRef]
- Xie, Z.; Yao, M.; Castro-Mejía, J.L.; Ma, M.; Zhu, Y.; Fu, X.; Zhang, B. Propionylated high-amylose maize starch alleviates obesity by modulating gut microbiota in high-fat diet-fed mice. J. Funct. Foods 2023, 102, 105447. [Google Scholar] [CrossRef]
- Chen, X.; Wang, Z.; Wang, D.; Kan, J. Effects of resistant starch III on the serum lipid levels and gut microbiota of Kunming mice under high-fat diet. Food Sci. Hum. Wellness 2023, 12, 575–583. [Google Scholar] [CrossRef]
- Ze, X.; Duncan, S.H.; Louis, P.; Flint, H.J. Ruminococcus bromii is a keystone species for the degradation of resistant starch in the human colon. ISME J. 2012, 6, 1535–1543. [Google Scholar] [CrossRef] [PubMed] [Green Version]


| Weight/Calories g (kcal) | LA-nHMT | LA-HMT | HA-nHMT | HA-HMT |
|---|---|---|---|---|
| Casein | 24.4 (97.6) | 24.4 (97.6) | 24.4 (97.6) | 24.4 (97.6) |
| D, L-methionine | 0.3 (-) | 0.3 (-) | 0.3 (-) | 0.3 (-) |
| α-cornstarch | 41.2 (164.8) | - | - | - |
| Rice flour | - | 34.7 (140.5) | 34.3 (142.8) | 34.3 (142.8) |
| Carbohydrate | - | 31.8 (127.1) | 30.4 (121.6) | 30.4 (121.6) |
| Protein | - | 2.5 (10.1) | 2.8 (11.2) | 2.8 (11.2) |
| Fat | - | 0.4 (3.3) | 1.1 (10.0) | 1.1 (10.0) |
| Corn oil | 1 (9) | 1 (9) | 1 (9) | 1 (9) |
| Cellulose | 5 (-) | 5 (-) | 5 (-) | 5 (-) |
| AIN-76 mineral mix | 1 (-) | 1 (-) | 1 (-) | 1 (-) |
| AIN-76 vitamin mix | 3.5 (-) | 3.5 (-) | 3.5 (-) | 3.5 (-) |
| Lard | 23.4 (210.6) | 23.4 (210.6) | 23.4 (210.6) | 23.4 (210.6) |
| Sucrose | 0.2 (0.8) | 0.2 (0.8) | 0.2 (0.8) | 0.2 (0.8) |
| Total | 100 (482.8) | 100 (458.5) | 100 (460.8) | 100 (460.8) |
| Weight/Calories g (kcal) | CON | HFD | HMT |
|---|---|---|---|
| Casein | 18.5 (74) | 23.3 (93.2) | 23.0 (92) |
| D, L-methionine | 0.3 (-) | 0.3 (-) | 0.3 (-) |
| Rice flour | 66.5 (249.4) | 43.3 (162.5) | 44 (161.4) |
| Carbohydrate | 58.9 (235.4) | 38.3 (153.3) | 35.3 (141.2) |
| Protein | 3.1 (12.2) | 2 (8) | 2.7 (10.7) |
| Fat | 0.2 (1.8) | 0.13 (1.2) | 1.1 (9.5) |
| Corn oil | 5 (45) | 1 (9) | 1 (9) |
| Cellulose | 5 (-) | 5 (-) | 5 (-) |
| AIN-76 mineral mix | 1 (-) | 1 (-) | 1 (-) |
| AIN-76 vitamin mix | 3.5 (-) | 3.5 (-) | 3.5 (-) |
| Lard | - | 22.4 (201.6) | 22 (198) |
| Sucrose | 0.2 (0.8) | 0.2 (0.8) | 0.2 (0.8) |
| Total | 100 (369.2) | 100 (467.0) | 100 (460.8) |
| Cholesterol | - | 0.25 (-) | 0.25 (-) |
| Organ or Tissue/Biochemical Parameters | LA-nHMT | LA-HMT | HA-nHMT | HA-HMT | Main Effect, nHMT vs. HMT | Main Effect, LA vs. HA | Interaction Effect |
|---|---|---|---|---|---|---|---|
| Liver, g | 11.8 ± 1.4 | 11.2 ± 1.3 | 10.6 ± 0.8 | 10.6 ± 1.2 | p = 0.06 | n.s. | n.s. |
| Total adipose tissue, g | 35.2 ± 4.9 | 32.3 ± 5.5 | 34.1 ± 9.5 | 27.6 ± 2.2 | p = 0.07 | n.s. | n.s. |
| Retroperitoneal fat pad | 11.5 ± 3.3 | 11.3 ± 2.5 | 11.9 ± 3.6 | 9.2 ± 1.4 | n.s. | n.s. | n.s. |
| Mesenteric fat pad | 7.4 ± 1.5 | 7.2 ± 1.0 | 8.1 ± 2.1 | 6.4 ± 0.9 | n.s. | n.s. | n.s. |
| Epididymal fat pad | 13.8 ± 3.9 | 13.8 ± 2.8 | 14.2 ± 4.1 | 11.4 ± 0.9 | n.s. | n.s. | n.s. |
| Total skeletal muscle tissue, g | 5.1 ± 0.6 | 4.9 ± 0.5 | 4.7 ± 0.3 | 4.8 ± 0.3 | n.s. | n.s. | n.s. |
| Gastrocnemius muscle | 4.5 ± 0.7 | 4.3 ± 0.5 | 4.1 ± 0.6 | 4.1 ± 0.3 | n.s. | n.s. | n.s. |
| Soleus muscle | 0.65 ± 0.1 | 0.60 ± 0.1 | 0.65 ± 0.4 | 0.65 ± 0.1 | n.s. | n.s. | n.s. |
| BW, g | 478.9 ± 27.3 | 474.1 ± 29.9 | 463.2 ± 27.5 | 450.3 ± 17.5 | * | n.s. | n.s. |
| Liver/BW, % | 2.5 ± 0.2 | 2.3 ± 0.1 | 2.3 ± 0.1 | 2.4 ± 0.2 | n.s. | n.s. | n.s. |
| Adipose/BW, % | 7.2 ± 0.9 | 6.8 ± 0.9 | 7.3 ± 1.7 | 6.1 ± 0.5 | p = 0.07 | n.s. | n.s. |
| Skeletal Muscle/BW, % | 1.1 ± 0.1 | 1.0 ± 0.1 | 1.0 ± 0.1 | 1.1 ± 0.1 | p = 0.07 | n.s. | n.s. |
| Plasma, TG (mg/dL) | 66.1 ± 25.3 | 53.0 ± 17.8 | 61.1 ± 23.8 | 69.7 ± 24.5 | n.s. | n.s. | n.s. |
| Plasma, T-Cho (mg/dL) | 56.2 ± 8.3 | 62.5 ± 11.0 | 60.4 ± 16.2 | 52.5 ± 12.7 | n.s. | n.s. | n.s. |
| Plasma, HDL-Cho (mg/dL) | 38.6 ± 4.2 | 50.7 ± 8.5 | 50.8 ± 23.6 | 45.3 ± 19.9 | n.s. | n.s. | n.s. |
| Plasma, LDL-Cho (mg/dL) | 17.1 ± 8.0 | 11.7 ± 11.3 | 13.2 ± 7.8 | 7.23 ± 10.4 | n.s. | n.s. | n.s. |
| Liver, TG (mg/g) | 70.7 ± 14.7 | 66.2 ± 6.4 | 51.8 ± 9.8 | 62.5 ± 9.1 | n.s. | * | n.s. |
| Liver, T-Cho (mg/g) | 13.8 ± 2.0 | 12.0 ± 1.4 | 12.6 ± 1.8 | 11.7 ± 0.4 | * | n.s. | n.s. |
| Organ or Tissue | CON | HFD | HMT |
|---|---|---|---|
| Liver, g | 14.9 ± 2.1 | 20.5 ± 2.3 * | 17.2 ± 2.9 |
| Total adipose tissue, g | 30.4 ± 6.5 | 40.2 ± 10.4 * | 34.2 ± 5.3 |
| Retroperitoneal fat pad | 6.3 ± 1.5 | 8.1 ± 2.2 | 6.8 ± 1.5 |
| Mesenteric fat pad | 13.0 ± 2.9 | 16.9 ± 5.4 | 14.4 ± 2.5 |
| Epididymal fat pad | 11.2 ± 2.9 | 15.1 ± 3.5 * | 12.0 ± 2.9 |
| Total skeletal muscle tissue, g | 5.8 ± 0.6 | 6.2 ± 0.5 | 5.5 ± 0.5 |
| Gastrocnemius muscle | 5.4 ± 0.6 | 5.8 ± 0.5 | 5.2 ± 0.5 |
| Soleus muscle | 0.4 ± 0.3 | 0.4 ± 0.1 | 0.4 ± 0.1 |
| BW, g | 464.8 ± 44.9 | 524.3 ± 57.9 *# | 468.7 ± 37.5 |
| Liver/BW, % | 3.2 ± 0.2 | 3.9 ± 0.2 *** | 3.6 ± 0.4 ** |
| Adipose/BW, % | 6.5 ± 1.1 | 7.6 ± 1.2 (p = 0.05, vs. CON) | 7.2 |
| Skeletal Muscle/BW, % | 1.3 ± 0.1 | 1.2 ± 0.1 | 1.2 ± 0.1 |
| Metabolites | HFD vs. CON | HMT vs. CON | HMT vs. HFD | |||
|---|---|---|---|---|---|---|
| Ratio | p-Value | Ratio | p-Value | Ratio | p-Value | |
| Campesterol/Cholesterol Lathosterol/ Cholesterol | 0.2 2.9 | 0.006 < 0.001 | 0.4 2.4 | 0.019 0.140 | 1.9 0.8 | 0.004 0.430 |
| Probe | Gene | Log Ratio |
|---|---|---|
| Fasn | fatty acid synthase | −1.62 |
| Gpat3 | Glycerol-3-phosphate O-acyltransferase 3 | −0.92 |
| Lpin1 | lipin1 | −0.90 |
| Fabp5 | fatty acid binding protein 5, epidermal | −0.81 |
| Aldh1b1 | aldehyde dehydrogenase 1 family, member B1 | −0.77 |
| Scd1 | Stearoyl-Coenzyme A desaturase | −0.71 |
| Acly | ATP citrate lyase | −0.70 |
| Cd14 | CD14 molecule | 0.59 |
| Fmo5 | flavin containing monooxygenase 5 | −0.36 |
Disclaimer/Publisher’s Note: The statements, opinions and data contained in all publications are solely those of the individual author(s) and contributor(s) and not of MDPI and/or the editor(s). MDPI and/or the editor(s) disclaim responsibility for any injury to people or property resulting from any ideas, methods, instructions or products referred to in the content. |
© 2023 by the authors. Licensee MDPI, Basel, Switzerland. This article is an open access article distributed under the terms and conditions of the Creative Commons Attribution (CC BY) license (https://creativecommons.org/licenses/by/4.0/).
Share and Cite
Ma, S.; Takasugi, S.; Sugawara, M.; Saito, K.; Jia, H.; Kato, H. Effects of Heat-Moisture-Treated High-Amylose Rice Flour on Body Weight, Lipid Metabolism, and Gut Microbiome Composition in Obese Rats. Metabolites 2023, 13, 858. https://doi.org/10.3390/metabo13070858
Ma S, Takasugi S, Sugawara M, Saito K, Jia H, Kato H. Effects of Heat-Moisture-Treated High-Amylose Rice Flour on Body Weight, Lipid Metabolism, and Gut Microbiome Composition in Obese Rats. Metabolites. 2023; 13(7):858. https://doi.org/10.3390/metabo13070858
Chicago/Turabian StyleMa, Sihui, Sae Takasugi, Masayoshi Sugawara, Kenji Saito, Huijuan Jia, and Hisanori Kato. 2023. "Effects of Heat-Moisture-Treated High-Amylose Rice Flour on Body Weight, Lipid Metabolism, and Gut Microbiome Composition in Obese Rats" Metabolites 13, no. 7: 858. https://doi.org/10.3390/metabo13070858