
Kinetic Modeling of Saccharomyces cerevisiae Central Carbon Metabolism: Achievements, Limitations, and Opportunities

 , , , and
Abstract
:1. Introduction
- Reaction rate constant, : is determined by the catalytic constant and enzyme concentration ( = ·). Thus, it varies as the cell changes its enzyme concentration in different environments.
- Catalytic constant, : indicative of how fast the reaction can go. Values in yeast models have been found as high as 5 · 102 s−1 [16].
- Equilibrium constants, : Values are found in the range 10−5–103 [17].
- Hill exponents, : specific of reactions with hill kinetics.
- Additionally, enzymes can contain allosteric activation or inhibition
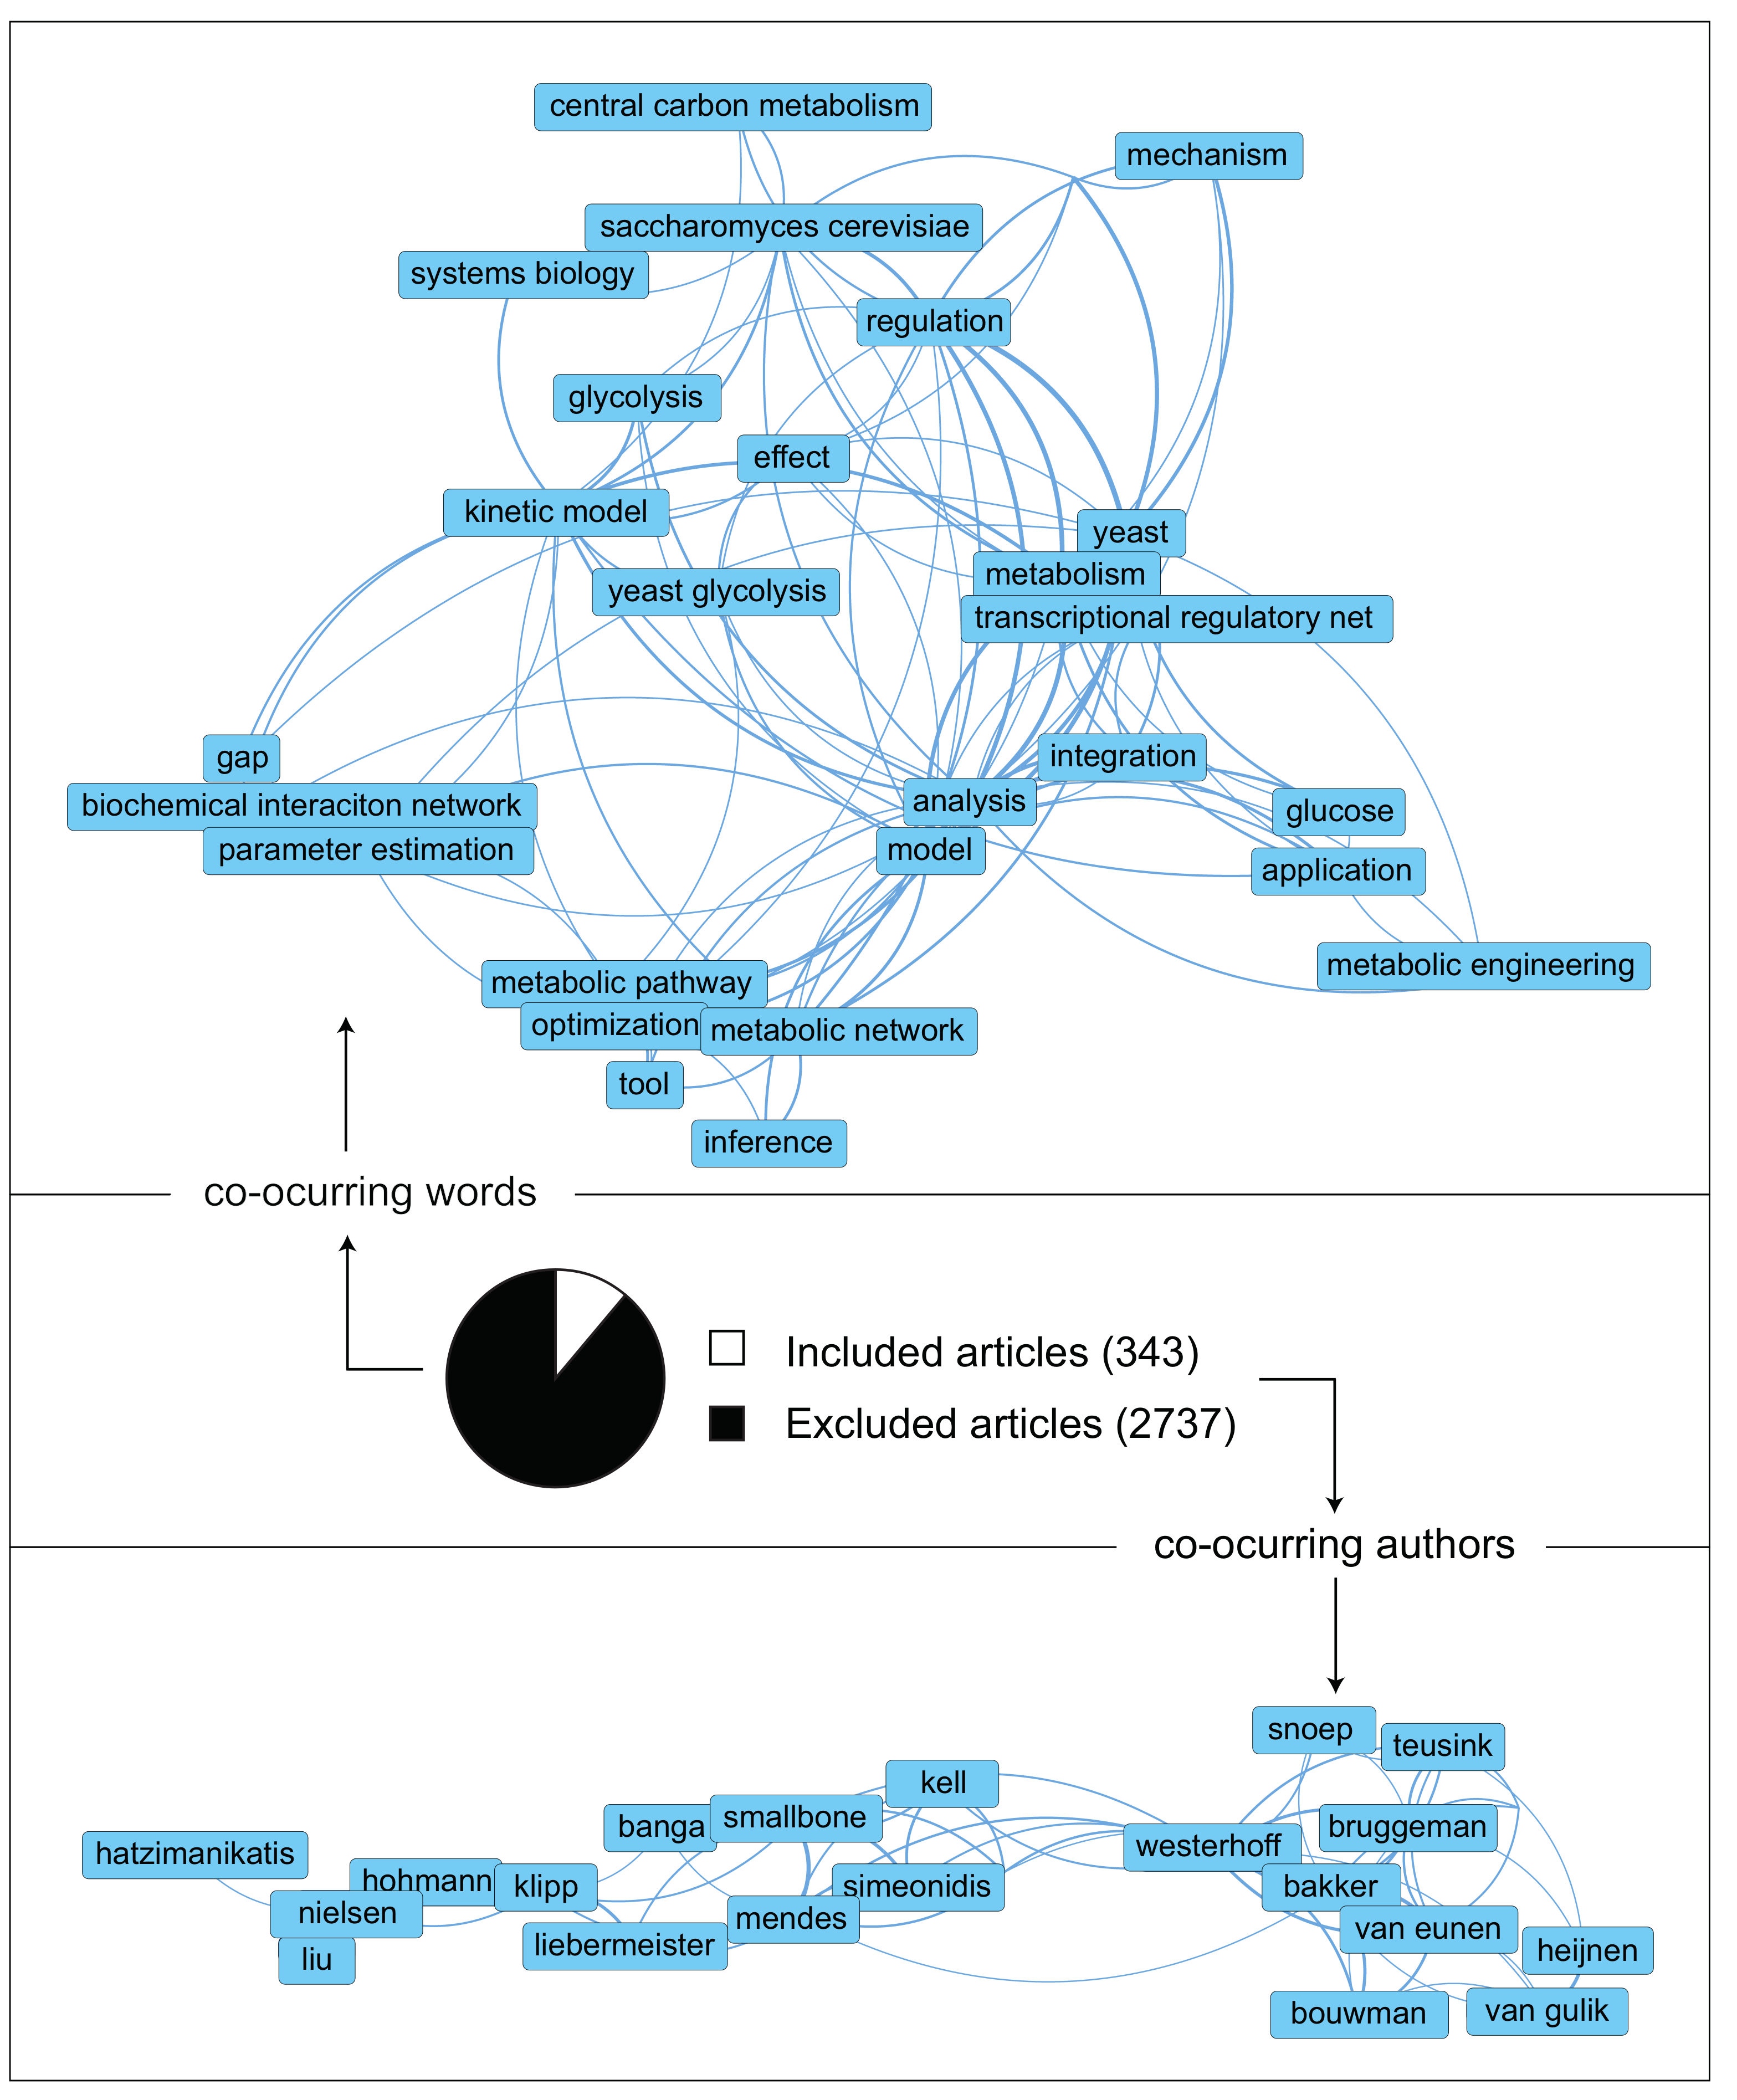
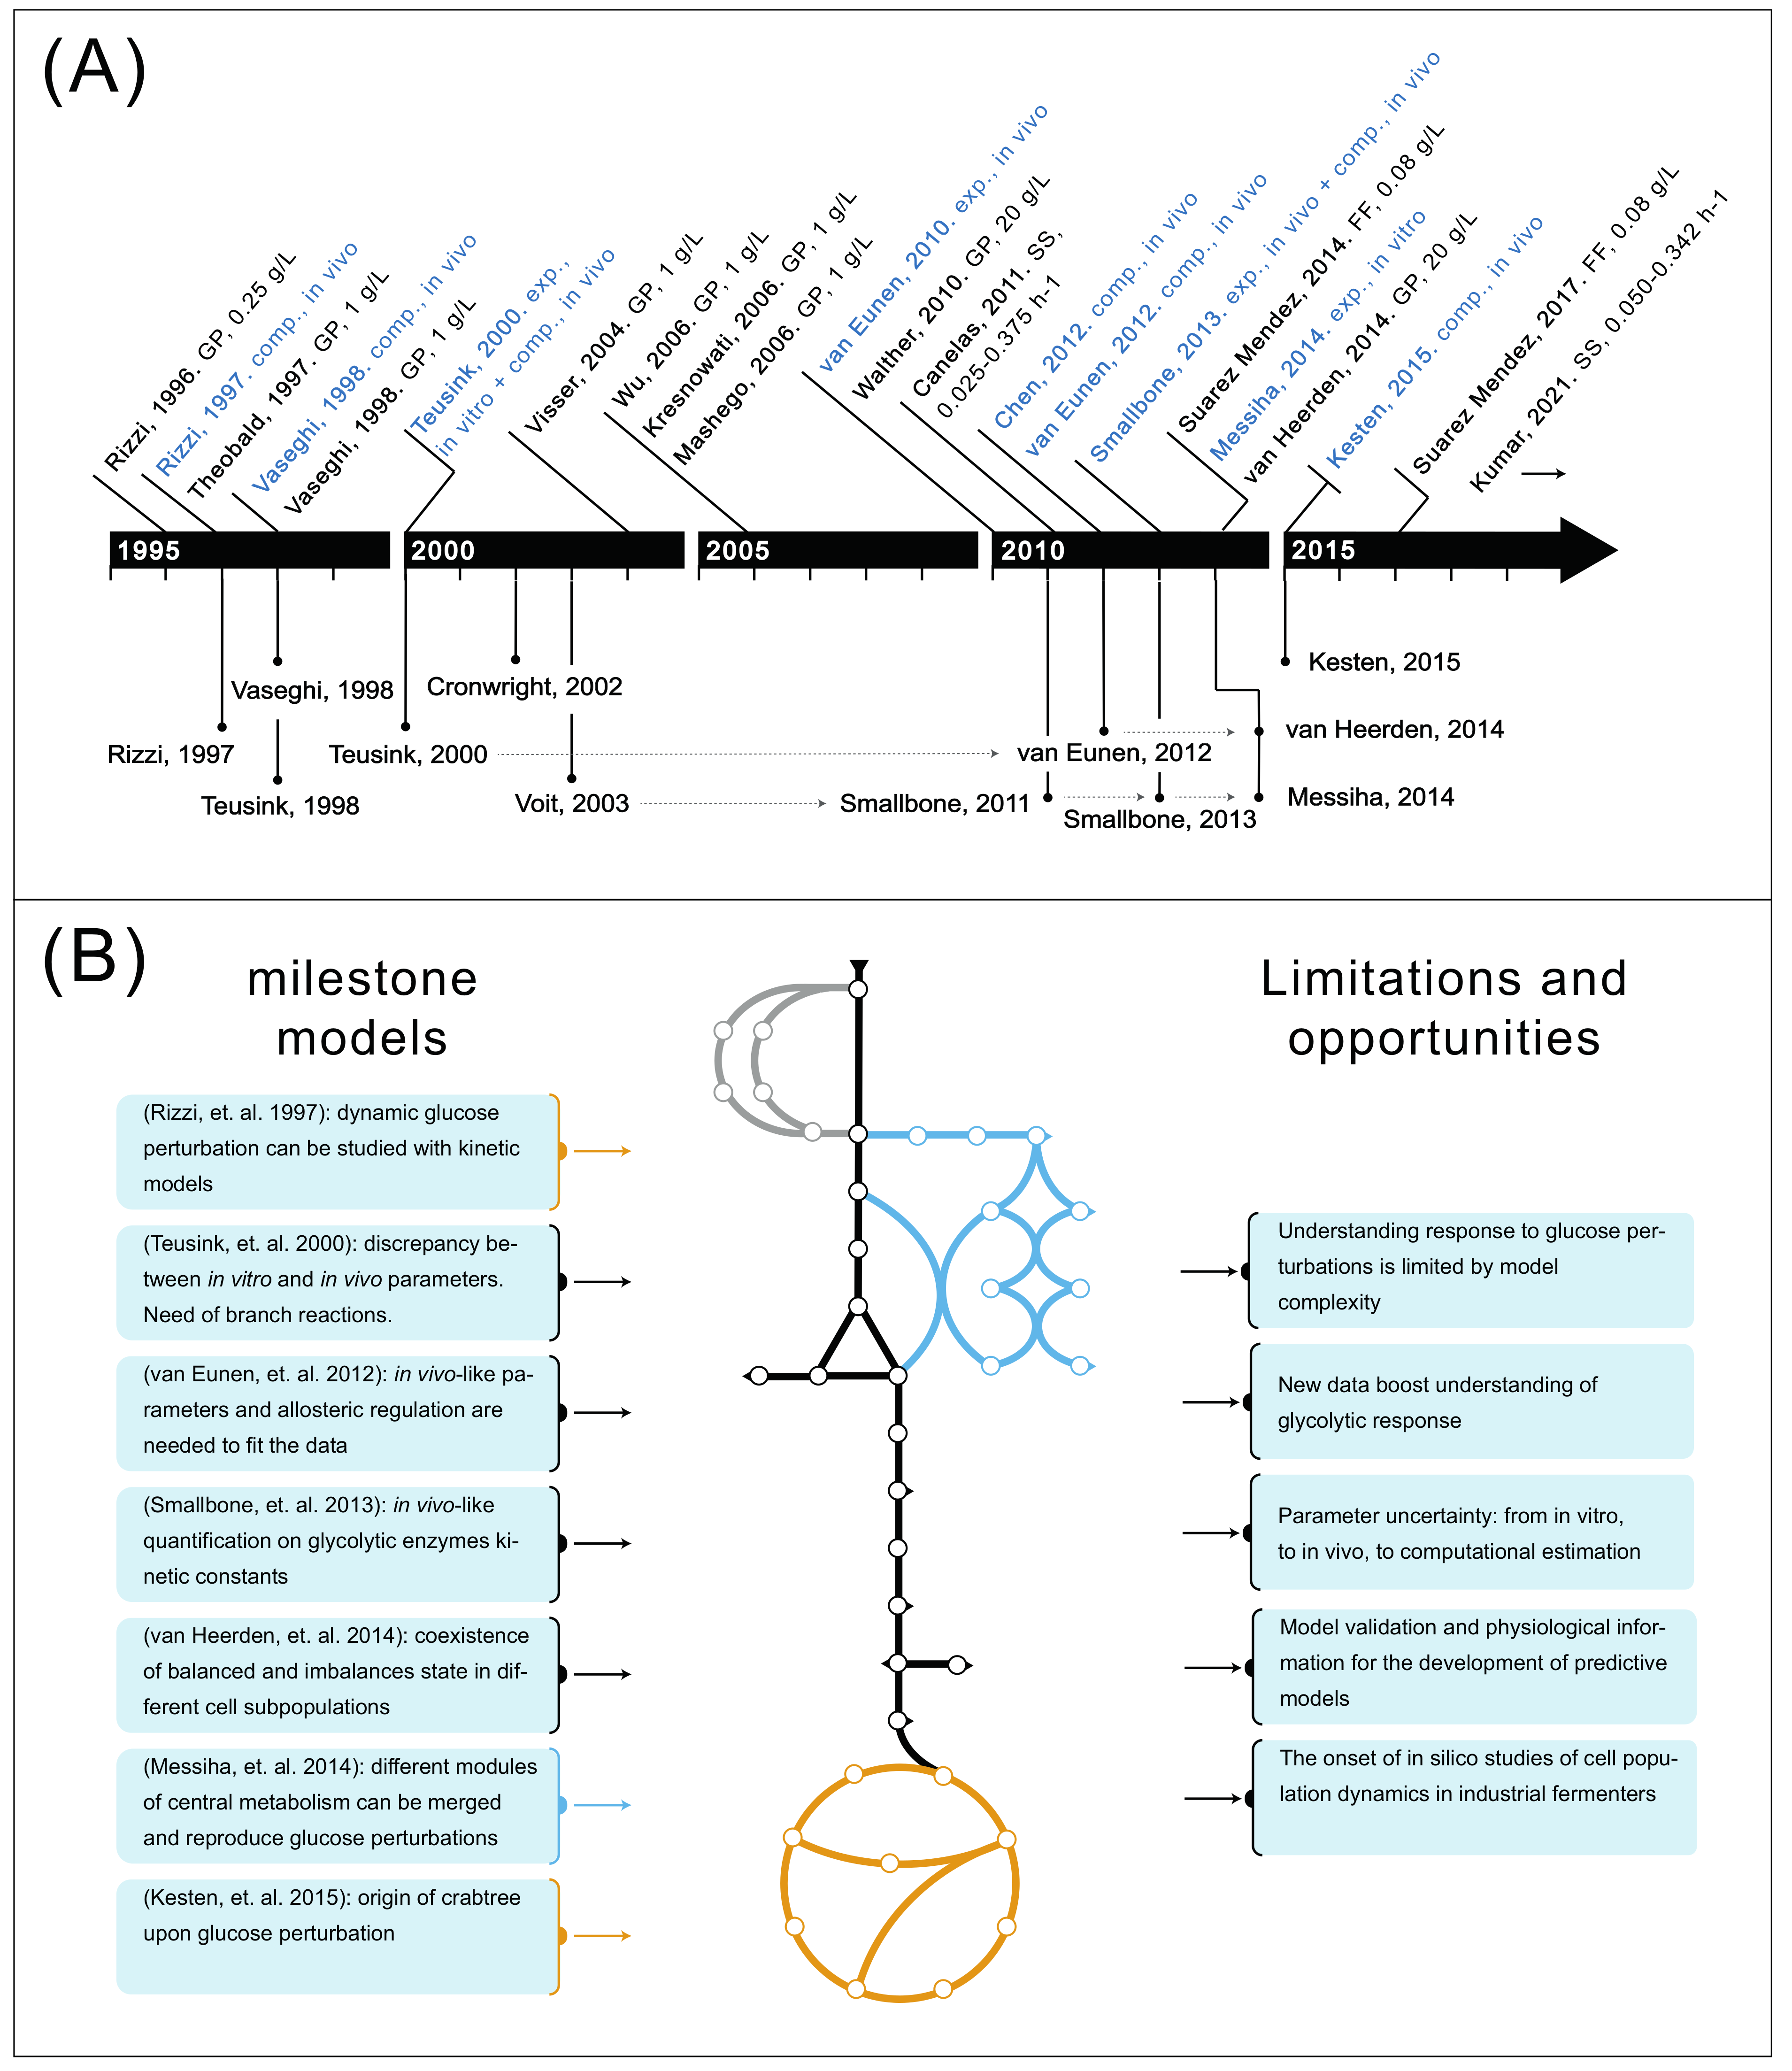
2. The Literature Collected Point at an Increasing Complexity in Both Data and Models
3. Glycolytic Response to Glucose Perturbations in Yeast Fermentations
4. The Development of Metabolic Models Has Resulted in Understanding of Key Glycolytic Properties

| Rizzi et al. [19] | Teusink et al. [82] | Teusink et al. [22] | van Eunen et al. [17] | |
|---|---|---|---|---|
| Contribution to glycolytic understanding | Dynamic models can accurately describe glucose perturbation. | ATP surplus can cause the observed overactivation of initial glycolytic steps in DTps1 mutant strains. | In vivo behavior cannot be predicted with in vitro kinetics. | Implementation of allosteric regulation and in vivo measured parameter values is necessary to reproduce GP data. |
| GLYCO | Individual + branch reactions (++) | Lumped reactions (+) | Individual + branch reactions (++) | Individual + branch reactions (++) |
| TRE | N/A | N/A | N/A | T6P regulation (+) |
| TCA | Individual reactions (++) | N/A | N/A | N/A |
| PPP | N/A | N/A | N/A | N/A |
| Cofactors | Conservation moiety (+) | Conservation moiety (+) | Conservation moiety (+) | Conservation moiety (+) |
| Parameters | Computational, in vivo (++) | Computational, toy model (+) | Computational, in vivo (++) | Experimental and computational, in vivo (++) |
| Data | Single GP experiment (++) | Single GP, toy data (+) | SS data point (+) | Single GP experiment and multiple SS (+++) |
| Smallbone et al. [16] | Van Heerden et al. [18] | Messiha et al. [33] | Kesten et al. [20] | |
| Contribution to glycolytic understanding | Broad quantification of enzymatic kinetic constants in in vivo-like conditions. | Glycolytic dynamics combined with cell heterogeneity determine cell fate. | Feasibility of constructing larges network models by merging smaller pathway models. | Cooperativity PYK-PYR and ADH-PDH bypass play a major role in the onset of the Crabtree effect. |
| GLYCO | Individual + branch reactions + isozymes (+++) | Individual + branch reactions (++) | Individual + branch reactions (++) | Individual + branch reactions (++) |
| TRE | N/A | T6P regulation (+) | N/A | N/A |
| TCA | N/A | N/A | N/A | Individual reactions (++) |
| PPP | N/A | N/A | Individual reactions (++) | N/A |
| Cofactors | Conservation moiety (+) | Conservation moiety + dynamic Pi (++) | Conservation moiety (+) | Conservation moiety (+) |
| Parameters | Experimental, in vivo (++) | Experimental, in vivo (++) | Experimental, in vivo (++) | Computational, in vivo (++) |
| Data | N/A | Single GP experiment (++) | Single GP experiment (++) | Single GP experiment (++) |
5. From Glycolysis to Central Carbon Metabolism: Understanding Response to Glucose Perturbations Is Limited by Model Complexity
6. New Intracellular Metabolomic and Fluxomic Data Boost Understanding of Glycolytic Response
| Rizzi et al. [25] | Theobald et al. [26] | Vaseghi et al. [21] | Visser et al. [27] | |
|---|---|---|---|---|
| Glucose input regime | Glucose-limited to glucose pulse (0.25 g L−1) | Glucose-limited to glucose pulse (1 g L−1) | Glucose-limited to glucose pulse (1 g L−1) | Glucose-limited to glucose pulse (1 g L−1) |
| Experimental setup | 30 °C, pH5, aerobic, D = 0.1 h−1, STR, direct sampling | 30 °C, pH5, aerobic, D = 0.1 h−1, STR, direct sampling | 30 °C, pH5, aerobic, D = 0.1 h−1, STR, direct sampling | 30 °C, pH5, aerobic, D = 0.05 h−1, STR, BioScope sampling |
| Duration | 500 s | 180 s | 180 s | 80 s |
| Strain | CBS 7336 (ATCC 32167) | CBS 7336 (ATCC 32167) | CBS 7336 (ATCC 32167) | CEN.PK113-7D |
| Measurement technique | Enzymatic assay | Enzymatic assay: metabolites, NAD(H) HPLC: adenine nucleotides | Enzymatic assay: metabolites, NAD(H) | Enzymatic assay: ATP, NADX and G6P MS: glycolytic intermediates |
| Intracellular variables measured | GLYCO: G6P. | GLYCO: G6P, F6P, FBP, GAP, 3PG, PEP, PYR. NUC: NAD(H), AXP (whole cell and cytoplasmic). Pi. | GLYCO: G6P, F6P. PPP: 6PG. NUC: NADP(H). | GLYCO: G6P, F6P, G1P, FBP, 2GP+3PG, PEP, PYR. NUC: ATP, NADX. |
| Glucose input regime | Glucose-limited to glucose pulse (1 g L−1) | Glucose-limited to glucose pulse (1 g L−1) | Glucose-limited to glucose pulse (1 g L−1) | Trehalose-limited to glucose pulse (20 g L−1) |
| Experimental setup | 30 °C, pH5, aerobic, D = 0.05 h−1, STR, BioScope sampling | 30 °C, pH5, aerobic, D = 0.05 h−1, STR, BioScope sampling | 30 °C, pH5, aerobic, D = 0.05 h−1, STR, direct sampling | 30 °C, pH4.8, aerobic, SF, direct sampling. |
| Duration | 180 s | 180 s | 300 s | 30 min |
| Strain | CEN.PK113-7D | CEN.PK113-7D | CEN.PK113-7D | BY4741 |
| Measurement technique | MS | Enzymatic analysis: NAD(H) MS | MS | MS |
| Intracellular variables measured | GLYCO: G6P, F6P, FBP, 2/3PG, PEP, PYR. TCA: ISOCIT, FUM, MAL, AKG, SUC. PPP: 6PG. TRE: G1P, T6P, TRE. NUC: AXP, NADH:NAD ratio. | GLYCO: G6P, F6P, F1,6P2, F2,6P2, 2/3PG, PEP. TCA: ISOCIT, AKG, SUC, FUM, MAL. PPP: 6PG. TRE: G1P, T6P. NUC: AXP, NADH:NAD ratio. | GLYCO: G6P, F6P, F1,6P2, F2,6P2, 2/3PG, PEP. TCA: ISOCIT, AKG, SUC, FUM, MAL. PPP: 6PG. TRE: G1P, T6P. NUC: AXP, NADH:NAD ratio. AAs. | GLYCO: G6P, F6P, FBP, G3P, 2/3PG, PEP. TCA: AKG, MAL. PPP: 6PG, R5P, R1P. TRE: T6P, G1P. NUC: ATP, ADP, AMP, IMP, INO, HYP, GTP, GDP, GMP. |
| Van Heerden et al. [18] | Suarez-Mendez et al. [36], Suarez-Mendez et al. [37] | Canelas et al. [34] | Kumar et al. [35] | |
| Glucose input regime | Glucose-limited to glucose pulse (20 g L−1) | Glucose-limited to feast–famine cycles (0.08 g L−1 max.) | Glucose-limited. Dilution rates from 0.025 to 0.375 h−1 | Glucose-limited. Dilution rates from 0.050 to 0.342 h−1 |
| Experimental setup | 30 °C, pH5, aerobic, D = 0.1 h−1, STR, BioScope sampling | 30 °C, pH5, aerobic, D = 0.1 h−1, STR, direct sampling | 30 °C, pH5, aerobic, STR, direct sampling | 30 °C, pH5, aerobic, STR, direct sampling |
| Duration | 340 s | 400 s | N/A (ss) | N/A (ss) |
| Strain | CEN.PK113-7D | CEN.PK113-7D | CEN.PK113-7D,mtlD1 | CEN.PK113-7D |
| Measurement technique | MS Reaction rates calculated by piecewise affine approximation (13C data) | MS Reaction rates calculated by piecewise affine approximation (13C data) | MS Reaction rates calculated with a stoichiometric model | MS |
| Intracellular variables measured | GLYCO: G6P, F6P, FBP. TRE: G1P, UDPG, T6P, TRE. PPP: 6PG. NUC: AXP, cAMP, UXP, GXP. Fluxes within glycolysis and trehalose cycle. | GLYCO: G6P, F6P, FBP, G3P, GLYC, DHAP, GAP, 2PG, 3PG, PEP, PYR. TCA: CIT, FUM, ISOCIT, MAL, AKG, SUC. PPP: 6PG, E4P, R5P, RBUP5, S7P, X5P. TRE: G1P, UDPG, T6P, TRE. NUC: AXP. Fluxes within glycolysis and trehalose cycle. | GLYCO: G6P, F6P, FBP, F26BP, G3P, DHAP, GAP, 2PG, 3PG, PEP, PYR. TCA: CIT, FUM, ISOCIT, MAL, OAA, SUC. PPP: 6PG, E4P, R5P, RBUP5, S7P, X5P. TRE: G1P, T6P, TRE. NUC: AXP, UXP, cAMP, NAD:NADH ratio. AAs. Fluxes within glycolysis. | GLYCO: G6P, F6P, FBP, G3P, DHAP, 2/3PG, PEP, PYR. TCA: CIT, FUM, OAA, ISOCIT, MAL, AKG, SUC. PPP: 6PG, R5P, RBUP5, S7P. TRE: G1P, UDPG. NUC: AXP, GXP, IXP, TXP, UXP, dAXP, dGXP, dUXP. AAs. |
7. Parameter Uncertainty: From In Vitro, to In Vivo, to Computational Estimation
| Teusink et al. [22] | Messiha et al. [33] | van Eunen et al. [32] | Smallbone et al. [16] | |
|---|---|---|---|---|
| Parameter estimation | Experimental, in vitro | Experimental, in vitro | Experimental, in vivo | Experimental, in vivo |
| Type of constant | , | , | ||
| Pathway | GLYCO | PPP | GLYCO | GLYCO |
| Experimental condition | Enzymatic assay. Enzyme-specific | Enzymatic assay. Enzyme-specific | Enzymatic assay. Cytosol-like | Enzymatic assay. Cytosol-like |
| Rizzi et al. [19] | Vaseghi et al. [21] | Teusink et al. [22] | van Eunen et al. [17] | |
| Parameter estimation | Computational, in vivo | Computational, in vivo | Computational, in vivo | Computational, in vivo |
| Type of constant | , | |||
| Pathway | GLYCO, TCA | PPP | GLYCO | GLYCO (GAPDH) |
| Experimental condition | GP (1 g L−1) | GP (1 g L−1) | SS (0.1 h−1) | GP (1 g L−1) |
| Chen et al. [118] | Smallbone et al. [16] | Kesten et al. [20] | ||
| Parameter estimation | Computational, in vivo | Computational, in vivo | Computational, in vivo | |
| Type of constant | , | |||
| Pathway | GLYCO | TRE | GLYCO, PPP, TCA | |
| Experimental condition | SS (0.1 h−1) | SS (0.1 h−1) | Either SS (0.1 h−1) or GP (1 g L−1) |
8. Model Validation and Inclusion of Physiological Variables Regulating Glycolysis Are Needed for the Development of Predictive Models
9. The Onset of In Silico Studies of Cell Population Dynamics in Industrial Fermenters
10. Conclusions
11. Methods
Author Contributions
Funding
Acknowledgments
Conflicts of Interest
Abbreviations
| CCM | Central Carbon Metabolism |
| ODE | Ordinary Differential Equation |
| FAIR | Findability, Accessibility, Interoperability, and Reuse |
| TCA | TriCarboxylic Acid |
| GP | Glucose Perturbation |
| PPP | Pentose Phosphate Pathway |
| SS | Steady State |
| FF | Feast–Famine |
| HXK | Hexokinase |
| PYK | Pyruvate Kinase |
| FBP | Fructose-1,6-bis-phosphate |
| PFK | Phosphofructokinase |
| PKA | Protein Kinase A |
| PTM | Post-Translational Modification |
| GLT | Glucose Transporter |
| O2 | Oxygen |
| CO2 | Carbon Dioxide |
| GAPDH | Glyceraldehyde 3-phosphate dehydrogenase |
| NMR | Nuclear Magnetic Resonance |
| MS | Mass Spectroscopy |
| MLE | Maximum Likelihood Estimation |
| CFD | Computational Fluid Dynamics |
References
- Nielsen, J.; Larsson, C.; van Maris, A.; Pronk, J. Metabolic engineering of yeast for production of fuels and chemicals. Curr. Opin. Biotechnol. 2013, 24, 398–404. [Google Scholar] [CrossRef]
- Attfield, P.V. Stress tolerance: The key to effective strains of industrial baker’s yeast. Nat. Biotechnol. 1997, 15, 1351–1357. [Google Scholar] [CrossRef] [PubMed]
- Enfors, S.O.; Jahic, M.; Rozkov, A.; Xu, B.; Hecker, M.; Jürgen, B.; Krüger, E.; Schweder, T.; Hamer, G.; O’Beirne, D.; et al. Physiological responses to mixing in large scale bioreactors. J. Biotechnol. 2001, 85, 175–185. [Google Scholar] [CrossRef]
- Haringa, C.; Tang, W.; Deshmukh, A.T.; Xia, J.; Reuss, M.; Heijnen, J.J.; Mudde, R.F.; Noorman, H.J. Euler-Lagrange computational fluid dynamics for (bio)reactor scale down: An analysis of organism lifelines. Eng. Life Sci. 2016, 16, 652–663. [Google Scholar] [CrossRef] [Green Version]
- Frick, O.; Wittmann, C. Characterization of the metabolic shift between oxidative and fermentative growth in Saccharomyces cerevisiae by comparative 13C flux analysis. Microb. Cell Fact. 2005, 4, 30. [Google Scholar] [CrossRef] [PubMed] [Green Version]
- Almquist, J.; Cvijovic, M.; Hatzimanikatis, V.; Nielsen, J.; Jirstrand, M. Kinetic models in industrial biotechnology—Improving cell factory performance. Metab. Eng. 2014, 24, 38–60. [Google Scholar] [CrossRef]
- Krebs, O.; Wolstencroft, K.; Owen, S.; Nguyen, Q.; Stanford, N.J.; Golebiewski, M.; Weidemann, A.; Bittkowski, M.; An, L.; Shockley, D.; et al. SEEK: A systems biology data and model management platform. BMC Syst. Biol. 2015, 9, 2–3. [Google Scholar] [CrossRef]
- Wilkinson, M.D.; Dumontier, M.; Aalbersberg, I.J.; Appleton, G.; Axton, M.; Baak, A.; Blomberg, N.; Boiten, J.W.; da Silva Santos, L.B.; Bourne, P.E.; et al. Comment: The FAIR Guiding Principles for scientific data management and stewardship. Sci. Data 2016, 3, 160018. [Google Scholar] [CrossRef] [Green Version]
- Malik-Sheriff, R.S.; Glont, M.; Nguyen, T.V.; Tiwari, K.; Roberts, M.G.; Xavier, A.; Vu, M.T.; Men, J.; Maire, M.; Kananathan, S.; et al. BioModels-15 years of sharing computational models in life science. Nucleic Acids Res. 2020, 48, D407–D415. [Google Scholar] [CrossRef] [Green Version]
- Singh, S. How to Conduct and Interpret Systematic Reviews and Meta-Analyses. Clin. Transl. Gastroenterol. 2017, 8, e93. [Google Scholar] [CrossRef]
- Taran, S.; Trivedi, V.; Singh, J.M.; English, S.W.; McCredie, V.A. The use of standardized management protocols for critically ill patients with non-traumatic subarachnoid hemorrhage: A protocol of a systematic review and meta-analysis. Syst. Rev. 2018, 7, 53. [Google Scholar] [CrossRef] [PubMed] [Green Version]
- Zanganeh, M.; Adab, P.; Li, B.; Frew, E. Protocol for a systematic review of methods and cost-effectiveness findings of economic evaluations of obesity prevention and/or treatment interventions in children and adolescents. Syst. Rev. 2018, 7, 54. [Google Scholar] [CrossRef] [PubMed] [Green Version]
- Gábor, A.; Banga, J.R. Robust and efficient parameter estimation in dynamic models of biological systems. BMC Syst. Biol. 2015, 9, 74. [Google Scholar] [CrossRef] [PubMed] [Green Version]
- Villaverde, A.F.; Fröhlich, F.; Weindl, D.; Hasenauer, J.; Banga, J.R. Benchmarking optimization methods for parameter estimation in large kinetic models. Bioinformatics 2019, 35, 830–838. [Google Scholar] [CrossRef]
- Cornish-Bowden, A. Fundamentals of Enzyme Kinetics; John Wiley & Sons: VCH, Weinheim, Germany, 2013. [Google Scholar]
- Smallbone, K.; Messiha, H.L.; Carroll, K.M.; Winder, C.L.; Malys, N.; Dunn, W.B.; Murabito, E.; Swainston, N.; Dada, J.O.; Khan, F.; et al. A model of yeast glycolysis based on a consistent kinetic characterisation of all its enzymes. FEBS Lett. 2013, 587, 2832–2841. [Google Scholar] [CrossRef]
- van Eunen, K.; Kiewiet, J.A.; Westerhoff, H.V.; Bakker, B.M. Testing biochemistry revisited: How in vivo metabolism can be understood from in vitro enzyme kinetics. PLoS Comput. Biol. 2012, 8, e1002483. [Google Scholar] [CrossRef]
- Van Heerden, J.H.; Wortel, M.T.; Bruggeman, F.J.; Heijnen, J.J.; Bollen, Y.J.; Planqué, R.; Hulshof, J.; O’Toole, T.G.; Wahl, S.A.; Teusink, B. Lost in transition: Start-up of glycolysis yields subpopulations of nongrowing cells. Science 2014, 343, 6174. [Google Scholar] [CrossRef]
- Rizzi, M.; Baltes, M.; Theobald, U.; Reuss, M. In vivo analysis of metabolic dynamics in Saccharomyces cerevisiae: II. Mathematical model. Biotechnol. Bioeng. 1997, 55, 592–608. [Google Scholar] [CrossRef]
- Kesten, D.; Kummer, U.; Sahle, S.; Hübner, K. A new model for the aerobic metabolism of yeast allows the detailed analysis of the metabolic regulation during glucose pulse. Biophys. Chem. 2015, 206, 40–57. [Google Scholar] [CrossRef]
- Vaseghi, S.; Baumeister, A.; Rizzi, M.; Reuss, M. In vivo dynamics of the pentose phosphate pathway in Saccharomyces cerevisiae. Metab. Eng. 1999, 1, 128–140. [Google Scholar] [CrossRef]
- Teusink, B.; Passarge, J.; Reijenga, C.A.; Esgalhado, E.; van der Weijden, C.C.; Schepper, M.; Walsh, M.C.; Bakker, B.M.; van Dam, K.; Westerhoff, H.V.; et al. Can yeast glycolysis be understood in terms of in vitro kinetics of the constituent enzymes? Testing biochemistry. Eur. J. Biochem. 2000, 267, 5313–5329. [Google Scholar] [CrossRef] [PubMed]
- Hynne, F.; Danø, S.; Sørensen, P. Full-scale model of glycolysis in Saccharomyces cerevisiae. Biophys. Chem. 2001, 94, 121–163. [Google Scholar] [CrossRef]
- Voit, E.O. Biochemical and genomic regulation of the trehalose cycle in yeast: Review of observations and canonical model analysis. J. Theor. Biol. 2003, 223, 55–78. [Google Scholar] [CrossRef]
- Rizzi, M.; Theobald, U.; Querfurth, E.; Rohrhirsch, T.; Baltes, M.; Reuss, M. In vivo investigations of glucose transport in Saccharomyces cerevisiae. Biotechnol. Bioeng. 1996, 49, 316–327. [Google Scholar] [CrossRef]
- Theobald, U.; Mailinger, W.; Baltes, M.; Rizzi, M.; Reuss, M. In vivo analysis of metabolic dynamics in Saccharomyces cerevisiae: I. Experimental observations. Biotechnol. Bioeng. 1997, 55, 305–316. [Google Scholar] [CrossRef]
- Visser, D.; van Zuylen, G.A.; van Dam, J.C.; Eman, M.R.; Pröll, A.; Ras, C.; Wu, L.; van Gulik, W.M.; Heijnen, J.J. Analysis of in vivo kinetics of glycolysis in aerobic Saccharomyces cerevisiae by application of glucose and ethanol pulses. Biotechnol. Bioeng. 2004, 88, 157–167. [Google Scholar] [CrossRef]
- Wu, L.; Van Dam, J.; Schipper, D.; Kresnowati, M.; Proell, A.M.; Ras, C.; Van Winden, W.A.; Van Gulik, W.M.; Heijnen, J.J. Short-term metabolome dynamics and carbon, electron, and ATP balances in chemostat-grown Saccharomyces cerevisiae CEN.PK 113-7D following a glucose pulse. Appl. Environ. Microbiol. 2006, 72, 3566–3577. [Google Scholar] [CrossRef] [Green Version]
- Kresnowati, M.T.; Van Winden, W.A.; Almering, M.J.; Ten Pierick, A.; Ras, C.; Knijnenburg, T.A.; Daran-Lapujade, P.; Pronk, J.T.; Heijnen, J.J.; Daran, J.M. When transcriptome meets metabolome: Fast cellular responses of yeast to sudden relief of glucose limitation. Mol. Syst. Biol. 2006, 2, 49. [Google Scholar] [CrossRef] [PubMed]
- Mashego, M.R.; Van Gulik, W.M.; Heijnen, J.J. Metabolome dynamic responses of Saccharomyces cerevisiae to simultaneous rapid perturbations in external electron acceptor and electron donor. FEMS Yeast Res. 2007, 7, 48–66. [Google Scholar] [CrossRef] [Green Version]
- Walther, T.; Novo, M.; Rössger, K.; Létisse, F.; Loret, M.O.; Portais, J.C.; François, J.M. Control of ATP homeostasis during the respiro-fermentative transition in yeast. Mol. Syst. Biol. 2010, 6, 344. [Google Scholar] [CrossRef]
- van Eunen, K.; Bouwman, J.; Daran-Lapujade, P.; Postmus, J.; Canelas, A.B.; Mensonides, F.I.C.; Orij, R.; Tuzun, I.; van den Brink, J.; Smits, G.J.; et al. Measuring enzyme activities under standardized in vivo-like conditions for systems biology. FEBS J. 2010, 277, 749–760. [Google Scholar] [CrossRef] [Green Version]
- Messiha, H.L.; Kent, E.; Malys, N.; Carroll, K.M.; Swainston, N.; Mendes, P.; Smallbone, K. Enzyme characterisation and kinetic modelling of the pentose phosphate pathway in yeast. PeerJ 2014, 2, e146v4. [Google Scholar] [CrossRef]
- Canelas, A.B.; Ras, C.; ten Pierick, A.; van Gulik, W.M.; Heijnen, J.J. An in vivo data-driven framework for classification and quantification of enzyme kinetics and determination of apparent thermodynamic data. Metab. Eng. 2011, 13, 294–306. [Google Scholar] [CrossRef] [PubMed]
- Kumar, K.; Venkatraman, V.; Bruheim, P. Adaptation of central metabolite pools to variations in growth rate and cultivation conditions in Saccharomyces cerevisiae. Microb. Cell Fact. 2021, 20, 64. [Google Scholar] [CrossRef] [PubMed]
- Suarez-Mendez, C.; Sousa, A.; Heijnen, J.; Wahl, A. Fast “Feast/Famine” Cycles for Studying Microbial Physiology Under Dynamic Conditions: A Case Study with Saccharomyces cerevisiae. Metabolites 2014, 4, 347–372. [Google Scholar] [CrossRef] [PubMed]
- Suarez-Mendez, C.A.; Ras, C.; Wahl, S.A. Metabolic adjustment upon repetitive substrate perturbations using dynamic13C-tracing in yeast. Microb. Cell Fact. 2017, 16, 161. [Google Scholar] [CrossRef] [Green Version]
- Parapouli, M.; Vasileiadis, A.; Afendra, A.S.; Hatziloukas, E. Saccharomyces cerevisiae and its industrial applications. AIMS Microbiol. 2020, 6, 1–31. [Google Scholar] [CrossRef]
- Hong, K.K.; Nielsen, J. Metabolic engineering of Saccharomyces cerevisiae: A key cell factory platform for future biorefineries. Cell. Mol. Life Sci. 2012, 69, 2671–2690. [Google Scholar] [CrossRef]
- Steensels, J.; Snoek, T.; Meersman, E.; Nicolino, M.P.; Voordeckers, K.; Verstrepen, K.J. Improving industrial yeast strains: Exploiting natural and artificial diversity. FEMS Microbiol. Rev. 2014, 38, 947–995. [Google Scholar] [CrossRef] [Green Version]
- Crater, J.S.; Lievense, J.C. Scale-up of industrial microbial processes. FEMS Microbiol. Lett. 2018, 365, fny138. [Google Scholar] [CrossRef]
- Oosterhuis, N.M.; Kossen, N.W. Dissolved oxygen concentration profiles in a production-scale bioreactor. Biotechnol. Bioeng. 1984, 26, 546–550. [Google Scholar] [CrossRef]
- Haringa, C.; Deshmukh, A.T.; Mudde, R.F.; Noorman, H.J. Euler-Lagrange analysis towards representative down-scaling of a 22 m3 aerobic S. cerevisiae fermentation. Chem. Eng. Sci. 2017, 170, 653–669. [Google Scholar] [CrossRef]
- Jones, J.A.; Toparlak, T.D.; Koffas, M.A. Metabolic pathway balancing and its role in the production of biofuels and chemicals. Curr. Opin. Biotechnol. 2015, 33, 52–59. [Google Scholar] [CrossRef] [PubMed] [Green Version]
- Lunt, S.Y.; Vander Heiden, M.G. Aerobic Glycolysis: Meeting the Metabolic Requirements of Cell Proliferation. Annu. Rev. Cell Dev. Biol. 2011, 27, 441–464. [Google Scholar] [CrossRef] [Green Version]
- Ishtar Snoek, I.S.; Yde Steensma, H. Factors involved in anaerobic growth of Saccharomyces cerevisiae. Yeast 2007, 24, 1–10. [Google Scholar] [CrossRef] [Green Version]
- Wiebe, M.G.; Rintala, E.; Tamminen, A.; Simolin, H.; Salusjärvi, L.; Toivari, M.; Kokkonen, J.T.; Kiuru, J.; Ketola, R.A.; Jouhten, P.; et al. Central carbon metabolism of Saccharomyces cerevisiae in anaerobic, oxygen-limited and fully aerobic steady-state conditions and following a shift to anaerobic conditions. FEMS Yeast Res. 2008, 8, 140–154. [Google Scholar] [CrossRef]
- Vemuri, G.; Eiteman, M.; McEwen, J.; Olsson, L.; Nielsen, J. Increasing NADH oxidation reduces overflow metabolism in Saccharomyces cerevisiae. Proc. Natl. Acad. Sci. USA 2007, 104, 2402–2407. [Google Scholar] [CrossRef] [PubMed] [Green Version]
- Nilsson, A.; Nielsen, J. Metabolic trade-offs in yeast are caused by F1F0-ATP synthase. Sci. Rep. 2016, 6, 22264. [Google Scholar] [CrossRef] [Green Version]
- Otterstedt, K.; Larsson, C.; Bill, R.M.; Ståhlberg, A.; Boles, E.; Hohmann, S.; Gustafsson, L. Switching the mode of metabolism in the yeast Saccharomyces cerevisiae. EMBO Rep. 2004, 5, 532–537. [Google Scholar] [CrossRef] [Green Version]
- Wang, D.; Xu, Y.; Hu, J.; Zhao, G. Fermentation kinetics of different sugars by apple wine yeast Saccharomyces cerevisiae. J. Inst. Brew. 2004, 110, 340–346. [Google Scholar] [CrossRef]
- Badotti, F.; Dário, M.G.; Alves, S.L.; Cordioli, M.; Miletti, L.C.; de Araujo, P.S.; Stambuk, B.U. Switching the mode of sucrose utilization by Saccharomyces cerevisiae. Microb. Cell Fact. 2008, 7, 4. [Google Scholar] [CrossRef] [Green Version]
- Marques, W.L.; Raghavendran, V.; Stambuk, B.U.; Gombert, A.K. Sucrose and Saccharomyces cerevisiae: A relationship most sweet. FEMS Yeast Res. 2016, 16, 107. [Google Scholar] [CrossRef] [PubMed] [Green Version]
- Ostergaard, S.; Olsson, L.; Nielsen, J. In vivo dynamics of galactose metabolism in Saccharomyces cerevisiae: Metabolic fluxes and metabolite levels. Biotechnol. Bioeng. 2001, 73, 412–425. [Google Scholar] [CrossRef] [PubMed]
- Weusthuis, R.A.; Adams, H.; Scheffers, W.A.; Van Dijken, J.P. Energetics and kinetics of maltose transport in Saccharomyces cerevisiae: A continuous culture study. Appl. Environ. Microbiol. 1993, 59, 3102–3109. [Google Scholar] [CrossRef] [Green Version]
- Meinander, N.Q.; Hahn-Hägerdal, B. Influence of cosubstrate concentration on xylose conversion by recombinant, XYL1-expressing Saccharomyces cerevisiae: A comparison of different sugars and ethanol as cosubstrates. Appl. Environ. Microbiol. 1997, 63, 1959–1964. [Google Scholar] [CrossRef] [Green Version]
- Rodrigues, C.I.S.; Wahl, A.; Gombert, A.K. Aerobic growth physiology of Saccharomyces cerevisiae on sucrose is strain-dependent. FEMS Yeast Res. 2021, 21, foab021. [Google Scholar] [CrossRef]
- Noor, E.; Eden, E.; Milo, R.; Alon, U. Central Carbon Metabolism as a Minimal Biochemical Walk between Precursors for Biomass and Energy. Mol. Cell 2010, 39, 809–820. [Google Scholar] [CrossRef] [PubMed]
- Chassagnole, C.; Noisommit-Rizzi, N.; Schmid, J.W.; Mauch, K.; Reuss, M. Dynamic modeling of the central carbon metabolism of Escherichia coli. Biotechnol. Bioeng. 2002, 79, 53–73. [Google Scholar] [CrossRef]
- Elsemman, I.E.; Prado, A.R.; Grigaitis, P.; Albornoz, M.G.; Harman, V.; Holman, S.; van Heerden, J.; Bruggeman, F.J.; Bisschops, M.M.; Sonnenschein, N.; et al. Whole-cell modeling in yeast predicts compartment-specific proteome constraints that drive metabolic strategies. bioRxiv 2021. [Google Scholar] [CrossRef]
- Verhagen, K.J.A.; van Gulik, W.M.; Wahl, S.A. Dynamics in redox metabolism, from stoichiometry towards kinetics. Curr. Opin. Biotechnol. 2020, 64, 116–123. [Google Scholar] [CrossRef]
- François, J.; Parrou, J.L. Reserve carbohydrates metabolism in the yeast Saccharomyces cerevisiae. FEMS Microbiol. Rev. 2001, 25, 125–145. [Google Scholar] [CrossRef] [PubMed] [Green Version]
- Kochanowski, K.; Sauer, U.; Noor, E. Posttranslational regulation of microbial metabolism. Curr. Opin. Microbiol. 2015, 27, 10–17. [Google Scholar] [CrossRef]
- Blázquez, M.A.; Lagunas, R.; Gancedo, C.; Gancedo, J.M. Trehalose-6-phosphate, a new regulator of yeast glycolysis that inhibits hexokinases. FEBS Lett. 1993, 329, 51–54. [Google Scholar] [CrossRef] [Green Version]
- Berg, J.M.; Tymoczko, J.L.; Stryer, L. Biochemistry: International Version; W.H. Freeman: Bethesda, MD, USA, 2002. [Google Scholar]
- Thevelein, J.M.; De Winde, J.H. Novel sensing mechanisms and targets for the cAMP-protein kinase A pathway in the yeast Saccharomyces cerevisiae. Mol. Microbiol. 1999, 33, 904–918. [Google Scholar] [CrossRef]
- Tripodi, F.; Nicastro, R.; Reghellin, V.; Coccetti, P. Post-translational modifications on yeast carbon metabolism: Regulatory mechanisms beyond transcriptional control. Biochim. Biophys. Acta 2015, 1850, 620–627. [Google Scholar] [CrossRef]
- Muratsubaki, H.; Katsume, T. Distribution of hexokinase isoenzymes depending on a carbon source in Saccharomyces cerevisiae. Biochem. Biophys. Res. Commun. 1979, 86, 1030–1036. [Google Scholar] [CrossRef]
- Orij, R.; Brul, S.; Smits, G.J. Intracellular pH is a tightly controlled signal in yeast. Biochim. Biophys. Acta 2011, 1810, 933–944. [Google Scholar] [CrossRef]
- Payne, J.L.; Wagner, A. Function does not follow form in gene regulatory circuits. Sci. Rep. 2015, 5, 13015. [Google Scholar] [CrossRef] [PubMed] [Green Version]
- Hess, B.; Boiteux, A. Mechanism of Glycolytic Oscillation in Yeast, I Aerobic and anaerobic growth conditions for obtaining glycolytic oscillation. Hoppe-Seyler’s Z. Physiol. Chem. 1968, 349, 1567–1574. [Google Scholar] [CrossRef] [PubMed]
- Richter, O.; Betz, A.; Giersch, C. The response of oscillating glycolysis to perturbations in the NADH/NAD system: A comparison between experiments and a computer model. Biosystems 1975, 7, 137–146. [Google Scholar] [CrossRef]
- SEL’KOV, E.E. Stabilization of Energy Charge, Generation of Oscillations and Multiple Steady States in Energy Metabolism as a Result of Purely Stoichiometric Regulation. Eur. J. Biochem. 1975, 59, 151–157. [Google Scholar] [CrossRef] [PubMed] [Green Version]
- Richter, P.H.; Ross, J. Oscillations and efficiency in glycolysis. Biophys. Chem. 1980, 12, 285–297. [Google Scholar] [CrossRef]
- Boiteux, A.; Busse, H.G. Circuit analysis of the oscillatory state in glycolysis. Biosystems 1989, 22, 231–240. [Google Scholar] [CrossRef]
- Grosz, R.; Stephanopoulos, G. Physiological, biochemical, and mathematical studies of micro-aerobic continuous ethanol fermentation by Saccharomyces cerevisiae. I: Hysteresis, oscillations, and maximum specific ethanol productivities in chemostat culture. Biotechnol. Bioeng. 1990, 36, 1006–1019. [Google Scholar] [CrossRef]
- Du Preez, F.B.; Van Niekerk, D.D.; Kooi, B.; Rohwer, J.M.; Snoep, J.L. From steady-state to synchronized yeast glycolytic oscillations I: Model construction. FEBS J. 2012, 279, 2810–2822. [Google Scholar] [CrossRef]
- Boiteux, A.; Goldbeter, A.; Hess, B. Control of oscillating glycolysis of yeast by stochastic, periodic, and steady source of substrate: A model and experimental study. Proc. Natl. Acad. Sci. USA 1975, 72, 3829–3833. [Google Scholar] [CrossRef] [Green Version]
- Galazzo, J.L.; Bailey, J.E. Fermentation pathway kinetics and immobilized Saccharomyces cerevisiae. Enzyme Microb. Technol. 1990, 12, 162–172. [Google Scholar] [CrossRef]
- Delgado, J.; Meruane, J.; Liao, J.C. Experimental determination of flux control distribution in biochemical systems: In vitro model to analyze transient metabolite concentrations. Biotechnol. Bioeng. 1993, 41, 1121–1128. [Google Scholar] [CrossRef]
- Rizzi, M.; Baltes, M.; Mailinger, W.; Theobald, U.; Reuss, M. Modelling of Short Term Crabtree-Effect in Baker’s Yeast. IFAC Proc. 1995, 28, 124–129. [Google Scholar] [CrossRef]
- Teusink, B.; Walsh, M.C.; van Dam, K.; Westerhoff, H.V. The danger of metabolic pathways with turbo design. Trends Biochem. Sci. 1998, 23, 162–169. [Google Scholar] [CrossRef]
- Cronwright, G.R.; Rohwer, J.M.; Prior, B.A. Metabolic control analysis of glycerol synthesis in Saccharomyces cerevisiae. Appl. Environ. Microbiol. 2002, 68, 4448–4456. [Google Scholar] [CrossRef] [PubMed] [Green Version]
- Liao, J.C.; Lightfoot, E.N.; Jolly, S.O.; Jacobson, G.K. Application of characteristic reaction paths: Rate-limiting capability of phosphofructokinase in yeast fermentation. Biotechnol. Bioeng. 1988, 31, 855–868. [Google Scholar] [CrossRef]
- Cortassa, S.; Aon, M.A. Metabolic control analysis of glycolysis and branching to ethanol production in chemostat cultures of Saccharomyces cerevisiae under carbon, nitrogen, or phosphate limitations. Enzyme Microb. Technol. 1994, 16, 761–770. [Google Scholar] [CrossRef]
- Pritchard, L.; Kell, D.B. Schemes of flux control in a model of Saccharomyces cerevisiae glycolysis. Eur. J. Biochem. 2002, 269, 3894–3904. [Google Scholar] [CrossRef] [Green Version]
- Conant, G.C.; Wolfe, K.H. Increased glycolytic flux as an outcome of whole-genome duplication in yeast. Mol. Syst. Biol. 2007, 3, 129. [Google Scholar] [CrossRef] [Green Version]
- Bakker, B.M.; Van Eunen, K.; Jeneson, J.A.; Van Riel, N.A.; Bruggeman, F.J.; Teusink, B. Systems biology from micro-organisms to human metabolic diseases: The role of detailed kinetic models. Biochem. Soc. Trans. 2010, 38, 1294–1301. [Google Scholar] [CrossRef] [Green Version]
- Visser, D.; Heijnen, J.J. Dynamic simulation and metabolic re-design of a branched pathway using linlog kinetics. Metab. Eng. 2003, 5, 164–176. [Google Scholar] [CrossRef]
- Smallbone, K.; Simeonidis, E.; Broomhead, D.S.; Kell, D.B. Something from nothing—Bridging the gap between constraint-based and kinetic modelling. FEBS J. 2007, 274, 5576–5585. [Google Scholar] [CrossRef] [PubMed] [Green Version]
- Smallbone, K.; Simeonidis, E.; Swainston, N.; Mendes, P. Towards a genome-scale kinetic model of cellular metabolism. BMC Syst. Biol. 2010, 4, 63. [Google Scholar] [CrossRef] [Green Version]
- Suarez-Mendez, C.A.; Hanemaaijer, M.; ten Pierick, A.; Wolters, J.C.; Heijnen, J.J.; Wahl, S.A. Interaction of storage carbohydrates and other cyclic fluxes with central metabolism: A quantitative approach by non-stationary 13C metabolic flux analysis. Metab. Eng. Commun. 2016, 3, 52–63. [Google Scholar] [CrossRef] [PubMed]
- Jules, M.; Guillou, V.; François, J.; Parrou, J.L. Two distinct pathways for trehalose assimilation in the yeast Saccharomyces cerevisiae. Appl. Environ. Microbiol. 2004, 70, 2771–2778. [Google Scholar] [CrossRef] [Green Version]
- Ramos, S.; Balbín, M.; Raposo, M.; Valle, E.; Pardo, L.A. The mechanism of intracellular acidification induced by glucose in Saccharomyces cerevisiae. J. Gen. Microbiol. 1989, 135, 2413–2422. [Google Scholar] [CrossRef] [PubMed] [Green Version]
- Oliveira, A.P.; Sauer, U. The importance of post-translational modifications in regulating Saccharomyces cerevisiae metabolism. FEMS Yeast Res. 2012, 12, 104–117. [Google Scholar] [CrossRef] [Green Version]
- Rodríguez, A.; De La Cera, T.; Herrero, P.; Moreno, F. The hexokinase 2 protein regulates the expression of the GLK1, HXK1 and HXK2 genes of Saccharomyces cerevisiae. Biochem. J. 2001, 355, 625–631. [Google Scholar] [CrossRef] [Green Version]
- Linck, A.; Vu, X.K.; Essl, C.; Hiesl, C.; Boles, E.; Oreb, M. On the role of GAPDH isoenzymes during pentose fermentation in engineered Saccharomyces cerevisiae. FEMS Yeast Res. 2014, 14, 389–398. [Google Scholar] [CrossRef]
- Hofmeyr, J.H.S.; Kacser, H.; van der Merwe, K.J. Metabolic control analysis of moiety-conserved cycles. Eur. J. Biochem. 1986, 155, 631–640. [Google Scholar] [CrossRef] [PubMed]
- Aledo, J.C.; Jiménez-Rivérez, S.; Cuesta-Munoz, A.; Romero, J.M. The role of metabolic memory in the ATP paradox and energy homeostasis. FEBS J. 2008, 275, 5332–5342. [Google Scholar] [CrossRef] [PubMed]
- Somsen, O.J.; Hoeben, M.A.; Esgalhado, E.; Snoep, J.L.; Visser, D.; Van der Heijden, R.T.; Heijnen, J.J.; Westerhoff, H.V. Glucose and the ATP paradox in yeast. Biochem. J. 2000, 352, 593–599. [Google Scholar] [CrossRef]
- Mensonides, F.I.C.; Bakker, B.M.; Cremazy, F.; Messiha, H.L.; Mendes, P.; Boogerd, F.C.; Westerhoff, H.V. A new regulatory principle for in vivo biochemistry: Pleiotropic low affinity regulation by the adenine nucleotides—Illustrated for the glycolytic enzymes of Saccharomyces cerevisiae. FEBS Lett. 2013, 587, 2860–2867. [Google Scholar] [CrossRef]
- Mashego, M.R.; van Gulik, W.M.; Vinke, J.L.; Visser, D.; Heijnen, J.J. In vivo kinetics with rapid perturbation experiments in Saccharomyces cerevisiae using a second-generation BioScope. Metab. Eng. 2006, 8, 370–383. [Google Scholar] [CrossRef] [PubMed]
- Canelas, A.B.; Ten Pierick, A.; Ras, C.; Seifar, R.M.; Van Dam, J.C.; Van Gulik, W.M.; Heijnen, J.J. Quantitative evaluation of intracellular metabolite extraction techniques for yeast metabolomics. Anal. Chem. 2009, 81, 7379–7389. [Google Scholar] [CrossRef]
- Douma, R.D.; De Jonge, L.P.; Jonker, C.T.; Seifar, R.M.; Heijnen, J.J.; Van Gulik, W.M. Intracellular metabolite determination in the presence of extracellular abundance: Application to the penicillin biosynthesis pathway in Penicillium chrysogenum. Biotechnol. Bioeng. 2010, 107, 105–115. [Google Scholar] [CrossRef]
- Lange, H.C.; Eman, M.; Van Zuijlen, G.; Visser, D.; Van Dam, J.C.; Frank, J.; De Teixeira Mattos, M.J.; Heijnen, J.J. Improved rapid sampling for in vivo kinetics of intracellular metabolites in Saccharomyces cerevisiae. Biotechnol. Bioeng. 2001, 75, 406–415. [Google Scholar] [CrossRef]
- Vasilakou, E.; Machado, D.; Theorell, A.; Rocha, I.; Nöh, K.; Oldiges, M.; Wahl, S.A. Current state and challenges for dynamic metabolic modeling. Curr. Opin. Microbiol. 2016, 33, 97–104. [Google Scholar] [CrossRef] [PubMed]
- Canelas, A.B.; van Gulik, W.M.; Heijnen, J.J. Determination of the cytosolic free NAD/NADH ratio in Saccharomyces cerevisiae under steady-state and highly dynamic conditions. Biotechnol. Bioeng. 2008, 100, 734–743. [Google Scholar] [CrossRef] [PubMed]
- Mashego, M.R.; Wu, L.; Van Dam, J.C.; Ras, C.; Vinke, J.L.; Van Winden, W.A.; Van Gulik, W.M.; Heijnen, J.J. MIRACLE: Mass Isotopomer Ratio Analysis of U-13C-Labeled Extracts. A New Method for Accurate Quantification of Changes in Concentrations of Intracellular Metabolites. Biotechnol. Bioeng. 2004, 85, 620–628. [Google Scholar] [CrossRef]
- Sauer, U. Metabolic networks in motion: 13C-based flux analysis. Mol. Syst. Biol. 2006, 2, 62. [Google Scholar] [CrossRef] [Green Version]
- Van Hoek, P.; Van Dijken, J.P.; Pronk, J.T. Effect of specific growth rate on fermentative capacity of baker’s yeast. Appl. Environ. Microbiol. 1998, 64, 4226–4233. [Google Scholar] [CrossRef] [PubMed] [Green Version]
- Bermejo, C.; Haerizadeh, F.; Takanaga, H.; Chermak, D.; Frommer, W.B. Optical sensors for measuring dynamic changes of cytosolic metabolite levels in yeast. Nat. Protoc. 2011, 6, 1806–1817. [Google Scholar] [CrossRef]
- Botman, D.; Van Heerden, J.H.; Teusink, B. An Improved ATP FRET Sensor for Yeast Shows Heterogeneity during Nutrient Transitions. ACS Sens. 2020, 5, 814–822. [Google Scholar] [CrossRef] [Green Version]
- Botman, D.; O’Toole, T.G.; Goedhart, J.; Bruggeman, F.J.; van Heerden, J.H.; Teusink, B. A yeast FRET biosensor enlightens cAMP signaling. Mol. Biol. Cell 2021, 32, 1229–1240. [Google Scholar] [CrossRef]
- Miskovic, L.; Béal, J.; Moret, M.; Hatzimanikatis, V. Uncertainty reduction in biochemical kinetic models: Enforcing desired model properties. PLoS Comput. Biol. 2019, 15, e1007242. [Google Scholar] [CrossRef] [Green Version]
- Kiureghian, A.D.; Ditlevsen, O. Aleatory or epistemic? Does it matter? Struct. Saf. 2009, 31, 105–112. [Google Scholar] [CrossRef]
- Goss, P.J.; Peccoud, J. Quantitative modeling of stochastic systems in molecular biology by using stochastic Petri nets. Proc. Natl. Acad. Sci. USA 1998, 95, 6750–6755. [Google Scholar] [CrossRef] [Green Version]
- Schillings, C.; Sunnåker, M.; Stelling, J.; Schwab, C. Efficient Characterization of Parametric Uncertainty of Complex (Bio)chemical Networks. PLoS Comput. Biol. 2015, 11, e1004457. [Google Scholar] [CrossRef] [PubMed]
- Chen, N.; Koumpouras, G.C.; Polizzi, K.M.; Kontoravdi, C. Genome-based kinetic modeling of cytosolic glucose metabolism in industrially relevant cell lines: Saccharomyces cerevisiae and Chinese hamster ovary cells. Bioprocess Biosyst. Eng. 2012, 35, 1023–1033. [Google Scholar] [CrossRef] [Green Version]
- Van Riel, N.; Giuseppin, M.; TerSchure, E.; Verrips, C. A Structured, Minimal parameter Model of the Central Nitrogen Metabolism inSaccharomyces cerevisiae: The Prediction of the Behaviour of Mutants. J. Theor. Biol. 1998, 191, 397–414. [Google Scholar] [CrossRef]
- Metzl-Raz, E.; Kafri, M.; Yaakov, G.; Soifer, I.; Gurvich, Y.; Barkai, N. Principles of cellular resource allocation revealed by condition-dependent proteome profiling. bioRxiv 2017, 6, e28034. [Google Scholar] [CrossRef]
- Björkeroth, J.; Campbell, K.; Malina, C.; Yu, R.; Bartolomeo, F.D.; Nielsen, J. Proteome reallocation from amino acid biosynthesis to ribosomes enables yeast to grow faster in rich media. Proc. Natl. Acad. Sci. USA 2020, 117, 21804–21812. [Google Scholar] [CrossRef] [PubMed]
- Kotte, O.; Heinemann, M. A divide-and-conquer approach to analyze underdetermined biochemical models. Bioinformatics 2009, 25, 519–525. [Google Scholar] [CrossRef] [PubMed] [Green Version]
- van Riel, N.A.; Sontag, E.D. Parameter estimation in models combining signal transduction and metabolic pathways: The dependent input approach. IEE Proc. 2006, 153, 263–274. [Google Scholar] [CrossRef] [Green Version]
- Hansen, P.C. Regularization, GSVD and truncatedGSVD. BIT Num. Math. 1989, 29, 491–504. [Google Scholar] [CrossRef]
- Steiert, B.; Timmer, J.; Kreutz, C. L1 regularization facilitates detection of cell type-specific parameters in dynamical systems. Bioinformatics 2016, 32, i718–i726. [Google Scholar] [CrossRef] [Green Version]
- Dolejsch, P.; Hass, H.; Timmer, J. Extensions of L1 regularization increase detection specificity for cell-type specific parameters in dynamic models. BMC Bioinform. 2019, 20, 395. [Google Scholar] [CrossRef]
- van Riel, N.A.; Tiemann, C.A.; Hilbers, P.A.; Groen, A.K. Metabolic Modeling Combined with Machine Learning Integrates Longitudinal Data and Identifies the Origin of LXR-Induced Hepatic Steatosis. Front. Bioeng. Biotechnol. 2021, 8, 536957. [Google Scholar] [CrossRef]
- Balsa-Canto, E.; Henriques, D.; Gábor, A.; Banga, J.R. AMIGO2, a toolbox for dynamic modeling, optimization and control in systems biology. Bioinformatics 2016, 32, 3357–3359. [Google Scholar] [CrossRef] [Green Version]
- Raue, A.; Steiert, B.; Schelker, M.; Kreutz, C.; Maiwald, T.; Hass, H.; Vanlier, J.; Tönsing, C.; Adlung, L.; Engesser, R.; et al. Data2Dynamics: A modeling environment tailored to parameter estimation in dynamical systems. Bioinformatics 2015, 31, 3558–3560. [Google Scholar] [CrossRef] [Green Version]
- Stapor, P.; Weindl, D.; Ballnus, B.; Hug, S.; Loos, C.; Fiedler, A.; Krause, S.; Hroß, S.; Fröhlich, F.; Hasenauer, J. PESTO: Parameter EStimation TOolbox. Bioinformatics 2018, 34, 705–707. [Google Scholar] [CrossRef] [Green Version]
- Fröhlich, F.; Weindl, D.; Schälte, Y.; Pathirana, D.; Paszkowski, Ł.; Lines, G.T.; Stapor, P.; Hasenauer, J. AMICI: High-performance sensitivity analysis for large ordinary differential equation models. Bioinformatics 2021, 37, 3676–3677. [Google Scholar] [CrossRef]
- Villaverde, A.F.; Henriques, D.; Smallbone, K.; Bongard, S.; Schmid, J.; Cicin-Sain, D.; Crombach, A.; Saez-Rodriguez, J.; Mauch, K.; Balsa-Canto, E.; et al. BioPreDyn-bench: A suite of benchmark problems for dynamic modelling in systems biology. BMC Syst. Biol. 2015, 9, 8. [Google Scholar] [CrossRef] [Green Version]
- ASME. Assessing Credibility of Computational Modeling through Verification and Validation: Application to Medical Devices; ASME: New York, NY, USA, 2018. [Google Scholar]
- Sandve, G.K.; Nekrutenko, A.; Taylor, J.; Hovig, E. Ten simple rules for reproducible computational research. PLoS Comput. Biol. 2013, 9, e1003285. [Google Scholar] [CrossRef] [Green Version]
- Porubsky, V.L.; Goldberg, A.P.; Rampadarath, A.K.; Nickerson, D.P.; Karr, J.R.; Sauro, H.M. Best practices for making reproducible biochemical models. Cell Syst. 2020, 11, 109–120. [Google Scholar] [CrossRef]
- Kleijnen, J.P. Verification and validation of simulation models. Eur. J. Oper. Res. 1995, 82, 145–162. [Google Scholar] [CrossRef] [Green Version]
- Ljung, L. System identification. In Signal Analysis and Prediction; Birkhauser: Boston, MA, USA, 1998; pp. 163–173. [Google Scholar]
- Luong, J. Ethanol Inhibition in Alcohol Ferment. Biotechnol. Bioeng. 1985, XXVII, 280–285. [Google Scholar] [CrossRef]
- Pham, H.; Larsson, G.; Enfors, S.O. Modelling of aerobic growth of Saccharomyces cerevisiae in a pH-auxostat. Bioprocess Eng. 1999, 20, 537–544. [Google Scholar] [CrossRef]
- Arroyo-López, F.N.; Orlić, S.; Querol, A.; Barrio, E. Effects of temperature, pH and sugar concentration on the growth parameters of Saccharomyces cerevisiae, S. kudriavzevii and their interspecific hybrid. Int. J. Food Microbiol. 2009, 131, 120–127. [Google Scholar] [CrossRef]
- Mensonides, F.I.; Brul, S.; Hellingwerf, K.J.; Bakker, B.M.; Teixeira De Mattos, M.J. A kinetic model of catabolic adaptation and protein reprofiling in Saccharomyces cerevisiae during temperature shifts. FEBS J. 2014, 281, 825–841. [Google Scholar] [CrossRef]
- Vinnakota, K.; Kemp, M.L.; Kushmerick, M.J. Dynamics of muscle glycogenolysis modeled with pH time course computation and pH-dependent reaction equilibria and enzyme kinetics. Biophys. J. 2006, 91, 1264–1287. [Google Scholar] [CrossRef] [Green Version]
- Millat, T.; Janssen, H.; Bahl, H.; Fischer, R.J.; Wolkenhauer, O. Integrative modelling of pH-dependent enzyme activity and transcriptomic regulation of the acetone-butanol-ethanol fermentation of Clostridium acetobutylicum in continuous culture. Microb. Biotechnol. 2013, 6, 526–539. [Google Scholar] [CrossRef]
- Cruz, L.A.B.; Hebly, M.; Duong, G.H.; Wahl, S.A.; Pronk, J.T.; Heijnen, J.J.; Daran-Lapujade, P.; van Gulik, W.M. Similar temperature dependencies of glycolytic enzymes: An evolutionary adaptation to temperature dynamics? BMC Syst. Biol. 2012, 6, 151. [Google Scholar] [CrossRef] [Green Version]
- Van Leemputte, F.; Vanthienen, W.; Wijnants, S.; Van Zeebroeck, G.; Thevelein, J.M. Aberrant Intracellular pH Regulation Limiting Glyceraldehyde-3-Phosphate Dehydrogenase Activity in the Glucose-Sensitive Yeast tps1 Δ Mutant. mBio 2020, 11, e02199-20. [Google Scholar] [CrossRef]
- Ho, P.; Westerwalbesloh, C.; Kaganovitch, E.; Grünberger, A.; Neubauer, P.; Kohlheyer, D.; von Lieres, E. Reproduction of large-scale bioreactor conditions on microfluidic chips. Microorganisms 2019, 7, 105. [Google Scholar] [CrossRef] [Green Version]
- Hashimoto, M.; Nozoe, T.; Nakaoka, H.; Okura, R.; Akiyoshi, S.; Kaneko, K.; Kussell, E.; Wakamoto, Y. Noise-driven growth rate gain in clonal cellular populations. Proc. Natl. Acad. Sci. USA 2016, 113, 3151–3156. [Google Scholar] [CrossRef] [Green Version]
- Männik, J.; Wu, F.; Hol, F.J.; Bisicchia, P.; Sherratt, D.J.; Keymer, J.E.; Dekker, C. Robustness and accuracy of cell division in Escherichia coli in diverse cell shapes. Proc. Natl. Acad. Sci. USA 2012, 109, 6957–6962. [Google Scholar] [CrossRef] [Green Version]
- Mustafi, N.; Grünberger, A.; Mahr, R.; Helfrich, S.; Nöh, K.; Blombach, B.; Kohlheyer, D.; Frunzke, J. Application of a genetically encoded biosensor for live cell imaging of L-valine production in pyruvate dehydrogenase complex-deficient Corynebacterium glutamicum strains. PLoS ONE 2014, 9, e85731. [Google Scholar] [CrossRef] [Green Version]
- Bamford, R.A.; Smith, A.; Metz, J.; Glover, G.; Titball, R.W.; Pagliara, S. Investigating the physiology of viable but non-culturable bacteria by microfluidics and time-lapse microscopy. BMC Biol. 2017, 15, 121. [Google Scholar] [CrossRef]
- Lapin, A.; Müller, D.; Reuss, M. Dynamic behavior of microbial populations in stirred bioreactors simulated with Euler-Lagrange methods: Traveling along the lifelines of single cells. Ind. Eng. Chem. Res. 2004, 43, 4647–4656. [Google Scholar] [CrossRef]
- Wang, G.; Haringa, C.; Noorman, H.; Chu, J.; Zhuang, Y. Developing a Computational Framework To Advance Bioprocess Scale-Up. Trends Biotechnol. 2020, 38, 846–856. [Google Scholar] [CrossRef]
- Chae, H.J.; DeLisa, M.P.; Cha, H.J.; Weigand, W.A.; Rao, G.; Bentley, W.E. Framework for online optimization of recombinant protein expression in high-cell-density Escherichia coli cultures using GFP-fusion monitoring. Biotechnol. Bioeng. 2000, 69, 275–285. [Google Scholar] [CrossRef]
- Teixeira, A.P.; Alves, C.; Alves, P.M.; Carrondo, M.J.; Oliveira, R. Hybrid elementary flux analysis/nonparametric modeling: Application for bioprocess control. BMC Bioinform. 2007, 8, 421. [Google Scholar] [CrossRef] [Green Version]
- Yüzgeç, U.; Türker, M.; Hocalar, A. On-line evolutionary optimization of an industrial fed-batch yeast fermentation process. ISA Trans. 2009, 48, 79–92. [Google Scholar] [CrossRef]
- Haringa, C.; Tang, W.; Wang, G.; Deshmukh, A.T.; van Winden, W.A.; Chu, J.; van Gulik, W.M.; Heijnen, J.J.; Mudde, R.F.; Noorman, H.J. Computational fluid dynamics simulation of an industrial P. chrysogenum fermentation with a coupled 9-pool metabolic model: Towards rational scale-down and design optimization. Chem. Eng. Sci. 2018, 175, 12–24. [Google Scholar] [CrossRef]
- Hajian, C.S.S.; Haringa, C.; Noorman, H.; Takors, R. Predicting by-product gradients of baker’s yeast production at industrial scale: A practical simulation approach. Processes 2020, 8, 1554. [Google Scholar] [CrossRef]
- Herwig, C.; Pörtner, R.; Möller, J. Digital Twins: Applications to the Design and Optimization of Bioprocesses; Springer Nature: Cham, Switzerland, 2021; Volume 177. [Google Scholar]
- Koulouris, A.; Misailidis, N.; Petrides, D. Applications of process and digital twin models for production simulation and scheduling in the manufacturing of food ingredients and products. Food Bioprod. Process. 2021, 126, 317–333. [Google Scholar] [CrossRef]
- Higgins, J.P.; Thomas, J.; Chandler, J.; Cumpston, M.; Li, T.; Page, M.J.; Welch, V.A. Cochrane Handbook for Systematic Reviews of Interventions; John Wiley & Sons: Hoboken, NJ, USA, 2019. [Google Scholar]
- Ouzzani, M.; Hammady, H.; Fedorowicz, Z.; Elmagarmid, A. Rayyan—A web and mobile app for systematic reviews. Syst. Rev. 2016, 5, 210. [Google Scholar] [CrossRef] [Green Version]
- Van Eck, N.J.; Waltman, L. Software survey: VOSviewer, a computer program for bibliometric mapping. Scientometrics 2010, 84, 523–538. [Google Scholar] [CrossRef] [Green Version]
- Olivier, B.G.; Snoep, J.L. Web-based kinetic modelling using JWS Online. Bioinformatics 2004, 20, 2143–2144. [Google Scholar] [CrossRef]


| Step | Description |
|---|---|
| 1. Development of a search query | A search query was designed and implemented in the Scopus database document search. The time range selected was 2000–2020 to obtain a workable library size and relevant to the publication time. This query aimed to find all papers relevant to kinetic metabolic models of S. cerevisiae. Areas of uncertainty in models was an area of focus as well. The search query is: (TITLE-ABS-KEY (kinet* OR dynam* OR biochem*) AND TITLE-ABS-KEY (metabol*) AND TITLE-ABS-KEY (model* OR network*) AND TITLE-ABS-KEY (yeast OR “baker’s yeast” OR cerevisiae) AND TITLE-ABS-KEY ((paramet* OR structur* OR topolog* OR “in vivo” OR “in vitro”) AND (uncertain* OR sensitiv* OR crosstalk OR burden OR likelih* OR control OR energ* OR ptm OR transcription* OR translation* OR regulat* OR interact* OR multilevel)) OR TITLE-ABS-KEY ((paramet* OR structur* OR topolog* OR “in vivo” OR “in vitro” OR regulat* OR interact* OR multilevel) AND (uncertain* OR sensitiv* OR crosstalk OR burden OR likelih* OR control OR energ* OR ptm OR transcription* OR translation*))) AND DOCTYPE (ar OR re) AND PUBYEAR > 1999. |
| 2a. Literature screening strategy: title and abstracts | The first screening round was performed using the RAYYAN webapp. Inclusion and exclusion criteria were used to determine if an article would be considered or not for our research. Since the library at this point was extensive (>3000 papers) and many articles had little relationship with our field, this step was performed only based on reading abstracts. Inclusion, exclusion, and undecided criteria were the following: Inclusion criteria: (1) Geographic location: no limitation, (2) Language: English, (3) Experimental scale: no limitation, (4) Publication type: article or reviews, (5) Organism: Saccharomyces cerevisiae, aka yeast, (6) Kinetic modeling, (7) Theoretical or experimental modeling, (8) Organelles: cytosol and mitochondria, (9) Yeast dynamic models external, but tightly related, to CCM and (10) State of the art yeast GSM of CCM. Exclusion criteria: (1) Non-peer review articles, (2) No patents, (3) Before 2000, (4) Mixed culture, (5) Not submerged growth, (6) Metabolic routes outside CCM, (7) Unconfined environment, (8) No modeling work and (9) Article duplicates. |
| 2b. Literature screening strategy: content | The second round of screening took place in the Mendeley environment. The manuscripts that priorly fitted in the ‘inclusion’ group were read (in this case, not constrained to abstract only) to find if their main work focus was a dynamic metabolic model of CCM. From these collection, unique models were identified. |
| 3. Extraction of relevant information | The following relevant information was extracted from each model: (1) Motivation/Research question, (2) Outcome of the research, (3) Future research proposed, (4) Type of dynamic modeling used, (5) Coverage of the model, (6) Presence of reaction that connect CCM to the remained of the metabolic network, (7) Modeling of dynamic and/or steady-state conditions, (8) Parameter values origin and (9) Presence or not of experimental data. |
| 4. Quality assessment | To rank the relevance of the found models to our research, the following quality aspects were evaluated: (1) New knowledge to the understanding of S. cerevisiae glycolysis provided, (2) Extensive coverage of glycolysis and other pathways in CCM, (3) Inclusion of relevant variables external to CCM stoichiometry and kinetics (i.e., cofactor kinetics, sink reactions or post-translational regulation), (4) Detail in kinetic descriptions: from simple mass actions to more complex Michaelis–Menten kinetics with allosteric regulation, (5) Source of parameters in the model: experimental parameter measurements determined in conditions that do not resemble the cytosol (in vitro-like) are the least relevant. When conditions resemble the cytosol (in vivo-like) or parameters were estimated to fit the experimental metabolomics data, these are deemed as more relevant, (6) Validation with experimental data: the more variables and experimental setups used for validation, the better, and (7) Since models often build on top of each other, these often results in the most relevant models being the most complete. |
| 5. Extra literature search | To check that no relevant literature was missed, S. cerevisiae CCM kinetic models were also searched for in the BioModels and the JWS databases. Furthermore, citation and snowball literature search were applied on the publications which contained the relevant and unique models. |
Publisher’s Note: MDPI stays neutral with regard to jurisdictional claims in published maps and institutional affiliations. |
© 2022 by the authors. Licensee MDPI, Basel, Switzerland. This article is an open access article distributed under the terms and conditions of the Creative Commons Attribution (CC BY) license (https://creativecommons.org/licenses/by/4.0/).
Share and Cite
Lao-Martil, D.; Verhagen, K.J.A.; Schmitz, J.P.J.; Teusink, B.; Wahl, S.A.; van Riel, N.A.W. Kinetic Modeling of Saccharomyces cerevisiae Central Carbon Metabolism: Achievements, Limitations, and Opportunities. Metabolites 2022, 12, 74. https://doi.org/10.3390/metabo12010074
Lao-Martil D, Verhagen KJA, Schmitz JPJ, Teusink B, Wahl SA, van Riel NAW. Kinetic Modeling of Saccharomyces cerevisiae Central Carbon Metabolism: Achievements, Limitations, and Opportunities. Metabolites. 2022; 12(1):74. https://doi.org/10.3390/metabo12010074
Chicago/Turabian StyleLao-Martil, David, Koen J. A. Verhagen, Joep P. J. Schmitz, Bas Teusink, S. Aljoscha Wahl, and Natal A. W. van Riel. 2022. "Kinetic Modeling of Saccharomyces cerevisiae Central Carbon Metabolism: Achievements, Limitations, and Opportunities" Metabolites 12, no. 1: 74. https://doi.org/10.3390/metabo12010074