On the Role of Grain Size and Carbon Content on the Sensitization and Desensitization Behavior of 301 Austenitic Stainless Steel


Materials and Mechanical Engineering, Centre for Advanced Steels Research, University of Oulu, 90014 Oulu, Finland
*
Author to whom correspondence should be addressed.
Metals 2019, 9(11), 1193; https://doi.org/10.3390/met9111193
Submission received: 14 October 2019
/
Revised: 3 November 2019
/
Accepted: 5 November 2019
/
Published: 6 November 2019
Abstract
:The effect of grain size in the range 72 to 190 μm and carbon content in the range 0.105–0.073 wt.% on the intergranular corrosion of the austenitic stainless steel 301 has been investigated. Grain boundary chromium depletion has been studied directly using energy dispersive X-ray spectroscopy combined with scanning transmission electron microscopy and indirectly using double loop electrochemical potentiokinetic reactivation tests. In addition, chromium depletion has been modelled using the CALPHAD Thermo-Calc software TC-DICTRA. It is shown that the degree of sensitization measured using the double loop electrochemical potentiokinetic reactivation tests can be successfully predicted with the aid of a depletion parameter based on the modelled chromium depletion profiles for heat treatment times covering both the sensitization and de-sensitization or self-healing. Additionally, along with intergranular M23C6 carbides, intragranular M23C6 and Cr2N nitrides that affect the available Cr for grain boundary carbide precipitation were also observed.
1. Introduction
Austenitic stainless steels have excellent corrosion resistance. However, they are susceptible to intergranular corrosion, that is, sensitization when exposed to the temperature regime 500–850 °C [1,2,3]. This is due to the grain boundary precipitation and growth of chromium carbides that cause the formation of Cr depleted zones, resulting in intergranular corrosion. However, the degree of sensitization is not directly correlated to the amount of carbide precipitation. It depends on the details of the chromium concentration profiles in the vicinity of the grain boundaries.
It is common to measure the intensity of intergranular attack in environments that are considered corrosive such as acids. There are standardized tests that have been developed to compare sensitization resistance excluding the effect of the testing medium. These tests are defined by American Society for Testing and Materials (ASTM) standards that include electrochemical techniques such as the double loop electrochemical potentiokinetic reactivation (DL-EPR) test [4]. The composition of the electrolyte, temperature, potential limits and scan rate need to be determined for each alloy.
There are several works dealing with the experimental quantification of sensitization in austenitic stainless steels and extensive work has been done to understand the effects of different variables on the magnitude of the sensitization [5,6,7,8]. For example, the influence of time at sensitization temperatures [9], the effect of strain [10] and the effect of grain size on chromium carbide precipitation has been studied [11,12,13]. Models have also been developed for the prediction of carbide precipitation [14,15,16].
The model proposed by Stawström and Hillert [17] showed that the precipitation, sensitization and desensitization kinetics are proportional to the square of grain size. The time to reach self-healing was calculated by considering the critical concentration of chromium to be 13% by wt. In this model, basic rate equation is obtained using Fick’s second law and the flux of chromium at the interface is obtained using mass balance theory in Zener’s model. However, multicomponent effects are not considered in both thermodynamic and kinetic modelling in the work. Pascali et al. [18] studied the effect of carbon content and grain size on the sensitization kinetics. It was observed that increase in grain size delayed the sensitization and desensitization at lower temperatures. The major effect of increased carbon content is the lowering of maximum temperature at which Time–Temperature–Sensitization (TTS) can be observed. The discrepancies in sensitization results between different test methods ASTM A262 Practice E and electrochemical potentiokinetic reactivation (EPR) test did not allow any other conclusions to be withdrawn. Beltran et al. [19] studied the simultaneous effect of strain and grain size on the sensitization in 304 stainless steels. With decrease in grain size from 150 to 15 μm, at 625 °C, the time to sensitize decreased and the deformation effects became less apparent. It was observed that the combined effects are due to the superposition of grain size effects, that cause increase in grain boundary diffusion paths (with decrease in grain size) and strain effects that control the mechanism of diffusion. However, in the 15 μm sample, the strain effects became less prominent and the grain size effects dominated the sensitization phenomenon. The work by Yu et al. [12] showed that the degree of sensitization (DOS) decreased with increasing solution annealing temperature and time that attributed to an increase in grain size. He used cellular automaton (CA) that describes the discrete spatial and temporal microstructure evolution on mesoscale to investigate intergranular corrosion (IGC) of austenitic stainless steel. Li et al. [11] also evaluated the influence of grain growth on the chromium carbide precipitation and showed that bulk chromium carbide precipitation kinetics are reduced with an increase in grain size. Yin et al. [20] predicted the effect of grain size on the chromium concentration profiles in Inconel 690. It was observed that larger grains resulted in lower minimum grain boundary chromium concentrations and wider chromium depleted zones and consequently lower sensitization resistance. Multicomponent effects are only considered to estimate the solubility data of carbon and chromium and not in other thermodynamic and diffusion calculations.
However, the effect of grain size on the electrochemical behaviour of intergranular corrosion has not been studied in the case of 301 SS. Also, the role of grain size and carbon content on the development and the characteristics of Cr depleted zones has not been extensively studied considering the multicomponent diffusion effects. Therefore, the present work concentrated on experimental and numerical studies of grain size and carbon content effects on the precipitation of chromium carbides, sensitization and self-healing in 301 stainless steels by taking into consideration, the multicomponent diffusion during the precipitate growth.
2. Materials and Methods
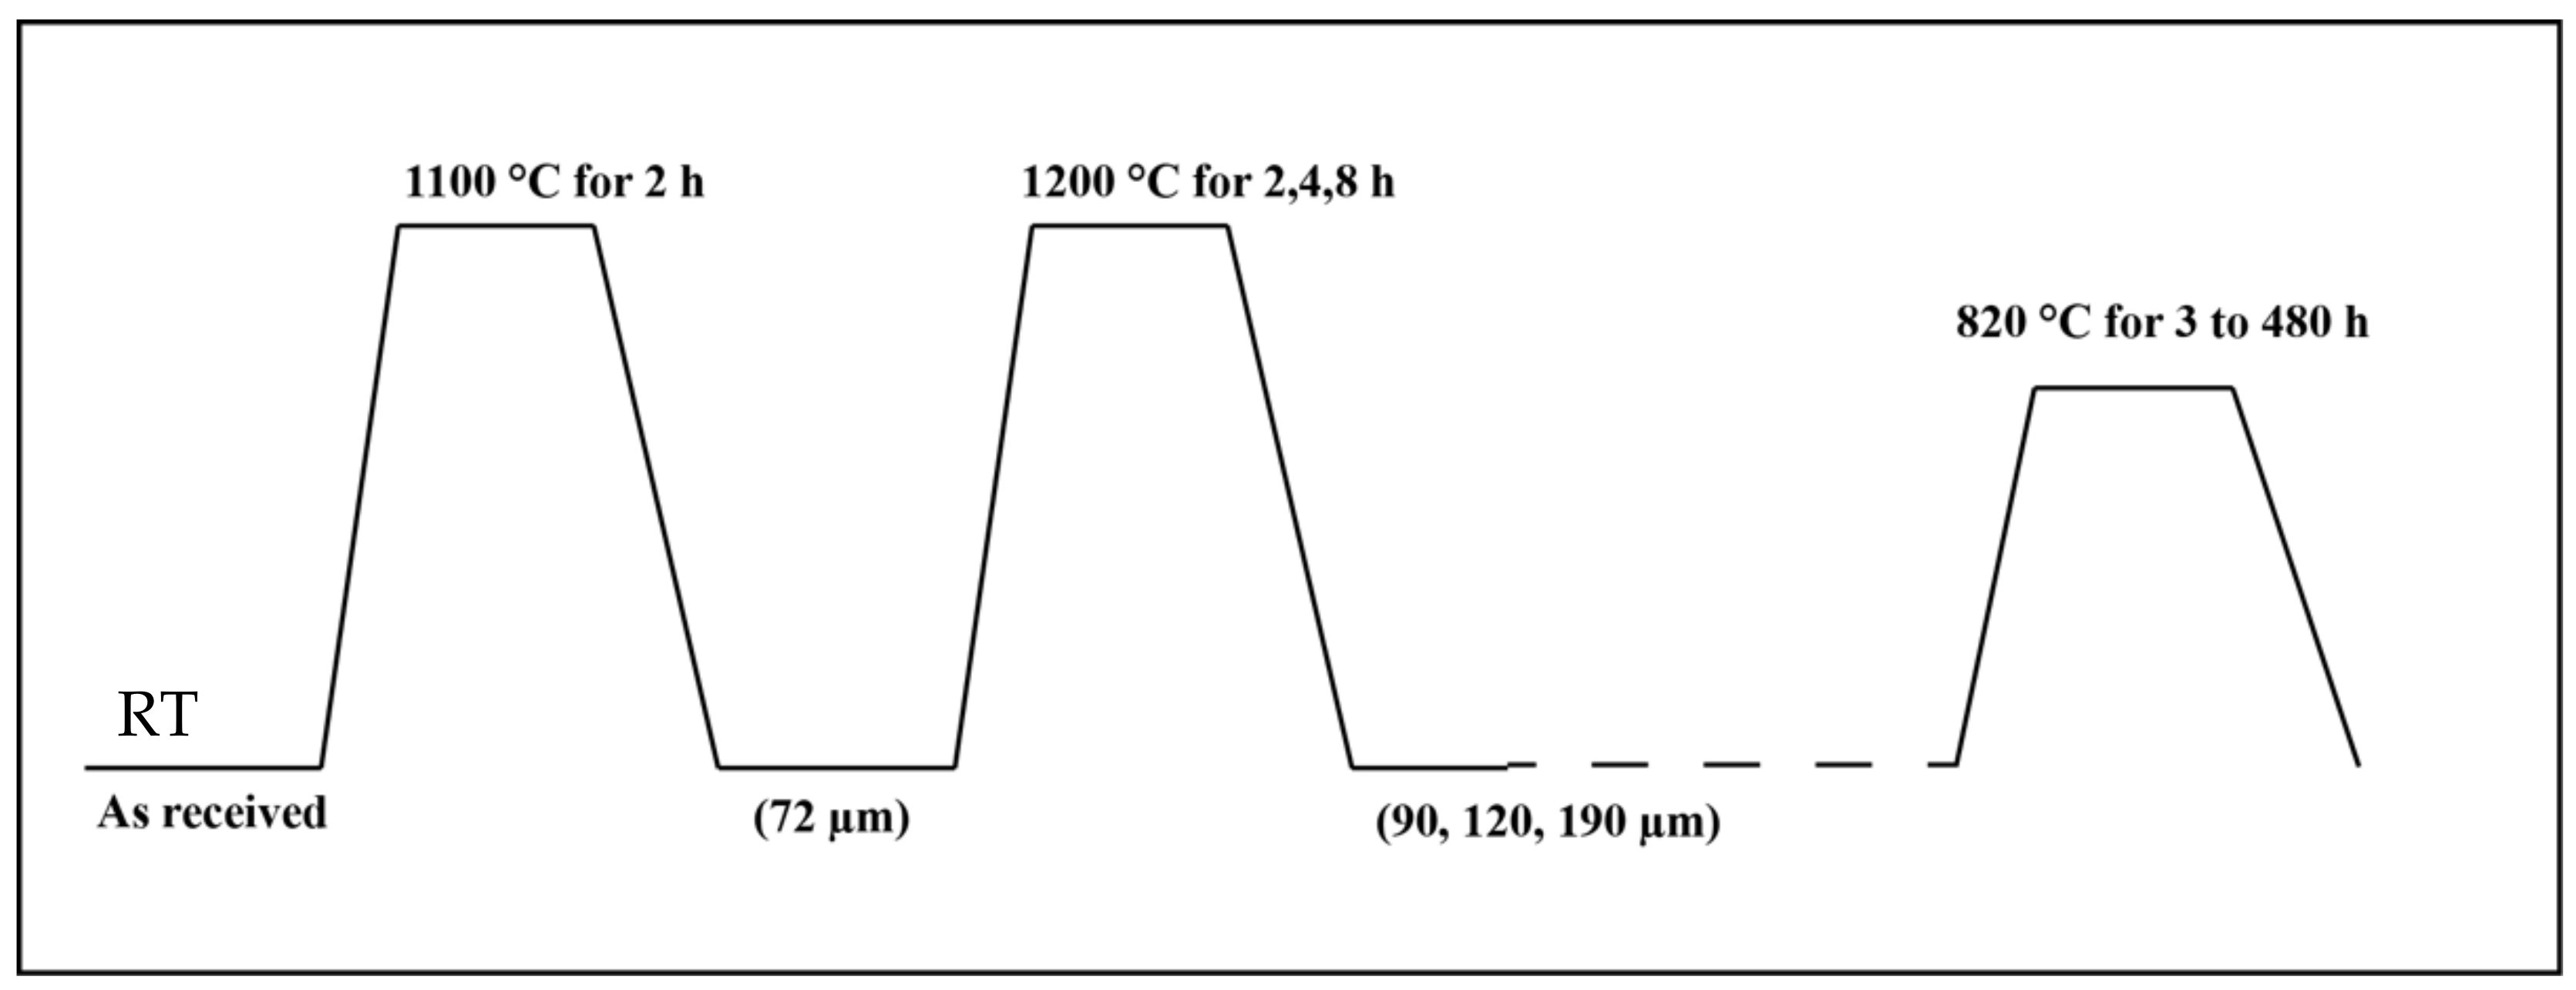
A 3 mm thick 301 austenitic stainless steel sheet with the chemical Fe-16.80Cr-6.36Ni-0.10C-0.065N (in wt.%) provided by Outokumpu Stainless Oy Tornio, Finland has been studied. All the samples were initially solution treated (ST) at 1100 °C for 2 h and water quenched for homogenization. Then, three sets of them were further annealed (A) at 1200 °C for 2 h, 4 h and 8 h to produce varying grain sizes. This resulted in a total of 4 sets of material (along with ST) with varying grain sizes. Subsequently, all the 4 sets of samples were heat treated at 820 °C for various times between 3 and 480 h, as can be seen in Figure 1 and Table 1, to generate different levels of sensitization. The samples are coded following the format “Grain size / temperature in °C-heat treatment time.” For example, the sample condition ST + 1200 °C/4 h heat treated at 820 °C for 120 h will be referred as 120 μm/820 °C-120 h (the average grain size of the sample ST + 1200 °C/4 h was 120 μm).
Field emission scanning electron microscopy (FESEM) (Zeiss Sigma, Carl Zeiss AG, Oberkochen, Germany) was used for metallographic investigation. The grain sizes were measured with the help of electron back scattered diffraction (EBSD) analysis. The EBSD mappings were performed using an accelerating voltage of 15 kV, a working distance of 15 mm, a step size of 0.65 μm and a tilt angle of 70°. In the measurement of grain sizes, the annealing twins are not counted as grains since they are not active sites for precipitation. The EBSD data were post-processed using MATLAB (version 2018b, MathWorks, Inc, Natick, MA, USA) supplemented with the MTEX toolbox [21].
All the heat treated samples were tested for sensitization using the double loop electrochemical potentiokinetic reactivation test (DL-EPR) according to the standard EN ISO 12732 [22]. This test gives the degree of sensitization as a percentage which was normalized with respect to the smallest grain sized sample used in this study, that is, 72 μm.
Normalized degree of sensitization (NDOS) = Ir × (GS/72), where Ir is the maximum current for the reactivation loop (μA·cm−2), Ia is the maximum current for the anodic loop (μA·cm−2) and GS is the grain size of the specimen expressed as an equivalent circle diameter (μm).
By normalizing the DOS values in this way, the effect of grain size on Ir through the length of grain boundary sampled is compensated and the relative normalized values of DOS better describe the relative depletion effects across the grain boundaries.
These tests were carried out using a VersaStat 3 potentiostat (AMETEK Princeton Applied Research, Oak Ridge, TN, USA) using an electrochemical cell with three electrodes with a saturated calomel electrode (SCE) as the reference electrode, platinum as the counter electrode and the sample as the working electrode. The samples were polished to a 600 grit finish before the test. The electrolyte used was 0.5 M H2SO4 + 0.01 M KSCN and the tests were run at ambient temperature with a scan rate of 6 V/h having a potential range from 0 to + 400 mV (SCE). Before the DL-EPR test, all the samples were maintained in the solution for 30 min to reach a steady state open-circuit potential. In this test, the polarization curve in the anodic direction (activation) and the corrosion current density associated with it corresponds to the corrosion across the whole specimen surface, while the corrosion current density observed during polarization in the cathodic direction (reactivation) corresponds to corrosion at the intersection of the grain boundaries with the surface [23]. Thus, the ratio of these two corrosion current densities gives a quantitative value of the degree of sensitization of the material. All of the experiments are repeated thrice and the observed DOS values are average values.
A 200 kV energy filtered scanning transmission electron microscopy (JOEL JEM-2200FS EFTEM/STEM) (JOEL Ltd., Akishima, Kanto, Japan) was used for the detailed observation of grain boundaries and precipitates in the transmission and scanning transmission (STEM) modes. 0.1 mm thick wafers are made by polishing, from which 3 mm diameter transmission electron microscopy samples were punched. These were further ground to 0.08 mm before electropolishing at 25 V in an electrolyte consisting of perchloric acid, butyl cellosolve, ethanol and distilled water.
The growth of M23C6 grain boundary precipitates was modelled using TC-DICTRA (ThermoCalc 2019a, Solna, Sweden) a tool for simulating diffusion in multicomponent alloys [24]. The simulations were performed taking into consideration multicomponent effects (Fe, Cr, Ni, Si, C and N) using the thermodynamic database TCFE7 and the mobility database of Thermo-Calc MOBFE2 [25]. It is assumed that M23C6 grows behind a planar austenite–carbide interface and thus the problem is reduced to one dimension. This seems justified as grain boundaries are expected to act as collector plates for the substitutional atoms that diffuse through the matrix to the grain boundaries since the mobility of substitutional alloying elements along the grain boundaries is much higher than through the austenite matrix [26]. The model used in the DICTRA simulations assumes local equilibrium at the precipitate—austenite interface and provides a numerical solution to the multi-component diffusion equations [24]. The composition at the interface between M23C6 carbide—austenite matrix is governed by the tie line that changes as the growth of the carbide proceeds. The activity of the carbon was assumed to be constant throughout the material owing to its higher diffusivity. The operative tie-line is then obtained by the iso-activity line for carbon that passes through the bulk composition of the material and thereby the initial interfacial concentrations. The determination of operating tie-line becomes difficult in multi-component systems. The iterative method to determine this operating tie line is mentioned in the work by Larsson et al. [27] and also employed by Kolli et al. [28]. The model initially considers the M23C6 carbide as an inactive phase and changes its status to active phase when there is enough thermodynamic potential for the formation for the phase. Automatic time step control is chosen for the simulations. In order to take into account the effect of soft-impingement, the width of the austenite from which C can be withdrawn was taken to be one sixth of the grain size as suggested by Sourmail [29] and also employed by Kolli et al. [30] but additionally, the effect of taking the whole average equivalent circle diameter (ECD) grain size and half the ECD grain size were also simulated.
3. Results
3.1. Equilibrium Calculations
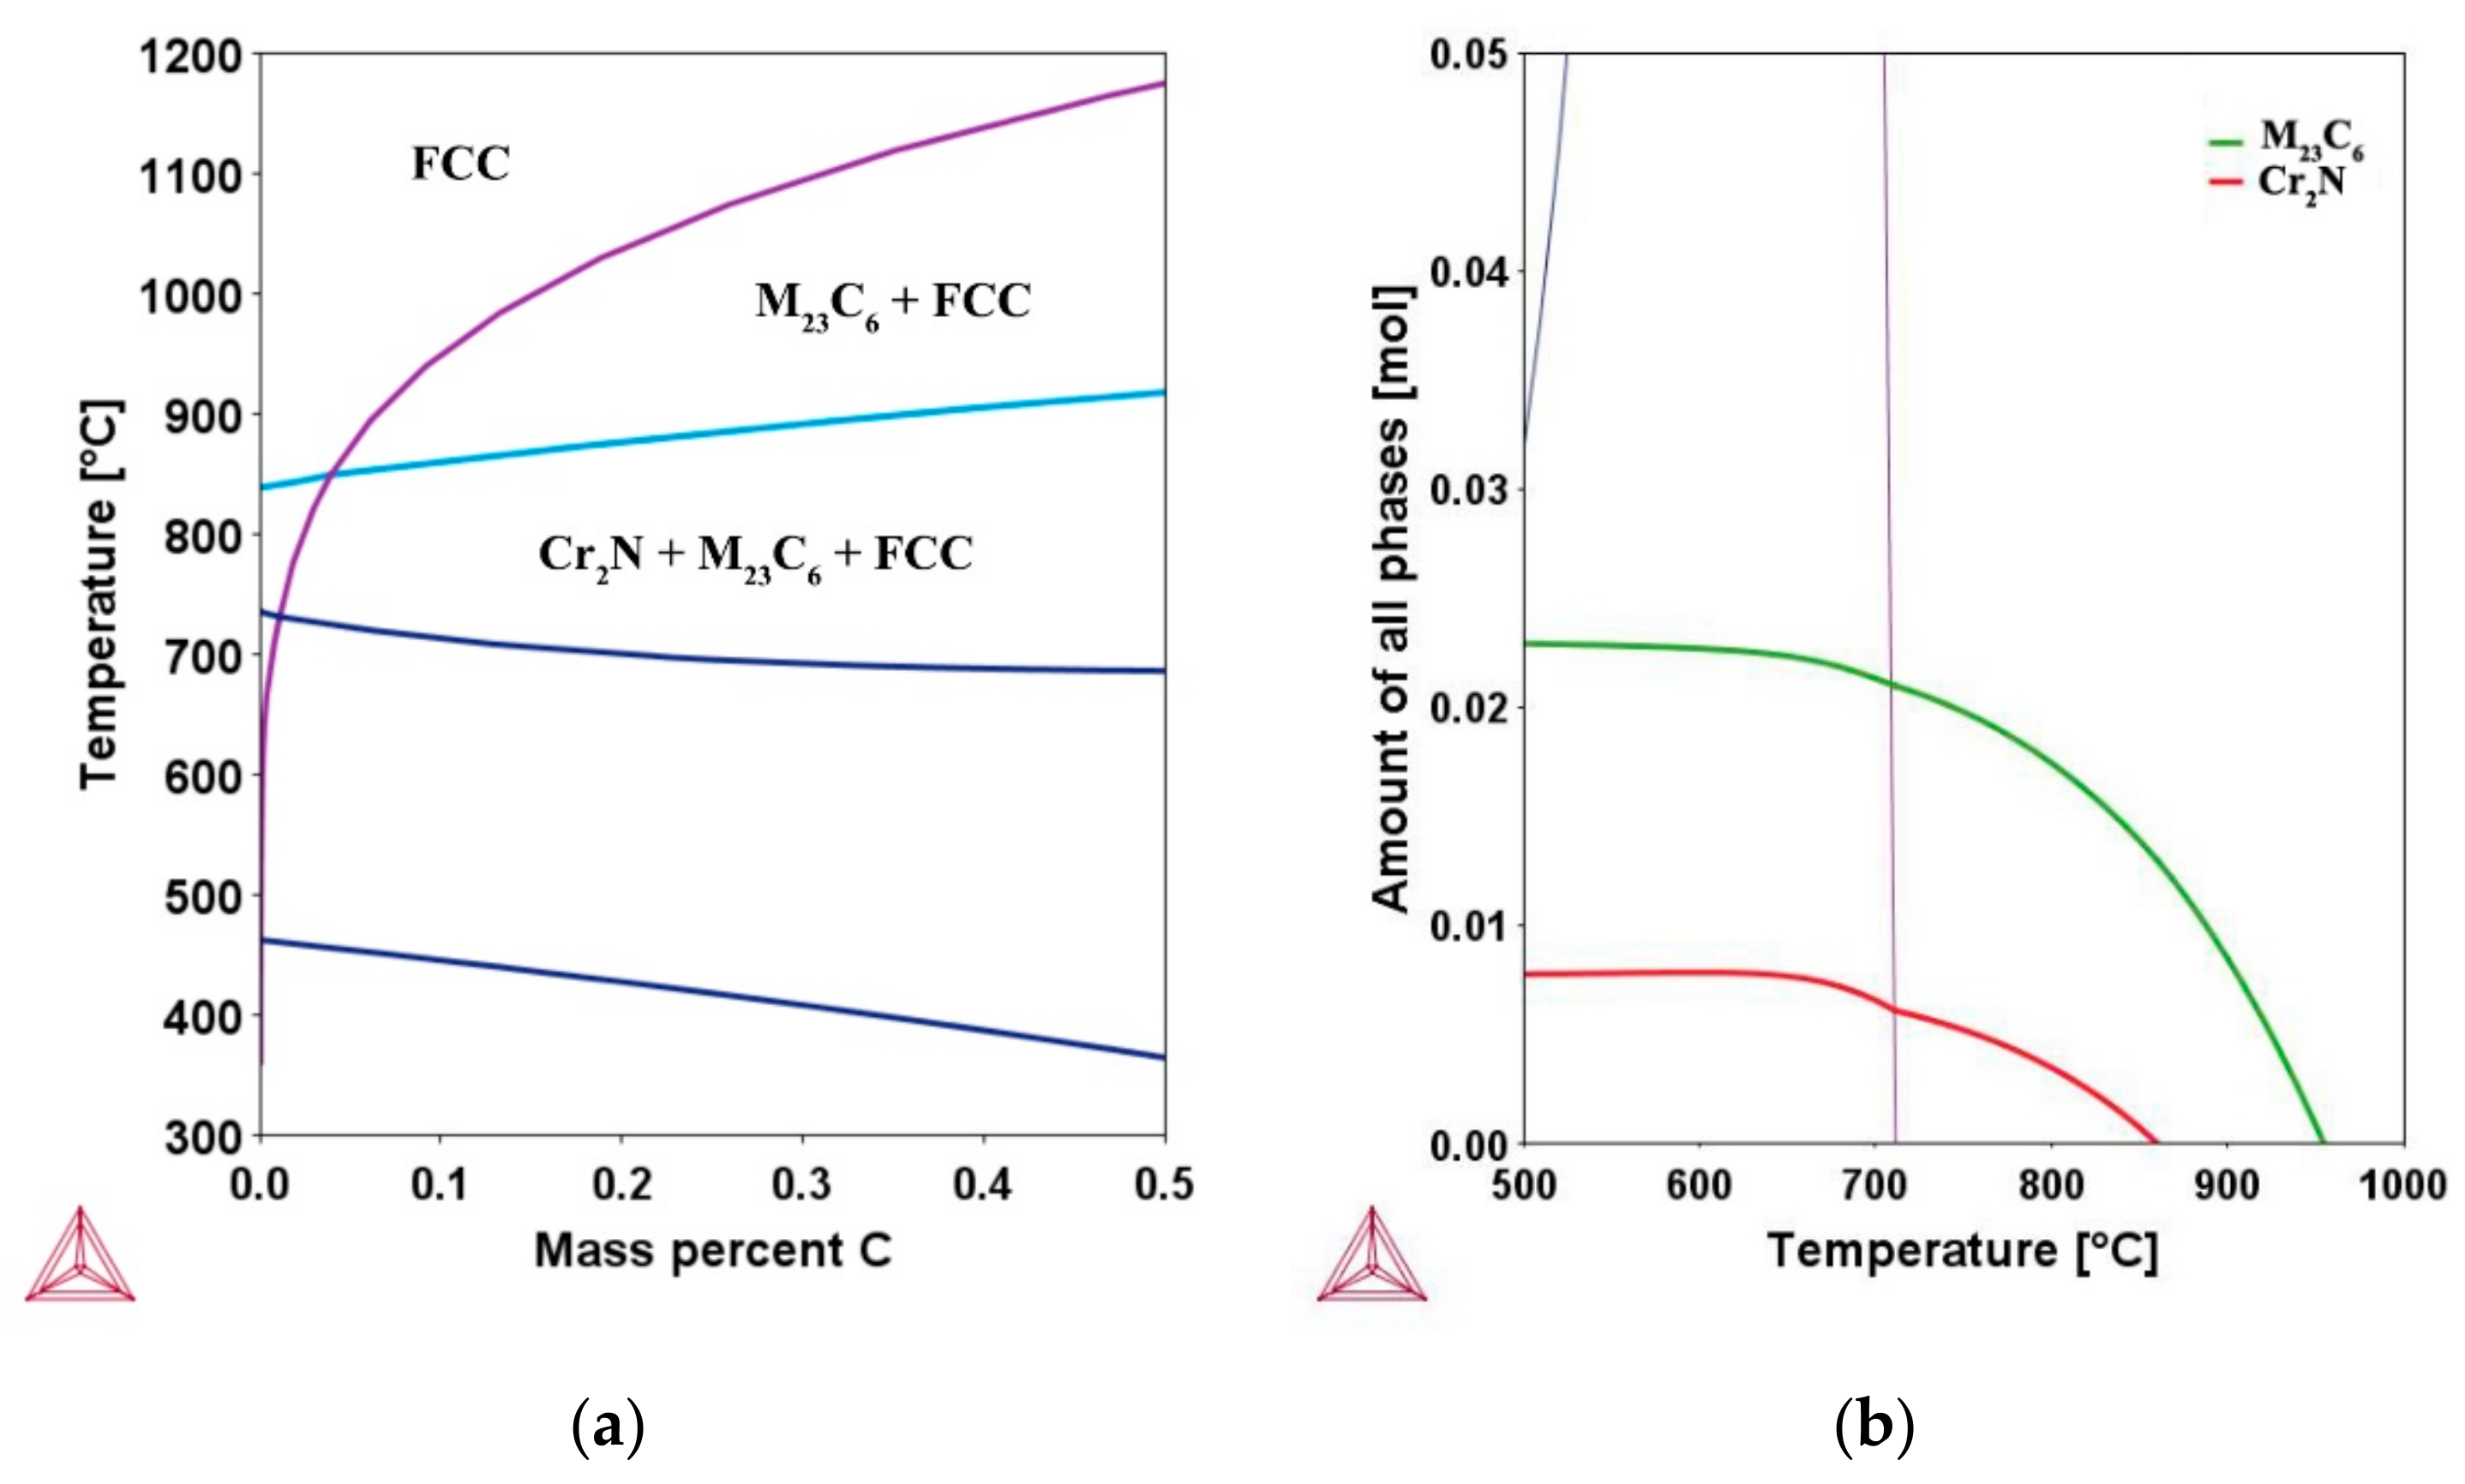
Heat treating austenite results in significant microstructural changes in the temperature ranges 500–900 °C that depend on the chemical composition, grain size and the exposure time. Precipitate phases nucleate on the high energy regions like the grain boundaries and grow. A phase diagram for the studied material calculated with the help of Thermo-Calc is presented in Figure 2a. For 0.1 wt.% C, the equilibrium phases in the sensitization temperature regime are austenite, M23C6 and Cr2N. All these phases have been observed in the microstructures of the different heat treatment conditions used in this work. The property diagram in the Figure 2b shows the equilibrium number of moles of the phases in 100 g of alloy as a function of temperature. At the considered temperature 820 °C, Thermo-Calc predicts the presence of chromium carbide (M23C6) and chromium nitride (Cr2N) and austenite under equilibrium conditions.
3.2. Grain Sizes
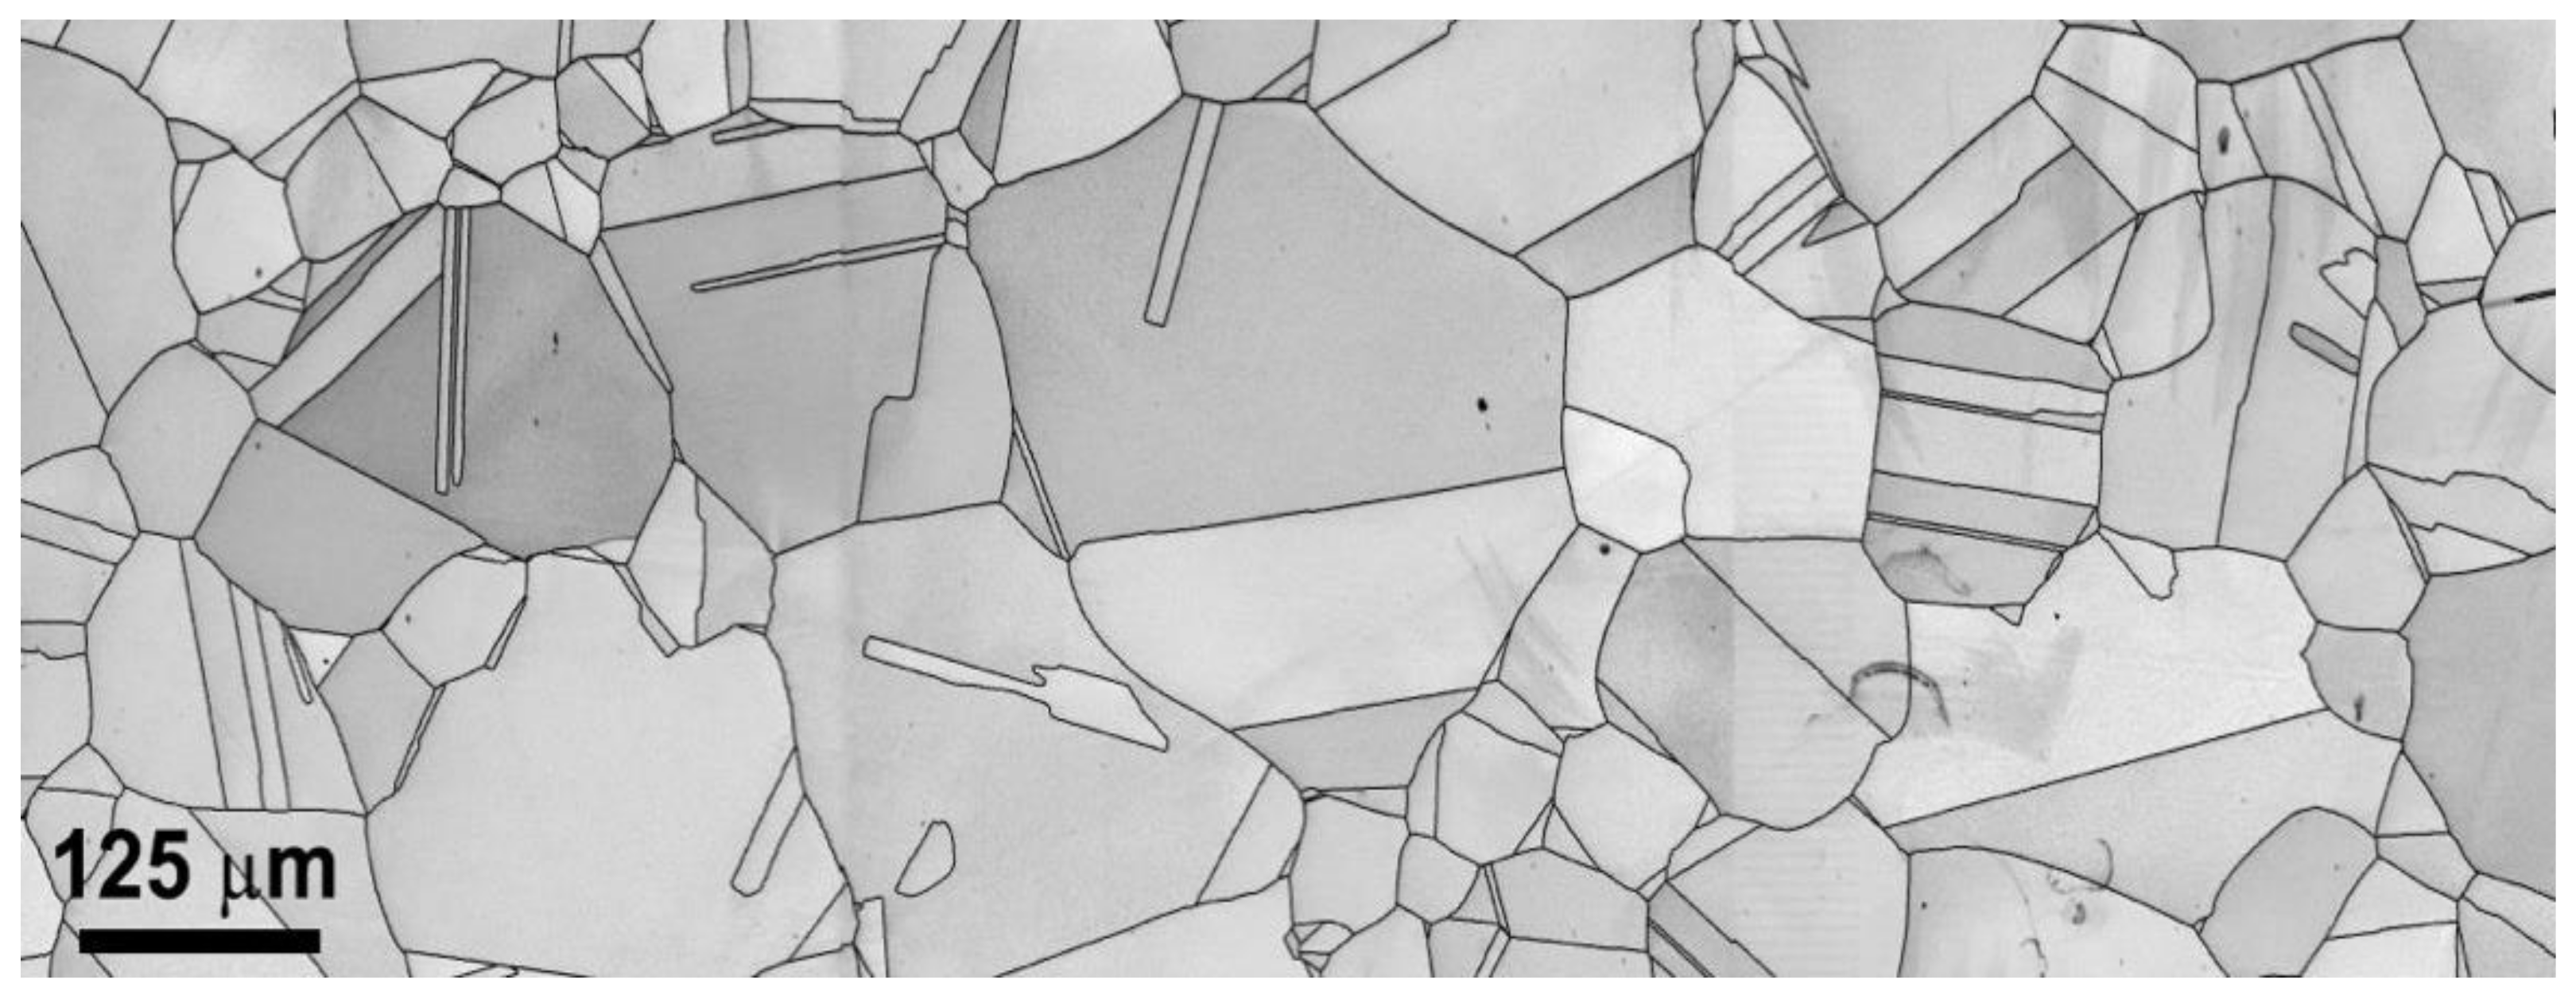
Equivalent circle diameters (ECD) of the grains with a grain boundary misorientation angle > 15° were obtained from the EBSD mappings using the MTEX toolbox. Figure 3 shows a typical microstructure as seen with an EBSD image for the sample condition ST + 1200 °C for 4 h.
The ST sample has the smallest grain size with an average ECD of 72 μm. The specimen conditions ST + 1200 °C for 2 h, 4 h, 8 h have average ECD values of 90, 120 and 190 μm respectively. Glow discharge optical emission spectroscopy of the specimens at the depth used for the DL-EPR tests revealed that the samples heat treated at 1200 °C to obtain increased grain sizes suffered some decarburization as can be seen in Table 2.
3.3. Precipitates and Chromium Depletion
3.3.1. M23C6
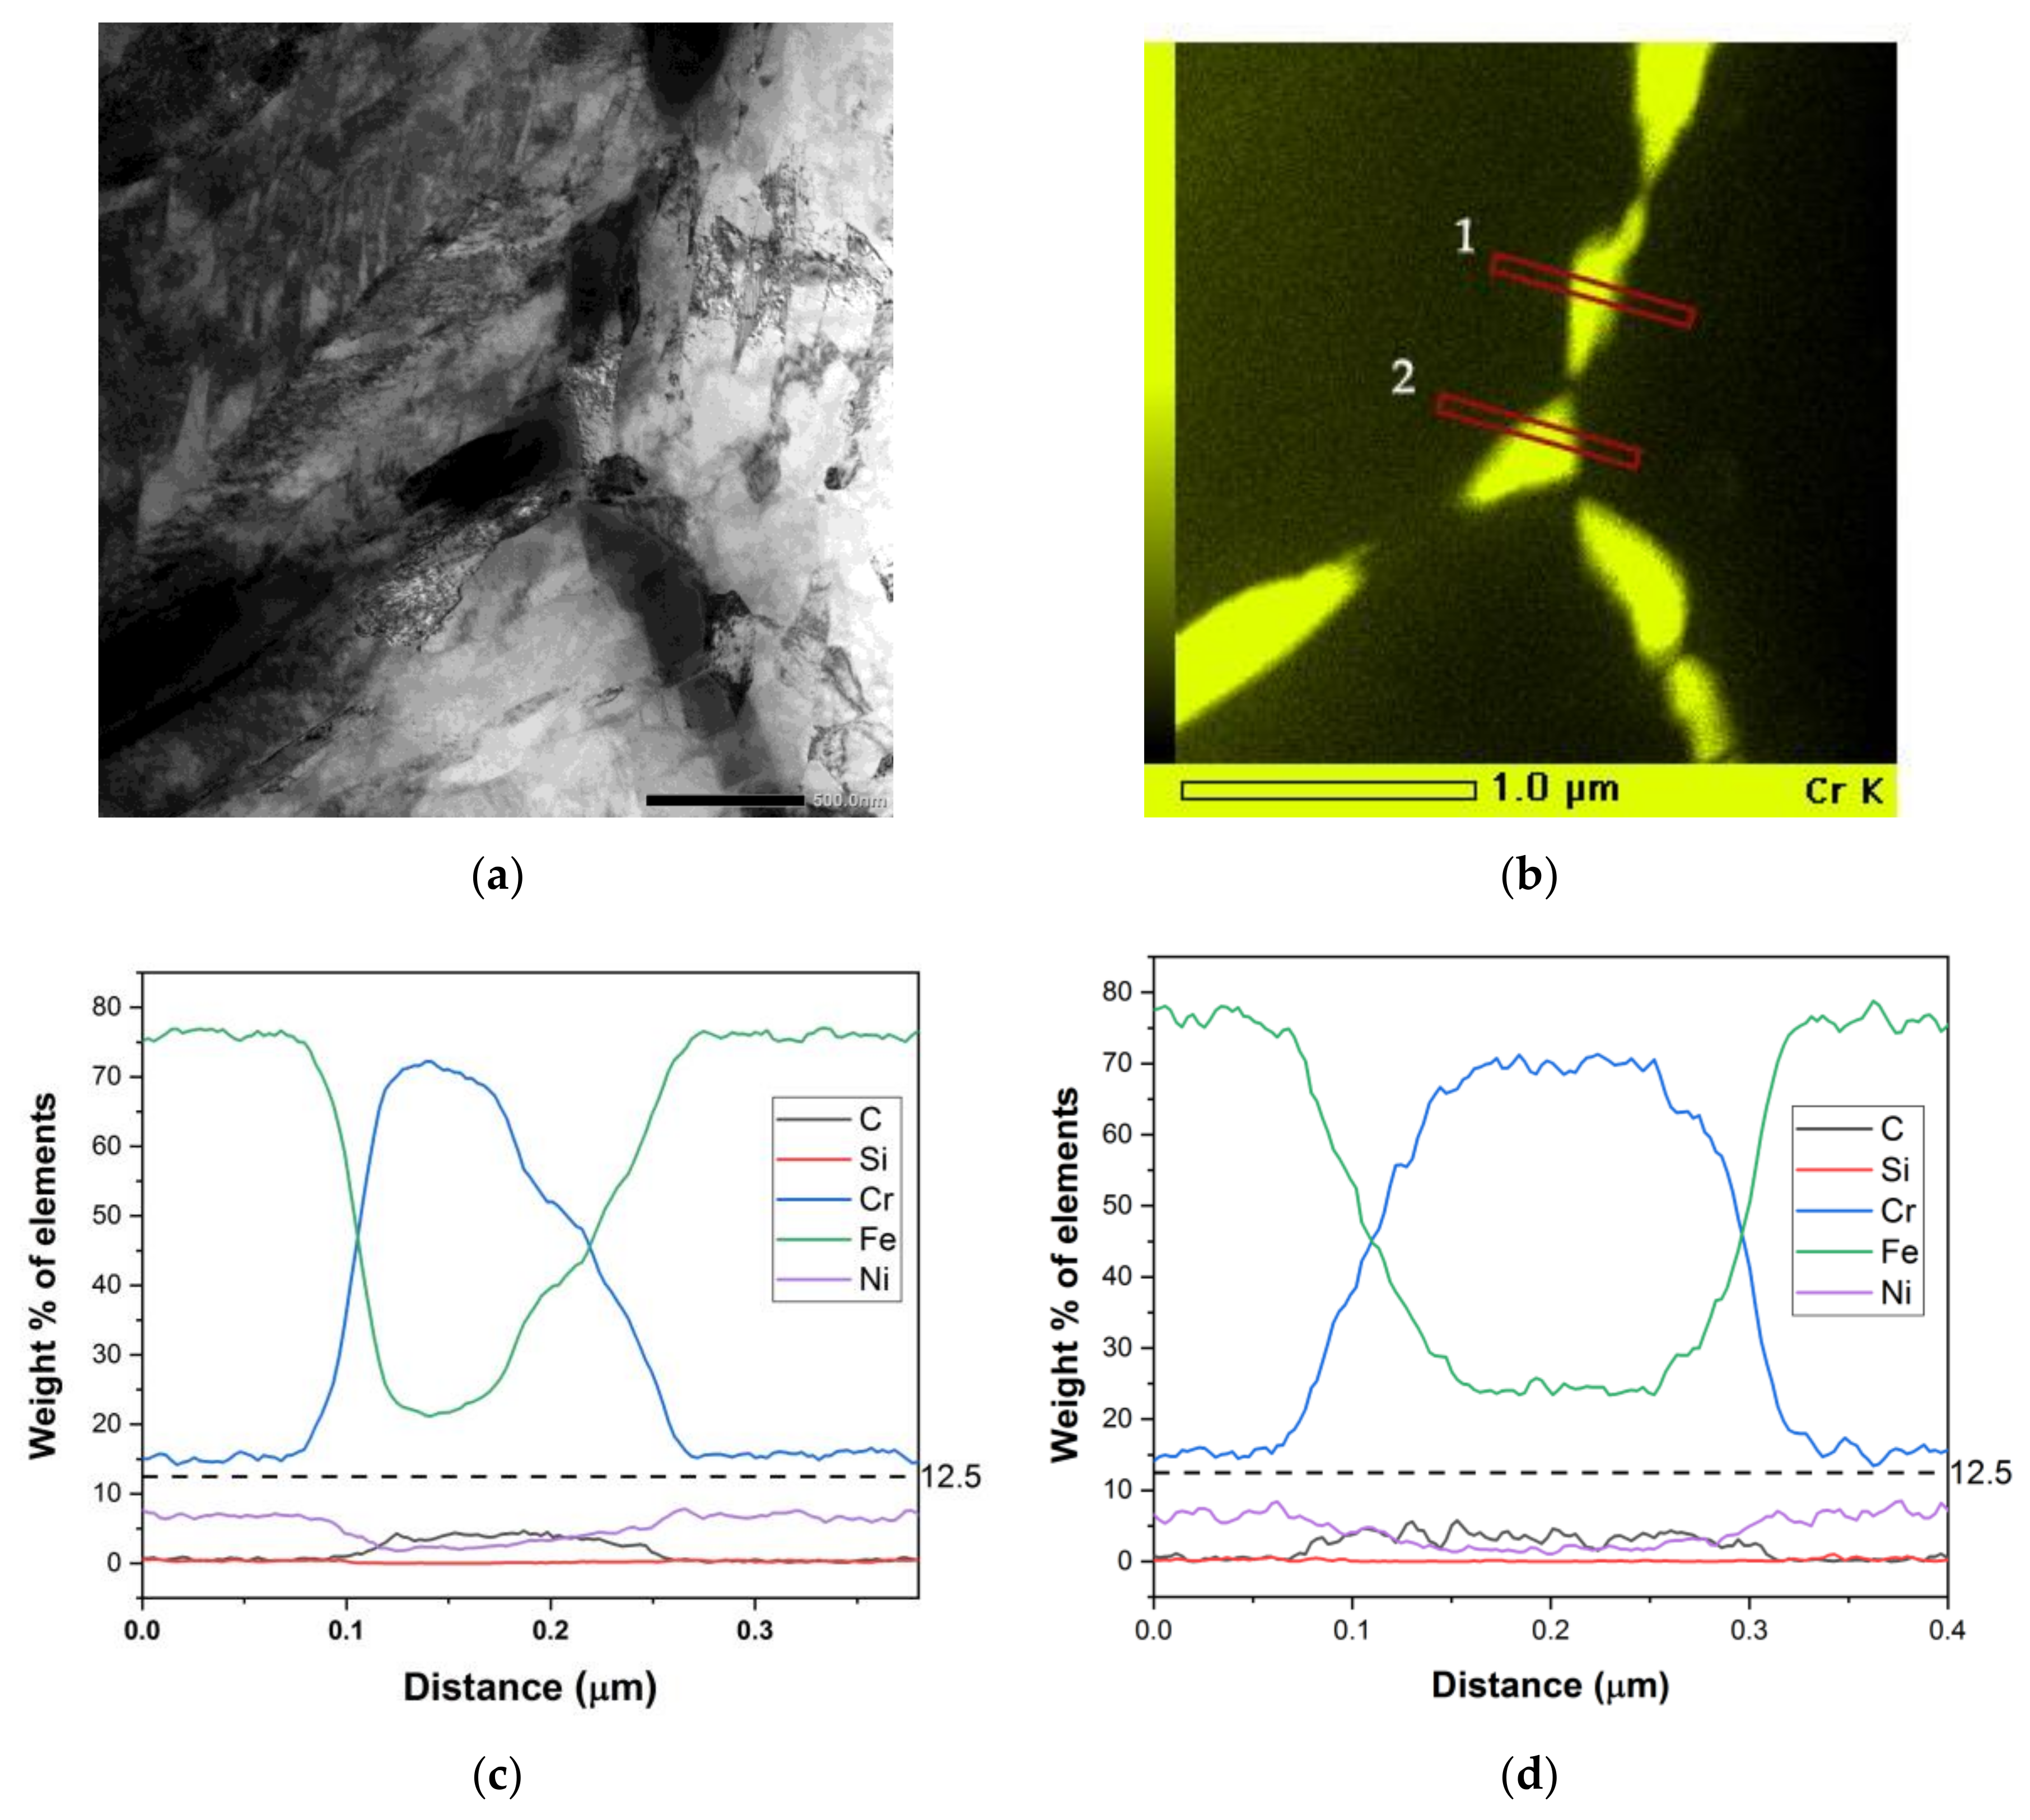
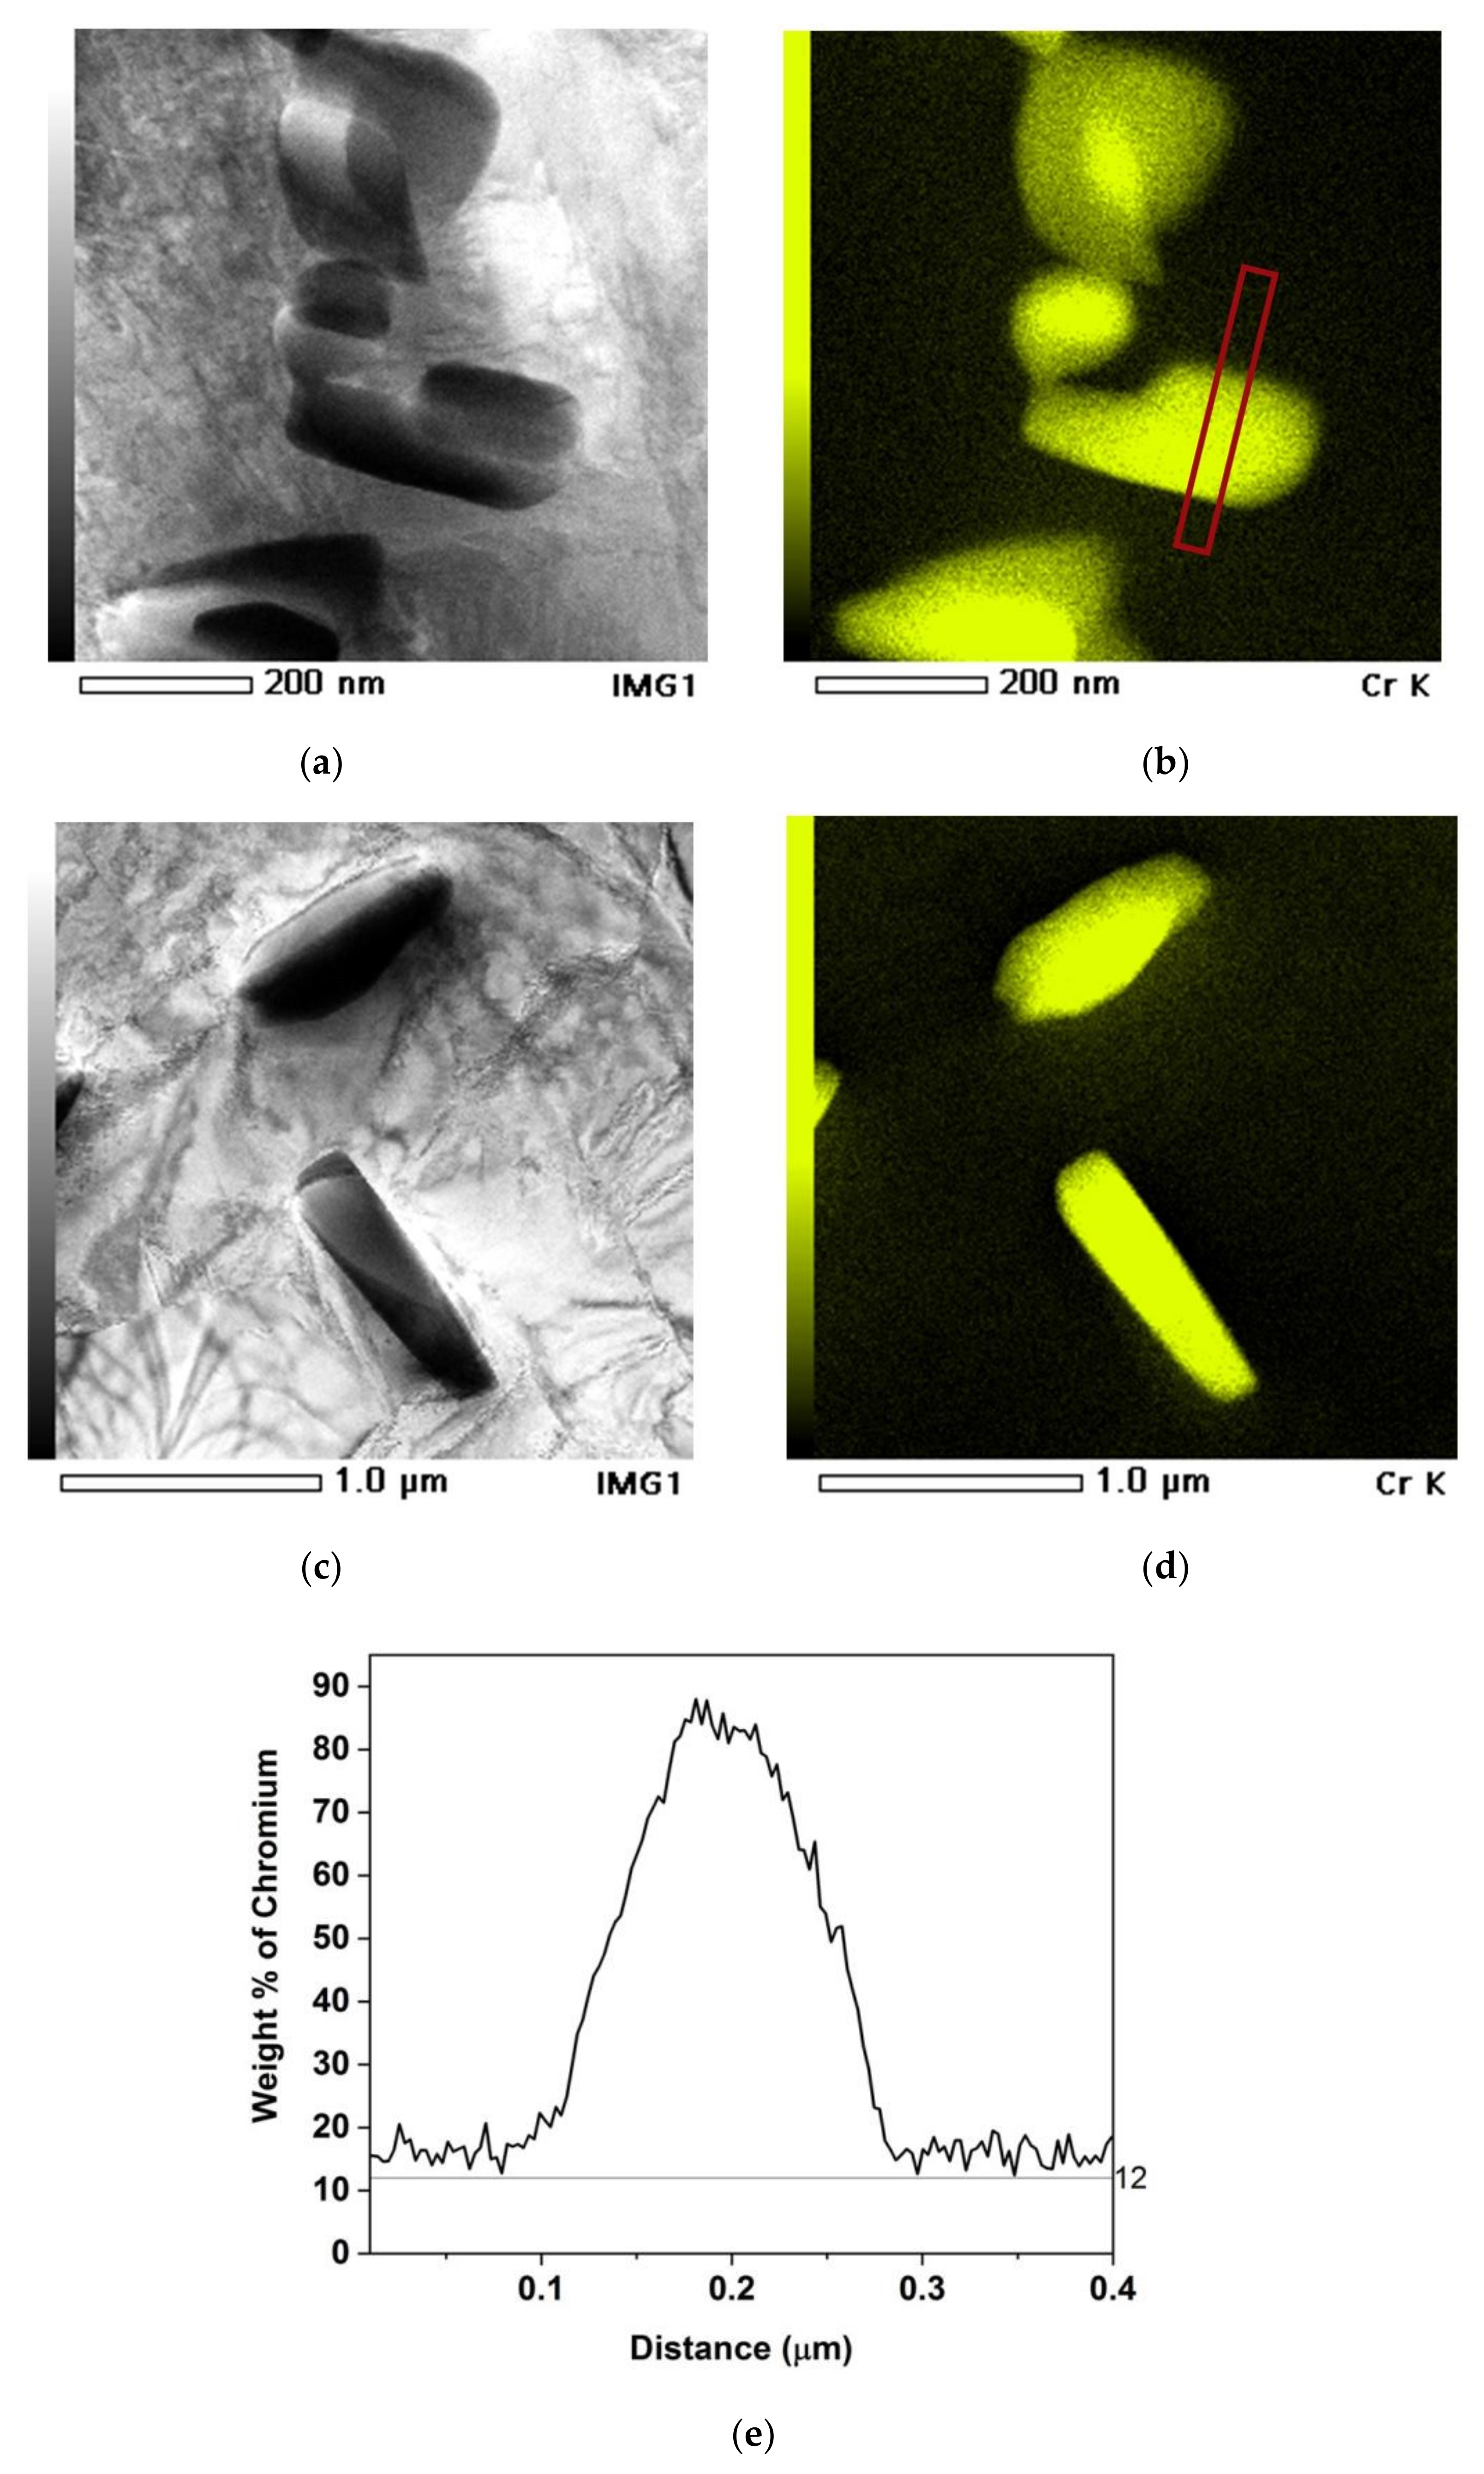
For the condition 72 μm / 820 °C-120 h, Figure 4 shows precipitates on grain boundaries together with EDS mappings and elemental concentration profiles. The EDS analyses of the precipitates confirm that the observed precipitates are M23C6 carbides. According to the DL-EPR measurements that are shown in the later sections, this sample condition was completely self-healed. The concentration profiles along the red lines in Figure 4b are shown in Figure 4c,d. Even though the Cr concentration right at the carbide–austenite interface cannot be seen due to the inclination of the interface with respect to the electron beam, the profiles indicate that the Cr concentration in the vicinity of the grain boundary carbides does not go below 12 wt.%. The chromium depleted occurring during the sensitization phase has been partially replenished.
Besides intergranular precipitates that form at relatively short times, after long heat treatments, intragranular precipitates were also observed. Figure 5 shows bright field transmission electron microscopy (TEM) micrographs together with Cr mappings and Cr concentration profiles for intragranular M23C6 carbides formed in samples 120 μm/820 °C-168 h and 190 μm /820 °C-240 h. Again, it can be seen that the Cr concentration in the vicinity of the carbide did not go below 12 wt.%.
3.3.2. Cr2N
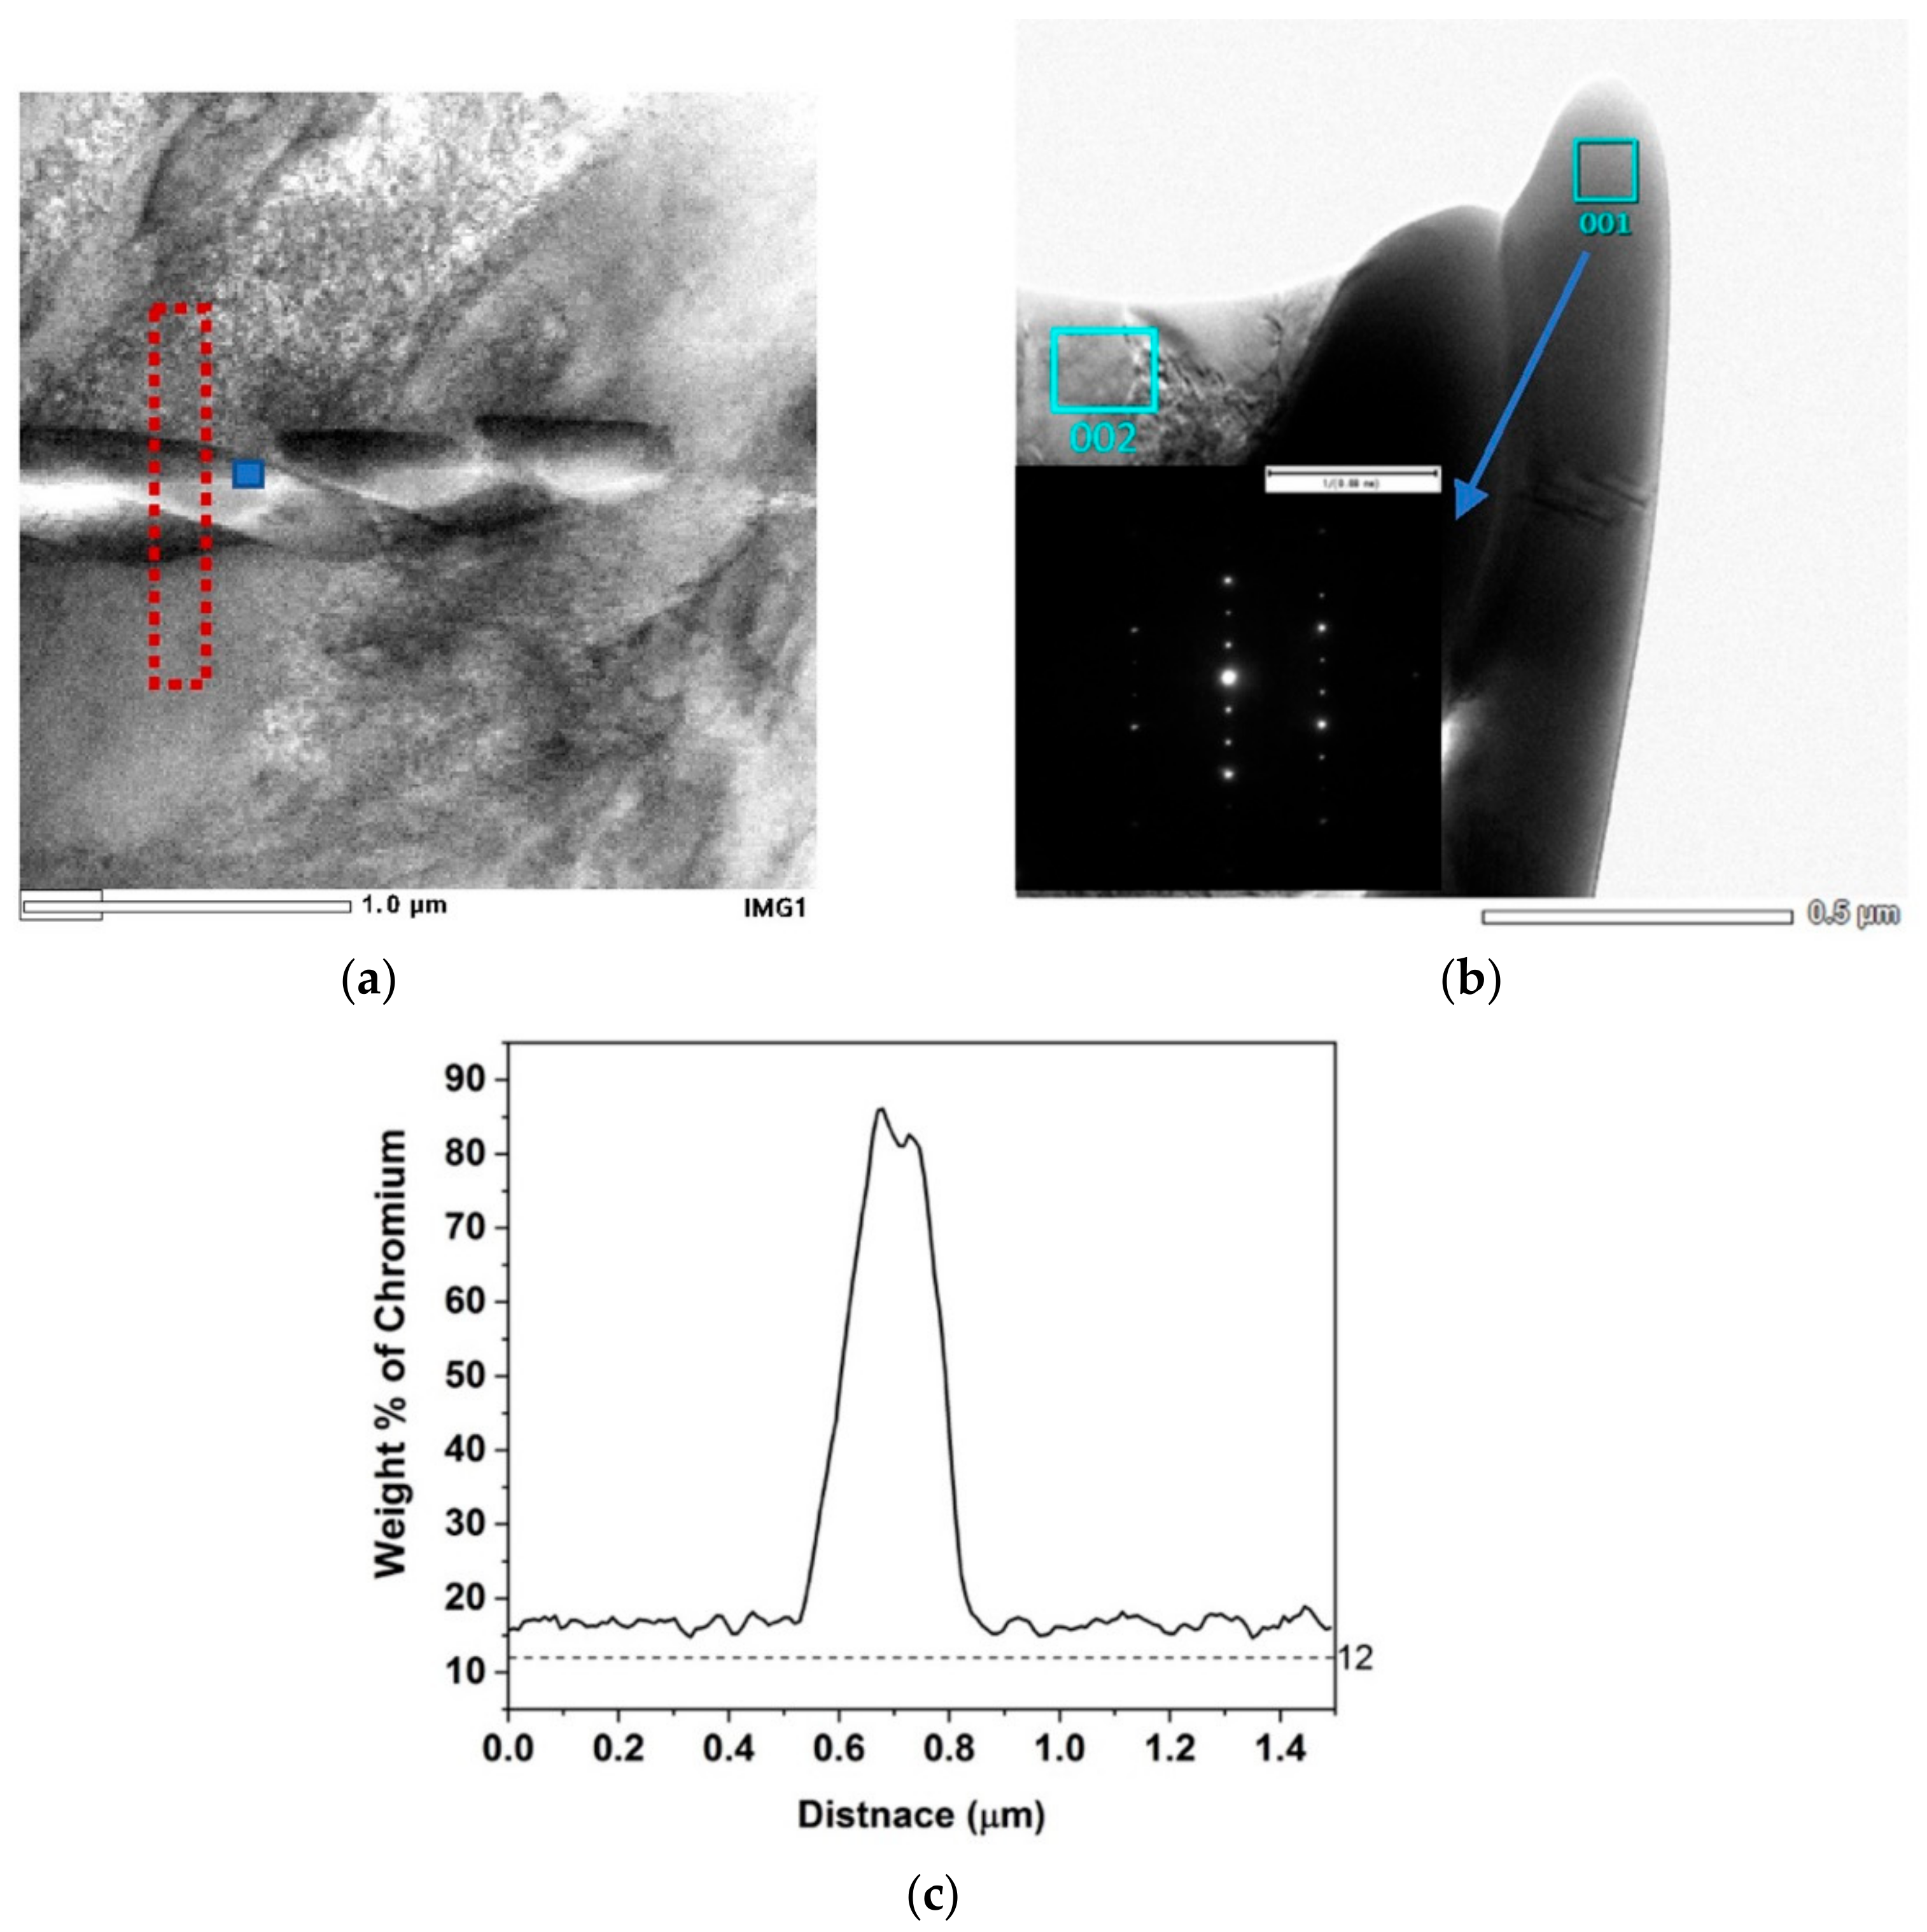
In the case of the large grained samples (120, 190 μm) that are heat treated for a long time at 820 °C (240 h), chromium nitride precipitates are observed. Figure 6 shows a STEM image of such precipitates (190 μm/820 °C-240 h) together with a selected area electron diffraction (SAD) pattern of one of the precipitates revealing the fact that it was Cr2N with a hexagonal crystal structure. A point analysis at the blue spot in Figure 6a revealed the precipitate composition to be 10.52N-82Cr-3Fe (wt.%). Cr depletion below that of the bulk is observed but the depleted Cr profiles did not go below 12%.
3.4. Degree of Sensitization
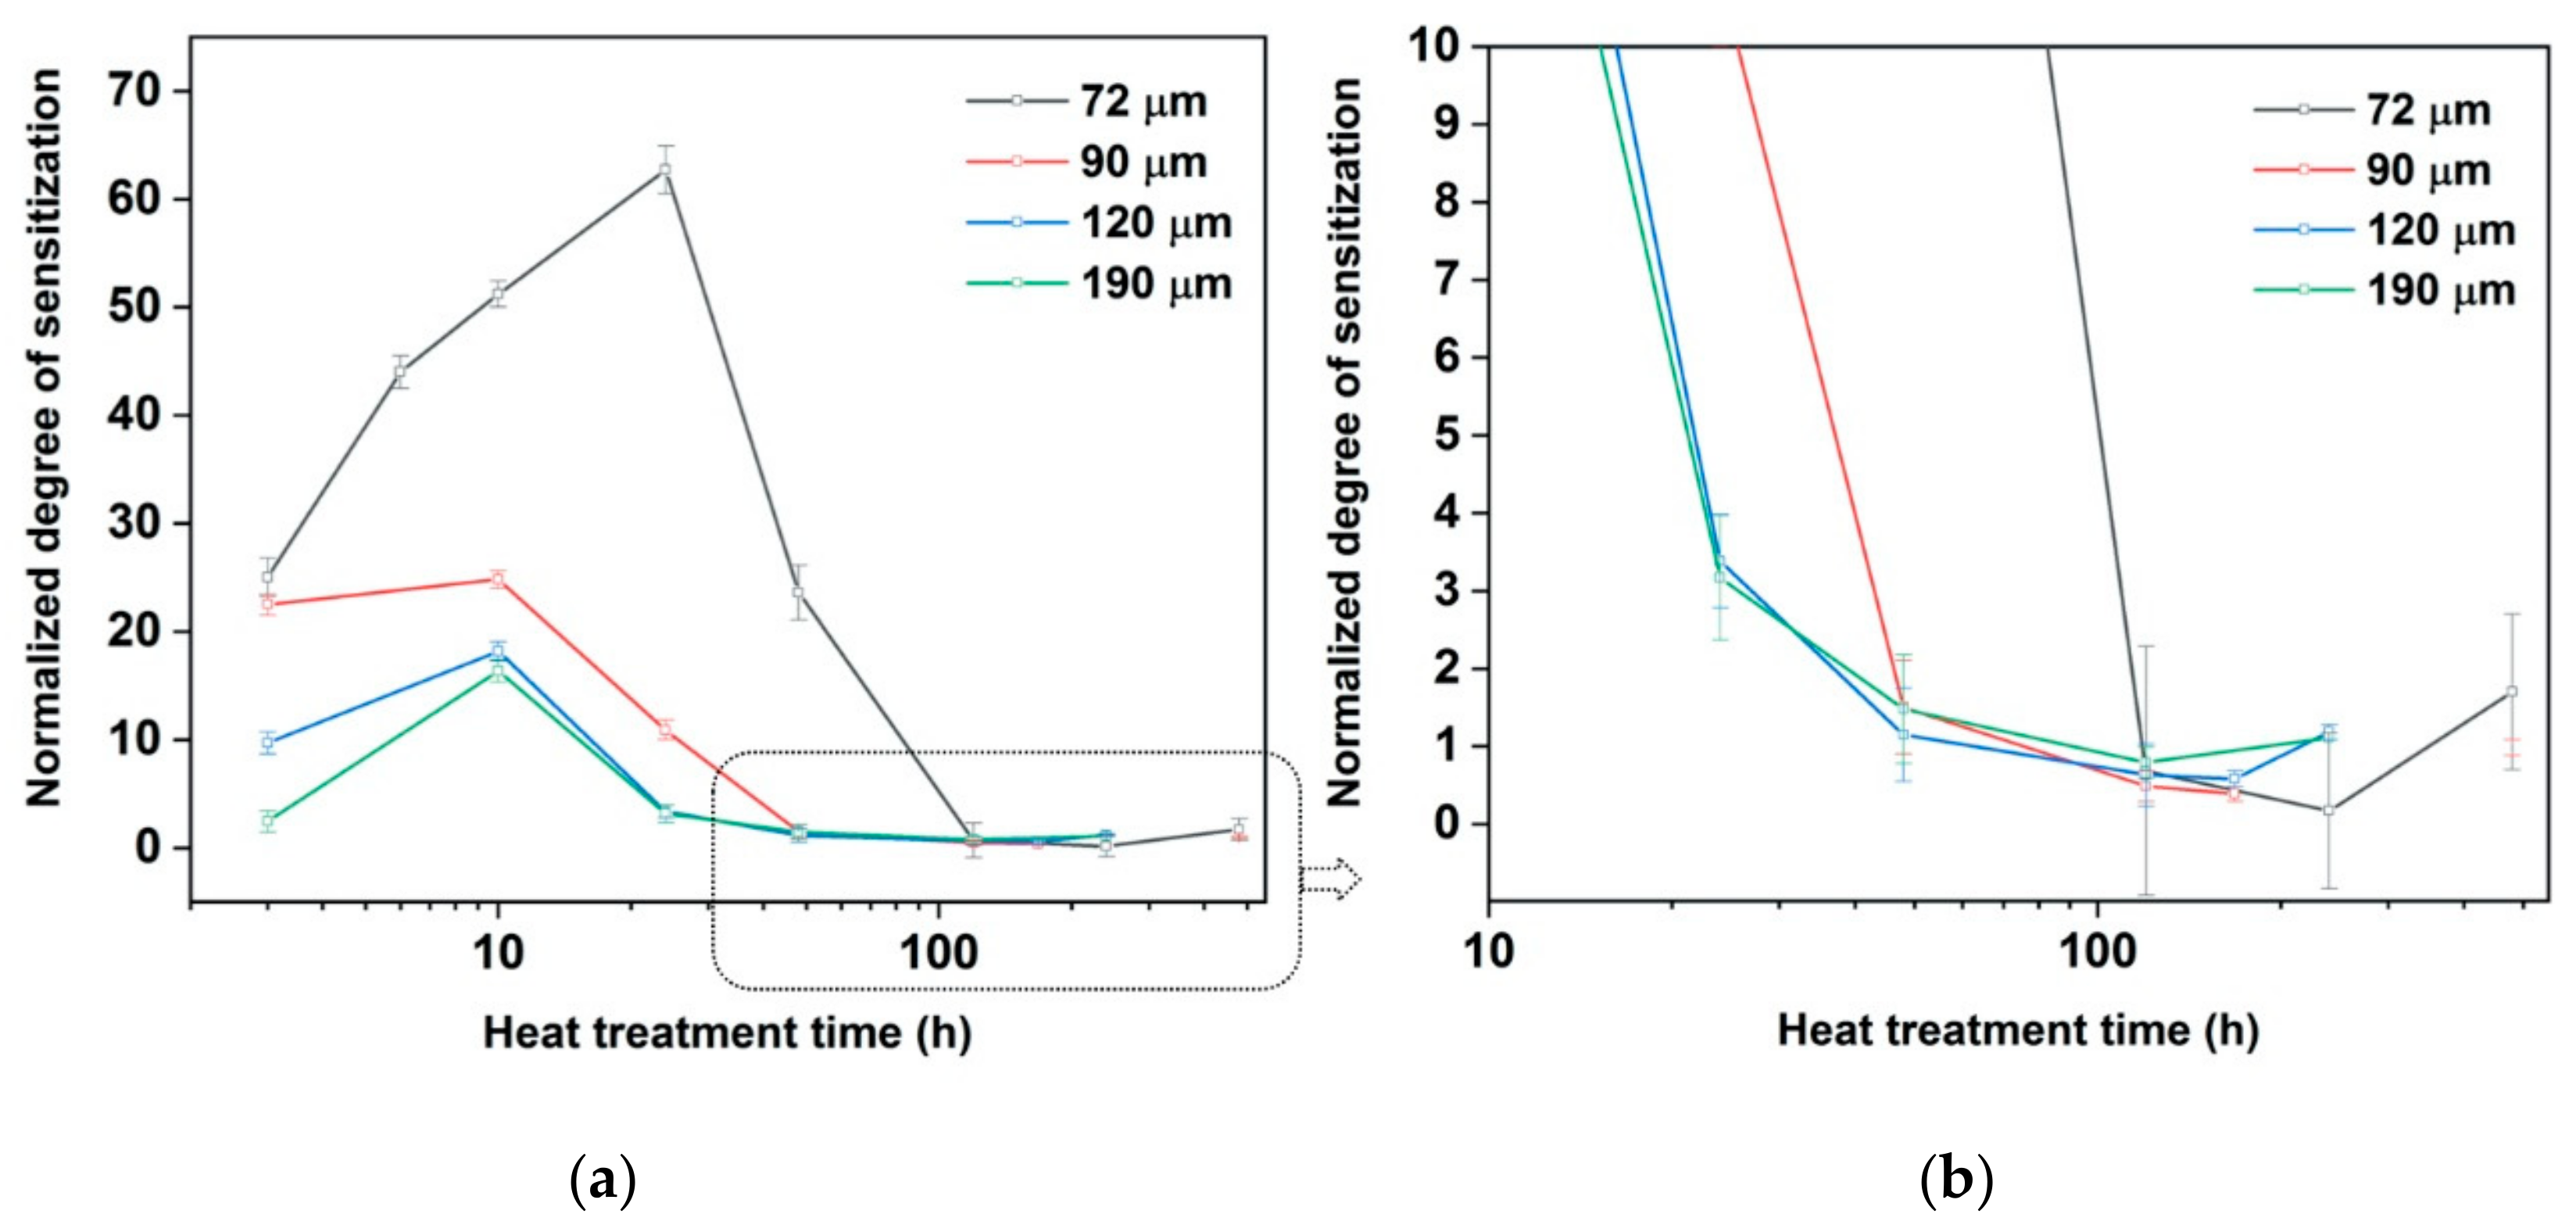
Figure 7 shows normalized DOS values (NDOS) obtained from the DL-EPR test results on the samples heat treated for various times. The normalization of the DOS values was done using average grain size obtained from the mean ECD grain sizes as described above. It can be seen that even after normalization, which compensates the reduction in the specific grain boundary length as grain size increases, an increase in grain size generally leads to a lower normalized degree of sensitization during both the sensitization and self-healing phases. The ST sample with a grain size of 72 μm became highly sensitized with a high peak DOS. As the C content is lower in large grained samples, the C available for M23C6 formation is lower and thereby lower peak NDOS values are observed in these samples. Also, with decrease in C content, the nose of temperature-time-sensitization diagram shifts towards right and to lower temperatures [10,31]. So, the temperature at which peak NDOS can be observed will be lower for the sample conditions 90–190 μm. This is the reason for the decrease in NDOS with an increase in grain size from 72–190 μm.
It can be observed that with an increase in grain size and reduction in carbon content the time to reach the peak NDOS is reduced. Figure 7b shows that after heat treating the samples with mean grain sizes 120 and 190 μm for 240 h, a small increase in NDOS is observed. However, the increase is small compared to the scatter in the measured values.
4. Modelling the Growth of Carbides
The TC-DICTRA simulations of the growth of M23C6 were performed taking into consideration the multicomponent effects (Fe, Cr, Ni, Si, C and N) using the thermodynamic database TCFE7 and the mobility database inside Thermo-Calc, MOBFE2. In the thermodynamic database, the M23C6 is treated as stoichiometric and diffusion inside the carbide is not considered.
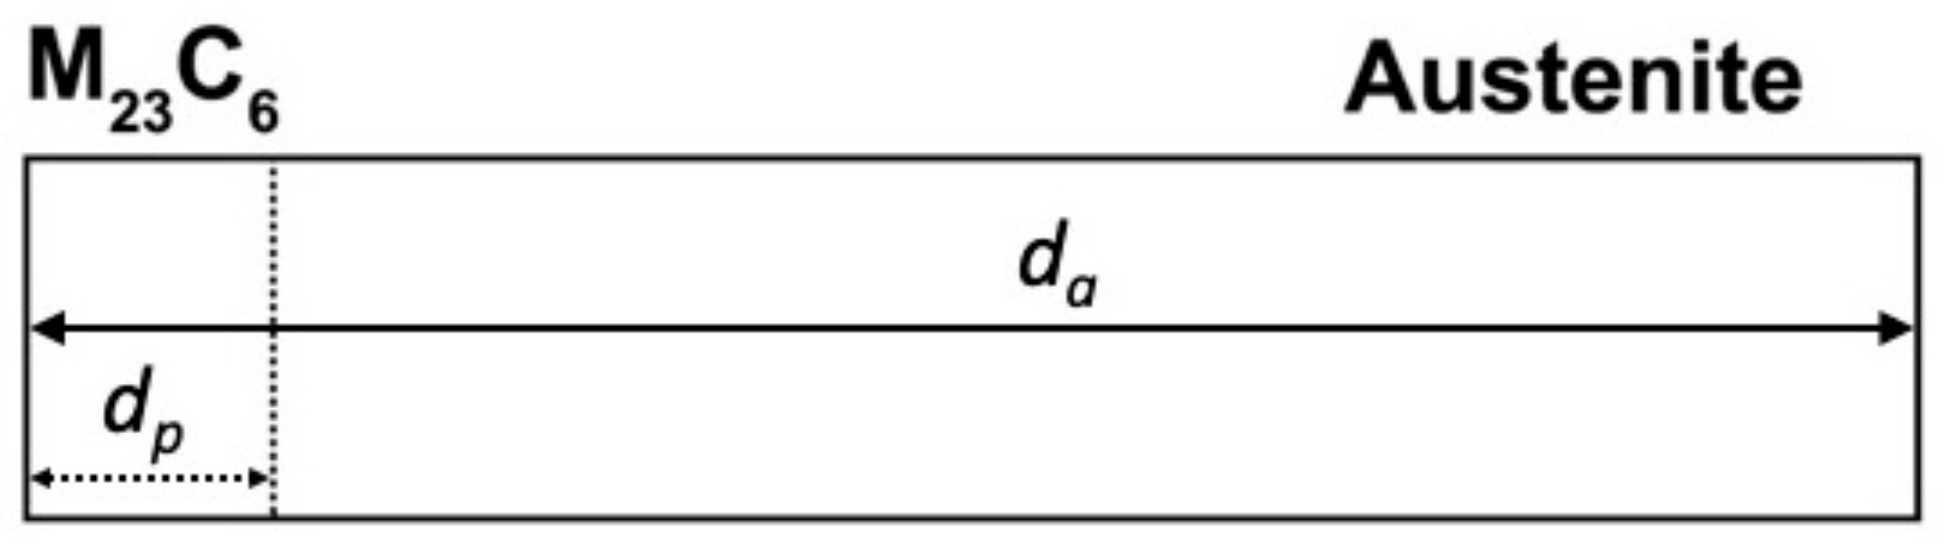
The growth problem is reduced to one dimension by assuming that M23C6 grows into austenite behind a planar interface as shown in Figure 8, at any given time during the growth of M23C6 carbide. It was also assumed that the initial width of austenite from which C can be withdrawn (da) is 1/6th of the average ECD (da changes with time). As discussed below, other assumptions regarding da produced unsatisfactory models. The value of dp (carbide thickness) is considered to be zero at the start of carbide growth. It is also assumed that the nucleation time for grain boundary M23C6 is negligible such that growth starts as soon as the isothermal temperature is reached, that is, at zero time.
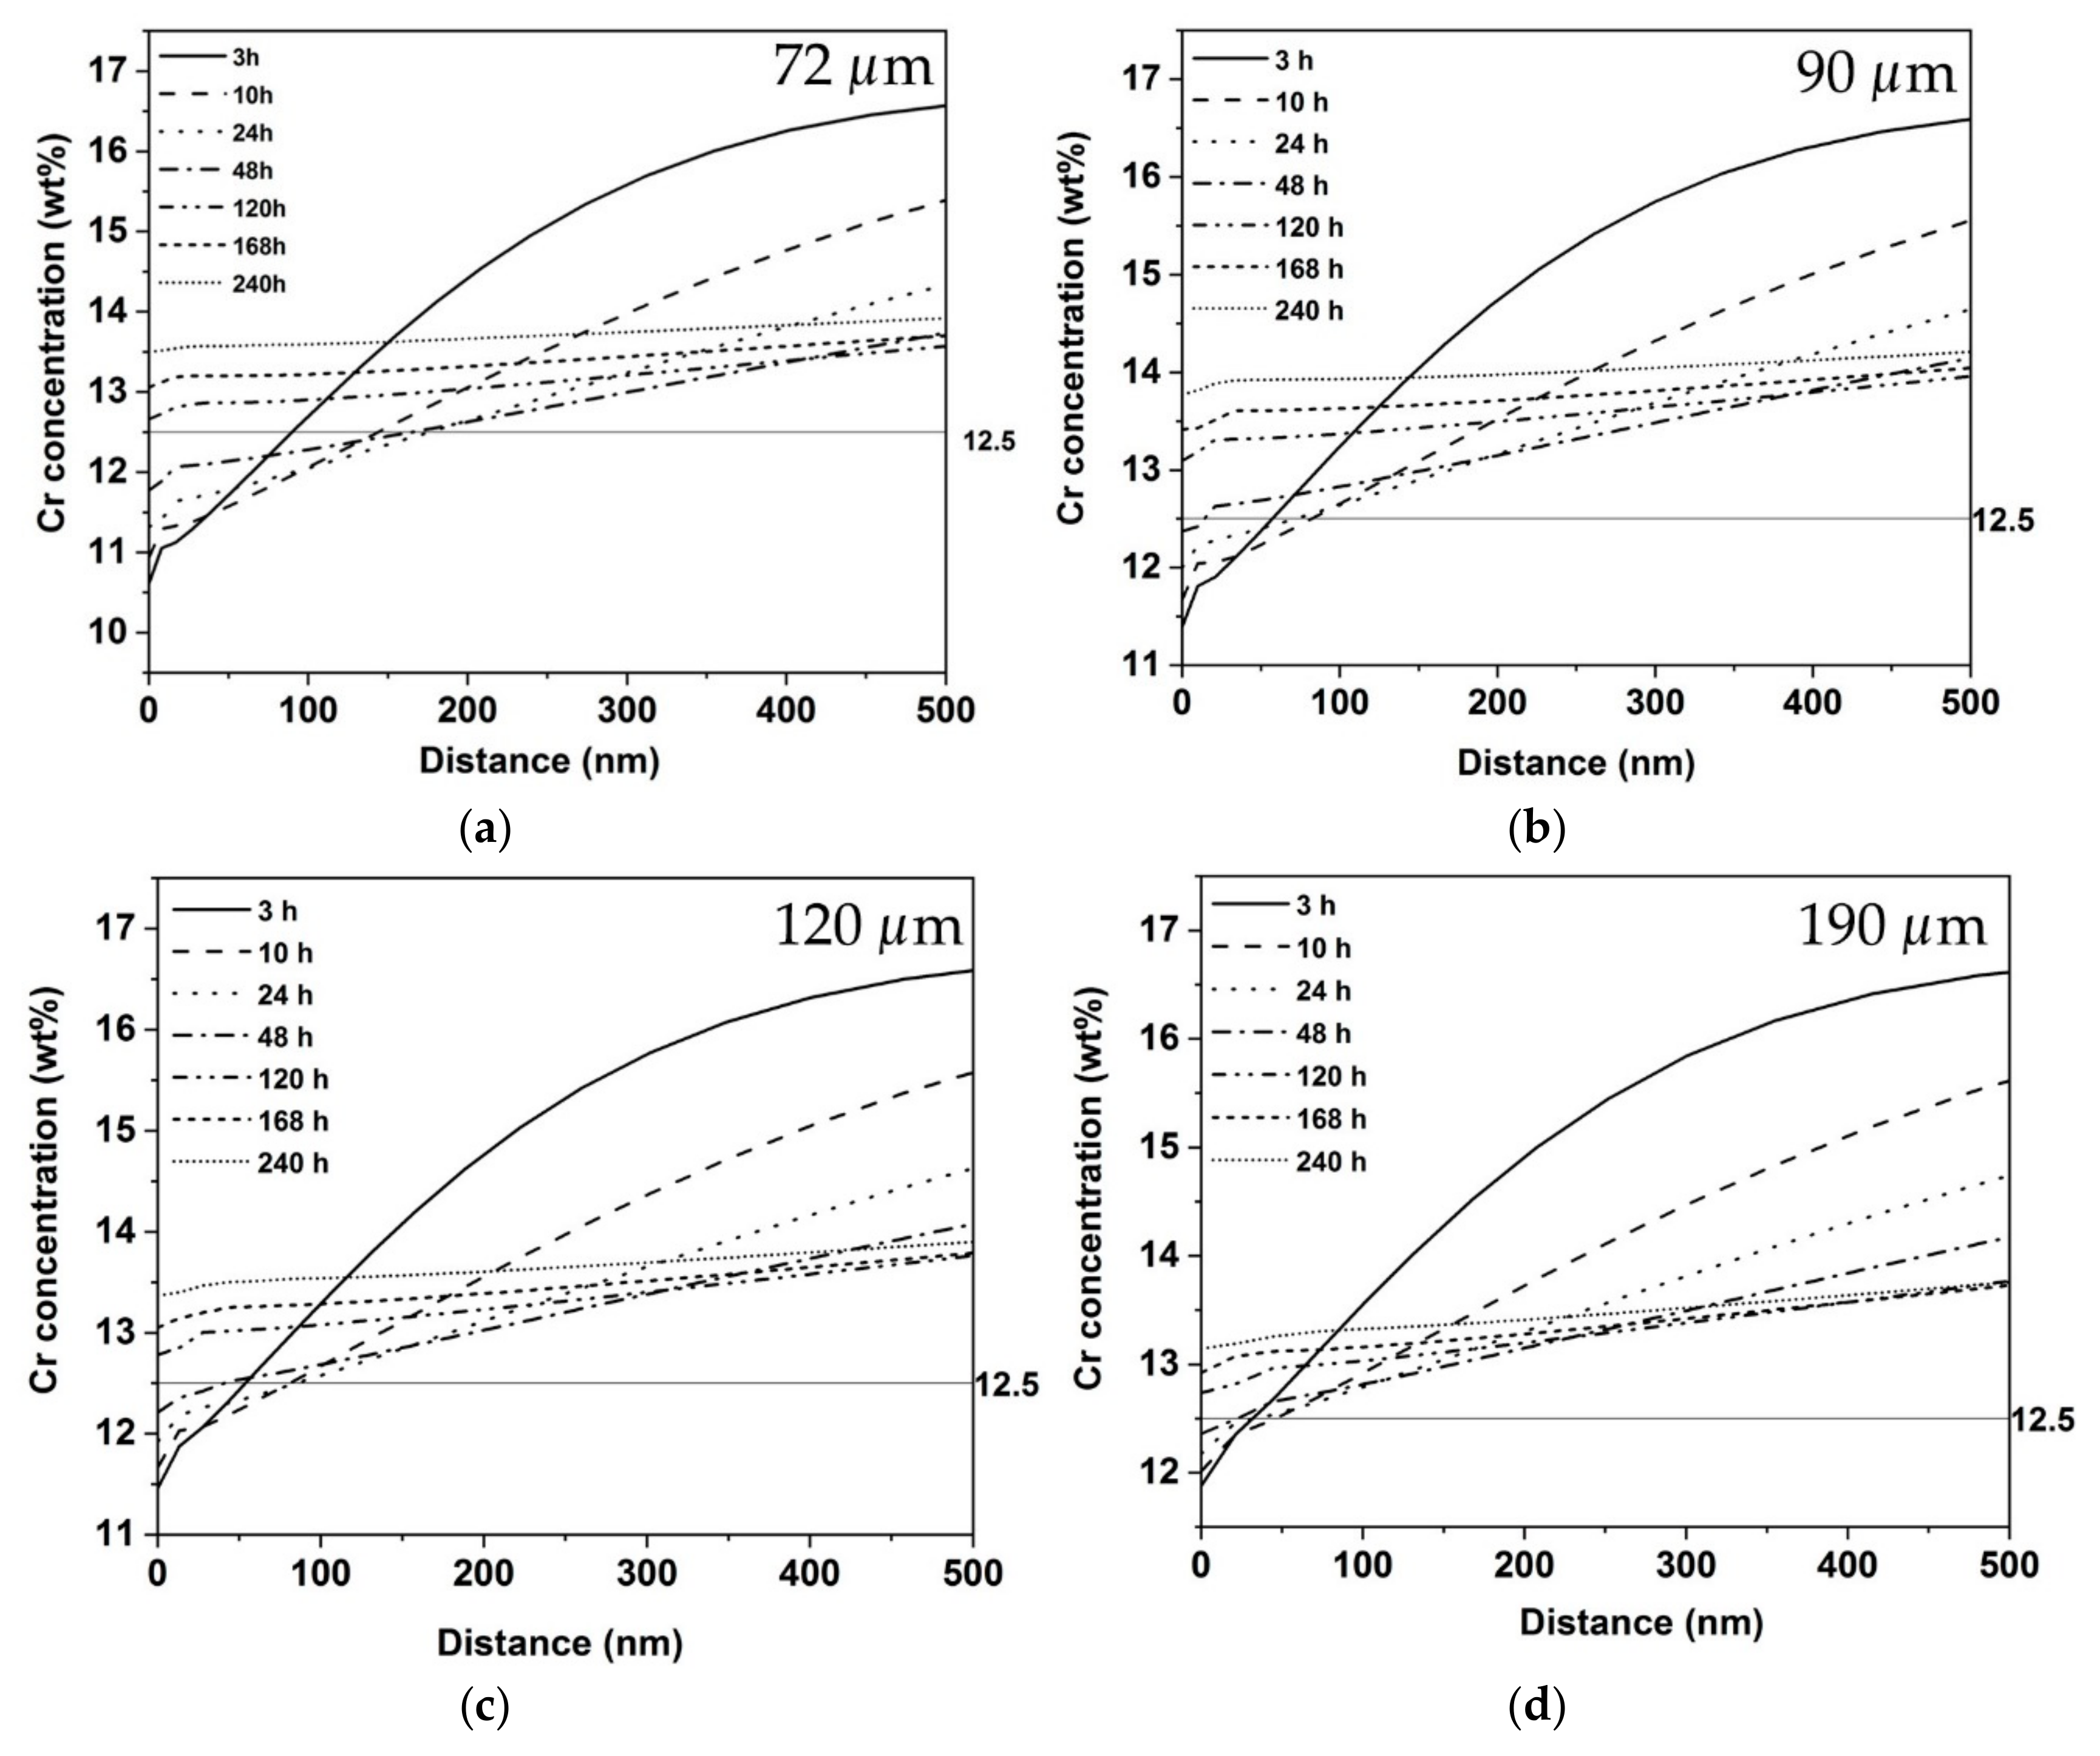
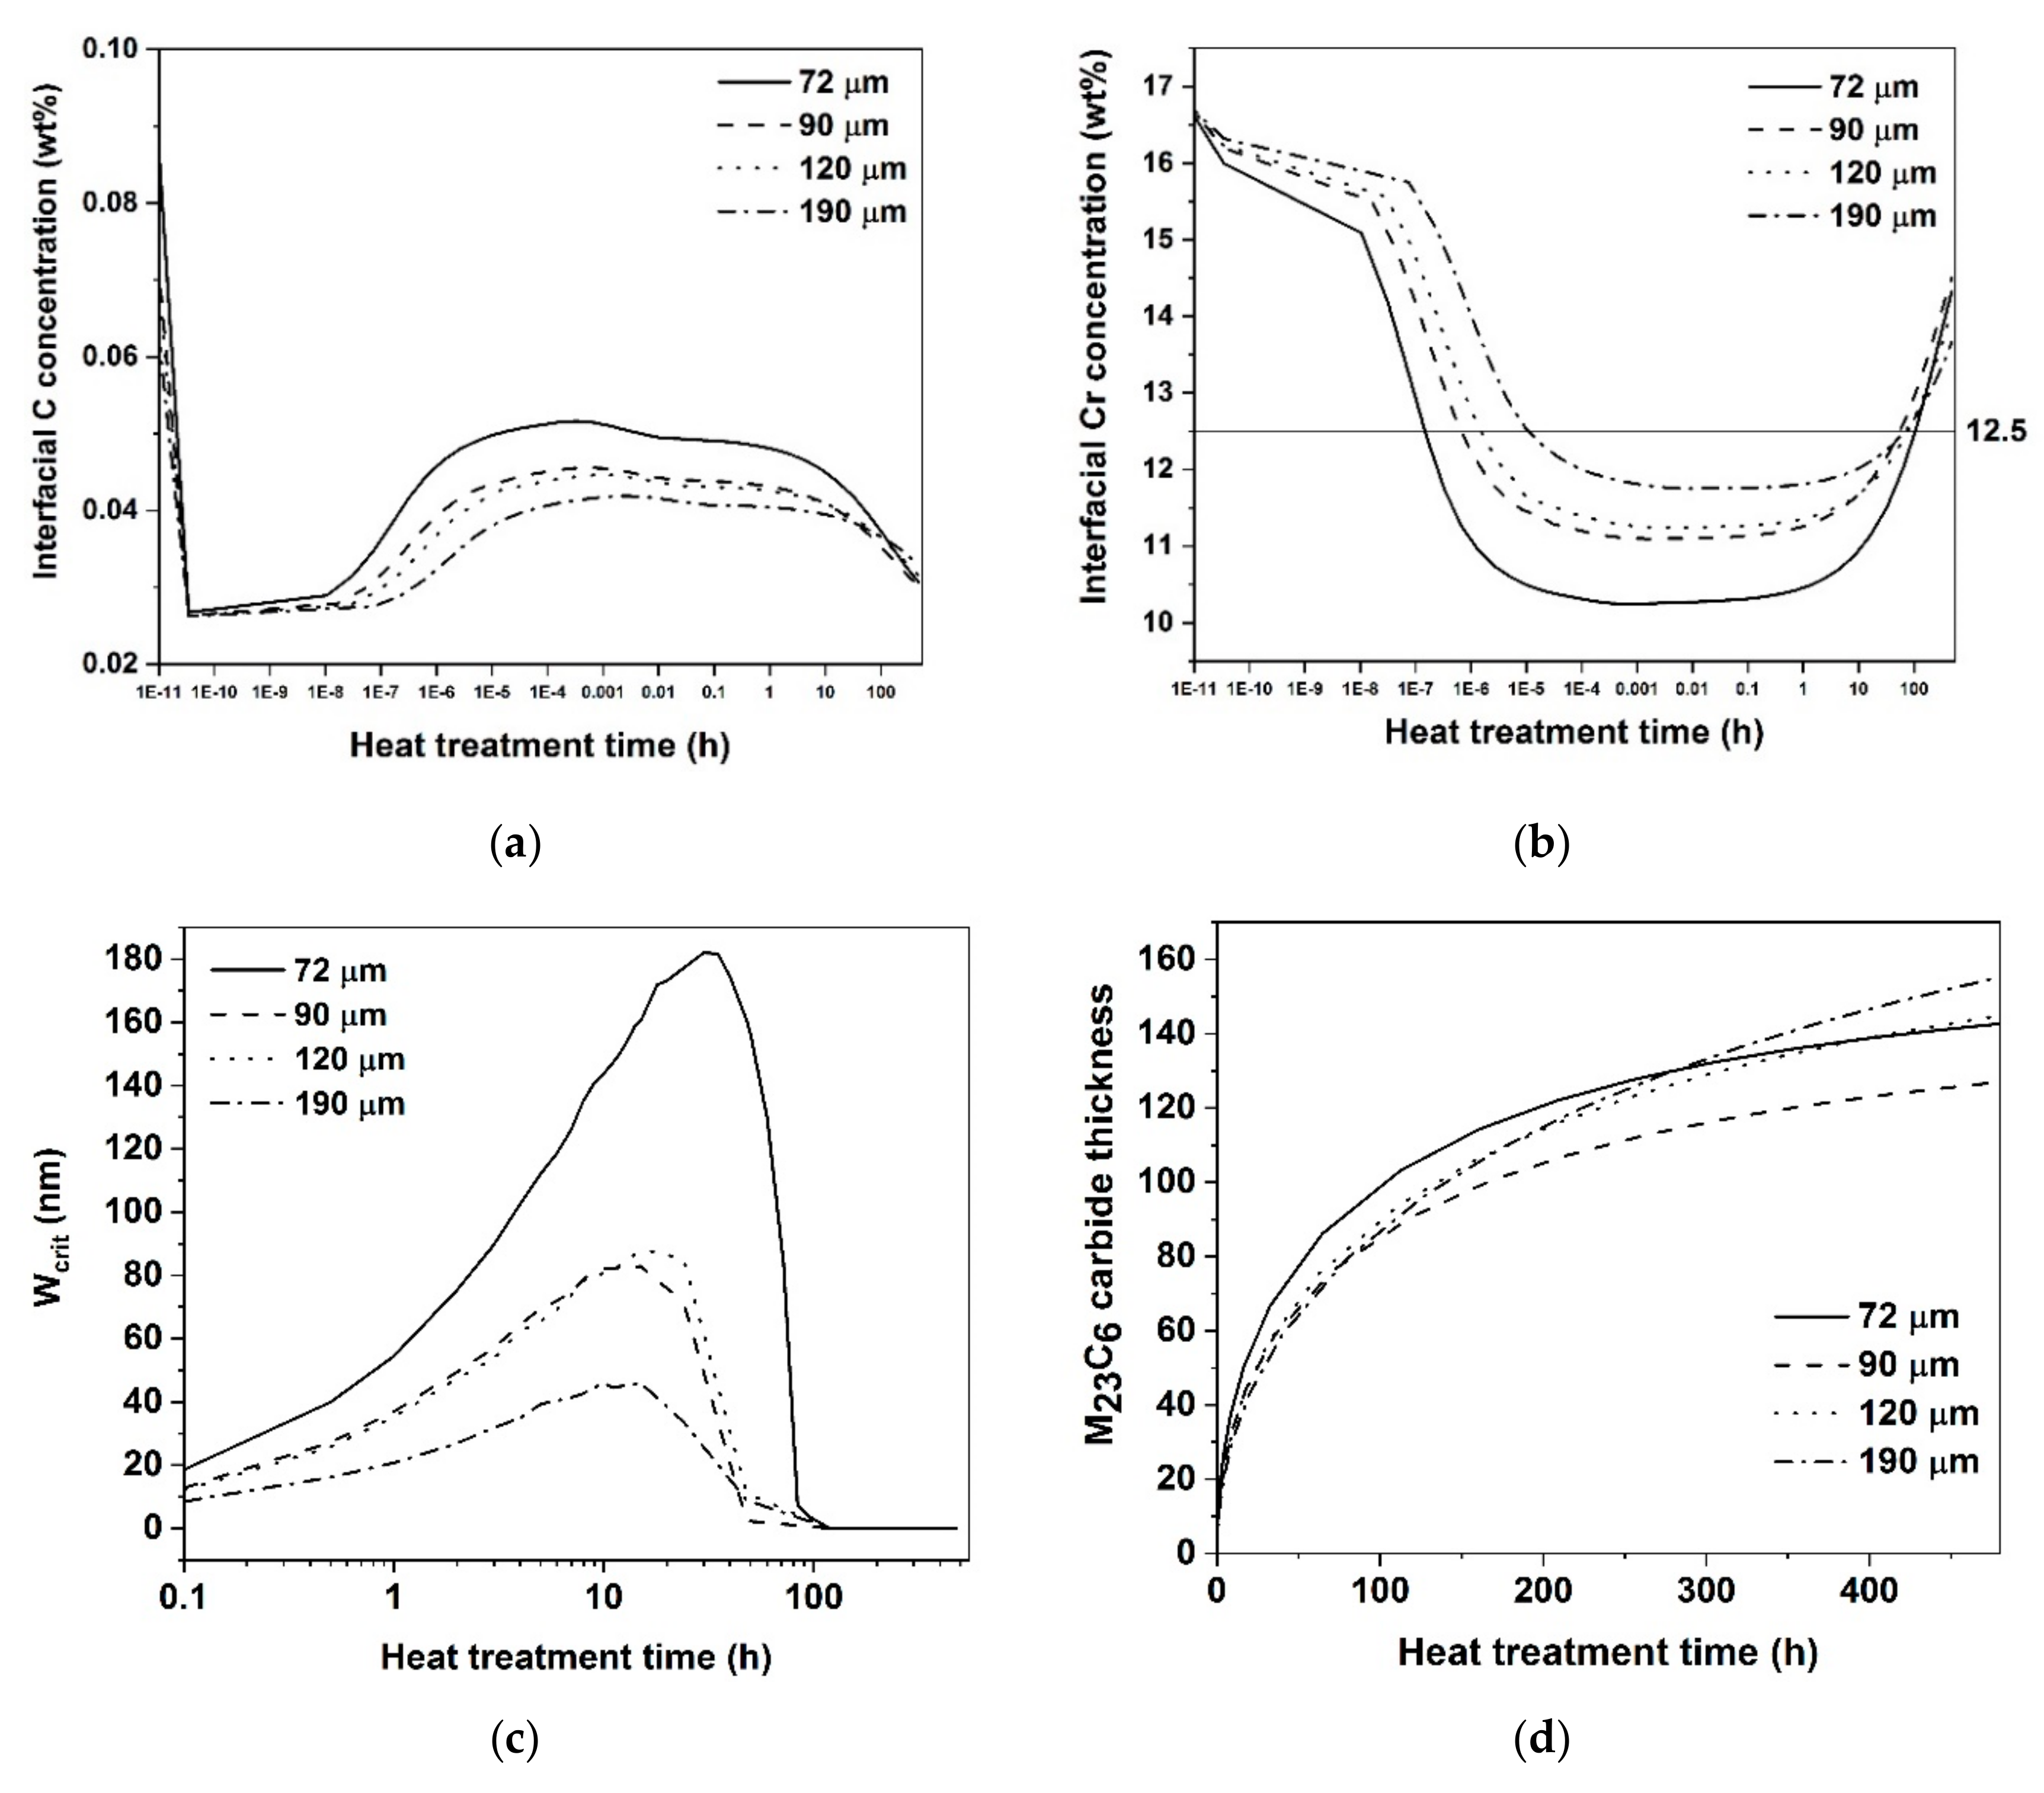
The growth simulations give the concentration profiles of all the alloying elements into the austenite matrix away from the carbide–austenite interface. For simplicity, we only consider the Cr concentration profiles. The Cr depletion adjacent to the precipitate can be characterized by three parameters: the Cr concentration in the matrix at the carbide–matrix interface (Crint), the critical concentration of Cr at which the width of depletion zone is measured (Crcrit) and the width of the depleted zone (Wcrit) at Crcrit. Figure 9 shows the Cr concentration profiles obtained from the simulations. The Crint at 3 h is increasing from 10.61 to 11.87 with increase in grain size from 72 to 190 μm. (Figure 10b). If the C content is kept constant, the Crint should decrease with increase in grain size. In the case of a fixed bulk C content, due to the higher diffusion cell size (da) the total mass of C available for the precipitation of M23C6 is higher in the case of large grain samples and thereby lower Cr concentrations in the austenite are predicted at the carbide–austenite matrix interface (Crint). On the other hand, for a fixed grain size (and da), lowering the bulk C content is predicted to increase Crint. In the present case, the combined effect of increasing grain size in the range 72–190 μm and the concomitant partial decarburization leads to an increase in Crint at the start of the precipitation, that is, the lowering of the C content is predicted to dominate over the increase of grain size.
5. Discussion
Li et al. [12] and Taiwade et al. [32] showed that the DOS decreases with increase in grain size. The measured NDOS values from Figure 7 also show the same, although large grained samples contain lower amounts of carbon. The exact time periods for the sensitization and desensitization were not measured and the varying carbon content in the samples with grain size did not permit in verifying grain size- sensitization relations proposed by Stawström and Hillert [17].
Sensitized microstructures have been well characterized previously [33,34]. The precipitation of M23C6 carbides occurs mainly on random high-angle grain boundaries and their size and spacing vary from boundary to boundary. From the TEM results of the self-healed sample shown in Figure 4, Cr depletion is observed in the vicinity of grain boundary M23C6 carbides but the Cr content did not go below 12 wt.%. This is also the case for intragranular M23C6 carbides shown in Figure 5. In the samples where sensitization is prevalent, Cr concentrations have been found to go below 12 wt.% [35].
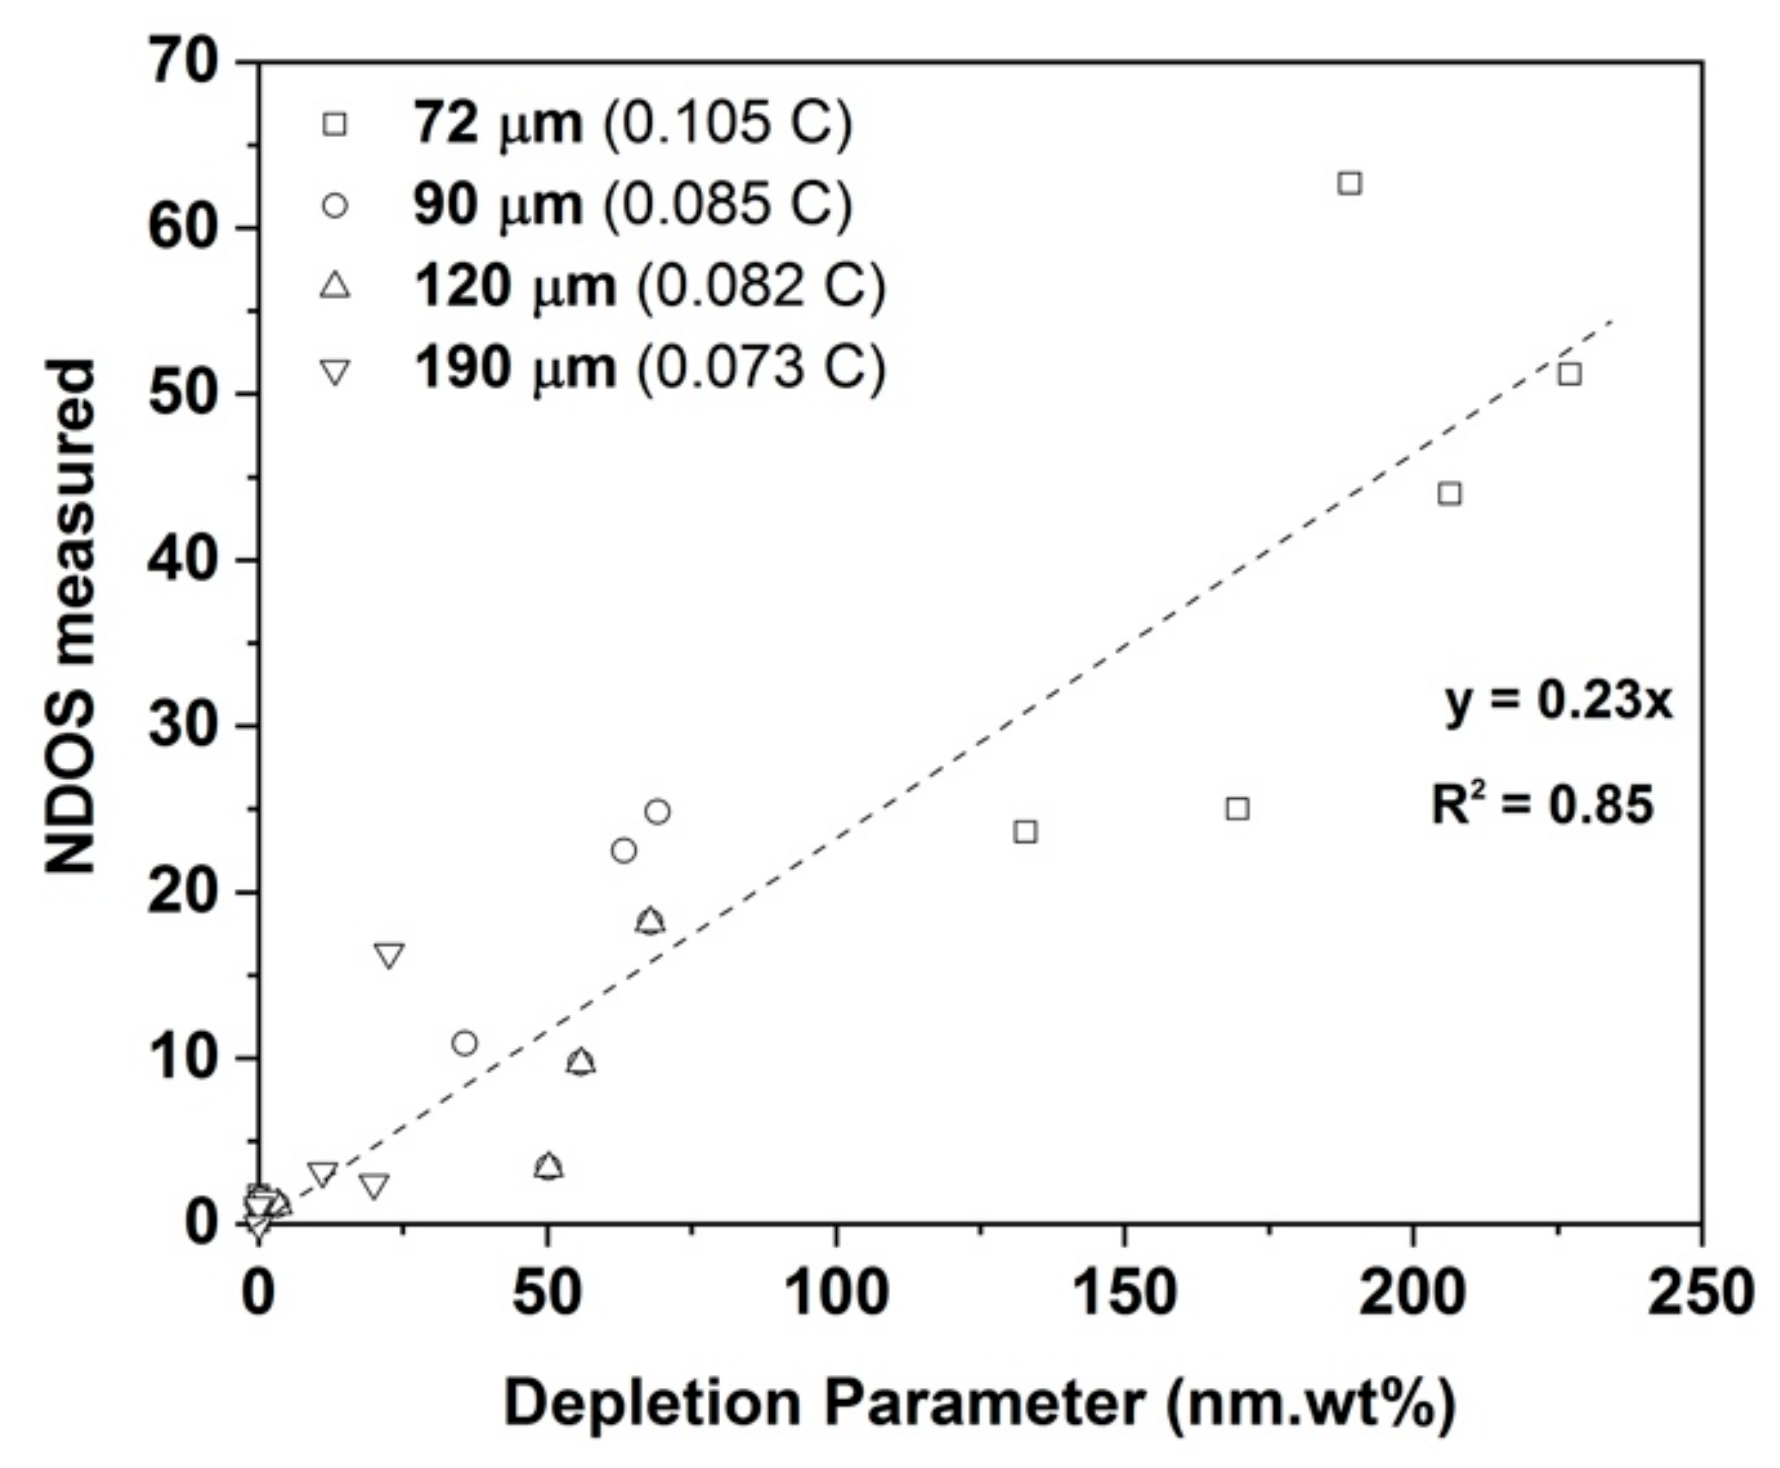
It is possible to perceive of various depletion parameters based on the terms Crint, Crcrit and Wcrit obtained from diffusion calculations. Three such depletion parameters are (Crcrit − Crint) × Wcrit, (Crcrit/Crint) × Wcrit and Wcrit/Crint. The statistical analyses of the correlations between the experimentally measured DOS values and these potential depletion parameters based on a variety of definitions of Crcrit showed that the best correlation is obtained with the following depletion parameter (DP):
i.e., using Wcrit values defined by Crcrit = 12.5%. The statistical analyses showed that the best predictive power of the depletion parameter was obtained by setting a minimum value of 10 wt.% for Crint. This implies that Cr contents in the depleted zone below 10.0 wt.% have no extra effect on the tendency to intergranular corrosion and measured DOS values. It has been shown earlier [25] that the same depletion parameter (DP) is successful in predicting the sensitization and self-healing in austenitic stainless steel.
DP = (12.5 − Crint) ×Wcrit, Crint > 10.0 and (12.5 − 10.0) × Wcrit, Crint ≤ 10.0
The final regression analysis of the experimental NDOS values based on the above definition of DP resulted in the linear relation.
that had an R2 value of 0.85, which is reasonable considering the simplicity of the model and also ignores the effects of intragranular precipitation, for example. Figure 11 shows the variation of calculated DP with measured NDOS values. The appearance of the intragranular M23C6 and Cr2N precipitates after long healing times will also affect the Cr profiles in the vicinity of the grain boundary carbides but such effects are excluded from the simple model. The small increase in DOS after 168 h observed in all the sample conditions could not be predicted by this simple model.
NDOSpredicted = 0.23 × DP
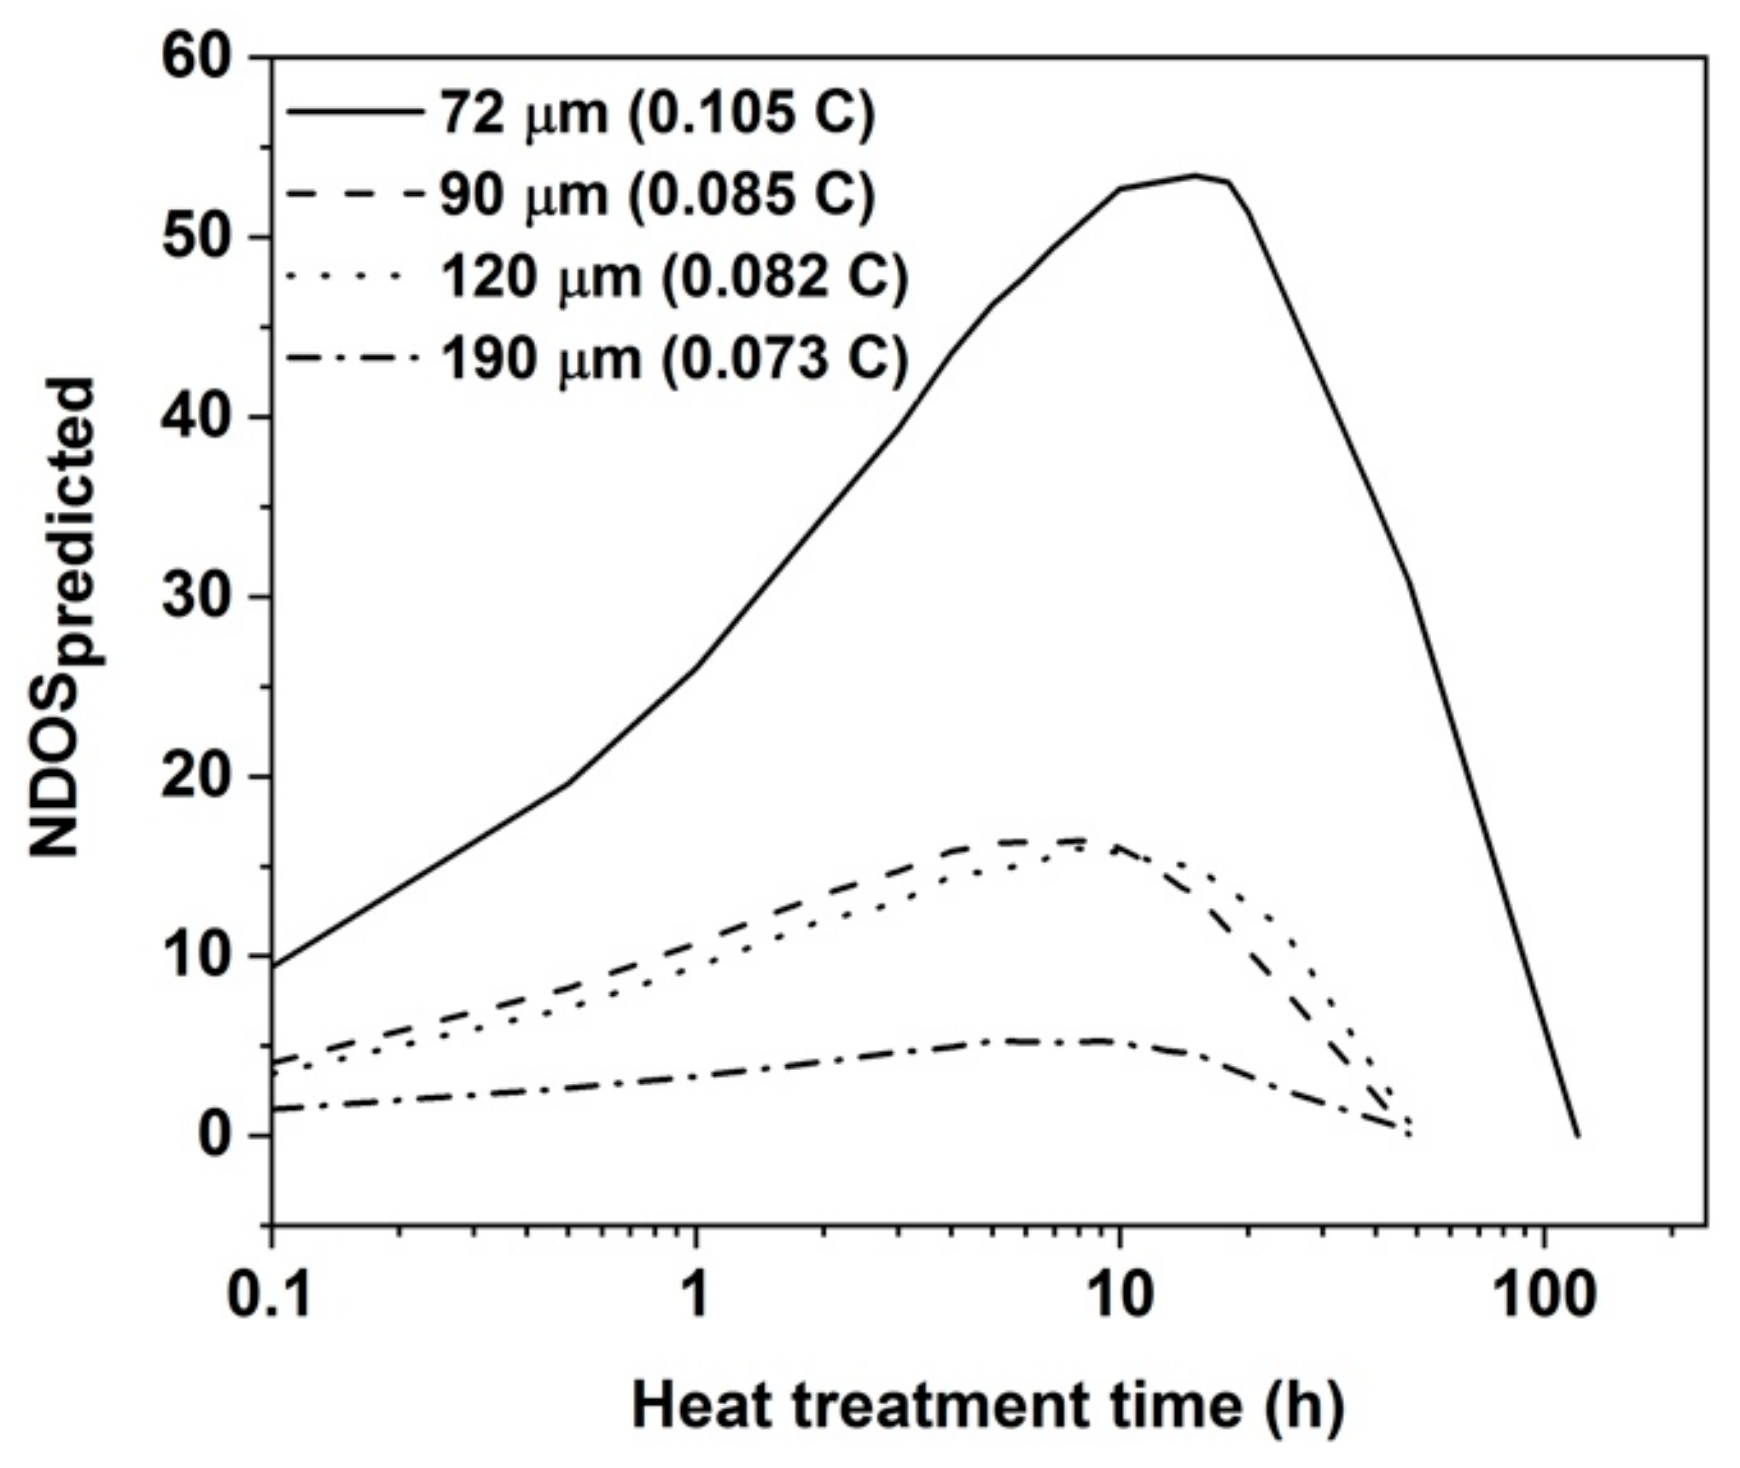
Nevertheless, the model is quite good at predicting the trends of the measured NDOS values for the conditions considered. Regarding the effect of heat treatment time at 820 °C on the sensitization and self-healing kinetics, Figure 11 shows that the predicted NDOS values follow the same trend as the experimentally measured values. The peak NDOSpredicted is in accordance with the experimentally measured NDOS values. The higher peak NDOSpredicted has been observed in 72 μm with higher C content. The available C for the precipitation of M23C6 carbide is lower in the case of samples with lower C content. It can be seen from Figure 10b,c after 3 h heat treatment, Crint is higher and Wcrit lower in the 190 μm sample than the 72 μm sample. This is due to the lower C content of the 190 μm sample leading to thinner grain boundary carbide, see Figure 10d. The variation of Crint and Wcrit controls how the DP changes and affects the predicted NDOS. In Figure 10b, when Crint reaches above 12.5% Cr, implies the sample condition is completely self-healed.
A good correlation between measured NDOS values and DP was only found when da was considered to be 1/6th of the average grain ECD and not if it was taken to be the full average grain ECD or half of the average. This supports the earlier assumptions regarding da made by Sourmail [29] and Kolli [30]. The approach is based on the idea that grains are taken as cubes with six faces making it appropriate to attribute to each calculation volume a sixth of the grain diameter from which C and Cr can be drawn. The predicted NDOS has been plotted with heat treatment time in Figure 12. It can be seen that the peak NDOS along with the time to reach peak NDOS are decreasing with increase in grain size and decrease in carbon content. The calculated NDOS values follow the similar trend to the measured NDOS values from Figure 7.
6. Summary and Conclusions
An austenitic stainless steel with the composition Fe-16.80Cr-6.36Ni-0.105C-0.06N has been solution treated at 1100 °C and 1200 °C and quenched to produce various grain sizes in the range 72–190 μm and corresponding carbon contents in the range 0.105–0.073 wt.%. Carbon content decreased with increasing grain size due to the longer times needed at 1200 °C to produce the larger grain sizes. The samples were further heat treated isothermally at 820 °C for times in the range 3 h to 480 h, which induced various degrees of sensitization and self-healing. The degree of sensitization was measured using DL-EPR tests and normalized to account for the effect of grain size on grain boundary length in the tested area. M23C6 grain boundary precipitates were identified using transmission electron microscopy. Chromium depletion profiles were calculated using Thermo-Calc DICTRA software and used to define a chromium depletion factor based on the predicted chromium concentration at the interface and the width of the profile at the critical chromium content of 12.5 wt.%. A good correlation between the depletion parameter and the normalized degree of sensitization was obtained when conditions are set regarding the lowest interface chromium concentration. The work shows that the depletion parameter based on concentration profiles obtained using DICTRA can quite successfully predict the degree of sensitization both during the sensitization stage and the self-healing stage. Deviations from the predictions may be have been partly caused by the appearance of intragranular M23C6 and Cr2N precipitates that were observed after long heat treatment times at 820 °C but that were not included in the one-dimensional DICTRA model.
Author Contributions
Writing—original draft, S.K.; writing—review and editing, S.K., V.J., J.K. and D.P.; supervision, D.P., resources, J.K. and D.P.
Funding
This project has received funding from the European Union’s Horizon 2020 research and innovation programme under the Marie Skłodowska-Curie grant agreement No 675715.
Acknowledgments
The authors would like to thank Thomas Ohligschläger of Tornio R&D Center, Outokumpu with regards to providing material and heat treatments. The authors thank Tun Tun and Sami Saukko for their support with regards to TEM work. The support of Outokumpu stainless Oy, Tornio in providing the material is also acknowledged.
Conflicts of Interest
The authors declare no conflict of interest.
References
- Sedriks, A.J. Corrosion of Stainless Steels, 2nd ed.; Wiley: Hoboken, NJ, USA, 1996; p. 112. [Google Scholar]
- Hänninen, H.E. Influence of metallurgical variables on environment-sensitive cracking of austenitic alloys. Int. Met. Rev. 2016, 24, 85–135. [Google Scholar]
- Cihal, V. Intergranular corrosion of steels and alloys. Mater. Sci. Monogr. 1984, 18, 79. [Google Scholar]
- ASTM G108-94: Standard Test Method for Electrochemical Reactivation (EPR) for Detecting Sensitization of AISI Type 304 and 304L Stainless Steels; ASTM: West Conshohocken, PA, USA, 2010.
- Bühler, H.E.; Gerlach, L.; Greven, O.; Bleck, W. The electrochemical reactivation test (ERT) to detect the susceptibility to intergranular corrosion. Corros. Sci. 2003, 45, 2325–2336. [Google Scholar] [CrossRef]
- Shaikh, H.; Sivaibharasi, N.; Sasi, B.; Anita, T.; Amirthalingam, R.; Rao, B.P.C.; Jayakumar, T. Use of eddy current testing method in detection and evaluation of sensitisation and intergranular corrosion in austenitic stainless steels. Corros. Sci. 2006, 48, 1462–1482. [Google Scholar] [CrossRef]
- Garcia, C.; De Tiedra, M.P.; Blanco, Y.; Martin, O.; Martin, F. Intergranular corrosion of welded joints of austenitic stainless steels studied by using an electrochemical minicell. Corros. Sci. 2008, 50, 2390–2397. [Google Scholar] [CrossRef]
- Pujar, M.G.; Parvathavarthini, N.; Dayal, R.K.; Thirunavukkarasu, S. Assessment of intergranular corrosion (IGC) in 316(N) stainless steel using electrochemical noise (EN) technique. Corros. Sci. 2009, 51, 1707–1713. [Google Scholar] [CrossRef]
- Sahlaoui, H.; Makhlouf, K.; Sidhom, H.; Philibert, J. Effects of ageing conditions on the precipitates evolution, chromium depletion and intergranular corrosion susceptibility of AISI 316L: Experimental and modelling results. Mater. Sci. Eng. A 2004, 372, 98–108. [Google Scholar] [CrossRef]
- Trillo, E.A.; Murr, L.E. Effects of carbon content, deformation and interfacial energetics on carbide precipitation and corrosion sensitization in 304 stainless steel. Acta Mater. 1998, 47, 235–245. [Google Scholar] [CrossRef]
- Ralston, K.D.; Birbilis, N. The Effect of Grain Size on Corrosion: A Review. MRS Proc. 2010, 66, 075005. [Google Scholar] [CrossRef]
- Li, S.X.; He, Y.N.; Yu, S.R.; Zhang, P.Y. Evaluation of the effect of grain size on chromium carbide precipitation and intergranular corrosion of 316L stainless steel. Corros. Sci. 2013, 66, 211–216. [Google Scholar] [CrossRef]
- Yu, X.; Chen, S.; Wang, L. Effect of solution treatment conditions on the sensitization of austenitic stainless steel. J. Serbian Chem. Soc. 2009, 74, 1293–1302. [Google Scholar] [CrossRef]
- Hall, E.L.; Briant, C.L. Chromium Depletion in the Vicinity of Carbides in Sensitized Austenitic Stainless Steels. Metall. Trans. A Phys. Metall. Mater. Sci. 1984, 15A, 793–811. [Google Scholar] [CrossRef]
- Was, G.S.; Kruger, R.M. A thermodynamic and kinetic basis for understanding chromium depletion in Ni-Cr-Fe alloys. Acta Metall. 1985, 33, 841–854. [Google Scholar] [CrossRef] [Green Version]
- Sahlaoui, H.; Sidhom, H.; Philibert, J. Prediction of chromium depleted-zone evolution during aging of Ni-Cr-Fe alloys. Acta Mater. 2002, 50, 1383–1392. [Google Scholar] [CrossRef]
- Stawström, C.; Hillert, M. An Improved Depleted-zone Theory of Intergranular Corrosion of 18-8 Stainless Steel. J. Inron Steel Inst. 1969, 207, 77–85. [Google Scholar]
- Pascali, R.; Benvenuti, A.; Wenger, D. Carbon content and grain size effects on the sensitization of AISI type 304 stainless steels. Corrosion 1984, 40, 21–32. [Google Scholar] [CrossRef]
- Yin, Y.F.; Faulkner, R.G. Model predictions of grain boundary chromium depletion in Inconel 690. Corros. Sci. 2007, 49, 2177–2197. [Google Scholar] [CrossRef] [Green Version]
- Yin, Y.; Faulkner, R.G.; Moreton, P.; Armson, I.; Coyle, P. Grain boundary chromium depletion in austenitic alloys. J. Mater. Sci. 2010, 45, 5872–5882. [Google Scholar] [CrossRef]
- Bachmann, F.; Hielscher, R.; Schaeben, H. Grain detection from 2d and 3d EBSD data-Specification of the MTEX algorithm. Ultramicroscopy 2011, 111, 1720–1733. [Google Scholar] [CrossRef]
- SFS - EN ISO 12732:2008: Corrosion of Metals and Alloys - Electrochemical Potentiokinetic Reactivation Measurement Using the Double Loop Method (Based on Cihal’ s Method) (ISO 12732:2006); Finnish Standards Association: Helsinki, Finland, 2008.
- Majidi, A.P.; Streicher, M.A. Double Loop Reactivation Method for Detecting Sensitization in AISI 304 Stainless Steels. Corrosion 1984, 40, 584–593. [Google Scholar] [CrossRef]
- Borgenstam, A.; Höglund, L.; Ågren, J.; Engström, A. DICTRA, a tool for simulation of diffusional transformations in alloys. J. Phase Equilibria 2000, 21, 269–280. [Google Scholar] [CrossRef]
- Andersson, J.O.; Helander, T.; Höglund, L.; Shi, P.; Sundman, B. Thermo-Calc & DICTRA, computational tools for materials science. Calphad Comput. Coupling Phase Diagr. Thermochem. 2002, 26, 273–312. [Google Scholar]
- Lewis, M.; Hattersley, B. Precipitation of M23C6 in austenitic steels. Acta Metall. 1965, 13, 1159–1168. [Google Scholar] [CrossRef]
- Larsson, H.; Reed, R.C. On the numerical simulation of diffusion-controlled reactions under local equilibrium conditions. Acta Mater. 2008, 56, 3754–3760. [Google Scholar] [CrossRef]
- Kolli, S.; Ohligschläger, T.; Porter, D. Quantitative Prediction of Sensitization in Austenitic Stainless Steel Accounting for Multicomponent Thermodynamic and Mass Balance Effects. ISIJ Int. 2019, 59, 1330–1336. [Google Scholar] [CrossRef] [Green Version]
- Sourmail, T.; Too, C.H.; Bhadeshia, H.K.D.H. Sensitisation and Evolution of Chromium-depleted Zones in Fe–Cr–Ni–C Systems. ISIJ Int. 2003, 43, 1814–1820. [Google Scholar] [CrossRef]
- Kolli, S.; Ohligschläger, T.; Kömi, J.; Porter, D. Sensitization and Self-healing in Austenitic Stainless Steel: Quantitative Prediction Considering Carbide Nucleation and Growth. ISIJ Int. 2019. [Google Scholar] [CrossRef]
- Parvathavarthini, N.; Dayal, R.K. Influence of chemical composition, prior deformation and prolonged thermal aging on the sensitization characteristics of austenitic stainless steels. J. Nucl. Mater. 2002, 305, 209–219. [Google Scholar] [CrossRef]
- Agrawal, H.; Sharma, P.; Tiwari, P.; Taiwade, R.V.; Dayal, R.K. Evaluation of Self-Healing Behaviour of AISI 304 Stainless Steel Evaluation of Self-Healing Behaviour of AISI 304 Stainless Steel. Trans. Indian Inst. Met. 2015, 68, 501–511. [Google Scholar] [CrossRef]
- Pond, R.C. Review of the principal contrast effects observed at interphase boundaries using transmission electron microscopy. J. Microsc. 1984, 135, 213–240. [Google Scholar] [CrossRef]
- Trillo, E.; Murr, L. A TEM investigation of M23C6 carbide precipitation behaviour on varying grain boundary misorientations in 304 stainless steels. J. Mater. Sci. 1998, 33, 1263–1271. [Google Scholar] [CrossRef]
- Bruemmer, S.M. Quantitative measurement and modelling of sensitization development in stainless steels. Corrosion 1990, 46, 556–562. [Google Scholar] [CrossRef]
Figure 1.
Heat treatments cycle employed.

Figure 2.
(a) Phase diagram showing the equilibrium phases in the experimental composition Fe-16.80Cr-6.36Ni-(0–0.5)C-0.065N (in wt.%) (b) property diagram showing the amount of phases in the composition Fe-16.80Cr-6.36Ni-0.1C-0.065N.
Figure 2.
(a) Phase diagram showing the equilibrium phases in the experimental composition Fe-16.80Cr-6.36Ni-(0–0.5)C-0.065N (in wt.%) (b) property diagram showing the amount of phases in the composition Fe-16.80Cr-6.36Ni-0.1C-0.065N.

Figure 3.
Microstructure observed under EBSD for 120 μm sample condition.

Figure 4.
Sample 72 μm/ 820 °C-120 h. (a) Bright field transmission electron microscope (TEM) micrograph showing M23C6 carbides along a grain boundary. (b) EDS mapping of Cr. (c,d) Concentration profiles along lines 1 and 2 in the Cr EDS map.
Figure 4.
Sample 72 μm/ 820 °C-120 h. (a) Bright field transmission electron microscope (TEM) micrograph showing M23C6 carbides along a grain boundary. (b) EDS mapping of Cr. (c,d) Concentration profiles along lines 1 and 2 in the Cr EDS map.

Figure 5.
(a,c) Bright field Transmission electron microscopy (TEM) micrograph of 120 μm/820 °C-168 h and 190 μm/820 °C-240 h respectively showing intragranular M23C6 carbides. (b,d) Energy dispersive spectroscopy (EDS) mapping of Cr for the micrographs (a,c) respectively, (e) Cr concentration profile along the red line shown in (b).

Figure 6.
Sample 190 μm/820 °C-240 h (a) STEM micrograph, (b) SAD pattern showing the precipitate to be Cr2N and (c) Cr concentration profile along the red line shown in (a).
Figure 6.
Sample 190 μm/820 °C-240 h (a) STEM micrograph, (b) SAD pattern showing the precipitate to be Cr2N and (c) Cr concentration profile along the red line shown in (a).

Figure 7.
Normalized Degree of sensitization (NDOS) with heat treatment time at 820 °C. (a) all results, (b) results from beyond 20 h on an expanded scale. Means and standard deviations shown by points and error bars.
Figure 7.
Normalized Degree of sensitization (NDOS) with heat treatment time at 820 °C. (a) all results, (b) results from beyond 20 h on an expanded scale. Means and standard deviations shown by points and error bars.

Figure 8.
Treatment of numerical simulation across the carbide-austenite interface.

Figure 9.
Cr concentration profiles in the austenite away from the M23C6 carbide-austenite matrix interface for the grain sizes (a) 72, (b) 90, (c) 120 and (d) 190 μm.
Figure 9.
Cr concentration profiles in the austenite away from the M23C6 carbide-austenite matrix interface for the grain sizes (a) 72, (b) 90, (c) 120 and (d) 190 μm.

Figure 10.
Variation of (a) interfacial C (b) interfacial Cr in austenite at carbide-austenite interface (c) width of Cr concentration profile at Crcrit (d) thickness of M23C6 carbide with heat treatment time.
Figure 10.
Variation of (a) interfacial C (b) interfacial Cr in austenite at carbide-austenite interface (c) width of Cr concentration profile at Crcrit (d) thickness of M23C6 carbide with heat treatment time.

Figure 11.
Predicted DP values to experimentally measured NDOS values.

Figure 12.
NDOS predicted with time for all the sample conditions.


Table 1.
Heat treatments employed to generate varied grain sized materials with varying sensitization levels.
Table 1.
Heat treatments employed to generate varied grain sized materials with varying sensitization levels.
| Heat Treatment | Heat Treatment Time at 820 °C (h) |
|---|---|
| 1100 °C/2 h (ST) | 3, 10, 24, 48, 120, 168, 240, 480 |
| 1200 °C/2 h | 3, 10, 24, 48, 120, 168, 240, 480 |
| 1200 °C/4 h | 3, 10, 24, 48, 120, 168, 240, 480 |
| 1200 °C/8 h | 3, 10, 24, 48, 120, 168, 240, 480 |
Table 2.
Average grain equivalent circle diameters (ECD) and C contents in the samples after the heat treatment.
Table 2.
Average grain equivalent circle diameters (ECD) and C contents in the samples after the heat treatment.
| Sample Condition | Average Grain ECD (μm) | C Content (wt.%) |
|---|---|---|
| 1100 °C/2 h (ST) | 72 ± 5 | 0.105 |
| ST + 1200 °C/2 h | 90 ± 4 | 0.085 |
| ST + 1200 °C/4 h | 120 ± 3 | 0.082 |
| ST + 1200 °C/8 h | 190 ± 4 | 0.073 |
© 2019 by the authors. Licensee MDPI, Basel, Switzerland. This article is an open access article distributed under the terms and conditions of the Creative Commons Attribution (CC BY) license (http://creativecommons.org/licenses/by/4.0/).
Share and Cite
MDPI and ACS Style
Kolli, S.; Javaheri, V.; Kömi, J.; Porter, D. On the Role of Grain Size and Carbon Content on the Sensitization and Desensitization Behavior of 301 Austenitic Stainless Steel. Metals 2019, 9, 1193. https://doi.org/10.3390/met9111193
AMA Style
Kolli S, Javaheri V, Kömi J, Porter D. On the Role of Grain Size and Carbon Content on the Sensitization and Desensitization Behavior of 301 Austenitic Stainless Steel. Metals. 2019; 9(11):1193. https://doi.org/10.3390/met9111193
Chicago/Turabian StyleKolli, Satish, Vahid Javaheri, Jukka Kömi, and David Porter. 2019. "On the Role of Grain Size and Carbon Content on the Sensitization and Desensitization Behavior of 301 Austenitic Stainless Steel" Metals 9, no. 11: 1193. https://doi.org/10.3390/met9111193
Note that from the first issue of 2016, this journal uses article numbers instead of page numbers. See further details here.