Effects of Machining Parameters on the Quality in Machining of Aluminium Alloys Thin Plates


1
Department of Mechanical Engineering and Industrial Design, School of Engineering, University of Cadiz, Av. Universidad de Cádiz 10, Puerto Real (Cádiz) E-11519, Spain
2
Fundación Tecnalia Research & Innovation, Scientific and Technological Park of Guipuzkoa, Paseo Mikeletegui, Donostia-San Sebastián (Guipuzcoa) 7 E-20009, Spain
*
Author to whom correspondence should be addressed.
Metals 2019, 9(9), 927; https://doi.org/10.3390/met9090927
Submission received: 23 July 2019
/
Revised: 21 August 2019
/
Accepted: 22 August 2019
/
Published: 24 August 2019
(This article belongs to the Special Issue Metal Machining—Recent Advances, Applications and Challenges)
Abstract
:Nowadays, the industry looks for sustainable processes to ensure a more environmentally friendly production. For that reason, more and more aeronautical companies are replacing chemical milling in the manufacture of skin panels and thin plates components. This is a challenging operation that requires meeting tight dimensional tolerances and differs from a rigid body machining due to the low stiffness of the part. In order to fill the gap of literature research on this field, this work proposes an experimental study of the effect of the depth of cut, the feed rate and the cutting speed on the quality characteristics of the machined parts and on the cutting forces produced during the process. Whereas surface roughness values meet the specifications for all the machining conditions, an appropriate cutting parameters selection is likely to lead to a reduction of the final thickness deviation by up to 40% and the average cutting forces by up to a 20%, which consequently eases the clamping system and reduces machine consumption. Finally, an experimental model to control the process quality based on monitoring the machine power consumption is proposed.
1. Introduction
Aluminium fuselage skin panel machining is considered a challenging operation due to its dimensional and surface requirements. These parts are lightened by machining superficial pockets in order to increase the fuel efficiency of aircrafts by reducing their structure weight. These pockets have historically been machined using chemical milling operations, although green manufacturing approaches have been focused on the study of mechanical machining for this purpose [1]. In fact, different projects and research studies have invested hundreds of thousands of euros to remove chemical milling, designing specific clamping systems to ensure surface quality and dimensional requirements while maintaining clamping flexibility. These systems are focused on twin-machining heads [2,3], magnetic slaves [4] or flexible vacuum beds [5] that control the deflection of the part avoiding overcut during the operation.
Additionally, the conventional machining of low stiffness parts presents dynamic and static problems [6,7]. On the one hand, dynamic stability of machining strongly depends on system stiffness, its natural frequency response, and the selected cutting parameters. Vibrations—chatter and forced vibrations—can directly affect the final roughness of parts, increasing their value and forcing manufacturers to make reprocessing steps, therefore increasing the operational cost [8,9]. In order to avoid them, chatter influence is studied using stability lobe diagrams (SLD), a representation tool that commonly relates the stability areas of machining with the feed rate, the spindle speed, the depth of cut, or the tool position [10,11,12,13,14], and forced vibrations can be studied through dynamic models. In this case, the applied force is studied to reduce the dynamic deflection of the part. On the other hand, quasi-static deflection can take place when the elastoplastic behaviour of the workpiece, combined with a failure on the clamping, is not enough to counter the machining force effect, reducing the real depth of cut [15,16,17]. This fact was proved experimentally by Yan et al. [18], who optimized the depth of cut depending on the cutting force, reducing the part deflection and increasing the process efficiency. Similarly, Sonawane et al. [19] used a statistical approach to model workpiece deflection, addressing it to the machining parameters and cutting tool orientation. In contrast, Oliveira et al. [20] established that the most influencing factor on the real depth of cut was the milling strategy (up or down milling), while other studies [21,22] have focused on the analysis of the toolpath effect on the final quality of slim parts.
However, few studies have been focused on the analysis of the parameters effect into the quality characteristics of thin plates. The literature review has shown that most of the studies have focused on thin-wall machining rather than thin-plates or thin floors [7]. Few of them have focused on the analysis of the parameters effect into the final quality characteristics. For this reason, this paper focuses on the study of thin plates in order to simulate the machining of large skin panels to evaluate the effect of the machining parameters on the final thickness, surface roughness and cutting forces of the part.
2. Materials and Methods
2.1. Machining Tests
Two type of machining tests were performed. The first type was used to analyse the thin plates’ behaviour through the machining of 50 × 50 mm2 pockets on samples of 80 × 80 mm2 and 2 mm thickness. Parts were screwed to a faced mill plate that was housed on a dynamometer. The samples were dry machined while keeping the axial distance constant, and the depth of cut (ap), the feed rate per tooth (fz) and the cutting speed (Vc) were variable. The values of each machining conditions are compiled in the levels listed in Table 1, in which the spindle speed (S) is also shown. The depth of cut was selected based on the geometrical requirements of industrial parts. Feed rate and cutting speed were selected based on the literature [14,23,24] and aerospace recommendations. The chosen strategy was down milling, following a toolpath from the centre of the workpiece up to the outside of it.
The second test aimed to obtain the cutting force values following a mechanistic approach. In this approach, the specific force coefficients of the combination pair tool-material had to be experimentally defined by performing different slots on a rigid aluminium workpiece. Additionally, in order to avoid chatter and ensure the rigid behaviour of the samples, SLD were calculated using an impact hammer test. The maximum depth of cut for stable machining was calculated using the procedure described by Altintas and Budak [25]. Following this procedure, the frequency responses of the tool and the workpiece at four different steps of the cutting operation were obtained. This combination provided the SLD diagram at the four stages in order to analyse possible changes during the machining operation.
Each machining test was performed in a 5-axis NC centre ZV 25U600 EXTREME (Ibarmia Innovatek S.L.U., Azkoitia, Spain). The material used on the sample parts was aluminium 2024-T3, and the tool was a torus end mill KENDU 4400.60 (Kendu, Segura, Spain) with a 10 mm diameter, 30° helix angle, 18° rake angle, 16° clearance angle for the secondary edge and 9° angle for the primary edge.
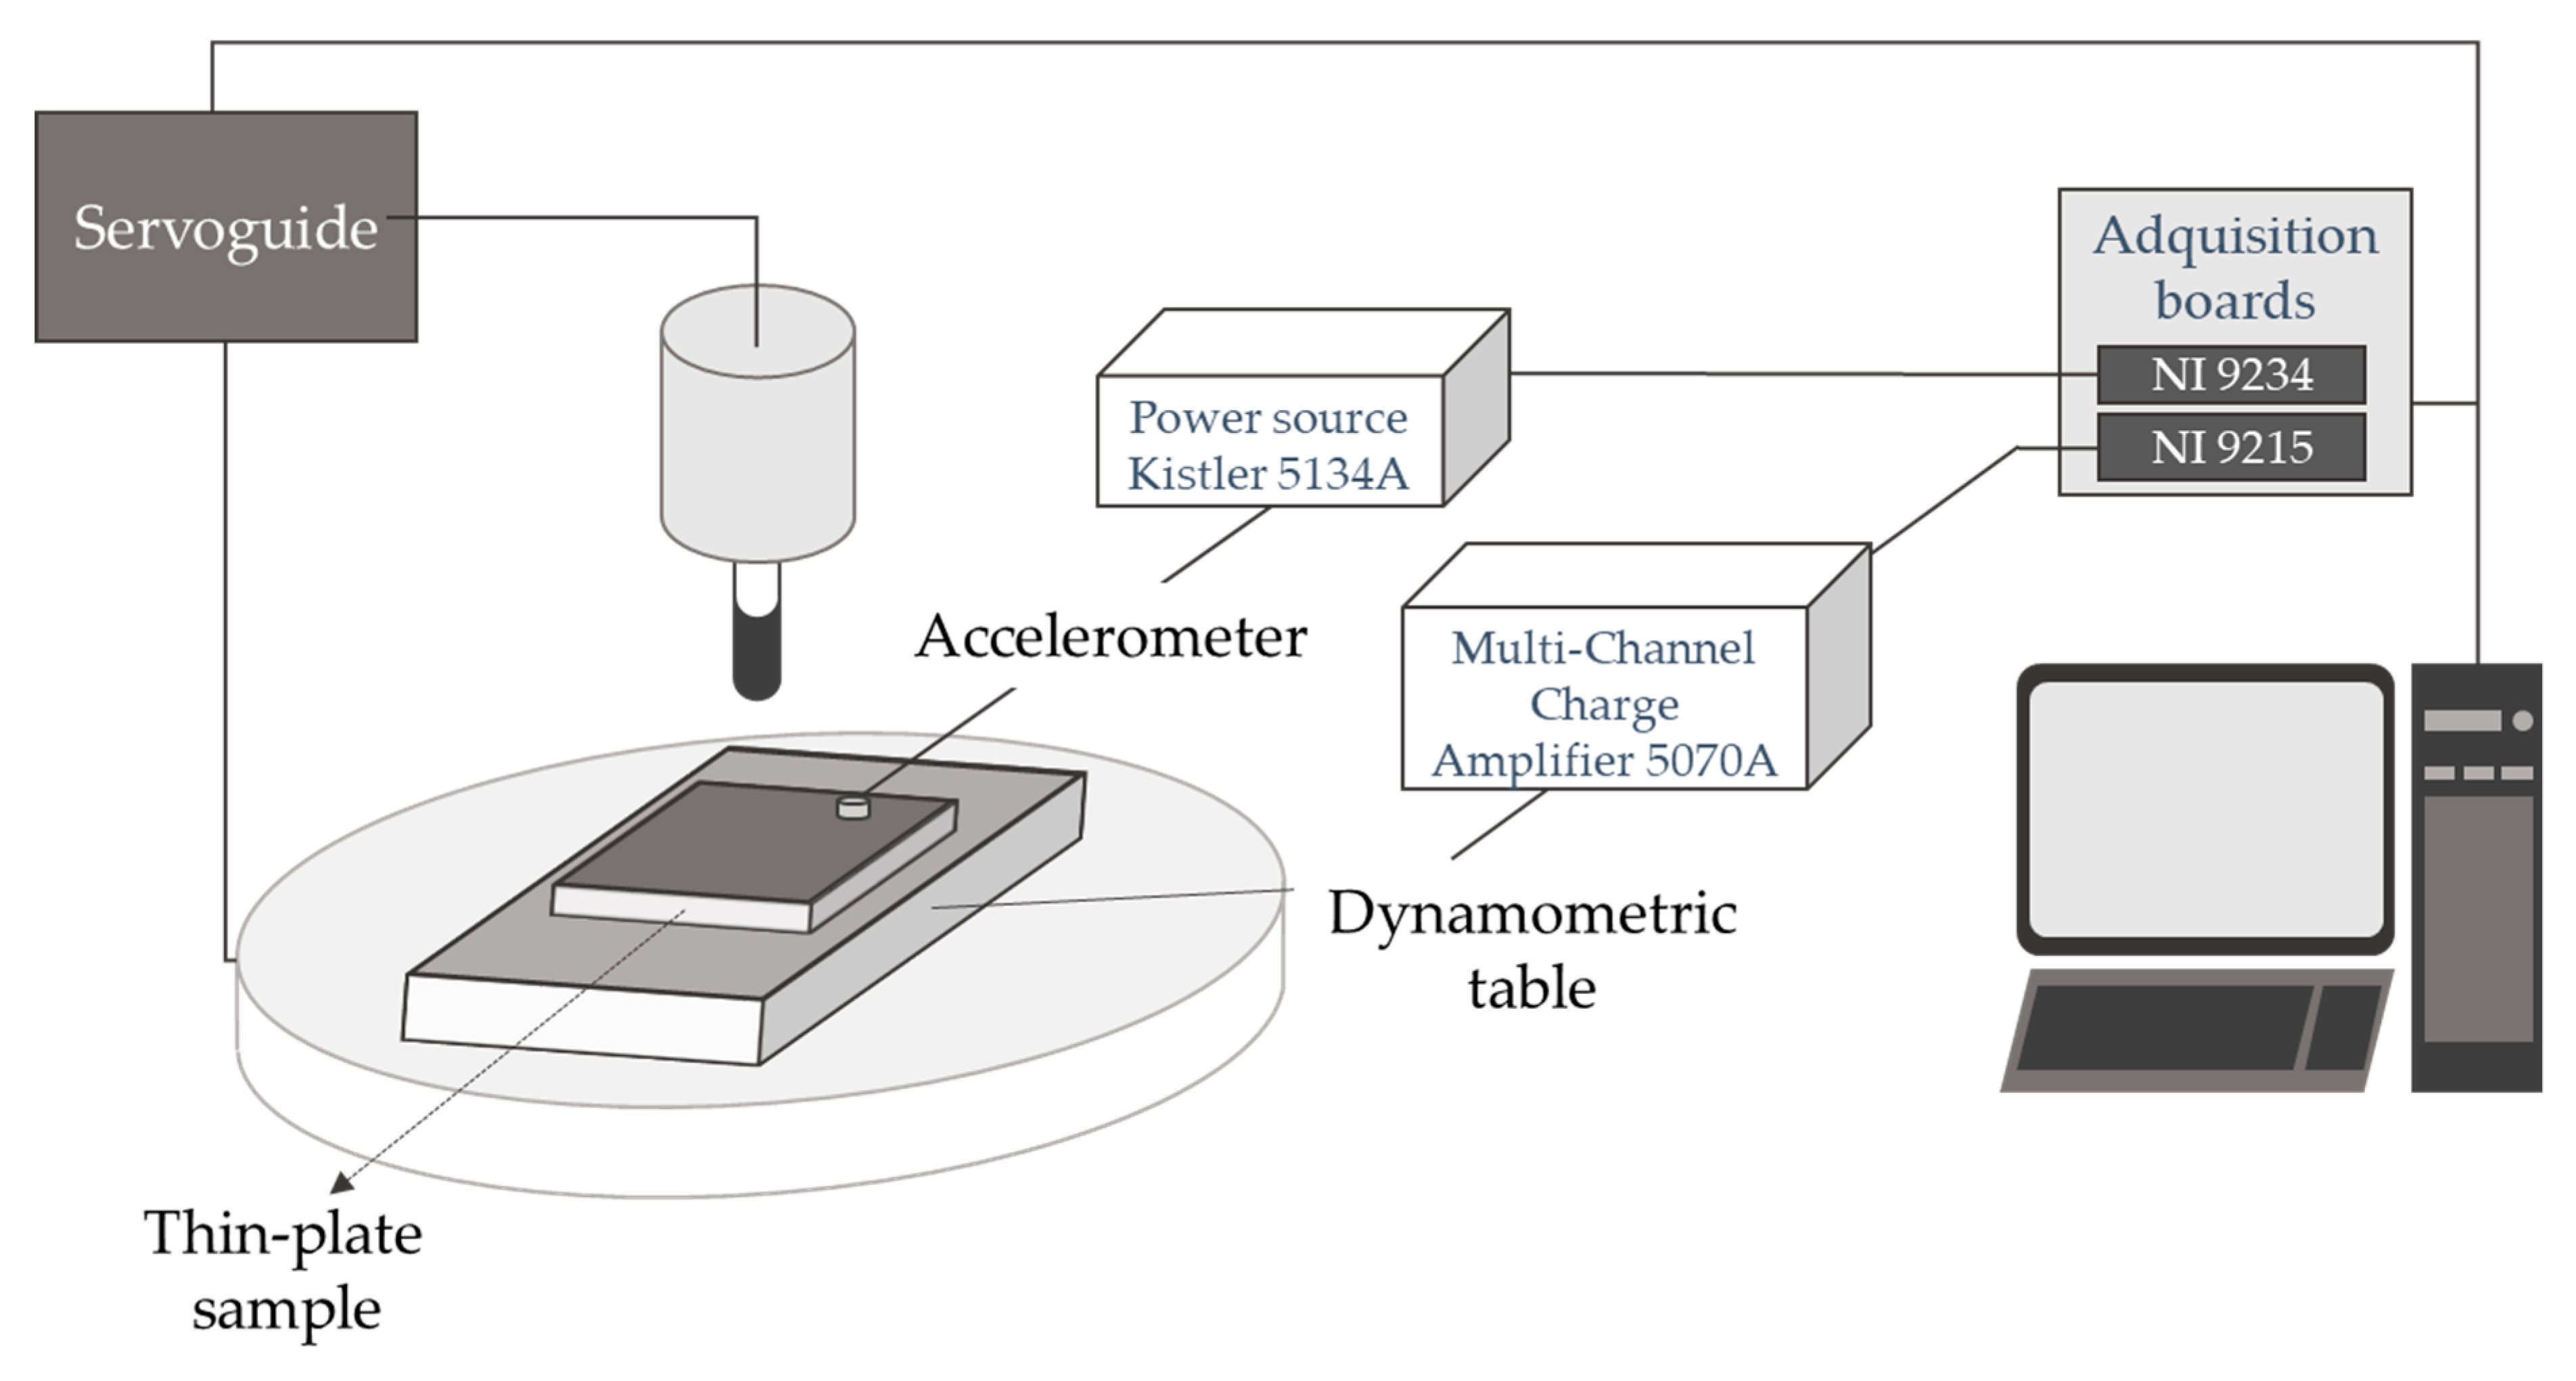
Forces and accelerations on the workpiece were monitored using a dynamometer Kistler 9257B (Kistler Group, Winterthur, Switzerland) and an accelerometer Kistler 8728A500 (Kistler Group, Winterthur, Switzerland), connected to National Instruments acquisition boards NI 9215(National Instruments, Austin, TX, USA) and NI 9234 (National Instruments, Austin, TX, USA), respectively. The power consumed by the spindle speed and the whole machine was also recorded using a Fanuc Servoguide system (Fanuc Corporation, Oshino-mura, Japan). The test configuration and monitoring system are shown in Figure 1.
2.2. Force Mechanistic Model
The expected forces could be calculated through a mechanistic approach [26,27] Tangential (t), axial (a) and radial (r) forces could be considered as a function of the cutting coefficient and the friction coefficient .
where is the differential chip edge length and is the applied rotation angle which depends on the instant depth of cut (z), the number of teeth engaged (j), the total number of teeth (N), and the helix angle (β).
The cutting forces were converted to Cartesian coordinates using Equation (3), with κ being the angle referred to the torus part of the mill.
The cutting and friction coefficients were obtained by solving the equation using the force values obtained in the slot test performed in a rigid part. The coefficients were considered constant for all the fz, but the effect of the Vc was taken into account. The test conditions are shown in Table 2. The results were used to predict the SLD.
2.3. Quality Evaluation
The quality of the parts was established through the final thickness distribution and roughness. Typical tolerance values in the industry were really tight, about ±0.1 mm for final thickness and under 1.6 µm for the roughness average (Ra).
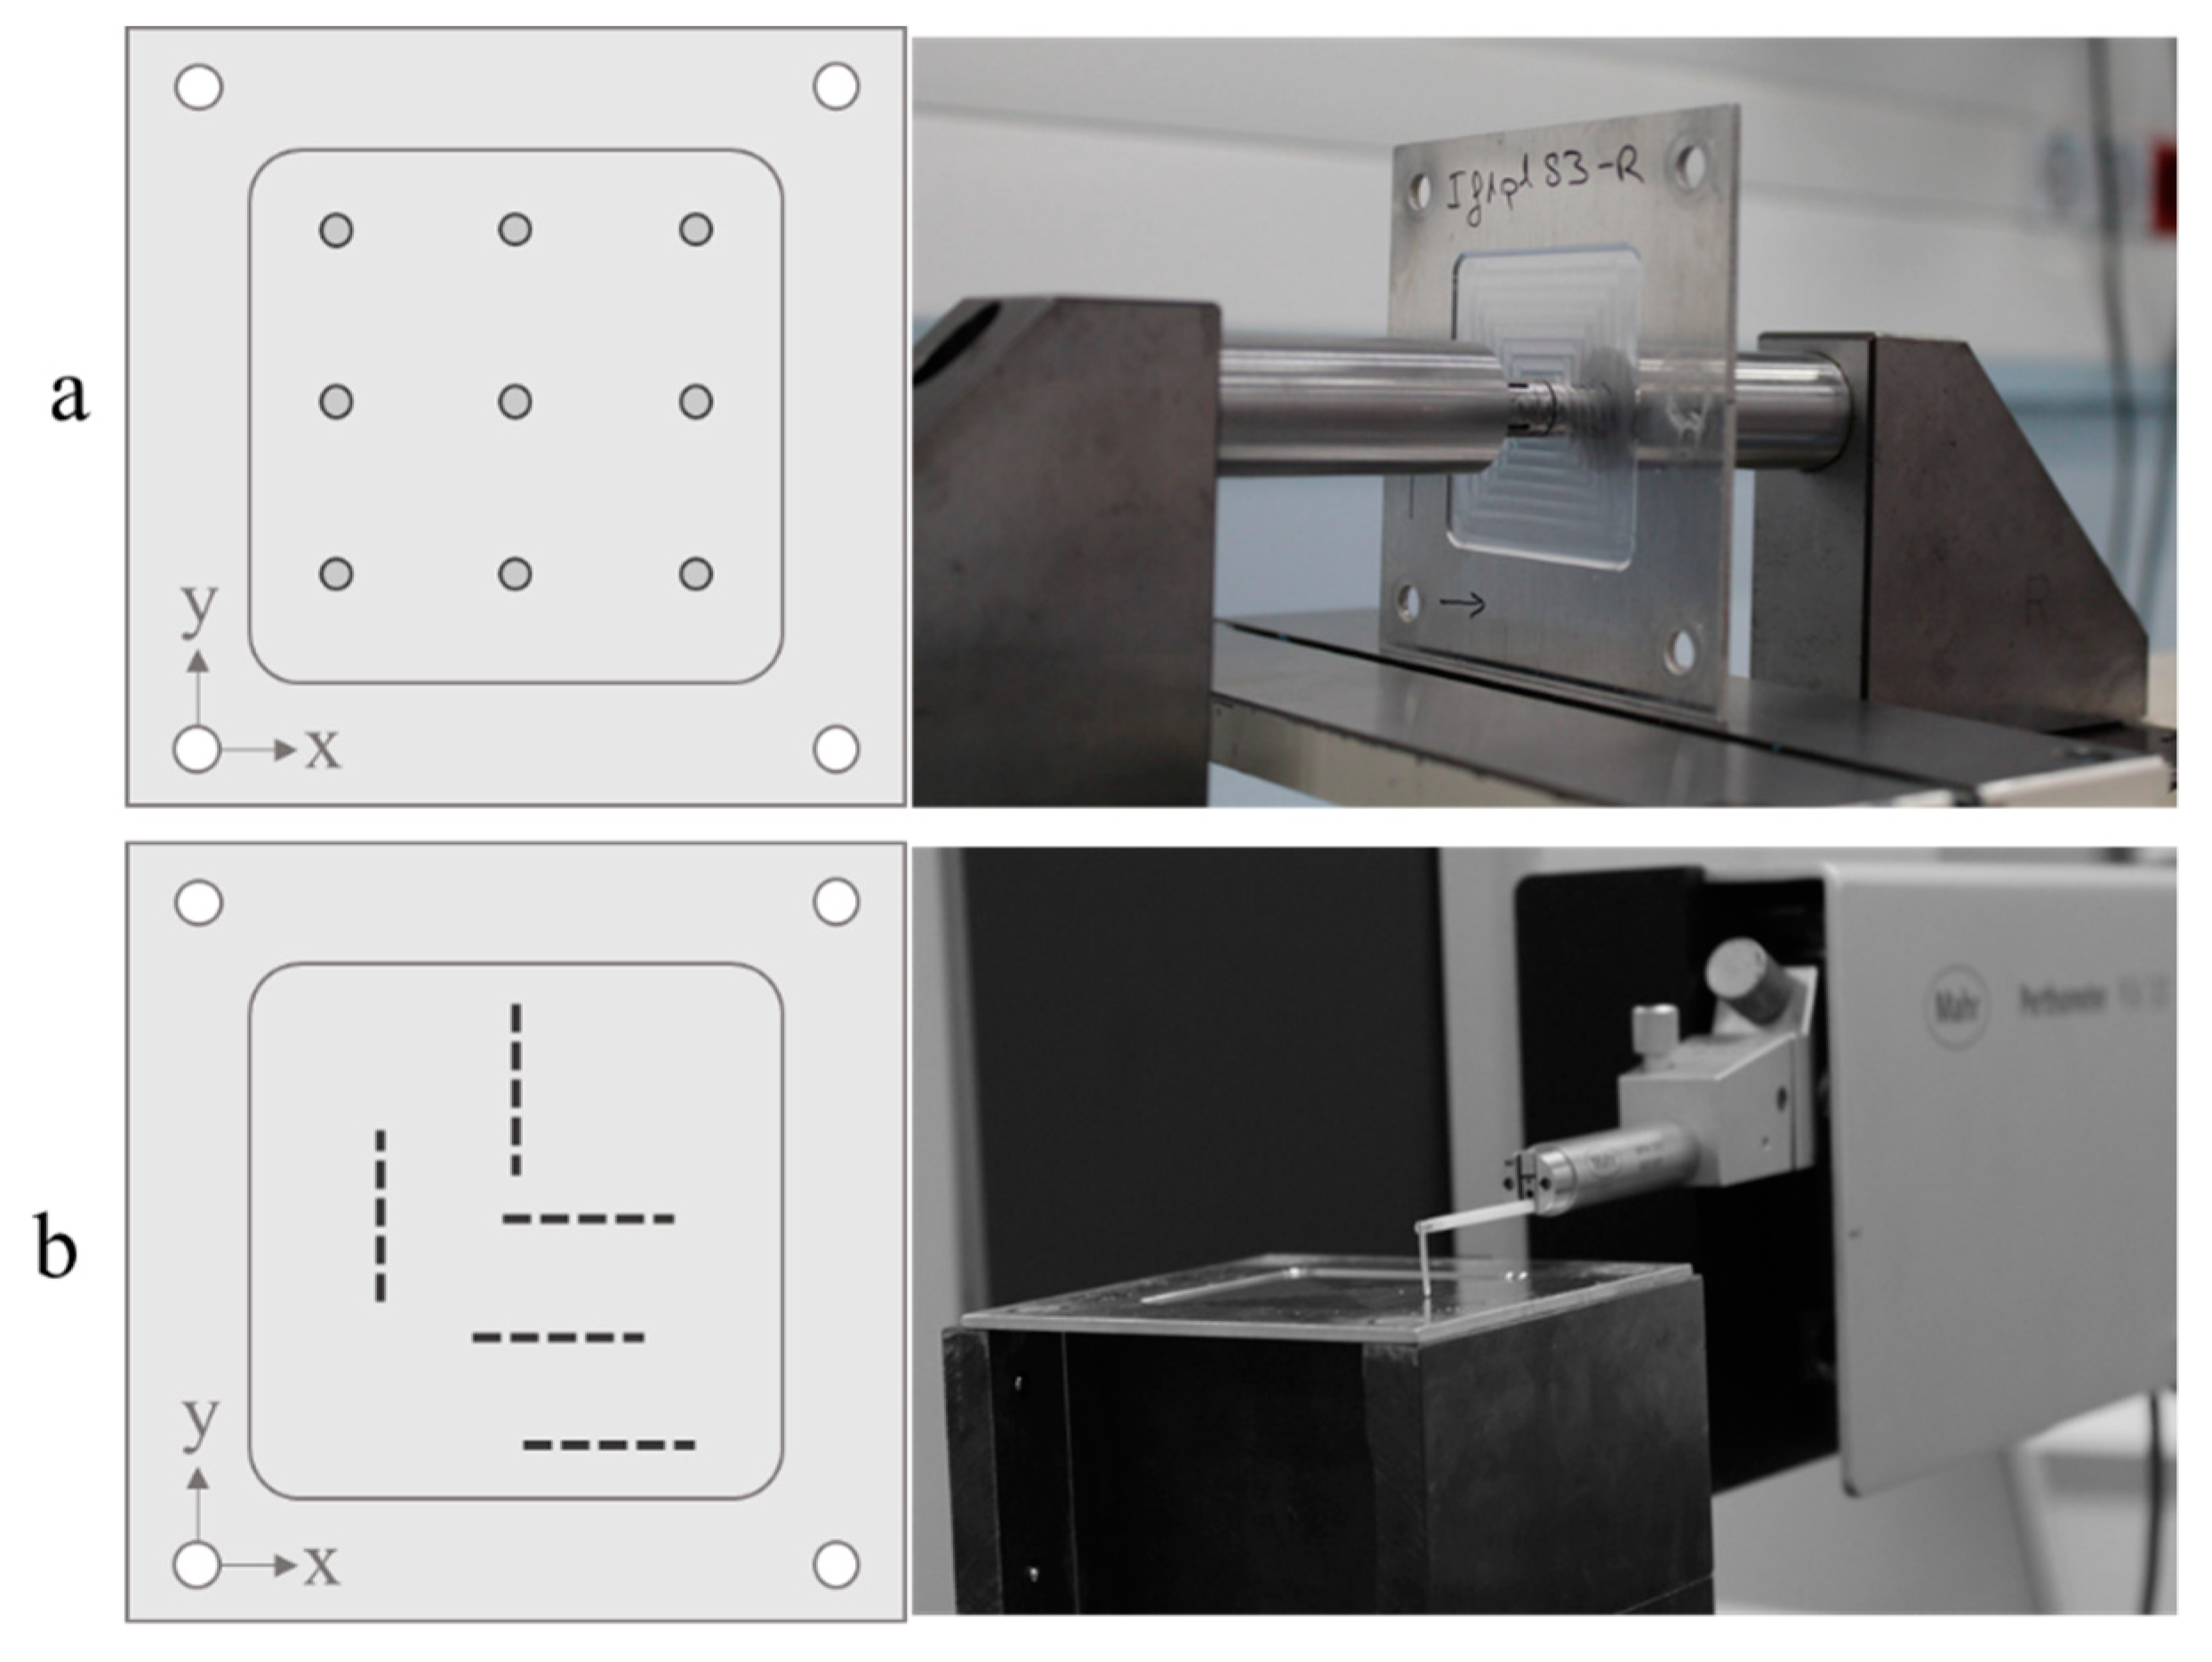
Final thicknesses were measured using a single coordinate measurement machine with an electronic comparator set. Nine points of the sample were evaluated, as shown in Figure 2a. Ra was measured using a Mahr Perthometer Concept PGK120 roughness measure station (Mahr technology, Göttingen, Germany) on five different areas of the part (Figure 2b). The areas for the roughness measures were selected in order to study the whole machining process and to cover both machine x and y axes. Roughness measurements were taken following the standard ISO 4288:1996 [28].
3. Results and Discussion
3.1. Final Thickness Error
The final thickness error can be defined as the difference between the experimental thickness and the expected one; this parameter measures the real part dimension. In addition to the static and dynamic phenomena that occur during low rigidity parts machining [7], aspects such as the machine positioning error and the thermal expansion of the spindle have influence over this parameter. Other possible thermal errors can be discarded due to the short length of the machining test, which allowed us to underestimate the effect on the accuracy of the machine due to temperature changes in its surroundings.
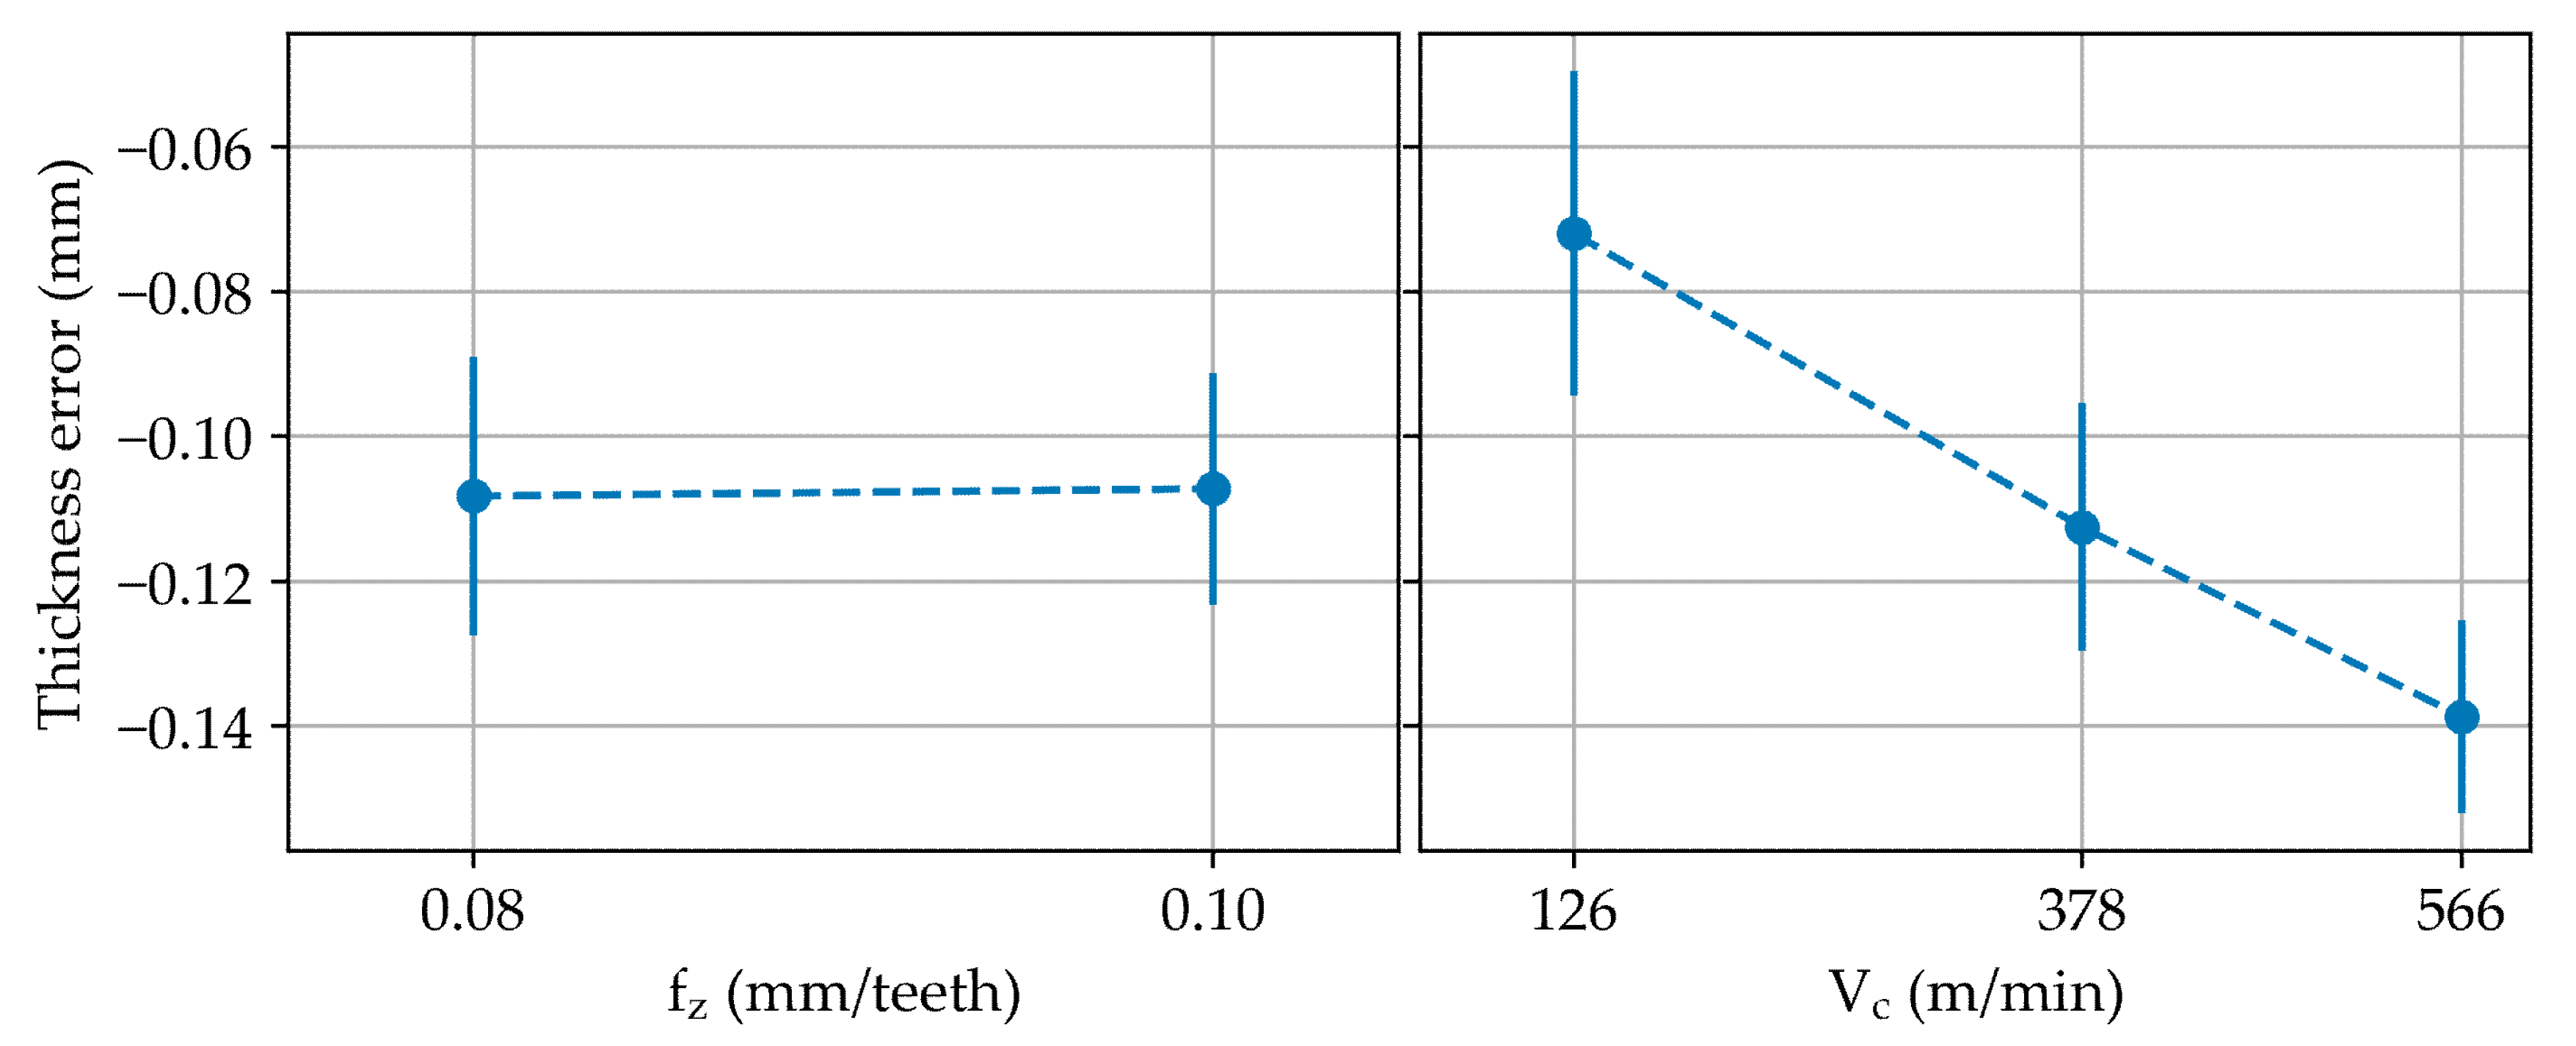
The analysis of the results showed that the feed rate had a negligible effect on the average final thickness error, while the cutting speed seems to have had a significant effect on this parameter. The higher the cutting speed, the greater the geometric error was, and the piece became thinner (Figure 3). Nevertheless, the thermal expansion of the spindle increased with the revolutions and therefore with the cutting speed [29]. This fact explains the part thinning, rejecting the direct effect of the cutting speed. Though the thermal expansion of the spindle was identified as an influencing parameter for the increase of the final average thickness error of the part, this error was easy to compensate when studying the elongation curves of the spindle and considering them in the CAM design [30] or implementing error compensation rules in the machine control [5].
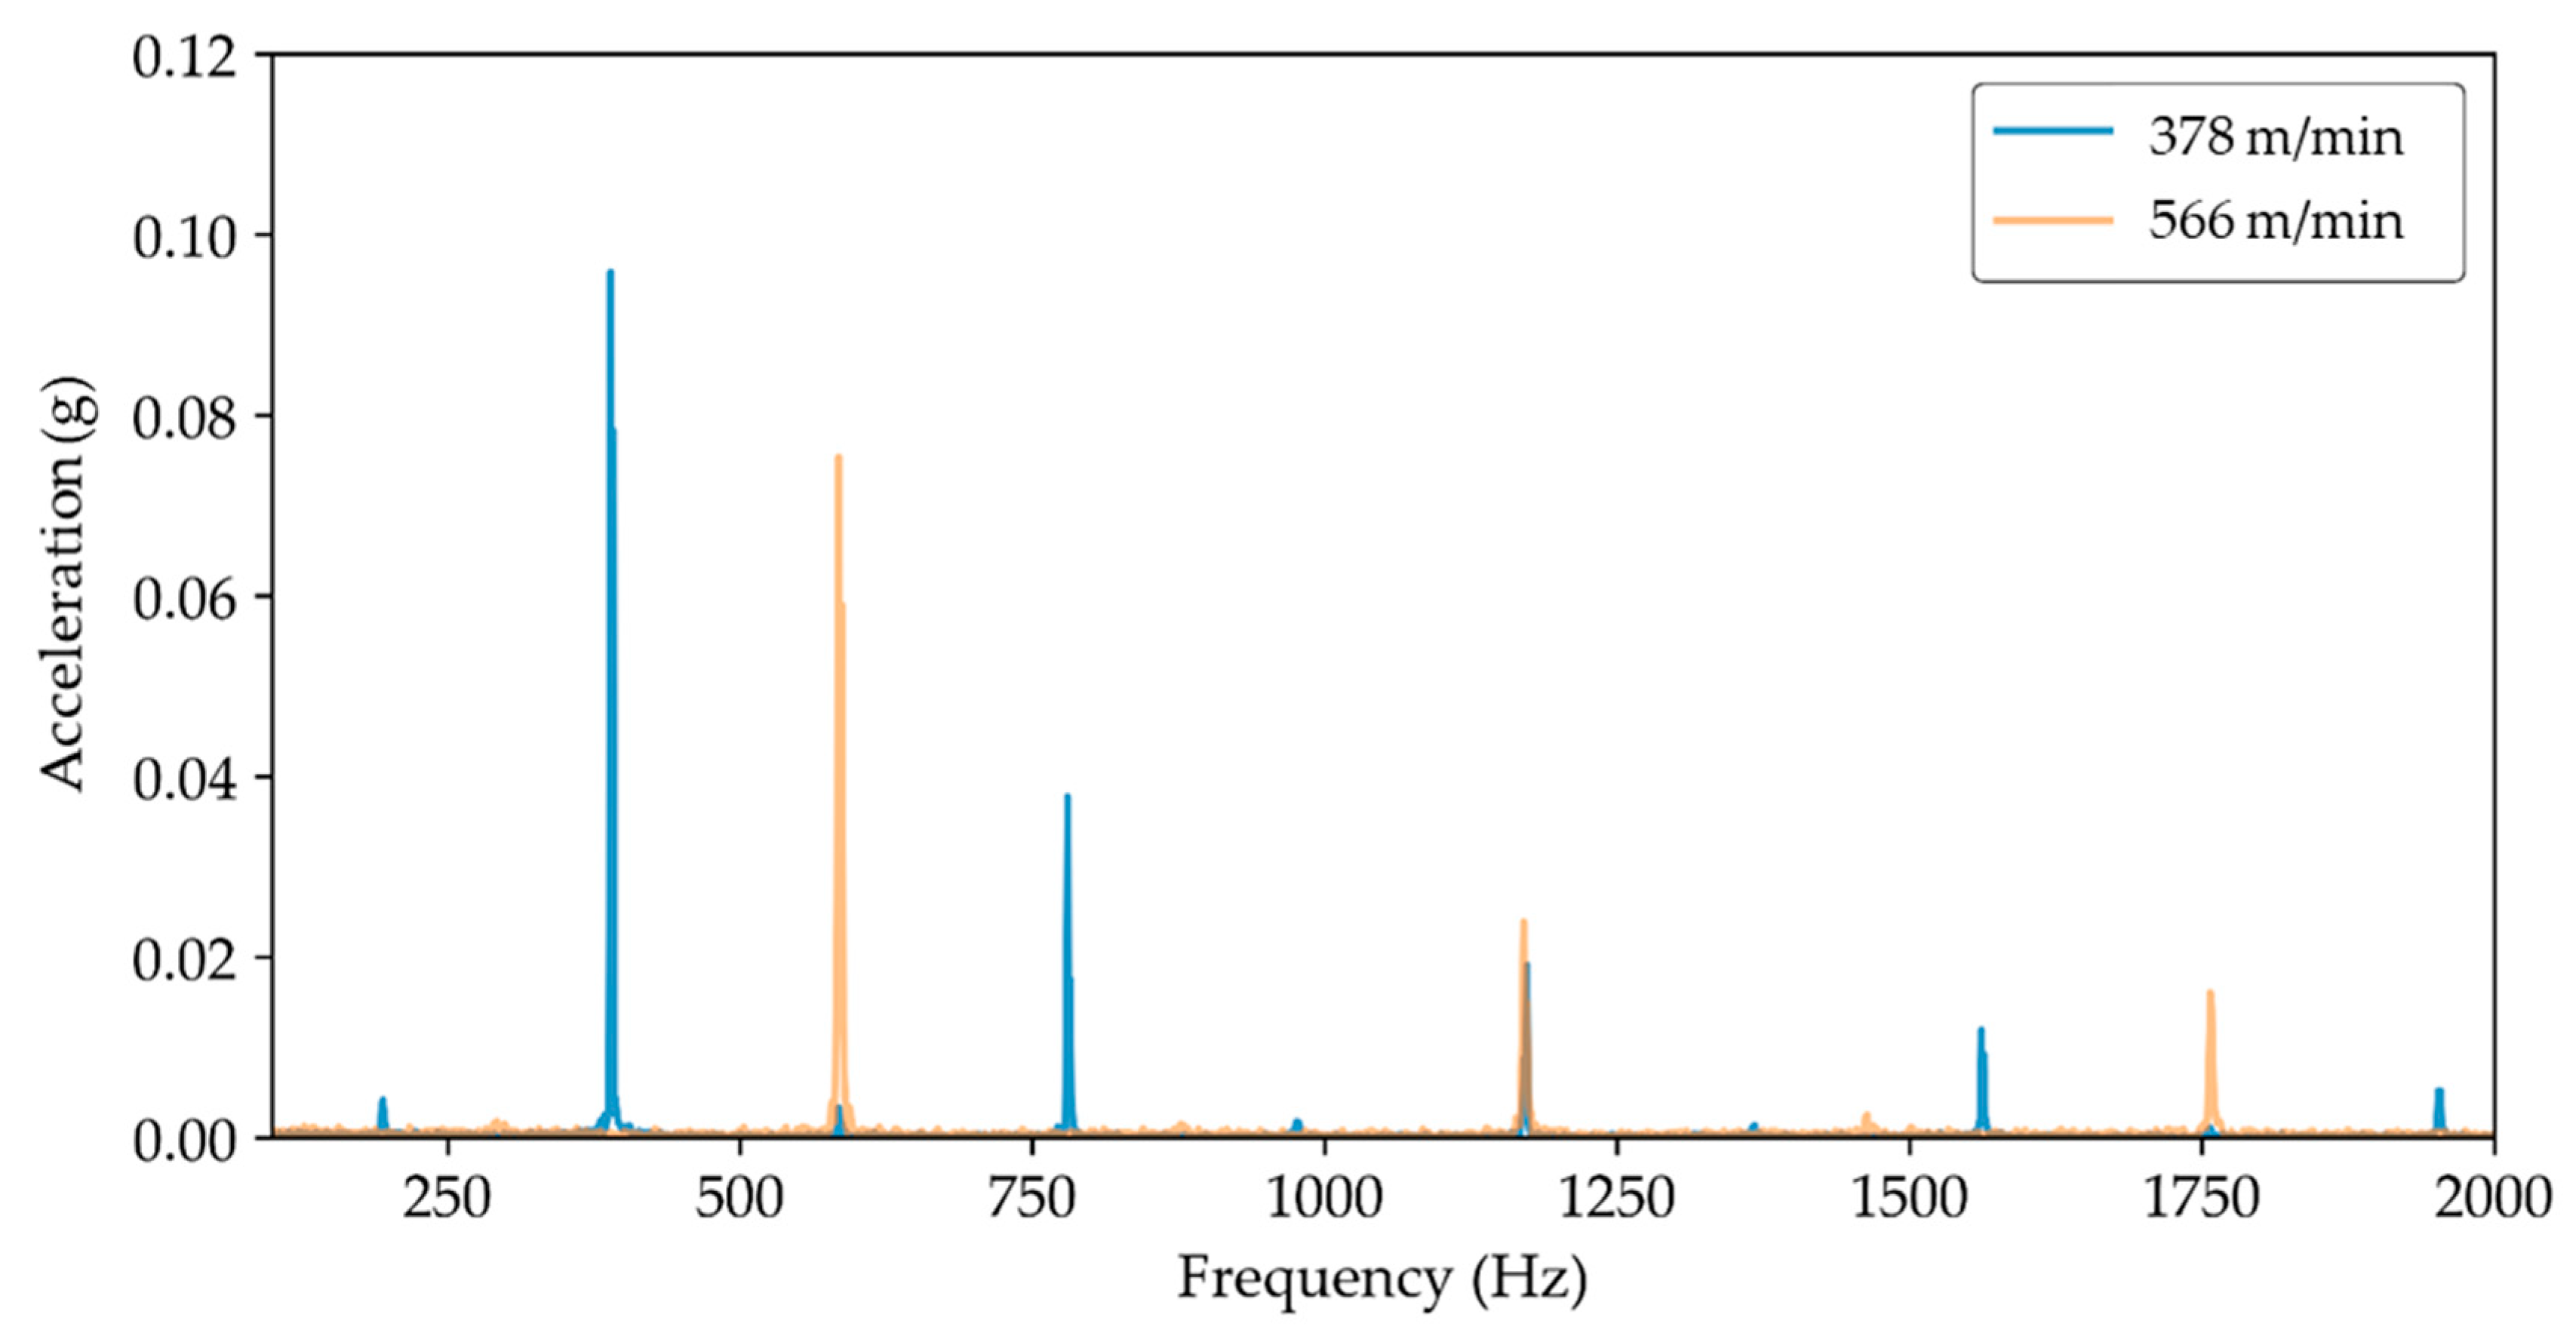
Once the average error—not directly related to the cutting parameters—can be compensated, the target is to get a homogeneous thickness distribution. Higher values of feeds per teeth combined with higher values of spindle speed led to a reduction up to 40% of the standard deviation of the thickness errors measured in a test sample. This decrease was due to a better behaviour of the process in terms of dynamics. If the part was machined at higher rotation speed where cutting forces excited higher frequency vibration modes and created lower vibration amplitudes (Figure 4), therefore leading to a more homogeneous thickness distribution
3.2. Roughness
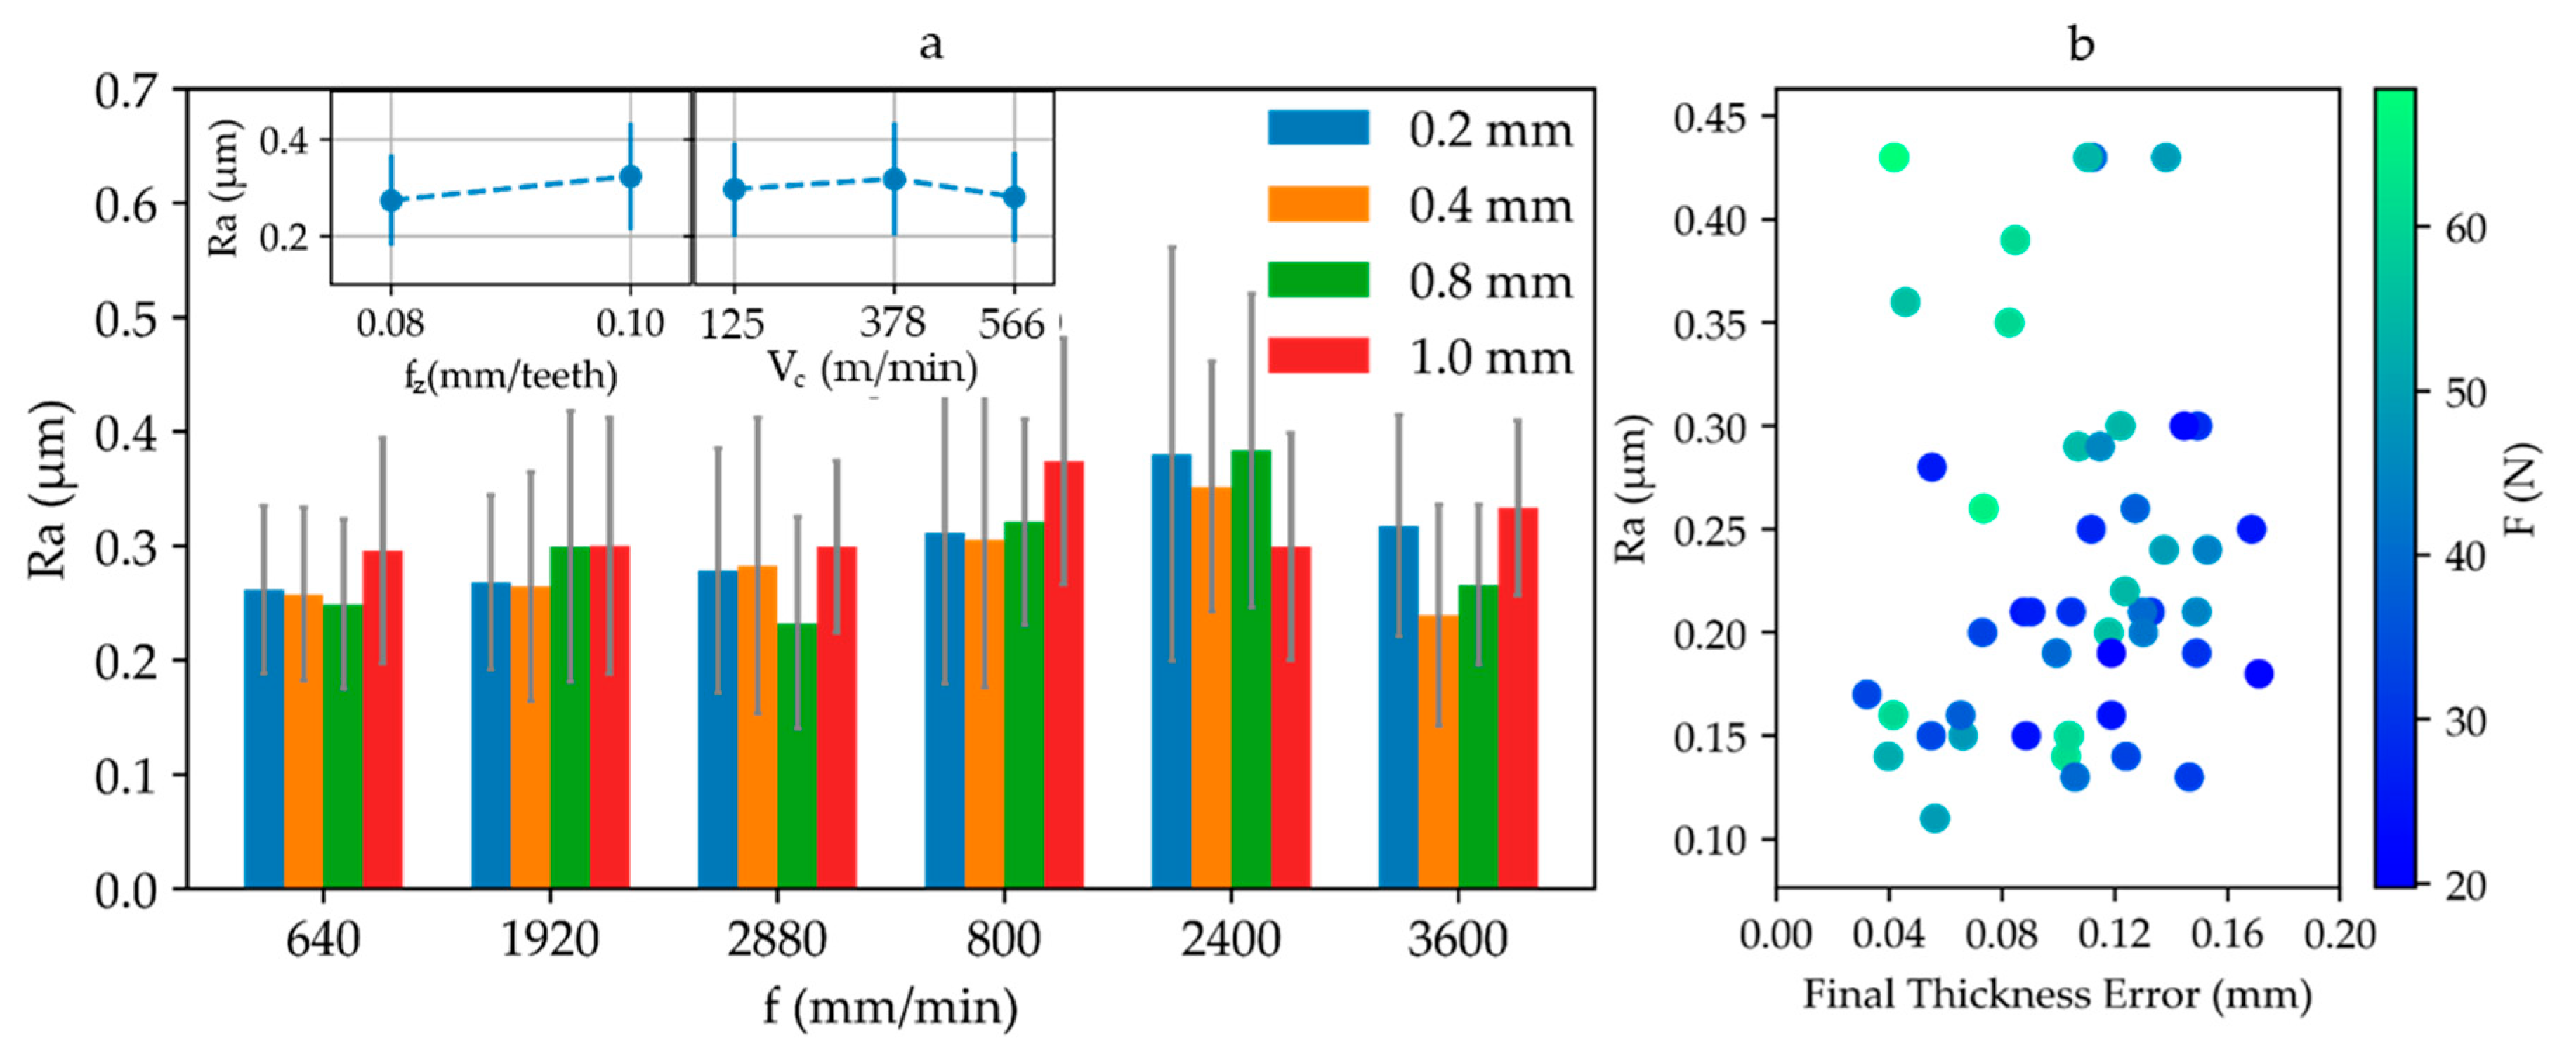
Roughness results were not significantly affected by any of the studied parameters in average deviation, with all of them being inside the most restrictive tolerance values (1.6 µm) required in chemical milling process (Figure 5a).
Measured forces and depths of cut errors did not have any impact on this quality characteristic (Figure 5b). However, lower cutting force values were related to roughness values under 0.3 µm. In fact, lower forces caused less tool deflection and vibrations of smaller amplitudes, leading to more stable machining processes that allowed us to produce more homogenous surfaces [31]. This revealed that the surface quality can be kept constant for any depth of cut under similar machining conditions. For this reason, the selection of parameters that decrease the forces should be considered.
3.3. Forces and Power Models
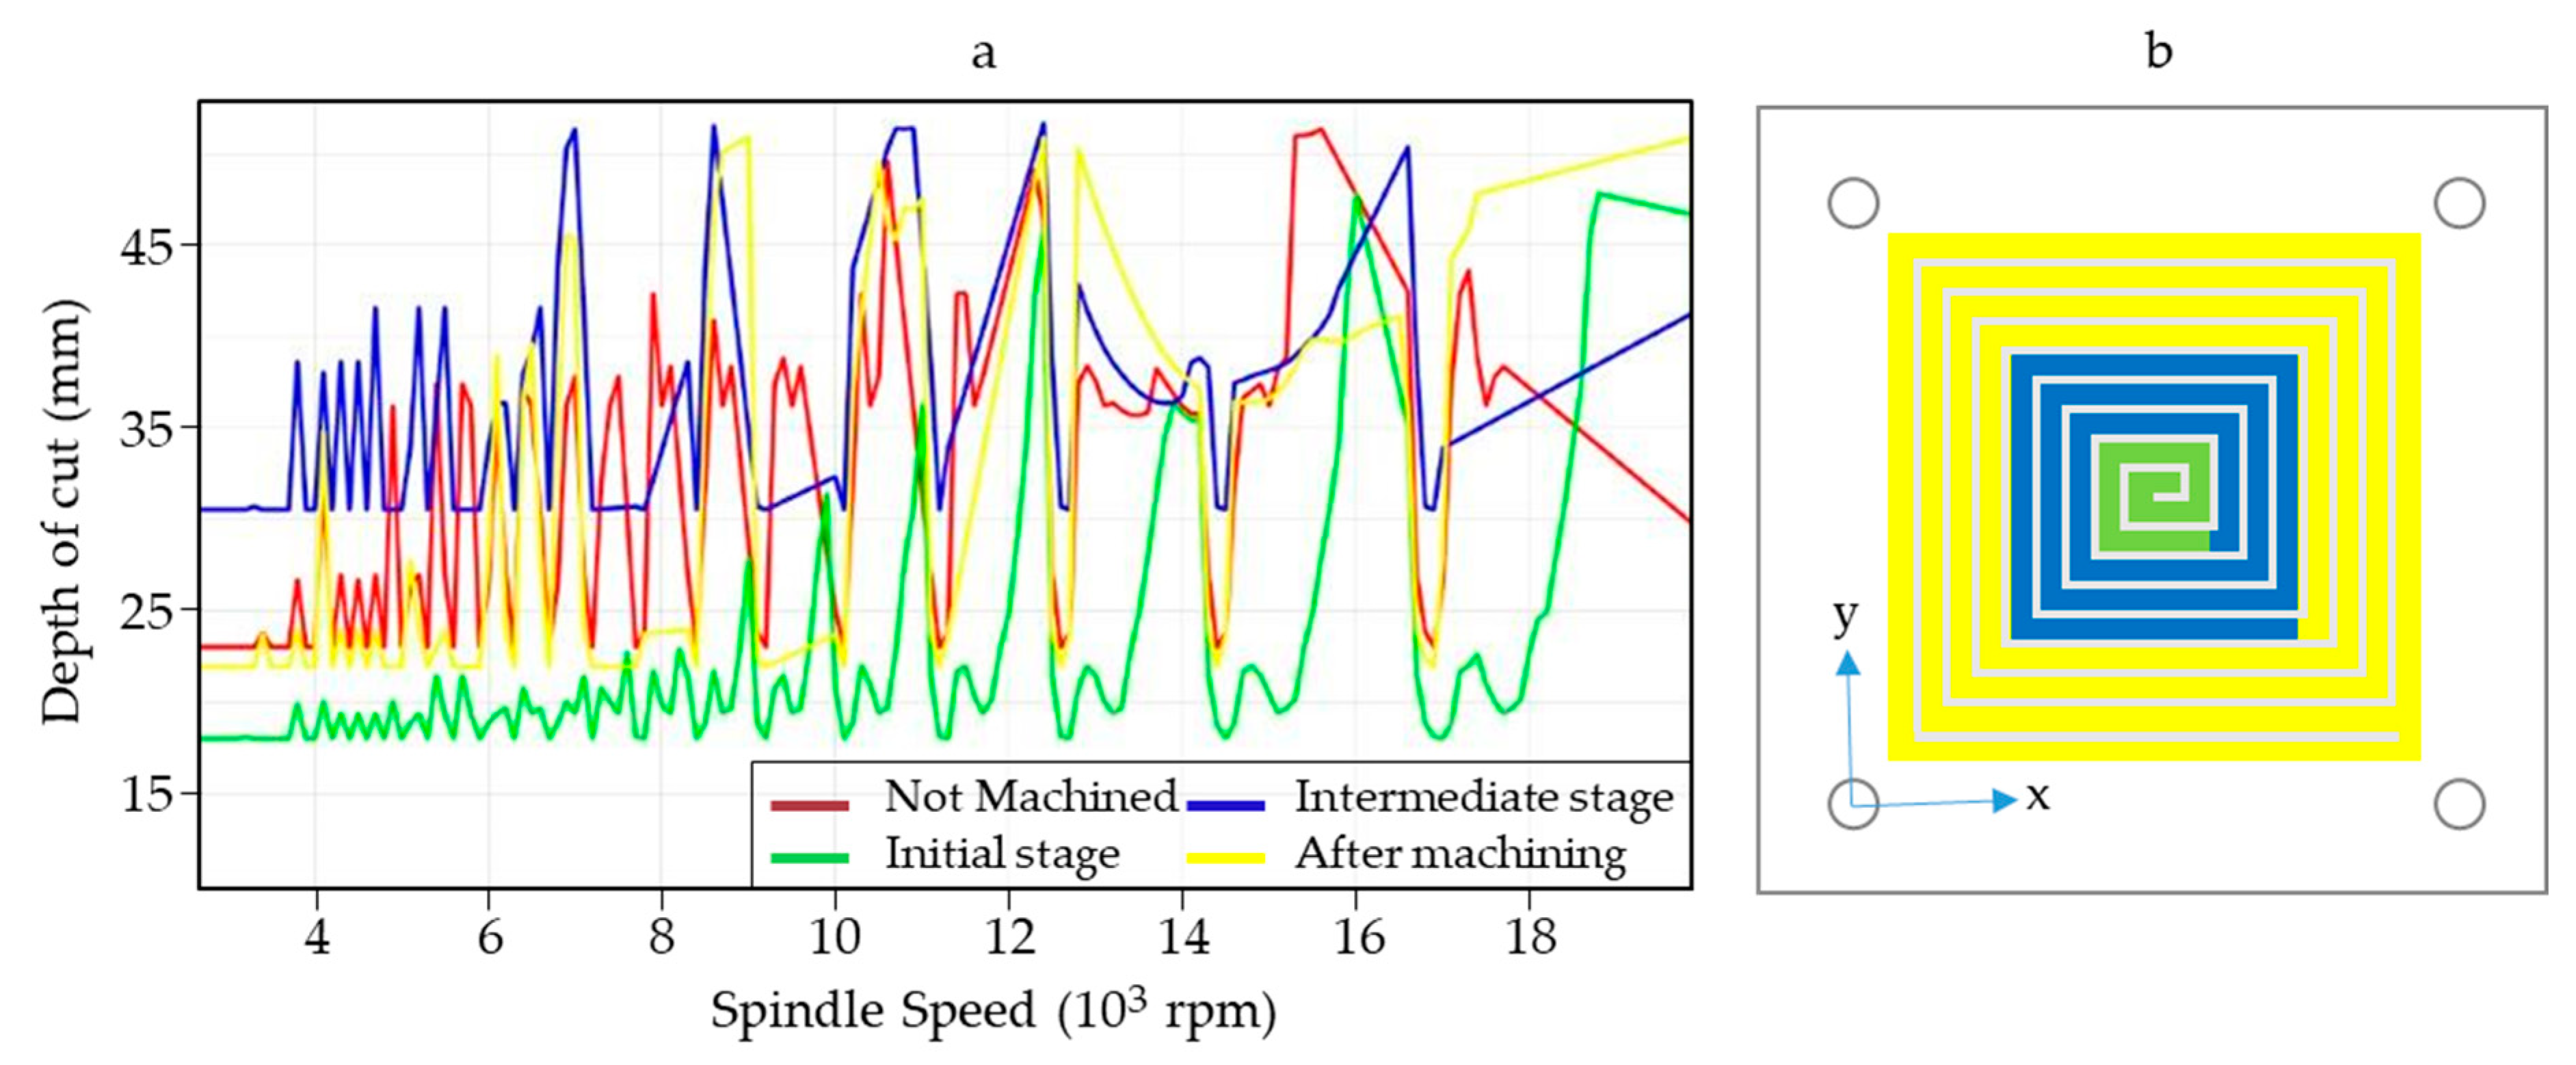
According to the SLD (Figure 6), thin plates almost behaved like a rigid part. This fact ensures that the tests were performed under stable machining conditions, proving that any variation occurring on the final thickness of the part was not produced by chatter issues.
However, the forces obtained on the tests performed on a rigid body did not completely agree with those measured on the flexible parts (Figure 7). The depth of cut was linearly related to Fx and Fy, but for medium and high cutting speed values, the Fz initiated a constant trend at cutting depths of 0.8 and 0.1 mm, respectively. Even though the machining operation was not in a high speed machining regimen for aluminium alloys, there was a decrease of the force values expected for the higher depths of cut. This fact had been previously observed by López de Lacalle et al. [32], where, due to the reduction of stiffness, the cutting forces decreased, obtaining behaviours closer to high speed machining at lower cutting speed.
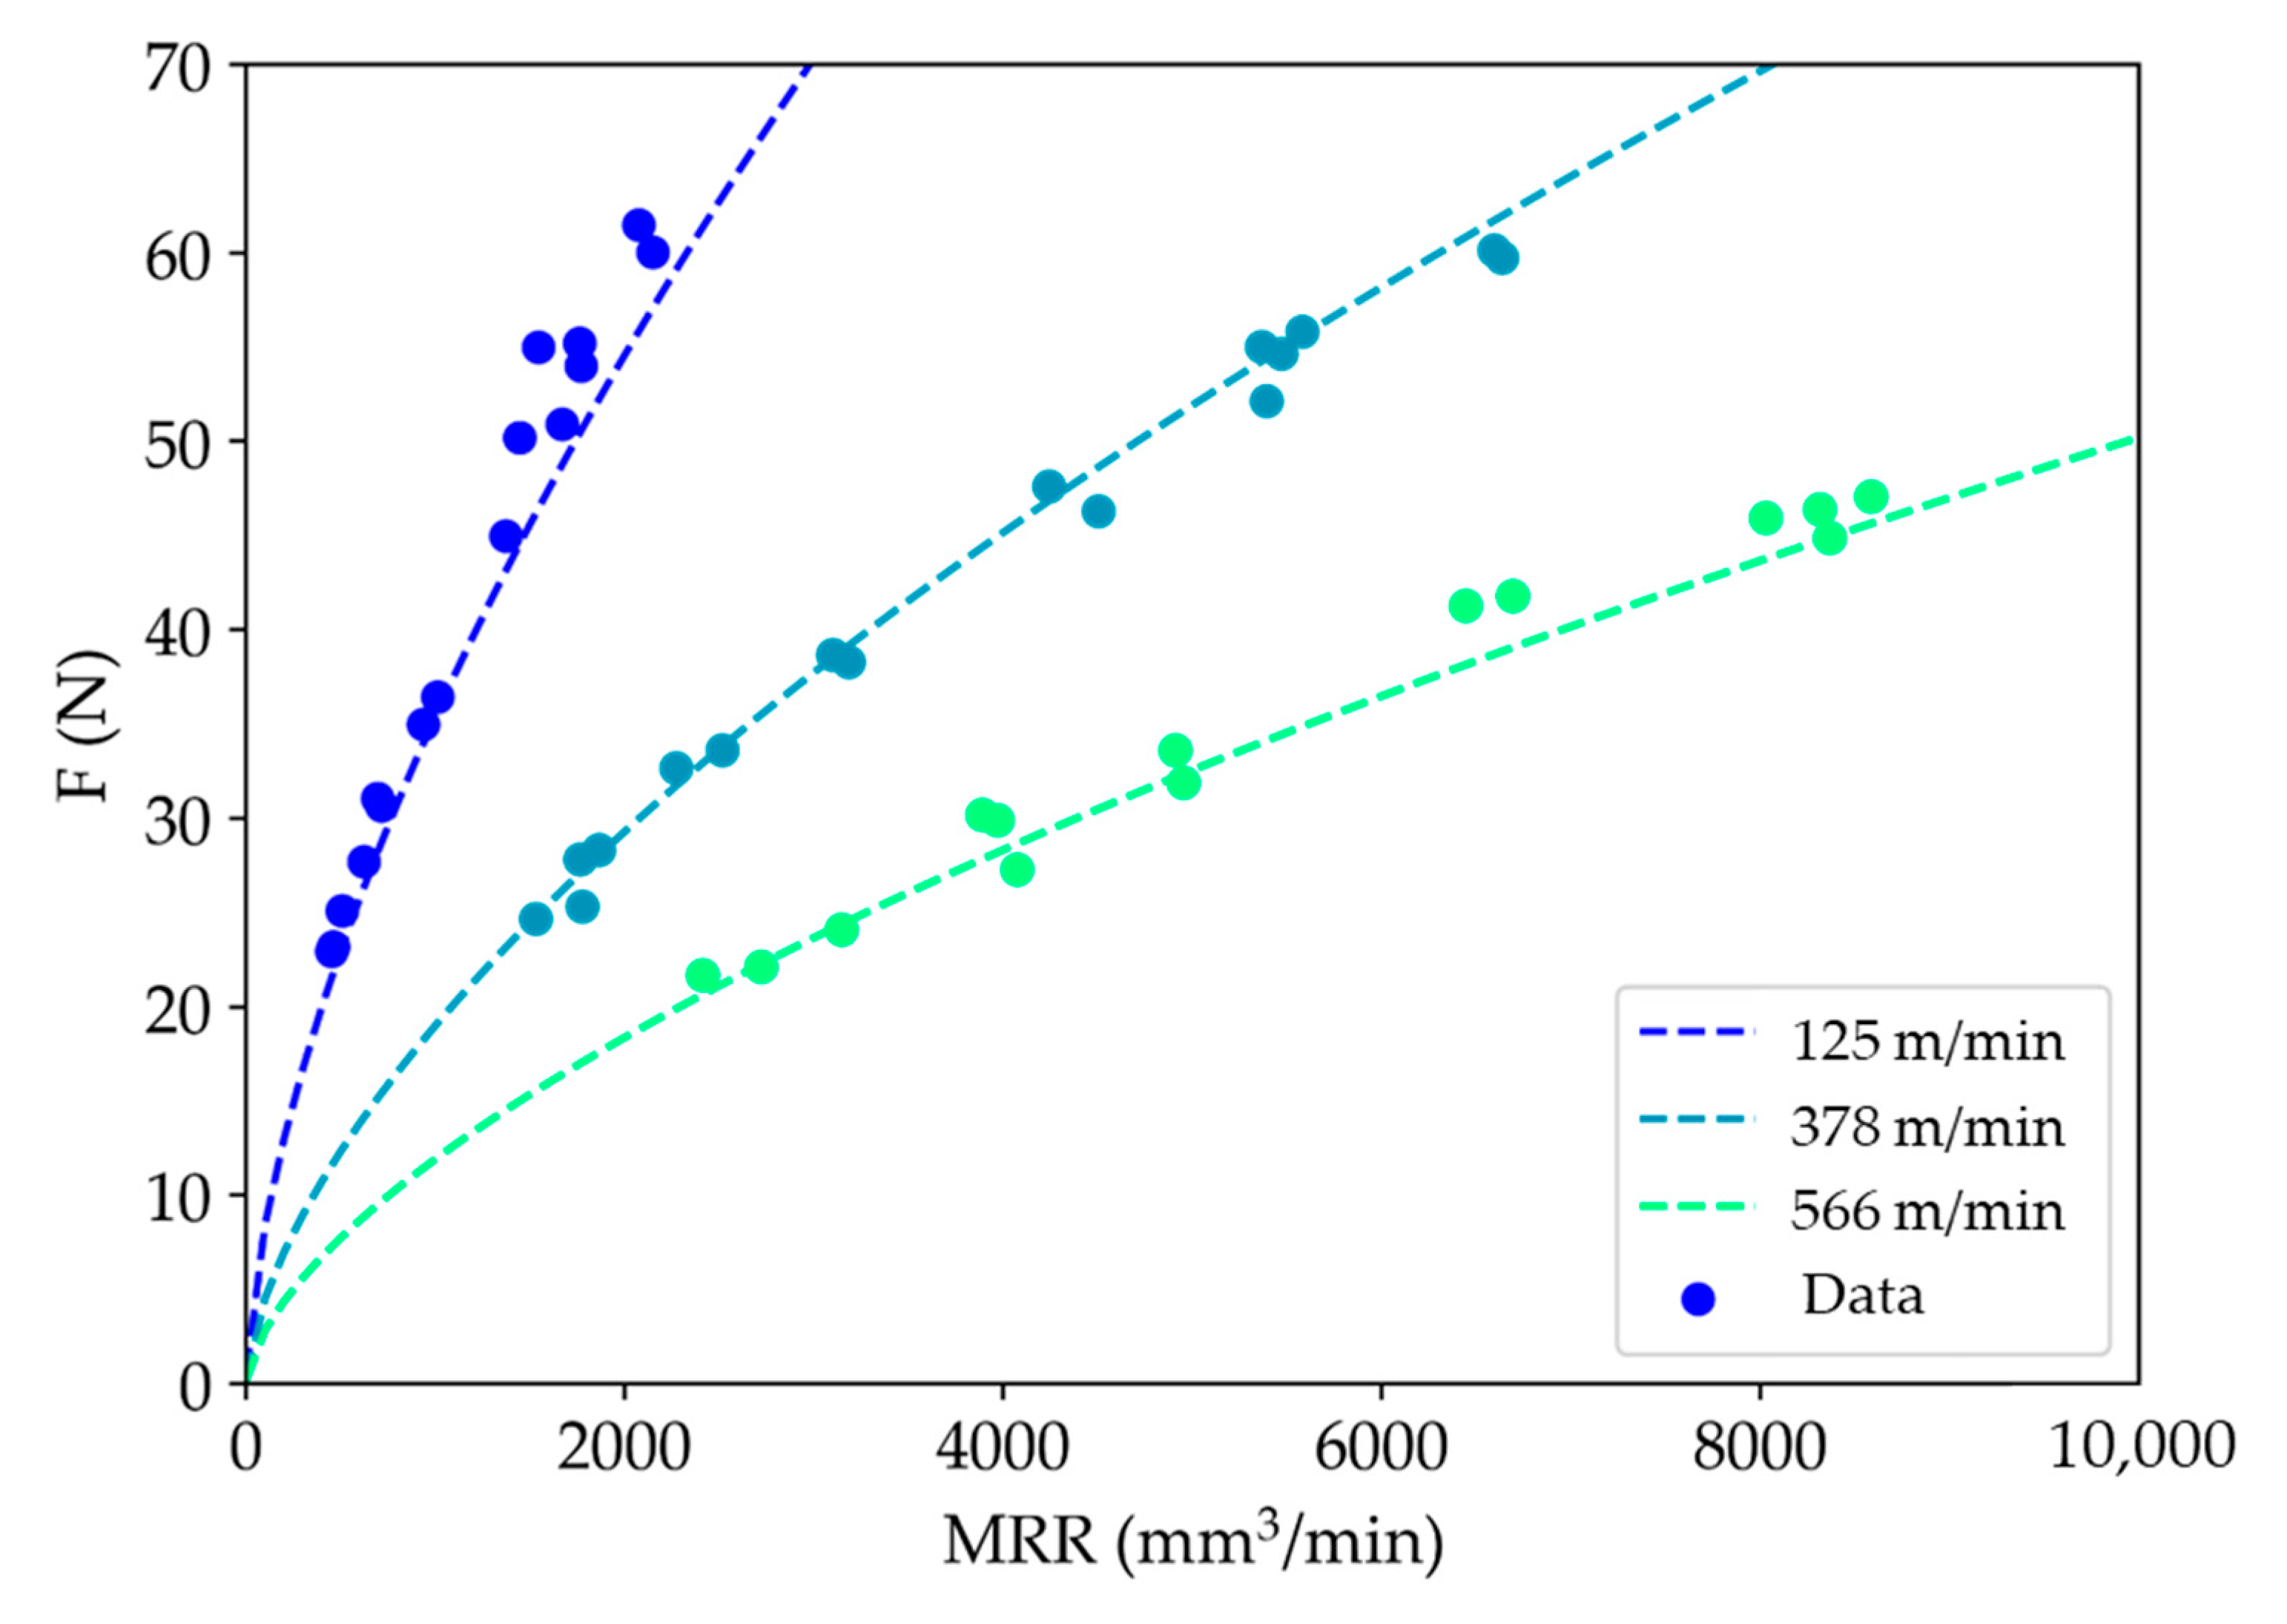
Aiming to provide a suitable model to relate the machining parameters to the process performance, the forces have been also studied by following a statistical approach. In this research, the force module and the material removal rate (MRR), which can be calculated as is shown in Equation (4), were correlated.
A potential regression was chosen for the model in order to ensure an R2 close to 0.95. The model equation is shown in Equation (5), where e is the Euler number, N is the number of teeth and ar is the radial depth of cut.
This model relates the force module (F) to the machining parameters through the MRR, and, as such, the concept of process productivity is introduced. This approach makes it easier to select higher efficient parameters. Both experimental and predicted data are shown in Figure 8. The reduction of forces at high spindle speeds for the same MRR is remarkable. This fact can be explained by a working regime close to high speed machining, as was referred to in previous paragraphs. The increase of the process temperature reduced the effort needed to cut the material [33]. Additionally, the heat generated in the process was quickly evacuated, which could have reduced induced residual stresses [34] and tool wear [33].
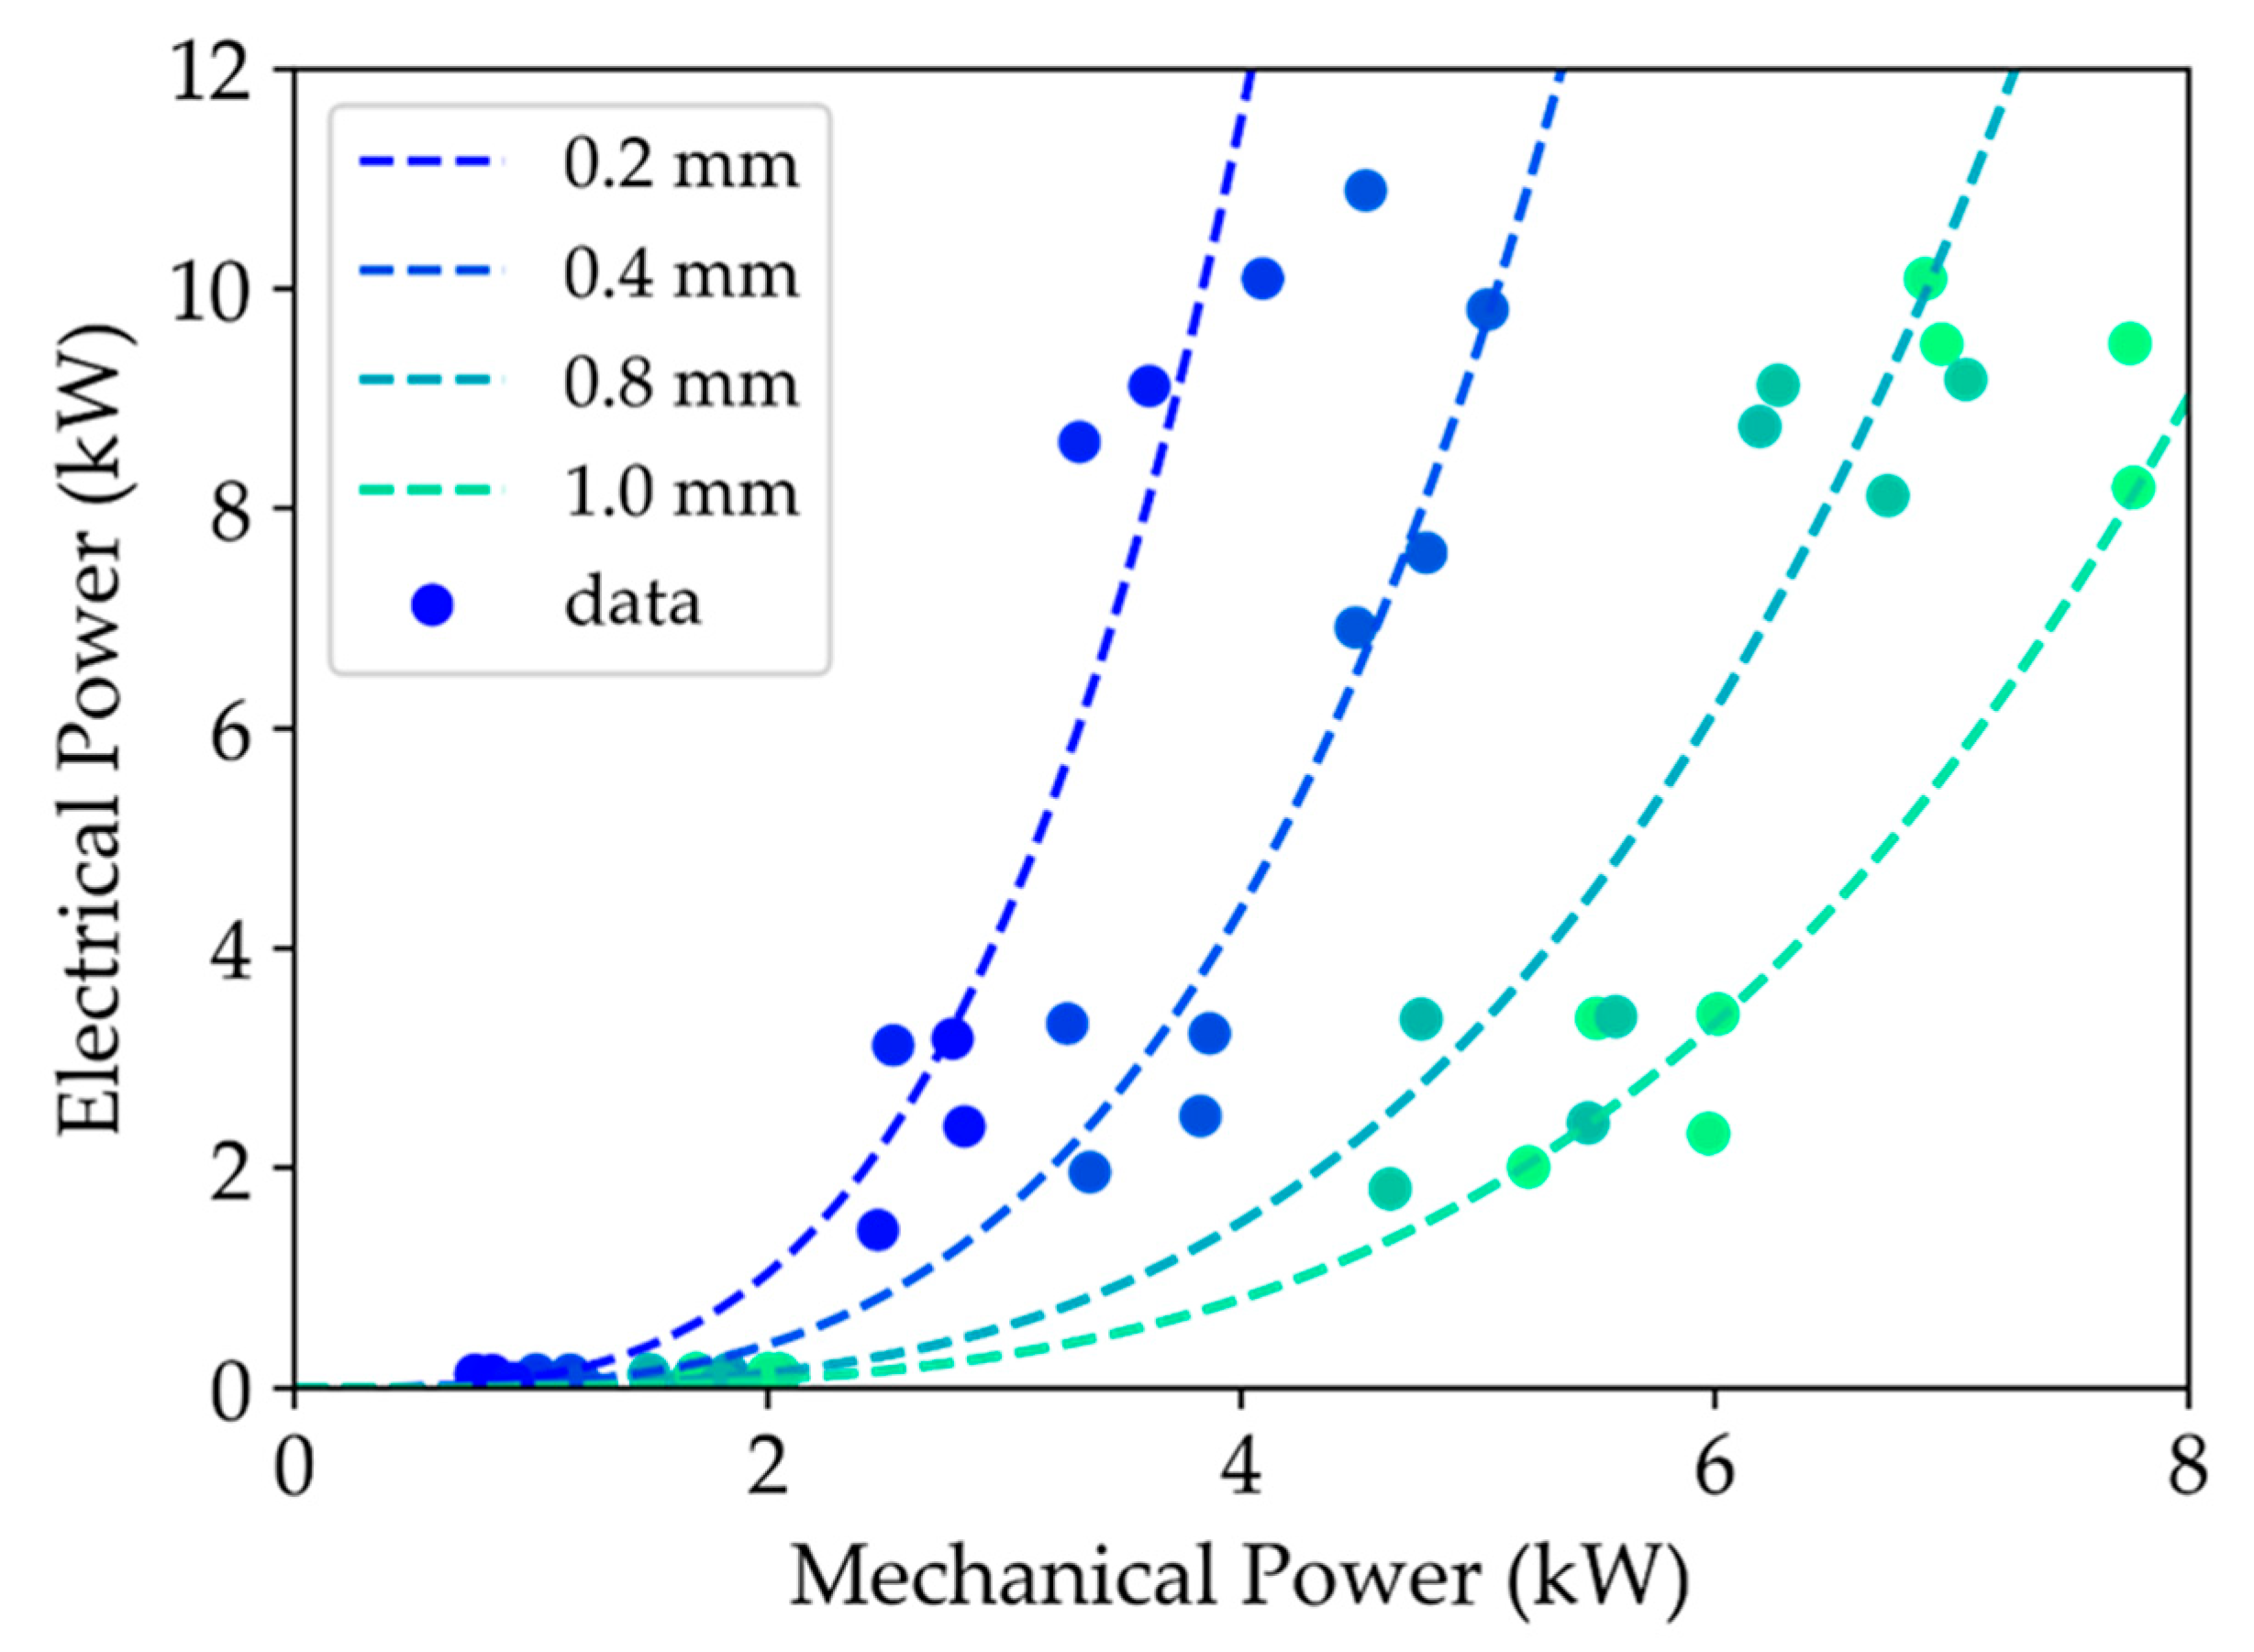
The force predicted by the proposed model, as a function of the cutting parameters, allowed the machining operation to be monitored using the electrical power registered by the ServoGuide System. Machining cutting power involved all the cutting parameters together, thus giving a closer idea of the overall interactions in the cutting process [35]. This monitoring option could be used as an input for adaptive control systems, in which the instant depth of cut can be controlled and modified online, as an alternative to others online depth of cut control based on ultrasound measurements [36]. This can reduce the number of overcuts and defective parts produced. In this case, the empirical model followed Equation (4), where e is the Euler number and D the tool diameter.
This equation was empirically obtained following an ANOVA approach, using the data represented on Figure 9. Combined relations between the different variables were neglected during the analysis. The R2 for the final statistical model was 0.953.
4. Conclusions
The machining of aluminium skin panels is used as a sustainable alternative for chemical milling process in the aerospace industry; therefore, it requires tight quality tolerances. This work presents a study of how cutting parameters influence the final thickness, surface roughness and cutting forces of thin plate aluminium parts in order to pursue two main objectives: To ensure the final quality of the part and to find an easy way to monitor the process.
The influence of the cutting speed on the final thickness error map of the machined thin plates has been proven. Higher values of cutting speeds tended to reduce the standard deviation of thickness error values measured in the test samples. The higher the cutting speed, the lower the cutting force module and the higher its excitation frequency, leading to an increase of process stability and a reduction of the results variability. Consequently, an improvement by up to a 40% of the implicit process tolerances has been achieved using a cutting speed of 566 m/min. This fact suggests that these parts could present even more homogenous results in terms of final thickness if higher cutting speeds were used. Roughness values are always under the more restrictive requirements for chemical milling. Lower values of cutting forces under stable machining conditions could ensure roughness values under 0.3 µm.
Furthermore, forces are affected by the low rigidity of the part that obtain lower average values for the z axis than those expected, based on rigid body experiments. A statistical analysis of the tests also revealed high cutting speed parameters as the more efficient ones based on MRR, providing a force model that includes all cutting parameter effects.
Finally, this model was used to relate mechanical power and electrical power consumption, allowing us to control online the depth of cut. This model is proposed as an alternative method to implement adaptive control techniques in other to avoid overcuts on aeronautical panels, reducing defective parts at the final stages of the process chain when their value is very high.
Author Contributions
Conceptualization, I.D.S., A.R. and A.J.G.; methodology, I.D.S. and A.R.; formal analysis, I.D.S. and A.J.G.; investigation, I.D.S. and A.R.; resources, A.R.; writing—original draft preparation, I.D.S.; writing–review and editing, A.R. and A.J.G.
Funding
This research was funded by University of Cadiz, grant number University training plan UCA/REC01VI/2016.
Acknowledgments
The authors acknowledge the support given by the Fraunhofer Joint Laboratory of Excellence on Advanced Production Technology (Fh–J_LEAPT Naples).
Conflicts of Interest
The authors declare no conflict of interest.
References
- Bi, Q.; Huang, N.; Zhang, S.; Shuai, C.; Wang, Y. Adaptive machining for curved contour on deformed large skin based on on-machine measurement and isometric mapping. Int. J. Mach. Tools Manuf. 2019, 136, 34–44. [Google Scholar] [CrossRef]
- Mtorres Surface Milling Machining. Available online: http://www.mtorres.es/en/aeronautics/products/metallic/torres-surface-milling (accessed on 2 June 2016).
- Dufieux Dufieux Industrie–Modular. Available online: http://www.dufieux-industrie.com/en/mirror-milling-system-mms (accessed on 2 June 2016).
- Mahmud, A.; Mayer, J.R.R.; Baron, L. Magnetic attraction forces between permanent magnet group arrays in a mobile magnetic clamp for pocket machining. CIRP J. Manuf. Sci. Technol. 2015, 11, 82–88. [Google Scholar] [CrossRef]
- Rubio, A.; Rivero, A.; Del Sol, I.; Ukar, E.; Lamikiz, A.; Rubio-Mateos, A.; Rivero–Rastrero, A.; Del Sol-Illana, I.; Ukar-Arrien, E.; Lamikiz-Mentxaka, A. Capacitation of flexibles fixtures for its use in high quality machining processes: An application case of the Industry 4.0 paradigm. DYNA 2018, 93, 608–612. [Google Scholar] [CrossRef]
- Campa, F.J.; López de Lacalle, L.N.; Celaya, A. Chatter avoidance in the milling of thin floors with bull-nose end mills: Model and stability diagrams. Int. J. Mach. Tools Manuf. 2011, 51, 43–53. [Google Scholar] [CrossRef] [Green Version]
- Del Sol, I.; Rivero, A.; Norberto, L.; Gamez, A.J. Thin–Wall Machining of Light Alloys: A Review of Models and Industrial Approaches. Materials 2019, 12, 2012. [Google Scholar] [CrossRef] [PubMed]
- Elbestawi, M.A.; Sagherian, R. Dynamic modeling for the prediction of surface errors in the milling of thin-walled sections. J. Mater. Process. Technol. 1991, 25, 215–228. [Google Scholar] [CrossRef]
- Tian, W.; Ren, J.; Wang, D.; Zhang, B. Optimization of non-uniform allowance process of thin-walled parts based on eigenvalue sensitivity. Int. J. Adv. Manuf. Technol. 2018, 96, 2101–2116. [Google Scholar] [CrossRef]
- Olvera, D.; Urbikain, G.; Elías-Zuñiga, A.; López de Lacalle, L. Improving Stability Prediction in Peripheral Milling of Al7075T6. Appl. Sci. 2018, 8, 1316. [Google Scholar] [CrossRef]
- Urbikain, G.; Olvera, D.; de Lacalle, L.N.L. Stability contour maps with barrel cutters considering the tool orientation. Int. J. Adv. Manuf. Technol. 2017, 89, 2491–2501. [Google Scholar] [CrossRef]
- Liu, X.; Gao, H.; Yue, C.; Li, R.; Jiang, N.; Yang, L. Investigation of the milling stability based on modified variable cutting force coefficients. Int. J. Adv. Manuf. Technol. 2018, 96, 2991–3002. [Google Scholar] [CrossRef]
- Qu, S.; Zhao, J.; Wang, T. Three–dimensional stability prediction and chatter analysis in milling of thin-walled plate. Int. J. Adv. Manuf. Technol. 2016, 86, 2291–2300. [Google Scholar] [CrossRef]
- Campa, F.J.; López de Lacalle, L.N.; Lamikiz, A.; Sánchez, J.A. Selection of cutting conditions for a stable milling of flexible parts with bull–nose end mills. J. Mater. Process. Technol. 2007, 191, 279–282. [Google Scholar] [CrossRef]
- Ding, H.; Ke, Y. Study on Machining Deformation of Aircraft Monolithic Component by FEM and Experiment. Chinese J. Aeronaut. 2006, 19, 247–254. [Google Scholar] [CrossRef] [Green Version]
- Tuysuz, O.; Altintas, Y. Frequency Domain Updating of Thin-Walled Workpiece Dynamics Using Reduced Order Substructuring Method in Machining. J. Manuf. Sci. Eng. 2017, 139, 071013. [Google Scholar] [CrossRef]
- Lin, X.; Wu, D.; Yang, B.; Wu, G.; Shan, X.; Xiao, Q.; Hu, L.; Yu, J. Research on the mechanism of milling surface waviness formation in thin-walled blades. Int. J. Adv. Manuf. Technol. 2017, 93, 2459–2470. [Google Scholar] [CrossRef]
- Yan, Q.; Luo, M.; Tang, K. Multi–axis variable depth-of-cut machining of thin-walled workpieces based on the workpiece deflection constraint. CAD Comput. Aided Des. 2018, 100, 14–29. [Google Scholar] [CrossRef]
- Sonawane, H.A.; Joshi, S.S. Modeling of machined surface quality in high-speed ball-end milling of Inconel-718 thin cantilevers. Int. J. Adv. Manuf. Technol. 2015, 78, 1751–1768. [Google Scholar] [CrossRef]
- De Oliveira, E.L.; de Souza, A.F.; Diniz, A.E. Evaluating the influences of the cutting parameters on the surface roughness and form errors in 4–axis milling of thin–walled free–form parts of AISI H13 steel. J. Braz. Soc. Mech. Sci. Eng. 2018, 40, 334. [Google Scholar] [CrossRef]
- Del Sol, I.; Rivero, A.; Salguero, J.; Fernández–Vidal, S.R.; Marcos, M. Tool–path effect on the geometric deviations in the machining of UNS A92024 aeronautic skins. Procedia Manuf. 2017, 13, 639–646. [Google Scholar] [CrossRef]
- Seguy, S.; Campa, F.J.; López de Lacalle, L.N.; Arnaud, L.; Dessein, G.; Aramendi, G. Toolpath dependent stability lobes for the milling of thin-walled parts. Int. J. Mach. Mach. Mater. 2008, 4, 377–392. [Google Scholar] [CrossRef]
- Mahmud, A.; Mayer, J.R.R.; Baron, L. Determining the minimum clamping force by cutting force simulation in aerospace fuselage pocket machining. Int. J. Adv. Manuf. Technol. 2015, 80, 1751–1758. [Google Scholar] [CrossRef]
- Li, B.; Jiang, X.; Yang, J.; Liang, S.Y. Effects of depth of cut on the redistribution of residual stress and distortion during the milling of thin–walled part. J. Mater. Process. Technol. 2015, 216, 223–233. [Google Scholar] [CrossRef]
- Altintaş, Y.; Budak, E. Analytical Prediction of Stability Lobes in Milling. CIRP Ann. Manuf. Technol. 1995, 44, 357–362. [Google Scholar] [CrossRef]
- Budak, E. Analytical models for high performance milling. Part I: Cutting forces, structural deformations and tolerance integrity. Int. J. Mach. Tools Manuf. 2006, 46, 1478–1488. [Google Scholar] [CrossRef] [Green Version]
- Gradišek, J.; Kalveram, M.; Weinert, K. Mechanistic identification of specific force coefficients for a general end mill. Int. J. Mach. Tools Manuf. 2004, 44, 401–414. [Google Scholar] [CrossRef]
- ISO, EN. 4288—Geometrical Product Specifications (GPS)—Surface Texture: Profile Method–Rules and Procedures for the Assessment of Surface Texture; International Organization for Standardization: Geneva, Switzerland, 1996.
- Chen, J.S.; Hsu, W.Y. Characterizations and models for the thermal growth of a motorized high speed spindle. Int. J. Mach. Tools Manuf. 2003, 43, 1163–1170. [Google Scholar] [CrossRef]
- Ratchev, S.; Liu, S.; Huang, W.; Becker, A.A. Milling error prediction and compensation in machining of low–rigidity parts. Int. J. Mach. Tools Manuf. 2004, 44, 1629–1641. [Google Scholar] [CrossRef]
- Bolar, G.; Das, A.; Joshi, S.N. Measurement and analysis of cutting force and product surface quality during end-milling of thin-wall components. Meas. J. Int. Meas. Confed. 2018, 121, 190–204. [Google Scholar] [CrossRef]
- López De Lacalle, L.N.; Lamikiz, A.; Sánchez, J.A.; Bustos, I.F. de Recording of real cutting forces along the milling of complex parts. Mechatronics 2006, 16, 21–32. [Google Scholar] [CrossRef]
- Brinksmeier, E.; Preuss, W.; Riemer, O.; Rentsch, R. Cutting forces, tool wear and surface finish in high speed diamond machining. Precis. Eng. 2017, 49, 293–304. [Google Scholar] [CrossRef]
- Masoudi, S.; Amini, S.; Saeidi, E.; Eslami-Chalander, H. Effect of machining-induced residual stress on the distortion of thin-walled parts. Int. J. Adv. Manuf. Technol. 2014, 76, 597–608. [Google Scholar] [CrossRef]
- Ma, Y.; Feng, P.; Zhang, J.; Wu, Z.; Yu, D. Energy criteria for machining-induced residual stresses in face milling and their relation with cutting power. Int. J. Adv. Manuf. Technol. 2015, 81, 1023–1032. [Google Scholar] [CrossRef]
- Rubio, A.; Calleja, L.; Orive, J.; Mújica, Á.; Rivero, A. Flexible Machining System for an Efficient Skin Machining. SAE Int. 2016, 1–12. [Google Scholar] [CrossRef]
Figure 1.
Scheme of the monitoring system.

Figure 2.
Measure procedure. (a) points selected for the thickness analysis and (b) areas studied for the roughness analysis.
Figure 2.
Measure procedure. (a) points selected for the thickness analysis and (b) areas studied for the roughness analysis.

Figure 3.
Average final thickness error depending on the feed per teeth (fz) and the cutting speed (Vc).
Figure 3.
Average final thickness error depending on the feed per teeth (fz) and the cutting speed (Vc).

Figure 4.
Fast Fourier Transform of the part acceleration signal for test at fz = 0.1 and ap = 1.0 mm, under two different cutting speeds.
Figure 4.
Fast Fourier Transform of the part acceleration signal for test at fz = 0.1 and ap = 1.0 mm, under two different cutting speeds.

Figure 5.
(a) Average of the roughness values obtained for different feed rates (f = N·fz·S) as a function of the depth of cut. The inlet shows the partial effect of the feed rate per teeth and the cutting speed. (b) Average roughness values of each performed test against the depth of cut error considering the force module.

Figure 6.
(a) Stability Lobe Diagrams (SLD) variation depending on the machining stage. Red line, before the machining; green line, in the first instants of the machining; blue line, intermediate stage; and yellow line, after the whole machining operation was performed. (b) Scheme of the areas of material removed in each stage with corresponding colours.

Figure 7.
Average forces for the x, y and z axes under rigid (solid blue line) and flexible (dashed orange line) consideration.
Figure 7.
Average forces for the x, y and z axes under rigid (solid blue line) and flexible (dashed orange line) consideration.

Figure 8.
Average force module predicted (dashed lines) and experimental data against the material removal rate (MRR) as a function of the cutting speed (Vc).
Figure 8.
Average force module predicted (dashed lines) and experimental data against the material removal rate (MRR) as a function of the cutting speed (Vc).

Figure 9.
Model correlation between the mechanical power, calculated based on the recorded forces, and the electrical power obtained on the ServoGuide system as a function of the ap.
Figure 9.
Model correlation between the mechanical power, calculated based on the recorded forces, and the electrical power obtained on the ServoGuide system as a function of the ap.


Table 1.
Machining parameters and levels for skin sample tests.
| Parameter | Level 1 | Level 2 | Level 3 | Level 4 |
|---|---|---|---|---|
| ap (mm) | 0.2 | 0.4 | 0.8 | 1.0 |
| fz (mm/tooth) | 0.08 | 0.1 | - | - |
| S (rpm) | 4,000 | 12,000 | 18,000 | - |
| Vc (m/min) | 126 | 378 | 566 | - |
Table 2.
Machining parameters and levels for cutting coefficient calculation tests.
| Parameter | Level 1 | Level 2 | Level 3 |
|---|---|---|---|
| ap (mm) | 0.2 | 0.6 | 1.0 |
| fz (mm/tooth) | 0.06 | 0.08 | 0.1 |
| S (rpm) | 4,000 | 12,000 | 18,000 |
| Vc (m/min) | 126 | 378 | 566 |
© 2019 by the authors. Licensee MDPI, Basel, Switzerland. This article is an open access article distributed under the terms and conditions of the Creative Commons Attribution (CC BY) license (http://creativecommons.org/licenses/by/4.0/).
Share and Cite
MDPI and ACS Style
Del Sol, I.; Rivero, A.; Gamez, A.J. Effects of Machining Parameters on the Quality in Machining of Aluminium Alloys Thin Plates. Metals 2019, 9, 927. https://doi.org/10.3390/met9090927
AMA Style
Del Sol I, Rivero A, Gamez AJ. Effects of Machining Parameters on the Quality in Machining of Aluminium Alloys Thin Plates. Metals. 2019; 9(9):927. https://doi.org/10.3390/met9090927
Chicago/Turabian StyleDel Sol, Irene, Asuncion Rivero, and Antonio J. Gamez. 2019. "Effects of Machining Parameters on the Quality in Machining of Aluminium Alloys Thin Plates" Metals 9, no. 9: 927. https://doi.org/10.3390/met9090927
Note that from the first issue of 2016, this journal uses article numbers instead of page numbers. See further details here.