Article

Global and High-Resolution Damage Quantification in Dual-Phase Steel Bending Samples with Varying Stress States

1
Institute of forming technology and lightweight components, TU Dortmund University, Baroper Str. 303, 44227 Dortmund, Germany
2
Institute of physical metallurgy and metal physics, RWTH Aachen, Kopernikusstr. 14, 52056 Aachen, Germany
*
Author to whom correspondence should be addressed.
Metals 2019, 9(3), 319; https://doi.org/10.3390/met9030319
Submission received: 31 January 2019 / Revised: 1 March 2019 / Accepted: 6 March 2019 / Published: 12 March 2019
(This article belongs to the Special Issue Material and Process Design for Lightweight Structures)

Abstract

:
In a variety of modern, multi-phase steels, damage evolves during plastic deformation in the form of the nucleation, growth and coalescence of voids in the microstructure. These microscopic sites play a vital role in the evolution of the materials’ mechanical properties, and therefore the later performance of bent products, even without having yet led to macroscopic cracking. However, the characterization and quantification of these diminutive sites is complex and time-consuming, especially when areas large enough to be statistically relevant for a complete bent product are considered. Here, we propose two possible solutions to this problem: an advanced, SEM-based method for high-resolution, large-area imaging, and an integral approach for calculating the overall void volume fraction by means of density measurement. These are applied for two bending processes, conventional air bending and radial stress superposed bending (RSS bending), to investigate and compare the strain- and stress-state dependent void evolution. RSS bending reduces the stress triaxiality during forming, which is found to diminish the overall formation of damage sites and their growth by the complimentary characterization approaches of high-resolution SEM and global density measurements.

1. Introduction

Over the past years, processes of damage formation have yielded tremendous interest in the field of materials science, due to the rising demand for advanced metallic materials combining high strength and excellent formability. For many of those materials, damage formation is a point that has to be addressed due to their intrinsic microstructural heterogeneity [1]. Typically, damage formation and accumulation take place during plastic deformation and are most commonly observed as the formation and growth of voids [2]. The interaction of these voids ultimately leads to failure; however, the mechanisms of damage formation and evolution themselves are not part of the process of material failure. During plastic deformation, processes of void nucleation, evolution and coalescence take place and lead to a continuous degradation of mechanical properties, and ultimately, failure.
Before the interaction and coalescence of voids start, void growth is the main mechanism of damage evolution. This process has been extensively researched, especially in the field of modeling, ranging from the fundamental modelling of void growth [3] and also nucleation [4] to advanced, high-resolution microstructural simulations [5]. As experimental approaches as well as the modelling of void growth have shown, the growth behavior of microstructural voids is largely dependent not only on the magnitude of strain, but in a significant way on the applied stress state [6].
For structural parts in the automotive industry, high-strength values combined with good formability are required; this objective has, recently, mainly been achieved by the usage of advanced high-strength steels (AHSS). A widely used variety of this class are the dual-phase steels. These combine low production costs compared to other AHSS with beneficial ductility, high yield strength values and near-linear strain hardening properties [7]. These properties are realized by a microstructure made up of ferritic and martensitic constituents. However, the complementary properties of these constituents typically cause a strong contrast in plastic deformation between the two phases, leading to a stress and strain partitioning behavior in the local microstructure. This incompatibility leads to the nucleation of voids, caused by distinct mechanisms [8]; the hard martensite islands are prone to locally brittle damage initiation, i.e. martensite cracking. These cracks typically occur at prior austenite grain boundary sites [9]. In addition to this mechanism, decohesion processes at interfaces such as phase boundaries between martensite and ferrite or at ferrite grain boundaries can take place [10]. In many cases, the local morphology [11] and heterogeneity of the microstructure [12] is the main factor determining the dominant damage mechanism, and a wide variety of intermediate forms or combinations of the above-mentioned mechanisms are observed. Commercially used dual-phase steels such as the one employed in this work often show a significant banding of martensite, leading to a pattern of voids often described in the literature as “necklaces” [12]. These agglomerations of voids, typically observed at large strains, are caused by the basic mechanisms of martensite cracking, phase boundary and grain boundary decohesion, but represent a distinct pattern of damage sites in their own right.
In order to link damage formation and stress state, independent parameters—namely the Lode angle parameter, θ ¯ , and the stress triaxiality η —are used. Both parameters influence the damage evolution [13]. The stress triaxiality, η , is defined as the ratio of hydrostatic stress, σh, and the von Mises equivalent stress, σvM:
η = σ h σ vM
The hydrostatic stress is thought to be responsible for the growth, or if negative, even shrinking of already nucleated voids in the microstructure. It is therefore expected for stress states with lower stress triaxialities to cause a delayed void evolution for forming-induced damage. With the deviatoric stress tensor, σ dev , the third normalized invariant, ξ, can be derived:
ξ =   27 det ( σ dev ) 2   σ vM 3 =   27 / 2 · ( σ 1 σ h ) · ( σ 2 σ h ) · ( σ 3 σ h ) { [ ( σ 1 σ 2 ) 2 + ( σ 2 σ 3 ) 2 + ( σ 3 σ 1 ) 2 ] / 2 } 2 / 3
This invariant ξ is defined in the range of 1 ξ 1 . The normalized Lode angle parameter, θ ¯ , is defined as
θ ¯ = 1 2 π arccos ( ξ )
During plane strain plastic forming, the second principal stress is always
σ 2 = σ 1 + σ 3 2
In the bending of sheet with a much larger width compared to the thickness, plane strain deformation conditions can be assumed. This leads to a constant normalized Lode angle parameter, θ ¯ = 0 .
Anderson et al. [14] revealed that the strain to fracture for a lower triaxiality is lower compared to higher triaxialities for a constant Lode angle parameter in DP800 steels. Thus, the stress state is important for material failure, but it also influences damage evolution, as failure can be the consequence of damage. Technologically, the stress state during bending must then be influenced to reduce damage. Technological solutions are, for instance, bending with a solid counter punch [15], roll bending with additional rolls [16], bending with an elastomer [17] and radial stress superposed bending [18]. Bending using elastomers is capable of reducing the stress triaxiality during bending by applying a counter pressure due to the inserted elastomer. This leads to a delayed damage evolution in terms of void nucleation, which subsequently influences the fatigue lifetime of bent products [19]. Thus, the accumulation of damage during forming is important for lightweight design and has to be taken into account as it affects the product performance. For industrial purposes, elastomer-bending is not feasible for controlling the stress state, as the elastomer does not apply reproducible counter pressures during forming and is limited in the magnitude of applicable stresses (the maximum pressure is less than 150 MPa), as well as showing a rapid degradation over its lifetime. Recently, a new bending process with predetermined stress states was introduced [20]. The so-called radial stress superposed bending (RSS bending) is capable of reducing the stress triaxiality and applying pressures up to the flow stress of the material in a reproducible way. It has already been shown to protract damage nucleation, leading to a reduced number of voids [20].
For the product design or process modeling, the amount of damage can be expressed directly as the area or volume fractions of voids or indirectly via certain mechanical properties. Lemaitre and Dufailly (1987) showed eight methods for direct and indirect damage measurement techniques and rated their suitability [21]. Direct measurements include microscopic analysis, X-ray analysis and density measurements. Indirect damage measurements are, for example, the decrease in Young’s modulus, micro hardness or indentation modulus [22]. For damage quantification, direct measurements are preferable as there is no mathematical model connected to the calculation of damage quantity. A damage variable, Ds, in surface observations is proposed by Lemaitre and Dufailly as the ratio of the void area, Sd, and the undamaged area, S [21].
For a DP600, the void volume fraction before failure is usually below 1–2% of the whole volume [22]. Consequently, the preparation of specimens for direct surface measurements is challenging. Samuels et al. showed that mechanical polishing might introduce strain hardening in the material surface [23]. Also, a void smearing effect could be shown due to different polishing steps [24]. Isik et al. revealed that ion beam slope cutting is capable of analyzing void sizes down to 0.05 µm2 [25]. Another quantification method is radiography. Using X-ray microtomography, specimens can be analyzed without metallographic preparation in a non-destructive way; this method is, however, limited by its spatial resolution [26].
For an integral approach to measuring void volume fractions, density measurements can be applied. Ratcliffe presented a method for measuring small density changes in solids using the Archimedean principle [27]. Schmitt et al. showed that different strain paths lead to different relative density changes [28]. Bompard proved the possibility of measuring density changes in a tensile specimen and correlated this to damage [29]. The method has equally been applied by Lemaitre and Dufailly to quantify damage evolution [21].
Lapovok et al. measured the density of specimens in a continuously cast aluminum alloy formed in an equal channel angular drawing process with the help of the Archimedean principle [30]. Tetrachloroethylene with a density of 1.62 g/cm³ was used instead of distilled water for higher accuracy. They correlated the change in density to the stress and strain state that is responsible for different paths of damage evolution. Tasan et al. stated that tactile density measurements are not capable of analyzing damage for specimens with a volume of as low as 1 mm3 for spatially resolved measurements [22] as the scatter observed for small volumes dominates the measurements.
Thus, in the current state of the art, it is shown that stress superposition during bending leads to delayed fracture. Despite this, it is not clear what influence the lowered stress triaxiality has on the void evolution and damage mechanisms. To quantify and characterize damage in bent samples, the methods for automated void recognition and density measurements have to be adopted to the requirements set by bending samples. With these characterization tools, the influence of the alteration in stress state on damage evolution can be quantified and subsequently used for the modelling or prediction of the expected service life time.

2. Materials and Methods

The DP steel applied in this study is of DP800 grade, which usually indicates that it has a guaranteed tensile strength of more than 800 MPa and its microstructure consists mainly of ferritic and martensitic constituents. However, a very small fraction of remaining austenite and bainite might still be present in the microstructure in small volume percentages. The as-received DP800 sheet material was subjected to a hot-dip galvanizing process using a zinc bath, which provides the rolled sheets with corrosion protection. The average grain size ranges from 2 µm to 20 µm, with martensite particles of approx. 2 µm in diameter embedded in the matrix. The characterized microstructure material shows a strong banding of the martensite phase along the rolling direction (Figure 1).
The flow curve at room temperature (obtained by a Zwick Z250 universal testing machine, ZwickRoell GmbH & Co. KG, Ulm, Germany) is given by experimental data from uniaxial tensile tests and extrapolated according to Gosh (Figure 2).
The tensile tests were conducted with a specimen geometry (DIN 50125—H 20 × 80) according to DIN EN ISO 6892-1 with a velocity of 0.0067 s−1 to ensure a constant strain rate. The measurement of the elongation was done directly on the test sample with a tactile macro-extensometer (Gauge length of 80 mm, ZwickRoell GmbH & Co. KG, Ulm, Germany). The flow curve is derived up to the uniform elongation experimentally and then extrapolated. The extrapolation parameters (εa: strain at yielding, n: hardening exponent, C and p: fitting parameters) according to Gosh are derived with the least square fitting method. The Young’s modulus E and Poisson’s ratio ν are given in Figure 2.

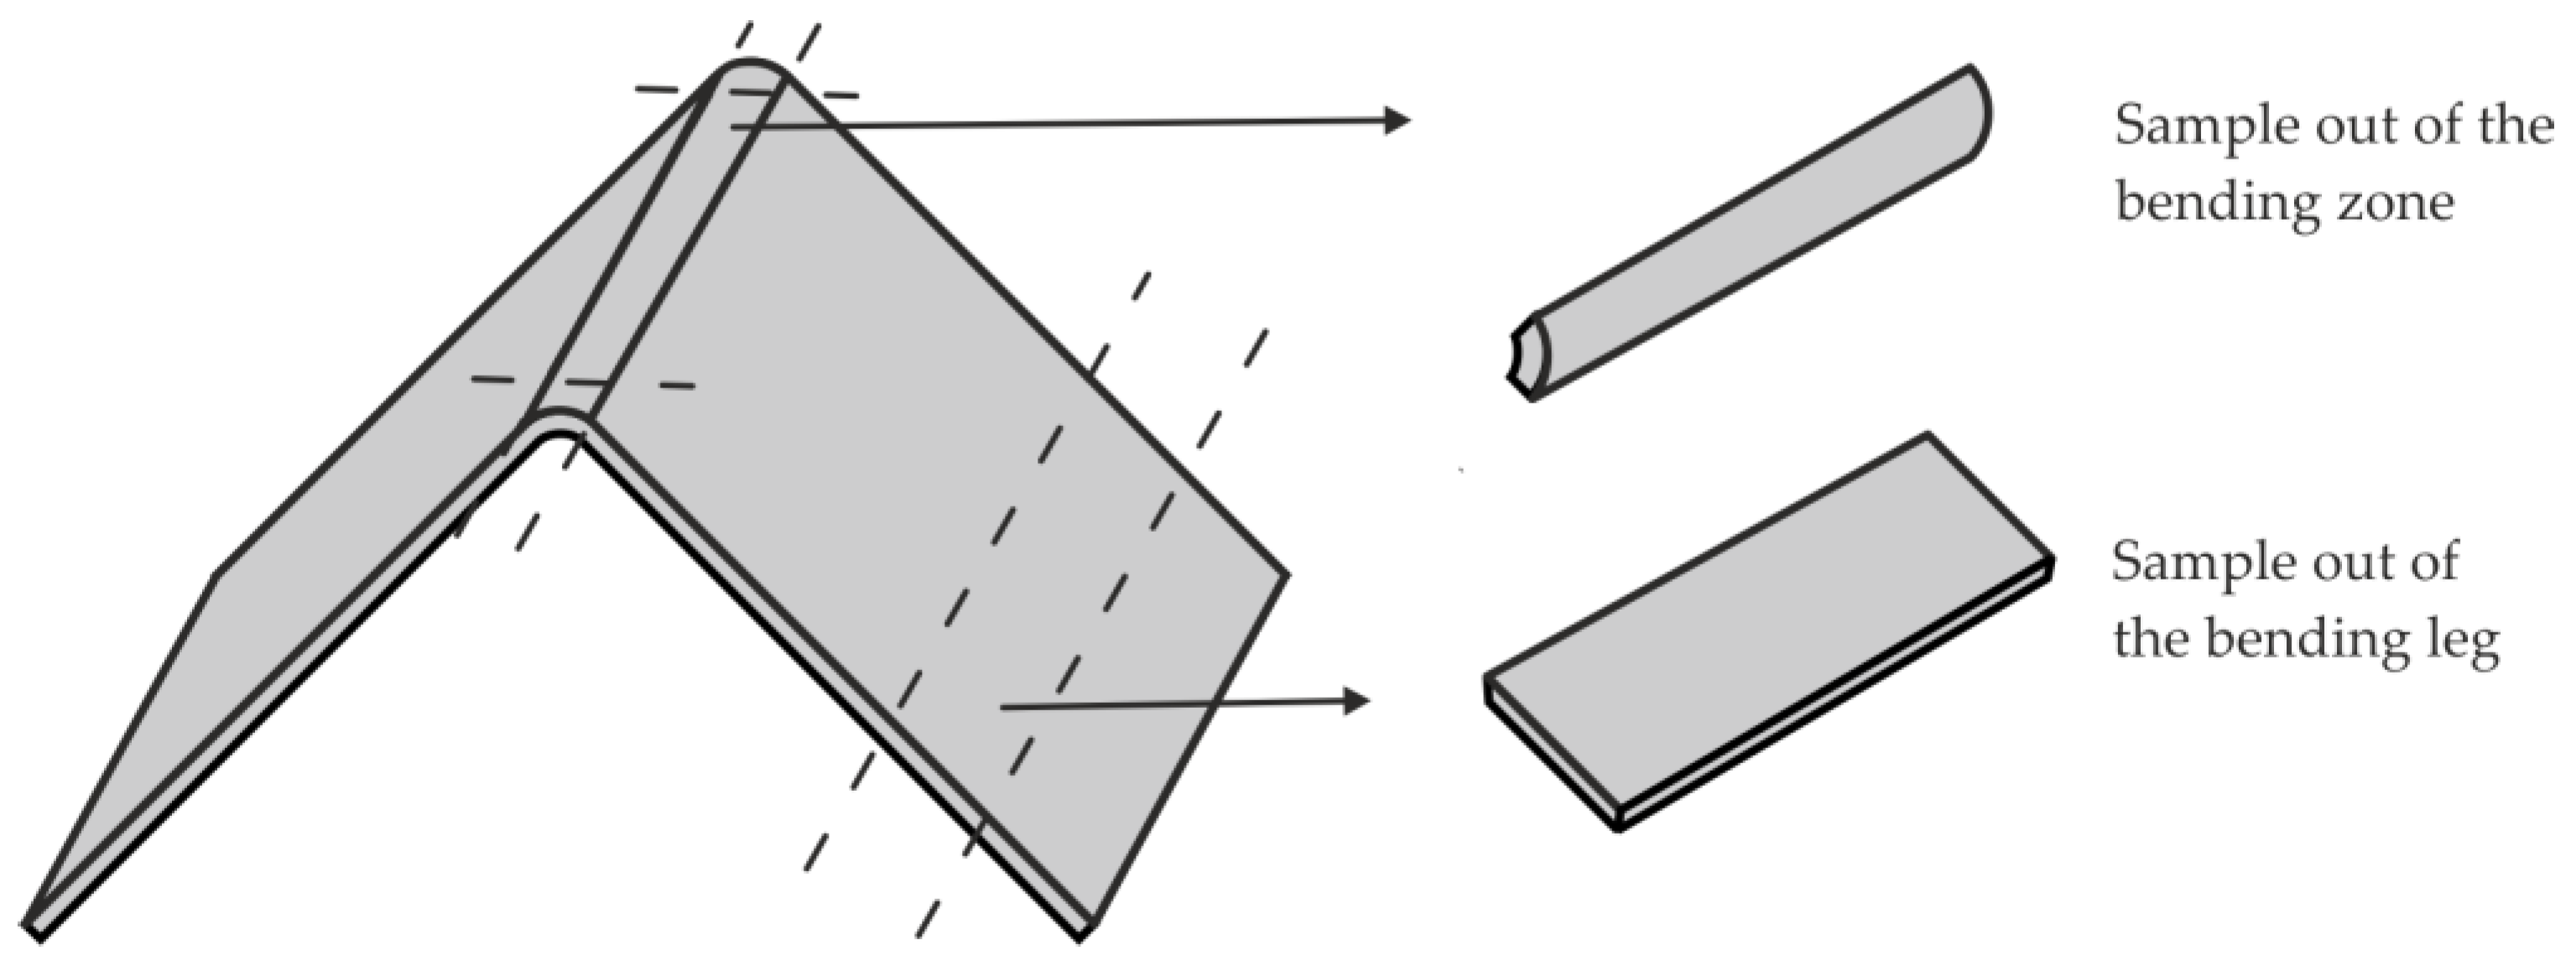
2.1. SEM Panoramic Imaging, Void Recognition and Area Determination

Deformation-induced damage in these grades of dual-phase steels typically occurs in the form of microscopic voids with sizes in the range of several hundred nm [8] to a few µm [26]. To reliably quantify voids at such small scales, high-resolution measurements of large micrographs in the order of mm2 are required. This was achieved in the present work by employing advanced scanning electron microscopy (LEO 1530, Carl Zeiss Microscopy GmbH, Jena, Germany) combined with panoramic imaging and an image stitching algorithm based on the VLFeat Matlab toolbox [31]. All panoramic images have been obtained at the tip of the bending sample (Figure 3) at a resolution of 32 nm/px using secondary electrons (SE) and a 20% area overlap. The field width of a single image was 100 µm, resulting in a total panoramic image size of 1000 µm × 500 µm. Respective specimens were mechanically polished to 0.25 µm and subsequently etched in 1% Nital for 10 s. A consistent, light etching is critical for this method, as shadowing effects of the protruding martensite phase have to be minimized for a reliable automated image recognition. The panoramic images are subsequently split into 5 slices that follow a radial direction. This approach is chosen to ensure an accurate measurement of the respective distance to the outer radius, which would be altered as, in bending samples, the upper edge cannot be straight. A binning of 3000 pixels in a radial direction was applied, and each data point was attributed to the middle of this bin, resulting in the outermost value for the distance to the outer radius being calculated as 48 µm from the edge.
Voids are identified using a grayscale threshold and the located sites from the original image processed further by the use of a watershed algorithm [32]. Here, by altering the grayscale threshold around the individual void, the optimum value for measuring the entire void area, but none of the surrounding microstructure, is determined. The calculation of the pixel areas results in a separate measurement for each individual void. This approach makes it possible to collect data not only for overall void area fractions, but for any type of measurement where information about each individual damage site is required. To calculate area fractions over one spatial coordinate, a moving bin is applied to smooth out peaks in the area fraction generated by single, larger voids, made possible by the individual identification and localization of damage sites.
A considerable error in the void area measurements of deformation-induced damage voids is generated by inclusions. These, in commercial DP steel, typically being TiN, can be caused to fall out of the polished surface during preparation, leaving voids of a similar, slightly larger diameter in the observed images. Examples of this type of voids as well as the above-mentioned fundamental mechanisms of damage nucleation and formation are shown in Figure 4. These voids at the sites of inclusions have a very different morphology from martensite cracks or interface decohesion sites, making them an ideal subject for recognition by deep learning [33]. In this work, neural networks have been trained using an initial data set, with the goal of automatically detecting voids that have been caused by inclusions in the microstructure. A system for recognizing these inclusions from SEM pictures has been developed and tested to an accuracy of over 95% and is applicable to the SEM panoramas used in this study [33]; here, it is used for inclusion void recognition only. With smaller plastic equivalent strains towards the sheet center, voids caused by inclusions become increasingly dominant, as this type of observed void is in the majority of cases an artefact of metallographic preparation by mechanical polishing. Non-metallic inclusions leave the surface during this process, and therefore cause surface voids that did not develop during plastic deformation and are therefore not to be measured simultaneously with plasticity-induced damage. The error normally introduced by measuring these inclusions as part of the void fraction is avoided by the recognition and exclusion of these particular voids.
The panoramic imaging method was carried out in the xy plane (“in-plane”) of a bending sample. To analyze all spatial directions, a second measurement was taken on a plane in the middle of the bending zone, parallel to the bending axis in z direction (“cross-section”) (Figure 5).
The results were taken from these two perpendicular planes as the evolution and growth of voids are expected to be highly anisotropic due to the tensile stresses perpendicular to the bending radius, which will affect the morphology of voids.

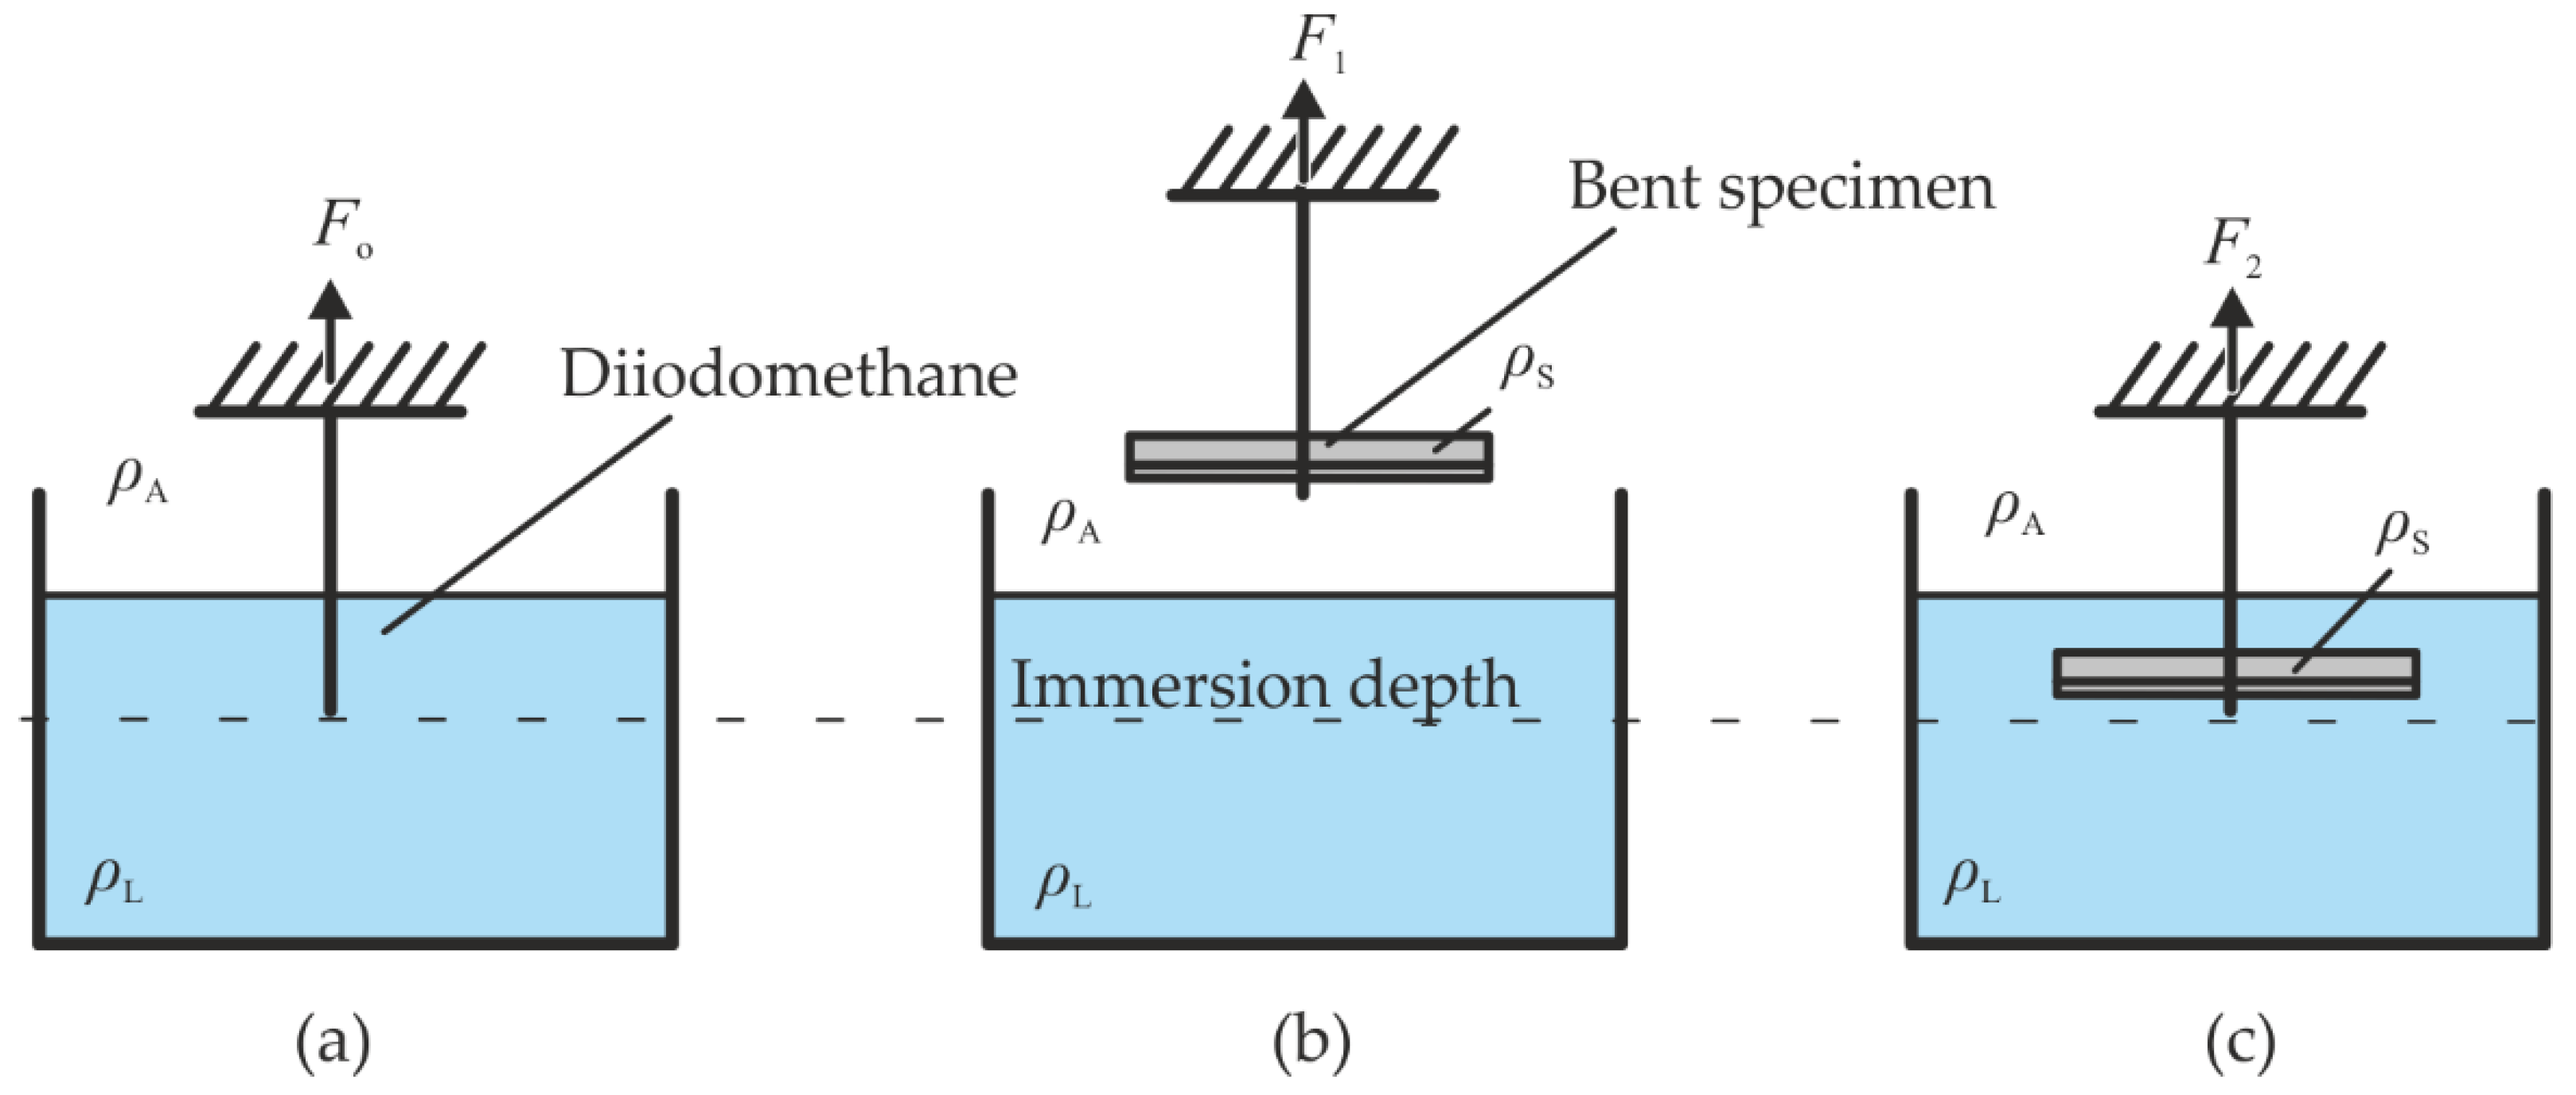
2.2. Density Measurement Method

Density measurements of heavy metals for damage quantification require a high resolution in the order of 0.002 g/cm3 as void volume fractions as low as 0.2% are investigated. The measurement principle is based on hydrostatic weighing. A solid immersed in liquid apparently reduces its weight by the liquid volume weight. It is necessary to know the density of the liquid to measure the density of the submerged solid. In contrast to the classical Archimedean density measurement, the volume of the displaced liquid is not measured by an overflow, but the weight differences are measured. Therefore, this method is strongly dependent on the volume of the specimen, as higher volumina lead to higher precision. The IMETERV6 device (IMETER/MSB Breitwieser MessSysteme, Augsburg, Germany) is used for the measurements in this work. The measuring process consists of taring the specimen holder in the measuring liquid at the predefined immersion depth, then withdrawing and connecting to the specimen (Figure 6).
Subsequently, the weighing of the specimen takes place in ambient air. Afterwards, specimens are immersed to exactly the same immersion depth with the same contact angle of the attached wire likewise at taring and weighing the buoyancy after the same predefined diving time. The same contact angle of the wire and liquid as well as the predefined immersion time are important for the measuring accuracy. Withdrawing and immersional weighing is repeated several times (15 to 25 times for 10 to 15 min) until the buoyancy values are constant. Thus, finally, all air bubbles from the surface are washed away and differences in the temperature of specimen and liquid have been compensated. The specimen is connected to a load cell (Sartorius AG, Göttingen, Germany) with a thin tungsten wire (D = 40 µm). The higher the density of the liquid, the higher the lifting force and therefore the measuring accuracy. Diiodmethane (CH2I2) is used as the immersion liquid, which is a so-called heavy liquid [34]. The measured density is 3.3027 g/cm3 at 25 °C [35]. The density of a solid ρs can thus be determined according to physical relationships [35]. This calculation requires the density of the liquid ρL, the density of the ambient air ρA, the resulting force on the specimen outside the measuring liquid W1 and that immersed in the measuring liquid, W2.
ρ s = ρ L ρ A 1 W 2 W 1 + ρ A
To calculate the void volume fraction in the bent product, specimens are cut out of the bending zone and the bending leg of the samples. Since the properties of a bent part deviate at the edge of the sheet (the assumption of plane strain is invalid), only the constant area of the bending zone is examined (5 mm apart from the outer edges) (Figure 7).
Comparative samples from the bending leg are examined. To further increase the measurement accuracy, three bent samples are simultaneously measured to increase the total volume to ~1 cm3.

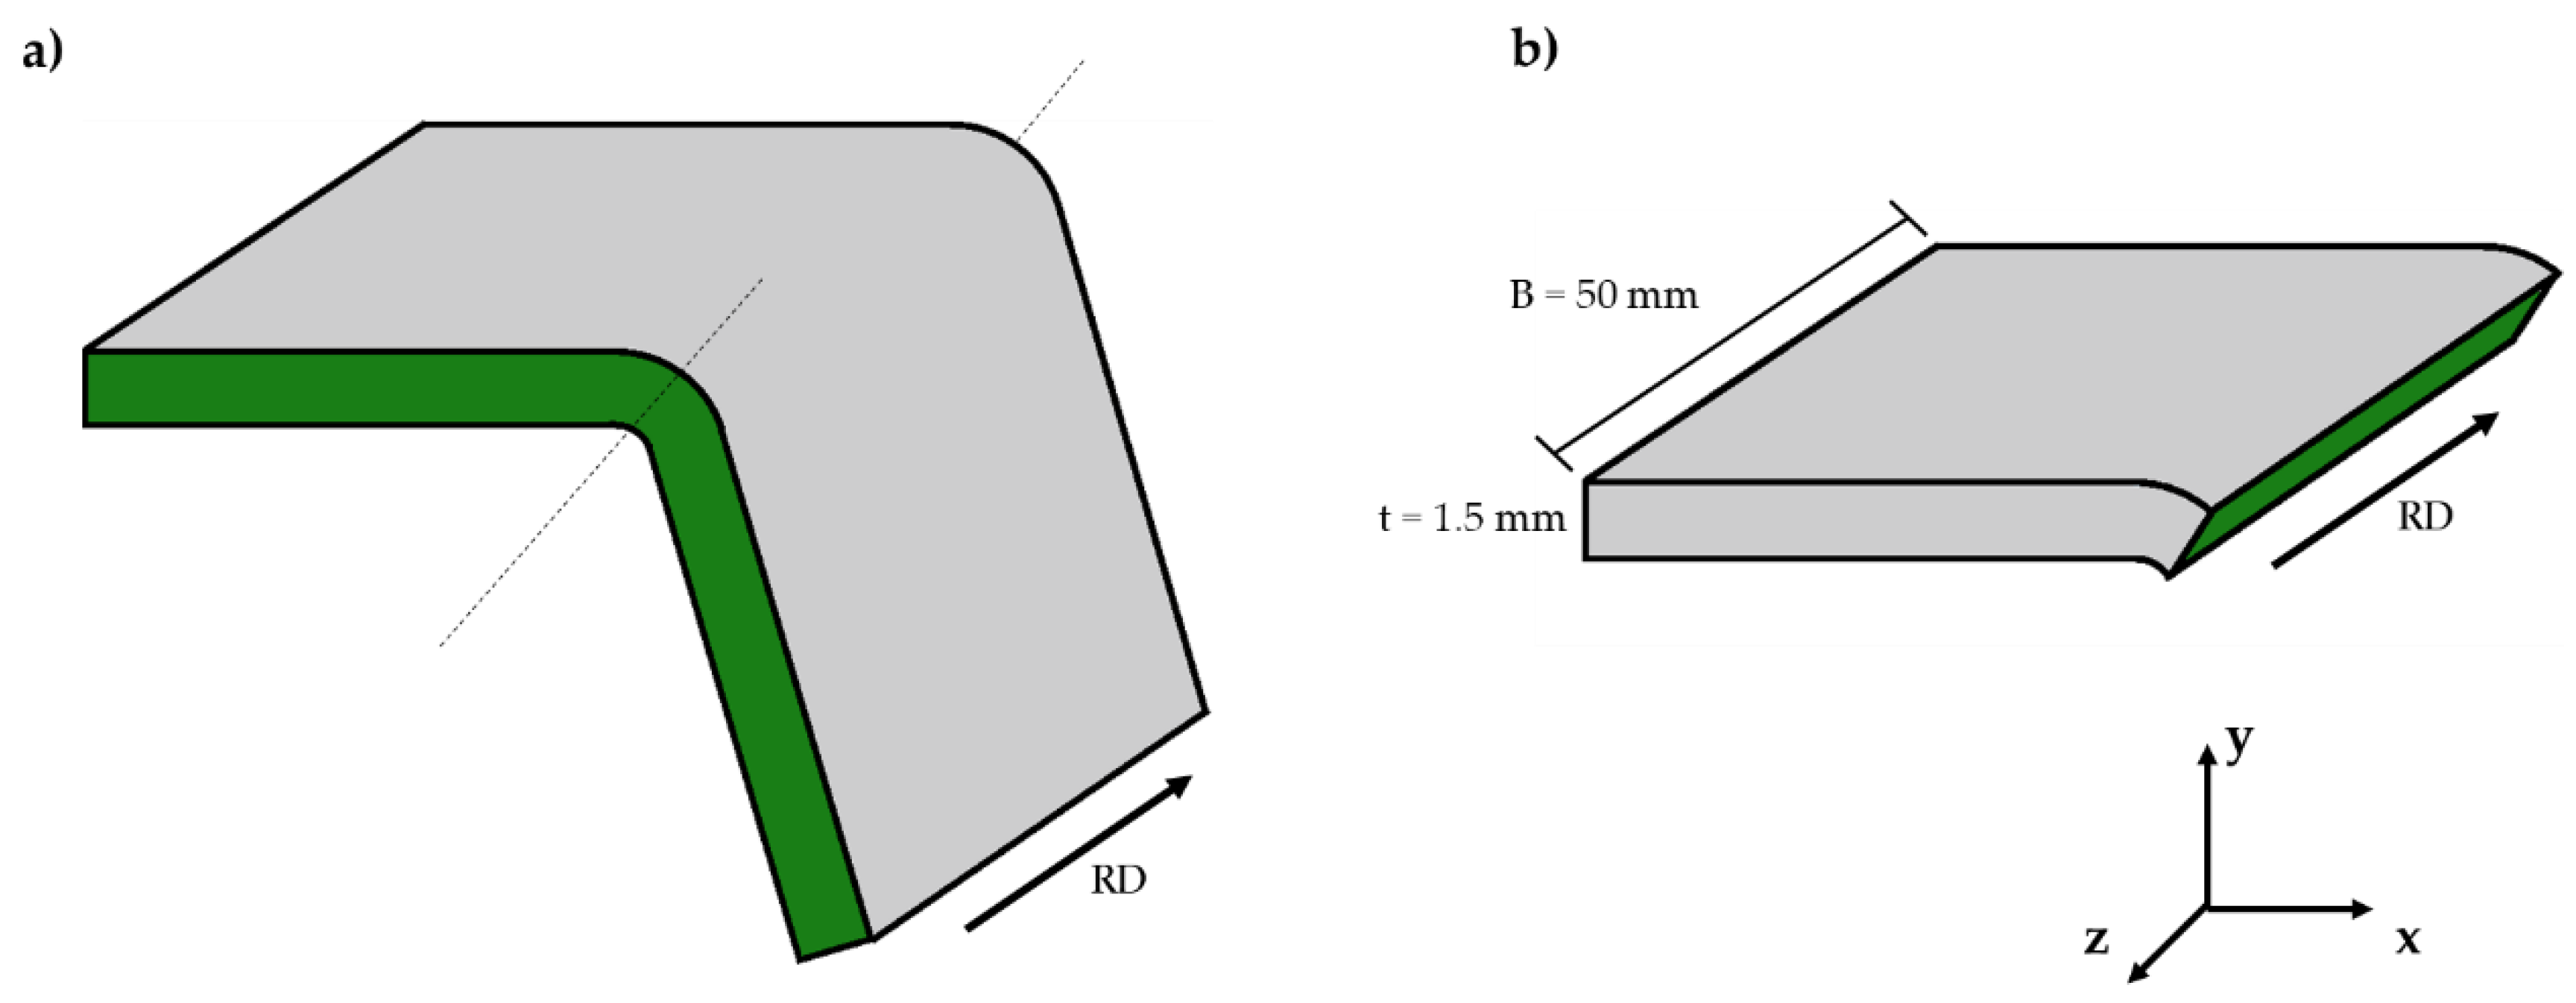
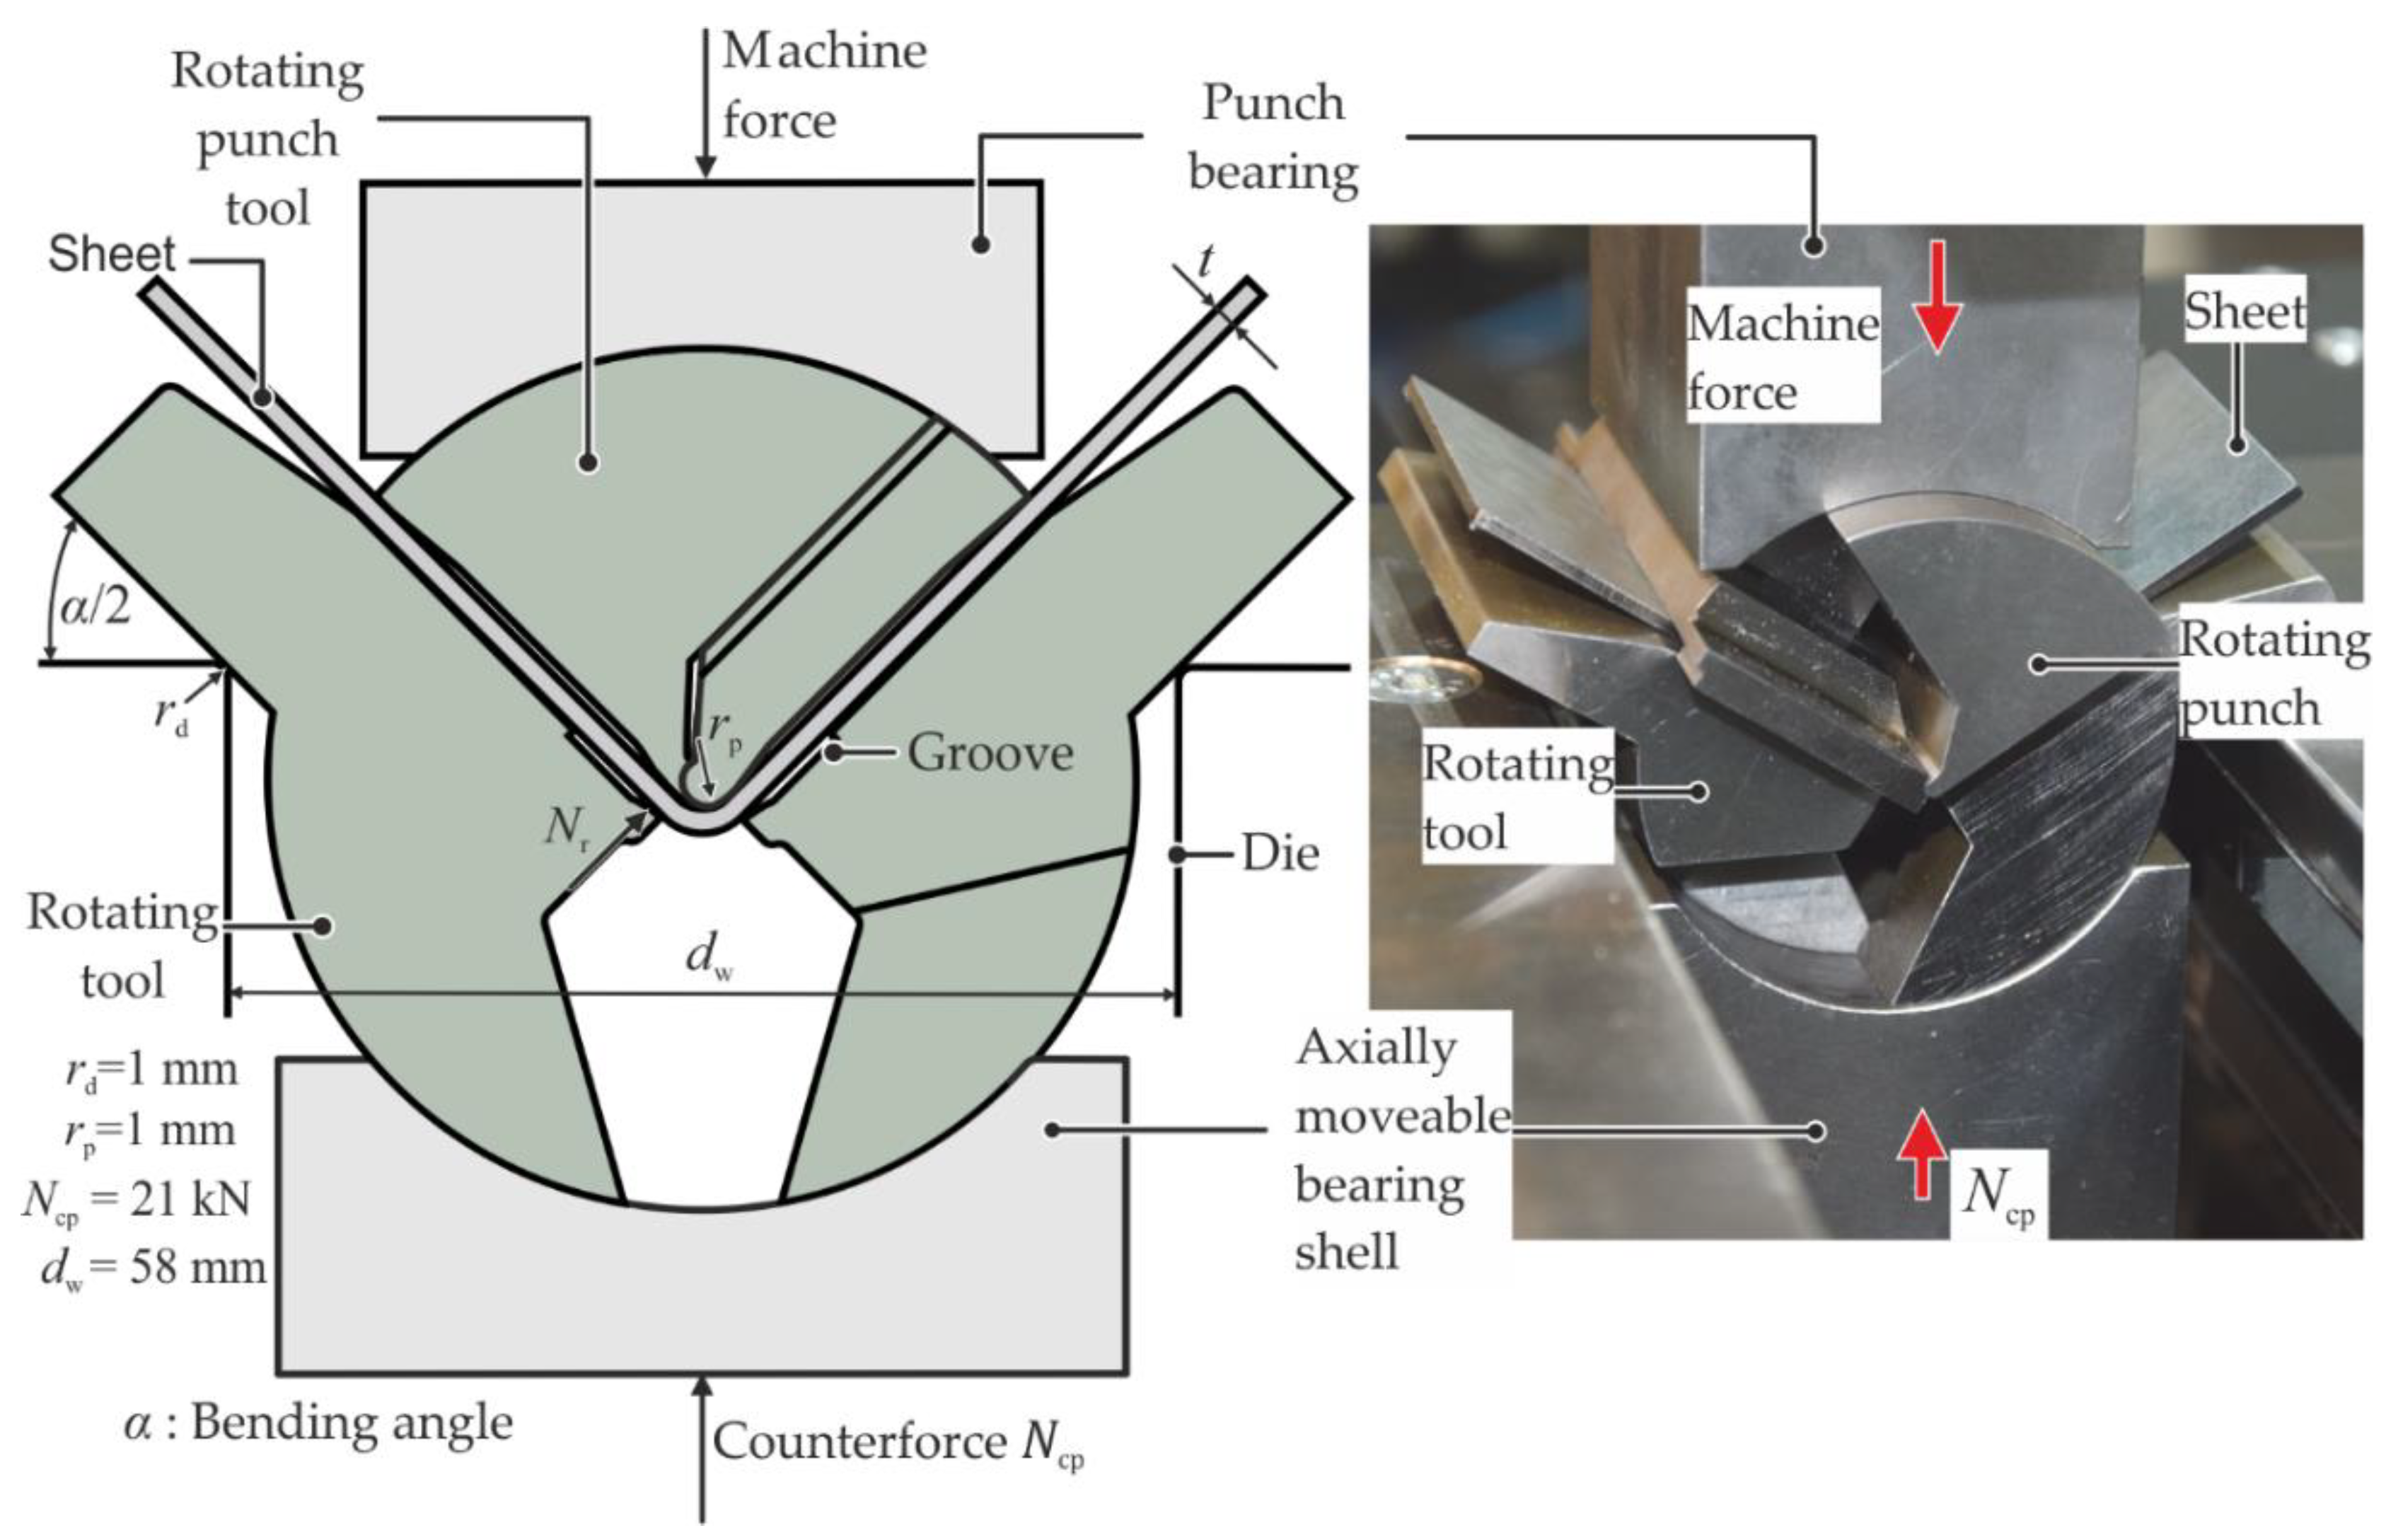
2.3. Air and Stress Superposed Bending Processes

The investigated air-bending process is defined by the geometrical parameters: die width wd, punch radius rp and die radius rd (Figure 8). The sheet is laser cut (100 mm × 50 mm × 1.5 mm) and bent parallel to the rolling direction to an unloaded bending angle of 66°.
During air bending, the outer fibers are formed under a tensile stress state, whereas the inner fibers are contracted. The plastic strains increase towards the outer fiber. Therefore, forming-induced voids and the final failure occur at the outer fiber [36]. To delay the void evolution, radial stress superposed bending can be used [20]. In this process, defined compressive stresses are superposed during bending. A normal force Nr rotates around the outer bending fiber and superposes stresses. The technological implementation of the process is done by rotating tools in bearing shells driven by a hydraulic cylinder (Figure 9). The hydraulic cylinder is connected to the lower moveable bearing shell and is capable of applying a given, constant pressure.
The applied process parameters lead to a comparable geometry of the bent products. For the validation of the identical strain at the outer fiber, optical measurements and hardness measurements are used. Stress triaxiality values and the strain distribution over the sheet thickness is investigated numerically according to the model presented in previous work [37]. The FEM-modeling was carried out with the elastic-plastic modelling with ABAQUS2016/Implicit2D (Dassault Systèmes, Vélizy-Villacoublay Cedex, France). Plane strain conditions and a planar symmetry were assumed to reduce computational effort. The sheet is modelled with the flow curve given in Figure 2. The rotating tools are modelled to be purely elastic, and all other components are rigid. The smallest element size in the bending zone is 0.05 mm and in the bending leg is 0.3 mm. The friction between the tools is modelled by the Coulomb friction law (µ = 0.02 between the lower rotating tools and the sheet/lower bearing shell, since it is lubricated; µ = 0.1 between the upper rotating tool and the sheet/upper bearing shell; µ = 0.1 in air bending). The maximum force deviation between the numerical and experimental punch force was lower than 10% [37].
Corresponding to Meya et al. [37], the stress triaxiality in air bending is ηmin = 0.57, while the minimum stress triaxiality during RSS bending in this set-up is calculated as ηmin = −0.06 at the outer fiber due to the superposed stresses.

3. Results

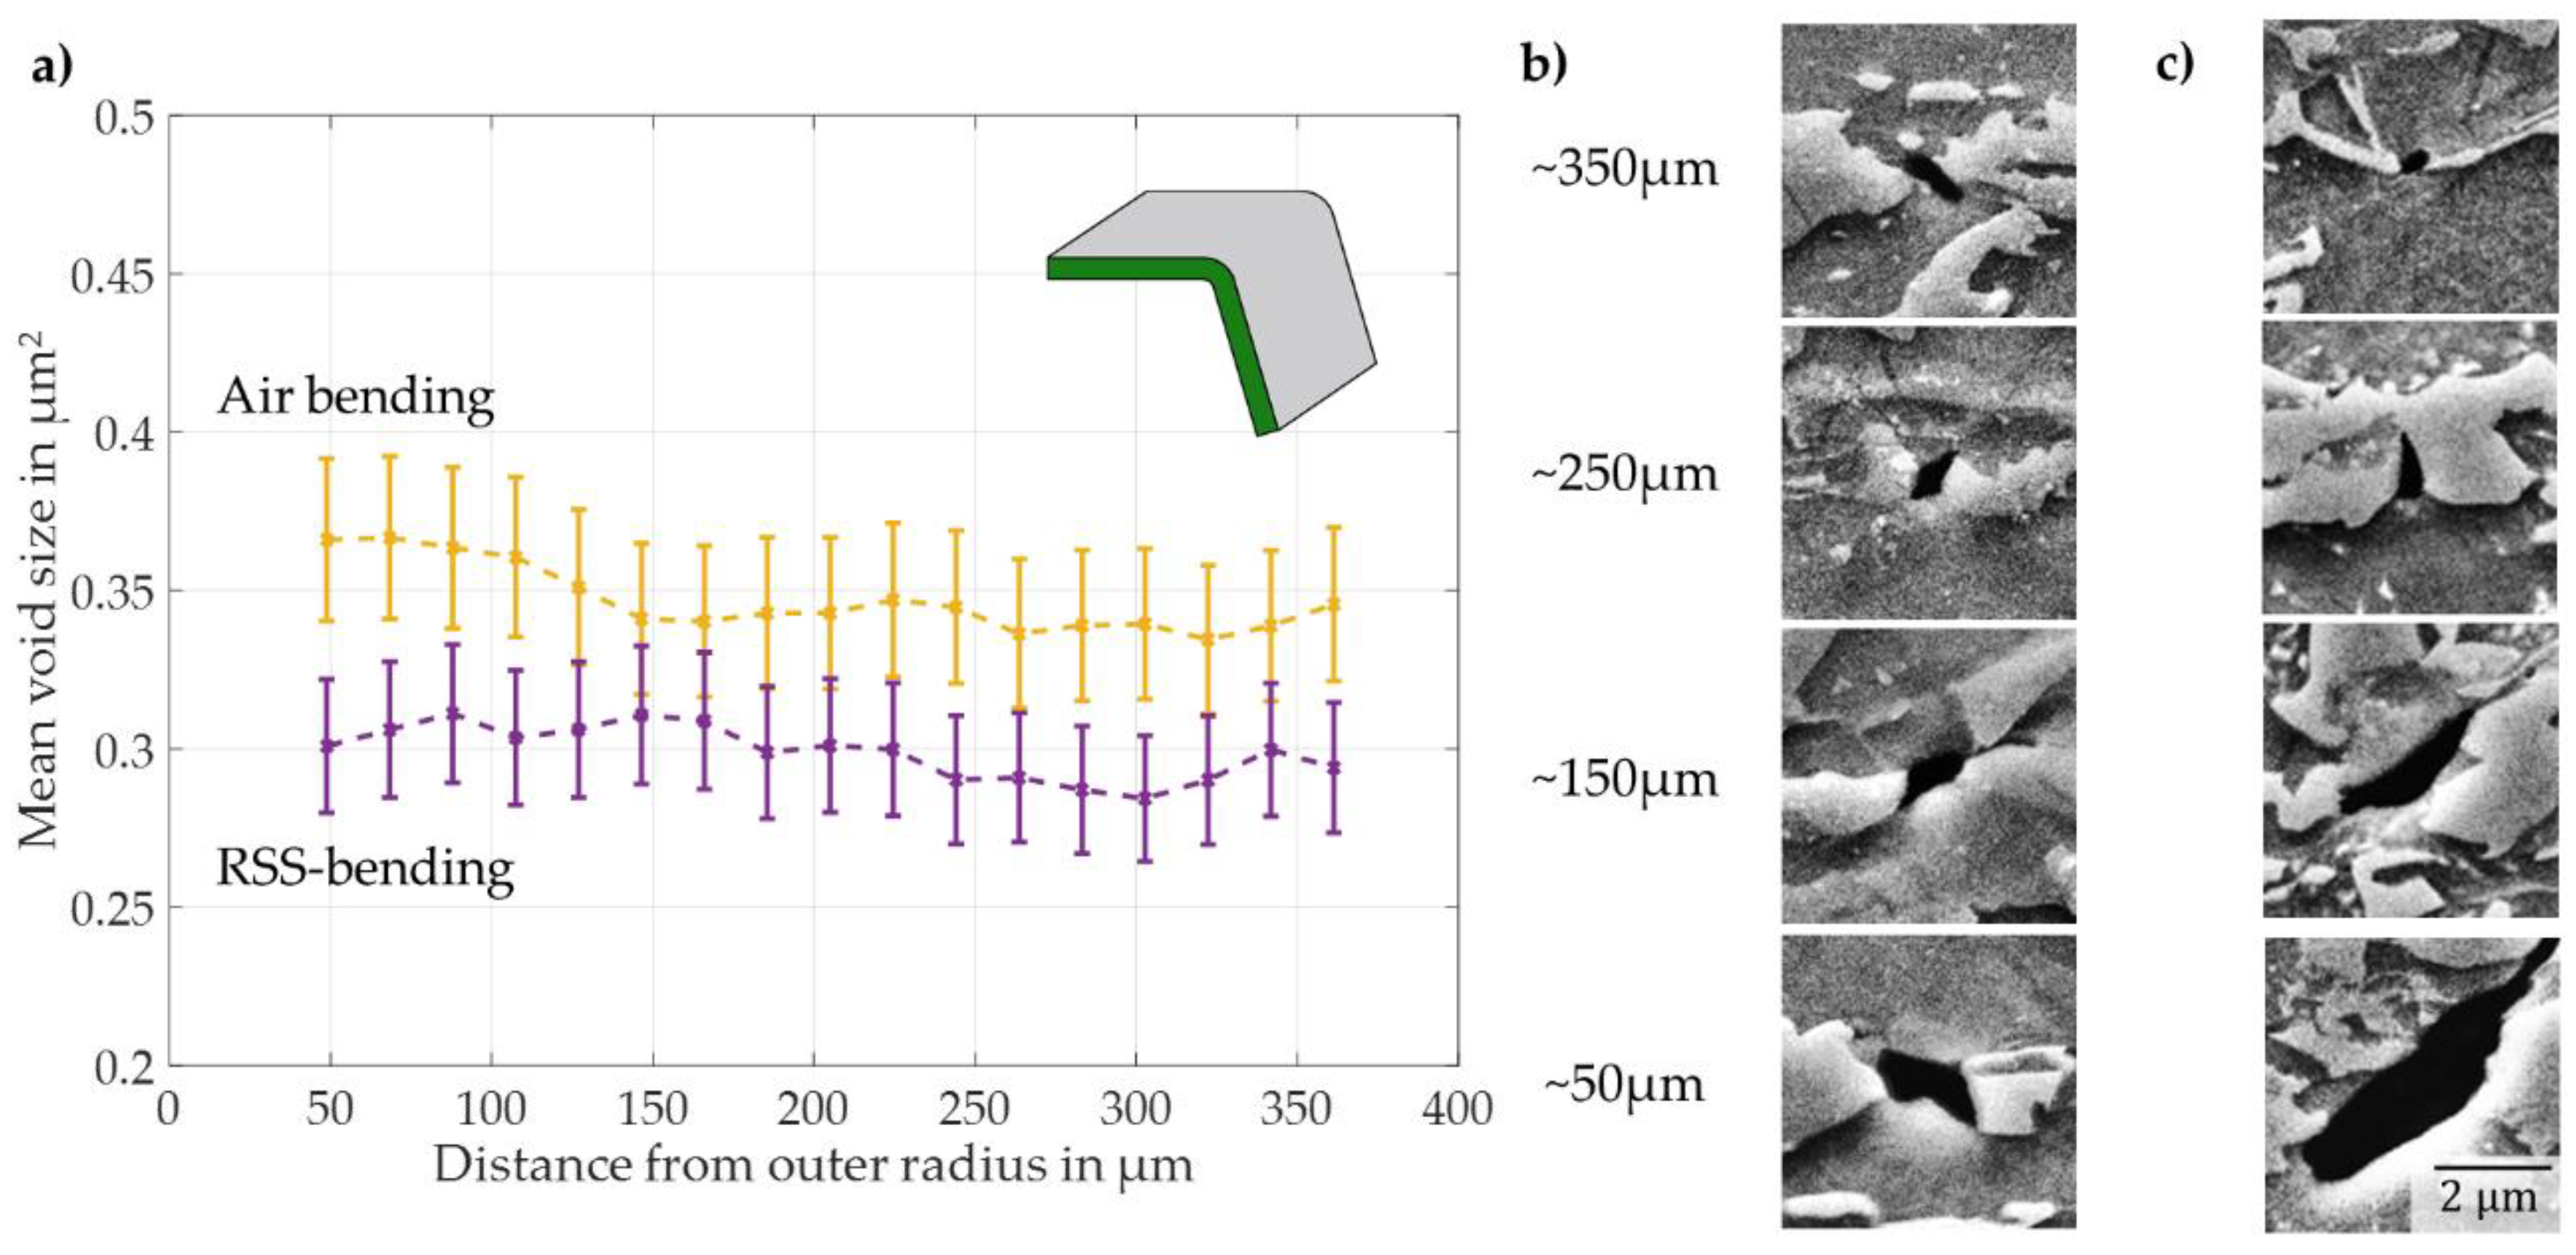
3.1. SEM-Based Damage Characterisation and Quantification

The measurements obtained by SEM observation yielded results for the global quantification of deformation-induced voids in the bent samples in the form of area fraction calculations, as well as achieving magnifications high enough to gain microstructural information about the individual mechanisms of damage nucleation and evolution, which have, however, not been considered in this work.
Firstly, the dominance of voids originating from inclusions in the steel microstructure becomes obvious when regarding the panoramic images; with greater distances from the outer radius, larger voids can almost exclusively be recognized as being caused by inclusions being removed from the polished surface during the preparation of the sample.
Secondly, regarding deformation-induced damage, both the absolute number of voids (Figure 10) and the mean size (Figure 11) of the voids are observed to increase towards the outer radius—the zone of the highest plastic equivalent strain. These observations are true for both applied bending methods and both observation planes. Representative examples of typical voids at the outer radius, at a distance of approx. 80 µm below the surface and at 400 µm below the outer radius, are given in Figure 11.
For each data point, an area of 33,379 µm2 was evaluated. The error for the measurements is calculated via the error for the watershed algorithm value for each single void, and summarized over all voids in the field of observation.
Comparing the area fractions, voids per area (n = 5345 voids/mm2 vs. n = 3589 voids/mm2 at the outer fiber) and void sizes (S = 0.37 µm2 vs. S = 0.30 µm2 at the outer fiber) across the two applied processes, a significant change in all these quantities is observable for the radial stress superposed (RSS) bending method compared with conventional air-bending. As calculating the void area fraction for various regions of the sample takes into account the overall magnitude of voids existing and nucleating in the observed area and their sizes, this property is able to deliver a more complete picture of void nucleation and growth compared to solely regarding void numbers or mean sizes. Area fraction calculations from the detected voids show an average decrease of 52.1% for the RSS bending.
The void area fractions measured in the cross-section are significantly smaller (up to 4 times), as the imaging plane is perpendicular to the bending strain εx and no macroscopic strain in the z-direction occurs. However, in these images an average decrease in void area fractions up to 69% for the triaxiality-reduced RSS-bending process is also visible.
Measurements in as-received, undeformed samples only found 3 to 5 voids that could not be reliably attributed to being caused by inclusions on the same field of view as used in the measurements above. Therefore, the void area fractions for the undeformed state of the sheet metal are assumed to be non-existent.
The results for mean void areas equally show a lower average void area for the RSS-bending process; this effect is, however, largely dominated by the scatter in void sizes, in particular at the region near the outer radius. On the one hand, large voids are found in this region in the air-bending samples, whereas the RSS-bending process does not provoke these large void sizes. A typical evolution of voids for both bending processes is shown in Figure 11. However, a clear difference in size emerges when regarding maximum void sizes instead of mean values; while for the air-bending process, void sizes at the outer radius reach up to 2.26 µm2, RSS-bent samples only showed void sizes lower than 1.22 µm2. This tendency does not appear in the mean void size calculations, as these are dominated by the large number of nucleating voids below 0.3 µm2 in size. This tendency for the growth of voids in air-bending samples can be underlined by normalizing the mean void sizes not by number, but by their respective area fractions. While for air bending, 74.9% of the total void area is made up by voids larger than the calculated mean void size per bin, this fraction calculates to a smaller value of 65.7% for the RSS-bending samples. Even though there is no clear threshold in size or morphology after which a void can clearly be classified as “grown”, this statistical approach shows a difference in the composition of the cumulative void area from small and large void sizes.

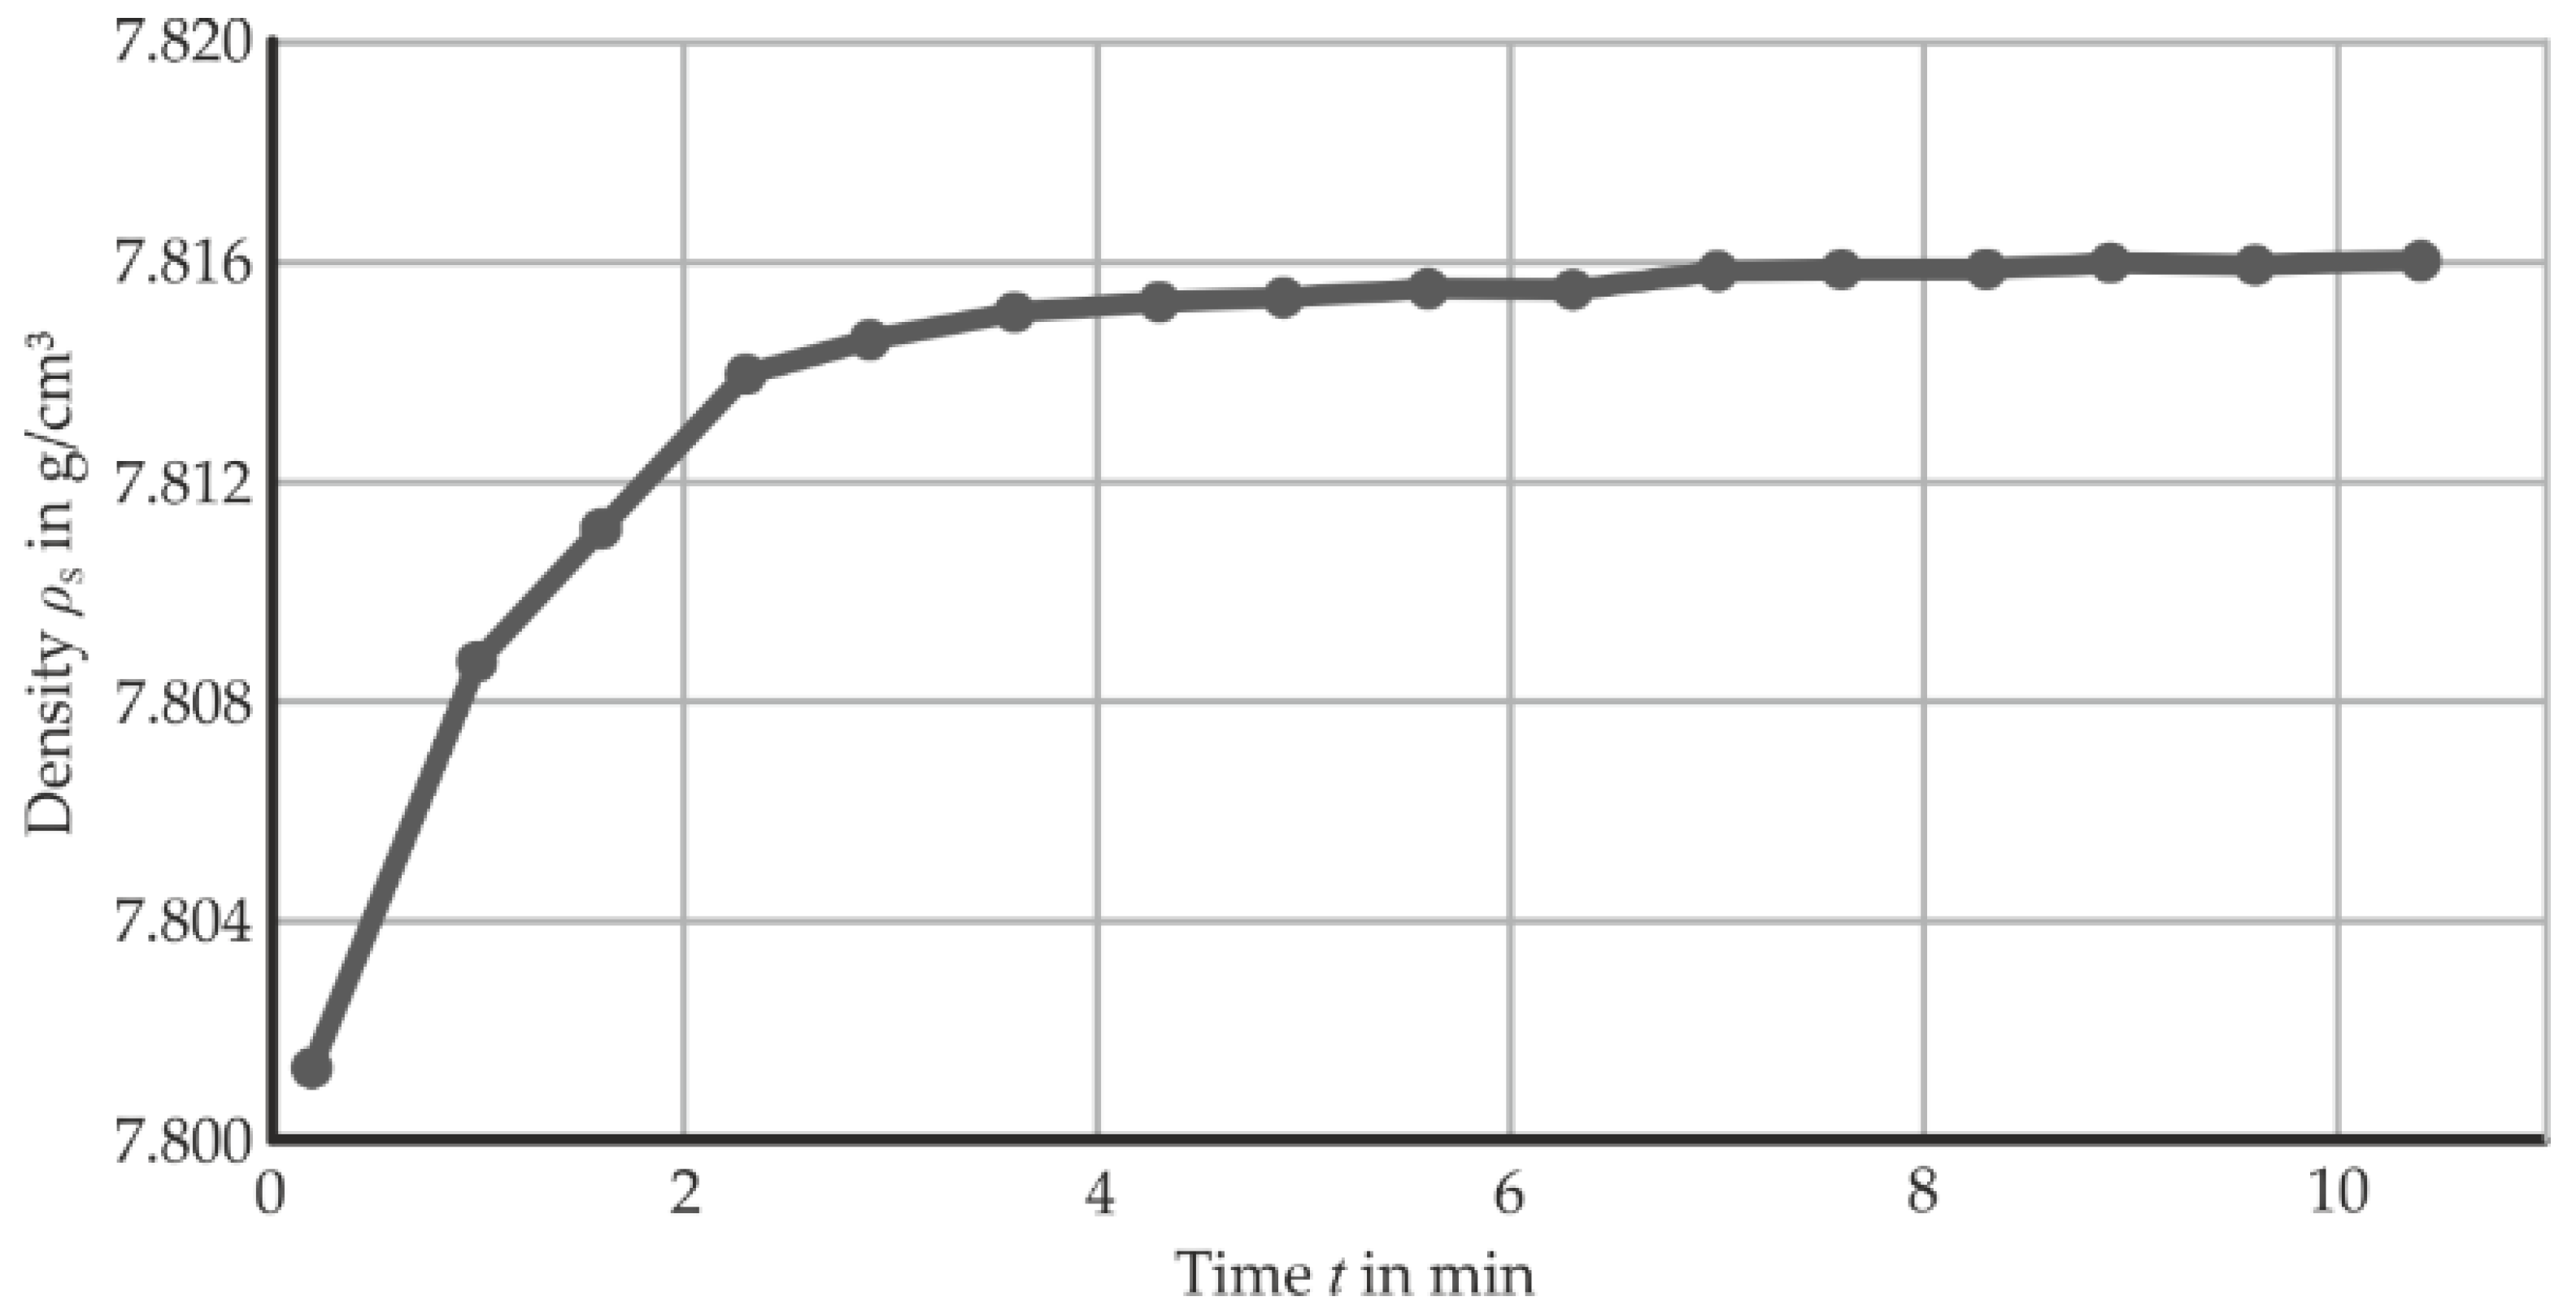
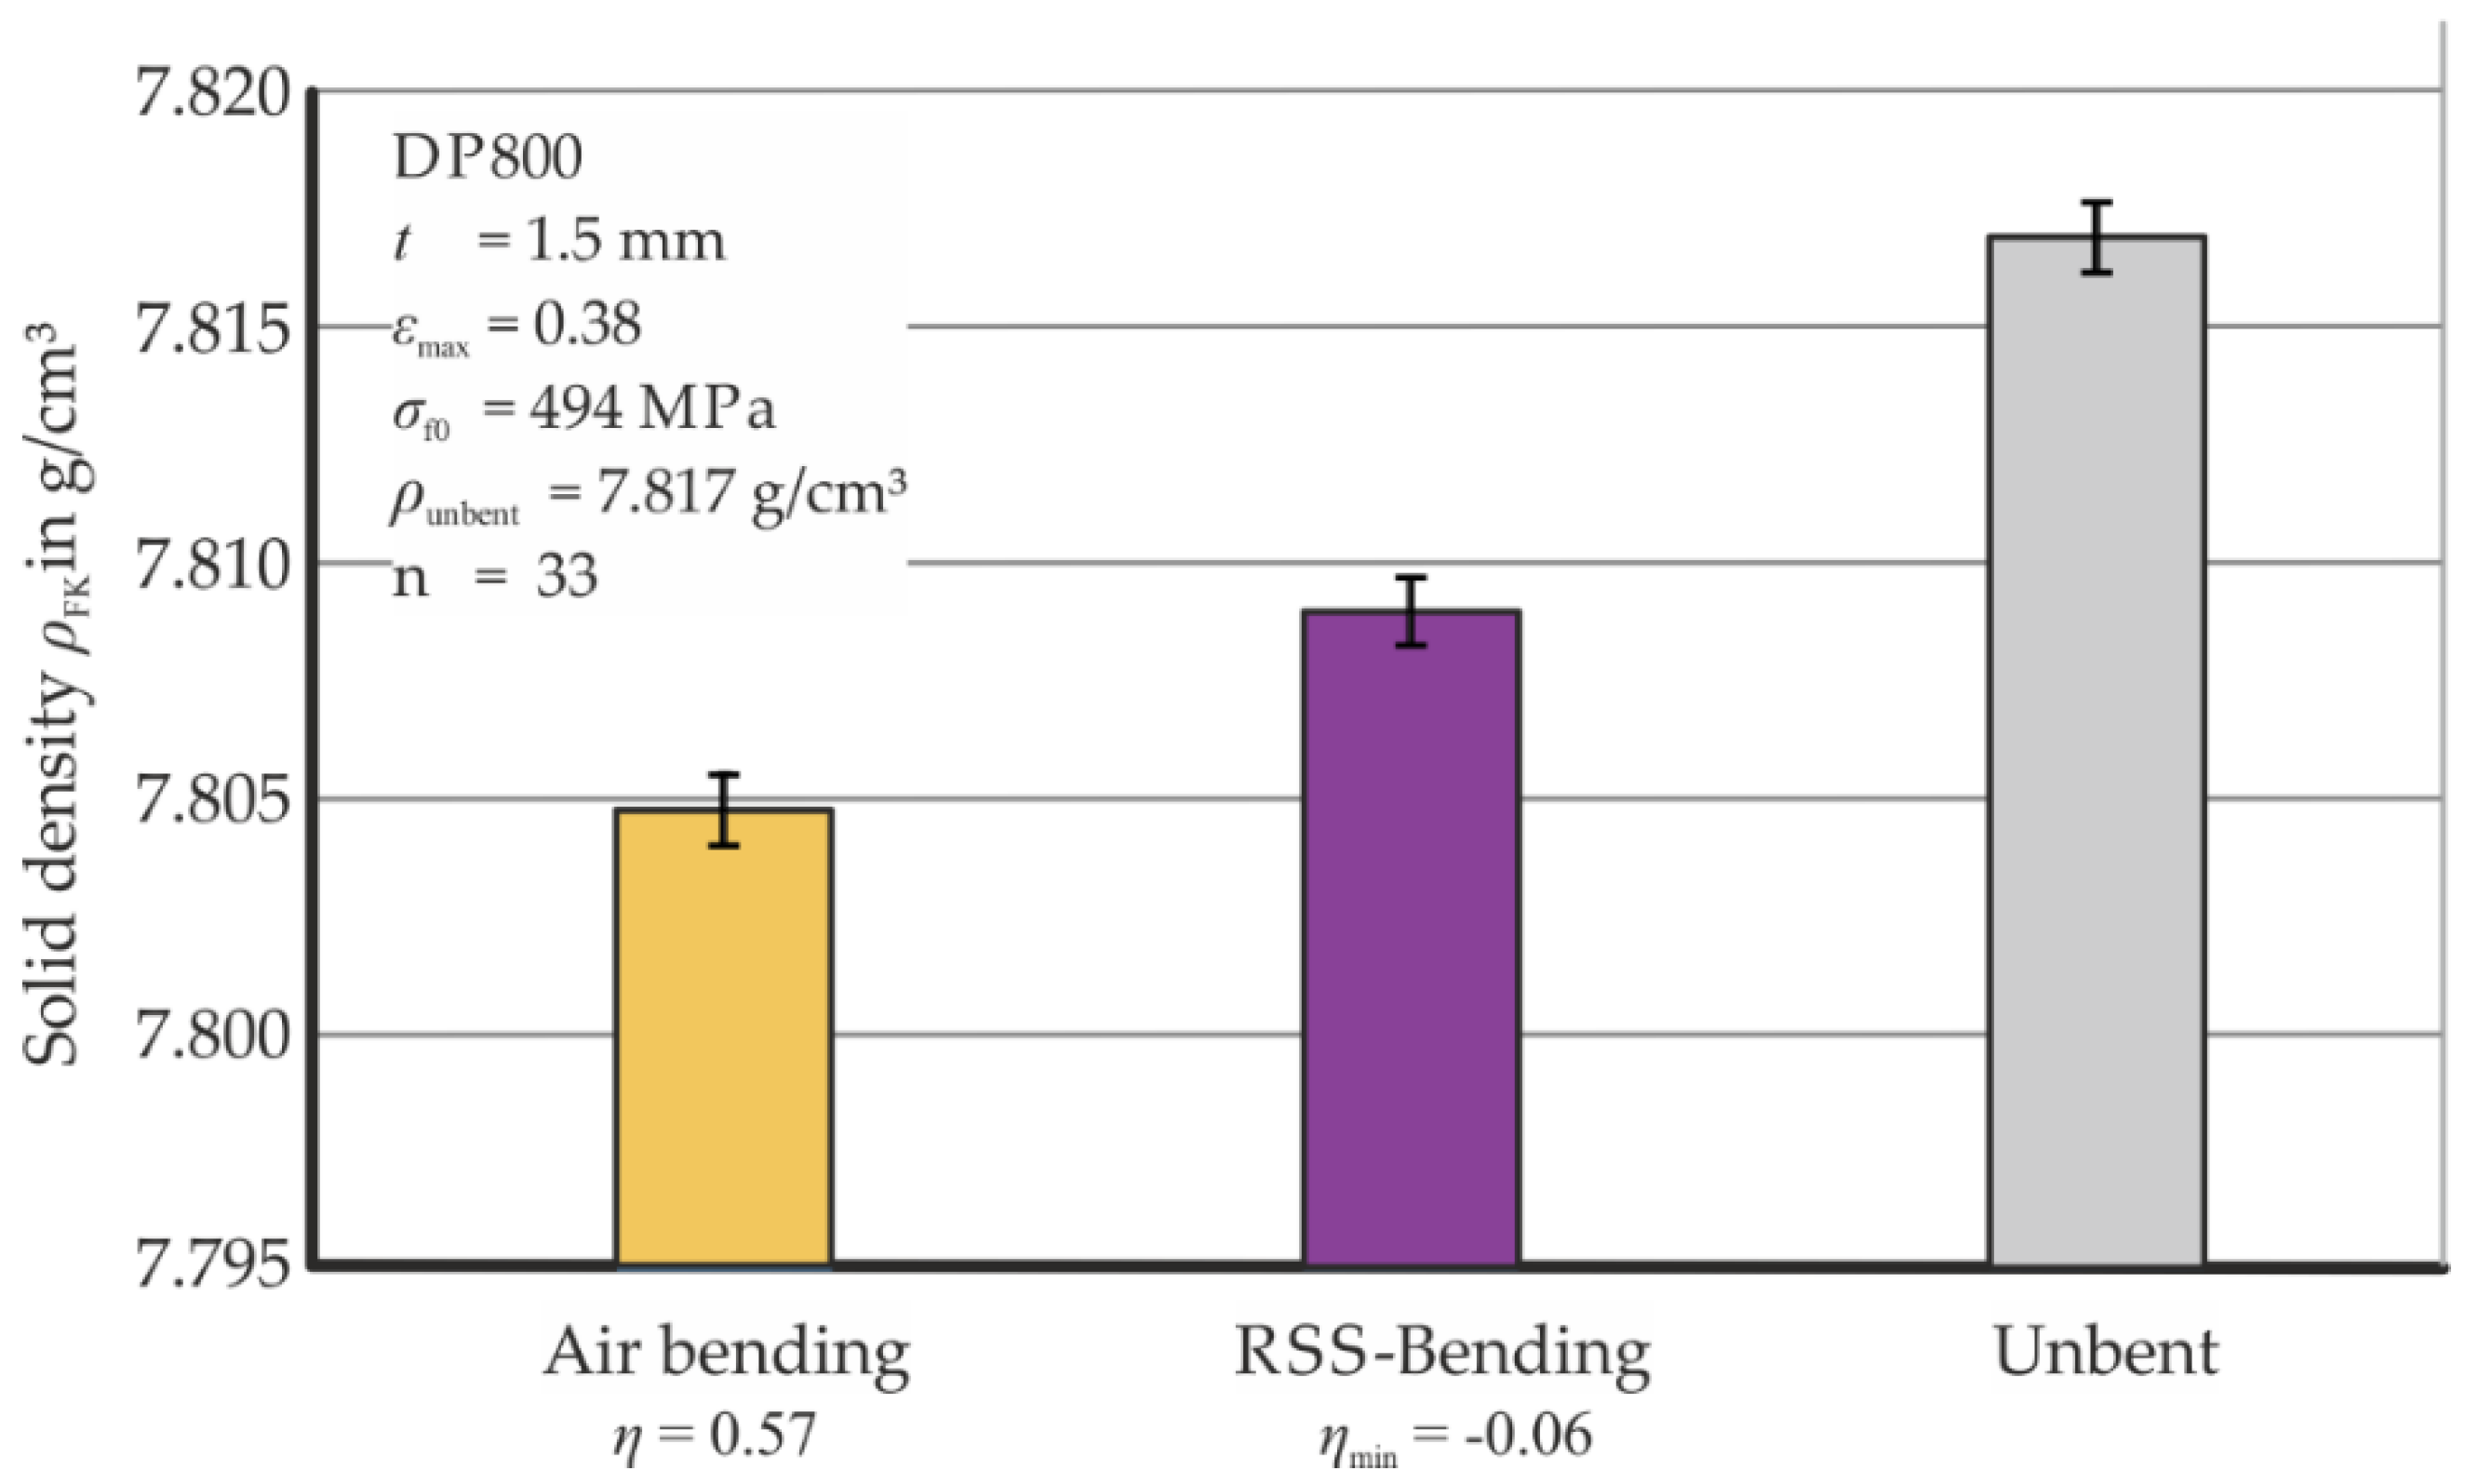
3.2. Density Measurements

The specimen is not tempered in advance, so it needs time to adapt its temperature to the measuring fluid. Also, the tempering of the measuring cup fluctuates because of the specimen immersion. The measurements are repeated several times to compensate and stabilize the influences of temperature differences and air bubbles (Figure 12).
The overall uncertainty regarding the measured density is a function of the measuring accuracy of the loading cell, the tempering, the ambient air and fluid density as well as the calculated temperature dependency of the fluid. The uncertainty reduces with a higher specimen volume and higher density of the fluid. In this set-up, the average uncertainty of the density is 0.0021 g/cm3 for a specimen volume of 1 cm3. The influence of the altered stress triaxiality on macroscopic density and the uncertainty of different specimens shows a maximum fluctuation of ± 0.0008 g/cm3 (Figure 13).
The density of the air-bent part (ηmin = 0.57) is reduced by 0.15% compared to the as-received material. In comparison, the RSS-bent (ηmin = −0.06) product’s density is reduced by 0.10%. Thus, a reduction of 33% in density loss is achieved by using the applied stress superposition during bending.

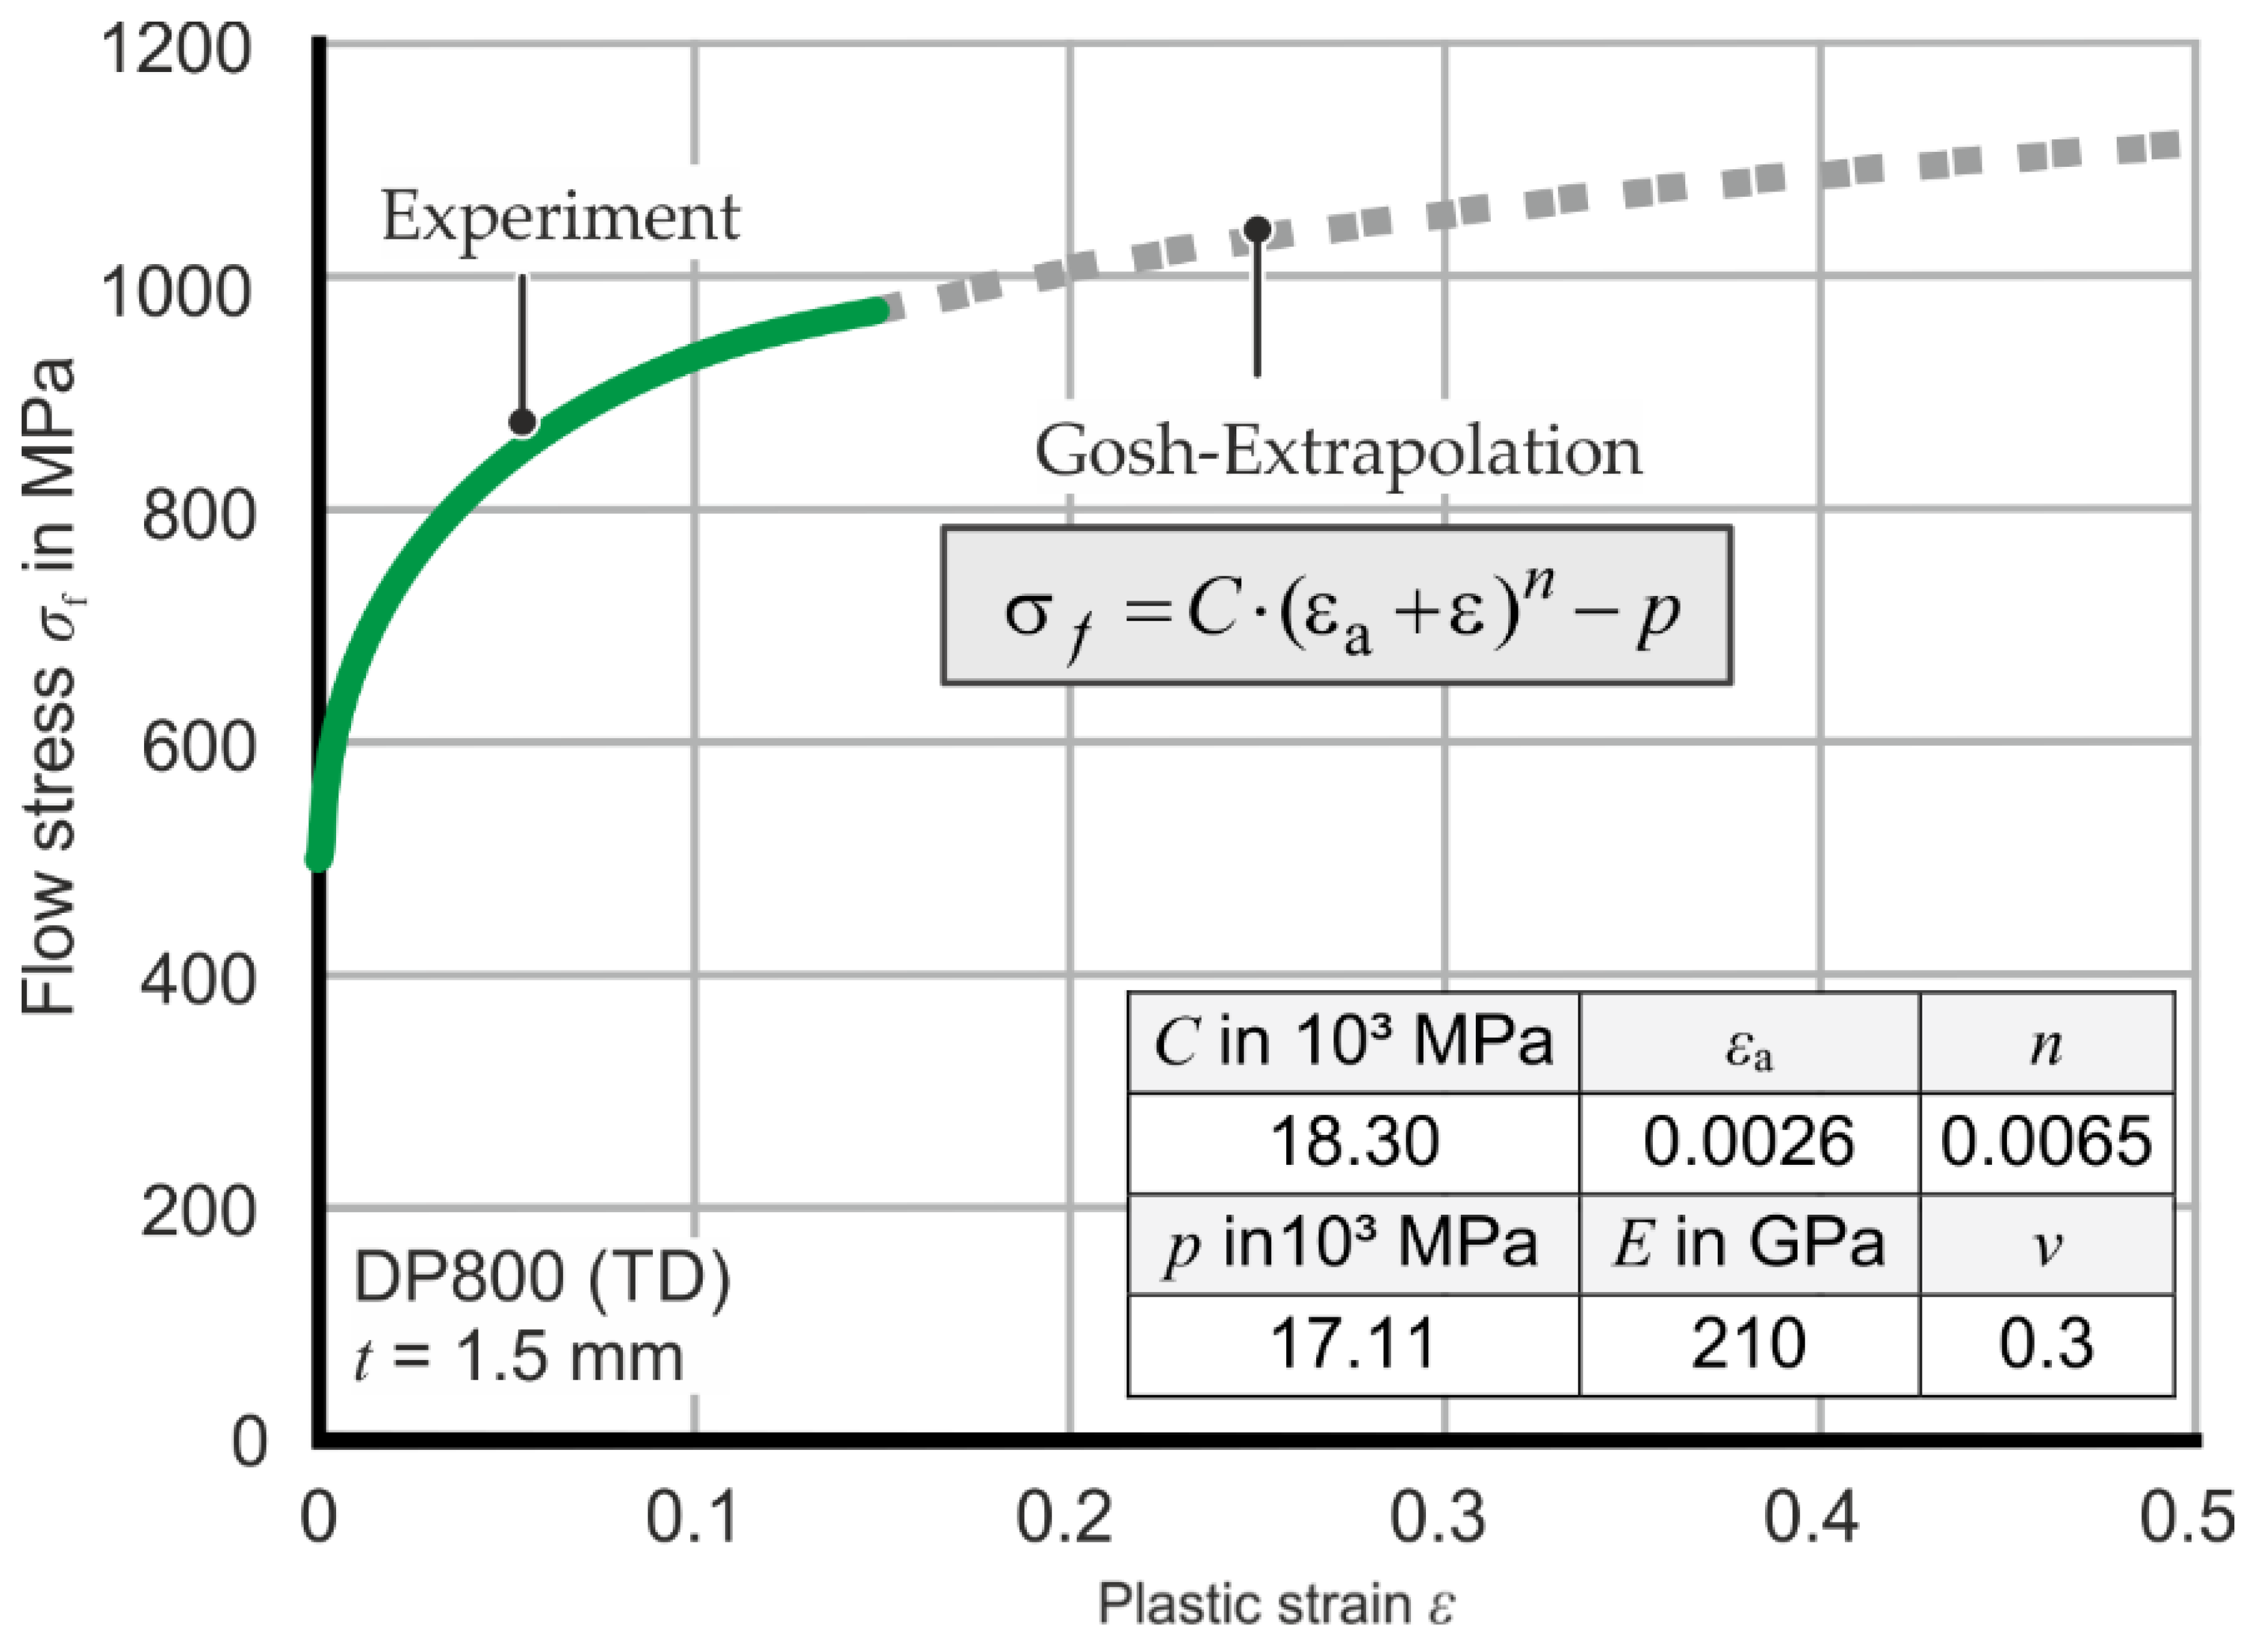
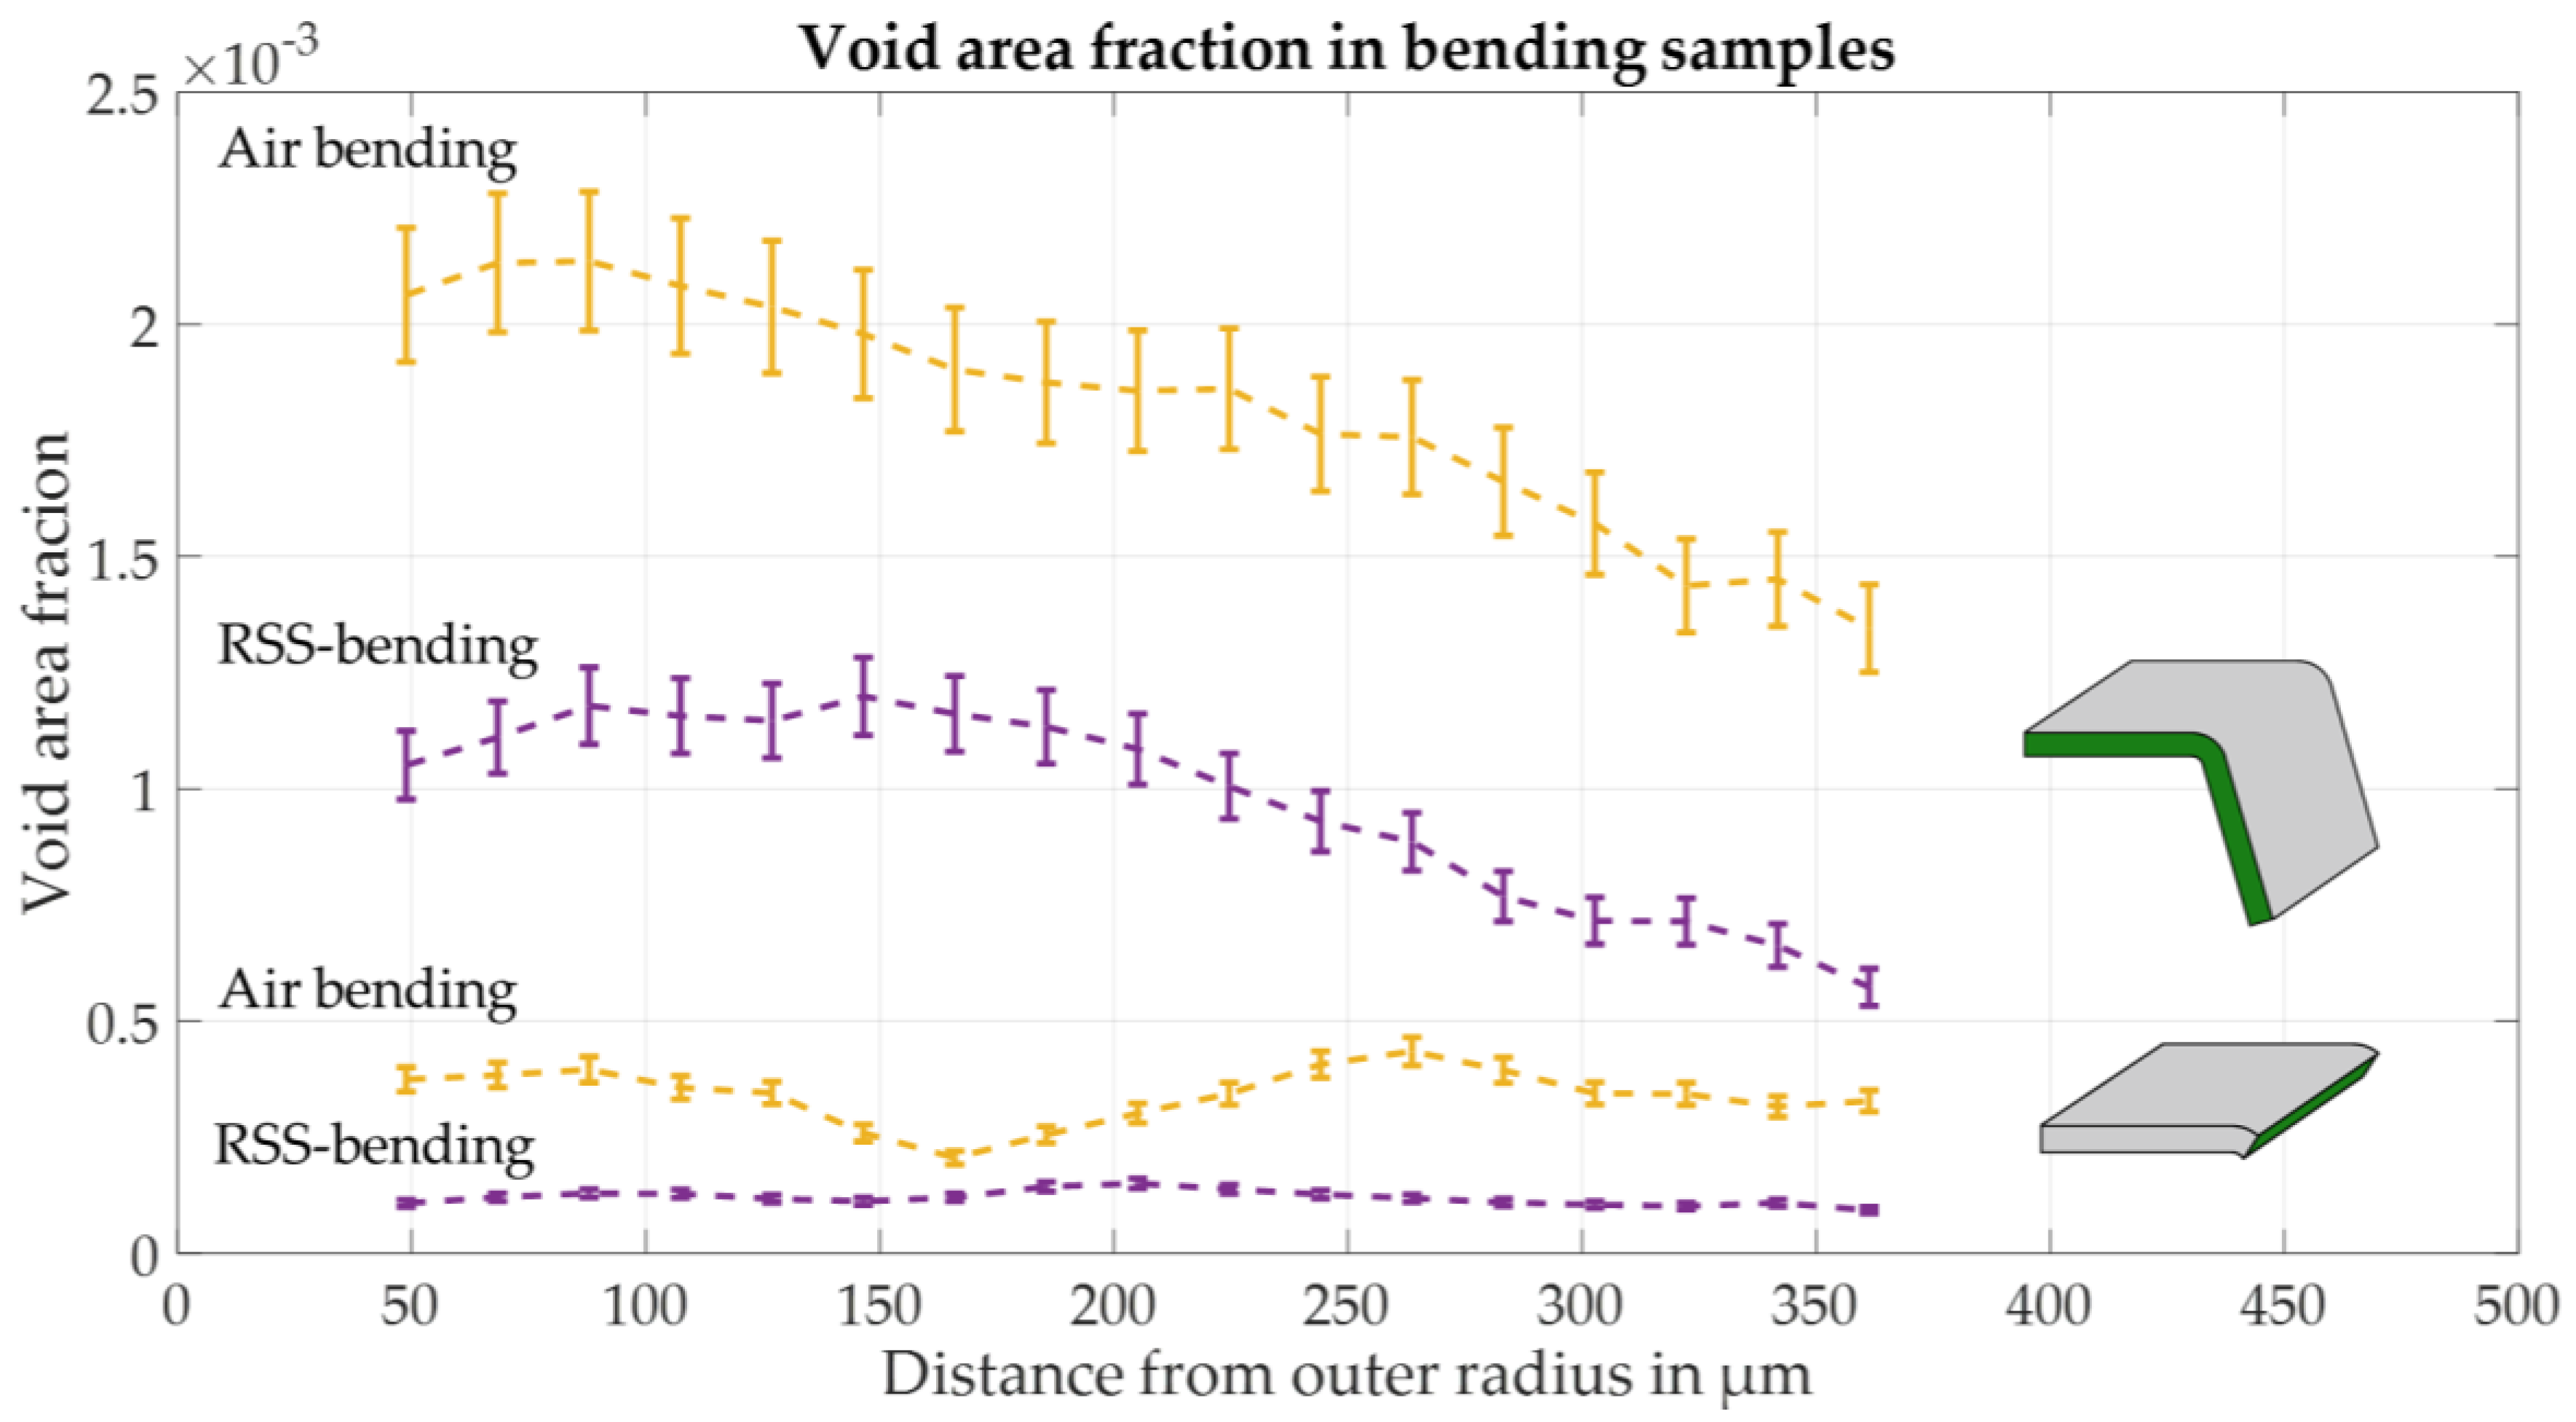
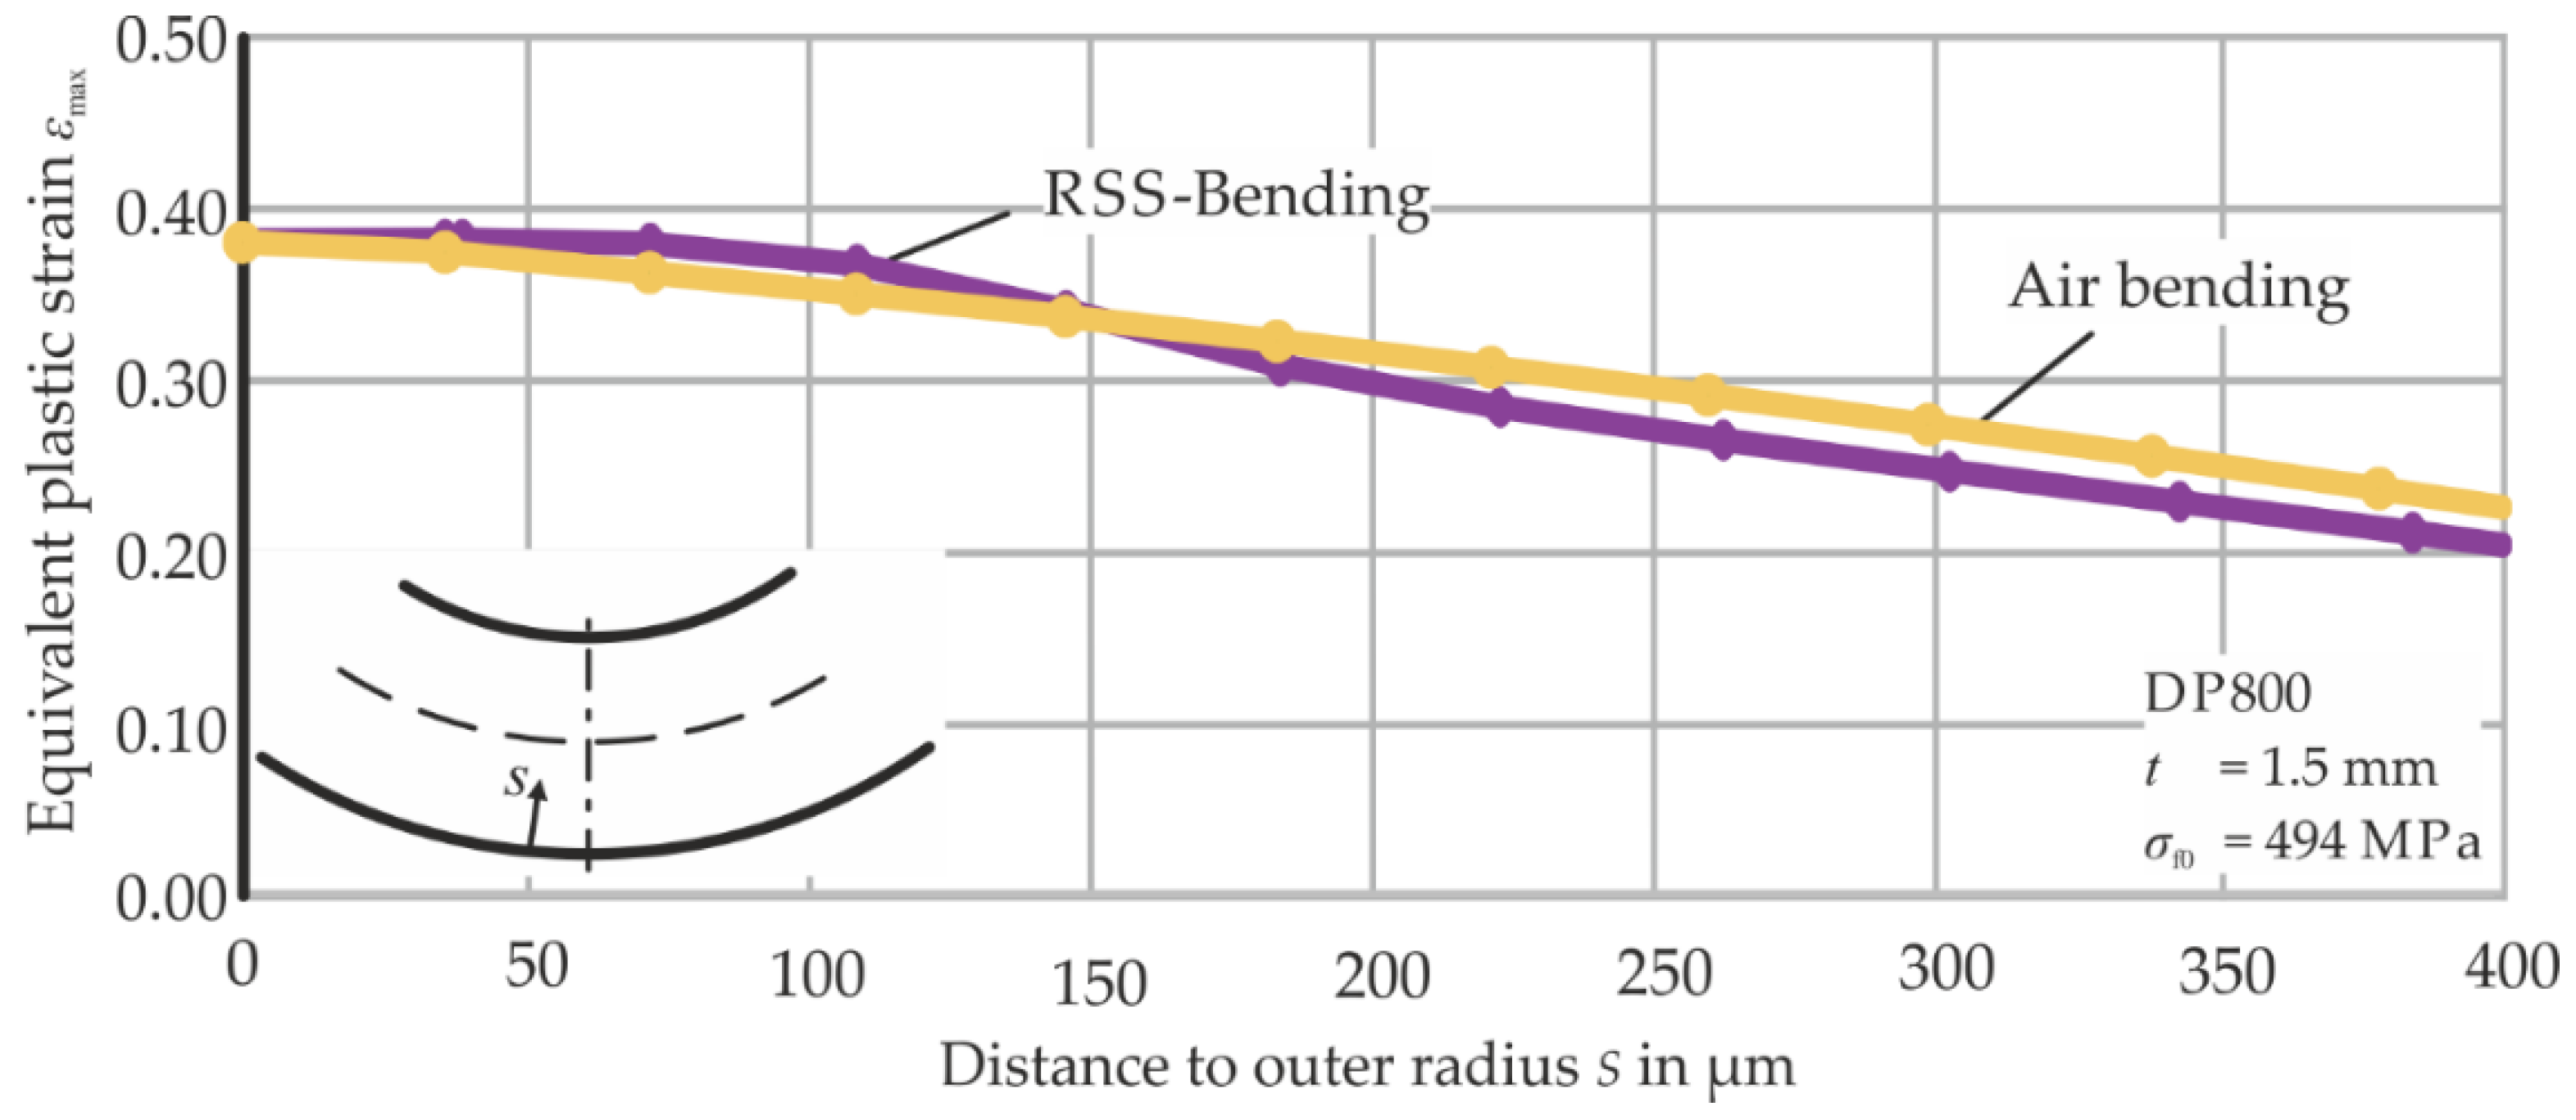
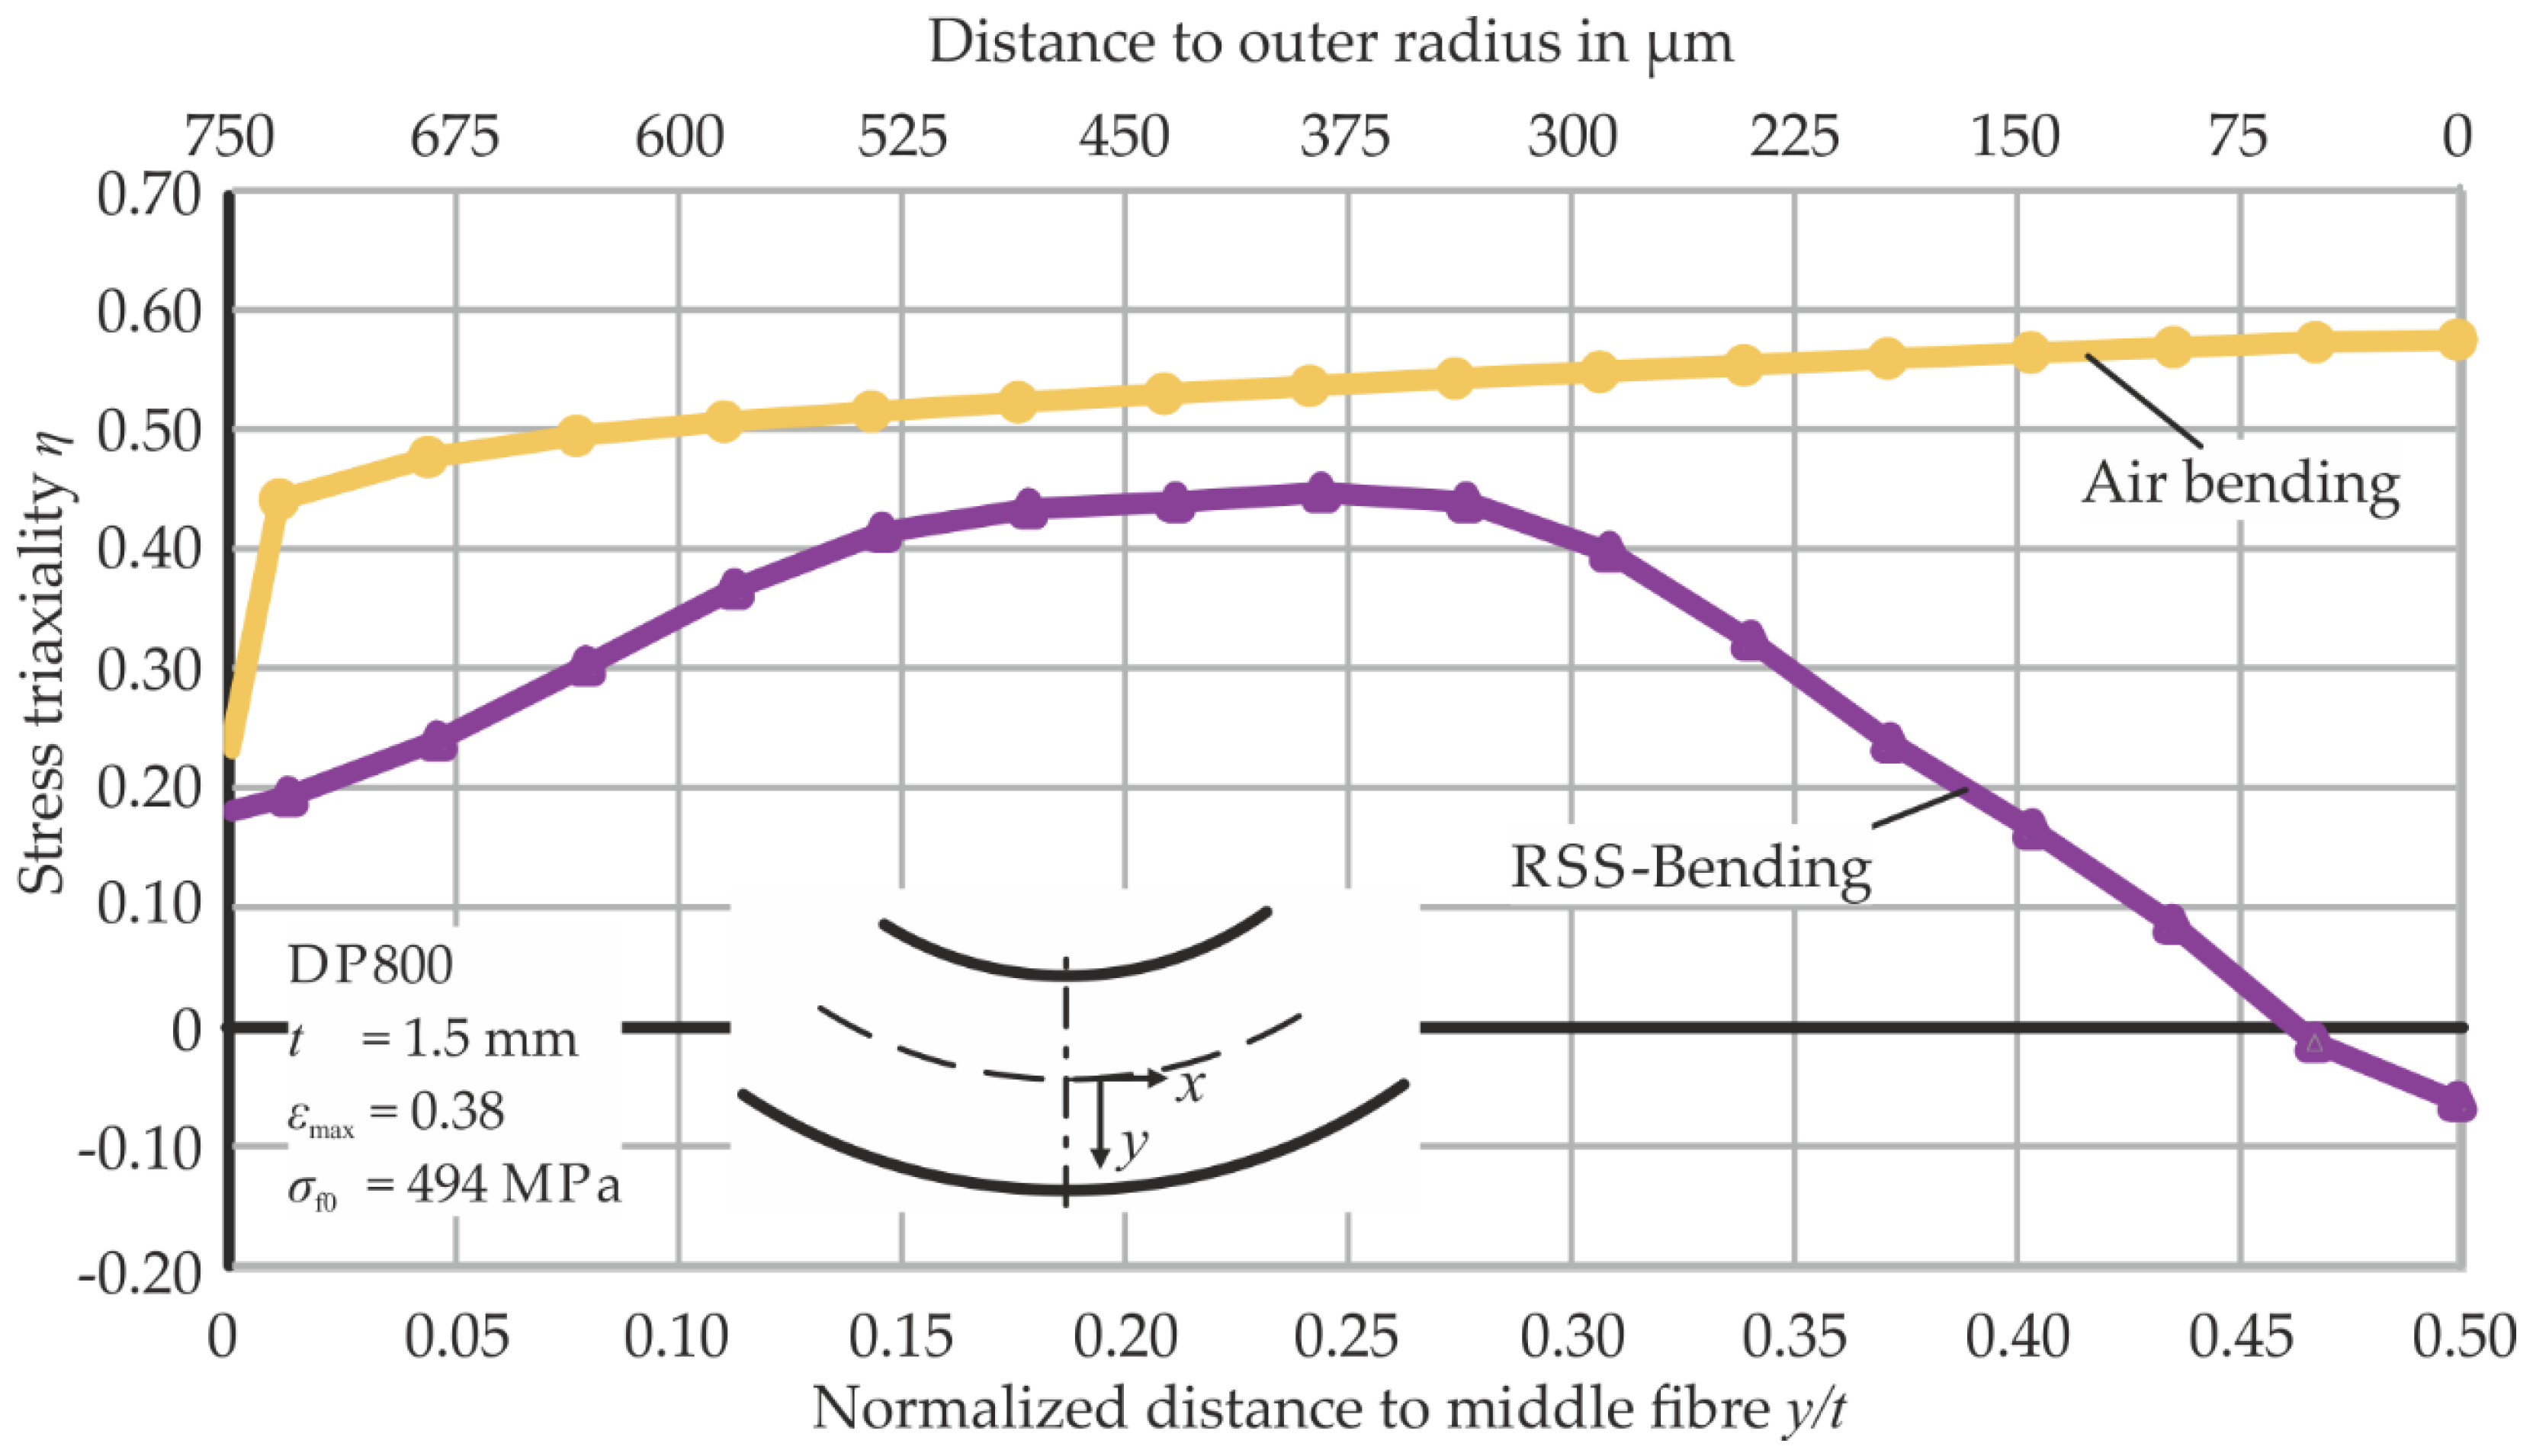
3.3. Resulting Strains and Stresses in Bending

The maximum curvature is measured by light optical microscopy and is revealed to be 0.307 ± 0.002 mm−1 for air bending and 0.310 ± 0.004 mm−1 for RSS-bending samples at the symmetry axis of the bending area. This difference of around 1% in curvature indicates similar plastic strains at the outer fiber. The numerically investigated strain distribution is also comparable, since the deviation of the equivalent plastic strain over the investigated area is less than 10% (Figure 14).
In order to neglect the influence of strain hardening in the comparison of air bent and RSS-bent products, micro hardness measurements are also conducted. The average Vickers hardness HV0.1 over the bending zone at the circumference is measured as 327 ± 23 HV0.1 (ηmin = 0.57) for air bending and 326 ± 19 HV0.1 (ηmin = −0.06) for RSS bending. The Vickers measurements are conducted with an HMV-G21D hardness testing machine (Shimadzu Corporation, Kyoto, Japan) and a test load of 980.7 mN. The duration time of indention is 10 s and 40 indentations with a distance of 0.075 mm between the measuring were done per sample. For each bending process, two samples were investigated.
Due to this neglectable difference in sample geometry and applied strains, the undergone stress state during forming can be thought to be responsible for any measured deviations in damage characteristics. The stress triaxiality values calculated over the sheet thickness in the outer fiber differ from air bending to RSS bending (Figure 15).
In general, the air bending manifests a triaxiality of η = 0.57 at the outer fiber. In RSS bending, stress triaxialities are lower for every point at the outer fiber while superposed stresses are applied by the bending tool. During the superposition of compressive stresses, triaxiality reaches negative values at the outer fiber (ηmin = −0.06), where the highest void volume fraction is expected due to the highest plastic strains. After the point of maximum stress superposition (Figure 15), triaxiality increases to η = 0.57 at the outer fiber until the plastic strain remains constant due to the moving forming zone in RSS bending [37].

4. Discussion

In the direct SEM-based observations of void evolution in bending samples, all classically known mechanisms and patterns of damage formation in dual-phase steels could be observed. The samples did not yet enter the state of crack formation, which is essential for observing and evaluating single voids and establishing a clear distinction between damage formation and material failure.
Deformation-induced damage voids can be sighted for regions up to 500 µm under the outer surface; for the area further towards the middle of the sheet, tensile strains are not high enough to nucleate a measurable number of voids. However, a dominant result of the void area measurements is that the average void size over all voids observed in a region does not increase drastically. This is explained by the fact that the nucleation of voids does not stop at higher plastic equivalent strains, leading to a steadily increasing number of newly nucleated, small voids. These are as dominant for the evolution of average void sizes as the evolution and growth of a few, single voids and therefore overshadow the growth of single voids when regarding mean void sizes only. Contrasting the observations of single, significantly larger voids near the outer radius, however, no increase in mean void size is observed for the RSS-bending process.
In comparison with the conventional air-bending process, the reduced triaxialities in the radial stress superposed bending process lead to a significant decrease in void area fractions. Compared to mean void size calculations, regarding area fractions yields a more complete picture of the damage state, as it takes both void nucleation and growth into account in its cumulative approach. This effect is particularly underlined by the previously-mentioned pronounced growth of voids that can be seen in the samples deformed with the conventional air-bending process. As shown in Figure 11, a clear evolution pattern of voids in a radial direction towards the outer radius could be observed; starting with mainly small voids, typically in the form of martensite cracking of void nucleation in martensite bands, the increasing tensile strains in all bending samples lead to a pronounced growth and additional nucleation of voids in that direction. Up to the outer radius of the sample, where significantly larger, evolved voids are observed, a considerate difference in void evolution behavior could be observed, as incidents of largely evolved voids over 2 µm2 in area are solely found in the air-bending samples, and not in the RSS-bent samples. This behavior of damage evolution is explained with the reduced triaxiality depicted in Figure 15 for the RSS-bending process. Corresponding to the damage model of Oyane [38], the measurements show a decrease in void area fraction for lower triaxialities in the RSS-bending process and equally in the maximum observed void sizes of 2.26 µm2 compared to 1.22 µm2.
The area fractions observed for the cross-section measurements range significantly under the in-plane measurements, but still show a clear distinction between air- and RSS-bending samples. As plane strain bending can be assumed in the middle of the sheet, no macroscopic strains in any of the plane directions for this observation plane occur. Here, tensile strains are perpendicular to the observation plane. The void morphology in the in-plane measurements was dominated by the growth of voids in the x-direction, this being the direction of tensile strains. Therefore, the growth in size of these voids is not to be observed in a cross-section of the sample. Void area fractions are therefore expected to be significantly higher for in-plane measurements as the major part of the void growth can be observed and measured.
The density measurements reveal a decrease in density of 0.15% for air bending and 0.10% for RSS bending compared to the unbent material. This implies an increase of void volume fraction by 33% for the air-bending process. Compared to the results of the undergone SEM analysis, values in a comparable magnitude are calculated: for RSS bending, the average decrease in void area fraction is calculated to be 44.7%.
Compared to previous work on bending processes, a drastic improvement in both damage-reduced bending technology and damage quantification is realized. Solid counter punches [15] as well as elastomer bending [17] reduce the tendency of cracking and reduce damage; however, these effects on damage void formation and growth have so far not been able to be quantified in a detailed way. The predicted damage reduction due to compressive stress superposition according to Lemaitre [3] has been calculated for elastomer bending [39]. In this work, the applied advanced characterization methods enable the experimental determination of damage quantity and its correlation to stress triaxiality. Additionally, in contrast to the aforementioned bending processes, RSS bending does not only reduce triaxiality and therefore damage, but also proves more controllable and reproducible.

5. Conclusions

A quantitative approach for the characterization of forming-induced damage is mandatory for accurately estimating product performance.
High-resolution SEM imaging coupled to automated void recognition has proven to enable the area measurement of a statistically significant proportion of microstructural, forming-induced voids. This leads to a large-area observation of void sizes and subsequent calculation of void area fractions. A detailed analysis of all occurring voids is therefore made possible.
Void area fractions as well as density measurements show a decrease in the same order of magnitude for damage quantity in the RSS-bending process, which is correlated to its lower triaxiality values, as differences in plastic strain are negligible.
Both the overall number of forming-induced voids and their maximum size is measured to be affected by the altered stress state. The nucleation as well as the growth of voids is therefore assumed to be dependent on the magnitude of triaxiality.
Compared to other bending processes that use superposed stresses to increase formability, the RSS-bending process has proven to also reduce microstructural damage occurring before the onset of fracture without their typical loss in reproducibility or restrictions in the magnitude of superposed stresses.
Designing geometrically identical bent parts using alternative load paths has proven to reduce damage, which will consequently lead to an increased performance. This will contribute to lightweight design via the realization of thinner sheet metal parts while maintaining their mechanical performance.

Author Contributions

R.M. performed the bending experiments and analyzed the data of the bending processes and the density measurements. C.F.K. performed the SEM-measurements and developed the methodology of automatic SEM-analysis. R.M. and C.F.K. wrote the manuscript. C.L., T.A.-S., S.K.-K. and A.E.T. reviewed the results and conclusions.

Funding

The investigations are kindly supported by the German Research Foundation in context of the Collaborative Research Centre CRC/Transregio 188 “Damage-Controlled forming processes”, projects A05 and B02.

Acknowledgments

The investigations are kindly supported by the German Research Foundation in context of the Collaborative Research Centre CRC/Transregio 188 “Damage-Controlled forming processes”, projects A05 and B02. We thank Mr. Michael Breitwieser for the density measurements and his lecture of the density theory.

Conflicts of Interest

The authors declare no conflict of interest.

References

  1. Ghadbeigi, H.; Pinna, C.; Celotto, S.; Yates, J.R. Local plastic strain evolution in a high strength dual-phase steel. Mater. Sci. Eng. A 2010, 527, 5026–5032. [Google Scholar] [CrossRef] [Green Version]
  2. Tasan, C.C.; Diehl, M.; Yan, D.; Bechtold, M.; Roters, F.; Schemmann, L.; Zheng, C.; Peranio, N.; Ponge, D.; Koyama, M.; et al. An Overview of Dual-Phase Steels: Advances in Microstructure-Oriented Processing and Micromechanically Guided Design. Annu. Rev. Mater. Res. 2015, 45, 391–431. [Google Scholar] [CrossRef]
  3. Lemaitre, J. A Continuous Damage Mechanics Model for Ductile Fracture. J. Eng. Mater. Technol. 1985, 107, 83–89. [Google Scholar] [CrossRef]
  4. Gurson, A.L. Continuum Theory of Ductile Rupture by Void Nucleation and Growth: Part I—Yield Criteria and Flow Rules for Porous Ductile Media. J. Eng. Mater. Technol. 1977, 99, 2–15. [Google Scholar] [CrossRef]
  5. Tasan, C.C.; Diehl, M.; Yan, D.; Zambaldi, C.; Shanthraj, P.; Roters, F.; Raabe, D. Integrated experimental—Simulation analysis of stress and strain partitioning in multiphase alloys. Acta Mater. 2014, 81, 386–400. [Google Scholar] [CrossRef]
  6. McClintock, F.A. A Criterion for Ductile Fracture by the Growth of Holes. J. Appl. Mech. 1968, 35, 363–371. [Google Scholar] [CrossRef]
  7. Mukherjee, K.; Hazra, S.S.; Militzer, M. Grain Refinement in Dual-Phase Steels. Metall. Mater. Trans. A 2009, 40, 2145–2159. [Google Scholar] [CrossRef] [Green Version]
  8. Kadkhodapour, J.; Butz, A.; Ziaei Rad, S. Mechanisms of void formation during tensile testing in a commercial, dual-phase steel. Acta Mater. 2011, 59, 2575–2588. [Google Scholar] [CrossRef]
  9. Archie, F.; Li, X.; Zaefferer, S. Micro-damage initiation in ferrite-martensite DP microstructures: A statistical characterization of crystallographic and chemical parameters. Mater. Sci. Eng. A 2017, 701, 302–313. [Google Scholar] [CrossRef]
  10. Landron, C.; Bouaziz, O.; Maire, E.; Adrien, J. Characterization and modeling of void nucleation by interface decohesion in dual phase steels. Scr. Mater. 2010, 63, 973–976. [Google Scholar] [CrossRef]
  11. Erdogan, M. The effect of new ferrite content on the tensile fracture behaviour of dual phase steels. J. Mater. Sci. 2002, 37, 3623–3630. [Google Scholar] [CrossRef]
  12. Lai, Q.; Bouaziz, O.; Gouné, M.; Brassart, L.; Verdier, M.; Parry, G.; Perlade, A.; Bréchet, Y.; Pardoen, T. Damage and fracture of dual-phase steels: Influence of martensite volume fraction. Mater. Sci. Eng. A 2015, 646, 322–331. [Google Scholar] [CrossRef]
  13. Bai, Y.; Wierzbicki, T. A new model of metal plasticity and fracture with pressure and Lode dependence. Int. J. Plast. 2008, 24, 1071–1096. [Google Scholar] [CrossRef]
  14. Anderson, D.; Butcher, C.; Pathak, N.; Worswick, M.J. Failure parameter identification and validation for a dual-phase 780 steel sheet. Int. J. Solids Struct. 2017, 124, 89–107. [Google Scholar] [CrossRef]
  15. Cupka, V.; Nakagava, T.; Tiyamoto, H. Fine bending with Counter Pressure. Ann. CIRP 1973, 22, 73–74. [Google Scholar]
  16. Gänsicke, B. Verbesserung des Formänderungsvermögen bei der Blechumformung Mittels Partiell Überlagerter Druckspannung. Ph.D. Thesis, Ruhr Universität Bochum, Bochum, Germany, 2002. [Google Scholar]
  17. Schiefenbusch, J. Untersuchungen zur Verbesserung des Umformverhaltens von Blechen beim Biegen. Ph.D. Thesis, Universität Dortmund, Dortmund, Germany, 1983. [Google Scholar]
  18. Meya, R.; Löbbe, C.; Tekkaya, A.E. Stress State Control by a novel bending process and its effect on damage evolution. In Proceedings of the 2018 Manufacturing Science and Engineering Conference MSEC, College Station, TX, USA, 18–22 June 2018. [Google Scholar]
  19. Tekkaya, A.E.; Ben Khalifa, N.; Hering, O.; Meya, R.; Myslicki, S.; Walther, F. Forming-induced damage and its effects on product properties. CIRP Ann. Manuf. Technol. 2017, 66, 281–284. [Google Scholar] [CrossRef]
  20. Meya, R.; Löbbe, C.; Hering, O.; Tekkaya, A.E. New bending process with superposition of radial stresses for damage control. In Proceedings of the Forming Technology Forum, Enschede, The Netherlands, 12–13 October 2017. [Google Scholar]
  21. Lemaitre, J.; Dufailly, J. Damage measurements. Eng. Fract. Mech. 1987, 28, 643–661. [Google Scholar] [CrossRef]
  22. Tasan, C.C.; Hoefnagels, J.P.M.; Geers, M.G.D. Identification of the continuum damage parameter: An experimental challenge in modeling damage evolution. Acta Mater. 2012, 60, 3581–3589. [Google Scholar] [CrossRef] [Green Version]
  23. Samuels, L.E. The nature of mechanically polished metal surfaces: The surface deformation produced by the abrasion and polishing of 70: 30 brass. Wear 1957, 1, 261. [Google Scholar] [CrossRef]
  24. Zhong, Z.; Hung, N.P. Grinding of alumina/aluminum composites. J. Mater. Process. Technol. 2002, 123, 13–17. [Google Scholar] [CrossRef]
  25. Isik, K.; Gerstein, G.; Clausmeyer, T.; Nürnberger, F.; Tekkaya, A.E.; Maier, H.J. Evaluation of Void Nucleation and Development during Plastic Deformation of Dual-Phase Steel DP600. Steel Res. Int. 2016, 87, 1583–1591. [Google Scholar] [CrossRef]
  26. Maire, E.; Bouaziz, O.; Di Michiel, M.; Verdu, C. Initiation and growth of damage in a dual-phase steel observed by X-ray microtomography. Acta Mater. 2008, 56, 4954–4964. [Google Scholar] [CrossRef]
  27. Ratcliffe, R.T. The measurement of small density changes in solids. Br. J. Appl. Phys. 1965, 16, 1193–1196. [Google Scholar] [CrossRef]
  28. Schmitt, J.H.; Jalinier, J.M.; Baudelet, B. Analysis of damage and its influence on the plastic properties of copper. J. Mater. Sci. 1981, 16, 95–101. [Google Scholar] [CrossRef]
  29. Bompard, D.P. Effets Endommageants de la Porosité sur la Propagation des Fessiures Dans le Nickel Fritté. Ph.D. Thesis, Universite de Technologie de Compiegne, Compiegne, France, 1986. [Google Scholar]
  30. Lapovok, R. Damage evolution under severe plastic deformation. Int. J. Fract. 2002, 115, 159–172. [Google Scholar] [CrossRef]
  31. Vedaldi, A.; Fulkerson, B. Vlfeat. In Proceedings of the International Conference on Multimedia—MM 2010, Firenze, Italy, 25–29 October 2010; ACM Press: New York, NY, USA, 2010; p. 1469. [Google Scholar]
  32. Vincent, L.; Soille, P. Watersheds in digital spaces: An efficient algorithm based on immersion simulations. IEEE Trans. Pattern Anal. Mach. Intell. 1991, 13, 583–598. [Google Scholar] [CrossRef]
  33. Kusche, C.; Reclik, T.; Freund, M.; Al-Samman, T.; Kerzel, U.; Korte-Kerzel, S. High-resolution, yet statistically relevant, analysis of damage in DP steel using artificial intelligence. arXiv, 2018; arXiv:1809.09657. [Google Scholar]
  34. Rappoport, Z. CRC Handbook of Tables for Organic Compund Identification; CRC Press: Boca Raton, FL, USA, 1967. [Google Scholar]
  35. Breitwieser, M. Bestimmungsmethoden der Dichte—IMETER. Available online: www.imeter.de (accessed on 15 January 2019).
  36. Akeret, R. Versagensmechanismen beim Biegen von Aluminiumblechen und Grenzen der Biegefähigkeit. Aluminium 1978, 54, 117–123. [Google Scholar]
  37. Meya, R.; Löbbe, C.; Tekkaya, A.E. Stress state analysis of radial stress superposed bending. Int. J. Precis. Eng. Manuf. 2018, 20, 53–66. [Google Scholar] [CrossRef]
  38. Oyane, M.; Sato, T.; Okimoto, K.; Shima, S. Criteria for ductile fracture and their applications. J. Mech. Work. Technol. 1980, 4, 65–81. [Google Scholar] [CrossRef]
  39. El Budamusi, M.; Becker, C.; Clausmeyer, T.; Gebhard, J.; Chen, L.; Tekkaya, A.E. Erweiterung der Formänderungsgrenzen von Höherfesten Stahlwerkstoffen bei Biegeumformprozessen Durch Innovative Prozessführung und Werkzeuge; IGF-Nr. 16585 N/FOSTA P930; Verl. Und Vertriebsges. Mb: Düsseldorf, Germany, 2015. [Google Scholar]
Figure 1. (a) Microstructure of the used dual-phase DP800 steel imaged by SEM, with visible deformation-induced voids. (b) Electron-backscatter-diffraction mapping of ferrite grains; martensite bands are visible as black areas.
Metals 09 00319 g001
Figure 2. Flow curve of the investigated DP800 steel with experimental data and extrapolation according to Gosh.
Metals 09 00319 g002
Figure 3. Schematic representation of void area measurements from panoramic SEM imaging. Individual images are stitched and voids recognized via a grayscale threshold. The identified voids are then individually processed using a watershed algorithm to measure their size.
Metals 09 00319 g003
Figure 4. (a) Examples of fundamental damage mechanisms of martensite/ferrite interface decohesion, martensite cracking, ferrite grain boundary (GB) decohesion and “necklace” type voids between two adjacent martensite particles; (b) void observed due to (partly) removed inclusions from the surface, recognized by a deep learning algorithm; (c) void coalescence near the outer surface of an air bending sample.
Metals 09 00319 g004
Figure 5. Evaluated planes in the bending samples (illustration): (a) cutting plane parallel to the bending plane (“in-plane”, xy plane); (b) cutting plane parallel to the bending axis (“cross-section”, yz plane). RD represents the rolling direction of the sheet.
Metals 09 00319 g005
Figure 6. Buoyancy principle for density measurement: (a) calibration of the suspension in ambient air; (b) weighing of the specimen in ambient air; (c) weighing of the specimen in the measuring liquid.
Metals 09 00319 g006
Figure 7. Area of sampling in a bent profile.
Metals 09 00319 g007
Figure 8. Air-bending process.
Metals 09 00319 g008
Figure 9. Technological implementation of radial stress superposed (RSS) bending.
Metals 09 00319 g009
Figure 10. Void area fraction in air bending and RSS bending in the outer fibers measured by SEM imaging and automated void recognition.
Metals 09 00319 g010
Figure 11. (a) Mean void size in the in-plane samples for air-bent and RSS-bent samples; representative void morphologies at various distances from the outer radius for (b) RSS bending and (c) air bending.
Metals 09 00319 g011
Figure 12. Density fluctuation due to bubbles and alternating temperature over time for an unbent sheet.
Metals 09 00319 g012
Figure 13. Density of different bent products in comparison to the as-received material.
Metals 09 00319 g013
Figure 14. Equivalent strain distribution in air bending and RSS bending at the outer fiber.
Metals 09 00319 g014
Figure 15. Triaxiality distribution in air bending and RSS bending during maximum stress superposition in the outer fibers.
Metals 09 00319 g015

