Surface Decarburization of the Hypo-Eutectoid Carbon Steel C45 during Annealing in Steady Air at Temperatures T > AC1


1
Faculty of Natural Sciences and Engineering, University of Ljubljana, Aškerčeva 12, SI-1000 Ljubljana, Slovenia
2
Institute of Metals and Technology, Lepi Pot 11, SI–1000 Ljubljana, Slovenia
3
Welding Institute Ltd., Ptujska 19, SI-1000 Ljubljana, Slovenia
*
Author to whom correspondence should be addressed.
Metals 2018, 8(6), 425; https://doi.org/10.3390/met8060425
Submission received: 11 May 2018
/
Revised: 24 May 2018
/
Accepted: 1 June 2018
/
Published: 5 June 2018
Abstract
:The non-alloyed hypo-eutectoid steel C45 was annealed in a steady air atmosphere at T > AC1 using three temperature ranges and annealing times ta = ½, 1 and 2 h. The oxidation and decarburization obeyed the parabolic law of growth with time and increased with higher temperatures and longer annealing times. The maximum visible thickness of the decarburized surface layer for all the temperature ranges can be predicted from the equations for the oxidation of iron and from the Van-Ostrand-Dewey equation (derived from Fick’s 2nd law) for the distribution of carbon. In this relation, the equation that gives the lowest values for the diffusion coefficient of carbon in austenite is appropriate. It was found that the Van-Ostrand-Dewey equation is applicable at T > AC1, despite the fact that it was derived for the decarburization of austenite at T > AG. A comparison of the results showed that the depth of the decarburization with a carbon content of 0.91–0.98C0 can be determined with optical metallography and that both the theoretical and measured values are, in general, mutually accurate in the regions of 93% to 98%. In practice, visible decarburization might not be present under some conditions while annealing in a steady air atmosphere. The reason for this is that the process of oxidation is faster than the process of decarburization. Considering the oxidation of steel under these conditions, annealing in a steady air atmosphere can be performed without any protective measures.
1. Introduction
The hot working and annealing associated with most of the heat treatments for non-alloyed and low-alloyed steels takes place in the austenite or austenite-ferrite microstructural region, which means that the annealing temperatures are higher than AC1 [1,2]. Both strong oxidation and decarburization of the steel’s surface occur when annealing at these temperatures in an oxidizing atmosphere [3,4,5,6,7,8,9]. The decarburization occurs as the steel shifts towards the thermodynamic equilibrium between itself and the atmosphere, but in an oxidizing atmosphere this equilibrium cannot be achieved. Under these conditions the iron oxidizes, mainly into FeO, while the carbon oxidizes into the gaseous products CO and CO2. The oxidation of the carbon on the steel’s surface creates and maintains the concentration gradient of the carbon between the surface and the interior of the steel. A consequence of this is the constant diffusion of the carbon from the interior towards the surface of the steel and the growth of the decarburized surface layer towards the interior. In practice it is necessary to prevent or reduce the decarburization of steel as much as possible, either by using a protective atmosphere or by annealing under conditions for which the process of oxidation is faster than the process of decarburization. The reason for these protective measures is a decrease of the resistance to crack initiation in the surface ferrite layer and an increase in the origin of fatigue fracture in the decarburized ferritic surface layer [10].
This article discusses the oxidation and decarburization of a non-alloyed hypo-eutectoid C45 (designated by EN 10027-1 standard) steel surface, both from the theoretical and practical points of view, during annealing in a steady air atmosphere in three temperature ranges above the AC1 temperature. The temperature ranges are, in accordance with the Fe-Fe3C phase diagram, chosen by considering the microstructure of the steel and the decarburization-induced and controlled microstructural change of the surface layer at the annealing temperatures.
2. Theoretical Basics
2.1. Metallurgical Theory of the Decarburization of Hypo-Eutectoid Carbon Steel at T > AC1
The decarburization of steel during annealing is an isothermal process that causes a decrease in the content of carbon in the surface layer. Meanwhile, during the isothermal annealing at T < TG (912 °C) there is also a change in the microstructure of the steel’s surface. From a microstructural point of view and with respect to the annealing temperature Ta, the decarburization of the surface at T > AC1 can be divided into three temperature ranges (Figure 1a): AC1 < Ta < AC3 (arrow 1), AC3 < Ta < TG (arrow 2) and Ta > TG (arrow 3).
Steel has a ferrite-austenite microstructure during the whole of the annealing time when annealing at the temperatures AC1 < Ta < AC3 (Figure 1a). At these temperatures a thermodynamic equilibrium exists between the ferrite with a constant carbon content CαG-P1 and the austenite with a constant carbon content CγG-S1 > C0. This thermodynamic equilibrium exists for the whole volume of the steel and the consequence is a sharp concentration gradient between both phases (Figure 1a,b). The carbon content of austenite is therefore, during the whole of the annealing time, higher than the initial carbon content of the steel C0 (different papers describe the decarburization of the surface in this temperature range with an initial carbon concentration C0, which is wrong; the decarburization cannot be correctly described because C0 is not present in any of the microstructural components at these temperatures; and the initial carbon concentration can only be used at temperatures T ≥ AC3). A surface ferritic layer αS will form during the annealing in an oxidizing atmosphere, mostly because of the surface decarburization of the austenite. The carbon content CαS = 0 is therefore quickly achieved on the outer side of this layer (the phase boundary air/αS). Meanwhile, the carbon content on the inner side of this ferrite layer is, all the time, equal to CαS = CαG-P1, which is in equilibrium with the austenite that has a carbon content CγG-S1 > C0 during the whole of the annealing time. The state on the inner side of the decarburized ferrite layer αS is therefore the same as the state between the austenite and the ferrite grains in the whole non-decarburized volume of the steel. The equilibrium between the ferrite grains and the carbon-rich austenite in the whole volume of the steel means that the decarburization of the austenite, when annealing in the (α + γ) region, is only possible on the inner side of the surface ferrite layer αS. The austenite can therefore only decrease its carbon content on the αS/γ phase boundary. This means that after cooling there exists only a completely ferritic surface layer, under which there is no visible partially decarburized layer that would have a higher ferrite content compared to the initial microstructure. A more or less frontal growth of the ferrite surface layer αS during the annealing at temperatures AC1 < Ta < AC3, without a partially decarburized layer, is therefore a consequence of the volume thermodynamic equilibrium between the ferrite with a carbon content CαS = CαG-P1 (the ferrite on the inner side of the ferrite surface layer and all the ferrite grains in the whole volume of the steel) and the austenite with a carbon content CγG-S1 > C0 (all the austenite grains in the whole volume of the steel), which consequently causes decarburization of the austenite only, on the inner boundary with the surface ferrite layer αS.
Steel has a mono-phase austenite microstructure at AC3 < Ta < TG temperatures (Figure 1a). During the annealing in an oxidizing atmosphere only the decarburization of austenite will occur on the surface at first, while later, when crossing the G-S line, the ferrite surface layer αS will start to form. The carbon content of the ferrite on the outer side of this layer (the phase boundary air/αS) quickly reaches the value CαS = 0, while the carbon content in the ferrite on the inner side of this layer is always CαS = CαG-P2, which is in a thermodynamic equilibrium with the partially decarburized austenite with a carbon content CγG-S2 < C0 (Figure 1a,c). The concentration gradient of the carbon between the ferrite on the inner side of the surface layer and the austenite is sharp, while in the austenite it slowly drops with the depth in the direction from CγG-S2 towards C0 (Figure 1c), because of the concentration profile of the carbon, defined by the Van-Ostrand-Dewey equation. During annealing in this temperature range there is a decarburized layer that is made of a surface ferrite layer, under which there is a layer of partially decarburized austenite. This is one reason for the existence of a visible, partially decarburized, ferrite-pearlite layer under the completely decarburized ferrite surface layer αS after cooling. This partially decarburized ferrite-pearlite layer shows an increasing content of pearlite as we move towards the interior, until it reaches its equilibrium content at the depth where the carbon content is C0. It is known that the thickness of a partially decarburized layer does not change very much during annealing, regardless of the annealing time [9]. The thickness of the partially decarburized layer in this temperature range is therefore controlled by the ratio of the diffusion rates of the carbon in the surface ferrite layer and in the austenite.
When annealing at Ta > TG the steel has a mono-phase austenite microstructure for the whole duration of the annealing (Figure 1a), and when annealing in an oxidizing atmosphere the decarburization of the austenite occurs. The carbon concentration in the austenite changes from CγS = 0 on the surface towards C0 in the interior (Figure 1a,d) in accordance with the Van-Ostrand-Dewey equation (derived from Fick’s 2nd law), which means that the carbon concentration gradient slowly decreases with the depth. In the case of a complete decarburization of the surface, the microstructure after cooling consists of a ferrite layer, under which is a thick, partially decarburized, ferrite-pearlite microstructure. The pearlite content increases continuously, until it reaches the equilibrium content in the depth with a nominal carbon content C0.
In practice, it is not necessary that all the mentioned microstructures will be visible after cooling. The reason is the velocity of the simultaneous reactions of oxidation and decarburization of the surface at the annealing temperature [5,6,7,8,9,10,11]. If the oxidation lags behind the complete decarburization then there is a reduced, completely decarburized layer as well as a whole, partially decarburized layer visible after cooling. If the oxidation and complete decarburization happen with the same rate, it means that after cooling there will only be a whole, partially decarburized layer that is visible. If the rate of oxidation is higher than the rate of complete decarburization and partially higher than the rate of partial decarburization, then there is only a reduced, partially decarburized layer that is visible after cooling. If the process of oxidation is as fast as, or faster than, both the complete and partial decarburization, then there will be no decarburized layer visible after the cooling. The oxidation of steel is faster when the annealing conditions and certain phenomena during annealing greatly reduce or prevent the oxidation of the carbon on the surface. This then prevents the formation of a concentration gradient between the surface and the interior of the steel, which is the basis for the carbon diffusion to the surface (the decarburization conditions and phenomena are discussed in individual sections). The lack of visible decarburization also happens when the annealing time is too short, due to the incubation period, which is a result of the initial surface oxidation and the formation of an impermeable oxide layer.
2.2. Theoretical Overview of the Oxidation of Hypo-Eutectoid Carbon Steel at T > AC1
Steel is non-alloyed when the content of alloying elements does not fundamentally affect the steel’s properties. It is a fact that all chemical elements whose affinity for oxygen is higher than that of iron will reduce the rate of oxidation because of the formation of more complex oxide layers, for example, MnO·SiO2 or 2MnO·SiO2 [2]. The amounts of these chemical elements in non-alloyed steels are low enough so that their oxide layers are discontinuous and permeable, which means that they can be neglected in a theoretical discussion of the oxidation and decarburization of a non-alloyed steel surface. Accordingly, the only oxidation reactions discussed in the following text are those of iron and carbon (Figure 2a), chosen from the Richardson-Jeffes diagram of oxide formation ΔG°-T [12]. The consequence of the oxidation of iron is an oxide surface layer, while the consequence of the oxidation of carbon is the decarburization of the steel’s surface layer. It is important to know that the conditions causing the oxidation of steel also always cause its decarburization.
2.2.1. Oxidation of Iron
Air is composed of 78 vol % N2, 21 vol % O2 and 1 vol % other gases. The partial pressure of oxygen in air is therefore pO2 = 2.1×10⁴ Pa = 0.21 atm. From the Richardson-Jeffes diagram of the formation of oxides ΔG°-T [12], we can see that iron oxidizes up to its melting point at this pressure. Considering the Fe-O phase diagram, the oxide layer on the iron and non-alloyed steel surface consists of FeO when annealing in air at temperatures T > 570 °C. In reality the high partial pressure of oxygen and the different valence numbers of iron create an oxide layer consisting of three different oxides at these temperatures. These oxides are present in a sequence from the one with the lowest amount of oxygen closest to the metal to the one with the highest amount of oxygen closest to the atmosphere: FeO/Fe3O4/Fe2O3-wüstite/magnetite/hematite (Figure 2b). Their relative thickness is mainly constant and not dependent on the thickness of the oxide layer, and at T > 700 °C is roughly 95% FeO, 4% Fe3O4 and 1% Fe2O3 [2,11,12,13,14]. At the temperature T = 570–800 °C it is, however, possible to find results that deviate in terms of compositions as well as thicknesses of the individual layers, which demonstrates the complexity of the oxidation of iron and non-alloyed steel in this temperature range [14]. The formation of the three-layered oxide layer can be explained in a simple way using the chemical reactions of the direct oxidation of iron with oxygen. In reality, the formation of the three-layered oxide layer is more complex, as it grows on the phase boundaries FeO/Fe3O4 and Fe3O4/Fe2O3, which is a consequence of specific transport processes through the individual oxide layers (the outwards diffusion of iron cations and electrons, and the inwards diffusion of oxygen anions; Figure 2b) [2,15,16].
The composition of the three-layered oxide layer with a majority of FeO shows that the oxidation of iron and non-alloyed steel at T > 570 °C is controlled by the formation of FeO. Because oxygen is unable to reach both the metal surface and the phase boundary FeO/Fe3O4 (O2− ions travel only from the phase boundary air/Fe2O3 through Fe2O3 onto the phase boundary Fe2O3/Fe3O4), FeO can only grow on the phase boundary FeO/Fe3O4 as a consequence of the diffusion of the Fe2+ iron cations through the FeO in the direction from the metal surface outwards and onto the FeO/Fe3O4 phase boundary. Here, a chemical reaction occurs between the iron and the magnetite, creating wüstite:
Fe3O4 + Fe → 4FeO
A fraction of the Fe2+ ions that arrive at the FeO/Fe3O4 phase boundary are not used in the reaction and they travel further, together with the Fe3+ ions, through the Fe3O4 layer, onto the Fe3O4/Fe2O3 phase boundary. Here, the iron reacts with the hematite, creating magnetite:
4Fe2O3 + Fe → 3Fe3O4
Because of the constant inflow of oxygen from the air, the hematite never depletes during the formation of magnetite. The constant diffusion of O2− ions through the Fe2O3 onto the phase boundary Fe3O4/Fe2O3 means that there is also a constant formation of hematite taking place there. Hematite is formed when the oxide ions react with the Fe3+ ions or with the magnetite. The chemical reactions for the formation of hematite are:
2Fe + 3/2O2 → Fe2O3
2Fe3O4 + 1/2O2 → 3Fe2O3
The thicknesses of the individual oxides in the oxide layer show that iron diffuses much faster in wüstite than in magnetite, and that the diffusion of iron and oxygen through hematite is very slow.
Regardless of the fact that the rate of oxidation of the non-alloyed steel is supposed to be lower than that of the oxidation of iron [14], the growth of the oxide layer on the surface of the iron and the non-alloyed steel at T > 570 °C is in accordance with the parabolic law [3,14]. The thickness of the oxide layer formed on the surface of the iron dox is calculated with the following equation [2,11]:
where ta is the annealing time (s) and Ta is the absolute annealing temperature (K).
The three-layered oxide layer based on FeO does not have a protective character for two reasons: One is the high permeability of FeO to the diffusion of Fe2+ cations through the oxide because of the presence of cation vacancies in the FeO crystal structure, which is a consequence of the nonstoichiometric structure (the accurate chemical formula of wüstite is Fe1−xO, which means that there are more O2− anions than Fe2+ cations in the crystal structure; as there is a lack of cations, the electrical neutrality has to be maintained with the presence of cation vacancies and, for example, Fe3+ ions). The second reason is that the oxide layer is not compact, which is a consequence of the porosity and the fractures in the oxide that give the air easy access to the steel’s surface. The porosity itself is a consequence of joining the cation vacancies, while the fractures are caused by the limited plasticity, by the inability of the above-critical thickness of the FeO layer to adjust to the steel surface, and by the internal stresses in the oxide that originate from several causes: From the differences between the thermal expansion of FeO and steel (the γ→α transformation during the decarburization at AC1 < Ta < TG causes the coefficient of thermal expansion of the steel surface to also change), the differences in the thermal expansion of the individual oxides in the oxide layer, the changes in the composition of FeO across its thickness, and from the phase transformations of the oxide layers and the steel (the formation of ferrite causes the surface to expand at AC1 < Ta < TG, while at Ta > TG it shrinks because of the decarburization of austenite). The consequence of the stresses in the oxide is a local decohesion and blistering of the oxide layer (additionally, because of the irregular composition and thickness of the oxide, stresses in the oxide between the areas with blisters and the areas without them form; also gases collect in the blisters, where the pressure increases, and if the critical pressure is reached, they will burst). The tendency for peeling and cracking increases with the greater thickness of FeO; this occurs at thicknesses that are larger than dox ≈ 50 μm [13]. In general, it is known that the oxidation in blisters is slower than in the areas where the oxide tightly fits to the steel surface [13,14]. This is a consequence of the bad contact between the peeled oxide layer and the steel surface, and the interrupted flow of the iron ions that is required for the formation of the oxide layer [14].
The volume of the iron oxides is larger than the volume of the steel from which they are formed. This is known as the Pilling-Bedworth ratio (PB) and is equal to 1.67–1.83 for the FeO/Fe-α system, 2.10 for Fe3O4/Fe-α and 2.14 for Fe2O3/Fe-α [2]. The PB ratio for the three-layered oxide layer is calculated in terms of the relative thicknesses of the individual layers. By taking the middle value of the PB for FeO/Fe-α, the PB ratio for the three-layered Fe-oxide is PB = 1.75×0.95 + 2.10×0.04 + 2.14×0.01 ≈ 1.77. This means that the thickness of the oxidized iron dm, from which the oxide layer with a thickness of dox is created during the annealing at T > 570 °C in an air atmosphere, is equal to [11]:
where the dm dimension is important for several reasons. In engineering, it is necessary to increase the thickness of the machine elements by at least dm before annealing. If the machining happens after the annealing then dm must be included as an addition for the mechanical treatment (turning, grinding), which must also include the possible thickness of the decarburized layer. In the theoretical analysis of the diffusion processes in the surface layer, the dimension dm is included in the calculated value of the diffusion distance, if the equation does not include the oxidation of the steel. The value of dm is therefore added to the visible or measured thickness of the decarburized layer when determining the absolute depth of the decarburization of non-alloyed steel. Figure 3 shows the calculated values of the thicknesses of the oxide layer dox and the thicknesses of the oxidized iron dm, from which the oxide layer dox is formed during the annealing in air for the used experimental conditions of the annealing.
2.2.2. Oxidation of Carbon
When discussing the oxidation of carbon, it is necessary to take into account the microstructure of the steel at the annealing temperature and the temperature range of the stability for CO2 and CO. Carbon in non-alloyed hypo-eutectoid steel at temperatures T > AC1 is only present in a solid solution, dissolved in Fe-α (ferrite) and/or in Fe-γ (austenite). The ferrite is stable at T < TG or T < AC3, while the austenite is stable at T > AC1.
Carbon reacts with oxygen creating CO and CO2 during the annealing of the steel in air. The reactions of the direct oxidation of carbon with oxygen (C + O2 → CO2 and 2C + O2 → 2CO; Figure 2) intersect at T ≈ 700 °C. The lines of both reactions show that at T > 700 °C CO is more stable or that CO is preferentially formed at T > AC1. This means that, with respect to the Boudouard equilibrium (C + CO2 ↔ 2CO, Figure 2), the reaction goes from left to right at T > 700 °C [12,17] or that there is a tendency towards decarburization at T > AC1. Because an increasing temperature means that the carbon preferentially burns to form CO, the equilibrium content of CO in the formed gas mixture also increases (Figure 4). The equilibrium content of carbon in austenite at the annealing temperature, based on the composition of the atmosphere in the furnace, is shown with lines that are moved to the right of the Boudouard equilibrium at T > AC1 (Figure 4). A curve from which the lines of the equilibrium carbon concentration in austenite are coming out is the equilibrium between the austenite and the ferrite in the two-phase region (α + γ), and under this line the equilibrium amount of carbon in ferrite is present. It is important to know that gas mixtures (CO + CO2) cause the decarburization of steel if their composition is below or to the right of the equilibrium line for that steel, while they cause carburization if their composition is above or to the left of that line.
It is important to consider, especially in the initial stage of annealing, that in the initial stage of the steel’s oxidation the oxide layer is still compact and the decarburization is suppressed because the formed carbon oxides are unable to enter into the atmosphere. That is to say, the steel/FeO phase boundary is the location of the formation and accumulation of the gas mixture (CO + CO2), the composition of which controls the process of decarburization. There are several oxidation reactions happening simultaneously during the annealing in air at T > AC1. Because the steel oxidizes already during heating towards the annealing temperature, there is a thin but compact layer of FeO already present on the steel’s surface at T > AC1. As the oxygen does not diffuse through FeO, the decarburization of the steel’s surface in the initial stage of annealing is only possible with the surface reaction of carbon in a solid solution of iron [C]Fe and wüstite [3,6,14]:
FeO + [C]Fe-α → Fe-α + CO
FeO + [C]Fe-γ → Fe-γ + CO
Initially, the steel decarburizes though both reactions when annealing at AC1 < Ta < AC3; however, it only decarburizes by Reaction (e) once the continuous ferrite layer is formed. At AC3 < Ta < TG the steel initially decarburizes by Reaction (f), but once a continuous ferrite layer is formed it decarburizes by Reaction (e). Decarburization happens by Reaction (f) at all times at T > TG. Part of the formed CO reacts further with FeO [3,14]:
FeO + CO → Fe-α or Fe-γ + CO2
Because CO is more stable at T > AC1 a part of the formed CO2 reacts further with the carbon dissolved in the solid solution with the Boudouard reaction [3,6]:
[C]Fe-α + CO2 → 2CO
[C]Fe-γ + CO2 → 2CO
The iron formed in Reactions (e)–(g) diffuses through the oxide layer as a result of the constant oxidation; at the same time there is an accumulation of a gas mixture with a high content of CO at the steel/FeO boundary. Because of this, the decarburization slows down drastically after some time or it can stop for a short period of time. There might even be an occurrence of the carburization of the surface [3]. This means that in the initial phase, after some time, the composition of the created gas mixture (CO + CO2) between the oxide and the steel reaches a composition that lies on the equilibrium lines or even to the left of them (Figure 4). Later, after a short pause, the decarburization accelerates rapidly, which is definitely a consequence of the formation of a highly permeable oxide layer (it can be assumed that, in the case of yet un-cracked blisters of oxide, both the oxidation and decarburization of the steel are reduced on those spots). The formed carbon oxides can go into the atmosphere through the cracks in the oxide layer, while oxygen has free access to the steel surface. From this moment on, it can be considered that the composition of the gas mixture on the steel/FeO boundary is constant and, because of the total surface decarburization, it lies in the ferrite region at AC1 < Ta < TG while lying under the equilibrium line for the austenite with a carbon content of C = 0.05 wt % at Ta > TG (Figure 4). The oxidation of iron increases because of this, while simultaneously also the decarburization increases as the reactions of the direct oxidation of carbon with oxygen start:
2[C]Fe-α + O2 → 2CO
[C]Fe-α + O2 → CO2
2[C]Fe-γ + O2 → 2CO
[C]Fe-γ + O2 → CO2
The larger part of the CO2 created by these reactions reacts with the carbon in the solid solution in accordance with Reactions (h) and (i) because of the high temperatures. Decarburization in the ferrite occurs through Reactions (e), (h), (j) and (k), while in the austenite it occurs by Reactions (f), (i), (l) and (m).
After achieving its maximum, the rate of decarburization slowly decreases with an increasing annealing time, showing a decrease in the amount of the formed gases CO and CO2 [5]. The reason is a continuous surface ferrite layer (at AC1 < Ta < TG) or a highly decarburized surface austenite layer (at Ta > TG) with a drastically reduced activity of carbon [4], a small concentration gradient of carbon and also with the diffusion of carbon being a controlled process of decarburization through highly decarburized surface layers. As longer annealing times mean a thicker decarburized surface layer, this also means that the diffusion distance for the carbon atoms in the decarburized layer also increases. This decreases the effectiveness of the driving force for the movement of the carbon atoms through the decarburized layer (the concentration gradient of the carbon slowly decreases with time because of the thickening of the totally decarburized surface layer); the consequence being additional decreases in the process of decarburization. This is why the time dependency of the growth of the decarburized layer, similar to the growth of the oxide layer on the surface of the iron, is parabolic [3,18].
3. Experimental
For the purpose of this research, a non-alloyed hypo-eutectoid steel C45 was chosen, the chemical composition of which was measured with an emission spectrometer (in wt %: C = 0.43, Si = 0.22, Mn = 0.61, P = 0.034, S = 0.014) with approximate temperatures of phase transitions AC1 = 735 °C and AC3 = 785 °C [19] and with a ferrite-pearlite initial microstructure. The samples were a rectangular cuboid shape with average dimensions of 40 mm × 30 mm × 17 mm, and with a mass m = 160 ± 20 g. All the samples were weighed before annealing and placed in groups in such a way that the masses of all three samples annealed at the same temperature for different times were within 5 g of each other. The surfaces of the samples were grinded and so were without any traces of oxides prior to the annealing. The effect of surface oxides on the kinetics of decarburization was negated with grinding prior to annealing, as oxides present on the surface before the annealing increase the visible decarburization [20].
The annealing took place in steady air (the humidity was not measured) at the annealing temperatures Ta = 760 °C, 850 °C, 950 °C, 1100 °C and the annealing times ta = ½ , 1, 2 h in a CARBOLITE laboratory electric resistance furnace with the volume of the chamber V = 22 dm3. Each sample was placed in the same spot in the preheated furnace on a firebrick in the middle of the annealing chamber, at the annealing temperature. This ensured the same conditions and the fastest heating of each sample to the annealing temperature. The heating and annealing temperatures were controlled with an ALMEMO 2590-9 certified contact thermocouple that was touching the side of the sample during the annealing (it was inserted into the furnace through the small hole in the ceiling of the furnace). The annealing time was measured from the time when the temperature on the control thermometer reached T = Ta − 0.5 °C. The temperature fluctuation during annealing was Ta − 1 °C ≤ T ≤ Ta + 3 °C. The samples were cooled in steady air outside the furnace after the annealing.
The depth of the decarburization was researched using optical microscopy in two ways: Conventionally, with an optical microscope equipped with a reticle, and also with a computer application of the microscope method measuring from a picture on the screen. Metallographic specimens were prepared with wet grinding SiC paper with a granulation up to #4000, polishing with a ¼-μm diamond paste and etching with 3% HNO3 in ethanol. Decarburization of the different surfaces (upper and lateral surfaces that are in contact with the atmosphere, and the bottom surface that is in contact with the firebrick, edges, corners) is not the same because of the different oxidation of these surfaces. Decarburization is, in general, always larger on the surfaces that have less ability to oxidize; therefore, the bottom surfaces are usually decarburized more [4], which also applies to the edges and corners on rectangular cuboid samples [11,20]. Both edges and corners are also prone to overheating. This research was focused only on the flat surfaces that were in contact with the atmosphere. The decarburization was measured on three sections perpendicular to the longer side of the sample on the upper and both lateral surfaces of the sample. The depth of the decarburization was also assessed theoretically by taking into account two equations: For the oxidation of the iron and for the distribution of the carbon in the decarburized austenite layer.
4. Results and Discussion
4.1. Oxidation of the Surface of C45 Steel
The steel’s surface oxidizes to a greater extent with higher annealing temperatures and longer annealing times. With a higher temperature (e.g. Ta = 1100 °C) there are also more carbon oxides CO and CO2 formed in the same period of time, which means that there is also a high degree of blistering of the oxide layer present after cooling (Figure 5). In the depression in the blistering oxide layer there is a visible fracture that has formed during the isothermal annealing. The proof of this is the very strong decarburization of the steel at this annealing temperature. On the edges the process of oxidation is slower.
The remains of a tightly fitting oxide layer, whose thickness increases with the annealing time, is visible on the samples annealed at Ta = 850 °C as it can be seen in Section 4.2.2. (This is not the total thickness of the oxide layer as its surface layer peeled off during the preparation of the metallographic specimens). The oxide layer is porous, but the steel underneath it is not decarburized, which shows a discontinuous porosity. This proves the assumptions that the degree of clinging of the oxide layer to the steel surface has an important effect on the kinetics of the oxidation and decarburization or, in other words, that the tightly fitting oxide layer prevents decarburization because of the higher oxidation rate of the iron.
The thicknesses of the oxide layers on the annealed samples could not be accurately measured as the oxide layers were crumbling and falling off the surface of the samples during their manipulation. Only the pieces of the oxide layer that peeled off from a sample annealed at Ta = 1100 °C for ta = 2 h could be measured reasonably accurately. Their thickness was larger than 1.0 mm, which is comparable to the calculated results (Figure 3). A comparison of the calculated results with the experimental-analytical results of the oxidation of steel 55SiCr with 1.51 wt % Si and 0.70 wt % Cr [8] shows that the 55SiCr steel oxidizes more slowly than the C45 steel [(a) Ta = 750 °C, ta = 1 h, steel 55SiCr: measured dox = 30 μm, result calculated with Equation (1): dox = 69 μm; (b) Ta = 1100 °C, ta = 1 h, steel 55SiCr: measured dox = 530 μm, result calculated with Equation (1): dox = 875 μm; (c) Ta = 1150 °C, ta = 1 h, steel 55SiCr: measured dox = 800 μm, result calculated with Equation (1): dox = 1136 μm; (d) Ta = 1200 °C, ta = 1 h, steel 55SiCr: measured dox = 1200 μm, result calculated with Equation (1): dox = 1449 μm], which is certainly a consequence of the higher content of silicon and the added chromium. Our calculated results are comparable with the measured thicknesses of the oxide layer on carbon steel with the carbon content C = 0.76 wt % (defined as base composition in [4]. When also taking into account our measured results for the peeled-off oxide layer after annealing at Ta = 1100 °C, ta = 2 h we consider that Equation (1) accurately describes the oxidation of non-alloyed C45 steel during annealing in steady air.
4.2. Decarburization of the Surface of C45 Steel
4.2.1. Annealing at Temperature T = 760 °C
The annealing temperature Ta = 760 °C is in the AC1 < Ta < AC3 range; therefore, the C45 steel has a dual-phase microstructure (α + γ) during the whole duration of the annealing. This means that in non-alloyed steel with a carbon content C0 = 0.43 wt % both ferrite with the carbon content CαG-P ≈ 0.0175 wt % and austenite with the carbon content CγG-S ≈ 0.546 wt % are in equilibrium at this temperature (the values are estimated from the Fe-Fe3C phase diagram, Figure II-4b,II-4c in [1]). During the whole annealing, the concentration gradient of the carbon ΔC/Δx between the ferrite and the austenite is sharp and large (ΔCα/γ ≈ 0.529 wt %; x = thickness of the crystal boundary, the distance of a few atoms) and constant between all the ferrite and austenite grains in the whole volume of the steel and with the inner side of the decarburized surface layer (Figure 1b). ΔC/Δxα is small in the surface ferrite layer with the surface carbon concentration CαS = 0 and it additionally decreases with longer annealing times (CαS = 0, ΔCα ≈ 0.0175 wt %, xα = thickness of the ferrite layer, which increases with longer annealing times). The microstructure of the surface part of the C45 steel after annealing is shown in Figure 6.
A clearly visible ferrite layer is formed on the surface as a consequence of the decarburization. Under it there is no visible, partially decarburized layer (see the explanation in Section 2.1). The decarburized layer is discontinuous after short annealing times. There is practically no decarburization on the surface after ta = ½ h (Figure 6a-left) and there was only a very locally limited small decarburization area found. The ferrite in this area could have easily been mistaken for a local banded distributed untransformed ferrite in steel, but the ferrite grains in a surface decarburized layer are more polygonal shape (Figure 6a-right). After ta = 1 h the surface is already strongly decarburized (Figure 6b), part of the decarburized surface is large, while there are still larger areas of surface that did not yet decarburize (here the state is the same as that in Figure 6a-left). After ta = 2 h, there is a continuous decarburized ferrite layer on the surface (Figure 6c). The measured maximum thicknesses of the decarburized layers after different annealing times are: 50 μm (ta = ½ h), 120 μm (ta = 1 h) and 150 μm (ta = 2 h).
4.2.2. Annealing at Temperature T = 850 °C
The annealing temperature Ta = 850 °C is in the AC3 < Ta < TG temperature range; therefore, the C45 steel has a single-phase γ microstructure during the annealing. However, because of the oxidation of carbon from the surface, the surface area of the austenite with the carbon content Cγ = C0 = 0.43 wt % is depleted in terms of carbon. When the carbon content in the surface area reduces to CγG-S ≈ 0.13 wt % (from Figure II-4b in [1]), surface ferrite with the carbon content CαG-P ≈ 0.007 wt % (from Figure II-4c in [1]) starts to form. This ferrite then quickly decarburizes to CαS = 0 on the surface. The difference in the carbon concentration in the ferrite is very small (ΔCα ≈ 0.007 wt %), while in austenite it is much larger (ΔCγ ≈ 0.3 wt %). The carbon concentration gradient ΔC/Δx is, in general, smaller in the ferrite than in the austenite, and it decreases even more with the thickening of the ferrite layer. The carbon concentration gradient between the ferrite and the austenite is constant and sharp, but compared to the annealing at Ta = 760 °C, it is much smaller (ΔCα/γ ≈ 0.123 wt %; x = thickness of the crystal boundary the distance of a few atoms). In the annealed sample, a surface ferrite layer forms because of the decarburization, under which there is a partially decarburized layer up to the depth where the carbon content is the same as the initial content C0 = 0.43 wt % (see the explanation in Section 2.1). The microstructure of the surface part of the C45 steel after the annealing is shown in Figure 7.
A large part of the surface remains non-decarburized, even after ta = 2 h (Figure 7a–c), which means that the decarburized surface layer is discontinuous under all annealing conditions. A clearly visible, completely decarburized surface ferrite layer, under which there is a partially decarburized layer, only exists in the samples annealed for ta = ½ h and ta = 2 h (this shows the course of the decarburization, as explained in Section 2.1). After short annealing times the ferrite layer is more pronounced, with coarse ferrite grains, as well as being thicker. The reason for this is the slower oxidation. It is interesting that in samples annealed for ta = 1 h there is no visible decarburization (actually there exists a very thin, ≤3 μm thick ferrite layer on some parts of the surface, Figure 7b-right). The measured maximum thicknesses of the decarburized layers after different annealing times are: Complete decarburization of 160 μm, including 80 μm of ferrite layer (ta = ½ h); complete decarburization is equal to the 3 μm thick ferrite layer (ta = 1 h); and complete decarburization of 280 μm, including the 70 μm of ferrite layer (ta = 2 h). The largest anomalies regarding the visible decarburization are found in this temperature range (the characteristic coarse-grained ferrite surface layer is the thickest after ta = ½ h, the decarburization is practically not visible after ta = 1 h, a large part of the surface is left non-decarburized even after ta = 2 h, and constant thicknesses of the partially decarburized layer are not observed; the results are therefore different to those in, e.g., [9]), but they can be explained by the kinetics of oxidation and decarburization and with different fitting of the oxide, which affects the kinetics of these processes. As mentioned before, in general, there is a tightly fitting oxide layer present on the surface of the samples after cooling, especially on the parts that were not decarburized, showing the effect of fitting of the oxide layer on the decarburization of the steel.
4.2.3. Annealing at Temperature T = 950 °C
When annealing at Ta = 950 °C (Ta > TG) in an oxidizing atmosphere the austenite with the carbon content Cγ = C0 = 0.43 wt % is depleted in terms of carbon in the surface area because of the oxidation of the carbon, which is explained in Section 2.1. The layer of completely decarburized austenite with the carbon content CγS = 0 forms on the surface, while the carbon content continuously increases towards the interior, until it reaches C0 = 0.43 wt %. The strongly decarburized surface austenite is transformed into a surface ferrite layer during the cooling in accordance with the Fe-Fe3C phase diagram. Under this layer there is a partially decarburized layer with an increasing content of pearlite towards the interior (Figure 8).
Lower magnifications showed that the surface is discontinuously decarburized even after ta = 2 h. Higher magnifications, meanwhile, showed that there is a very thin continuous ferrite layer in the “non-decarburized surface areas”, which becomes thicker with longer annealing times (ta = ½ h: ≈ 5 μm, ta = 1 h: ≈ 10 μm, ta = 2 h: ≈ 15 μm, left part of Figure 8a–c). This also applies to the more strongly decarburized areas (right-hand part of Figure 8a–c). The measured maximum thicknesses of the locally decarburized layers are: 200 μm, including a 40-μm-thick ferrite or 75-μm-thick predominantly ferrite layer (ta = ½ h); 260 μm, including a 60-μm-thick ferrite or 100-μm-thick predominantly ferrite layer (ta = 1 h); and 400 μm, including a 100-μm-thick ferrite or 150-μm-thick predominantly ferrite layer (ta = 2 h). The steel is, in general, not overheated under these annealing conditions, which is demonstrated by the small polygonal grains.
4.2.4. Annealing at Temperature T = 1100 °C
The austenite with the carbon content Cγ = C0 = 0.43 wt % is depleted in terms of carbon in the surface area because of the oxidation of carbon from the surface when annealing at Ta = 1100 °C (Ta > TG) in an oxidizing atmosphere. There are similar concentration gradients of carbon and the same phenomena exist in steel as when annealing at Ta = 950 °C, but the kinetics are faster because of the higher temperature.
The whole surface is decarburized and the decarburized layer is clearly visible (Figure 9). On the surface there is a predominantly ferrite layer. Under this predominantly ferrite layer, the ferrite content continuously decreases with depth, while a higher content of intergranular ferrite shows a more intense diffusion of carbon along the austenite grain boundaries. The steel is strongly overheated, which is shown by the coarse pearlite grains and by the coarse Widmanstätten ferrite microstructure of the partially decarburized layer. The measured maximum thicknesses of the decarburized layers are: 650 μm, including a 200-μm-thick predominantly ferrite layer (ta = ½ h); 1000 μm, including a 260-μm-thick predominantly ferrite layer (ta = 1 h); and 1400 μm, including a 300-μm-thick predominantly ferrite layer (ta = 2 h).
4.3. Theoretical Assessment of the Thickness of the Decarburized Layer
A theoretical discussion of the depth of the decarburization is not simple. During annealing in air the decarburization of steel is initiated by the general oxidation of the steel surface, because of the high partial pressure of oxygen. The reactions of oxidation and decarburization happen at the same time; therefore, the different effects on both processes intertwine, some proportionately and some inversely proportionately. As mentioned earlier, the decarburization is visible only if the oxidation of the steel surface is slower than its decarburization, i.e., when the oxidation of carbon and the carbon diffusion rate is greater than the oxidation rate). Visible decarburization depends on the oxidation potential of the annealing atmosphere, which also determines the degree of oxidation of the surface. This is the reason for the great differences in the visible decarburization that occurs when annealing in air or, e.g., in a mixture of N2 + 2% O2 [8]. Visible decarburization is always larger when annealing in atmospheres with a low oxygen content [8,10]. It is also affected by the fitting of the oxide layer to the steel surface (poor fitting of the oxide layer increases decarburization due to the reduction of the oxidation rate) and its permeability for the gases (non-permeable oxide layer reduces the decarburization), the carbon content in the steel, and the cooling rate after annealing, while different alloying elements affect the kinetics of oxidation and decarburization. With low cooling rates, when the steel is cooled in the furnace, decarburization also happens during the cooling, especially in the two-phase (α + γ) region where the surface ferrite layer thickens due to slower oxidation. Therefore, in reference to the isothermal annealing, the visible decarburization increases. Conversely, in hypo-eutectoid non-alloyed steels the whole visible decarburization decreases with faster cooling rates. This is a consequence of lowering and bringing closer together the Ar3 and Ar1 temperatures and with that the conditioned lower content of ferrite at the expense of an increased pearlite content [10,15]. At some point, for each steel characteristic, the critical cooling rate, the Ar3 and Ar1 temperatures become equal. At that point there is no more pro-eutectoid ferrite in the microstructure. If the cooling rate is, therefore, high enough for the partially decarburized layer, then the pro-eutectoid ferrite will no longer form in this layer as well and only pearlite will exist there. At even higher cooling rates there is a formation of bainite or martensite in the partially decarburized layer. The partially decarburized layer is not completely visible at higher cooling rates because of this and it might completely disappear at a high enough cooling rate, with only the completely decarburized surface layer left visible. Metallographically, the determined depth of decarburization is therefore always smaller than the actual depth, and the difference becomes larger with higher cooling rates after the annealing. In a metallographic analysis it is also necessary to consider the limited ability of the human eye to detect small differences in the ferrite and pearlite contents or globular cementite in the ferrite (sferoidizing state), which additionally reduces the assessed thickness of the decarburized layer and increases the observational error. More precise values of the depth of the decarburization are determined by microhardness measurements but these are still not as accurate as the actual depths measured using chemical analyses [20,21].
There are various models and equations available for calculating the decarburized layer. All are based on Fick’s 2nd law. The uncorrected and corrected Van-Ostrand-Dewey equation [5,6,8,22,23] is used for annealing temperatures Ta > TG, as well as a Fourier analysis [23]. The Van-Ostrand-Dewey equation is also used and corrected for creating a diffusion model of decarburization that is based on microhardness measurements [21]. For annealing temperatures Ta < TG the equations for the calculation of the completely decarburized surface ferrite layers are known [5,9,22,24]. Some equations also take into account the oxidation of the surface [6,9,16,22,24,25]. The thickness of the decarburized layer can also be calculated from the amount of released gaseous carbon oxides [5]. The equations are corrected in different ways or there are algorithms created in such a way that the calculated values for a selected carbon diffusion coefficient are close to the values obtained by the experiments (the possible reasons for discrepancies between the calculated and measured values are described in the previous paragraph). Any discrepancies are also the consequence of a chosen carbon diffusion coefficient in the austenite, which increases with a higher carbon content in the steel [1,2,26]. Because of the different ways of determining the carbon diffusion coefficient in austenite, there are many similar equations that give different values at the same temperature as a consequence of the different pre-exponential factors and activation energies [2,8,9,10,25,26,27,28]. We found that the highest values of the carbon diffusion coefficient in austenite DCγ are given by an equation from the literature [27], while the lowest values are given by an equation from the literature [28]:
In both equations, Ta is the absolute annealing temperature (K) and R is the gas constant (8.314 J/mol·K). The values that were calculated with other equations from other literature sources as well as diffusion coefficient values read from the diagrams in [1,26] lie in this range. The diffusion coefficients DCγ calculated from both equations for the used experimental temperatures are presented in Table 1.
Method of Calculating the Thickness of the Decarburized Layer
We assumed that only the decarburization of austenite takes place under all the annealing conditions (decarburization of the surface ferrite layer was disregarded because of the small concentration gradient, even though the process is controlled by the burning of carbon on the surface of the ferrite layer and by the diffusion of carbon through the ferrite layer). Therefore, we theoretically assessed the thickness of the decarburized layer using the Van-Ostrand-Dewey equation, which describes the decarburization of austenite in terms of the annealing temperature and time [6,29]:
where: Cx is the carbon content in the steel at a distance x from the surface, Cx ≤ C0 (wt %); C0 is the carbon content in the steel (wt %); DCγ is the diffusion coefficient of the carbon in the austenite at Ta temperature (cm2/s); ta is the annealing time at Ta temperature (s); and erf [u] is the Gauss error function [30].
When calculating the absolute depth of the decarburization, a distance x = xA is assumed, where the carbon content is equal to Cx = CxA = A × C0. A is the factor of decarburization and is equal to A = CxA/C0 ≤ 1 (because of the different assumed distances xA in literature, there are also different values reported for A, e.g., 0.85 [8], 0.90 [6], 0.925 [16,25] and 0.98 [23]). In the literature [16,25], it mentions that it is possible to theoretically assess the depth of the decarburization with a 97% accuracy at the depth xA = x0.925 with the carbon content CxA = A × C0 = 0.925C0, which is also supposed to be a limit value for the ability to determine the thickness of the decarburized layer by metallography. Equation (5) makes it possible to approach the calculated values with experimental measurements by the method of trial and error, and in this way determine the most appropriate diffusion coefficient of the carbon for a theoretical assessment of the depth of decarburization for concrete experimental conditions. From Equation (5) it follows that A = erf [xA/(2·)] and consequently from the table for erf [u], that xA/(2·) = B. From this equation the depth xA is calculated, at which there is a carbon content CxA after annealing:
where: DCγ is the diffusion coefficient of carbon (cm2/s) in austenite at the temperature Ta (K); ta is the annealing time (s) at Ta, where we can use 104 to the convert from cm to μm.
It was shown that the applicable equation in our case of decarburization is Equation (4) with the lowest values of the diffusion coefficient DCγ. The appropriateness of the lowest DCγ for the analysis of decarburization was already reported in [16,25], where the equation for decarburized austenite with the carbon content C = 0 was used for the calculation of DCγ, although it gives slightly higher values in comparison to Equation (4). The Equation (4) or DCγ values calculated with it are already included in all further derivatives of Equation (6). The calculations showed that the absolute depth of the decarburization for C45 steel with the carbon content C = 0.43 wt % for the used annealing temperatures in steady air is best given using the following derivatives of Equation (6):
As Equations (6)–(10) do not take the oxidation of the steel into consideration, the xA represents the absolute depth of the decarburization (xA = ), which is equal to the sum of thicknesses of the visible decarburization and the oxidized steel dm. The calculated theoretical visible thickness of the decarburization is therefore equal to:
If surface hardness is the decisive factor for a particular product, then it is appropriate for the steel to be decarburized, reducing the carbon content so that it still gives the lowest value of hardness on the surface based on the Jominy graph. How is a still-acceptable theoretical factor of decarburization A for a particular steel determined? The lowest acceptable theoretical value A, and with that a still-acceptable depth of decarburization xA is determined by transferring the lowest value of the hardness of the surface from the Jominy graph to the diagram for martensite hardness vs. carbon content (Figure 13 in [31]). Then a curve with the appropriate martensite content is chosen by taking into account the content of retained austenite in the microstructure, the carbon content in the steel for the selected hardness is read and, finally, a value for A is calculated. The hardness of the surface in the Jominy graph for C45 steel is 55–62 HRC and the carbon content is C = 0.42–0.50 wt % [19,32]. As a very low retained austenite content is typical for carbon steels, the curve corresponding to 99% martensite in the microstructure is chosen. The curve shows that at 99% martensite in the microstructure, 55 HRC is achieved with a carbon content C ≈ 0.38 wt % = CxA. Considering the hardness, this carbon content is the lowest acceptable theoretical carbon content for C45 steel. (The correctness of this approach is proven by the Jominy graph for C45 and C35 steels, which partially overlap [32]. The hardness of the surface in the Jominy graph of C35 steel is 48–58 HRC and carbon content is C = 0.32–0.39 wt %). Based on this, the lowest acceptable value for the factor of decarburization for C45 steel with the carbon content C = 0.43 wt % is A = CxA/C0 = 0.38/0.43 = 0.884. The depth x0.884 is calculated using Equation (6), adjusted to these circumstances:
where: Ta is the absolute annealing temperature (K), and ta is the annealing time (s) at the temperature Ta. By analogy with Equation (11), the theoretical visible depth 0.884 at the carbon content C ≈ 0.38 wt % from the outer steel surface of the sample towards the interior is:
The depth of the theoretically still-acceptable decarburization 0.884 for C45 steel with C0 = 0.43 wt % is therefore the minimum thickness required to be cut off after annealing in steady air, which should still ensure the lowest acceptable hardness of the surface of C45 steel after the correct quenching. The measured , and the theoretical decarburization depths , 0.884 are presented in Table 2, while the relations of the visible thicknesses of the decarburization related to the annealing time and temperature are graphically shown in Figure 10.
The time relationship for the maximum thickness of decarburization and the surface ferrite layer is parabolic (Figure 10a,b), while the temperature relation is exponential (Figure 10c). The results show the correspondence between the theoretical and experimental values for the maximum visible decarburization, which is also shown by the / ratio. The maximum visible depth of decarburization is greater at higher annealing temperatures and longer annealing times; however, this does not apply to the ferrite-only surface layer, as this layer is thinner at Ta = 850 °C and 950 °C than it is at 760 °C. This is a consequence of the faster oxidation at higher temperatures and of the incubation time required for the sufficient decarburization of the austenite (at Ta = 850 °C austenite must first decarburize to a carbon content CγG-S ≈ 0.13 wt % and only then will the surface ferrite layer begin to form during the annealing; at Ta = 950 °C austenite must first decarburize to a carbon content CγG-S < 0.02 wt % for the surface ferrite layer to start forming during cooling). At Ta = 850 °C a time anomaly is revealed with the thickest ferrite layer being present after ½ h of annealing. This is definitely a consequence of the process of oxidation overtaking the process of decarburization at longer annealing times and therefore “consuming” more of the decarburized surface layer (the rate of oxidation is equal to or higher than the rate of complete and partial decarburization after 1 h of annealing, while the speed of decarburization becomes higher than the speed of oxidation after longer annealing times, which is shown by the ferrite layer becoming visible on the surface again). Metallographically measured depths of the visible decarburization are larger than the lowest required 0.884 (carbon content C = 0.38 wt %) and are determined in a depth of carbon content C = 0.39–0.42 wt %. We have therefore metallographically assessed the depth of the visible decarburization with a carbon content of 0.91C0 to 0.98C0 in a ferrite-pearlite microstructure, which is similar to the findings in [16,25]. The results show the amount of surface material necessary to be cut off, so that the hardness of the surface of the C45 steel after quenching will still be acceptable. From Table 2, it is clear that the thickness of the measured ferrite or predominantly ferrite layer is substantially smaller than the 0.884 depth (except at Ta = 760 °C, which is described later), which confirms the validity of the calculations. If the strength and ductility of the product are more important, then the acceptable depth of decarburization (and therefore also factor A) can be smaller than 0.884 because of the lower strength and not-so-hard low carbon martensite will form in the decarburized surface zone after quenching. Both the ductility and the resistance to surface-crack initiation will increase as a consequence, while the strength of the structural component will not be decreased because of the very thin, lower strength surface layer [33].
Theoretically, the obtained values of the visible decarburization might be distinguished from the measured values only at Ta = 850 °C, ta = 1 h. Because there is practically no visible decarburization under these conditions, it means that the C45 steel could possibly be annealed in an air atmosphere at this temperature and for this long a time. In general, a large part of the surface remains visibly non decarburized also under other experimental annealing conditions (except at Ta = 760 °C, ta = 2 h and Ta = 1100 °C, ½ h ≤ ta ≤ 2 h, where a continuous completely decarburized surface layer is present). Similar results for a non-alloyed steel with C = 0.75 wt %, annealed in an air atmosphere at temperatures Ta = 800–1000 °C for ta = 3 h and 24 h are given in [4]. Here, it was found that there is no decarburization at the spots where the oxide tightly fits the surface and vice versa. The reasons for such a difference in states of the same surface should therefore be looked for in different fittings of the oxide layer (this is probably somewhat affected by the different rate of oxidation for the individual segments of the surface or of different surfaces; vertical and rounded surfaces oxidize differently than the horizontal ones) and with that connected local cracking of the oxide layer, which is certainly also a consequence of the segregations in steel. The effect of segregations is not shown only in non-decarburized and decarburized segments of the same surface, but also in the decarburized surface layer itself. This is most evident in the samples annealed at Ta = 950 °C for ta = ½ and 2 h (Figure 8), where segregations are visible as an inserted thin pearlite layer in a completely ferrite surface layer (it is also possible that these kinds of carbon segregations in the surface layer occur during the process of decarburization or even during the cooling of the decarburized austenite).
The visible decarburized layer is equal to the completely decarburized ferrite layer at the annealing temperature Ta = 760 °C (under the latter there is no partially decarburized layer as the surface ferrite layer borders directly on the non-decarburized steel) because of the decarburization in the two-phase equilibrium state (α + γ). The 0.884 depth is irrelevant at this temperature because the 0.884 values are located in the ferrite layer, as seen in Table 2. This means that the theoretical model used in practice in this annealing region must always provide a positive deviation from the measured values. If this is not the case, then there will be a remainder of completely decarburized surface ferrite areas left, even after machining the surface, which will consequently cause a soft surface even after quenching. It was found that the absolute depth x0.976 with B ≈ 1.6 is appropriate and it is calculated using Equation (6):
where: ta is the annealing time (s) at the annealing temperature Ta (K). Using an analogy with Equations (11) and (13), the value for 0.976 is calculated with the equation:
The calculated values x0.976 and 0.976 are given in Table 2. A larger positive deviation of the calculated values from the measured ones is present only at the annealing time ta = ½ h. Under these conditions there is a very local surface-decarburized ferrite layer, which is dimensionally almost identical to the bands of non-transformed ferrite in the rest of the volume of the steel. The process of oxidation apparently runs faster than the decarburization or slows it down, which shows the acceptability of annealing in air also for the production of dual-phase steel (ferrite + martensite).
The theoretical model can positively or negatively deviate from the measured values at Ta > AC3 because of the presence of a partially decarburized layer. If the theoretical values show a positive deviation from the measured ones ( > ), then this guarantees that the maximum hardness values based on the Jominy graphs have been achieved. In the case of a negative deviation, the theoretical values must fulfil the condition > 0.884 for C45 steel based on the required minimum hardness. If strength and ductility are more important, then < 0.884 is also good, but there must be no completely ferrite or predominantly ferrite surface layer present after machining of the surface; therefore, the > condition must always be met. A surface layer of ferrite is therefore always forbidden.
5. Conclusions
The hypo-eutectoid carbon steel C45 with a carbon content C = 0.43 wt % and with an initial ferrite-pearlite microstructure, having a grinded, non-oxidised surface, was isothermally annealed in steady air at temperatures T > AC1 in three temperature regions (AC1 < Ta < AC3, AC3 < Ta < TG in Ta > TG) and times ta = ½, 1, 2 h. On the basis of the experimental and theoretical results, we can conclude the following for pieces with a mass m ≤ 180 g:
- The oxidation, the maximum visible decarburization of the surface and the completely decarburized ferrite layer grow with longer annealing times in accordance with the parabolic law of growth. The thickness of the decarburized layer increases exponentially with higher temperatures. The reasons for some global and local discrepancies in practice (total absence of decarburization, thinner completely decarburized ferrite surface layer at higher temperatures, locally limited decarburization) must be searched for in the ratio of the rates of oxidation and decarburization, the different fittinsg of the oxide layer on the steel surface, the local peeling off and cracking of the oxide layer and with that the associated different rates of oxidation for the individual local segments, the effect of segregations on the kinetics of oxidation and decarburization, the effect of segregations on the local peeling off, and the cracking of the oxide layer.
- Under the annealing conditions Ta = 850 °C, ta = 1 h there is no visible decarburization. This means that under these conditions, the oxidation of the surface of C45 steel that was grinded prior to annealing is faster than the decarburization and that normalization and annealing for quenching can be performed in an air atmosphere. Because of the very locally limited minimal decarburization at Ta = 760 °C, ta = ½ h it is acceptable to also perform annealing for a dual-phase (ferrite + martensite) microstructure in an air atmosphere under these conditions. Under all other annealing conditions, it is necessary to introduce measures for the prevention of decarburization or to take into account the addition of thickness prior to the annealing, which is the sum of the thicknesses of both the oxidized layer and the visible decarburized layer.
- A completely ferrite surface layer without a partially decarburized layer exists only in the samples that were annealed at Ta = 760 °C (AC1 < Ta < AC3) in a dual-phase region (α + γ). This is a consequence of the specific course of the austenite decarburization at the inner boundary of the ferrite layer in conditions of constant and time-independent thermodynamic equilibrium between the ferrite and austenite grains in the whole volume of an annealed piece. These conditions do not allow the partial decarburization towards the interior to occur, as is the case with pieces annealed at Ta > AC3.
- A continuous, visible, decarburized ferrite layer forms only under the annealing conditions Ta = 760 °C, ta > 1 h, while at Ta = 1100 °C, ½ h ≤ ta ≤ 2 h (steel is very overheated here) there is a partially decarburized layer spread towards the interior under the continuous surface ferrite layer. Under all other annealing conditions there are only local decarburized surface layers in which there is, besides a partial decarburization, also a thin superficial, completely ferrite layer observed. This layer forms already during the annealing at the annealing temperatures AC1 < Ta < TG, while at Ta > TG it only forms later, during the cooling of the completely decarburized austenite. The thickest strongly decarburized surface layer is formed at Ta = 1100 °C, which is a consequence of the high temperatures and their effect on the oxidation and decarburization of the steel surface.
- Even though the Van-Ostrand-Dewey equation was developed for the decarburization of austenite (Ta > TG), the results show that it can be used, at least in certain time periods, for all annealing temperatures Ta > AC1, which widens the temperature region of its use considerably.
- With the method of trial and error, the Van-Ostrand-Dewey equation enables the adjustment of calculated values with experimental measurements and an assessment of the accuracy of the measurements for different experimental techniques. The metallographically and theoretically measured depths of decarburization with a carbon content of 0.91C0 to 0.98C0 in a ferrite-pearlite microstructure, formed during cooling in steady air, can be adjusted, in general, with a 93% to 98% accuracy.
- The most suitable equation for calculating the diffusion coefficient of carbon in austenite for the researched experimental state is also determined by the Van-Ostrand-Dewey equation. Because of the completely decarburized austenite in the surface layer, the equation that gives the lowest values for the diffusion coefficient of carbon in austenite at annealing temperatures Ta (K) is appropriate: (cm2/s); R = 8.314 J/mol·K.
- The equations used to calculate the thickness of oxidized steel dm and the absolute depth of the decarburization xA can also be used to precisely theoretically determine the visible decarburization of the C45 steel with a difference of both quantities = xA − dm. This shows that the equation for growth of the oxide layer dox on iron, from which the thickness of the oxidized iron dm is calculated, also describes the oxidation of non-alloyed steel in steady air relatively well, even though the literature stated a slower oxidation of non-alloyed steel in comparison with iron.
- Most types of annealing take place at temperatures T > AC3; therefore, the addition of thickness, which has to be more than the absolute depth of the decarburization x0.884, must be taken into account before annealing in steady air for C45 steel with C = 0.43 wt % to achieve the required hardness. In the case of the annealing conditions at which visible decarburization does not exist, the additional thickness only has to be greater than the calculated thickness of the oxidized steel dm. When annealing for the production of dual-phase steel under the annealing conditions Ta = 760 °C, ta ≥ 1 h, it is necessary to ensure the addition of thickness in the size of the absolute depth of decarburization xA = x0.976, because of the removal of the surface ferrite layer.
Author Contributions
M.Z. carried out the literature review, performed the experiments, made the measurements, analysed the data and constructed the diagrams. B.Z. defined the research program, carried out the metallography, analysed the results and wrote the paper. A.N. optimized the research program, improved the idea for the paper, analysed the data and revised the paper. J.B. analysed the data and revised the paper. The annealing furnace is owned by B.K. was responsible for controlling and measuring the temperature.
Conflicts of Interest
The authors declare no conflict of interest.
References
- Leslie, W.C. The Physical Metallurgy of Steels; McGraw-Hill Inc.: London, UK, 1982; pp. 74–81. ISBN 0-07-066385-8. [Google Scholar]
- De Cooman, B.C.; Speer, J.G. Fundamentals of Steel Product Physical Metallurgy; AIST: Warrendale, PA, USA, 2011; pp. 61–64, 37–42. [Google Scholar]
- Billings, G.A. Oxidation and Decarburization Kinetics of Iron-Carbon Alloys in Carbon Dioxide-Carbon Monoxide Atmosphere. Master’s Thesis, McMaster University, Hamilton, ON, Canada, 1966. [Google Scholar]
- Marston, H.F.; Rose, A.J.; Abbot, R.E.; Bugdol, M.; Richardson, W. Oxidation and Decarburization of High Carbon Steels; Final Report; European Commission, Directorate-General Science, Research and Development: Luxembourg, 1998; pp. 14, 15, 52, 53, 65, 66. ISBN 92-828-4548-6. [Google Scholar]
- Mardon, C. The Austenitization and Decarburization of High Silicon Spring Steel. Ph.D. Thesis, University of Canterbury, Christchurch, New Zealand, 1998. [Google Scholar]
- Mayott, S.W. Analysis of the Effect of Reduced Oxygen Atmospheres on the Decarburization Depth of 300M Alloy Steel. Master’s Thesis, Rensselaer Polytechnic Institute, Department of Materials Science and Engineering, New York, NY, USA, 2010. [Google Scholar]
- Zhang, C.L.; Zhou, L.Y.; Liu, Y.Z. Surface decarburization characteristics and relation decarburized types and heating temperature of spring steel 60Si2MnA. Int. J. Miner. Metall. Mater. 2013, 20, 720–724. [Google Scholar] [CrossRef]
- Liu, Y.; Zhang, W.; Tong, Q.; Wang, L. Effects of Temperature and Oxygen Concentration on the Characteristics of Decarburization of 55SiCr Spring Steel. ISIJ Int. 2014, 54, 1920–1926. [Google Scholar] [CrossRef] [Green Version]
- Zhao, F.; Zhang, C.L.; Liu, Y.Z. Ferrite decarburization of high silicon spring steel in three temperature ranges. Arch. Metall. Mater. 2016, 61, 1715–1722. [Google Scholar] [CrossRef]
- Schumann, H. Metallographie; 12. Auflage; VEB-DVG: Leipzig, Germany, 1983; pp. 316–321, 368, 150–152. ISBN 3-342-00009-0. [Google Scholar]
- Zorc, M. Decarburization of Non-Alloy Medium Carbon Steel during Annealing in an Air Atmosphere. Bachelor’s Thesis, University of Ljubljana, Faculty of Natural Sciences and Engineering-Department of Materials and Metallurgy, Ljubljana, Slovenia, 2016. [Google Scholar]
- Hasegava, M. Ellingham Diagram. In Treatise on Process Metallurgy-Vol. 1: Process Fundamentals; Seetharaman, S., Ed.; Elsevier: Oxford, UK, 2013; pp. 507–516. ISBN 9870080969862. [Google Scholar]
- Vodopivec, F. Kovine in Zlitine (Metals and Alloys, in Slovenian); Inštitut za Kovinske Materiale in Tehnologijo: Ljubljana, Slovenia, 2002; pp. 159–164. ISBN 961-238-084-8. [Google Scholar]
- Chen, R.Y.; Yuen, W.Y.D. Review of the High-Temperature Oxidation of Iron and Carbon Steels in Air or Oxigen. Oxid. Met. 2003, 59, 433–468. [Google Scholar] [CrossRef]
- Kveder, A. (Ed.) Metalurški Priročnik (Handbook of Metallurgy, in Slovenian); Tehniška Založba Slovenije: Ljubljana, Slovenia, 1972; pp. 232, 233, 759. [Google Scholar]
- Liščić, B. Steel Heat Treatment. In Steel Heat Treatment Handbook, 2nd ed.; Totten, G.E., Ed.; CRC Press-Taylor & Francis Group: Boca Raton, FL, USA, 2007; pp. 277–414. ISBN 987-0-8493-8455-4. [Google Scholar]
- Gontarev, V. Teorija Metalurških Procesov (Theory of Metallurgical Processes, in Slovenian); Univerza v Ljubljani, NTF-Oddelek Za Materiale in Metalurgijo: Ljubljana, Slovenia, 2005; pp. 27–32. ISBN 961-6047-30-2. [Google Scholar]
- Naumann, F.K. Das Buch der Schadensfälle; Dr. Riederer-Verlag GmbH: Stuttgart, Germany, 1976; p. 181. [Google Scholar]
- Rose, A.; Peter, W.; Strassburg, W.; Rademacher, L. Atlas zur Wärmebehandlung der Stähle-Teil II; Verlag Stahleisen M.B.H.: Düsseldorf, Germany, 1961; p. II-101A. [Google Scholar]
- Vander Voort, G.F. Understanding and Measuring Decarburization. Adv. Mat. Process. 2015, 173, 22–27. [Google Scholar]
- Gegner, J. Diffusion Modelling of Decarburization Microhardness-Distance Profiles. Available online: https://www.ariel.ac.il/sites/conf/mmt/MMT-2006/Service_files/papers/Session_1/1-168_di.pdf (accessed on 28 April 2017).
- Choi, S.; van der Zwaag, S. Prediction of Decarburized Ferrite Depth of Hypoeutectoid Steel with Simultaneous Oxidation. ISIJ Int. 2012, 52, 549–558. [Google Scholar] [CrossRef] [Green Version]
- Cioffi, R.D. A Comparison Study on Depth of Decarburization and the Role of Stable Carbide Forming Elements in 1075 Plain Carbon Steel and 440A Stainless Steel; Rensselaer Polytechnic Institute, Department of Materials Science and Engineering: New York, NY, USA, 2012. [Google Scholar]
- Choi, S.; Lee, Y. An Approach to predict the Depth of the Decarburized Ferrite Layer of Spring Steel Based on Measured Temperature History of material during Cooling. ISIJ Int. 2014, 54, 1682–1689. [Google Scholar] [CrossRef]
- Birks, N. Mechanism of decarburization. In Decarburization; ISI Publication 133; The Iron and Steel Institute: London, UK, 1970; pp. 1–12. ISBN 0900497165. [Google Scholar]
- Wells, C.; Batz, W.; Mehl, R.F. Diffusion Coefficient of Carbon in Austenite. J. Met. 1950, 188, 553–560. [Google Scholar] [CrossRef]
- Bhadeshia, H.K.D.H.; Honeycombe, R.W.K. Steels Microstructure and Properties, 3rd ed.; Elsevier: Oxford, UK, 2006; pp. 11–12. ISBN 978-0-750-68084-4. [Google Scholar]
- Callister, W.D., Jr. Material Science and Engineering-An Introduction, 7th ed.; John Wiley & Sons, Inc.: New York, NY, USA, 2007; p. 119. ISBN 978-0-471-73696-7. [Google Scholar]
- Porter, D.A.; Easterling, K.E. Phase Transformations in Metals and Alloys, 2nd ed.; Chapman & Hall: London, UK, 1992; pp. 7, 74. ISBN 0-412-450030-5. [Google Scholar]
- Error Function Table. ECE 3610 Engineering Probability & Statistics. Available online: https://www.geophysik.uni-muenchen.de/Members/mohr/materials/ComputationalGeophysics2017/?searchterm=Function%20Table (accessed on 16 May 2017).
- Ericsson, T. Principles of Heat Treating of Steels. In ASM Handbook-Vol. 4: Heat Treating; Lampman, S.R., Zorc, T.B., Eds.; ASM International®: Materials Park, OH, USA, 2009; pp. 3–19. ISBN 978-0-87170-379-8. [Google Scholar]
- CEN Brussels, B. Standard EN 10083-2/2006: Steels for Quenching and Tempering—Part 2: Technical Delivery Conditions for Non Alloy Steels. ICS 77.140.10. 2006. [Google Scholar]
- Jaason, K.; Peetsalu, P.; Saarna, M.; Kulu, P.; Beilmann, J. Decarburisation Effect on Hardened Strip Steel Fastening Components. Mat. Sci. 2016, 22, 148–152. [Google Scholar] [CrossRef]
Figure 1.
Surface decarburization of non-alloyed hypo-eutectoid steel during isothermal annealing at T > AC1; (a) Change in the microstructure; (b–d) concentration profiles of the carbon during the isothermal annealing for the different temperature ranges.
Figure 1.
Surface decarburization of non-alloyed hypo-eutectoid steel during isothermal annealing at T > AC1; (a) Change in the microstructure; (b–d) concentration profiles of the carbon during the isothermal annealing for the different temperature ranges.

Figure 2.
Oxidation of non-alloyed steel. (a) Richardson-Jeffes diagram of oxidation reactions during the annealing of a non-alloyed steel in air, arranged according to [6,12]; (b) the mechanism of formation of the surface three-layered oxide, arranged according to [15,16].

Figure 3.
Oxidation of iron during the annealing in air (our experimental conditions). (a) Calculated thickness of the oxide layer dox, (b) calculated thickness of the oxidized iron dm.
Figure 3.
Oxidation of iron during the annealing in air (our experimental conditions). (a) Calculated thickness of the oxide layer dox, (b) calculated thickness of the oxidized iron dm.

Figure 4.
Equilibrium for gas mixtures (CO + CO2) in the C-O system for the reactions of decarburization or carburization at pressure p = 1 atm; arranged according to [15,17].

Figure 5.
Surface of the sample after one hour of annealing at Ta = 1100 °C and cooling in air.

Figure 6.
Microstructure of the surface part of C45 steel after annealing at Ta = 760 °C. (a) ta = ½ h, (b) ta = 1 h, (c) ta = 2 h.
Figure 6.
Microstructure of the surface part of C45 steel after annealing at Ta = 760 °C. (a) ta = ½ h, (b) ta = 1 h, (c) ta = 2 h.

Figure 7.
Microstructure of the surface part of C45 steel after annealing at Ta = 850 °C. (a) ta = ½ h, (b) ta = 1 h, (c) ta = 2 h.
Figure 7.
Microstructure of the surface part of C45 steel after annealing at Ta = 850 °C. (a) ta = ½ h, (b) ta = 1 h, (c) ta = 2 h.

Figure 8.
Microstructure of the surface part of C45 steel after annealing at Ta = 950 °C. (a) ta = ½ h, (b) ta = 1 h, (c) ta = 2 h.
Figure 8.
Microstructure of the surface part of C45 steel after annealing at Ta = 950 °C. (a) ta = ½ h, (b) ta = 1 h, (c) ta = 2 h.

Figure 9.
Microstructure of the surface part of C45 steel after annealing at Ta = 1100 °C. (a) ta = ½ h, (b) ta = 1 h, (c) ta = 2 h.
Figure 9.
Microstructure of the surface part of C45 steel after annealing at Ta = 1100 °C. (a) ta = ½ h, (b) ta = 1 h, (c) ta = 2 h.

Figure 10.
Visible thickness of decarburization for steel with C = 0.43 wt %. (a) Maximum thicknesses related to annealing time, (b) maximum thicknesses of surface ferrite layer related to annealing time, (c) maximum thicknesses related to temperature.
Figure 10.
Visible thickness of decarburization for steel with C = 0.43 wt %. (a) Maximum thicknesses related to annealing time, (b) maximum thicknesses of surface ferrite layer related to annealing time, (c) maximum thicknesses related to temperature.


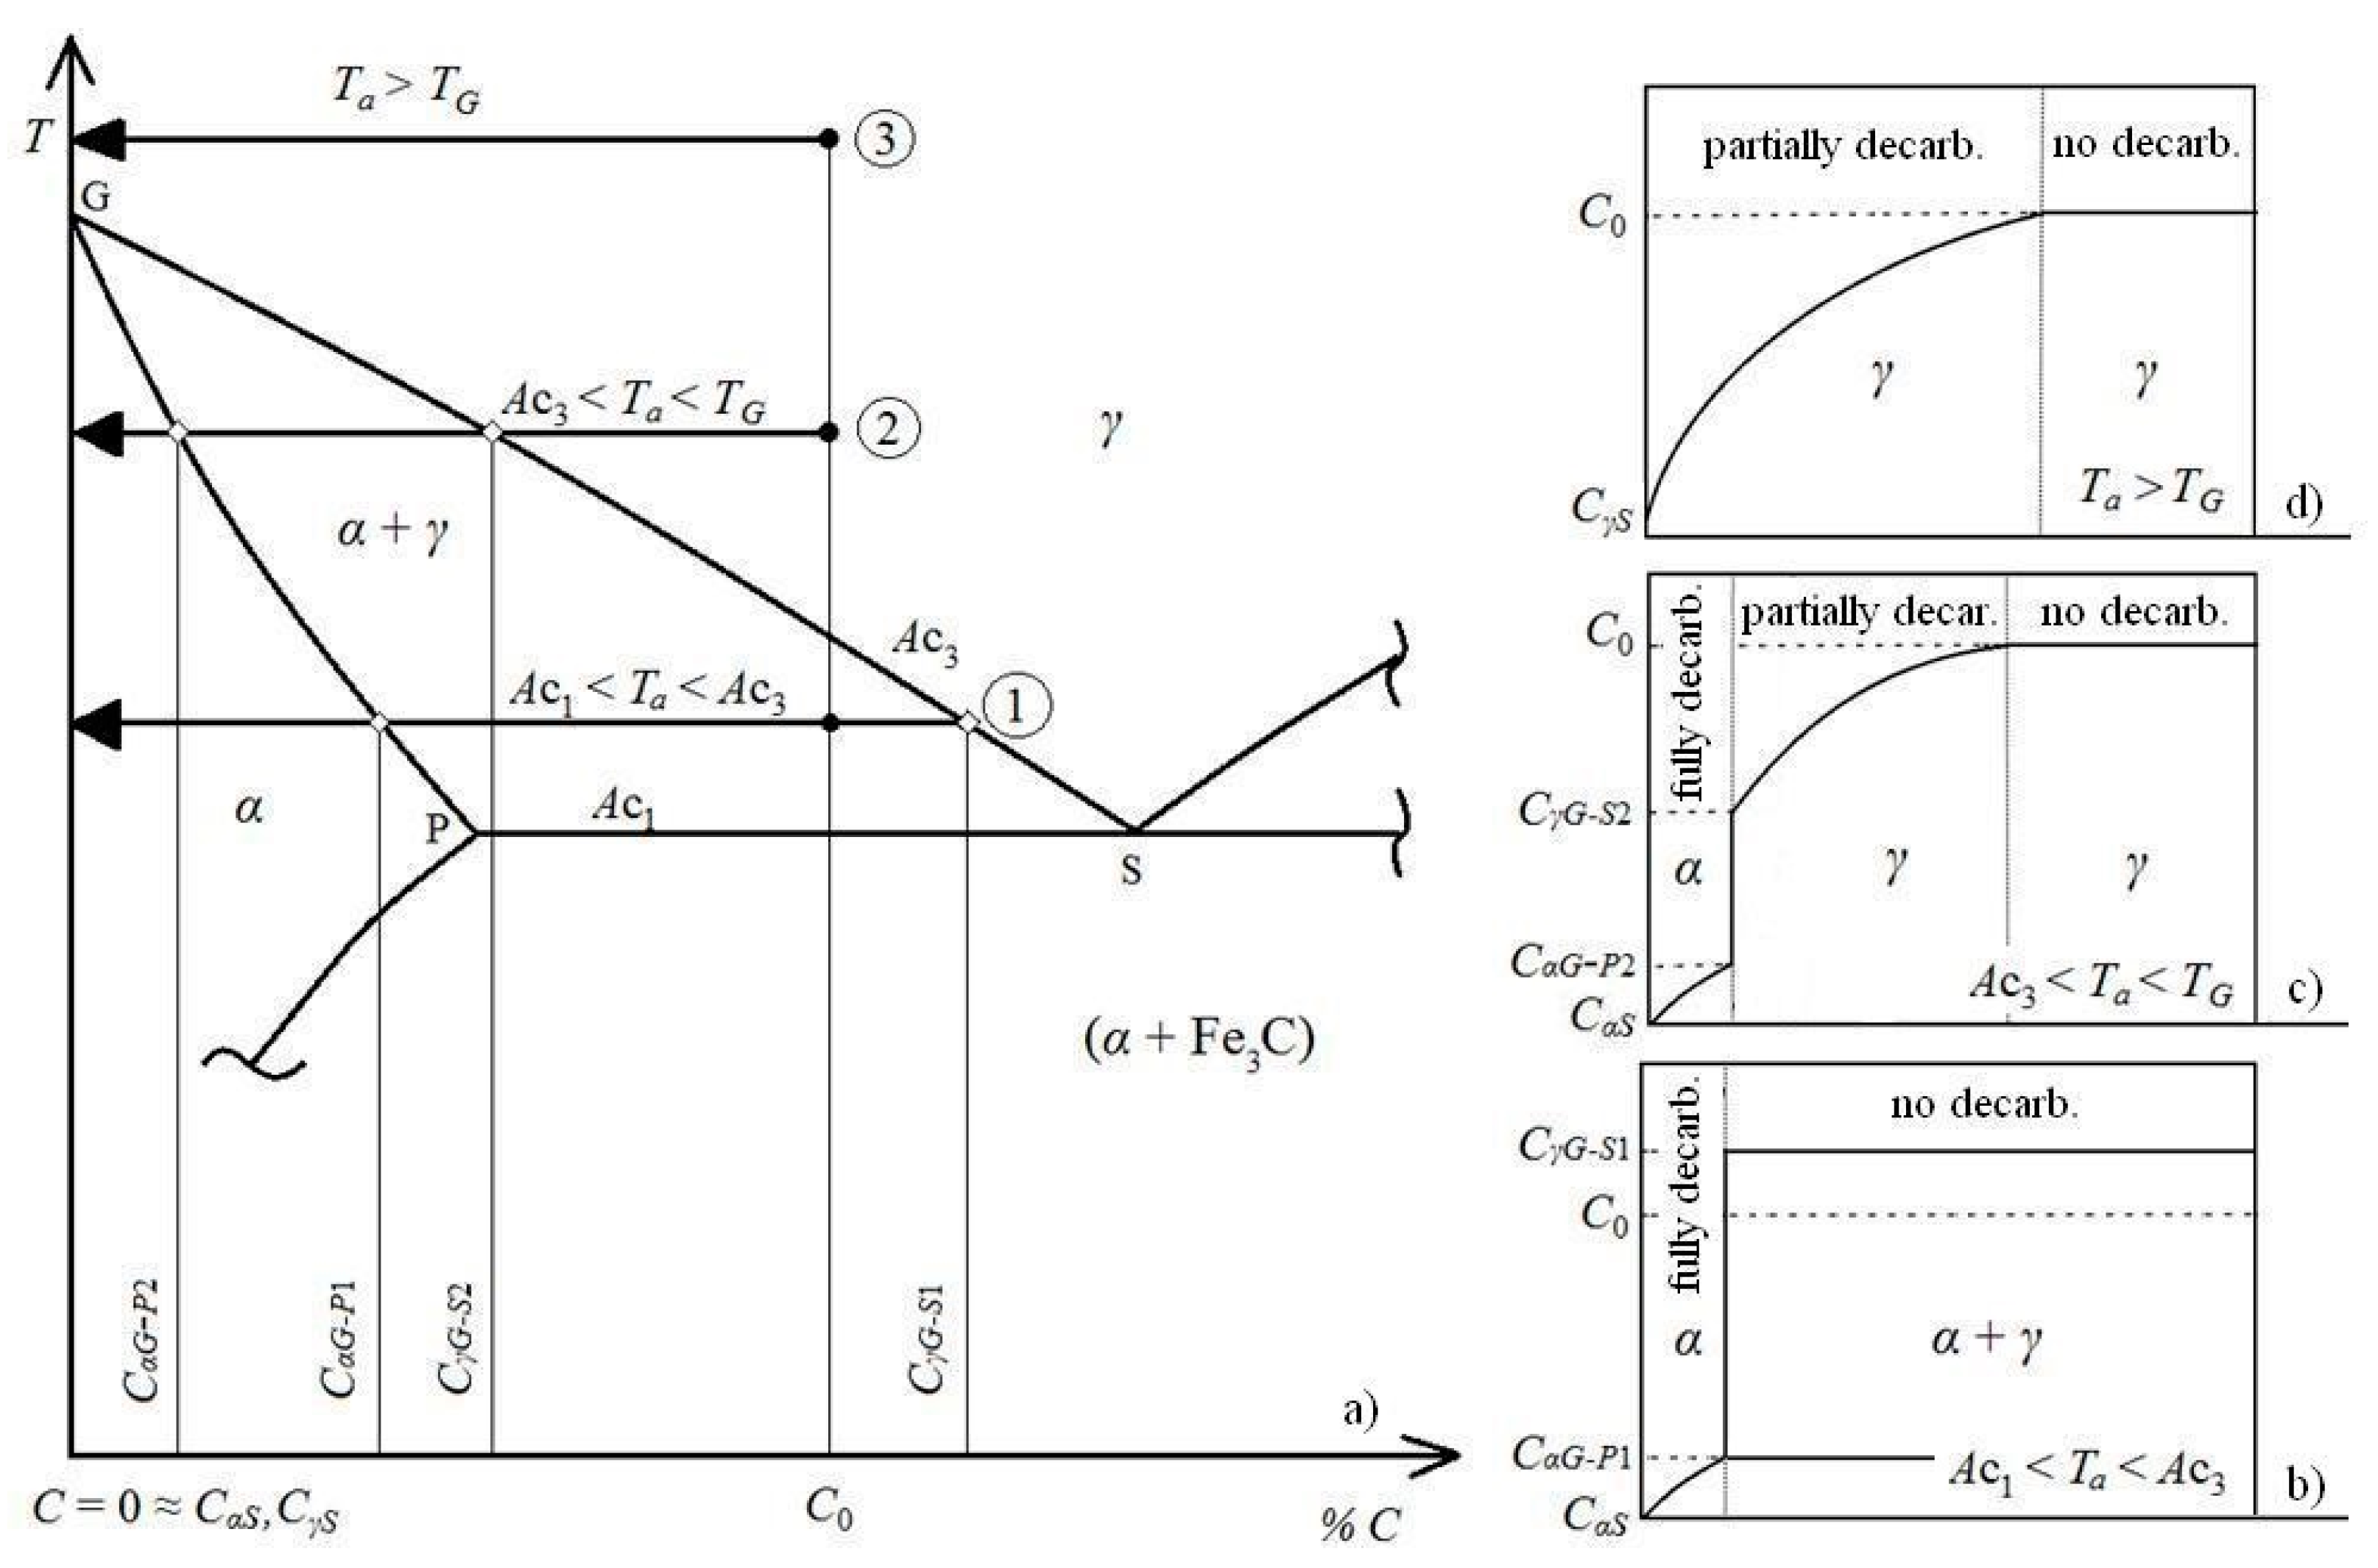
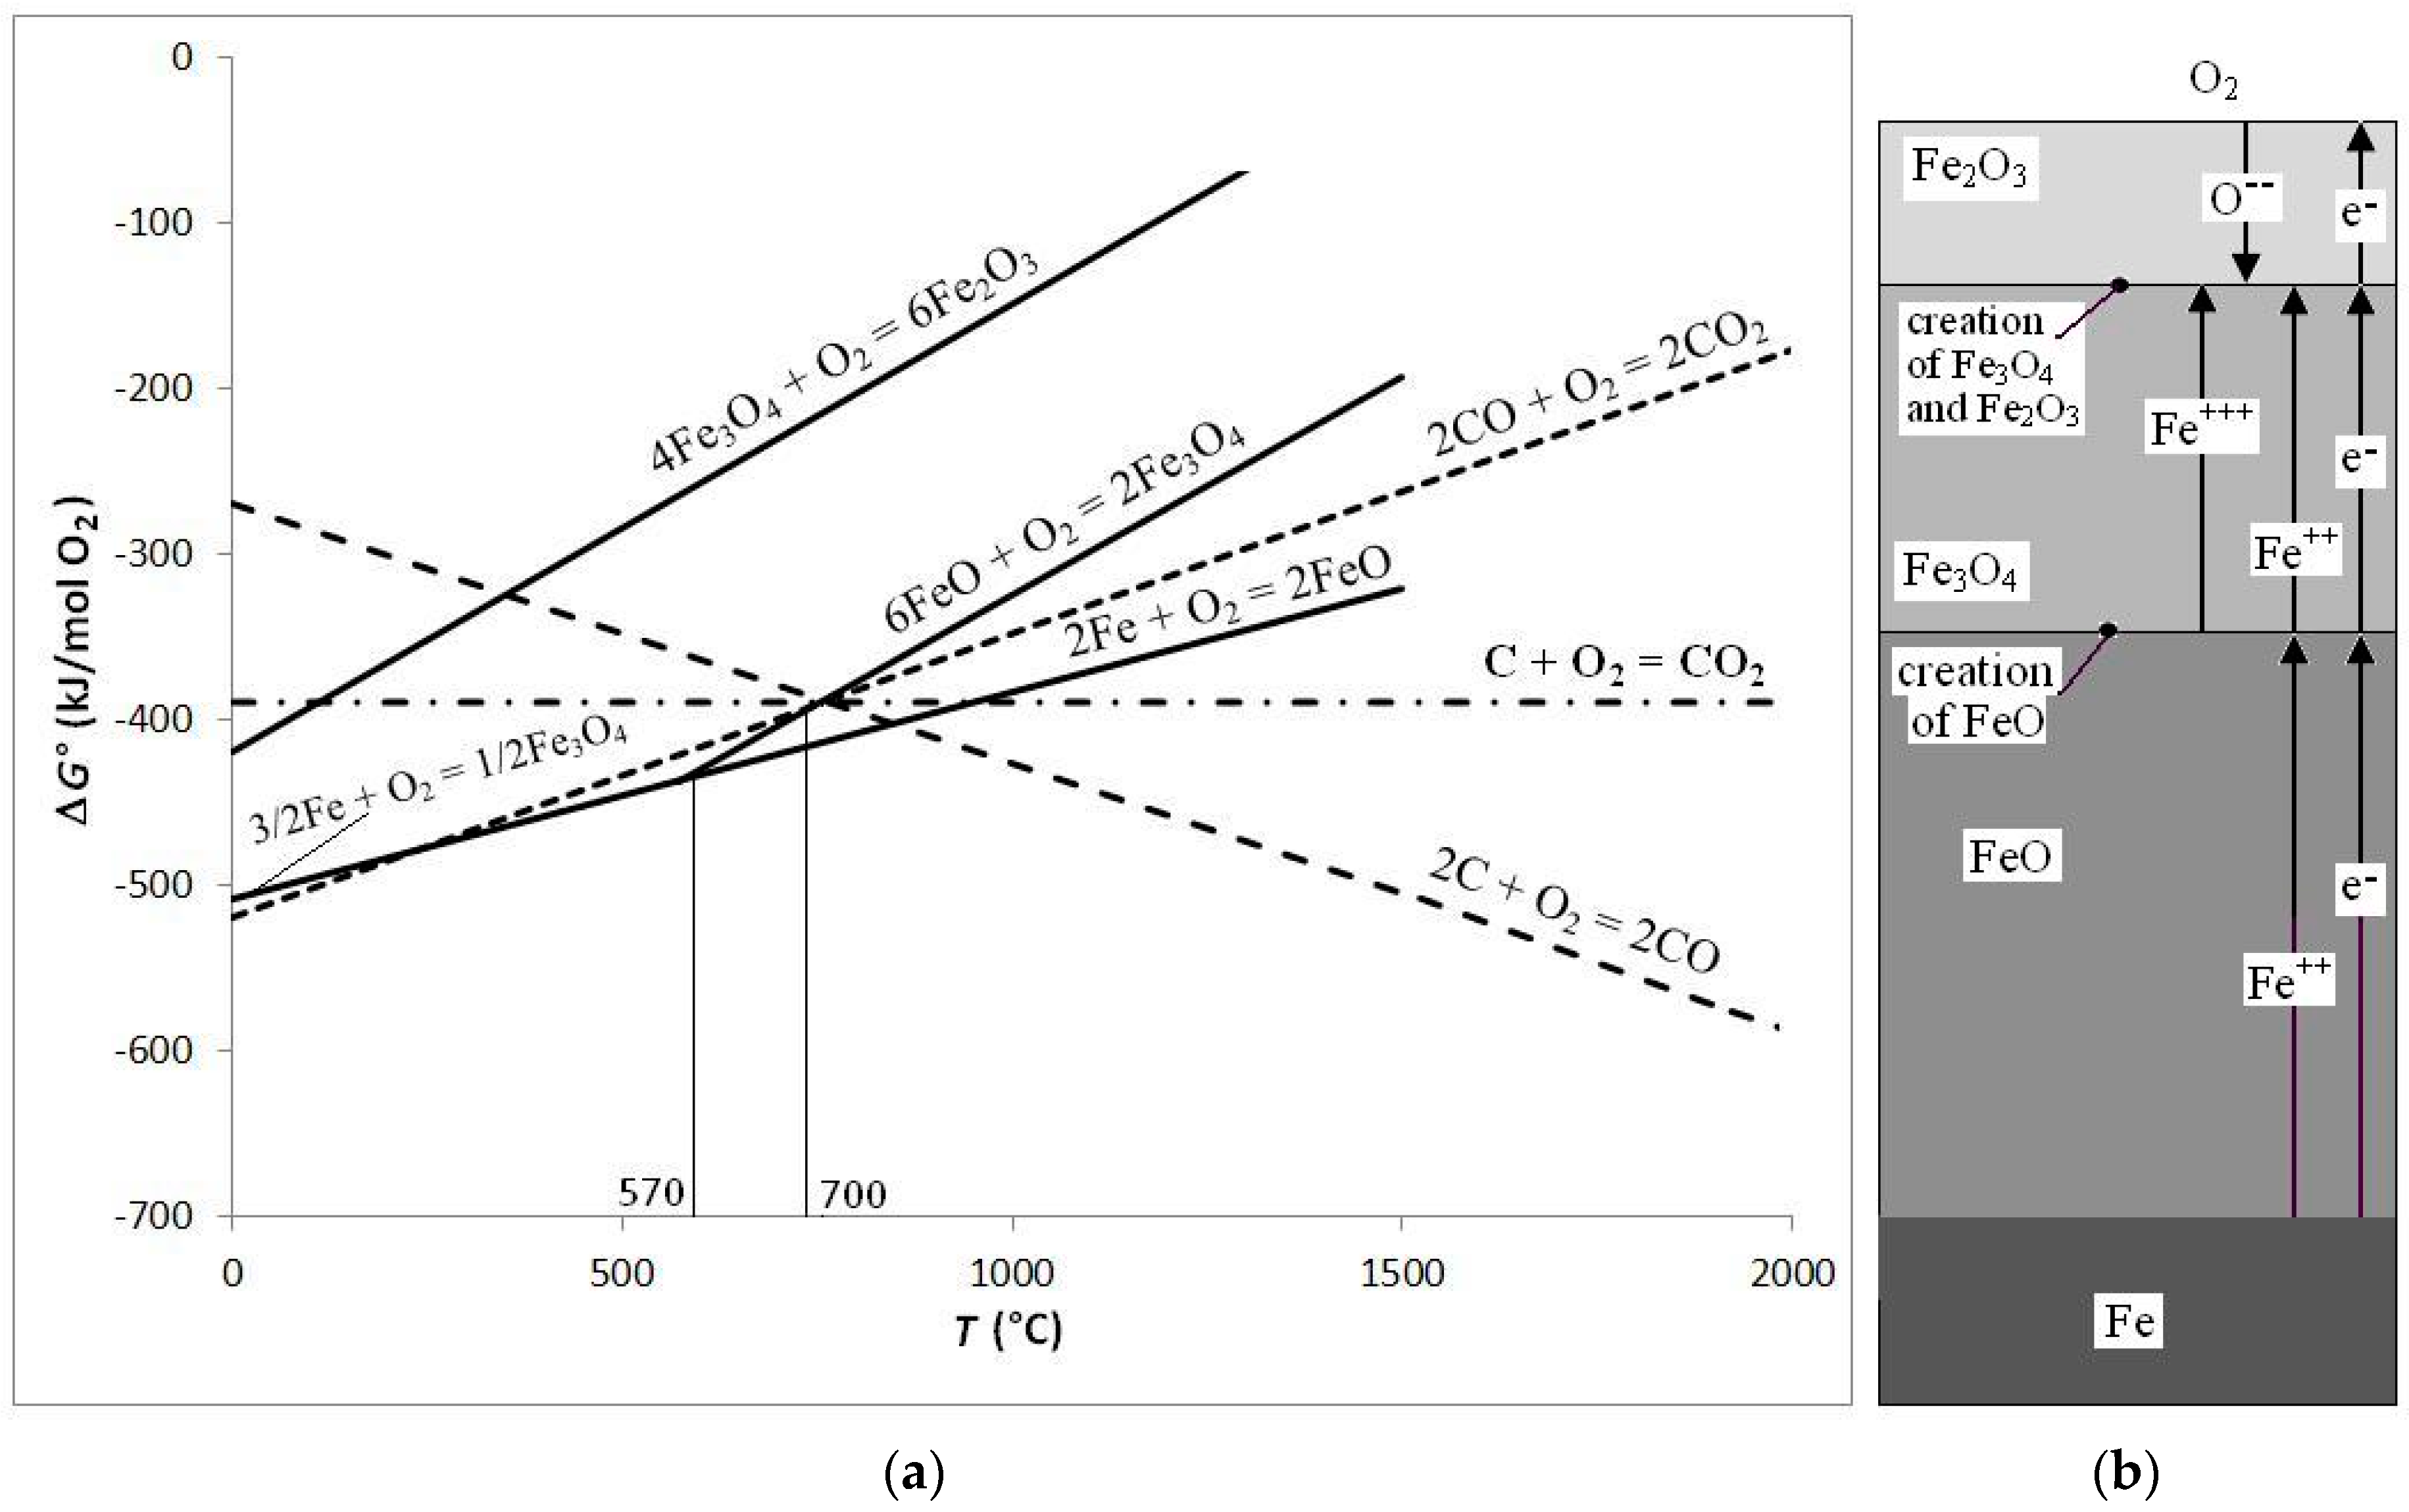
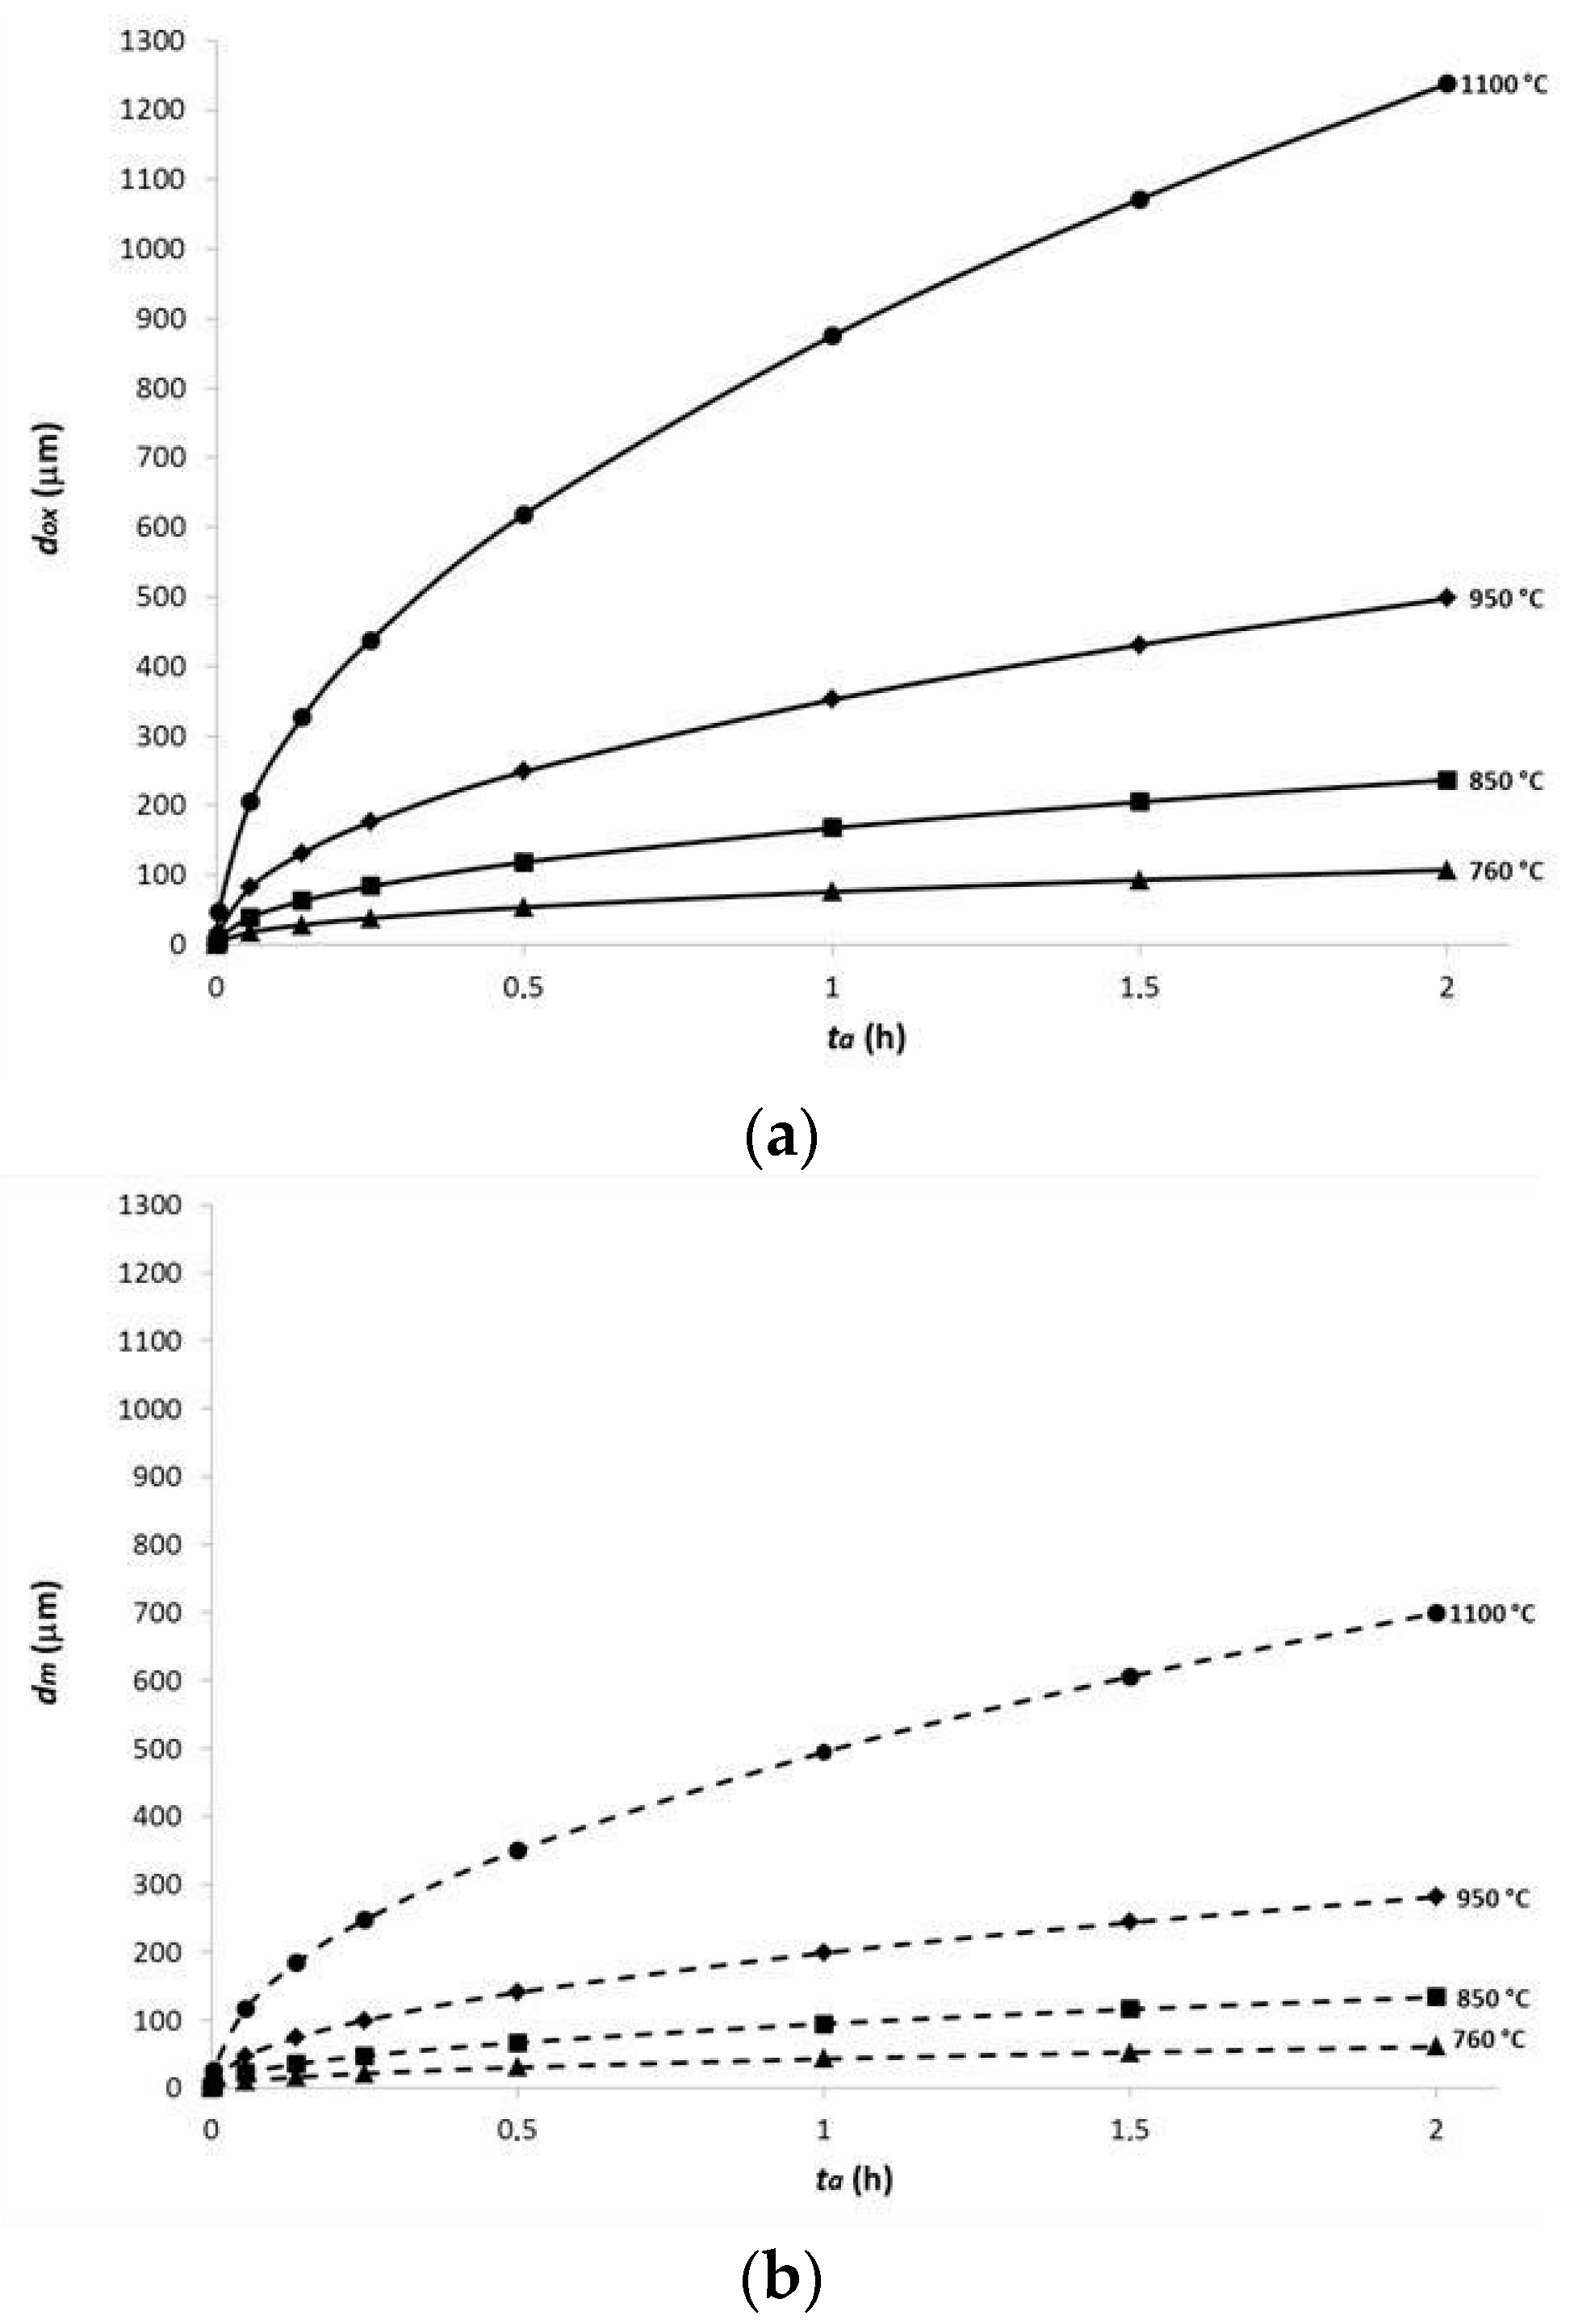
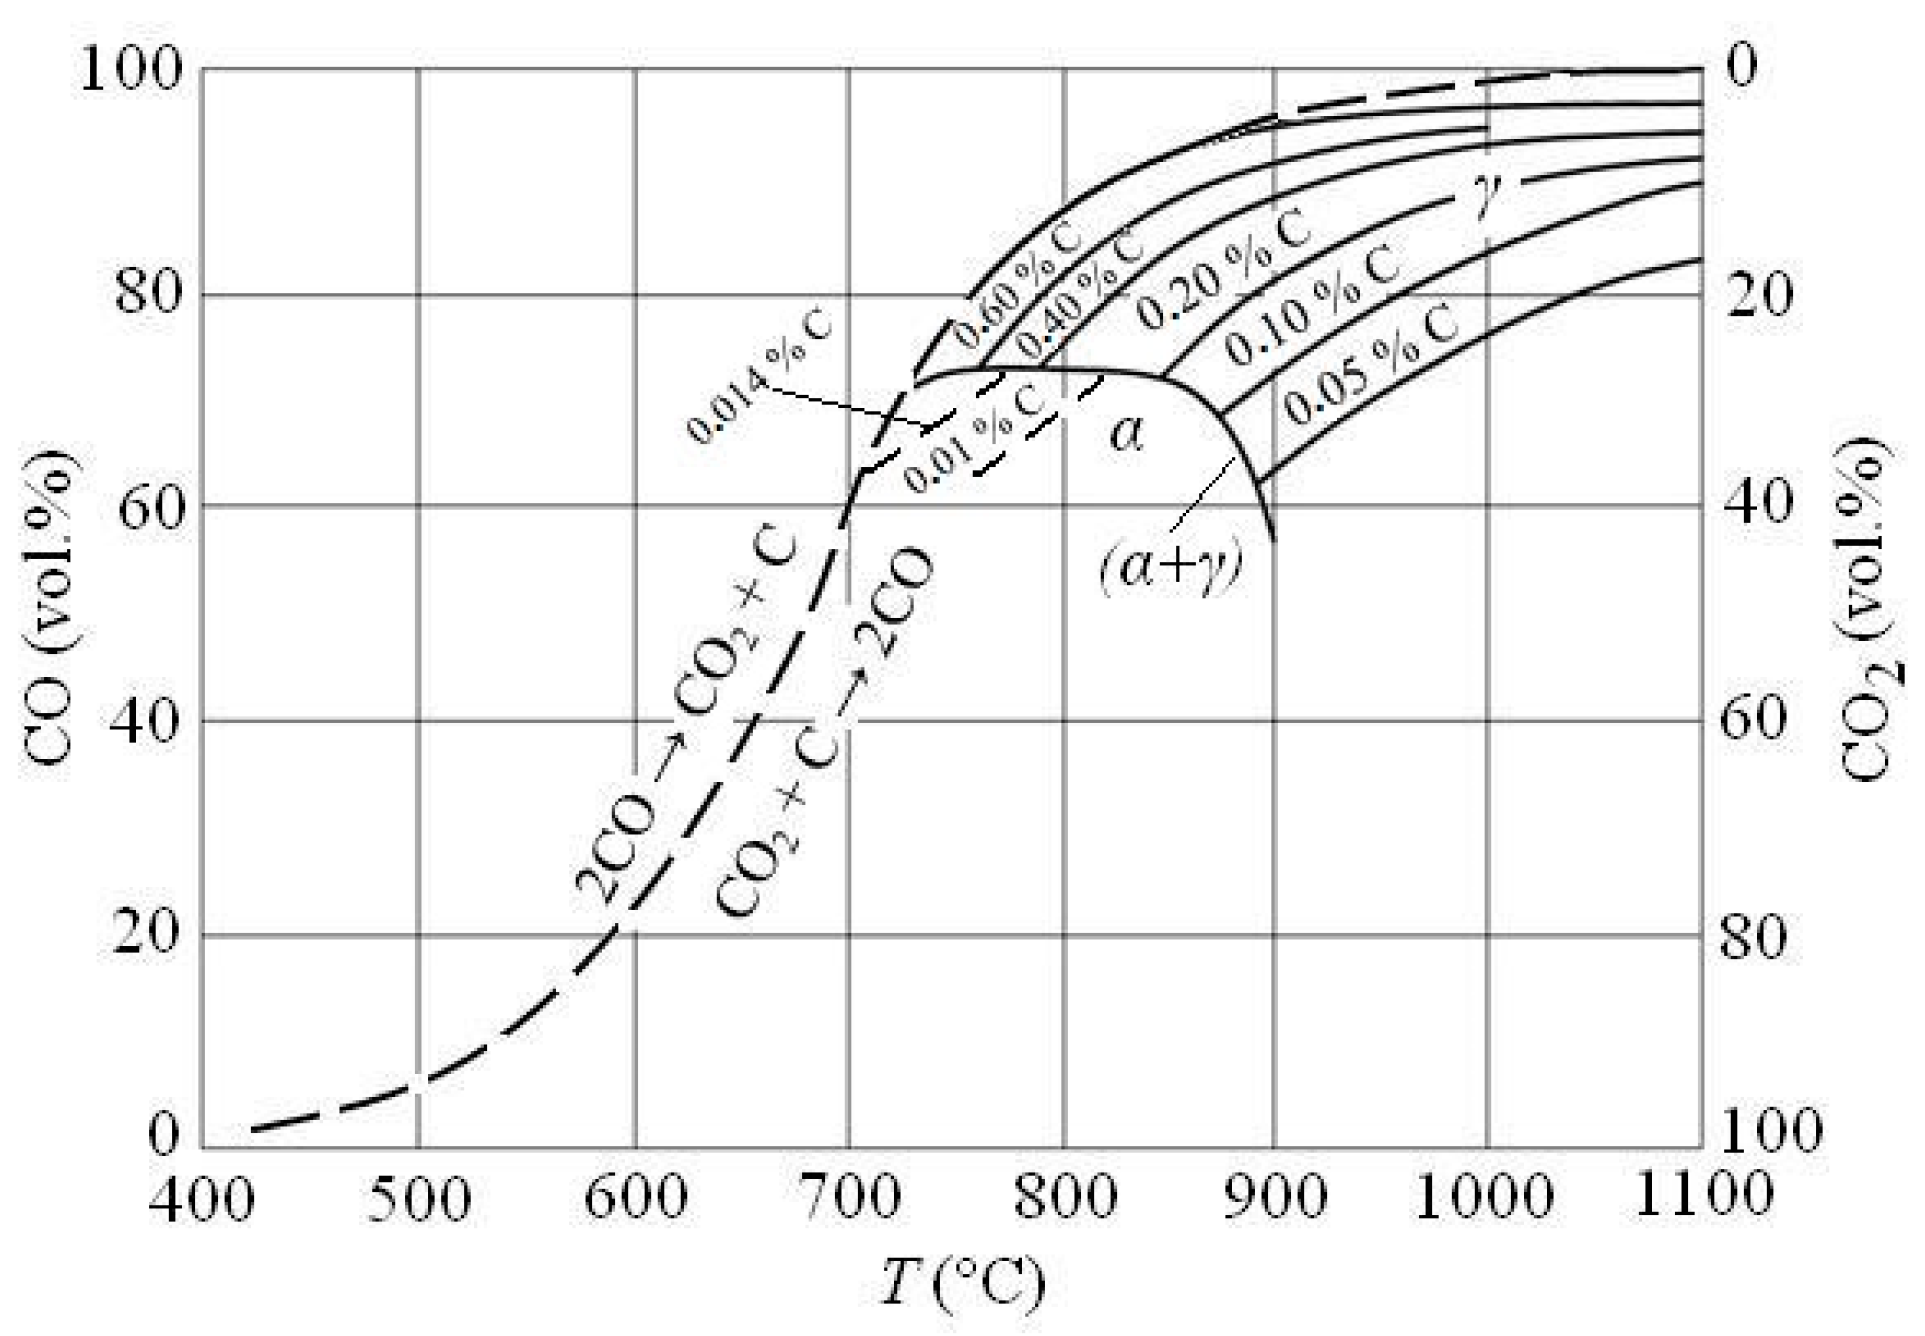
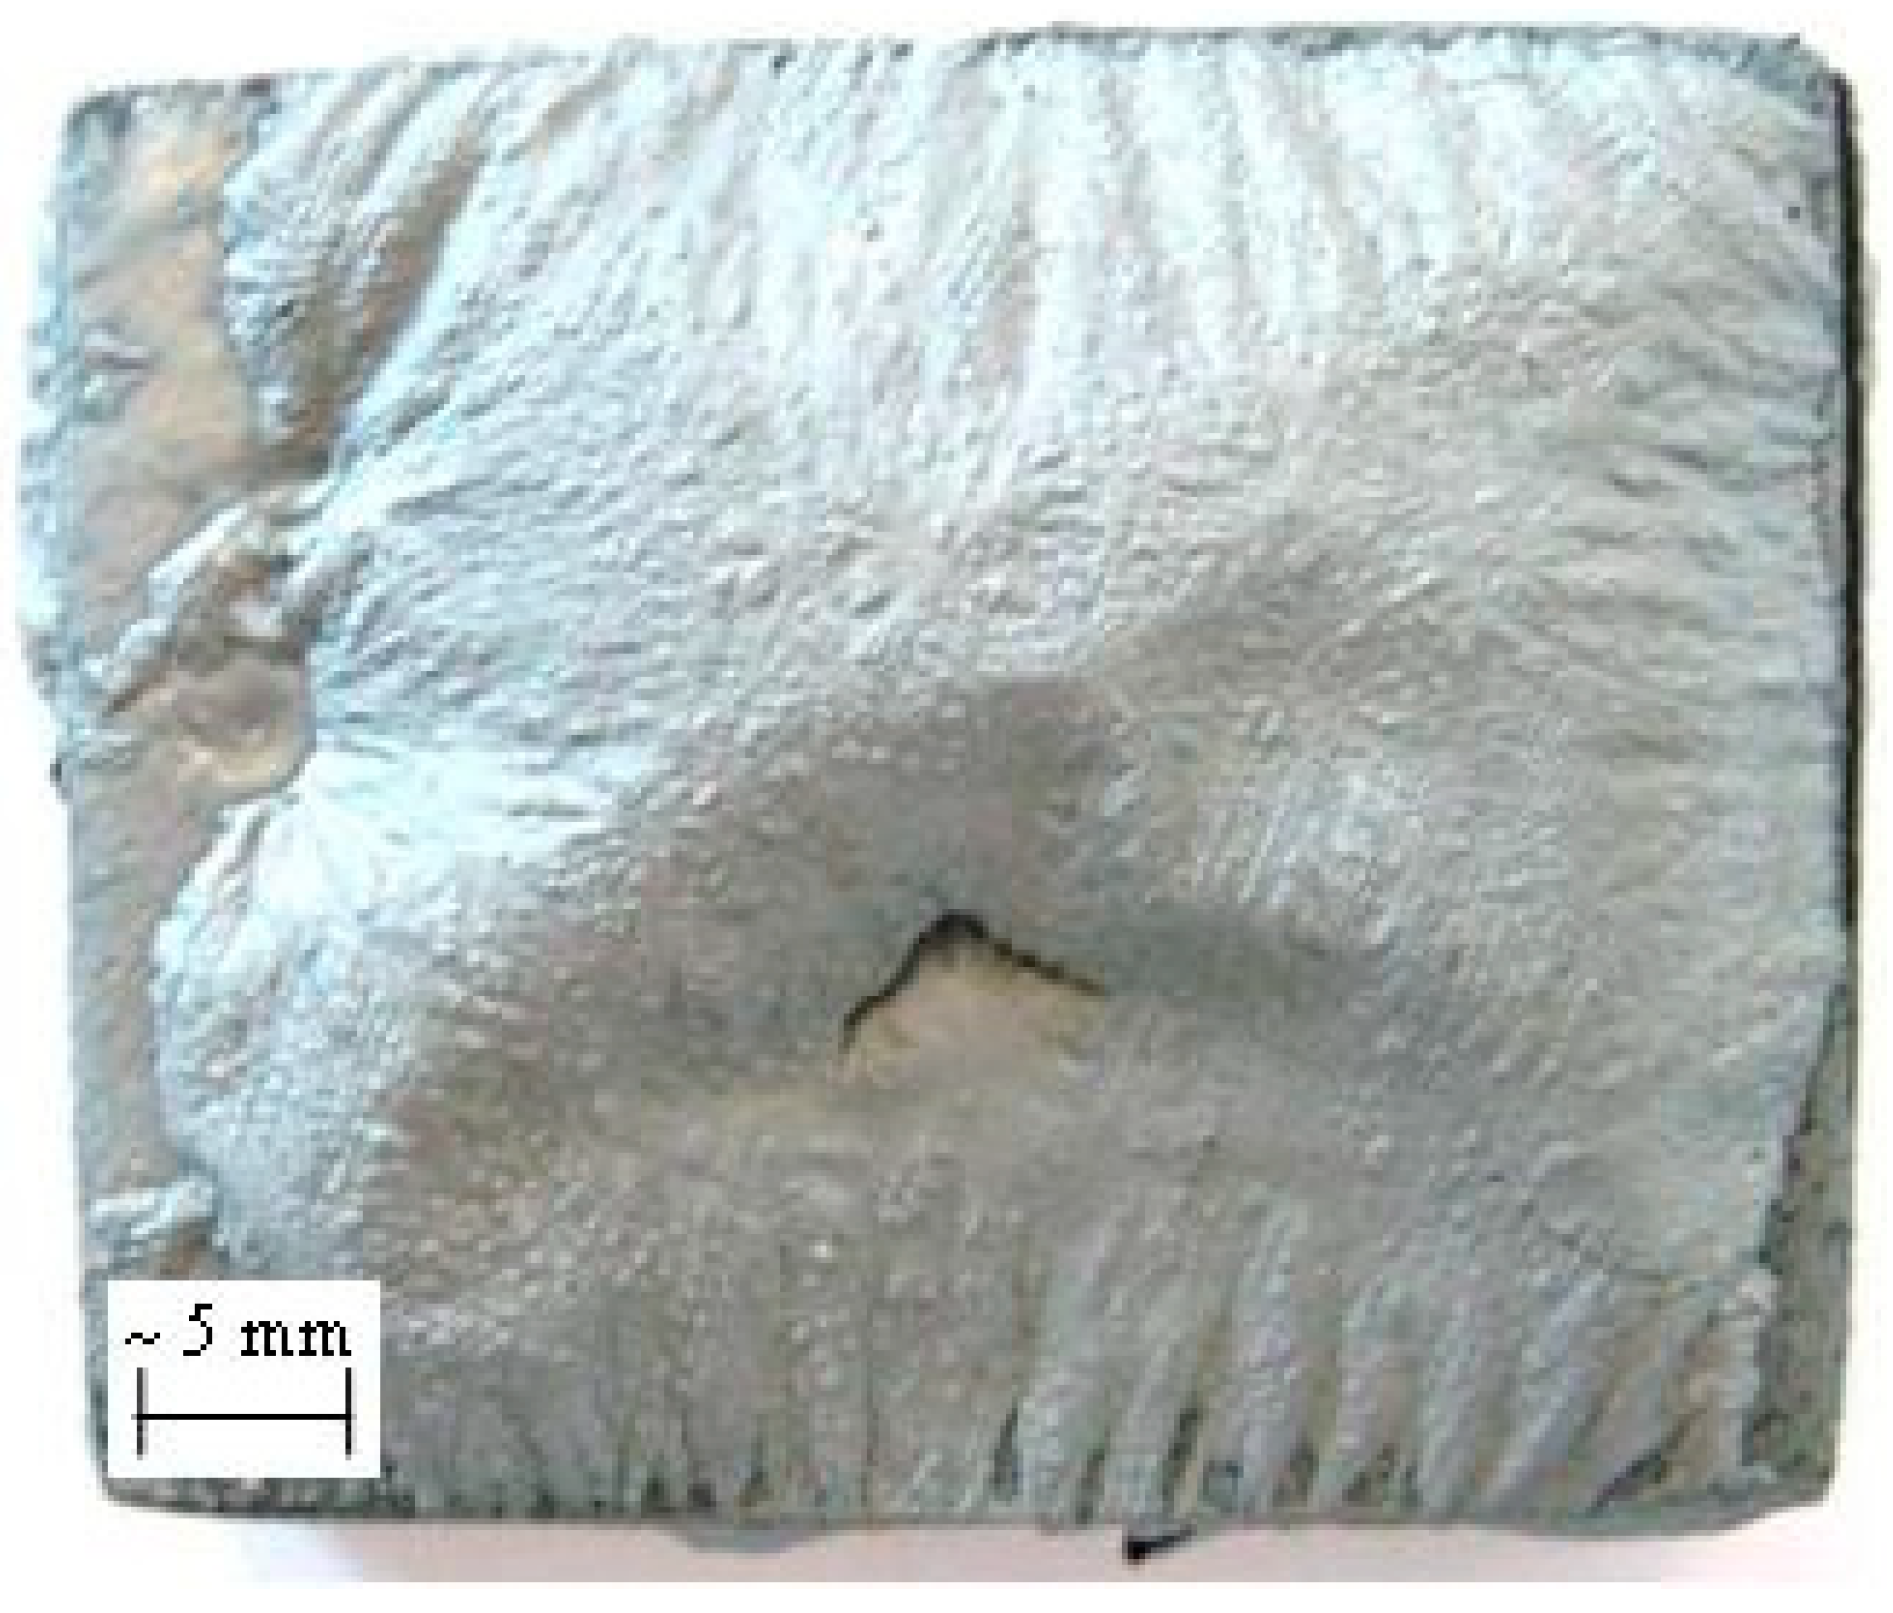
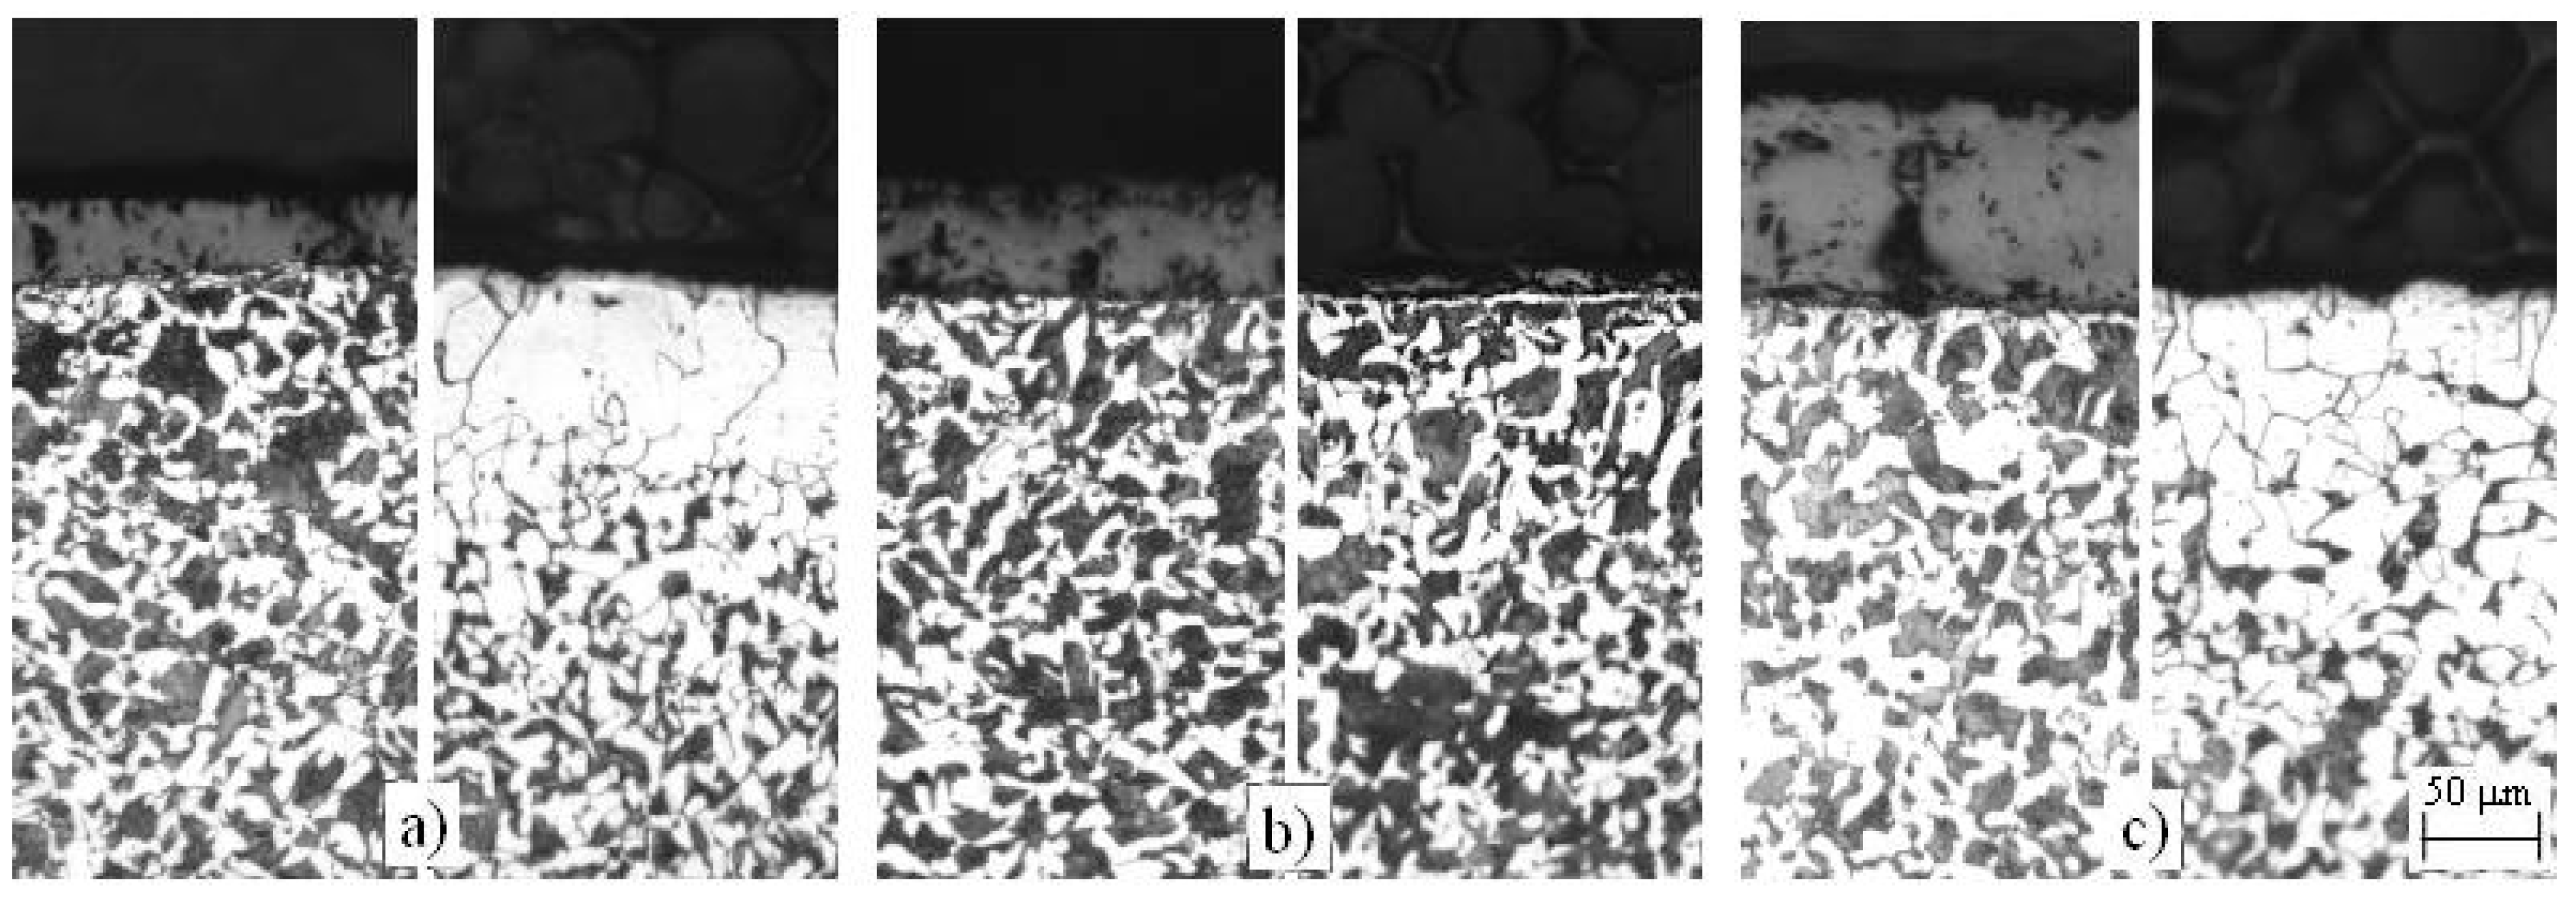
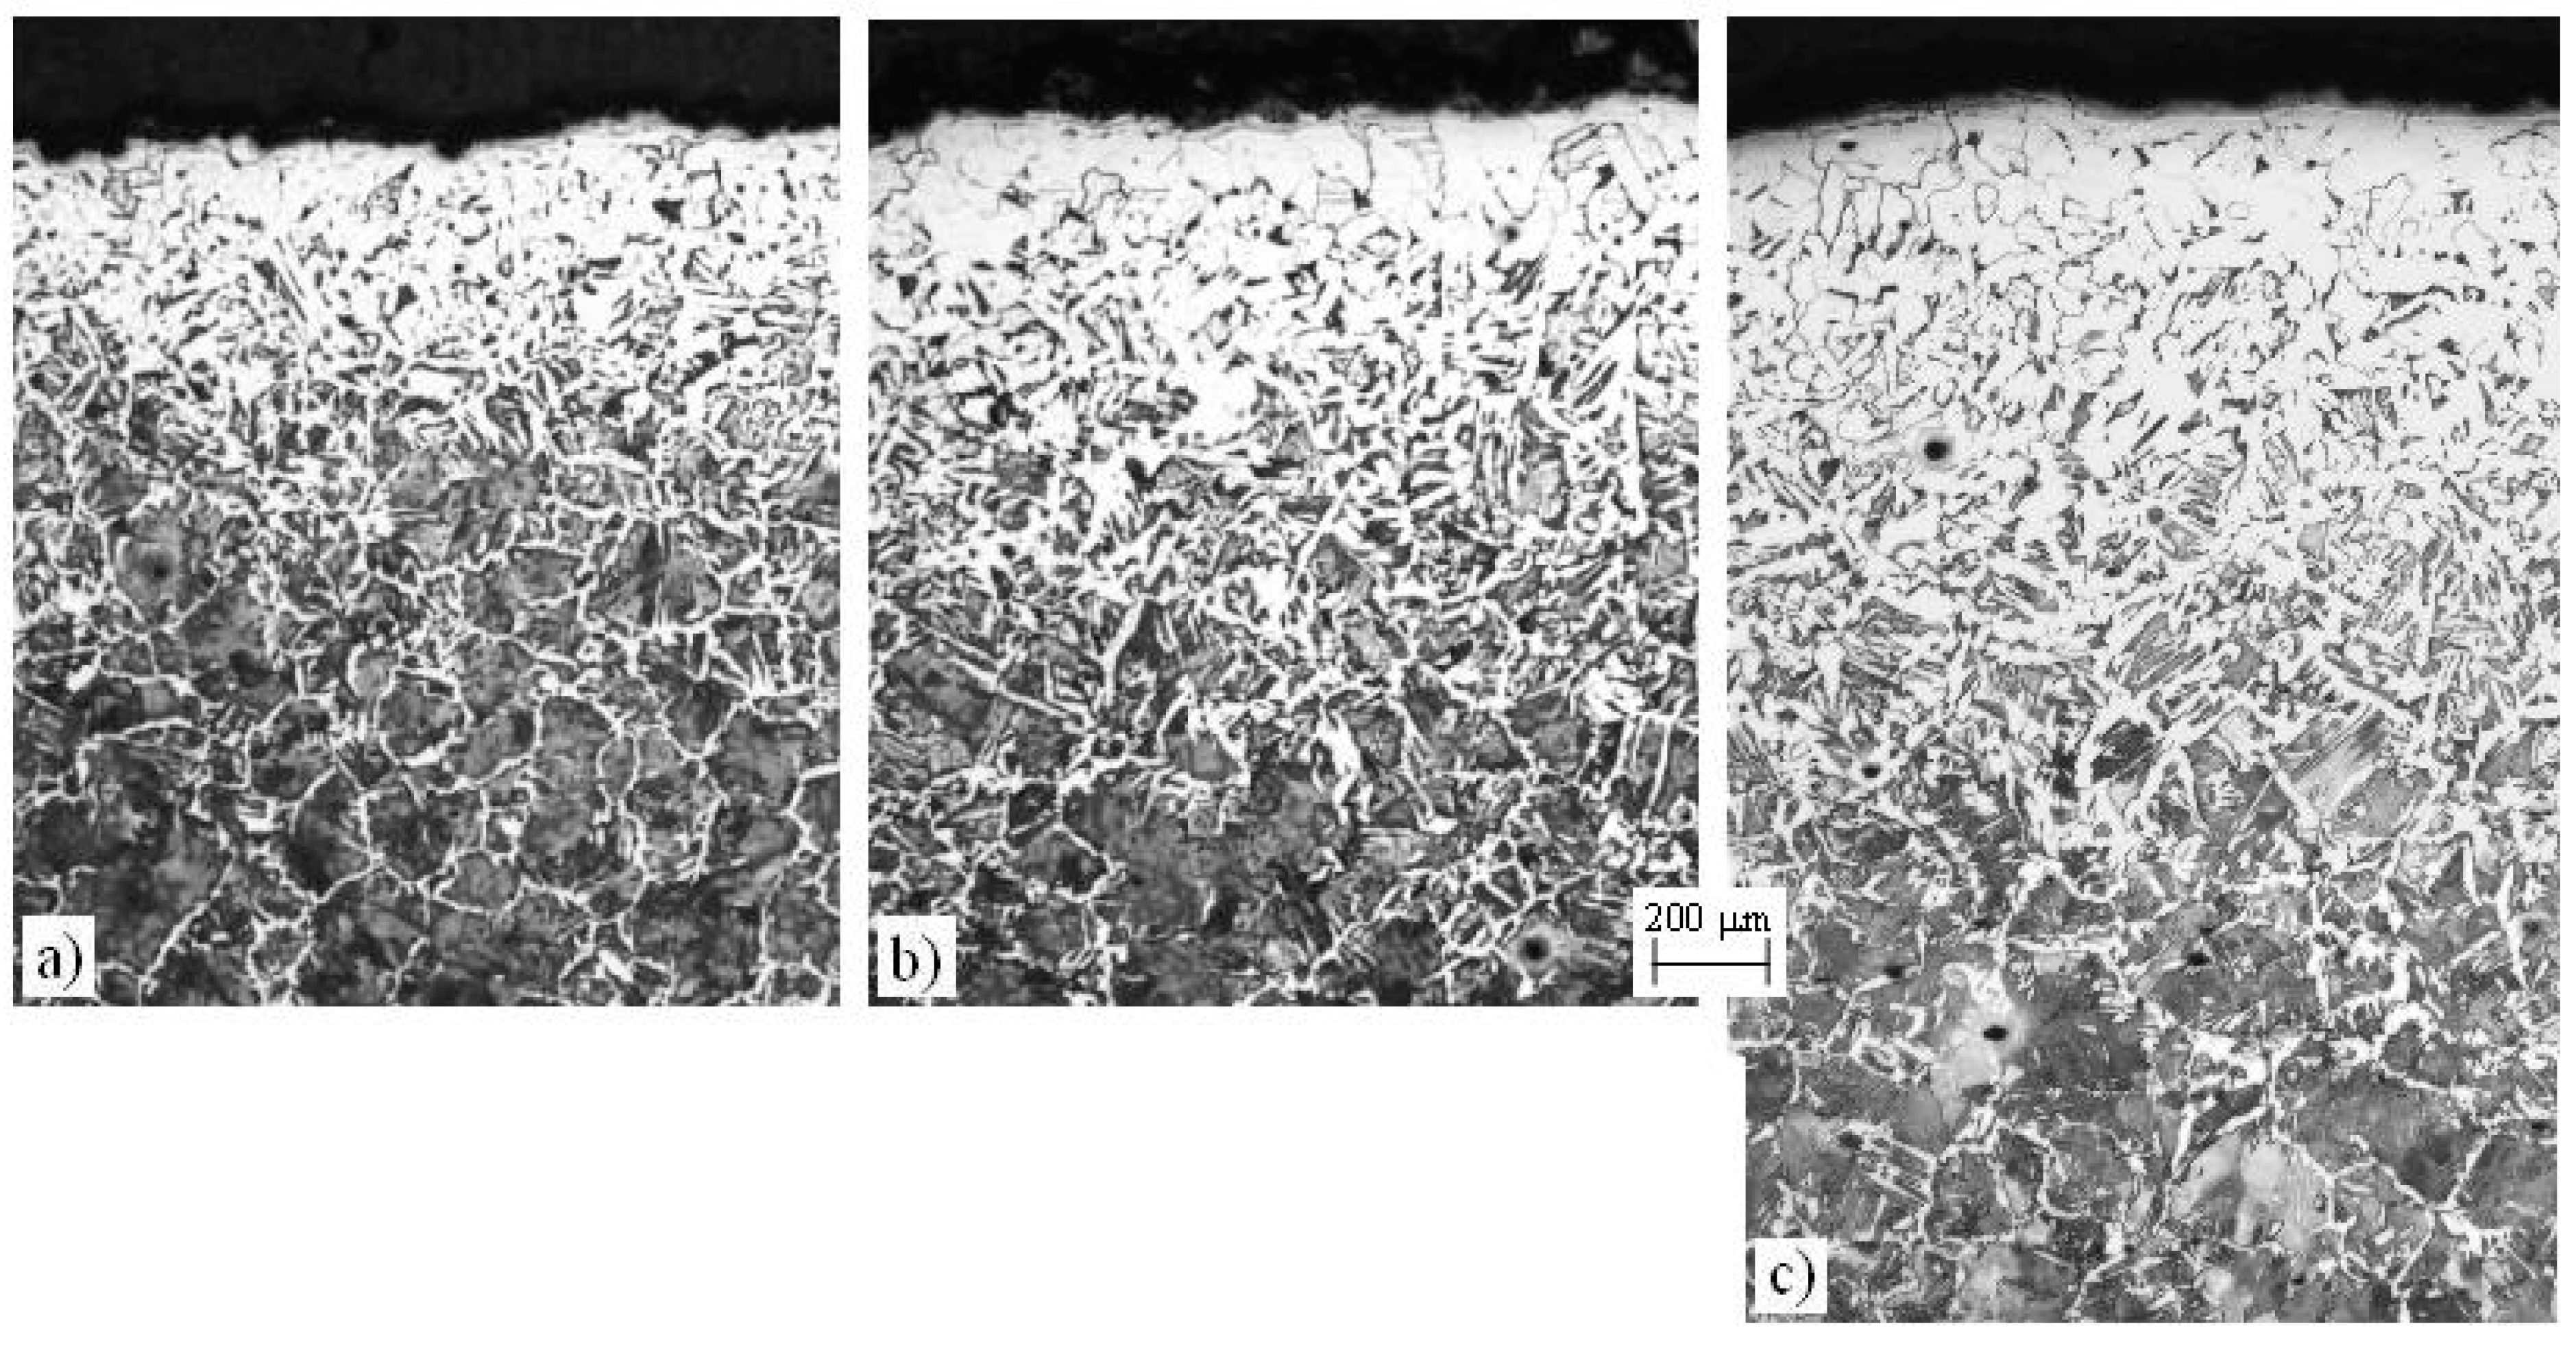
Table 1.
Carbon diffusion coefficients in austenite DCγ calculated using Equations (1) and (2).
| Equation | Ta (°C/K) | 760/1033 | 850/1123 | 950/1223 | 1100/1373 |
|---|---|---|---|---|---|
| (3) | DCγ (cm2/s) | 2.236×10⁻⁸ | 7.880×10⁻⁸ | 2.570×10⁻⁷ | 1.096×10⁻⁶ |
| (4) | DCγ (cm2/s) | 7.546×10⁻⁹ | 3.000×10⁻⁸ | 1.097×10⁻⁷ | 5.382×10⁻⁷ |
Table 2.
Calculated and measured maximum thicknesses of decarburized layer.
| Ta (°C) | ta (s) | dm | xA | / | x0.884 | 0.884 | |||
|---|---|---|---|---|---|---|---|---|---|
| 760 | 1800 | 31 | 110 | 79 | 50 | 50 | 1.580 | 82;118 * | 51;87 * |
| 3600 | 43 | 156 | 113 | 120 | 120 | 0.942 | 116;167 * | 73;124 * | |
| 7200 | 61 | 221 | 160 | 150 | 150 | 1.067 | 164;236 * | 103;175 | |
| 850 | 1800 | 67 | 216 | 149 | 160 | 80 | 0.931 | 163 | 96 |
| 3600 | 95 | 305 | 210 | 3 | 3 | 70.00 | 231 | 136 | |
| 7200 | 134 | 432 | 298 | 280 | 70 | 1.064 | 326 | 192 | |
| 950 | 1800 | 141 | 337 | 196 | 200 | 40;75 # | 0.980 | 312 | 171 |
| 3600 | 199 | 477 | 278 | 260 | 60;100 # | 1.069 | 441 | 242 | |
| 7200 | 282 | 674 | 392 | 400 | 100;150 # | 0.980 | 624 | 342 | |
| 1100 | 1800 | 350 | 1027 | 677 | 650 | 200 # | 1.041 | 691 | 341 |
| 3600 | 477 | 1452 | 975 | 1000 | 260 # | 0.975 | 977 | 500 | |
| 7200 | 699 | 2054 | 1355 | 1400 | 300 # | 0.968 | 1382 | 683 |
Note: all distances are in (μm); —calculated theoretical visible thickness of decarburization; —maximum measured visible thickness of decarburization; —maximum measured thickness of ferrite or predominantly ferrite layer; # predominantly ferrite layer; * values x0.976 and 0.976.
© 2018 by the authors. Licensee MDPI, Basel, Switzerland. This article is an open access article distributed under the terms and conditions of the Creative Commons Attribution (CC BY) license (http://creativecommons.org/licenses/by/4.0/).
Share and Cite
MDPI and ACS Style
Zorc, M.; Nagode, A.; Burja, J.; Kosec, B.; Zorc, B. Surface Decarburization of the Hypo-Eutectoid Carbon Steel C45 during Annealing in Steady Air at Temperatures T > AC1. Metals 2018, 8, 425. https://doi.org/10.3390/met8060425
AMA Style
Zorc M, Nagode A, Burja J, Kosec B, Zorc B. Surface Decarburization of the Hypo-Eutectoid Carbon Steel C45 during Annealing in Steady Air at Temperatures T > AC1. Metals. 2018; 8(6):425. https://doi.org/10.3390/met8060425
Chicago/Turabian StyleZorc, Matija, Aleš Nagode, Jaka Burja, Borut Kosec, and Borut Zorc. 2018. "Surface Decarburization of the Hypo-Eutectoid Carbon Steel C45 during Annealing in Steady Air at Temperatures T > AC1" Metals 8, no. 6: 425. https://doi.org/10.3390/met8060425
Note that from the first issue of 2016, this journal uses article numbers instead of page numbers. See further details here.