Strain Localization during Equal-Channel Angular Pressing Analyzed by Finite Element Simulations
by
 , , and
Tobias Daniel Horn
1,* ,
,
Christian Bert Silbermann
1,
Philipp Frint
2,
Martin Franz-Xaver Wagner
2 and
Jörn Ihlemann
1 1
Chair of Solid Mechanics, Chemnitz University of Technology, Reichenhainer Str. 70, D-09126 Chemnitz, Germany
2
Chair of Materials Science, Institute of Material Science and Engineering, Chemnitz University of Technology, Erfenschlager Str. 73, D-09125 Chemnitz, Germany
*
Author to whom correspondence should be addressed.
Metals 2018, 8(1), 55; https://doi.org/10.3390/met8010055
Submission received: 19 December 2017
/
Revised: 6 January 2018
/
Accepted: 8 January 2018
/
Published: 15 January 2018
(This article belongs to the Special Issue Scientific and Engineering Progress on Aluminum-Based Light-Weight Materials: Research Reports from the German Collaborative Research Center 692)
Abstract
:Equal-Channel Angular Pressing (ECAP) is a method used to introduce severe plastic deformation into a metallic billet without changing its geometry. In special cases, strain localization occurs and a pattern consisting of regions with high and low deformation (so-called shear and matrix bands) can emerge. This paper studies this phenomenon numerically adopting two-dimensional finite element simulations of one ECAP pass. The mechanical behavior of aluminum is modeled using phenomenological plasticity theory with isotropic or kinematic hardening. The effects of the two different strain hardening types are investigated numerically by systematic parameter studies: while isotropic hardening only causes minor fluctuations in the plastic strain fields, a material with high initial hardening rate and sufficient strain hardening capacity can exhibit pronounced localized deformation after ECAP. The corresponding finite element simulation results show a regular pattern of shear and matrix bands. This result is confirmed experimentally by ECAP-processing of AA6060 material in a severely cold worked condition, where microstructural analysis also reveals the formation of shear and matrix bands. Excellent agreement is found between the experimental and numerical results in terms of shear and matrix band width and length scale. The simulations provide additional insights regarding the evolution of the strain and stress states in shear and matrix bands.

1. Introduction
Equal-Channel Angular Pressing (ECAP) is a severe plastic deformation (SPD) process developed by Segal [1,2]. During ECAP, a billet with a typically square or circular cross-section is pressed through an angled channel. Both channels (entrance and exit channel) are intersected by a shear plane, where a shear deformation is introduced into the material. The angle between these two channels () and the angle of the outer curvature () inside the “L”-shaped channel (cf. Figure 1) control the amount of introduced (effective) strain [3].
In the most common ECAP dies (, ), the introduced effective strain is approximately 1.15 after a single pass. As a consequence of the severe plastic deformation, grain refinement occurs. Grain refinement results in a higher yield strength since geometrical boundaries are effective obstacles for dislocation motion [4,5]. In addition, an extraordinarily high ductility is observed in many materials after multiple ECAP passes [6,7,8].
For most metallic materials, the billet is deformed predominantly homogeneously during ECAP [8,9,10]. However, under certain conditions, pronounced strain localization occurs and results in heterogeneous microstructures consisting of regions with large inherent strain (shear bands) and regions with much lower strains (matrix bands) [11,12,13,14,15].
In addition to experimental investigations, finite element (FE) simulations have been carried out to understand the ECAP process in greater detail. For this purpose, multiple parameter studies were conducted, e.g., studying the effect of variations of the channel angle [16,17,18,19], the angle of the outer curvature [18,19,20,21,22,23], the strain rate [24,25,26] as well as the friction between the channel and the billet [16,18,23,26,27]. However, within this huge body of scientific work, only a few papers address the simulation of strain localization [24,28,29]. In those papers, strain softening behavior had to be used in order to simulate strain localization in distinct bands. Figueiredo et al. showed that the occurrence of shear bands depends on the initial flow-softening rate and the steady-state stress [28] as well as the strain rate [24]. Furthermore, most of the aforementioned finite element studies do not contain a convergence study for their simulation model and in some cases an automatic remeshing function was used to reach a stable simulation [18,20,24,29].
The present paper shows both experimentally and numerically that strain localization during ECAP can even occur for a strain hardening material. To this end, explicit finite element simulations are conducted. In order to achieve reliable FE solutions, systematic convergence studies are performed. As a special feature, the billet is meshed with pre-oriented rhomboid-shaped elements such that remeshing is not necessary. The role of two types of hardening—isotropic and kinematic—is investigated numerically by varying the corresponding material parameters. It is found that only kinematic hardening leads to the emergence of localized deformation in a form of shear and matrix bands. The simulation results are compared thoroughly to corresponding ECAP experiments on billets made of an AA6060 alloy. Finally, the origin of the heterogeneous plastic flow is discussed both from a microstructural and a mechanical point of view, representing a starting point for further basic research on localization phenomena during SPD processing.
2. Simulation Model
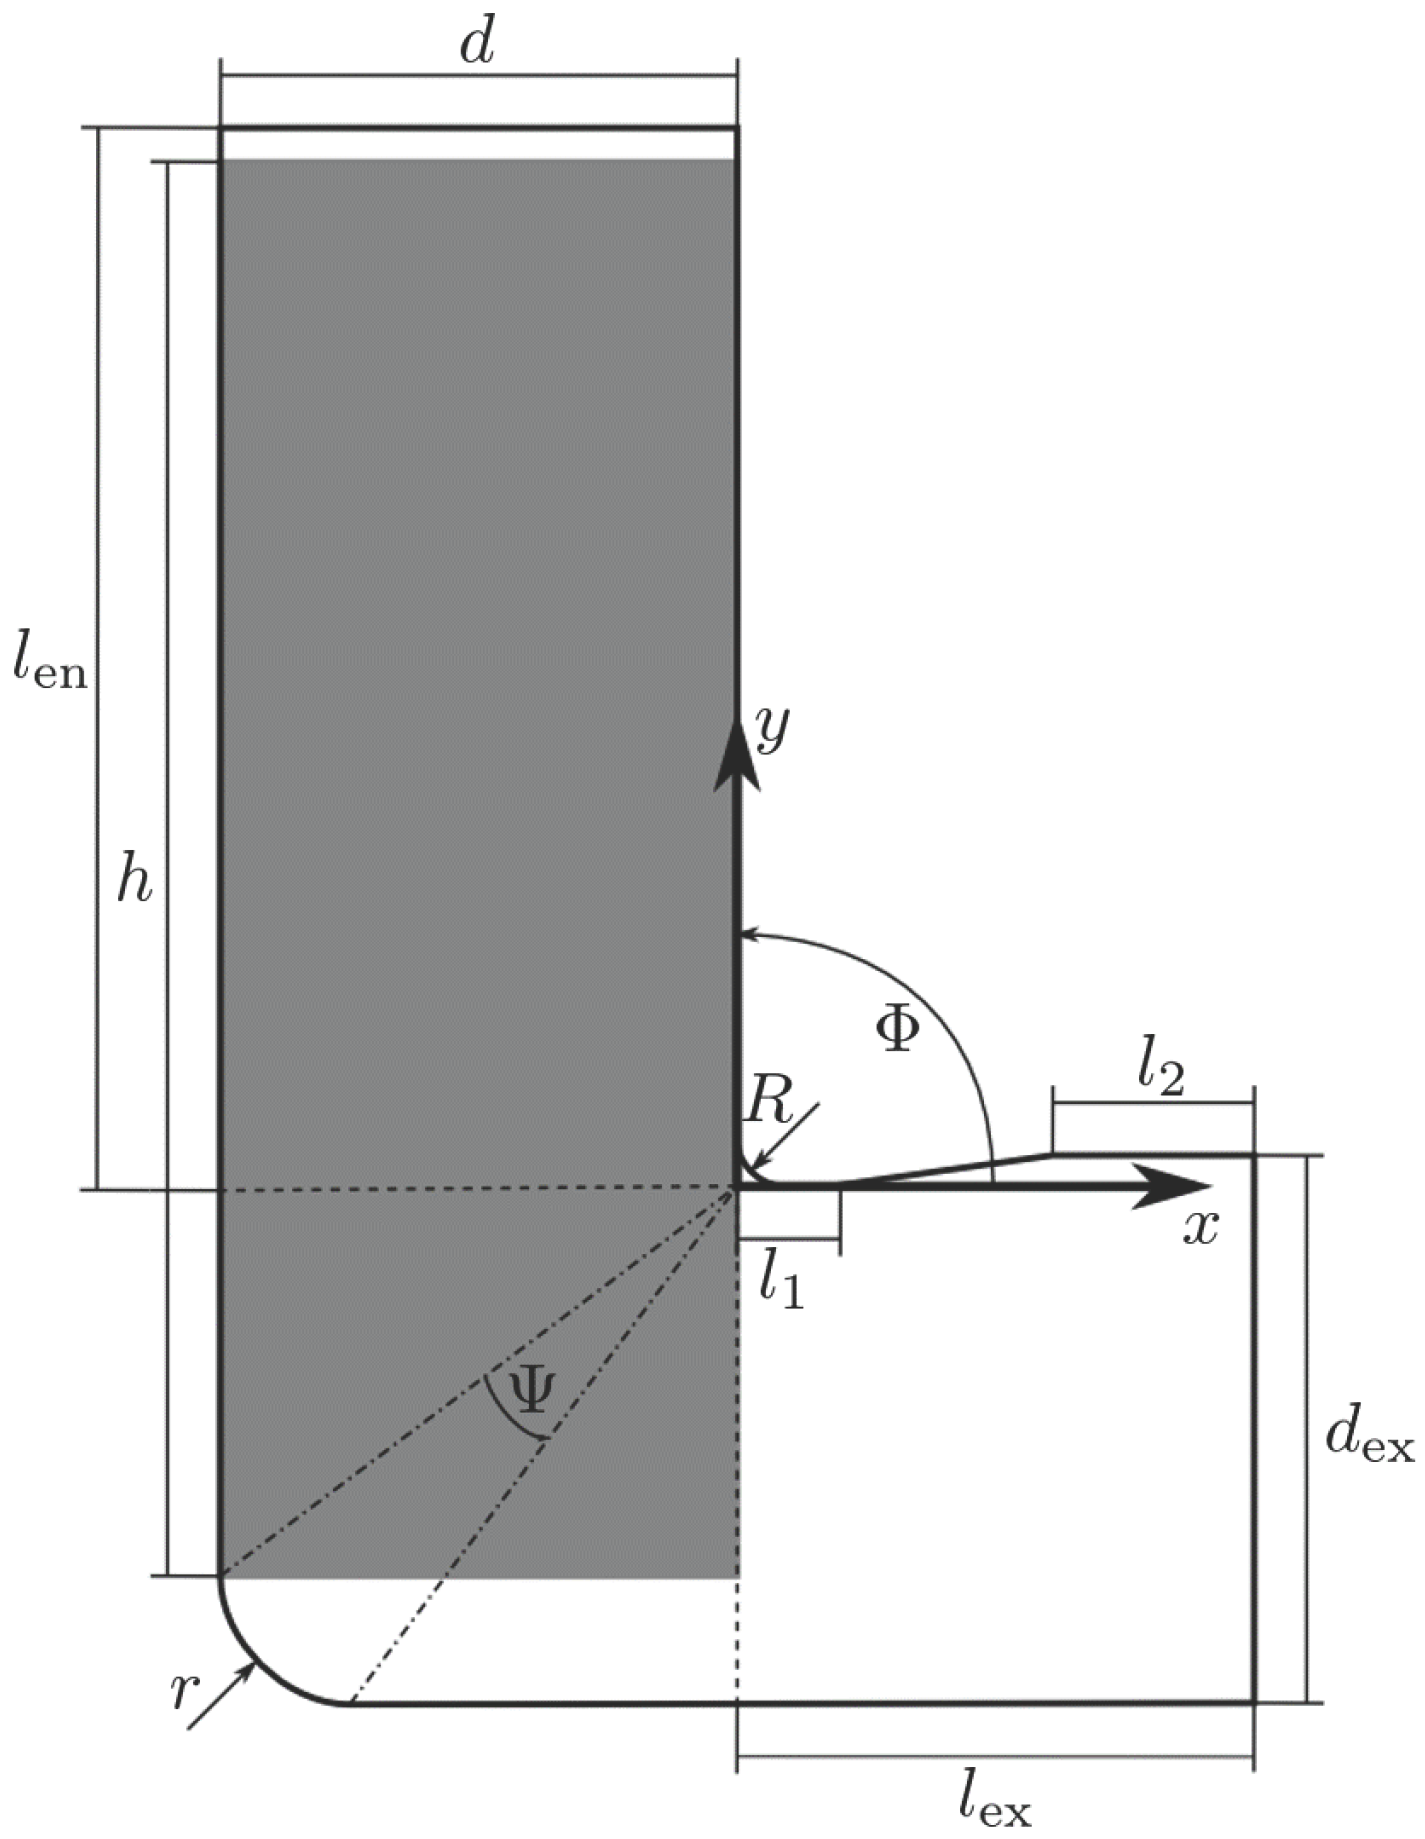
Isothermal and frictionless 2D plane-strain finite element simulations of one pass of ECAP were conducted using the commercial explicit finite element code Abaqus (Version 6.14-4). For the contact between ECAP tool and billet, the Abaqus penalty algorithm is used employing a contact stiffness factor of 0.8. The geometry parameters specifying the ECAP process are shown in Figure 2: d is the diameter of the billet with cross-sectional area of d × d and length h. is the channel angle, the angle of the outer curvature, r is the outer and R the inner edge radius. The outer edge radius is defined via the diameter d, the angle of the outer curvature and the channel angle:
The gray area in Figure 2 is a 2D representation of the billet with the length h and the width d, which is equal to the diameter of the entrance channel. The geometry parameters for the 2D model presented in Table 1 are chosen in analogy to the parameters used for the experimental investigations shown later.
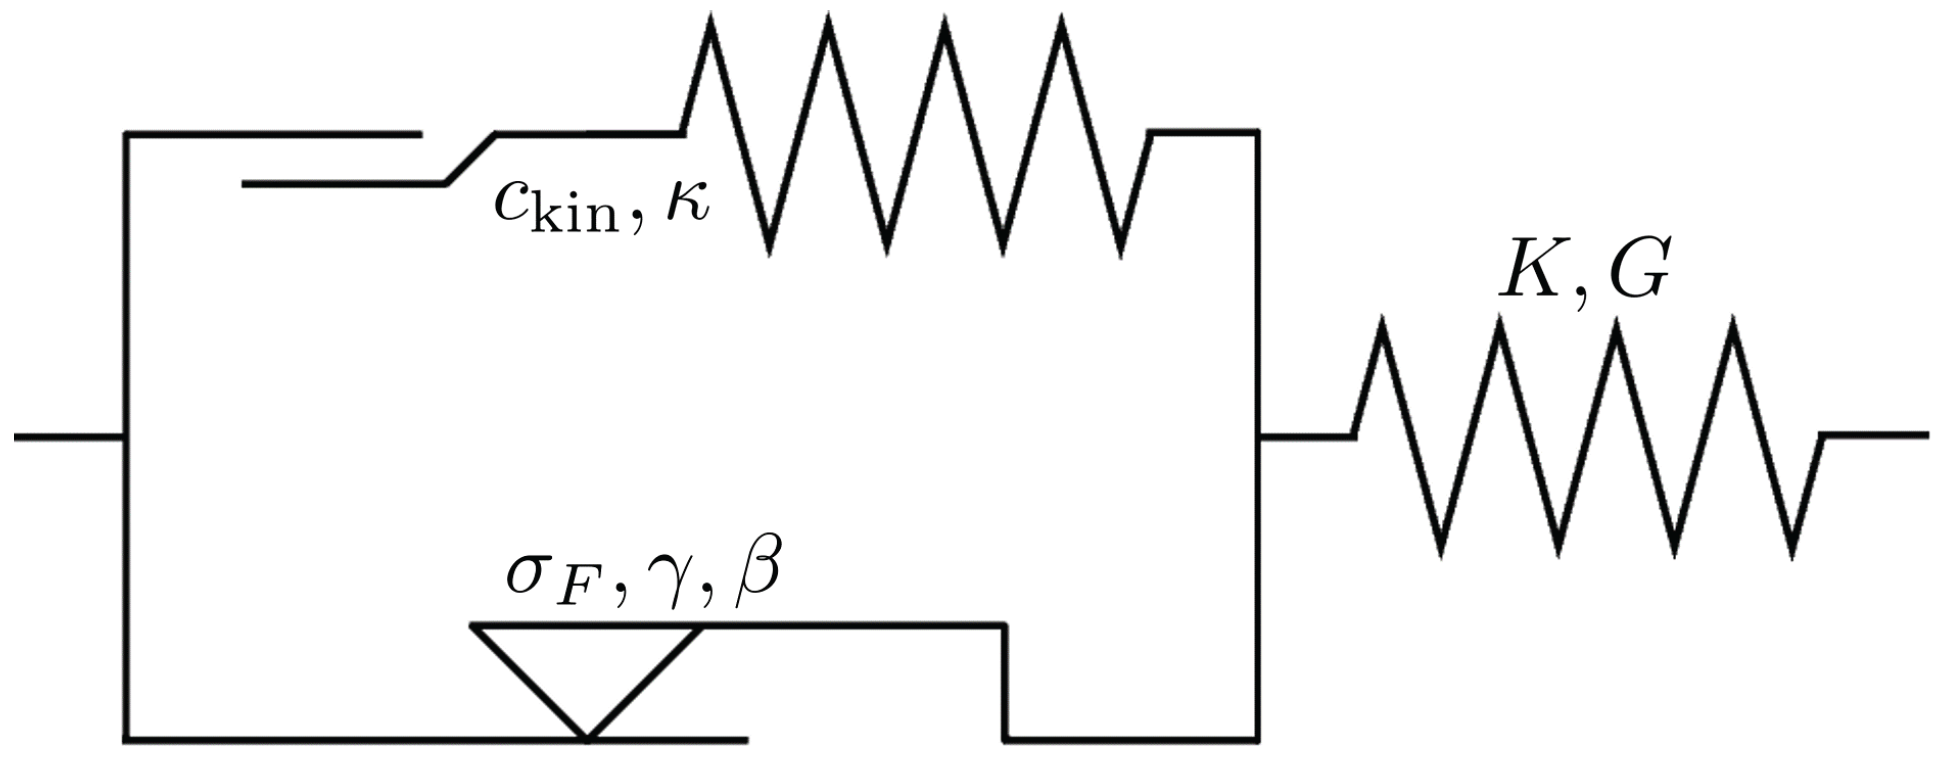
To simulate the ECAP process, a version of the elastic visco-plastic material model of Shutov and Kreißig [30] is used (cf. Table 2). It is based on the multiplicative decomposition of the deformation gradient and of the inelastic part of the deformation gradient . The rheological representation of the model [31] is shown schematically in Figure 3.
The elastic behavior is modeled with a Neo-Hookean spring and the plastic flow is represented by a parallel connection of a St. Venant element with an endochrone element that describes the kinematic hardening of an Armstrong-Frederick type [32]. Furthermore, the St. Venant element incorporates the yield stress and the isotropic hardening of Voce type [33]. Normally, the visco-plastic flow is prescribed with Perzyna’s rule [34]. However, in the present study, rate-independent plastic flow is assumed.
Note that the constitutive model is a purely phenomenological elastic-plastic model with isotropic and kinematic hardening. It is not based on specific assumptions regarding microstructural deformation mechanisms and therefore allows for a quite general analysis of shear localization during ECAP. As indicated in the constitutive Equations (1)–(10), seven parameters are needed to describe the material behavior. K and G are the bulk and shear modulus, is the yield stress and the other constants represent the parameters of the isotropic (, ) and kinematic (, ) hardening. As shown in [35], and define the initial hardening rate (IHR) while and determine the strain hardening capacity (SHC). (The meaning of the kinematic hardening parameters is derived from linearized equations. Strictly speaking, this interpretation is thus only valid for small strains.)
In the material model summarized in Table 3, the Cauchy-Green tensor , two internal state variables and the second Piola-Kirchoff stress further appear, which is related to the Cauchy stress by
Here, the third invariant of a second order tensor is defined by . Furthermore, denotes the material time derivative and represents the deviatoric part of . Finally, denotes the unimodular part of . The identity tensor is prescribed as the initial condition for the internal state variables throughout this paper. The inelastic multiplier is calculated iteratively from the Karush–Kuhn–Tucker (KKT) conditions (10) applying a Newton iteration.
The material model was implemented in the Vumat user subroutine of Abaqus/Explicit. Further details on the material model and applications to the simulation of metal forming can be found elsewhere [30,36,37,38]. For an adequate interpretation of the results, some simplifications in the simulation model must be kept in mind:
- A two-dimensional plane-strain simulation is used. Therefore, boundary effects perpendicular to the simulated plane have to be neglected. The main reason for this simplification is the computational effort, which increases excessively when changing to a three-dimensional model. However, the comparison of simulation and experimental results (Section 3) demonstrates that the error of this simplification is small.
- As the investigation of viscous effects goes beyond the scope of this study, a rate-independent model was chosen. The aluminum material used in the experimental studies exhibits only a minor rate dependence and the experiments have been performed at room temperature. Due to the very low pressing speed of 0.3 mm/s and consequently low strain rates inside the shear zone, the error of this limitation is kept small. Furthermore, adiabatic heating phenomena are essentially negligible and do not have any practical significance [39].
- A frictionless model was used to simulate ECAP. In the experimental studies, the ECAP die is always lubricated such that the friction coefficient is low [40]. In addition, both in the experiments and in the simulations, the exit channel is moved with the billet in order to minimize the friction [41]. Because of this, self-heating due to friction may be neglected.
3. Parameter Variation
First, convergence studies for element type, element size, mass scaling and velocity scaling were performed to reach a behavior independent of these influences and to avoid artificial effects (e.g., due to inertia forces). The FE model was meshed with rhomboid-shaped CPE4R-elements. The initial inclination was chosen such that the elements’ interior angles remain as close as possible to during the whole deformation. It turned out that a mesh with a maximum element size of (≈92,600 elements) has to be used by applying a maximum possible mass scale of and plunger velocity of m/s. After these convergence studies, a parameter variation for almost all geometrical and material parameters was conducted. Here, only the most important results are presented; for a more detailed depiction including the convergence studies, see [35].
3.1. Reference Simulation
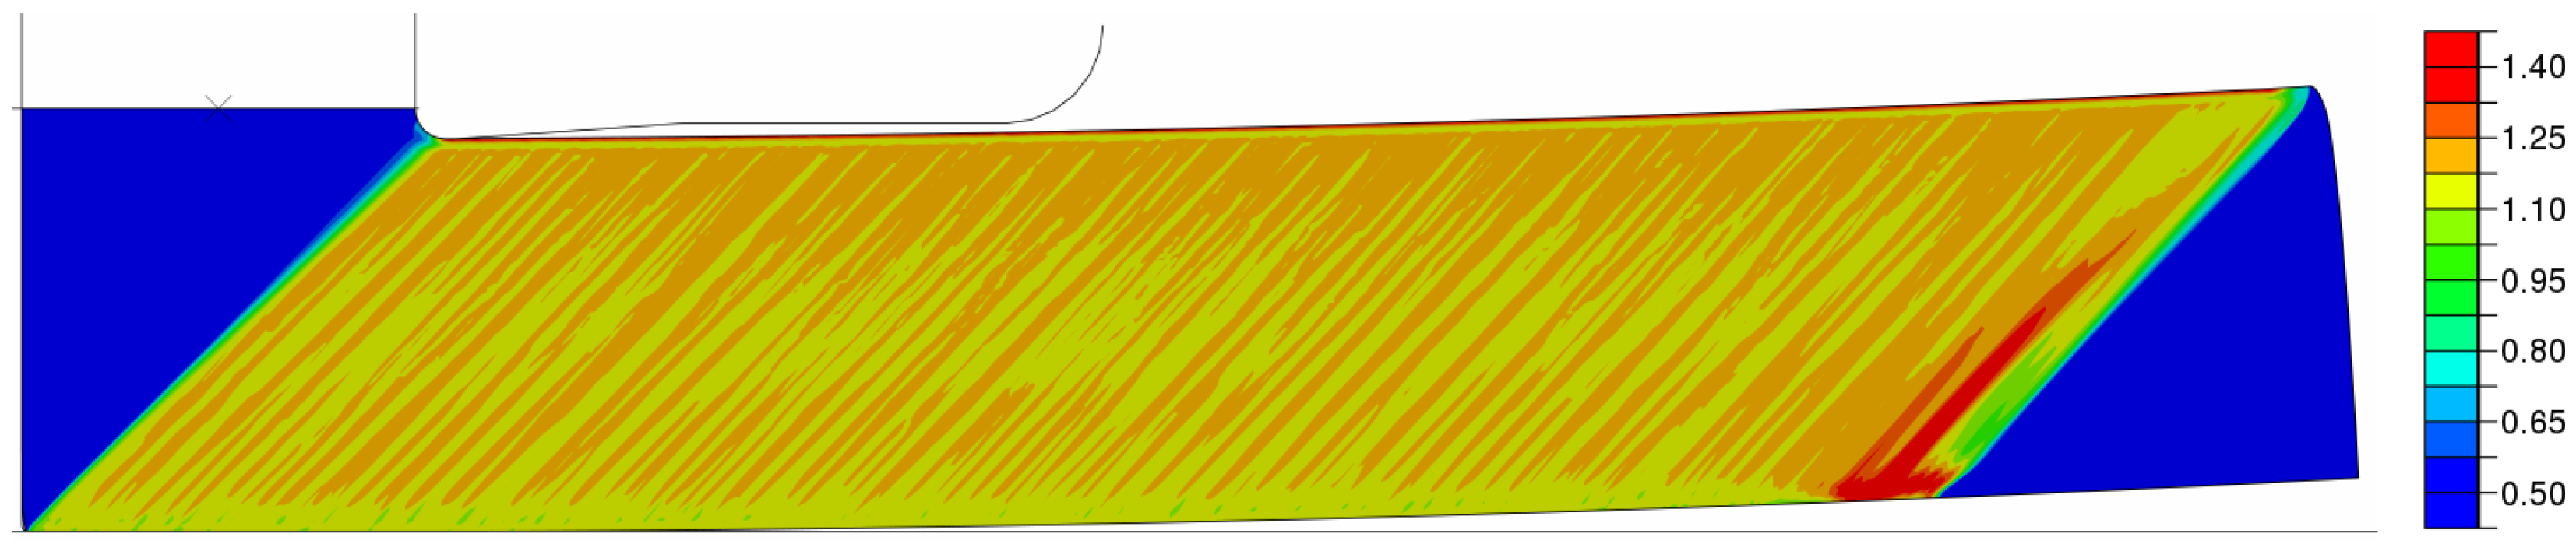
As a reference, a single ECAP pass is simulated with elastic ideal-plastic behavior. The material parameters corresponding to aluminum are shown in Table 3.
In the contour plot in Figure 4, some inhomogeneities in the strain field are visible. However, because of the low difference between maximum and minimum value and the missing regularity, they do not represent fully developed shear or matrix bands (see Section 1). Instead, if the amplitude of the effective plastic strain is lower than , this state will be called “minor fluctuation” in the following. Furthermore, the outer edge of the ECAP die is completely filled with material (lower left corner in Figure 4), which is in line with experimental investigations [23]. Finally, there is a small curvature of the billet because of internal stresses developed during ECAP [42]. This is also known from ECAP experiments without applying any backpressure. In summary, the simulation result corresponds well with the expectations gained from experiments.
3.2. Effects of Isotropic Hardening
Strain localization is observed in experiments if the SHC of the material subjected to ECAP is low. Motivated by these experimental observations, two different levels of the hardening capacity: and and three different levels of the initial hardening rate (IHR): , and are chosen for a systematic comparison. For the material has a low and for it has a high hardening rate during the whole deformation. For , the material has a pronounced IHR and a very small hardening rate at the end of the deformation.
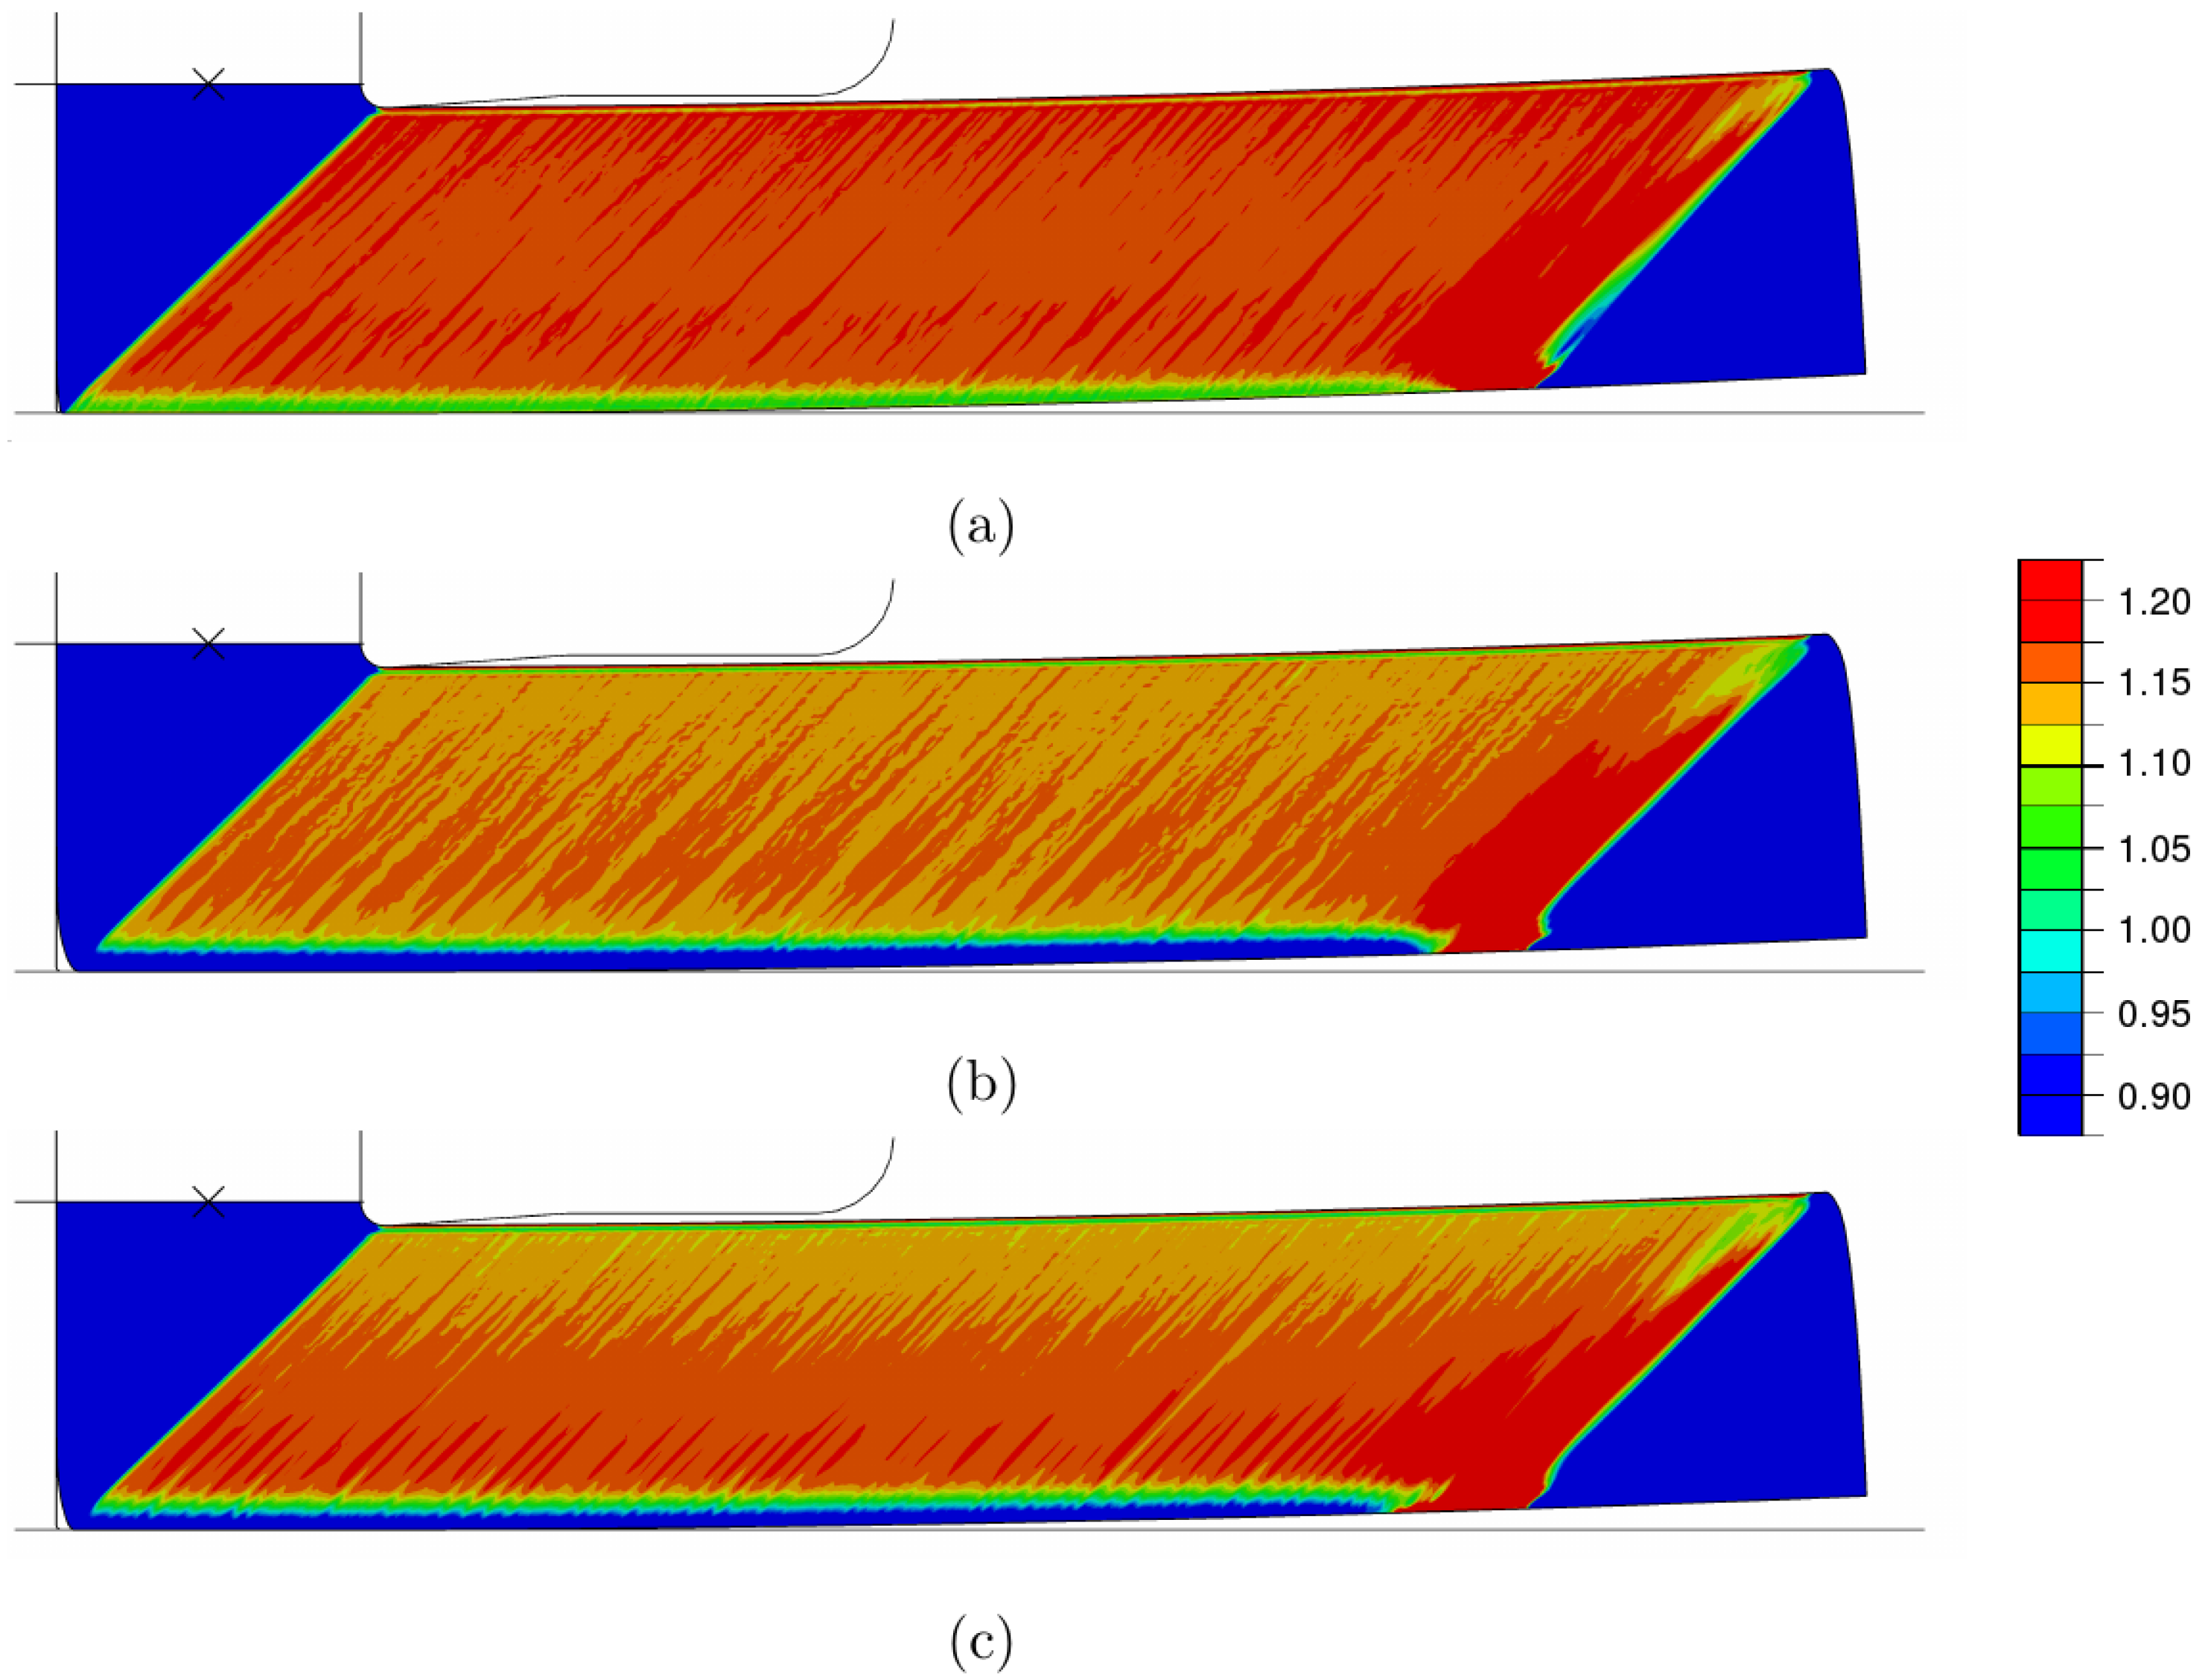
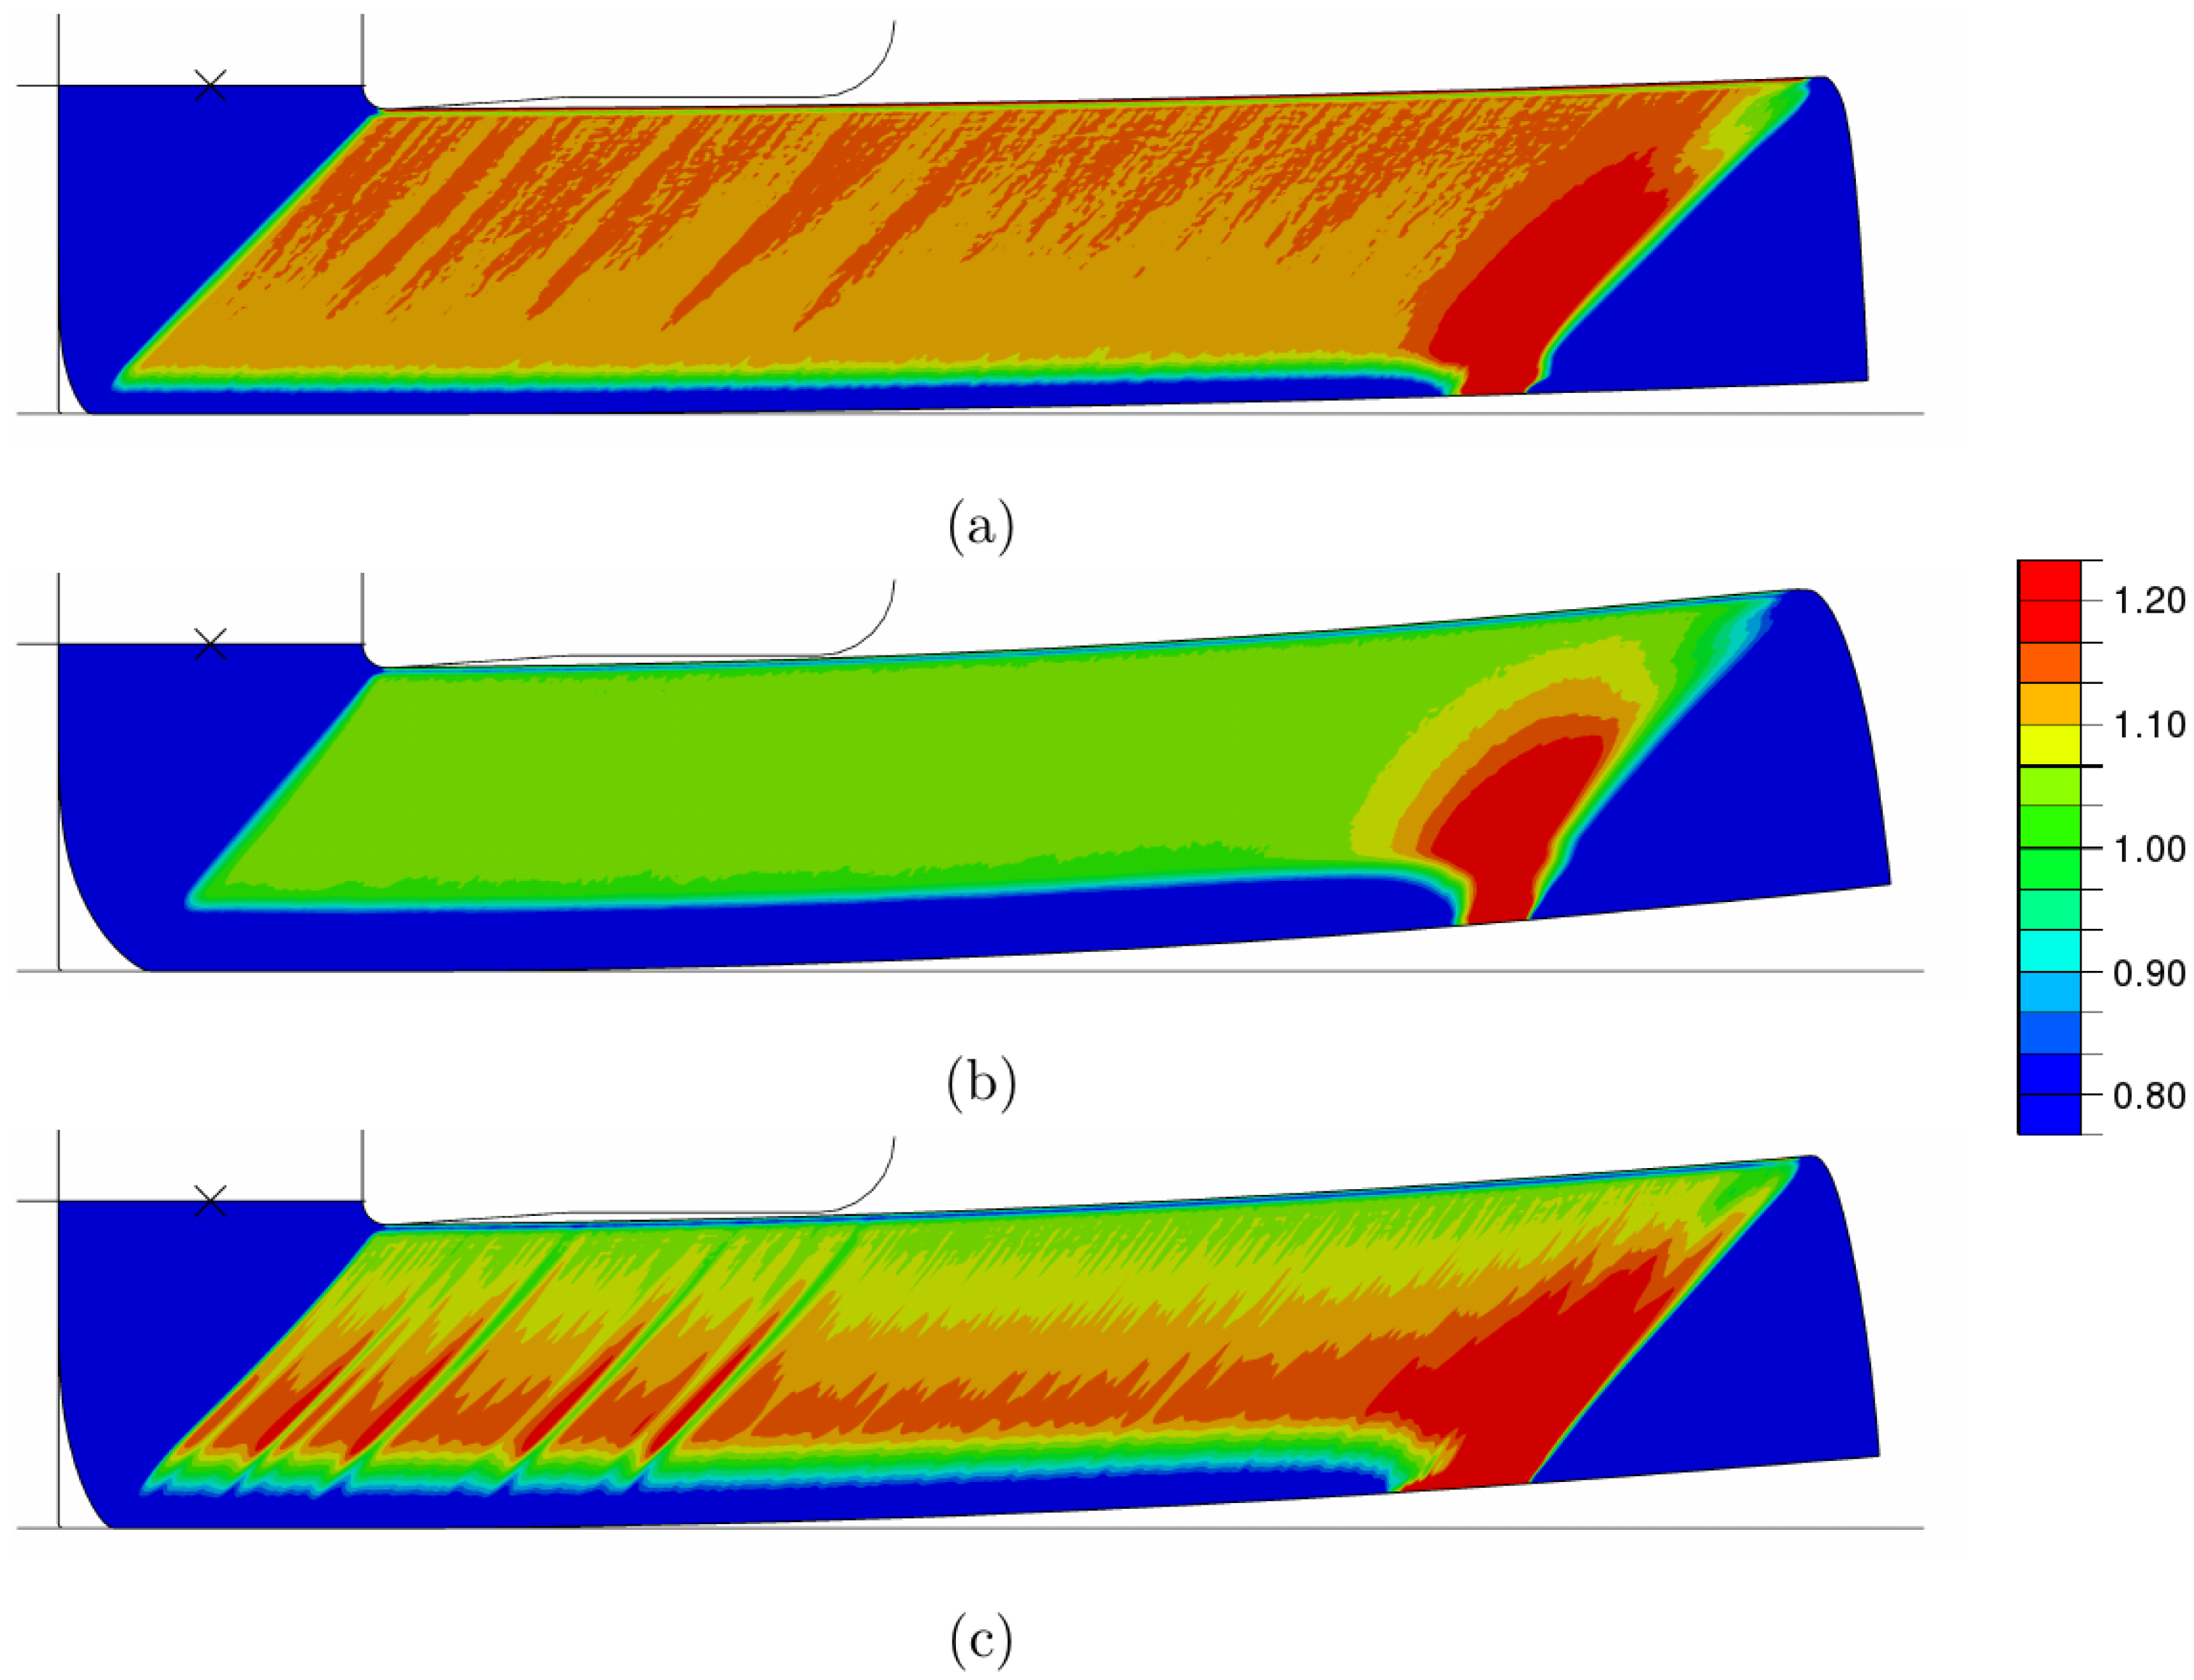
The results of the simulations with and with are shown in Figure 5 and Figure 6, respectively. Minor strain fluctuations occur for all simulations, except the one with a high SHC and a high hardening rate during the whole deformation, Figure 6b. In this case, even minor fluctuations are suppressed yielding a quasi-homogeneous distribution. The situation is different for the low SHC : even the high hardening rate during the whole deformation is still too low to suppress fluctuations. Consequently, the SHC controls the heterogeneity of plastic deformation in case of isotropic hardening. However, the difference between the ideal-plastic behavior and this hardening behavior is very small and therefore the results are similar.
For the SHC is much higher. Still, for low IHR, the material behavior is almost ideal-plastic as well and, due to this, fluctuations occur. For high IHR, the material is hardening during the whole deformation and any heterogeneities are suppressed. For pronounced IHR, the SHC is already exhausted at the initial stage of the deformation process. Thus, at the end of the deformation, the material behaves almost ideal-plastically with a higher yield stress. For this reason, heterogeneities also occur in this case.
There is another feature that becomes visible looking at the bottom zone of the billets shown in Figure 5 and Figure 6: the more the material flow omits the outer edge of the channel, the less the bottom zone deforms and the higher the vertical gradient of the effective plastic strain and the billet’s curvature. This detail is in perfect agreement with experimental observations [41,43,44], which further indicates that the FE simulations presented here accurately capture various subtle experimental details.
3.3. Effects of Kinematic Hardening
The difference between kinematic and isotropic hardening is the plastic anisotropy induced by kinematic hardening. While modeling of isotropic hardening usually involves only the scalar equivalent stress, kinematic hardening is based on the stress and back stress tensor (cf. Equation (3)). Hence, kinematic hardening not only depends on the principal stresses, but also on the principal directions.
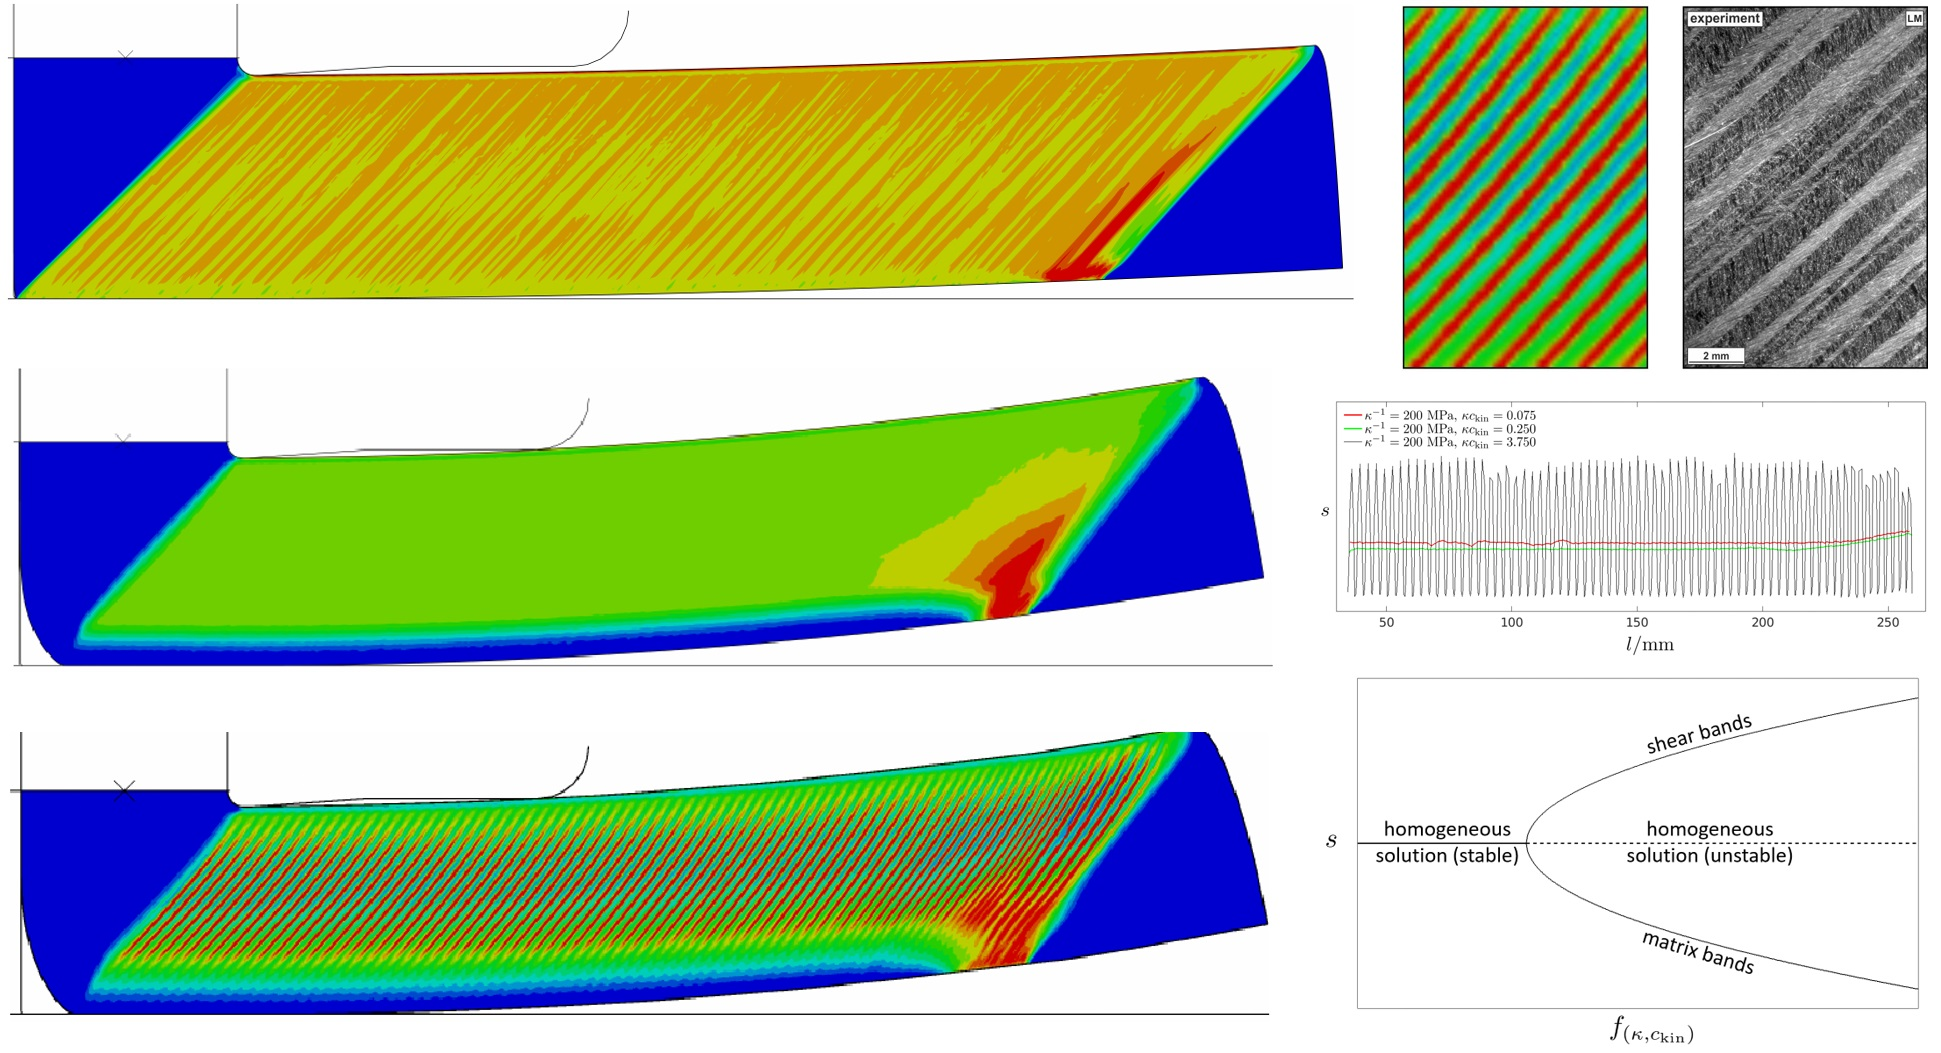
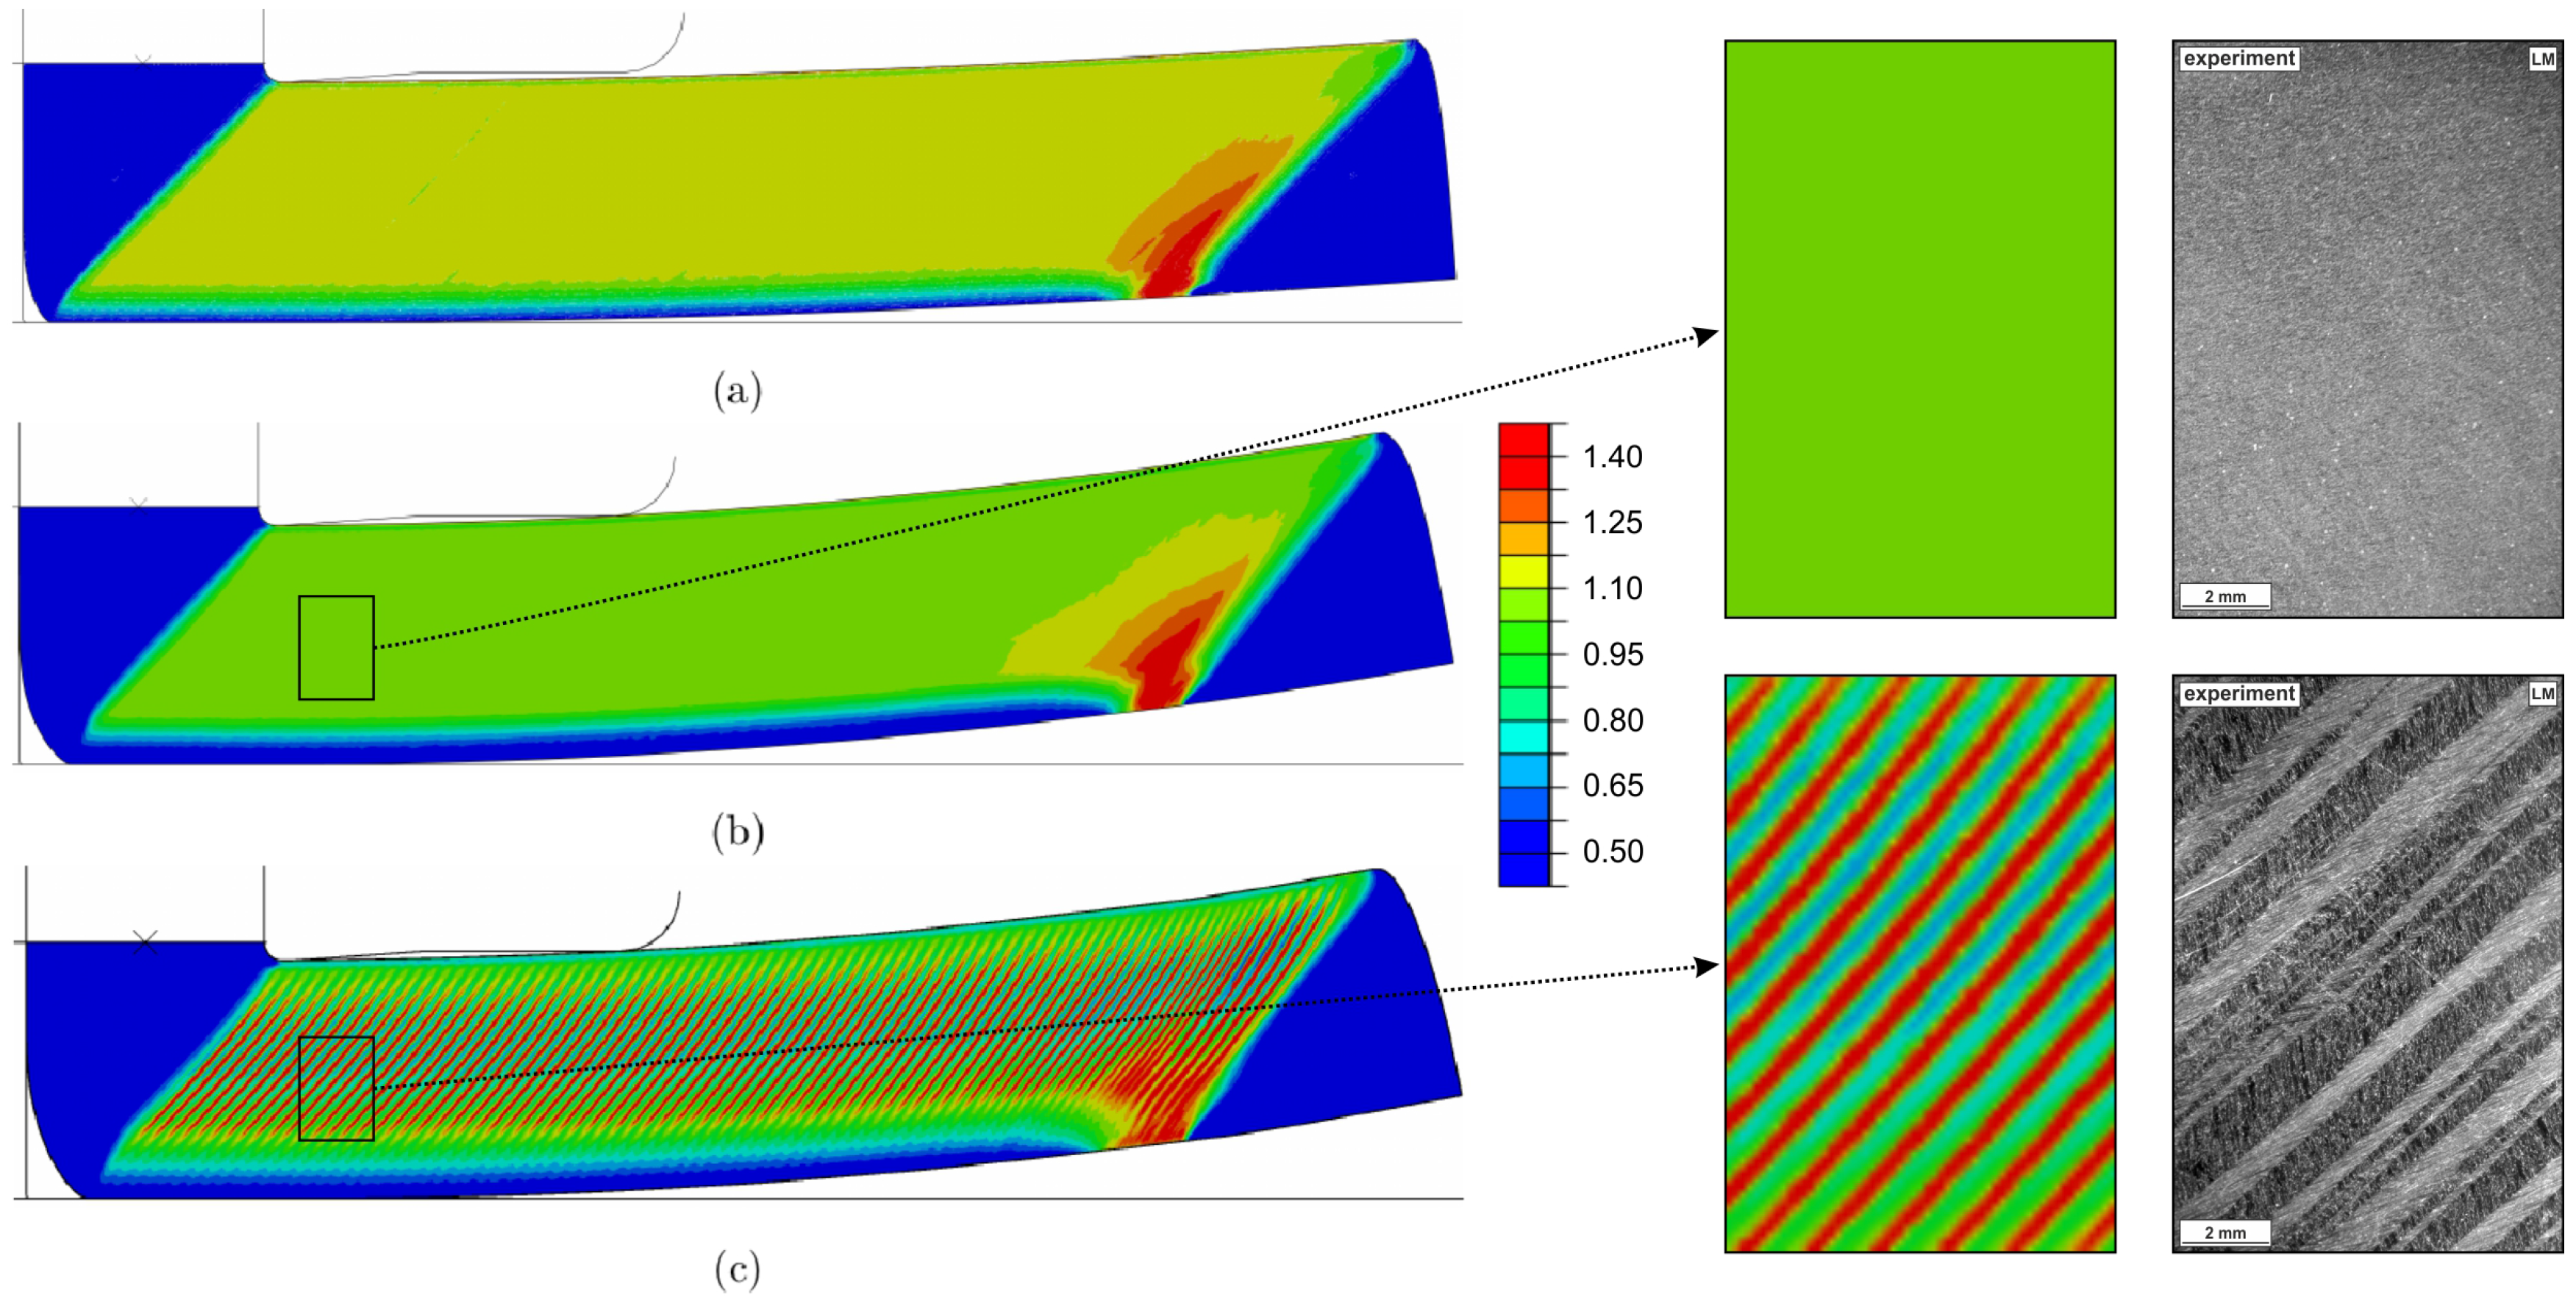
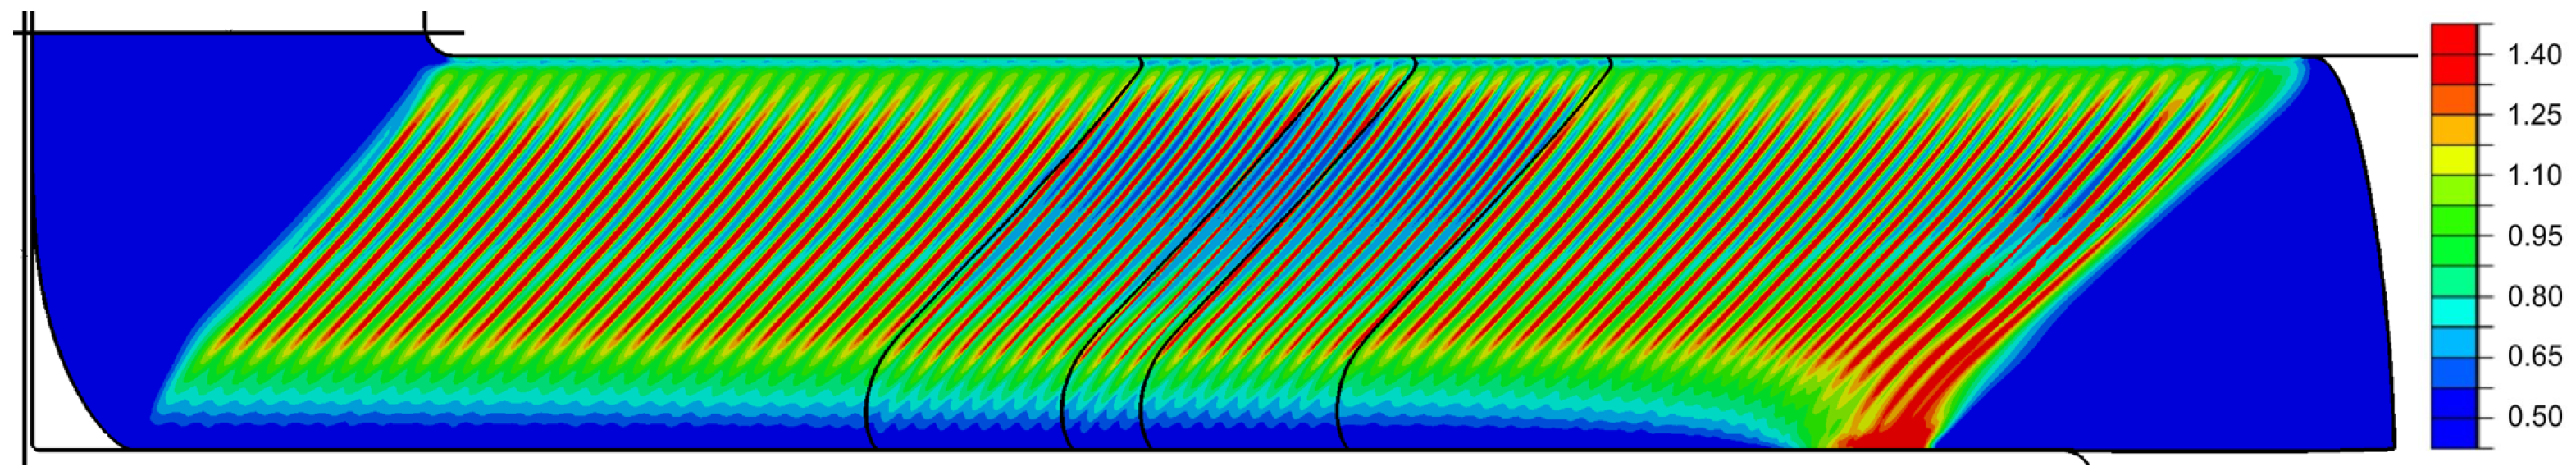
A high SHC of was chosen and the IHR was varied in a similar way as in the investigations for isotropic hardening. The results shown in Figure 7 are similar to those of isotropic hardening. At low IHR and at pronounced IHR strain, inhomogeneities occur, whereas, at high IHR, the inhomogeneities are suppressed. However, there is an important difference: at pronounced IHR, the deformation is not only inhomogeneous but, as an entirely new feature, a very regular pattern emerges. Additionally, the difference between the minimum and maximum strain values in the distinctly different regions is high ().
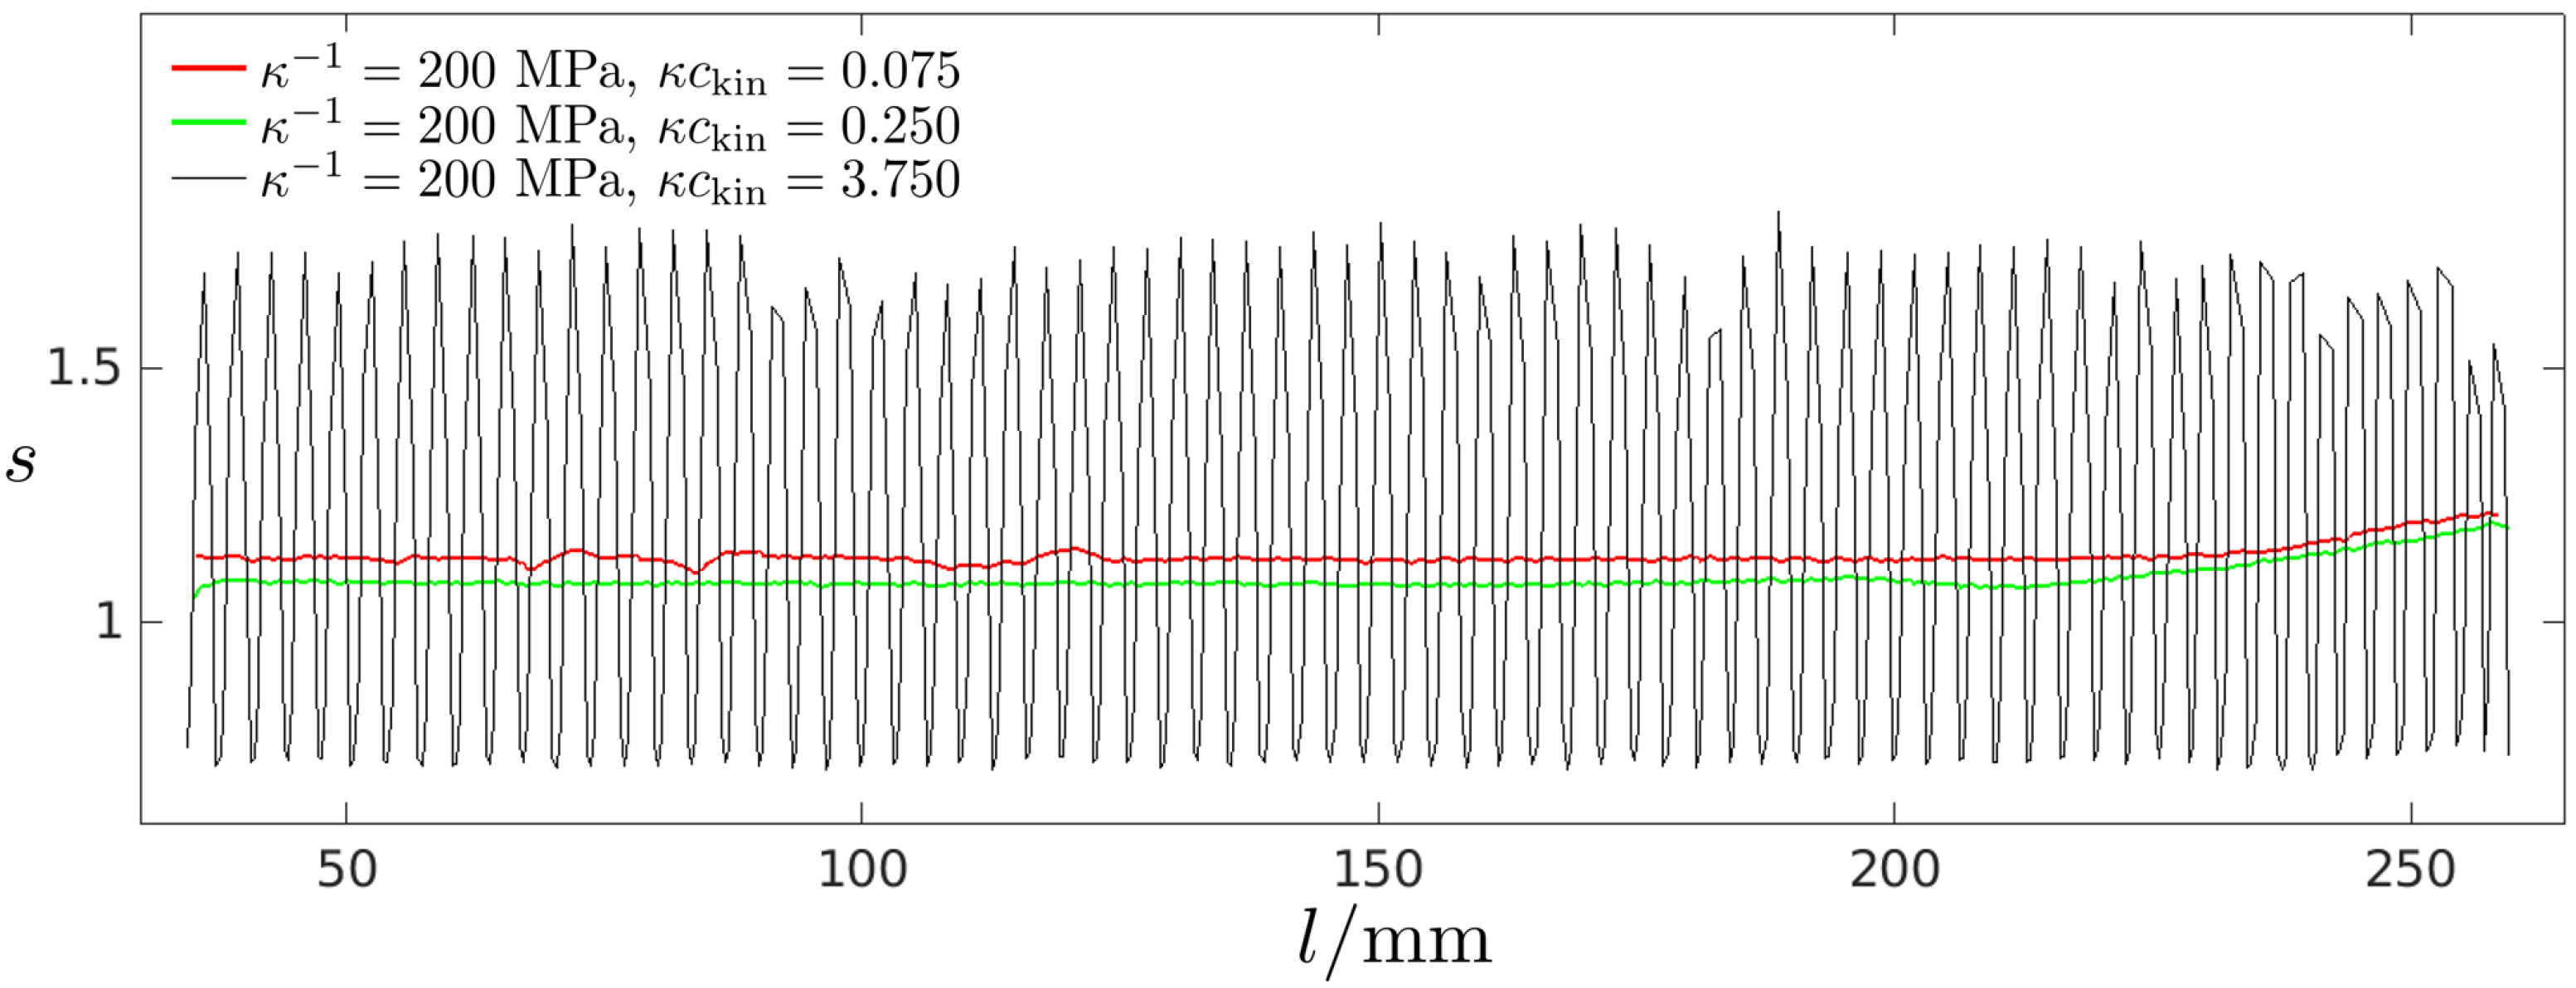
This type of localized deformation is very similar to the shear and matrix band structure observed in the experiment (cf. Section 3.4). The regularity of these bands can also be documented by plotting the progression of the effective plastic strain along the length of the billet, Figure 8. The undeformed regions of the billet (i.e., the material near the ends of the billet that has not passed through the shear zone during ECAP) and the region of unsteady flow at the beginning of the process are omitted in this analysis; the total length of the billet is 300 mm. Furthermore, an animation of this simulation is provided in the supplementary material of this paper.
To ensure a converged solution, the simulation model of the billet was divided into five parts (cf. Figure 9). The two big outer parts are meshed with an element size of mm, the two parts next to them with an element size of mm and the part in the midst with an element size of mm. Despite the mesh size variation with the length of the billet, the shear and matrix bands dimensions remain constant and some shear bands cross the border between two mesh parts. This shows that the dimensions and the direction of the shear bands do not depend on the mesh. The difference in the effective plastic strain increases with a further refinement of the mesh.
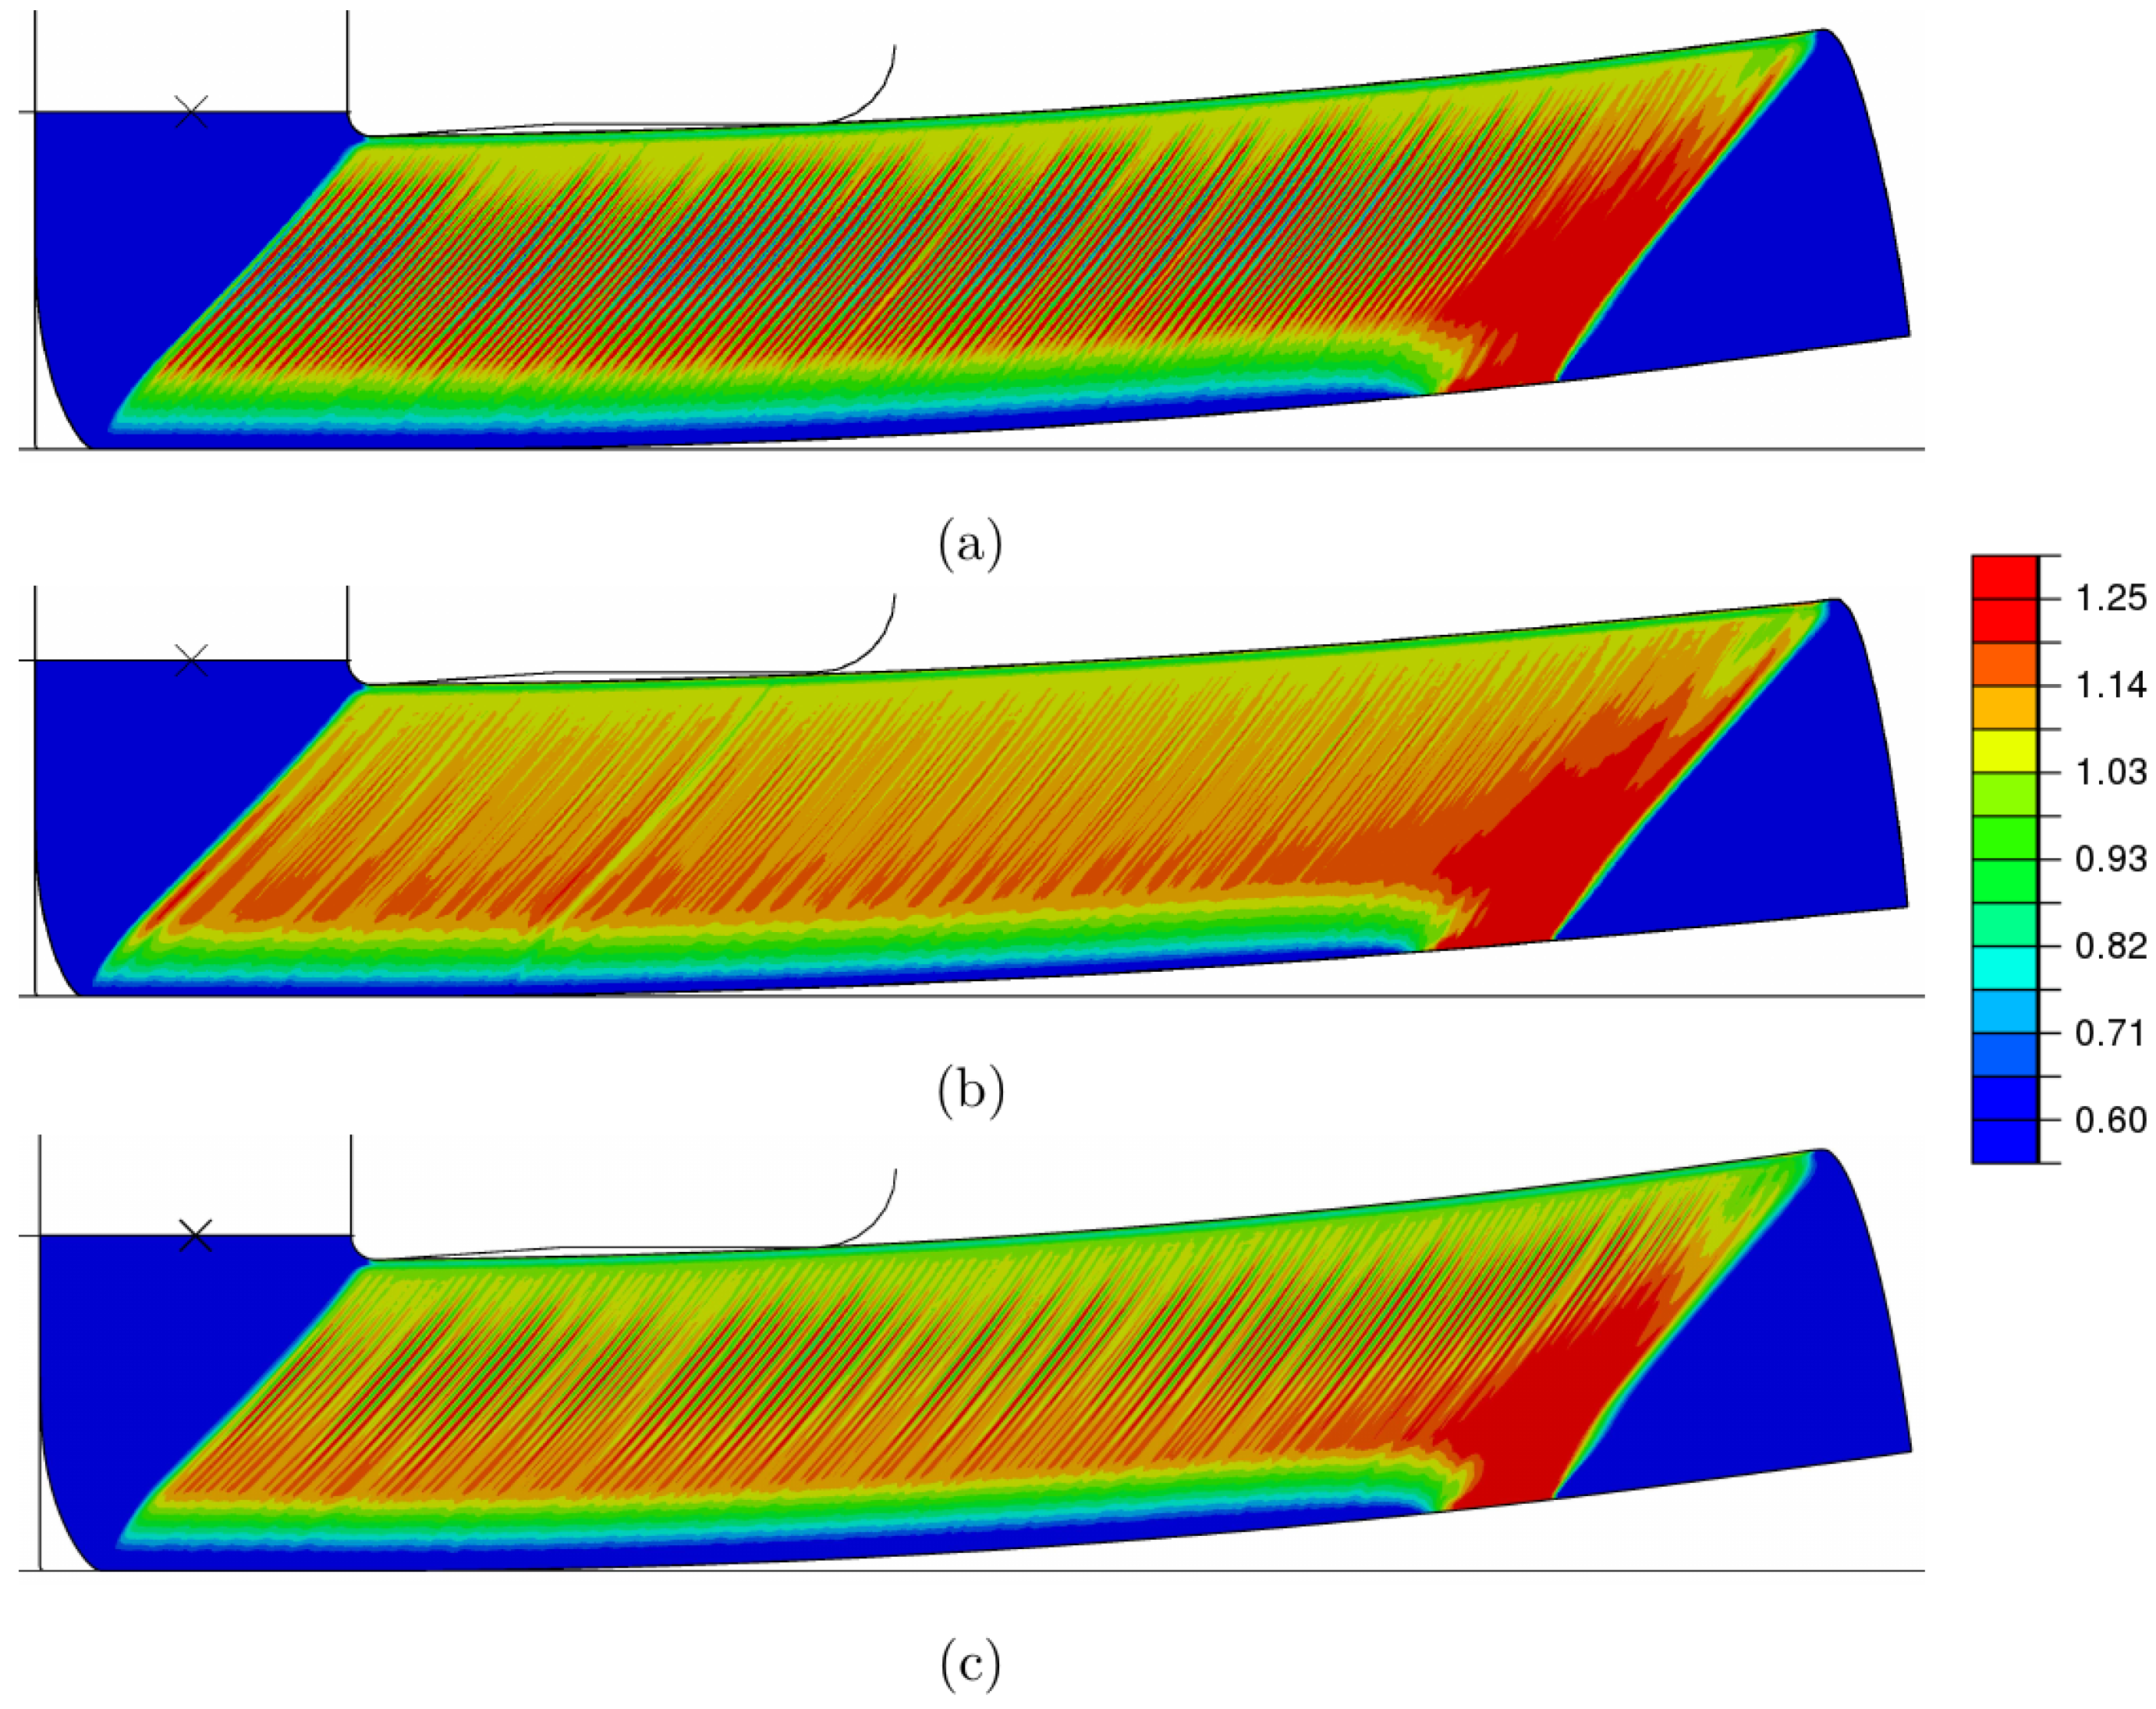
In order to further analyze and confirm the observation that shear bands are formed when there is a pronounced IHR, additional simulations were carried out, varying and . In Figure 10, three examples are shown: in simulation (a), was doubled resulting in an increase of the IHR (cf. Section 2). With this increase of the IHR, many more shear bands are formed. In simulation (b), is halved, which decreases the SHC and reduces the IHR. This also increases the number of shear bands, but the difference in effective strain between shear and matrix bands is considerably decreased (). In simulation (c), and are halved such that the hardening capacity is lower, but the IHR remains unchanged. In this case, the number of shear bands increases as well compared to Figure 7c. Based on these (and many other performed) simulations, it can be concluded that there is a strong effect of the kinematic hardening parameters on the emergence, number, and shape of the bands as well as on the amount of plastic strains within them. However, this effect is strongly nonlinear and the occurrence of distinct shear bands cannot be simply related to a single material parameter in the framework of the present material model.
Finally, one key result of the present study is that—while fluctuations in terms of the distribution of effective strains along the billet can in principle be simulated both by assuming isotropic or kinematic hardening, and using a wide variety of material parameters—only kinematic hardening appears to be suitable for an accurate simulation of distinct shear bands that differ from the adjacent matrix bands by relatively large amounts of plastic strain.
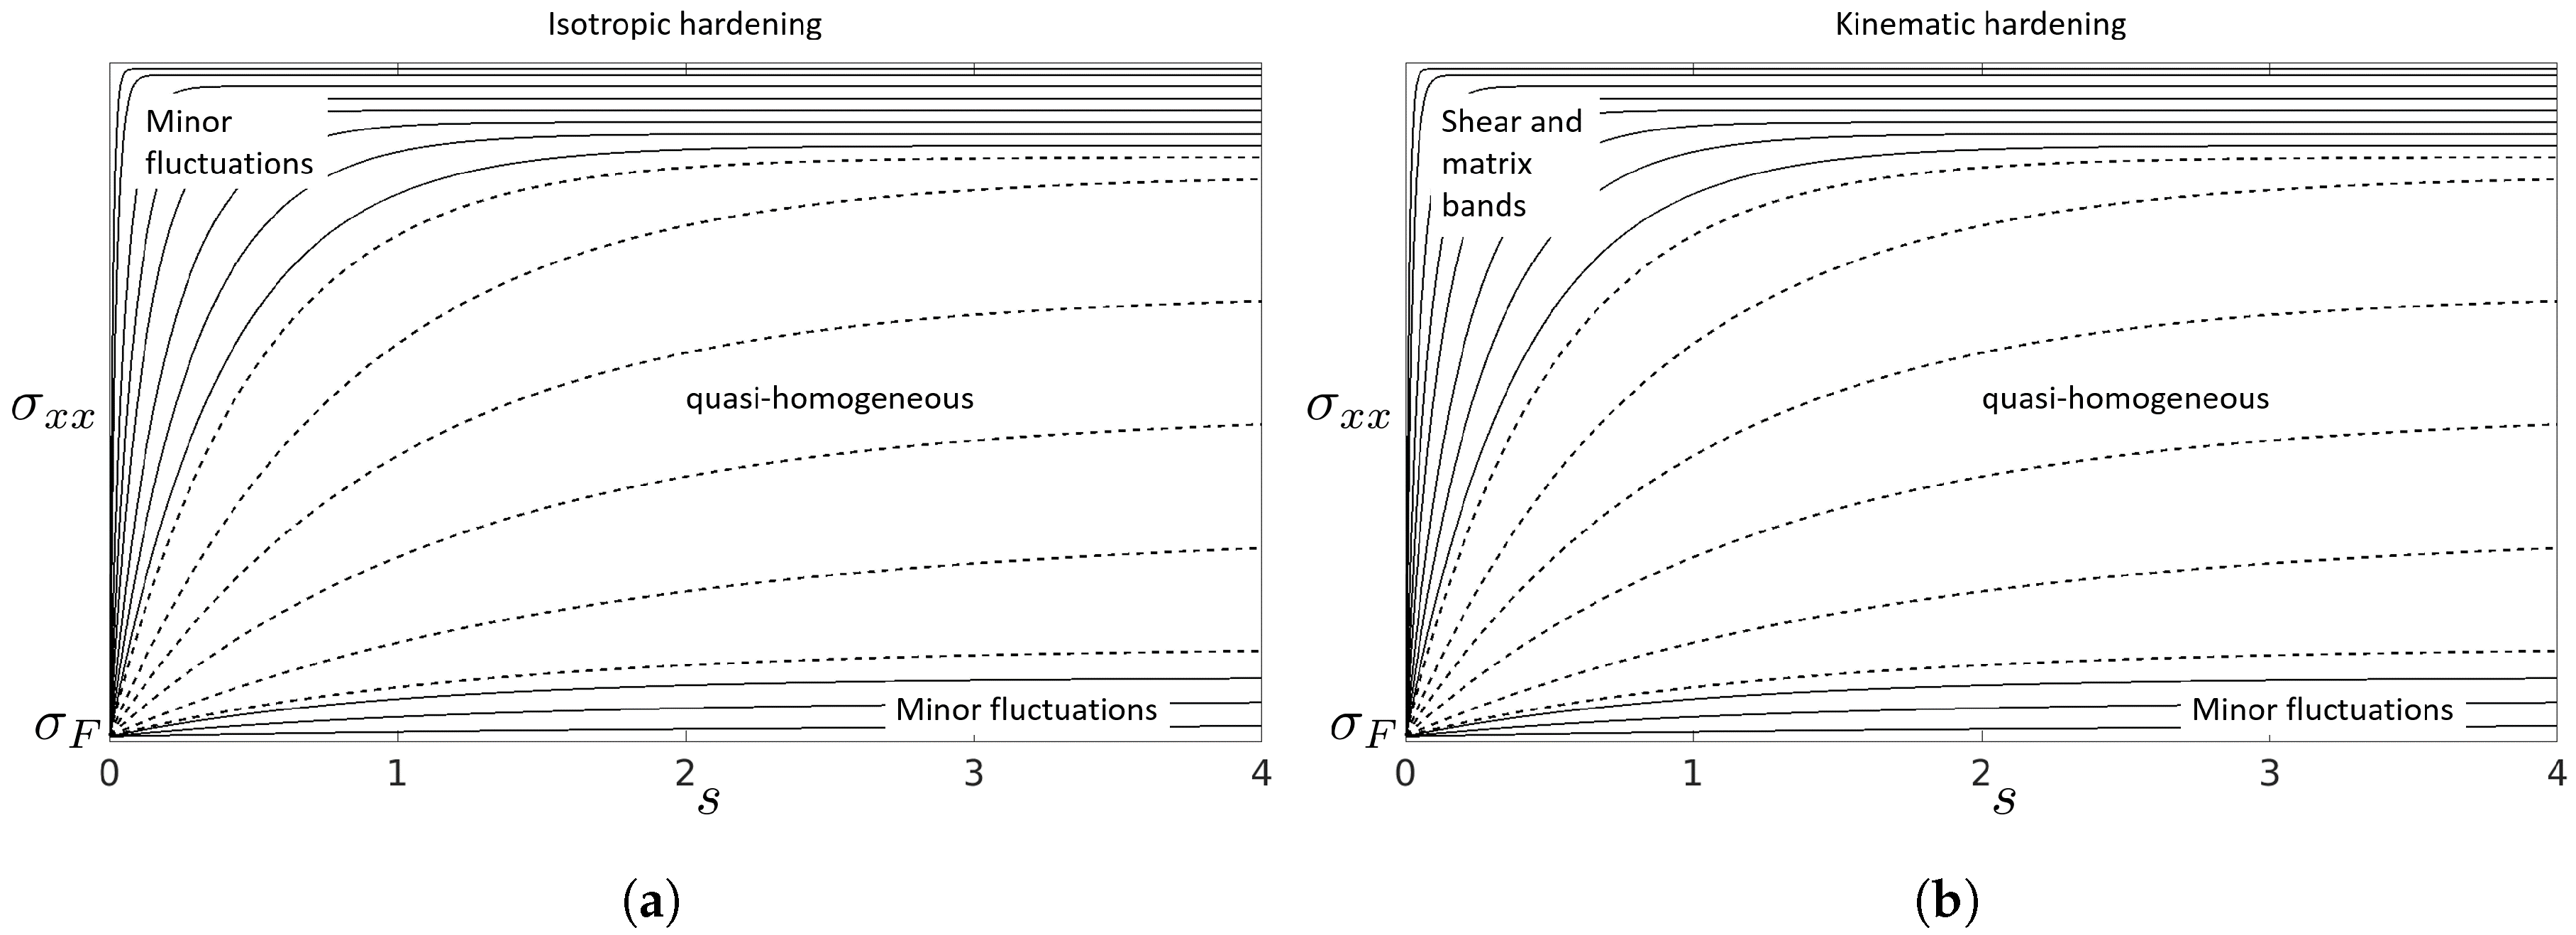
The results may be summarized in a generalized diagram where the parameter regions are indicated with corresponding uniaxial flow curves as function of s (Figure 11). (Note that the diagram is only valid for reasonable i.e., sufficiently high values of the SHC). Heterogeneities occur in two different regions, defined approximately by the solid lines: in the region where the hardening rate is too low during the whole deformation such that the material behavior is similar to ideal-plastic, as well as in the region where the maximum hardening capacity is reached shortly after the beginning of the deformation. For isotropic hardening (cf. Figure 11a), all heterogeneities remain minor fluctuations whereas for kinematic hardening (cf. Figure 11b) shear and matrix bands are formed. The region defined approximately by the dotted curves corresponds to the quasi-homogeneous solution.
Remark 1.
Only the reference simulation (and not a solution with such strong heterogeneities as in Figure 7c, Figure 9 and Figure 10) was considered in the convergence studies. However, here a converged solution with respect to the number of the shear and matrix bands is presented. While the number of shear and matrix bands stays constant when the mesh size is further reduced, the values of the effective strain in the bands have not fully converged yet.
3.4. Experimental Validation
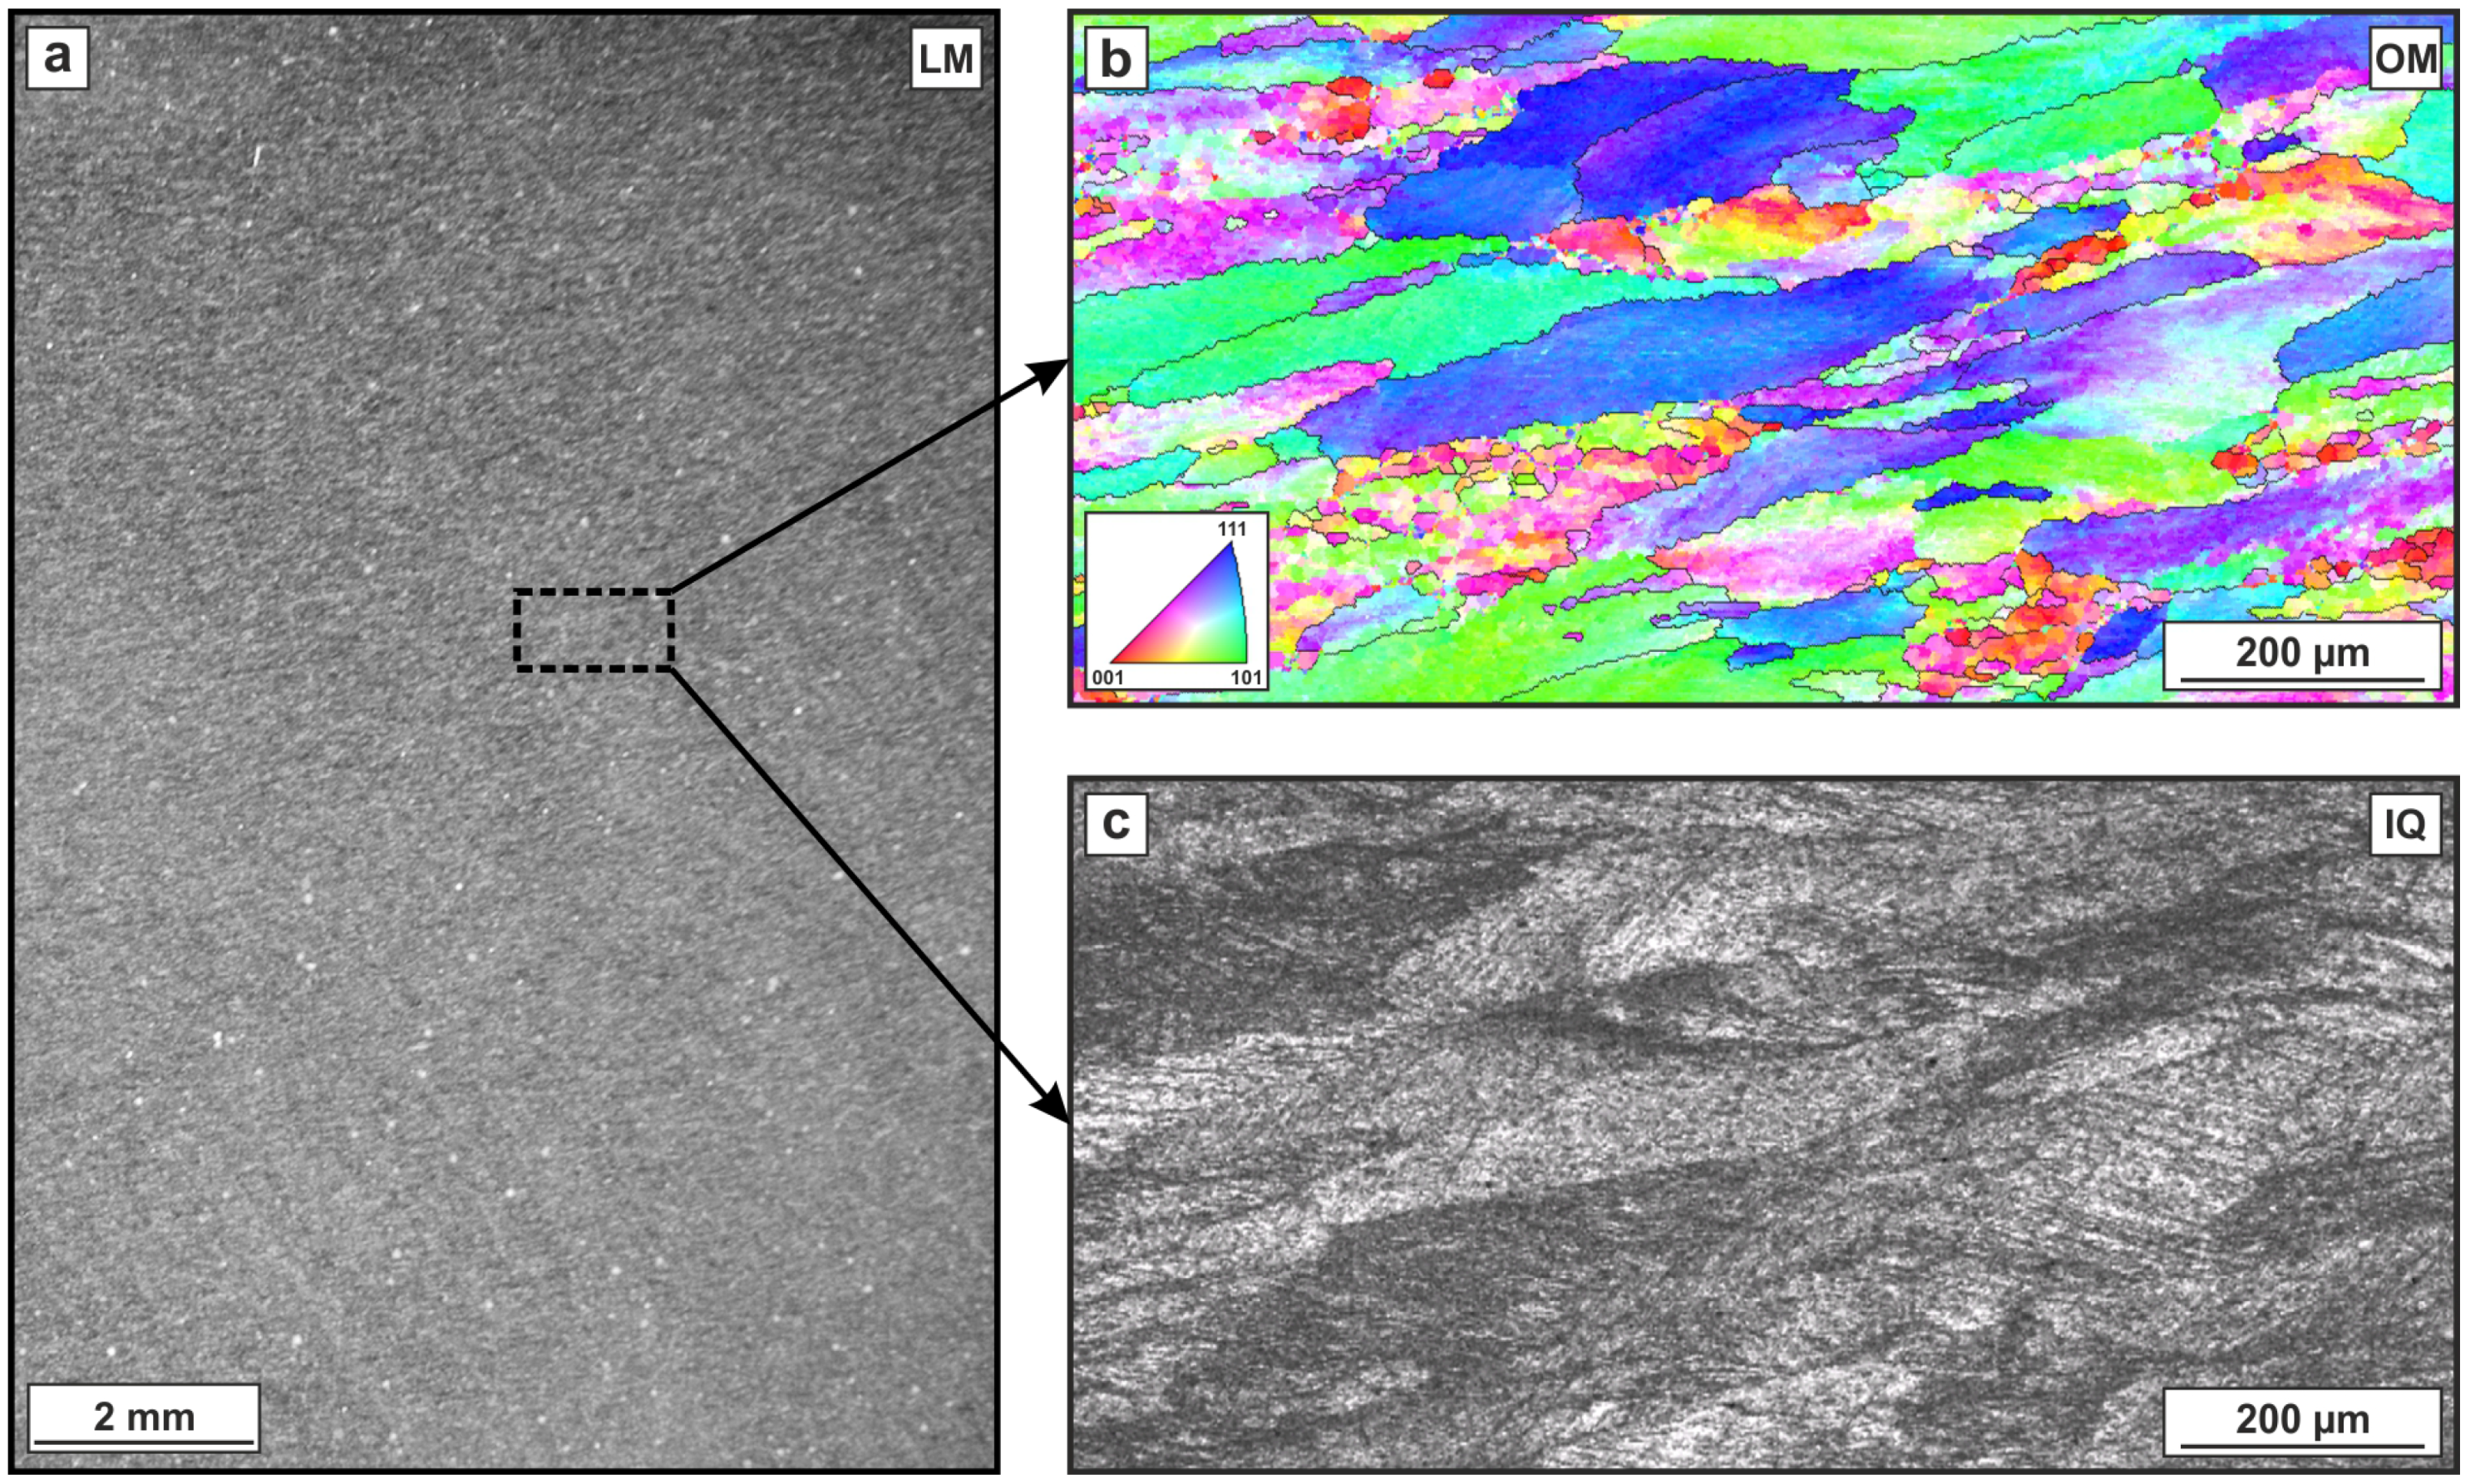
In order to validate the simulation results, complementary experimental studies were carried out using technical parameters where shear localization has been reported before. It is well known that ECAP typically introduces a homogeneous shear deformation for many metallic materials [9]. One main requirement for a homogeneous deformation is a sufficient SHC of the processed material. In the case of processing conventional fully recrystallized 6000 series aluminum alloys, a homogeneous introduction of strain is generally observed [43,44,45]. Figure 12 shows the microstructure of an ECAP-processed billet (AA6060) that has been processed conventionally (hot extrusion including full recrystallization) prior to ECAP. Figure 12a shows an optical micrograph of the severely sheared microstructure without any macroscopic heterogeneities. A detailed view into the microstructure by scanning electron microscopy (in electron back-scatter diffraction mode, EBSD) reveals minor differences regarding the locally introduced strains that result from the different crystallographic orientations of Figure 12b,c. These microstructural results are completely in line with earlier reports [9,46,47] showing macroscopically homogeneous deformation for similar alloys.
These results were obtained for a fully recrystallized material that exhibits a sufficiently high hardening rate throughout the whole deformation process. The analogous simulation parameters in the conducted simulations for isotropic hardening are MPa, and for kinematic hardening MPa, . Both simulations result in a quasi-homogeneous solution, as shown for isotropic hardening in Figure 6b and for kinematic hardening in Figure 7b. Thus, a very good accordance between simulation and experiments is achieved for this kind of material condition.
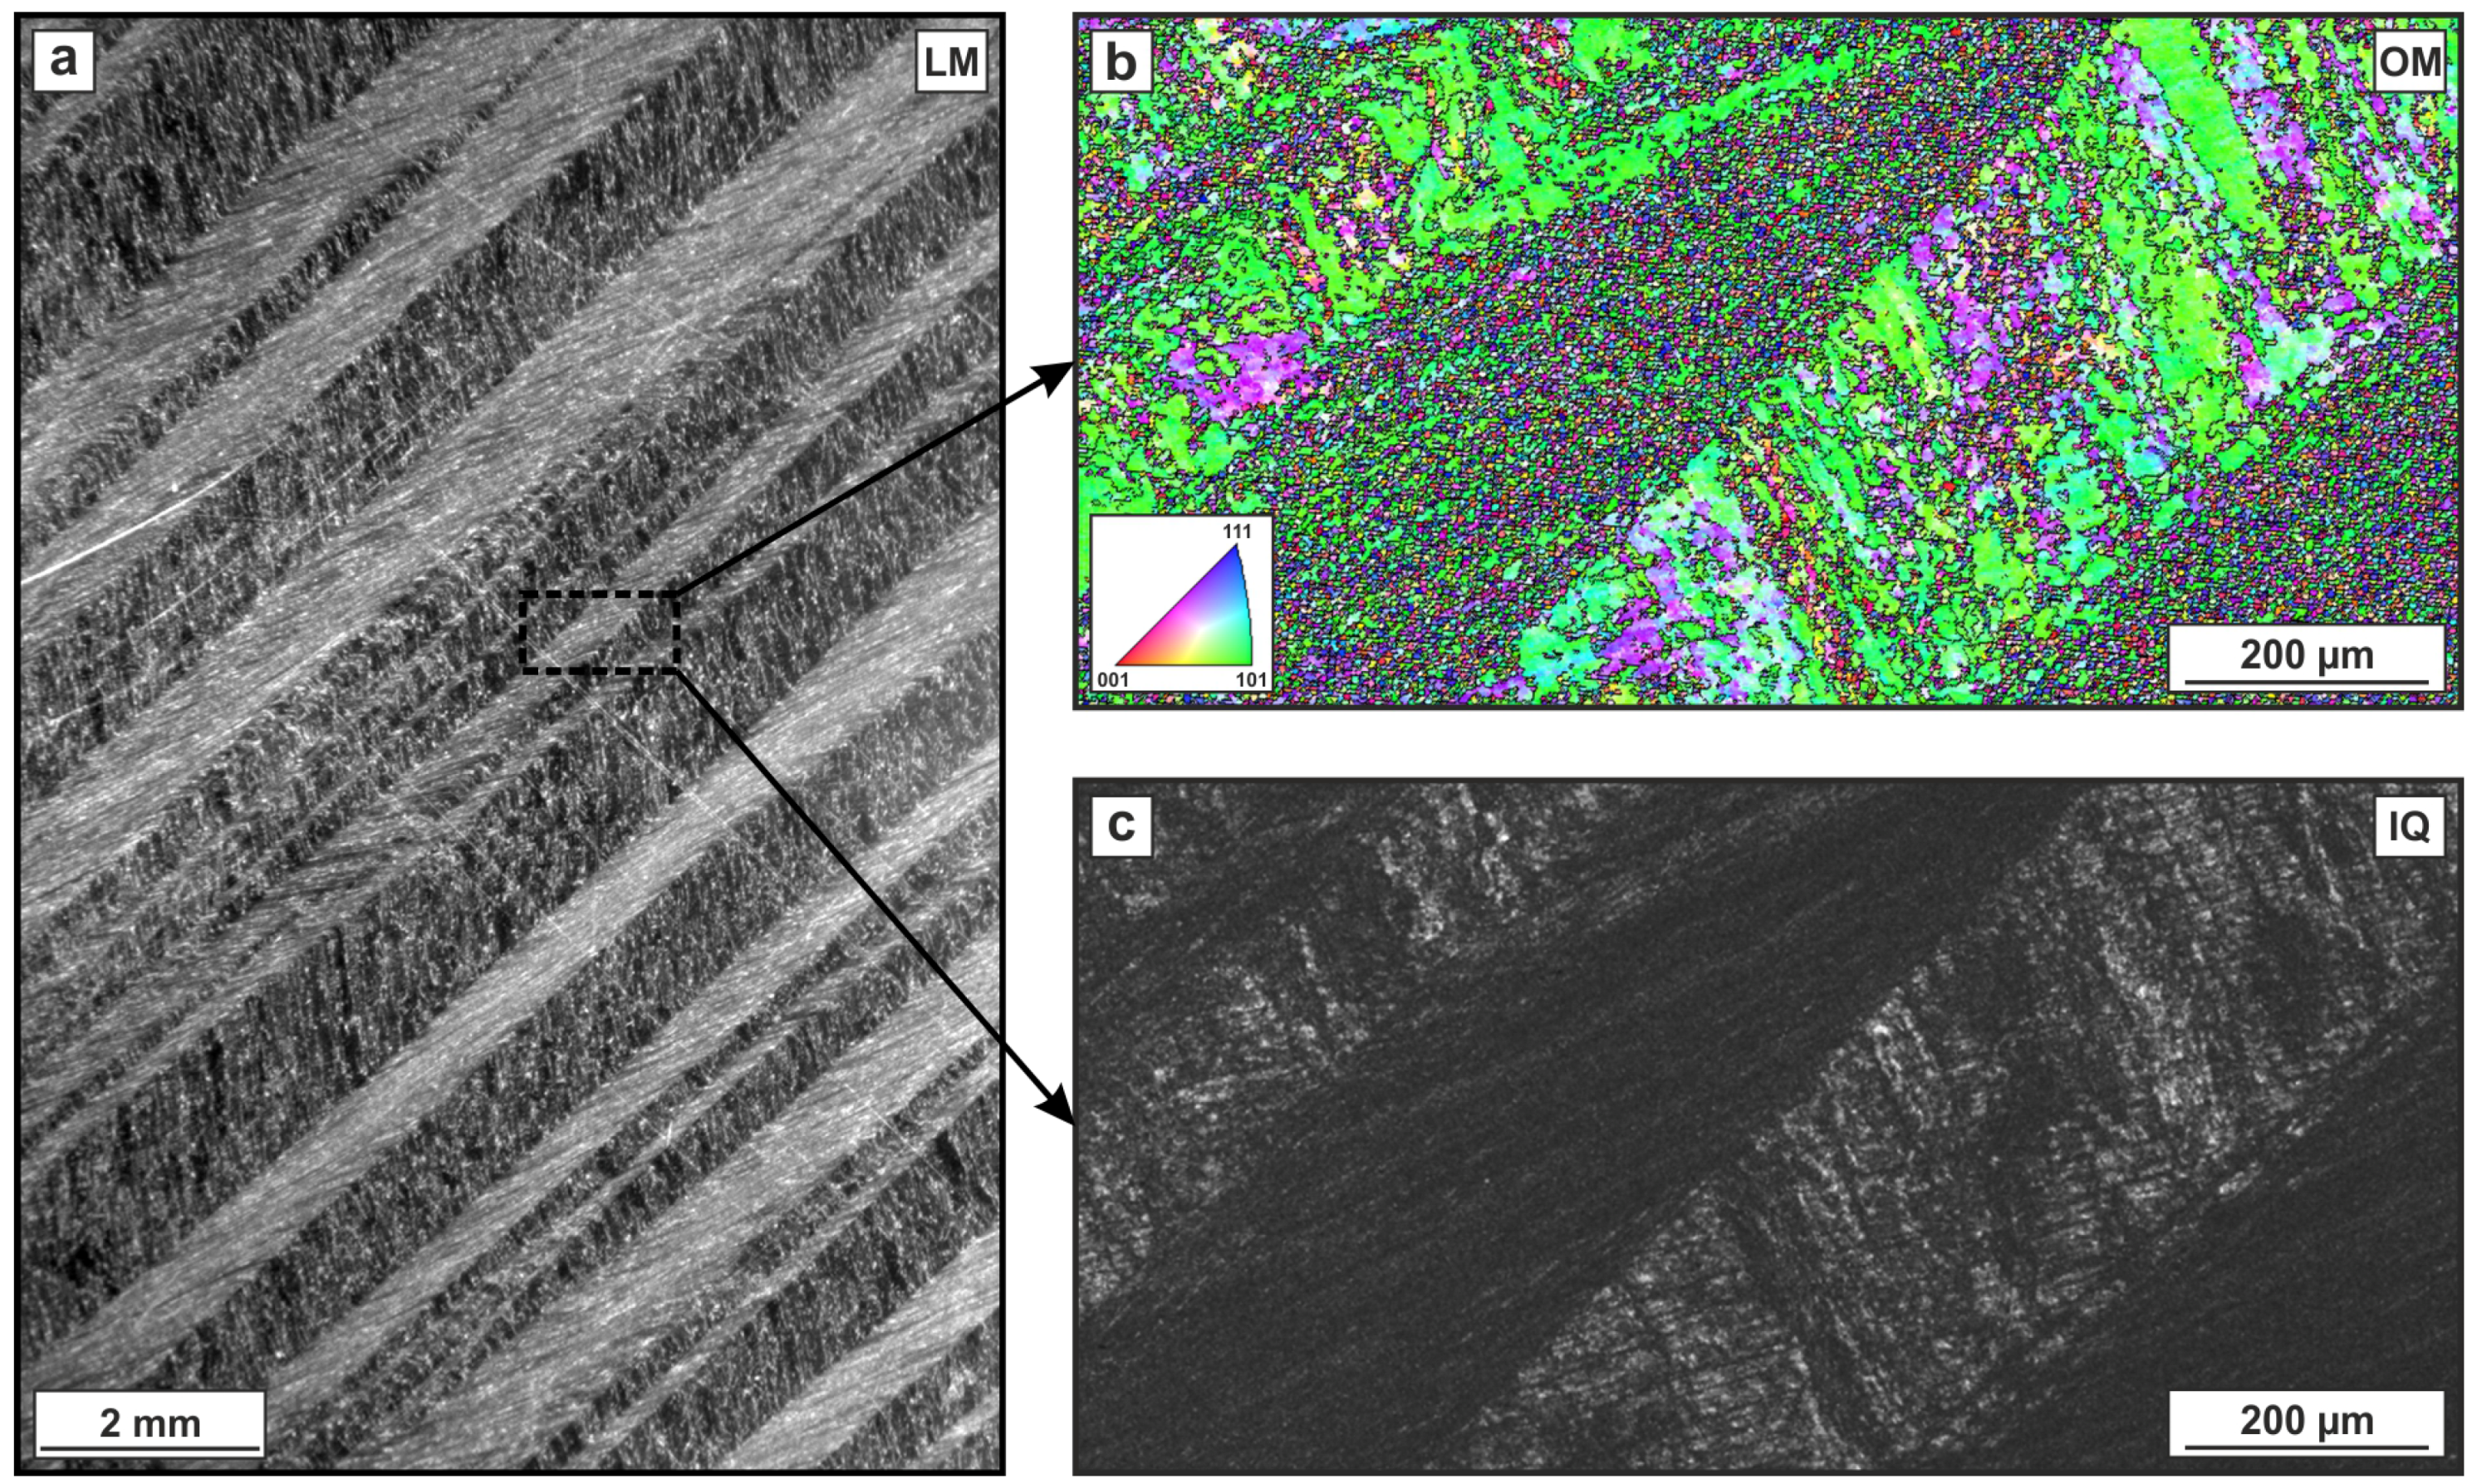
In contrast to the homogeneous microstructure observed after ECAP of a fully recrystallized material, a strongly heterogeneous structure was found after processing a severely cold-worked condition (cold extrusion [48]) of the same alloy. As a consequence of cold extrusion the material exhibits a very limited SHC compared to its hot-extruded counterpart. Figure 13a shows the microstructure after ECAP. It is characterized by an alternating arrangement of two fundamentally different types of macroscopic bands: Shear bands, where the material got severely sheared and matrix bands that exhibit much lower strains. Figure 13c shows an image quality map of an EBSD measurement. Darker areas are associated with a low band contrast as a result of severe distortion of the lattice due to inherent strain. The band structure is oriented under an angle of exactly with respect to the pressing direction, which corresponds to an alignment parallel to the theoretical shear zone [3,49] of the ECAP die. The mean width of both band types is approximately 400 μm resulting in an almost equal area fraction (≈50%). It should be noted that the material might show a pronounced kinematic strain hardening caused by the previous cold working by extrusion at ambient temperature.
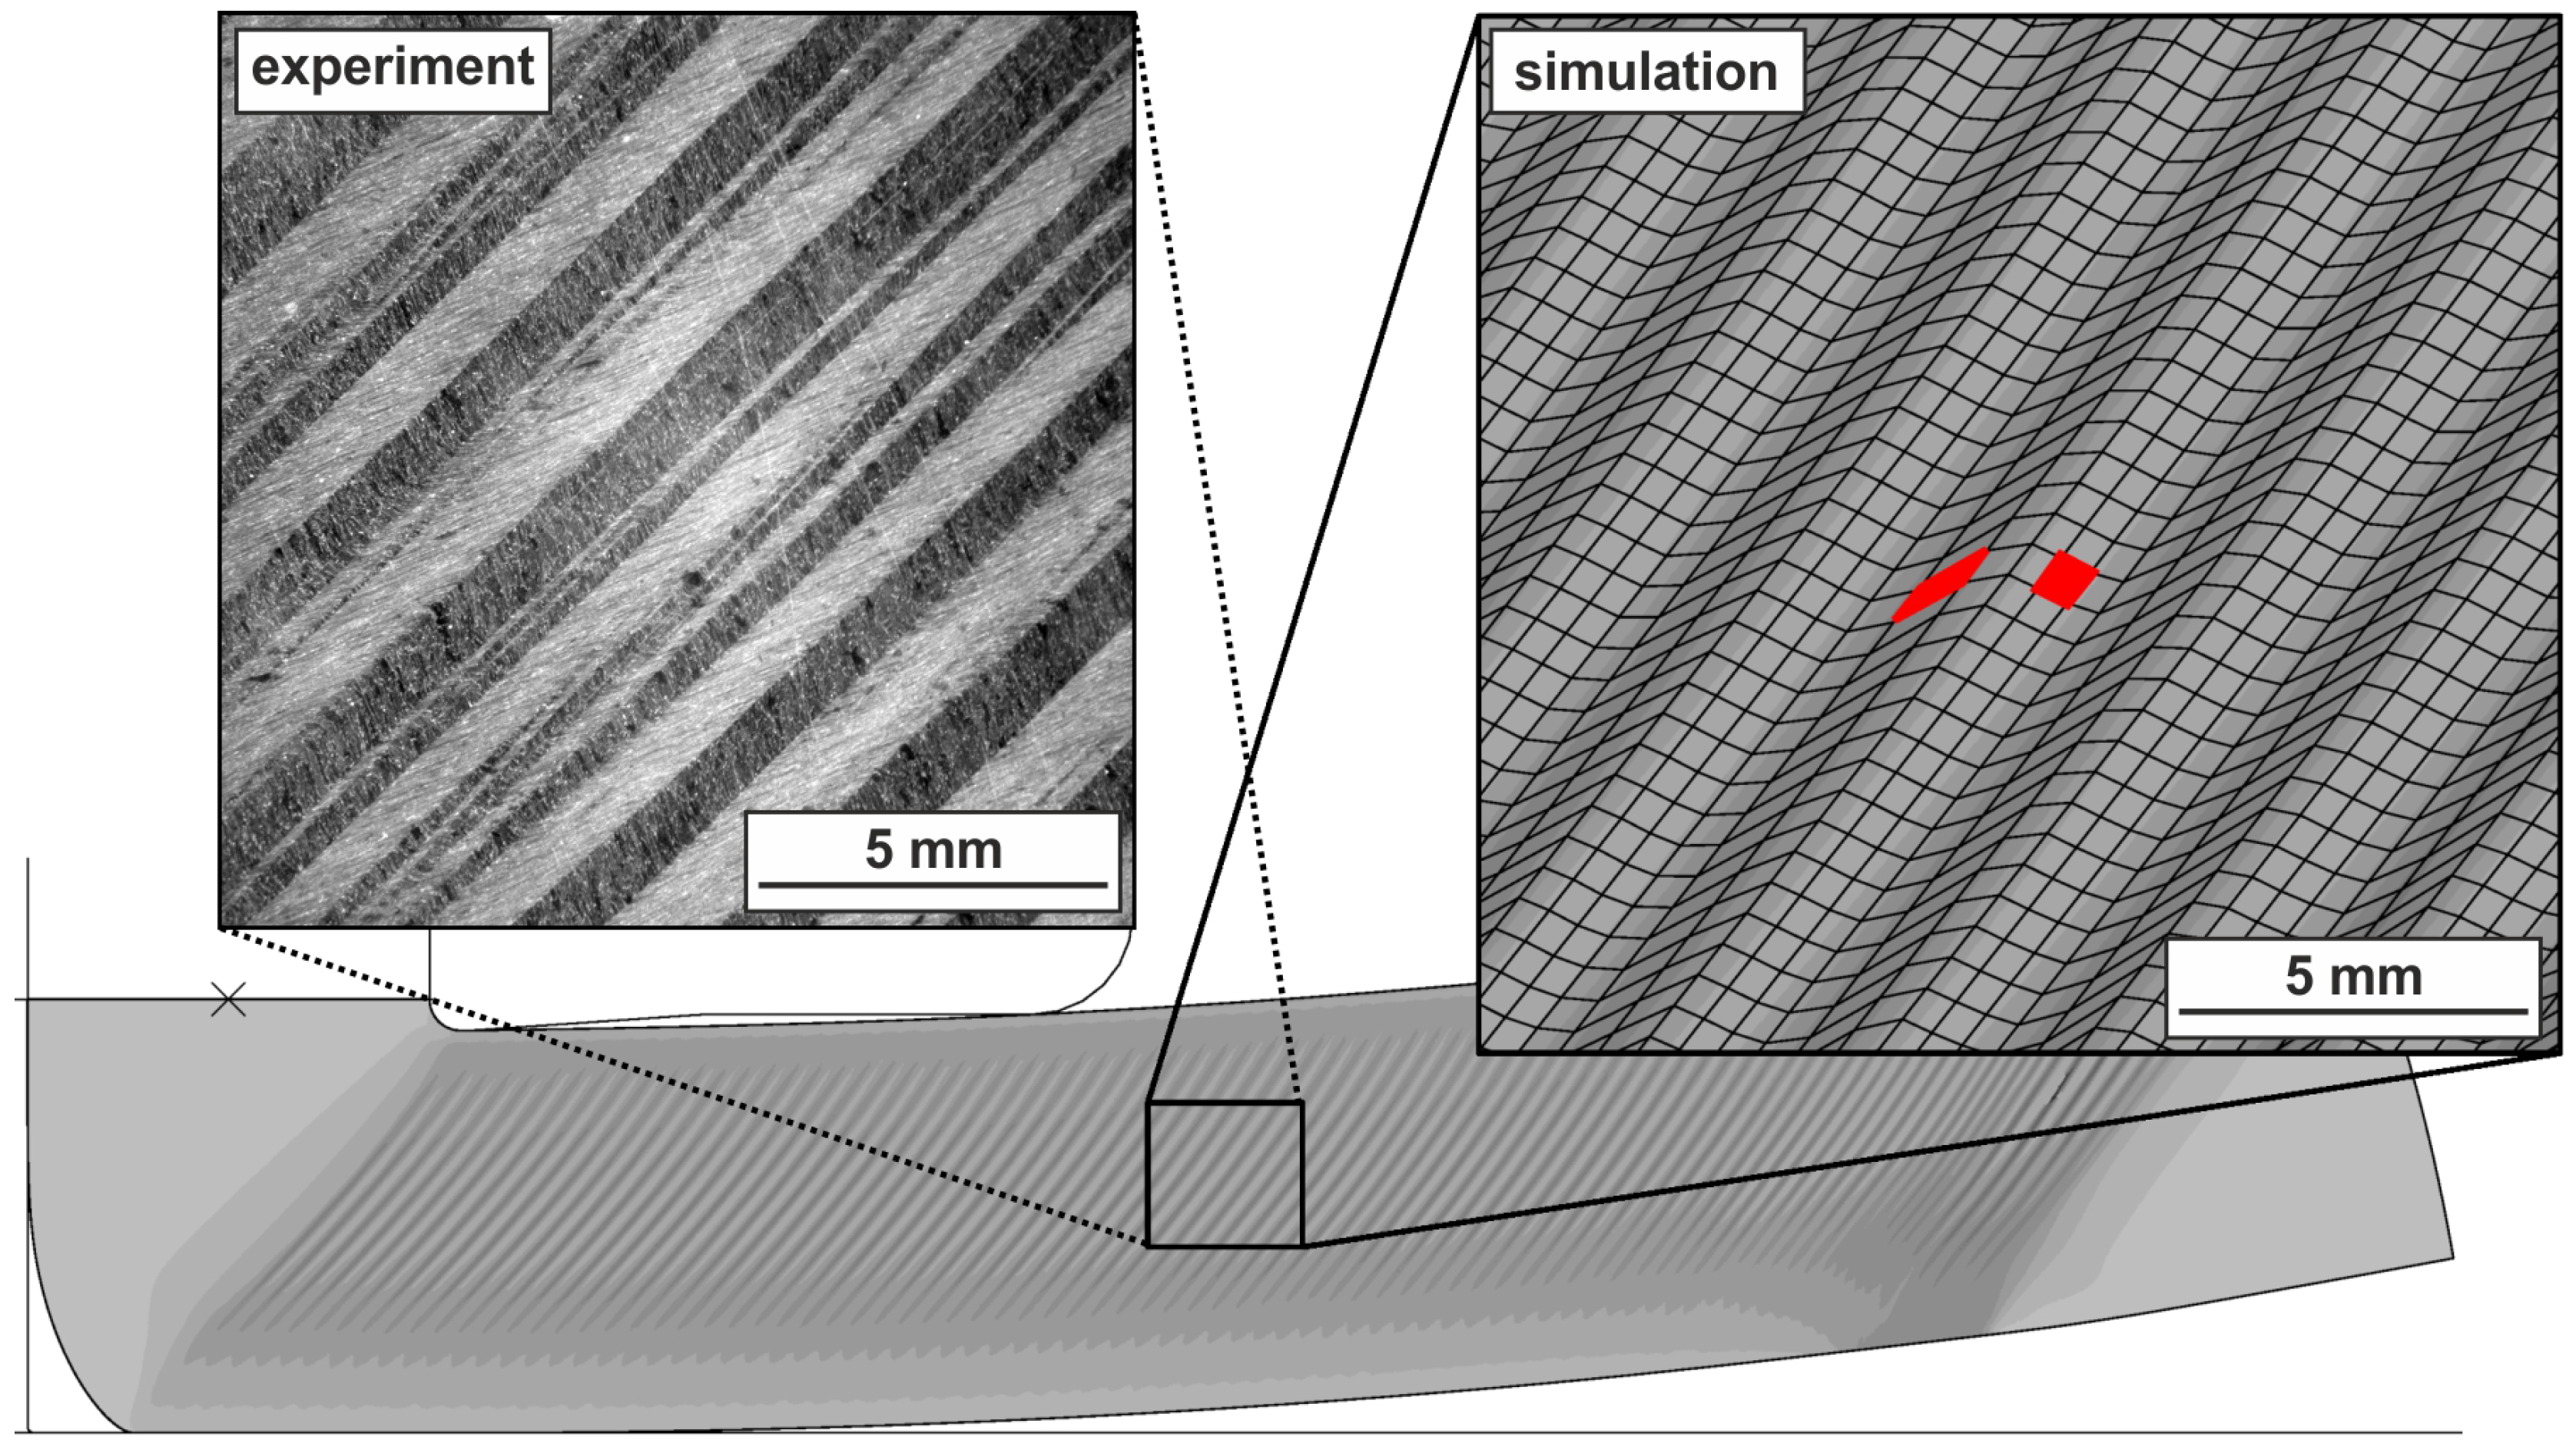
The material behavior in this case corresponds to the simulations for isotropic hardening with MPa, or for kinematic hardening with MPa, . These simulations show a very small SHC during the entire ECAP pass (cf. Remark 2). As shown in Figure 7, there exists a very good agreement between the result of the simulation with kinematic hardening and the experimental strain distributions of shear and matrix band. (An explanation of why a simulation including only isotropic hardening cannot produce shear and matrix bands is given in Section 4.) Consequently, a scale comparison was conducted in Figure 14, which also shows excellent agreement. The length scales of the shear and matrix bands in the experiments and in the simulations are nearly equal.
Remark 2.
To be more precise, these simulations show at the beginning of the process a high SHC, but also a pronounced hardening rate. With this particular material behavior, the hardening of the material during the extrusion prior to ECAP can be captured. However, after a minimal plastic deformation in the simulation, the material already reaches the state of a very small remaining SHC.
Despite the inherent simplifying assumptions (cf. Section 2) and even though the experiments are affected by various technological influencing factors like friction, there is a close agreement between the simulations and the experimental observations. This encourages and motivates further analysis of the microstructural and mechanical mechanisms that lead to the formation of shear bands during ECAP. A first attempt to more generally understand which conditions lead to distinct shear localization is given below.
4. Remarks on the Mechanism of Heterogeneous Plastic Flow
To get a more detailed description of the localization mechanism, two representative finite elements are chosen: one element of a shear and one element of a matrix band, as depicted in Figure 14 (simulation). These elements are selected far away from all boundaries of the ECAP tool, such that no boundary effects affect the results. For these elements, the stress and strain state is evaluated.
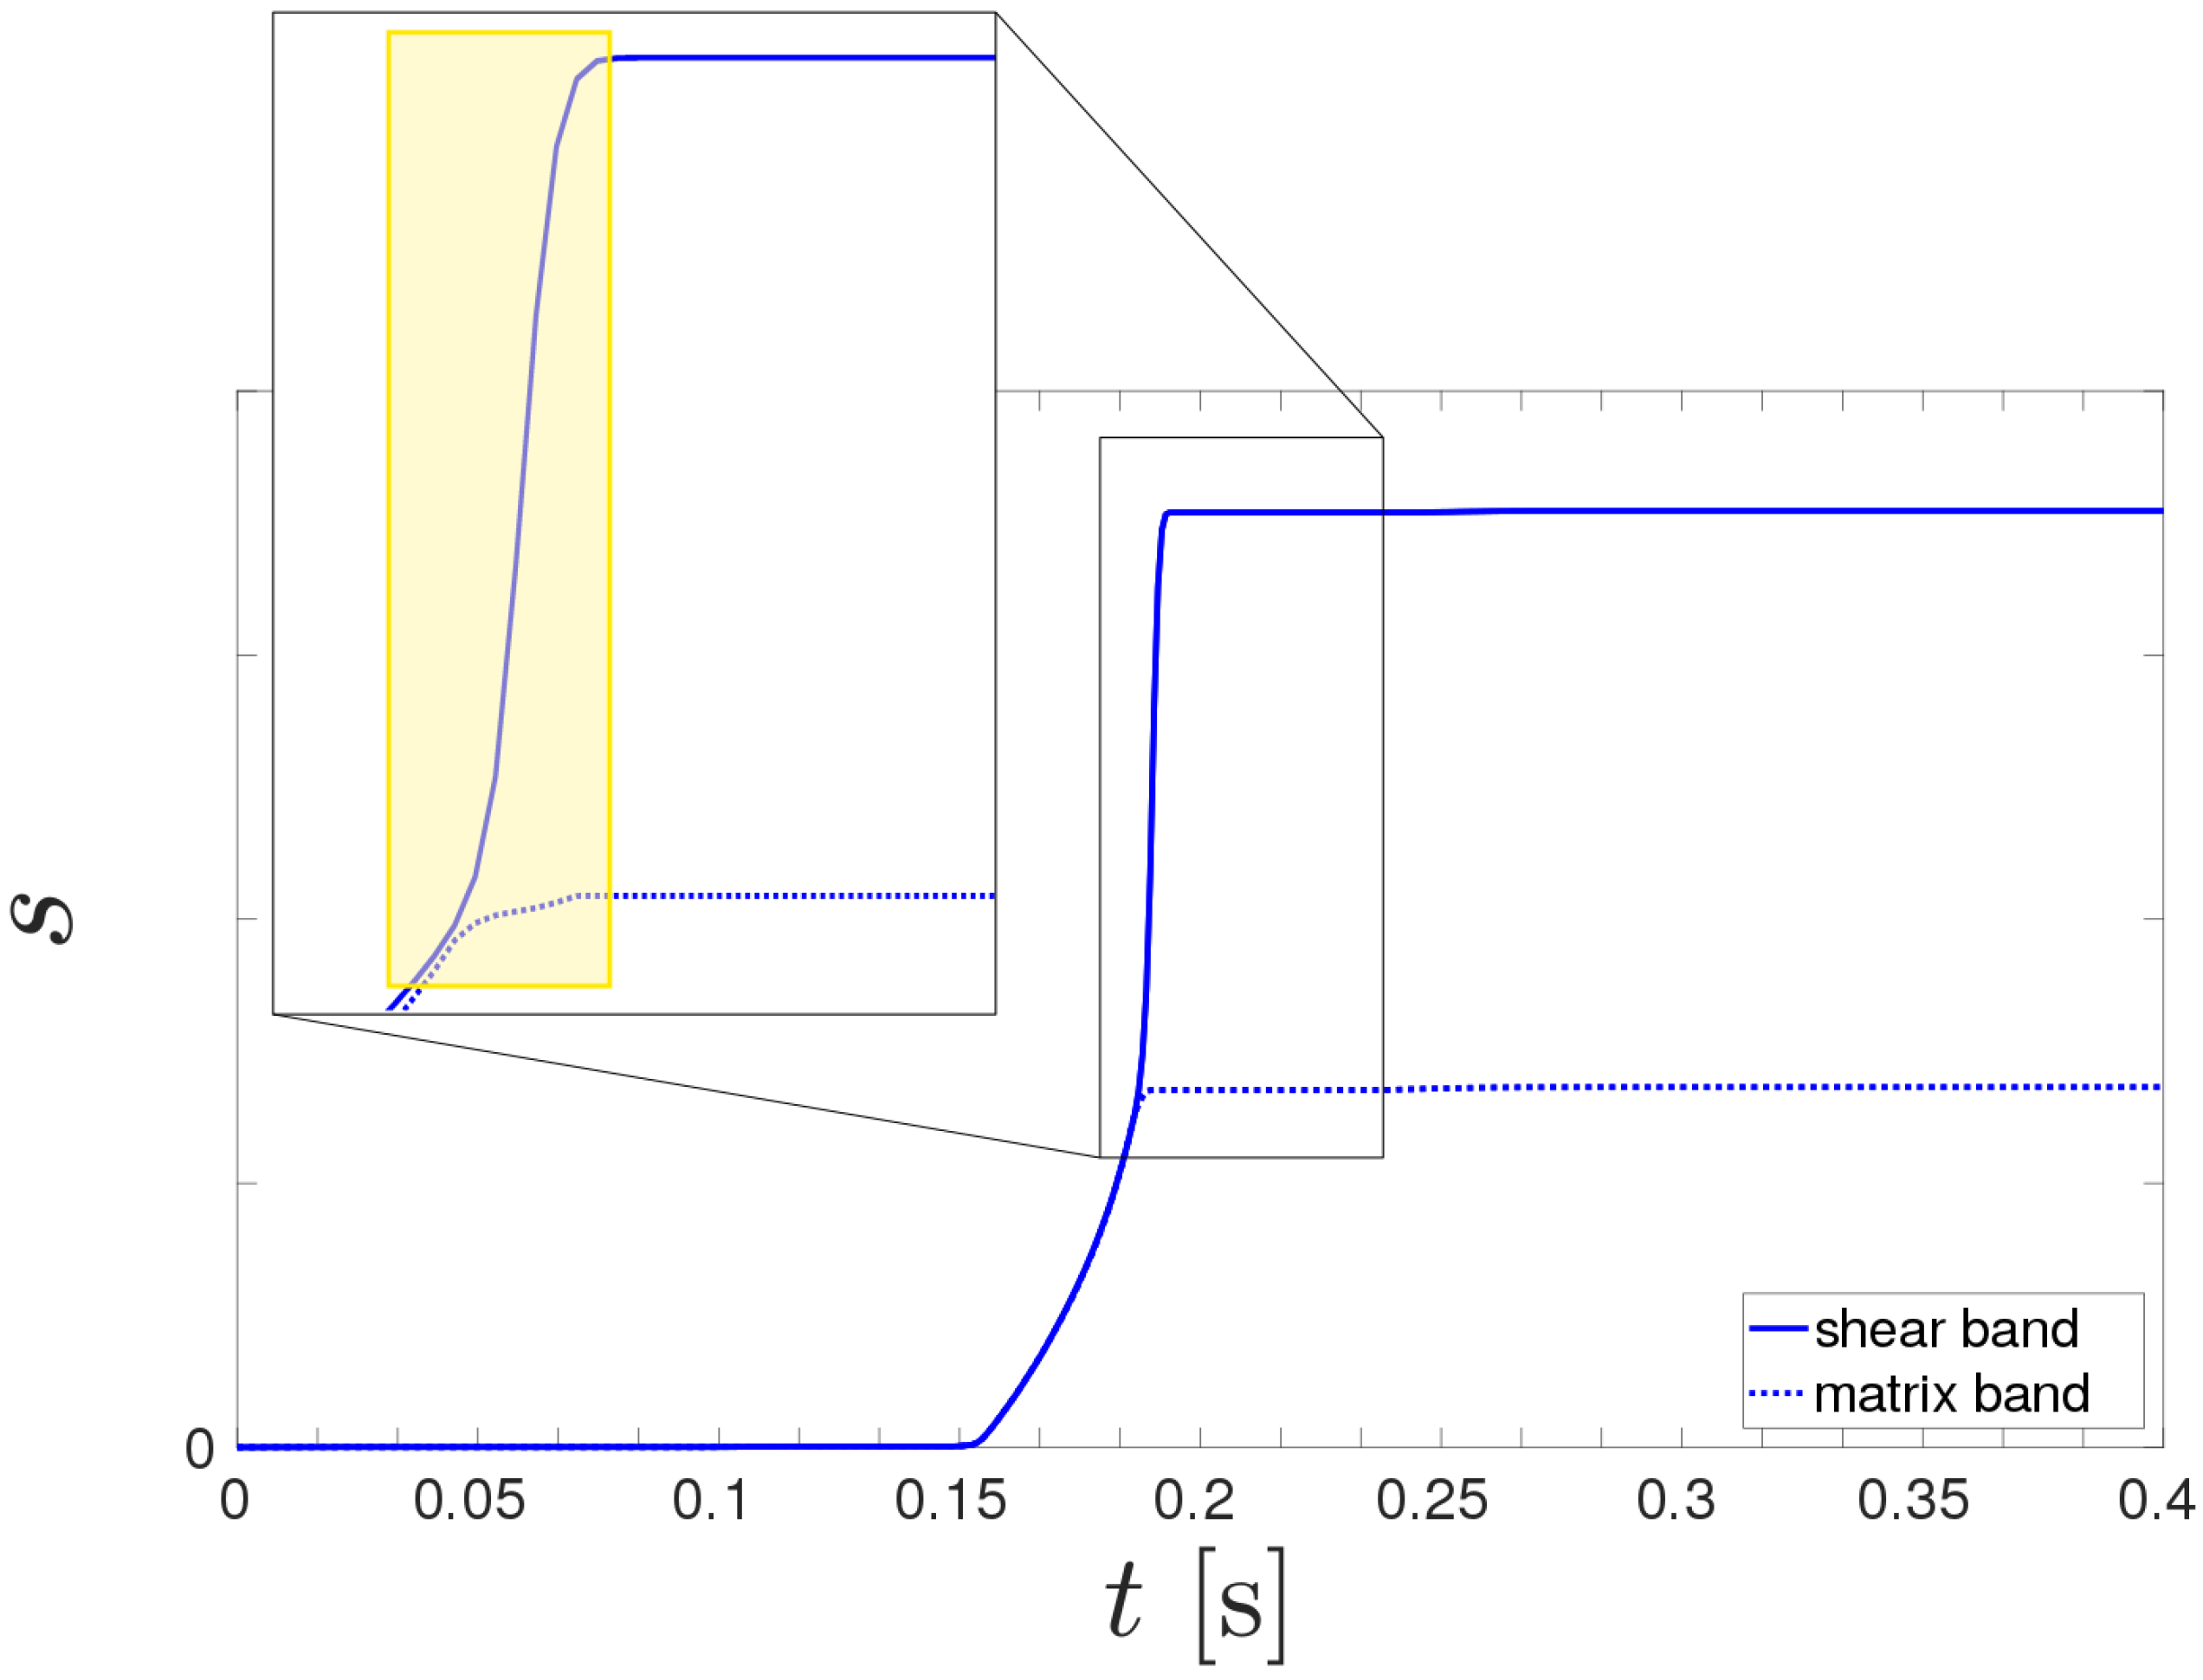
At first, the evolution of stresses and strains during one ECAP pass in the shear and matrix bands is investigated. Shear and matrix band evolve one after another and there is a constant time interval between the formation of these bands. For reasons of clarity and comprehensibility, the time interval is subtracted in every diagram comparing shear and matrix bands (Figure 15 and Figure 16). As shown in Figure 15, the evolution is equal for both types of bands for a long time. However, at a certain point after the plastic flow has already set in, the solution diverges abruptly. At this point of the deformation, the effective plastic strain rate increases rapidly in the shear bands, whereas, in the matrix bands, decreases. It follows that, at this point, the plastic flow increases rapidly in the shear band as the rate of plastic deformation is directly proportional to the effective plastic strain rate: . Interestingly, the duration of plastic flow is equal for both bands, as shown in the yellow domain in Figure 15. This is in contrast to results given in the literature [11], where it is assumed that plastic flow occurs only in the shear bands. The simulation results show that also in the matrix bands plastic flow occurs while passing through the shear zone, even though to a very small extent. The simulations also indicate that the deformation of both types of bands occurs in the same shear zone region within the ECAP die.
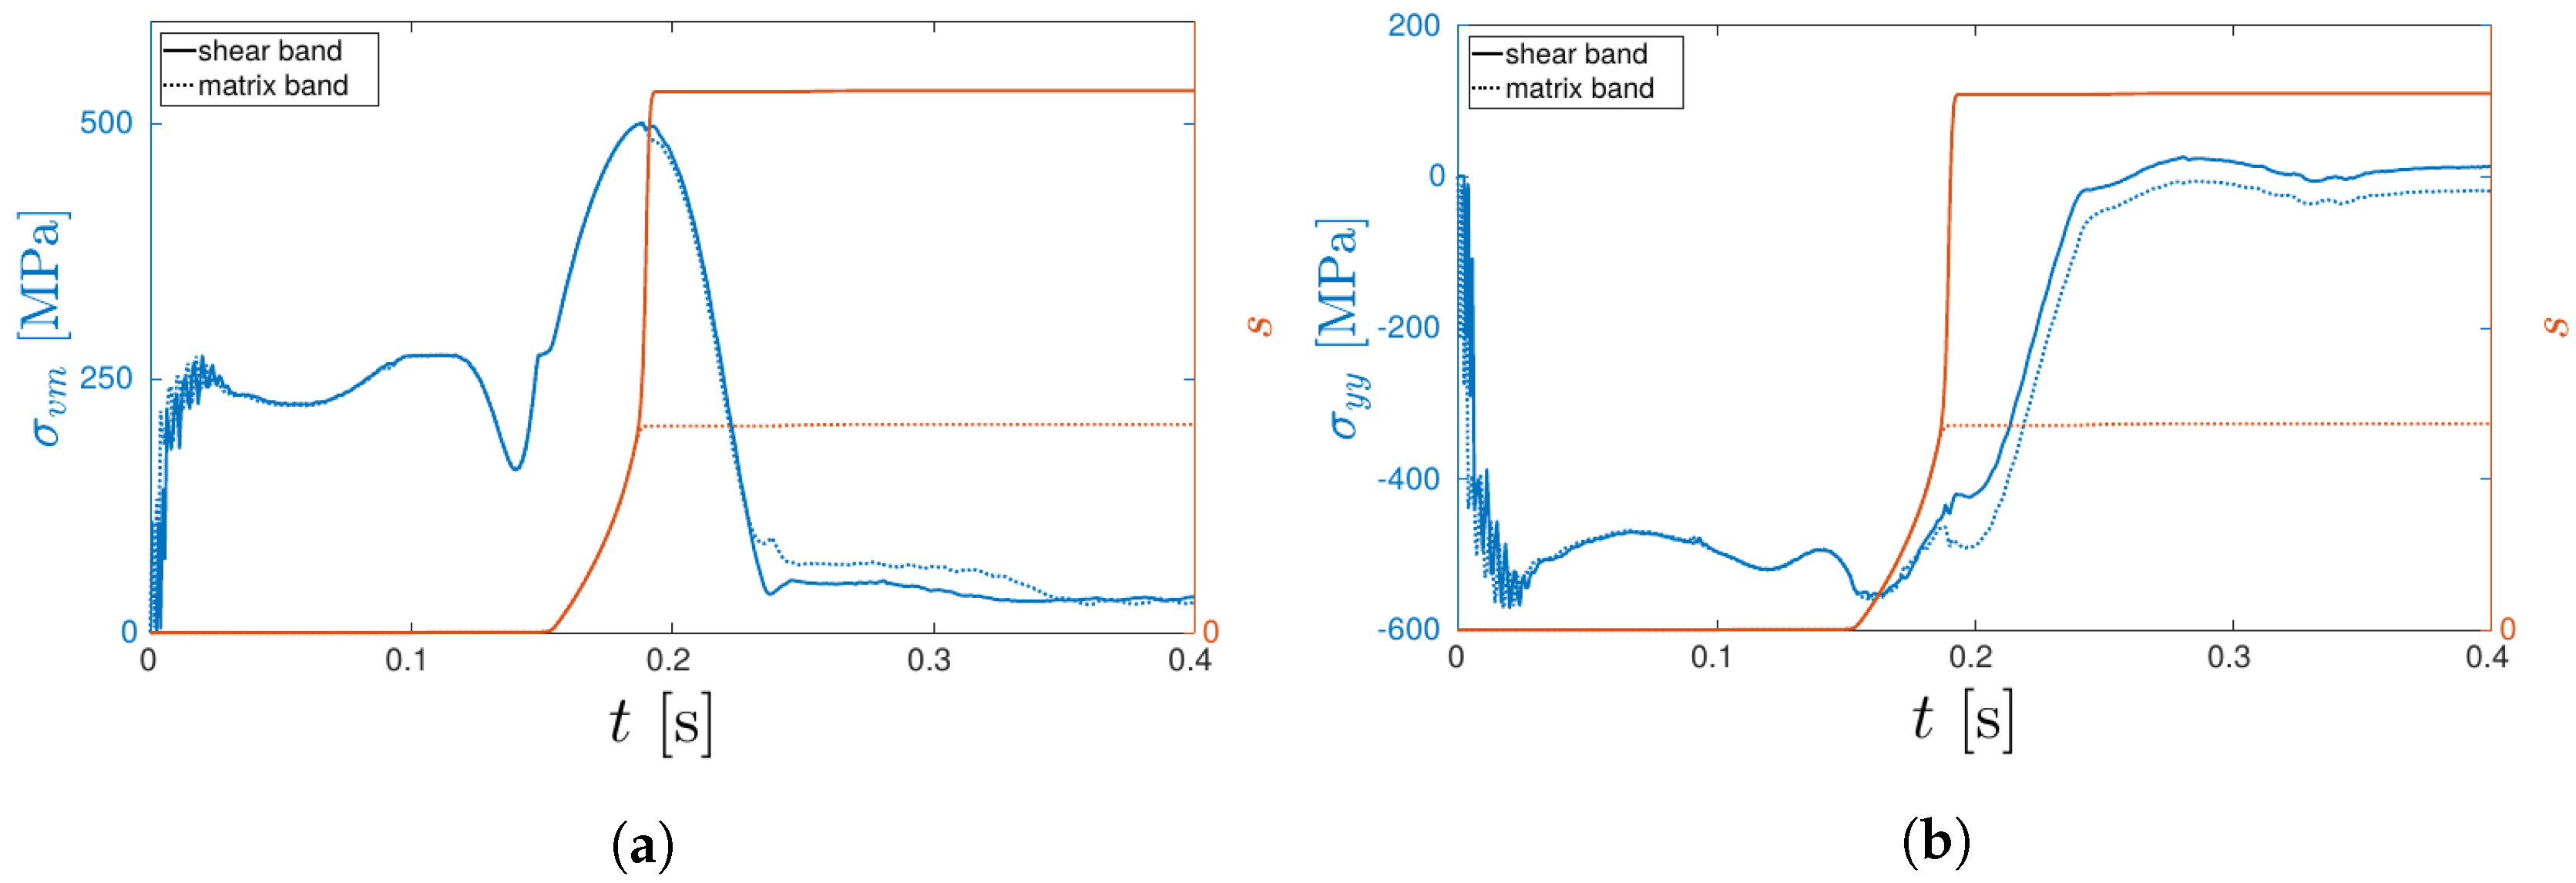
To reach a better comprehension of the evolution of the shear and matrix bands, the evolution of the corresponding stress states is also considered. Figure 16a compares the von Mises stress of the shear and the matrix band. Interestingly, the von Mises equivalent stress remains almost equal until far after the divergence of the effective plastic strain. For a justification of this fact, the definition of the von Mises stress
has to be considered. It is clear that equal normal stresses are not required for an equal von Mises stress; only the difference between the coefficients of the stress tensor has to be equal. This observation gives an explanation why shear bands only appear by involving kinematic hardening and not by isotropic hardening: isotropic hardening is based on the equivalent stress (cf. Equation (8)). If there is no difference between shear and matrix band in terms of the equivalent stress, there will be no differences in material behavior. Therefore, there is no difference concerning effective strain.
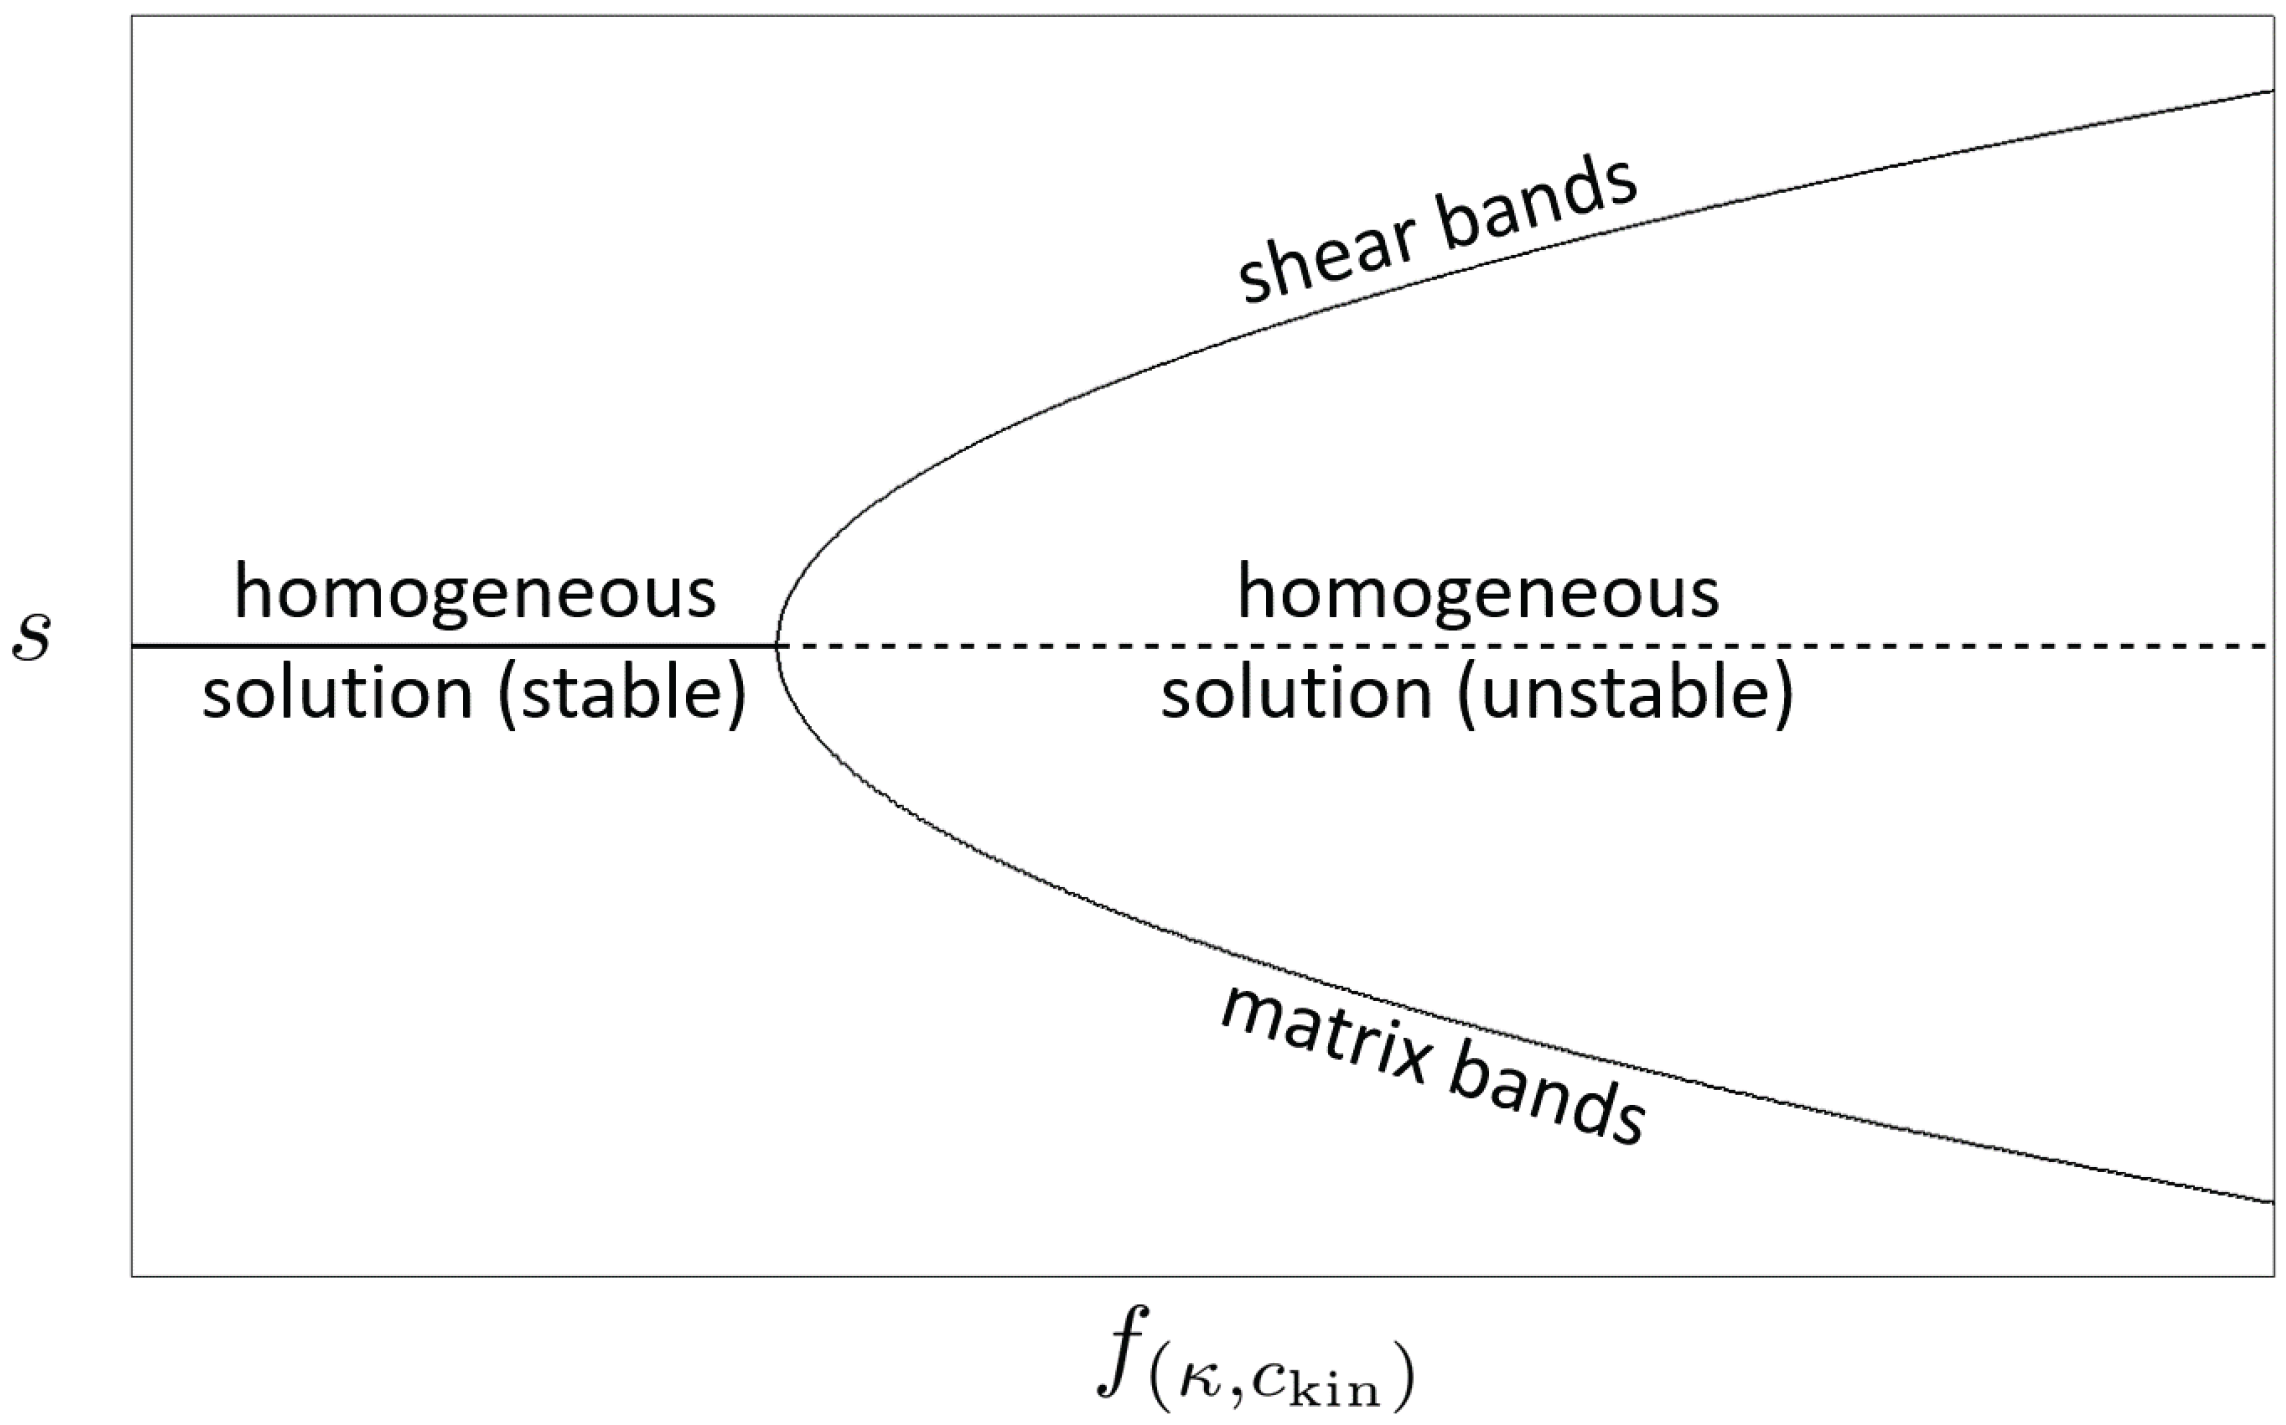
As a consequence of almost equal von Mises stresses, all components of the stress tensor have to be analyzed. The focus here is placed on the normal component with respect to the pressing direction y. (cf. Figure 2—Note that the y-direction is defined globally. Hence, it is only the pressing direction for the input channel.) Again, the evolution of within shear and matrix bands remains very similar for a long time. As indicated in Figure 16b, a difference in occurs just in time with the difference in the effective plastic strain within shear and matrix bands. The fact that it is difficult to identify a precise source/origin of the divergence of the solution into shear and matrix bands is typical for pattern-forming systems. In such systems, assigning cause and effect is not always directly possible [50,51]. Moreover, one peculiarity becomes obvious: the difference in stress and strain state emerges abruptly and there is no indicator for a slowly increasing gap between the bands. This indicates an analogy to a supercritical pitchfork bifurcation in the solution (cf. Figure 17). The control parameter in such a theoretical scenario is likely to be a combination of and , as shown in Section 3. There are domains in the parameter space where only one stable solution occurs, the homogeneous distribution of strain. However, in other domains, two stable solutions occur: the shear and the matrix band. The choice of the stable solution is affected by the previously deformed material segment. A material segment that experiences an overlarge plastic flow (the shear band) is followed by a material segment that experiences an undersized plastic flow (the matrix band). It is worth noting that the application of bifurcation analysis (which is common in studying pattern-forming systems) to ECAP represents a novel approach to understand the formation of shear and matrix bands. While the fundamental idea is presented here for the first time, it is highlighted that further work is required to fully describe and understand localized flow during ECAP in the conceptual framework of pattern formation and self-organizing systems.
5. Conclusions
Adopting phenomenological plasticity theory with isotropic and kinematic hardening and using two-dimensional explicit finite element simulations, and strain localization during ECAP can be reproduced. To this end, a systematic convergence study helps to ensure a stable and reliable FE solution, which is suitable for gaining new insights in the localization process. The FE simulations show that isotropic hardening can only cause minor fluctuations in the plastic strain fields. Kinematic hardening with high initial hardening rate and sufficient strain hardening capacity can lead to pronounced localized deformation in form of shear and matrix bands. This enables the numerical analysis of the evolution of this band structure during ECAP with a phenomenological material model. Neither micro-mechanical material features nor strain softening of the material have to be considered. It is confirmed that kinematic harding plays thus an important role for simulating strain localization during ECAP. Additionally, we find a surprisingly accurate match between simulation and our experimental results. A detailed analysis of shear and matrix bands revealed that not only the shear bands, but also the matrix bands deform plastically during ECAP. Although the plastic deformation is very small in the whole shear zone, the effective plastic strain rate is always larger than zero.
In future work, the influences of the different hardening mechanisms have to be studied in greater detail. In particular, the effect of the parameters of kinematic hardening but also the influence of the formative hardening on the evolution of shear bands is not fully understood yet. An extensive experimental characterization of the present hardening behavior of the investigated material is the focus of a future work. This will help to gain a detailed understanding of the relationship between material’s hardening behavior and the occurrence of strain localization. Because of the complex relationship of strain hardening and local (plastic) deformation behavior including strain localization in certain cases, an in-depth understanding of the acting microstructural and micro-mechanical mechanisms is needed to describe and predict the material’s behavior during severe plastic deformation. Applying the theoretical concepts used to describe pattern-formation in self-organizing systems may provide a novel pathway to distinguish stable vs. unstable deformation modes.
Supplementary Materials
The following are available online at www.mdpi.com/2075-4701/8/1/55/s1, Video S1: Effective strain for kinematic hardening with the hardening parameters MPa, . The shear and matrix band formation in the shear zone is shown.
Acknowledgments
The authors gratefully acknowledge the German Research Foundation (Deutsche Forschungsgemeinschaft, DFG) for supporting this work carried out within the framework of the Collaborative Research Center SFB 692 (projects A1, C2, C5).
Author Contributions
Tobias Daniel Horn performed the FE simulations, based on a pilot study from Christian Silbermann. Philipp Frint conceived and designed the experiments. All authors discussed the results.
Conflicts of Interest
The authors declare no conflict of interest.
Abbreviations
The following abbreviations are used in this manuscript:
| ECAP | equal-channel angular pressing |
| SPD | severe plastic deformation |
| IHR | initial hardening rate |
| SHC | strain hardening capacity |
| EBSD | electron back-scatter diffraction |
| KKT | Karush–Kuhn–Tucker |
| FE | finite element |
References
- Segal, V. The Method of Material Preparation for Subsequent Working. Patent of the USSR Nr. 575892, 1977. [Google Scholar]
- Segal, V.; Reznikov, V.; Dobryshevshiy, A.; Kopylov, V. Plastic working of metals by simple shear. Russ. Metall. (Metally) 1981, 1, 99–105. [Google Scholar]
- Iwahashi, Y.; Wang, J.; Horita, Z.; Nemoto, M.; Langdon, T.G. Principle of equal-channel angular pressing for the processing of ultra-fine grained materials. Scr. Mater. 1996, 35, 143–146. [Google Scholar] [CrossRef]
- Hall, E. The deformation and ageing of mild steel: III discussion of results. Proc. Phys. Soc. Sect. B 1951, 64, 747. [Google Scholar] [CrossRef]
- Petch, N. The cleavage strength of polycrystals. J. Iron Steel Inst. 1953, 174, 25–28. [Google Scholar]
- Valiev, R.; Alexandrov, I.; Zhu, Y.; Lowe, T. Paradox of strength and ductility in metals processed bysevere plastic deformation. J. Mater. Res. 2002, 17, 5–8. [Google Scholar] [CrossRef]
- Wang, Y.; Chen, M.; Zhou, F.; Ma, E. High tensile ductility in a nanostructured metal. Nature 2002, 419, 912–915. [Google Scholar] [CrossRef] [PubMed]
- Ma, A.; Jiang, J.; Saito, N.; Shigematsu, I.; Yuan, Y.; Yang, D.; Nishida, Y. Improving both strength and ductility of a Mg alloy through a large number of ECAP passes. Mater. Sci. Eng. A 2009, 513, 122–127. [Google Scholar] [CrossRef]
- Valiev, R.Z.; Langdon, T.G. Principles of equal-channel angular pressing as a processing tool for grain refinement. Prog. Mater. Sci. 2006, 51, 881–981. [Google Scholar] [CrossRef]
- Kim, W.; Chung, C.; Ma, D.; Hong, S.; Kim, H. Optimization of strength and ductility of 2024 Al by equal channel angular pressing (ECAP) and post-ECAP aging. Scr. Mater. 2003, 49, 333–338. [Google Scholar] [CrossRef]
- Frint, P. Lokalisierungsphänomene Nach Kombinierter Hochgradig Plastischer Umformung Durch Extrusion und ECAP Einer 6000er-Aluminiumlegierung. Ph.D. Thesis, Chemnitz University of Technology, Chemnitz, Germany, 2015. [Google Scholar]
- Lapovok, R.; Tóth, L.S.; Molinari, A.; Estrin, Y. Strain localisation patterns under equal-channel angular pressing. J. Mech. Phys. Solids 2009, 57, 122–136. [Google Scholar] [CrossRef]
- Zhilyaev, A.; Swisher, D.; Oh-Ishi, K.; Langdon, T.; McNelley, T. Microtexture and microstructure evolution during processing of pure aluminum by repetitive ECAP. Mater. Sci. Eng. A 2006, 429, 137–148. [Google Scholar] [CrossRef] [Green Version]
- Segal, V. Equal channel angular extrusion: from macromechanics to structure formation. Mater. Sci. Eng. A 1999, 271, 322–333. [Google Scholar] [CrossRef]
- Miyamoto, H.; Ikeda, T.; Uenoya, T.; Vinogradov, A.; Hashimoto, S. Reversible nature of shear bands in copper single crystals subjected to iterative shear of ECAP in forward and reverse directions. Mater. Sci. Eng. A 2011, 528, 2602–2609. [Google Scholar] [CrossRef]
- Prangnell, P.; Harris, C.; Roberts, S. Finite element modelling of equal channel angular extrusion. Scr. Mater. 1997, 37, 983–989. [Google Scholar] [CrossRef]
- Raab, G. Plastic flow at equal channel angular processing in parallel channels. Mater. Sci. Eng. A 2005, 410, 230–233. [Google Scholar] [CrossRef]
- Dumoulin, S.; Roven, H.; Werenskiold, J.; Valberg, H. Finite element modeling of equal channel angular pressing: Effect of material properties, friction and die geometry. Mater. Sci. Eng. A 2005, 410, 248–251. [Google Scholar] [CrossRef]
- Kim, H.S.; Seo, M.H.; Hong, S.I. Finite element analysis of equal channel angular pressing of strain rate sensitive metals. J. Mater. Process. Technol. 2002, 130, 497–503. [Google Scholar] [CrossRef]
- Yoon, S.C.; Kim, H.S. Finite element analysis of the effect of the inner corner angle in equal channel angular pressing. Mater. Sci. Eng. A 2008, 490, 438–444. [Google Scholar] [CrossRef]
- Kim, H.S.; Seo, M.H.; Hong, S.I. Plastic deformation analysis of metals during equal channel angular pressing. J. Mater. Process. Technol. 2001, 113, 622–626. [Google Scholar] [CrossRef]
- Park, J.W.; Suh, J.Y. Effect of die shape on the deformation behavior in equal-channel angular pressing. Metall. Mater. Trans. A 2001, 32, 3007–3014. [Google Scholar] [CrossRef]
- Li, S.; Bourke, M.; Beyerlein, I.; Alexander, D.; Clausen, B. Finite element analysis of the plastic deformation zone and working load in equal channel angular extrusion. Mater. Sci. Eng. A 2004, 382, 217–236. [Google Scholar] [CrossRef]
- Figueiredo, R.B.; Cetlin, P.R.; Langdon, T.G. Stable and unstable flow in materials processed by equal-channel angular pressing with an emphasis on magnesium alloys. Metall. Mater. Trans. A 2010, 41, 778–786. [Google Scholar] [CrossRef]
- Semiatin, S.; Delo, D.; Shell, E. The effect of material properties and tooling design on deformation and fracture during equal channel angular extrusion. Acta Mater. 2000, 48, 1841–1851. [Google Scholar] [CrossRef]
- Oruganti, R.; Subramanian, P.; Marte, J.; Gigliotti, M.F.; Amancherla, S. Effect of friction, backpressure and strain rate sensitivity on material flow during equal channel angular extrusion. Mater. Sci. Eng. A 2005, 406, 102–109. [Google Scholar] [CrossRef]
- Bowen, J.; Gholinia, A.; Roberts, S.; Prangnell, P. Analysis of the billet deformation behaviour in equal channel angular extrusion. Mater. Sci. Eng. A 2000, 287, 87–99. [Google Scholar] [CrossRef]
- Figueiredo, R.B.; Aguilar, M.T.P.; Cetlin, P.R. Finite element modelling of plastic instability during ECAP processing of flow-softening materials. Mater. Sci. Eng. A 2006, 430, 179–184. [Google Scholar] [CrossRef]
- Ghazani, M.S.; Vajd, A. Finite Element Simulation of Flow Localization During Equal Channel Angular Pressing. Trans. Indian Inst. Met. 2017, 70, 1323–1328. [Google Scholar] [CrossRef]
- Shutov, A.; Kreißig, R. Finite strain viscoplasticity with nonlinear kinematic hardening: Phenomenological modeling and time integration. Comput. Methods Appl. Mech. Eng. 2008, 197, 2015–2029. [Google Scholar] [CrossRef]
- Kießling, R.; Landgraf, R.; Scherzer, R.; Ihlemann, J. Introducing the concept of directly connected rheological elements by reviewing rheological models at large strains. Int. J. Solids Struct. 2016, 97, 650–667. [Google Scholar] [CrossRef]
- Frederick, C.O.; Armstrong, P. A mathematical representation of the multiaxial Bauschinger effect. Mater. High Temp. 2014, 24, 1–26. [Google Scholar] [CrossRef]
- Voce, E. The relationship between stress and strain for homogeneous deformation. J. Inst. Met. 1948, 74, 537–562. [Google Scholar]
- Perzyna, P. The constitutive equations for rate sensitive plastic materials. Q. Appl. Math. 1963, 20, 321–332. [Google Scholar] [CrossRef]
- Horn, T. Simulation und FE-Analyse der Verformungslokalisierung bei der ECAP-Umformung. Master’s Thesis, Chemnitz University of Technology, Chemnitz, Germany, 2016. [Google Scholar]
- Shutov, A.V.; Kreißig, R. Geometric integrators for multiplicative viscoplasticity: Analysis of error accumulation. Comput. Methods Appl. Mech. Eng. 2010, 199, 700–711. [Google Scholar] [CrossRef]
- Shutov, A.V.; Kuprin, C.; Ihlemann, J.; Wagner, M.F.X.; Silbermann, C. Experimentelle Untersuchung und numerische Simulation des inkrementellen Umformverhaltens von Stahl 42CrMo4 Experimental investigation and numerical simulation of the incremental deformation of a 42CrMo4 steel. Materialwissenschaft Werkstofftechnik 2010, 41, 765–775. [Google Scholar] [CrossRef]
- Silbermann, C.B.; Shutov, A.V.; Ihlemann, J. On operator split technique for the time integration within finite strain viscoplasticity in explicit FEM. PAMM 2014, 14, 355–356. [Google Scholar] [CrossRef]
- Yamaguchi, D.; Horita, Z.; Nemoto, M.; Langdon, T.G. Significance of adiabatic heating in equal-channel angular pressing. Scr. Mater. 1999, 41, 791–796. [Google Scholar] [CrossRef]
- Frint, P.; Wagner, M.F.X.; Weber, S.; Seipp, S.; Frint, S.; Lampke, T. An experimental study on optimum lubrication for large-scale severe plastic deformation of aluminum-based alloys. J. Mater. Process. Technol. 2017, 239, 222–229. [Google Scholar] [CrossRef]
- Frint, S.; Hockauf, M.; Frint, P.; Wagner, M.F.X. Scaling up Segal’s principle of Equal-Channel Angular Pressing. Mater. Des. 2016, 97, 502–511. [Google Scholar] [CrossRef]
- Horn, T.; Silbermann, C.; Ihlemann, J. FE-Simulation based analysis of residual stresses and strain localizations in ECAP processing. PAMM 2017, 16. in press. [Google Scholar]
- Frint, P.; Hockauf, M.; Dietrich, D.; Halle, T.; Wagner, M.F.X.; Lampke, T. Influence of strain gradients on the grain refinement during industrial scale ECAP. Materialwissenschaft Werkstofftechnik 2011, 42, 680–685. [Google Scholar] [CrossRef]
- Frint, P.; Hockauf, M.; Halle, T.; Wagner, M.F.X.; Lampke, T. The role of backpressure during large scale Equal-Channel Angular Pressing. Materialwissenschaft Werkstofftechnik 2012, 43, 668–672. [Google Scholar] [CrossRef]
- Frint, P.; Hockauf, M.; Halle, T.; Strehl, G.; Lampke, T.; Wagner, M.F.X. Microstructural Features and Mechanical Properties after Industrial Scale ECAP of an Al 6060 Alloy. Mater. Sci. Forum 2011, 667, 1153–1158. [Google Scholar] [CrossRef]
- Lefstad, M.; Pedersen, K.; Dumoulin, S. Up-scaled equal channel angular pressing of AA6060 and subsequent mechanical properties. Mater. Sci. Eng. A 2012, 535, 235–240. [Google Scholar] [CrossRef]
- Chaudhury, P.K.; Cherukuri, B.; Srinivasan, R. Scaling up of equal-channel angular pressing and its effect on mechanical properties, microstructure, and hot workability of AA 6061. Mater. Sci. Eng. A 2005, 410, 316–318. [Google Scholar] [CrossRef]
- Berndt, N.; Frint, P.; Böhme, M.; Wagner, M.F.X. Microstructure and mechanical properties of an AA6060 aluminum alloy after cold and warm extrusion. Mater. Sci. Eng. A 2017, 707, 717–724. [Google Scholar] [CrossRef]
- Beyerlein, I.J.; Tomé, C.N. Analytical modeling of material flow in equal channel angular extrusion (ECAE). Mater. Sci. Eng. A 2004, 380, 171–190. [Google Scholar] [CrossRef]
- Ebeling, W.; Feistel, R. Chaos und Kosmos: Prinzipien der Evolution; Spektrum Akad. Verlag: Heidelberg, Germany, 1994; pp. 109–118. [Google Scholar]
- Ebeling, W. Chaos, Ordnung und Information: Selbstorganisation in Natur und Technik; Urania-Verlag: Leipzig, Germany, 1989; Volume 74, p. 40. [Google Scholar]
Figure 1.
Sketch of an Equal-Channel Angular Pressing (ECAP) channel with the channel angle and the angle defining the outer curvature.
Figure 1.
Sketch of an Equal-Channel Angular Pressing (ECAP) channel with the channel angle and the angle defining the outer curvature.

Figure 2.
Sketch of the simulation model with the relevant geometrical parameters.

Figure 3.
Rheological representation of the material model with the material parameters.

Figure 4.
Contour plot of the effective plastic strain s (cf. Equation (9)) for the reference simulation: some inhomogeneities are visible. Compared to experimental observations of shear and matrix bands, these variations are negligible; they are therefore considered as minor fluctuations.
Figure 4.
Contour plot of the effective plastic strain s (cf. Equation (9)) for the reference simulation: some inhomogeneities are visible. Compared to experimental observations of shear and matrix bands, these variations are negligible; they are therefore considered as minor fluctuations.

Figure 5.
Effective plastic strain s (cf. Equation (9)) for simulations with isotropic hardening with in combination with (a) , (b) and (c) . . In all cases, only minor fluctuations occur.
Figure 5.
Effective plastic strain s (cf. Equation (9)) for simulations with isotropic hardening with in combination with (a) , (b) and (c) . . In all cases, only minor fluctuations occur.

Figure 6.
Effective plastic strain s (cf. Equaiton (9)) for simulations with isotropic hardening with in combination with (a) , (b) and (c) . . In (a,c), minor fluctuations occur; (b) shows a quasi-homogeneous distribution of the effective plastic strain.
Figure 6.
Effective plastic strain s (cf. Equaiton (9)) for simulations with isotropic hardening with in combination with (a) , (b) and (c) . . In (a,c), minor fluctuations occur; (b) shows a quasi-homogeneous distribution of the effective plastic strain.

Figure 7.
(left) effective plastic strain s (cf. Equation (9)) for simulations with kinematic hardening with in combination with (a) , (b) and (c) ; (right) comparison of the simulations with optical micrographs after one pass of ECAP for a fully recrystallized (top) and a severely cold worked conventional 6000 series aluminum alloy (bottom).

Figure 8.
The effective plastic strain s (cf. Equation (9)) as a function of the position in the billet (cf. Figure 7). Undeformed areas and the unsteady flow at the beginning of the process are omitted.
Figure 8.
The effective plastic strain s (cf. Equation (9)) as a function of the position in the billet (cf. Figure 7). Undeformed areas and the unsteady flow at the beginning of the process are omitted.

Figure 9.
Contour plot of the effective plastic strain s (cf. Equation (9)) for the simulation with locally refined mesh. The billet is divided into five parts. The outer two parts are meshed with an element size of mm, the two parts next to them with an element size of mm and the part in the midst with an element size of mm. Obviously, the solution is converged with respect to the dimensions of the shear and matrix bands.

Figure 10.
Effective plastic strain s (cf. Equation (9)) for simulations with kinematic hardening with the parameters (a) , (b) and (c) . In all cases, shear and matrix bands occur.
Figure 10.
Effective plastic strain s (cf. Equation (9)) for simulations with kinematic hardening with the parameters (a) , (b) and (c) . In all cases, shear and matrix bands occur.

Figure 11.
Generalized diagram with uniaxial flow curves as functions of the effective plastic strain depicting the regions where localized deformation occurs for (a) isotropic and (b) kinematic hardening. Material parameters corresponding to flow curves in the marked regions lead to the indicated solution. Note that, despite the apparent similarity of the uniaxial flow curves, isotropic and kinematic hardening are fundamentally different in the multiaxial case.

Figure 12.
Microstructure after homogeneous shear deformation by one pass of ECAP of a fully recrystallized conventional 6000 series aluminum alloy. Optical micrograph (a) showing a microstructural overview and color-coded orientation map (OM) (b) and image quality map (IQ) (c) from electron back-scatter diffraction (EBSD) measurement.

Figure 13.
Microstructure after heterogeneous deformation by one pass of ECAP of a severely cold worked conventional 6000 series aluminum alloy. Optical micrograph (a) showing a microstructural overview and color-coded orientation map OM (b) and image quality map IQ (c) from EBSD measurement.
Figure 13.
Microstructure after heterogeneous deformation by one pass of ECAP of a severely cold worked conventional 6000 series aluminum alloy. Optical micrograph (a) showing a microstructural overview and color-coded orientation map OM (b) and image quality map IQ (c) from EBSD measurement.

Figure 14.
Comparison of shear and matrix bands in simulation (right) and experiment (left). In the optical micrograph, the shear bands are shown in bright and the matrix bands in dark gray. In the simulation, the opposite is the case: The shear bands are depicted in dark and the matrix bands in bright gray. Additionally, the positions of the chosen elements in the billet far away from all boundaries are shown in red.

Figure 15.
The evolution of the effective plastic strain s (cf. Equation (9)) for the representative elements corresponding to shear and matrix bands, respectively (see highlighted elements in Figure 14).
Figure 15.
The evolution of the effective plastic strain s (cf. Equation (9)) for the representative elements corresponding to shear and matrix bands, respectively (see highlighted elements in Figure 14).

Figure 16.
The evolution of the effective plastic strain s (orange) and of (a) the von Mises equivalent stress (blue) and of (b) the principal stress in ECAP pressure direction (blue). The solid lines are used for the shear band and the dotted lines for the matrix band.
Figure 16.
The evolution of the effective plastic strain s (orange) and of (a) the von Mises equivalent stress (blue) and of (b) the principal stress in ECAP pressure direction (blue). The solid lines are used for the shear band and the dotted lines for the matrix band.

Figure 17.
Assumed supercritical pitchfork bifurcation of the effective plastic strain s (cf. Equation (9)) in the parameter space. The control parameter is a function of both parameters of kinematic hardening.
Figure 17.
Assumed supercritical pitchfork bifurcation of the effective plastic strain s (cf. Equation (9)) in the parameter space. The control parameter is a function of both parameters of kinematic hardening.


Table 1.
Geometry parameters for the simulation model (cf. Figure 2).
Table 1.
Geometry parameters for the simulation model (cf. Figure 2).
| Φ | Ψ | R | d | h | |||||
|---|---|---|---|---|---|---|---|---|---|
| 50 mm | 52 mm | 300 mm | 300 mm | 75 mm | 5 mm | 41 mm |
Table 2.
Constitutive equations of the applied elastic-plastic material model.
 |
Table 3.
Material parameters for aluminum with ideal-plastic behavior, used in the reference simulation.
Table 3.
Material parameters for aluminum with ideal-plastic behavior, used in the reference simulation.
| K/MPa | G/MPa | /MPa | /MPa | /MPa | ||
|---|---|---|---|---|---|---|
© 2018 by the authors. Licensee MDPI, Basel, Switzerland. This article is an open access article distributed under the terms and conditions of the Creative Commons Attribution (CC BY) license (http://creativecommons.org/licenses/by/4.0/).
Share and Cite
MDPI and ACS Style
Horn, T.D.; Silbermann, C.B.; Frint, P.; Wagner, M.F.-X.; Ihlemann, J. Strain Localization during Equal-Channel Angular Pressing Analyzed by Finite Element Simulations. Metals 2018, 8, 55. https://doi.org/10.3390/met8010055
AMA Style
Horn TD, Silbermann CB, Frint P, Wagner MF-X, Ihlemann J. Strain Localization during Equal-Channel Angular Pressing Analyzed by Finite Element Simulations. Metals. 2018; 8(1):55. https://doi.org/10.3390/met8010055
Chicago/Turabian StyleHorn, Tobias Daniel, Christian Bert Silbermann, Philipp Frint, Martin Franz-Xaver Wagner, and Jörn Ihlemann. 2018. "Strain Localization during Equal-Channel Angular Pressing Analyzed by Finite Element Simulations" Metals 8, no. 1: 55. https://doi.org/10.3390/met8010055
Note that from the first issue of 2016, this journal uses article numbers instead of page numbers. See further details here.