
Study of Surface Temperature Distribution for High-Temperature U75V Rail Steel Plates in Rolling Process by Colorimetry Thermometry


1
Collaborative Innovation Center of Steel Technology, University of Science and Technology Beijing, 30 Xueyuan Road, Haidian District, Beijing 100083, China
2
Yangjiang Alloy Material Laboratory, 1 Luoqin Road, Jiangcheng District, Yangjiang 529500, China
3
Xinxing Hebei Engineering & Research Inc., Ltd., No. 2 Century Street, Handan 056010, China
*
Author to whom correspondence should be addressed.
Metals 2022, 12(5), 860; https://doi.org/10.3390/met12050860
Submission received: 11 April 2022
/
Revised: 8 May 2022
/
Accepted: 10 May 2022
/
Published: 17 May 2022
(This article belongs to the Special Issue Advances in High-Strength Low-Alloy Steels)
Abstract
:Surface temperature is a critical operating parameter that influences the phase transition time and rolling quality of U75V rail steel plates in the rolling process. There is still no extensive online detection system for the surface temperature of rail steel plates due to the hazardous environment, incorrect surface emissivity, and complex backgrounds. In this paper, online surface temperature detection equipment based on multi-spectral photography was built for high-temperature rail steel plates in the rolling processes. Then, the emissivity model for a high-temperature environment, colorimetric thermometry, and noise filtering methods were investigated to improve the accuracy of the temperature detection results of rail steel plates. Finally, the surface temperature of the U75V rail steel plate during three rolling passes could be calculated online point by point, and the greatest error was approximately 0.82% due to the blackbody calibration experiments. The results not only have a positive effect on understanding the temperature declination process of low-alloy rail steel plates during the rolling process, but could also benefit the control of the cooling rate and optimize the rolling model during rolling passes.
1. Introduction
As a typical low-alloy material, the quality of U75V rail steel is directly related to the safety of people and goods in railways transportation. The rolling process is the essential procedure in modern low-alloy rail steel production, while the surface temperature of the rail steel plate is the key controlling parameter in the production process [1], determining the phase transition time and rolling quality. Moreover, the online temperature detection results are the basis for the closed-loop control of the rolling model and process optimization of cooling rates [2]. Normally, there are contact and non-contact methods to detect the surface temperature, which are decided upon based on whether it is in contact with the measured object [3]. However, the contact measurement method needs to ensure reliable contact between the sensor and the plate surface in a long thermal equilibrium time, and, generally, there is only one or few points of data, indicating that the contact temperature method is not suitable for the online measurement of a steel plate in a high-temperature environment and at a high rolling speed [4]. Consequently, a large number of studies are focused on non-contact methods.
Monier proposed a two-color pyrometer to detect the liquid metals’ surface temperature distributions [5]. Gosai studied temperature measurement in the turning operation of hardened steel [6]. Xie studied the temperature measurement of plates in a secondary cooling zone end-piece based on data fusion [7] and molten steel level identification based on temperature distribution sensed by a refractory bar [8], while Zhang et al. [9] and Qi et al. [10] also investigated the surface temperature of the high-temperature plate using a digital image method. Although those studies have already built the mature temperature detection method, a low accuracy caused by the unsuitable emissivity of different plates makes it difficult to meet the requirements of real-time online temperature detection for U75V rail steel plates [11]. In particular, the emissivity of the steel is related to its surface condition, varying with surface temperature itself and the wavelength of detection equipment [12]. The emissivity in different wavelengths is assumed as greyscale in colorimetric thermometry to eliminate the effect of emissivity, which will bring new errors to the temperature calculation process [13]. As a result, research on the emissivity of metal surfaces has become one of the hot topics in recent years [14,15,16,17], following the study of emissivity data for metallic elements and alloys by the authoritative Thermophysical Properties Research Center’s experts in the USA [18]. Mayr-Schmolzer et al. [19], Xing et al. [20], and Ham et al. [21] studied the emissivity of different steel materials under various temperatures and wavelengths, while Taylor et al. [15], Suleiman et al. [22], and Li et al. [23] investigated the patterns of emissivity models for steel materials with different influencing factors separately.
To reduce the impact of emissivity on the surface temperature detection of the plate, some scholars have built the emissivity model for the surface temperature detection process [24,25], which has contributed to improving the accuracy of the surface temperature. In addition, the hazardous environment, including high temperatures and high dust in the plate production process, has a great impact on the image quality and on the noise of the CCD imaging equipment itself, which could seriously influence the accuracy of the surface temperature measurement [26,27]. In addition, high-temperature detection equipment based on colorimetric thermometry relies on a high-precision calibration process of blackbody furnaces [28,29].
On this basis, this paper starts with rebuilding the emissivity calculation model in the temperature and wavelength variant process. Then, online detection equipment for high-temperature rail steel plates’ surface temperature based on multi-spectral imaging was established. After that, a colorimetry temperature model based on the emissivity model and noise filtering algorithm was investigated to increase the accuracy of the surface temperature. Finally, the digital imaging system was applied to monitor rail steel plates’ surface temperature during the duration of the rolling process after the calibration experiment in the blackbody furnace experiments. The results not only have a positive effect on understanding the temperature tendency of rail steel plates in the rolling passes, but could also benefit the improvement of the rolling quality.
2. Emissivity Calculation Model
As one of the error sources of the colorimetry temperature measurement process, the emission rate of rail steel plates at a high temperature is an important factor in the calculation accuracy. The reasons may be explained as follows: energy radiated from high-temperature rail steel plates to the outside space will be affected by its surface properties, which are generally characterized by emission rates. Therefore, the surface of a high-temperature plate could easily react with oxygen in the atmospheric environment without any additional protection, leading to an oxidation layer generated on the surface of the plate. Consequently, the surface emission rates are altered with the property of the surface layer because the thickness and tissue of the oxidation layer have relationships with its chemical composition, surface temperature, roughness, etc. It is commonly understood that the largest factors for the emission rate of steel plates are the surface temperature and the measuring wavelengths.
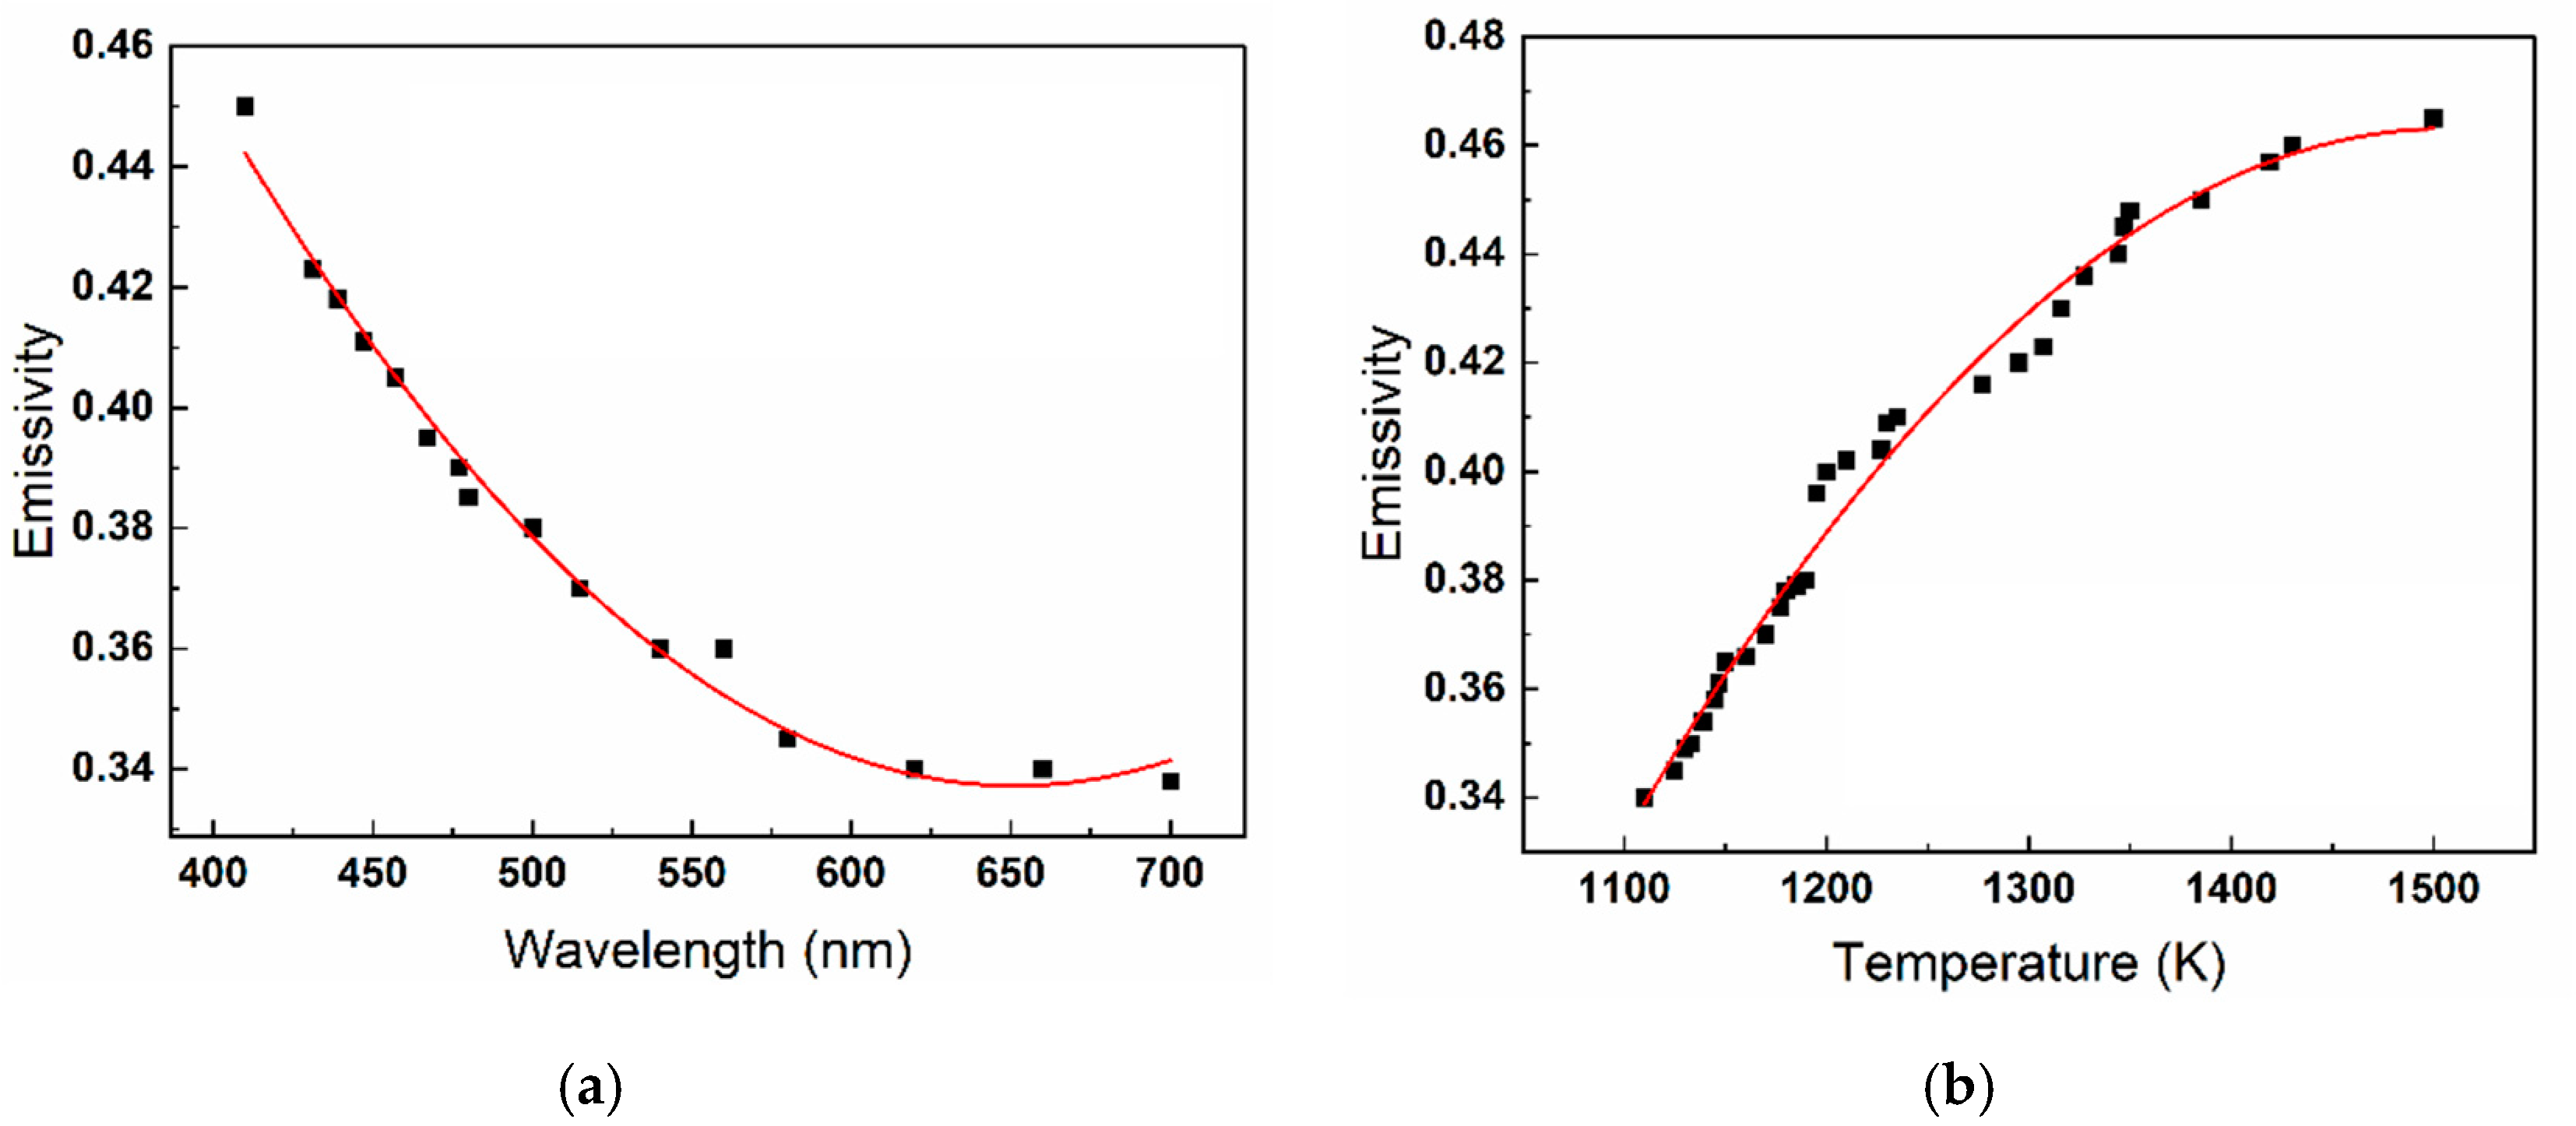
In this paper, the data of emissivity of rail steel plate variation with surface temperature and measuring wavelengths are obtained from the book Thermal radiative properties: metallic elements and alloys, written by Touloukian and DeWitt [18]. The wavelength increases from 400 nm to 750 nm, and the emissivity of steel materials shows a decreasing trend that synchronously decreases from 0.42 to 0.32. This may be explained by the corresponding photon energy becoming smaller when the wavelength increases, causing a corresponding decrease in emissivity. It could also be observed that the emissivity in the higher temperature of the plate is higher than that of lower ones at the same wavelength. In addition, the emissivity increases from 0.31 to approximately 0.47 when the surface temperature of the plate increases from 1100 K to 1600 K, indicating that the emissivity increases with the surface temperature, which could be explained by the increase in photon energy emitted as the temperature increases. Moreover, the spectral emission rate of stainless steel is lower than that of carbon steel at 0.03% at the same temperature, which could be explained by the surface of stainless steel with a high alloy element content being denser than that of carbon steel.
Above all, the emissivity calculation model (ECM) was built to reduce the temperature detection error. The relationship and equation between the wavelength and emissivity of lower alloy steel under 1147 K are shown in Figure 1a and Equation (1), respectively, whereas the temperature and emissivity of lower alloy steel under a 665 nm wavelength are shown in Figure 1b, and the equation is derived as Equation (2). The two equations about emissivity with the wavelength and temperature are only in the separate condition, which is not suitable for high rail steel plates, where it is essential to built and fusion model including wavelength and temperature. The ε_λ (655 nm) is 0.3408 and ε_T (1147 K) is 0.3568 under the respective conditions, so the relative error δ (λ ~ T) is 4.48%. To verify the general formula of Equation (1) to other wavelengths, it seems that those two parameters have a strong correlation, indicating that Equation (1) could be applied in other ranges of the wavelength.
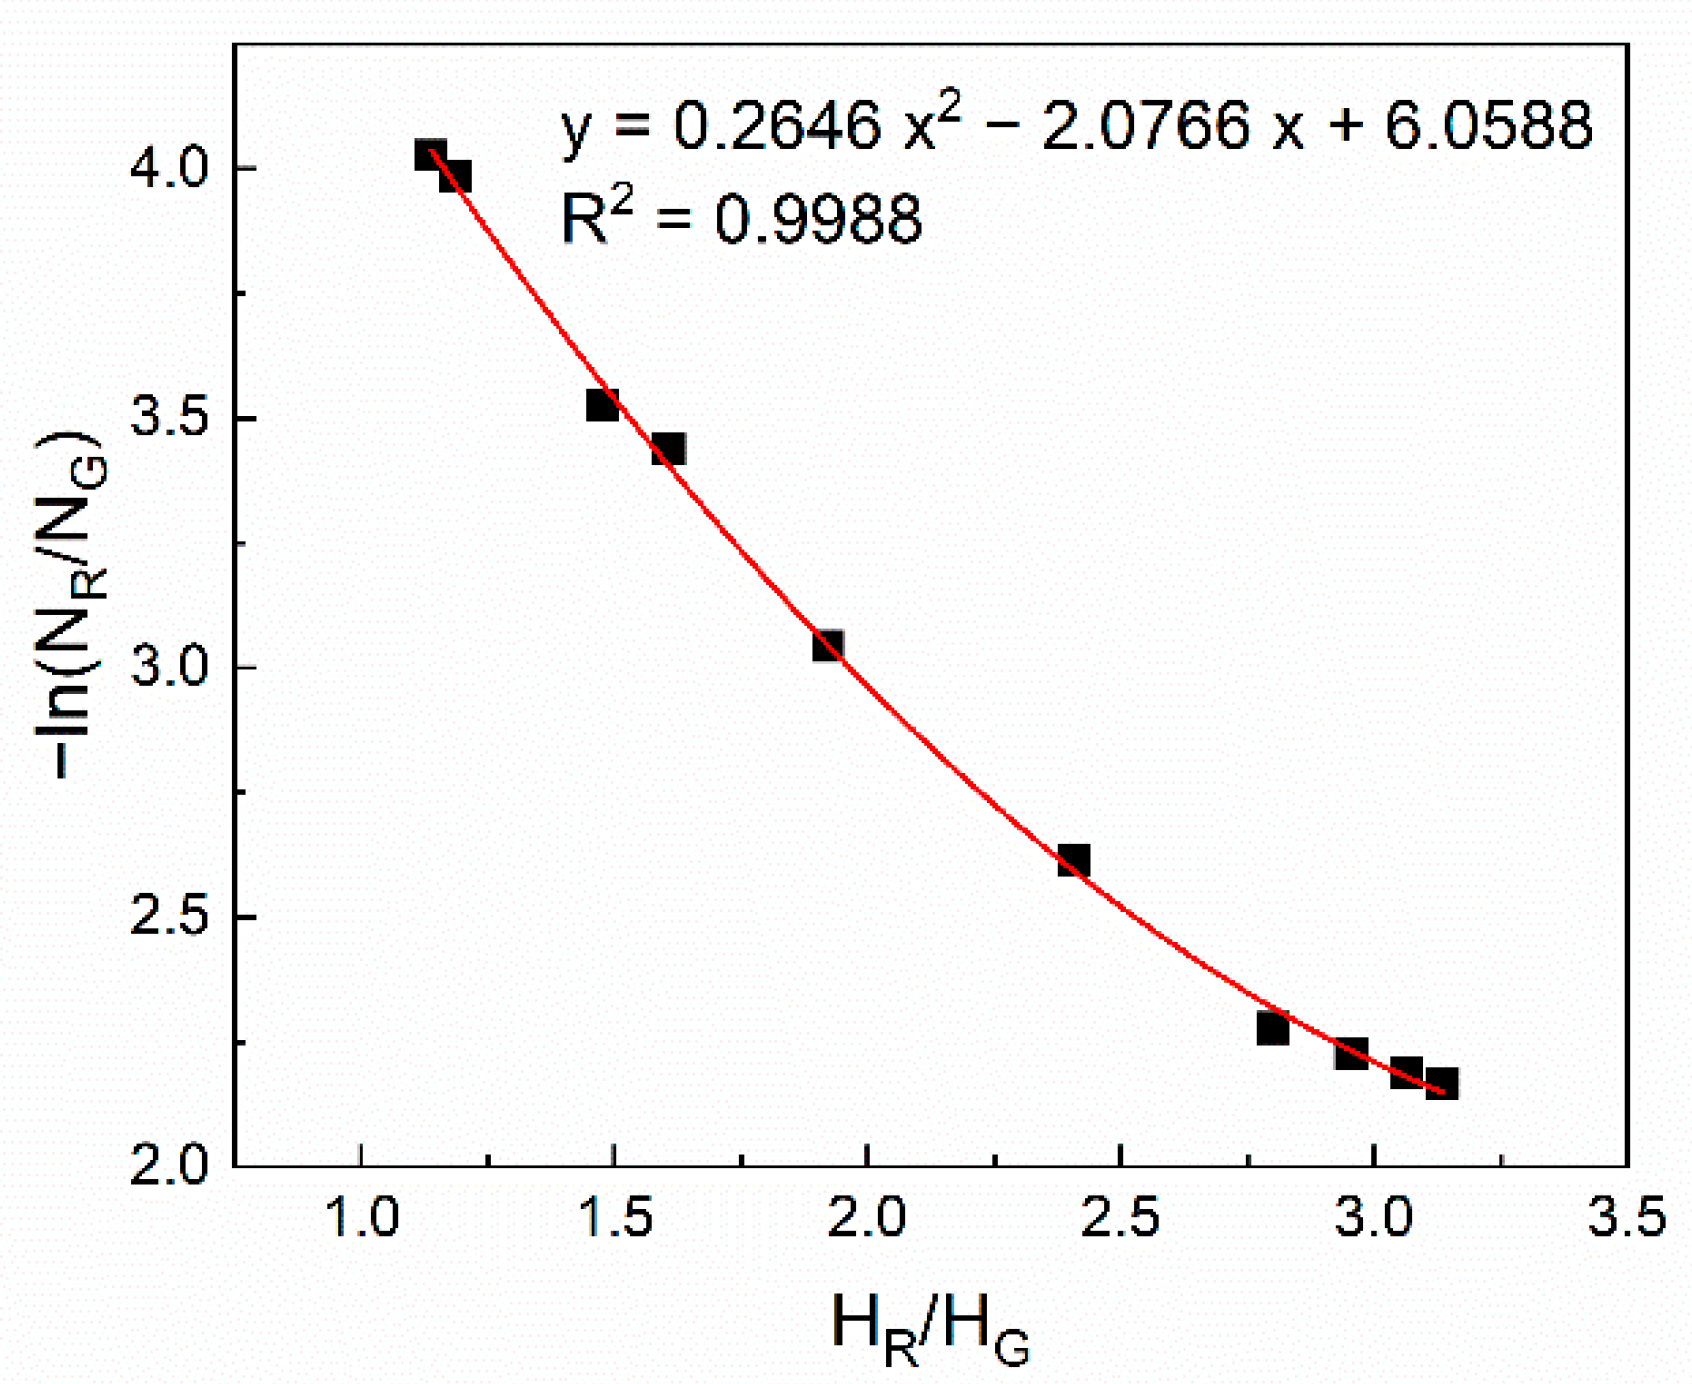
According to the above analysis, the errors in the emissivity model of rail steel plates have come from two main aspects. On the one hand, regarding the error caused by the emissivity fitting process, the R-Square (COD) of the wavelength and temperature is 0.9887 and 0.9853 in Equation (1). Secondly, those two-emissivity models are just under a specific single wavelength and a certain temperature due to the high cost of the full-wavelength and temperature experiment. Thus, the emissivity model can be modified from the following two aspects in this paper. On the one hand, the errors produced by Equations (1) and (2) will be minimized by . On the other hand, the absolute error of emissivity with wavelengths shown in Figure 2 and Equation (3) will also be considered. Accordingly, Equation (2) can be modified by Equation (5) to represent the emissivity variation with temperature and wavelength. The error analysis results of the emissivity model are shown in Table 1 and the largest relative error for emissivity variation with temperature and wavelength is approximately 1.21%, which indicates that the relative error of the revised model can satisfy the temperature calculation requirement.
3. Theory
3.1. Temperature Calculation Method
The method of measuring the temperature of a thermally radiating object as a function of the ratio of its spectral radiance at two wavelengths under the center temperature conditions is called colorimetric thermometry, and is also named the two-color method. If the greyscale values emitted from the same point are measured simultaneously at wavelengths and , respectively, temperature T is shown as Equation (6). The detailed calculation steps of colorimetric thermometry can be seen in references [29,30].
For a calibrated CCD system, can be obtained by image processing, can be obtained by the calibration process, and the emissivity model can be obtained from Equation (5). After the digital image processing of the plate, the surface temperature distribution of the rail steel plate can then be calculated point by point.
3.2. Noise Filtering Algorithm
The most commonly used denoising methods include adaptive smooth filtering denoising, adaptive median filtering denoising, geometric mean filtering denoising, super limit neighborhood filtering denoising, and wavelet filtering denoising [31]. The purpose of adaptive smoothing is to adjust the gradient filtering mask at a certain point so that, if the gradient at a certain point is large, causing a sudden change in the image, the mask factor could become small. Conversely, a low gradient at a point in the image means that it is probably not an image edge and has a higher mask factor. The principle of adaptive median filter denoising is to change the size of the filter window at certain set conditions, replacing the central pixel of noise in the filter window. The adaptive median filter can handle a larger probability of impulse noise by maintaining better image detail. To screen the useful pixels from noise-containing pixels, the distinct characteristics of pixels and noise under wavelet transformation can be used to achieve the separation of noise-free pixels from noise by processing the wavelet decomposition coefficients.
4. Experiments
4.1. Digital Imaging System
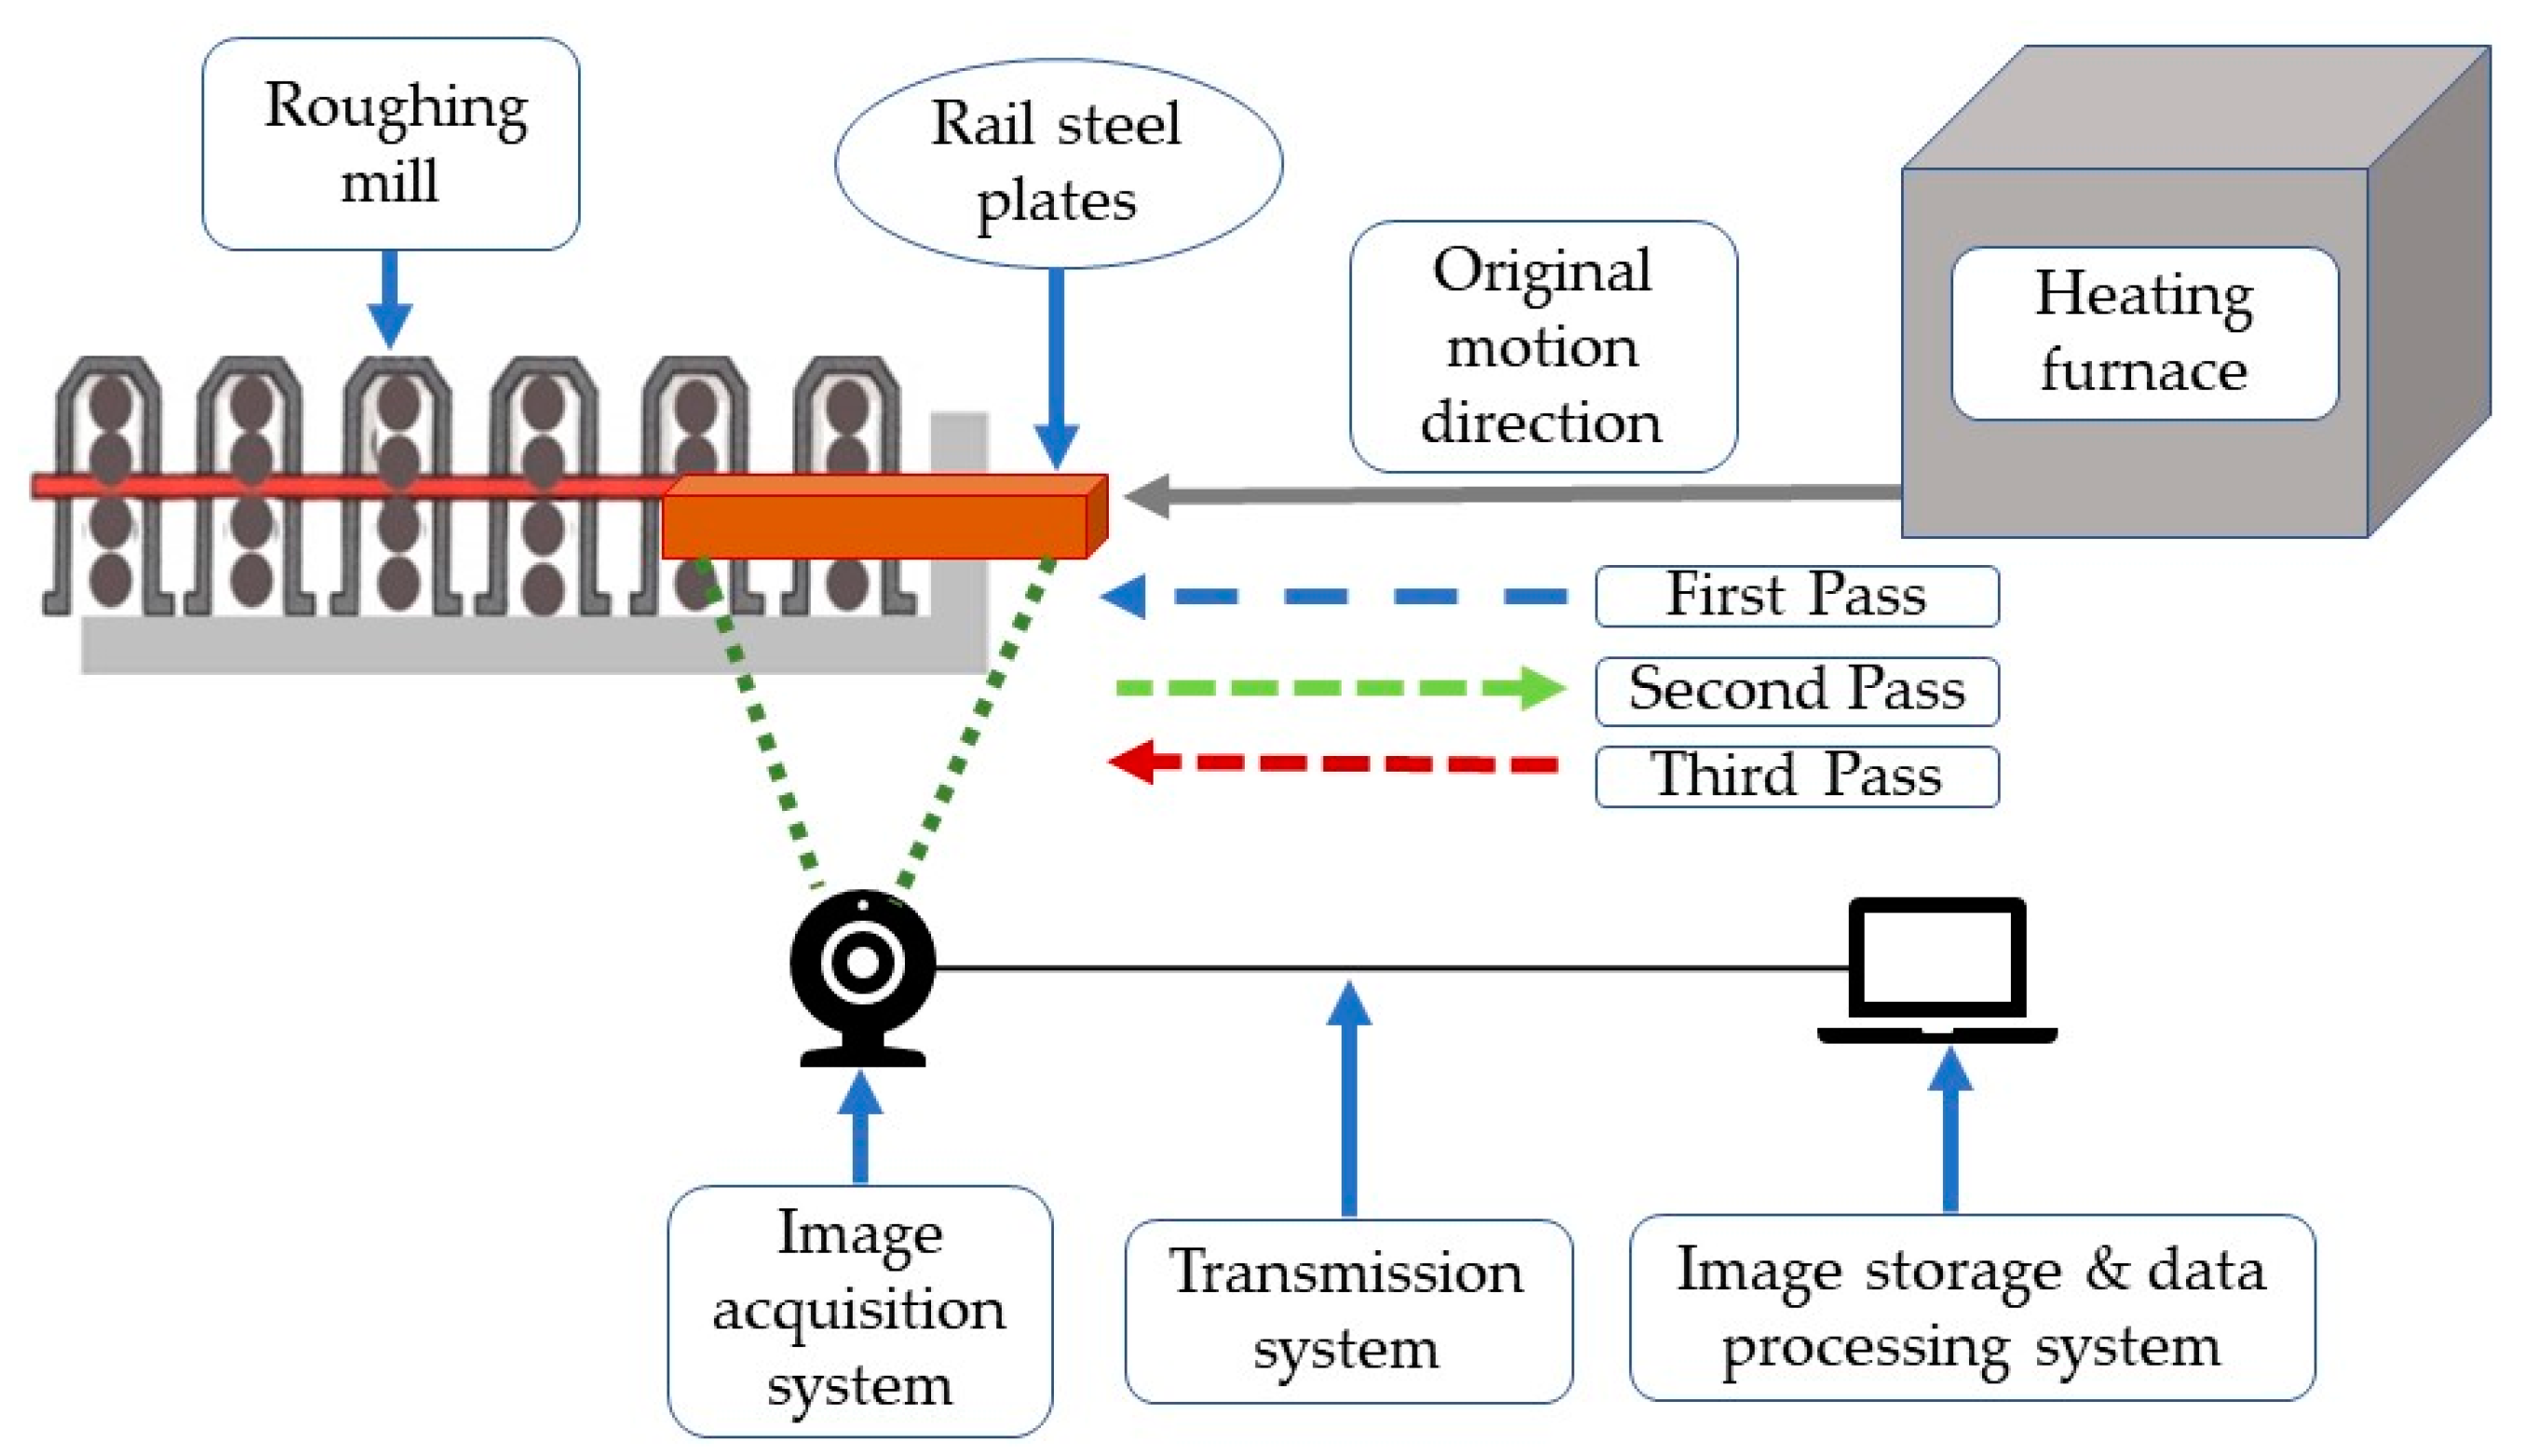
The digital imaging system is the key to the temperature distribution detection of plates; the main composition of the U75V rail steel plates is shown in Table 2, which should obtain the radiation information during the harsh environment, including high temperatures and dust, providing effective radiation images for surface temperature calculations. In this paper, the digital imaging system for rail steel plate temperature detection consisted of an image acquisition system, a transmission system, image storage, and a data processing system, including a multispectral camera, a lens, a data transmission line, and a storage system, as shown in Figure 3. The CCD camera was the multispectral camera AD-080GE from the Danish company JAI, which uses the Sony ICX-204AK and Sony ICX-204AL 1/3” progressive scan CCD sensors produced by Sony in Tokyo, Japan. The prismatic beam splitting method was used to project coaxial light from the same lens onto the two CCDs, respectively; then, the images from the two CCDs could be obtained. Therefore, the lens is one of the key factors in determining the visual and imaging quality of the camera. The Japanese Computar megapixel fixed focus lens was used in the system.
The experiments were carried out at rolling procedures; the light emitted from the plates enters the acquisition system and is captured by the multispectral CCD camera. Then, the radiation images from the multispectral CCD system from the Danish company JAI are transmitted from the transmission system to the image storage and data processing system, where the temperature distribution is calculated and finally displayed through software.
4.2. Calibration for Digital Imaging System
The temperature calibration process is the basis for colorimetric thermometry. The key is to find a source of radiation that produces a blackbody-like emission. Therefore, a blackbody furnace is an ideal object, and does not depend on the specific physical properties of established objects, defined for calibrating the digital imaging system under the center temperatures. Specifically, the blackbody radiation energy is related to the thermodynamic temperature by the Stefan–Boltzmann law. Absolute black bodies do not exist in nature and artificial black bodies have an absorption rate of radiation close to 1 and almost zero reflectivity. A blackbody furnace usually converts the heat generated by electrical energy into thermal energy, maintaining the continuous rise in the temperature inside the furnace continuously.
In this paper, the digital imaging system was calibrated in the Chinese Academy of Metrology; the blackbody furnace calibration process is shown in Figure 4. It consists of a furnace body, photoelectric pyrometer, control cabinet, water cooling system, vacuum system, and argon gas transmission system. The main body is a horizontal graphite tube furnace, with a heating system central to the body, which is divided into two symmetrical cavities. Outside the tube, there is a graphite heat insulation screen, and its exterior is covered with carbon felt and high-temperature insulation material, while the upper part is equipped with a water-cooling system, an evacuation system, and an argon gas transfer system. The comparison of the calibrated temperature calculated by Equations (5) and (6) with setting one is shown in Table 3. Normally, the error analysis of the colorimetric method by using a digital imaging system is used to compare the actual temperatures of the blackbody furnace with the calculated ones by the colorimetric method [32,33]; the result in this paper is shown in Table 3, whereas the relative error γ of TC and T can be calculated by Equation (7), and the results are shown in Figure 4. It seems that the largest measurement errors between calculated temperatures and the actual one in the blackbody furnace are within 0.82%, which could satisfy the tuyere temperature calculation in the rail steel plates.
4.3. Surface Temperature Variation during the Rolling Process
Studying the surface temperature variation during the rolling process could benefit control optimization and the understanding of cooling mechanisms. In this paper, the digital imaging system was applied in the rolling process after the heating zone in a rail steel production procedure. The images of the red, green, and blue color channels of the steel plate, as well as the near-infrared images, were captured and saved, and the temperature distributions of the four groups of plates were calculated and analyzed at the same time. Therefore, the imaging distance is 3 m, the lens focal length is 16 mm, and the aperture is F8. To obtain the high-quality radiation images, the different exposure times were set to ensure that the greyscale values of the captured images were all below 255, avoiding the supersaturation.
5. Results and Discussion
5.1. Noise Filtering Results
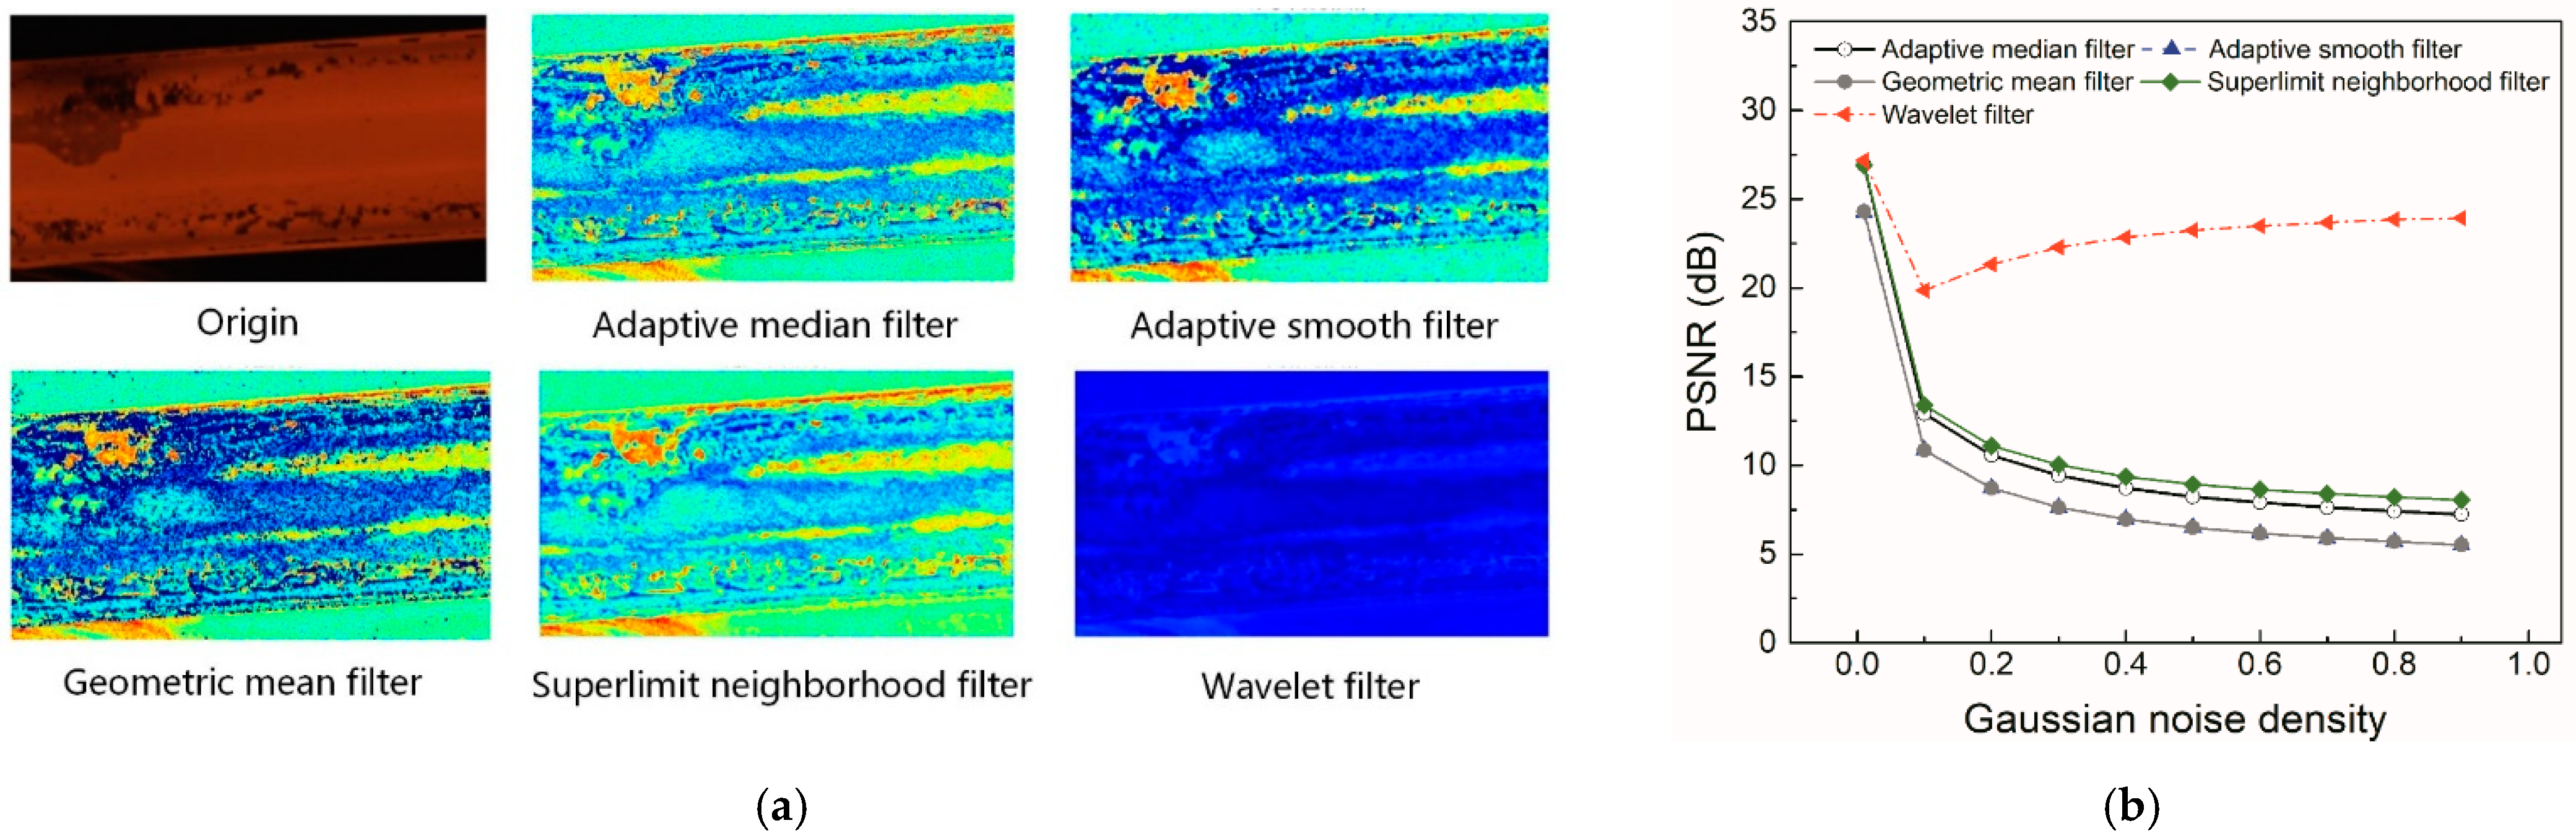
The five denoising methods were applied to denoise the images of rail steel plates; the denoising results are shown in Figure 5a, indicating that the denoised images obtained by those methods have retained the edge details as well as high-temperature parts in the images. The peak signal-to-noise ratio (PSNR) criterion is applied to evaluate the effectiveness of those five denoising methods, which is calculated by the error between the resultant image after the filtering and denoising of the original noise-free image. A larger PSNR value means a better denoising result for the original image. The detailed calculation steps of denoising methods and PSNR can be seen in references [34]. The PSNR of noise density for different denoising methods of image-joining Gaussian noise is shown in Figure 5b; the PSNR value is the largest for the wavelet filter denoising method when the noise density is 0.01. With the increase in noise density, the PSNR value of the wavelet filter denoising method is nearly maintained, whereas the others show a significantly tendency to decrease. Consequently, the wavelet filter denoising method is suitable for denoising the high-temperature rail steel plate.
5.2. Temperature Detection Results during Rolling Passes
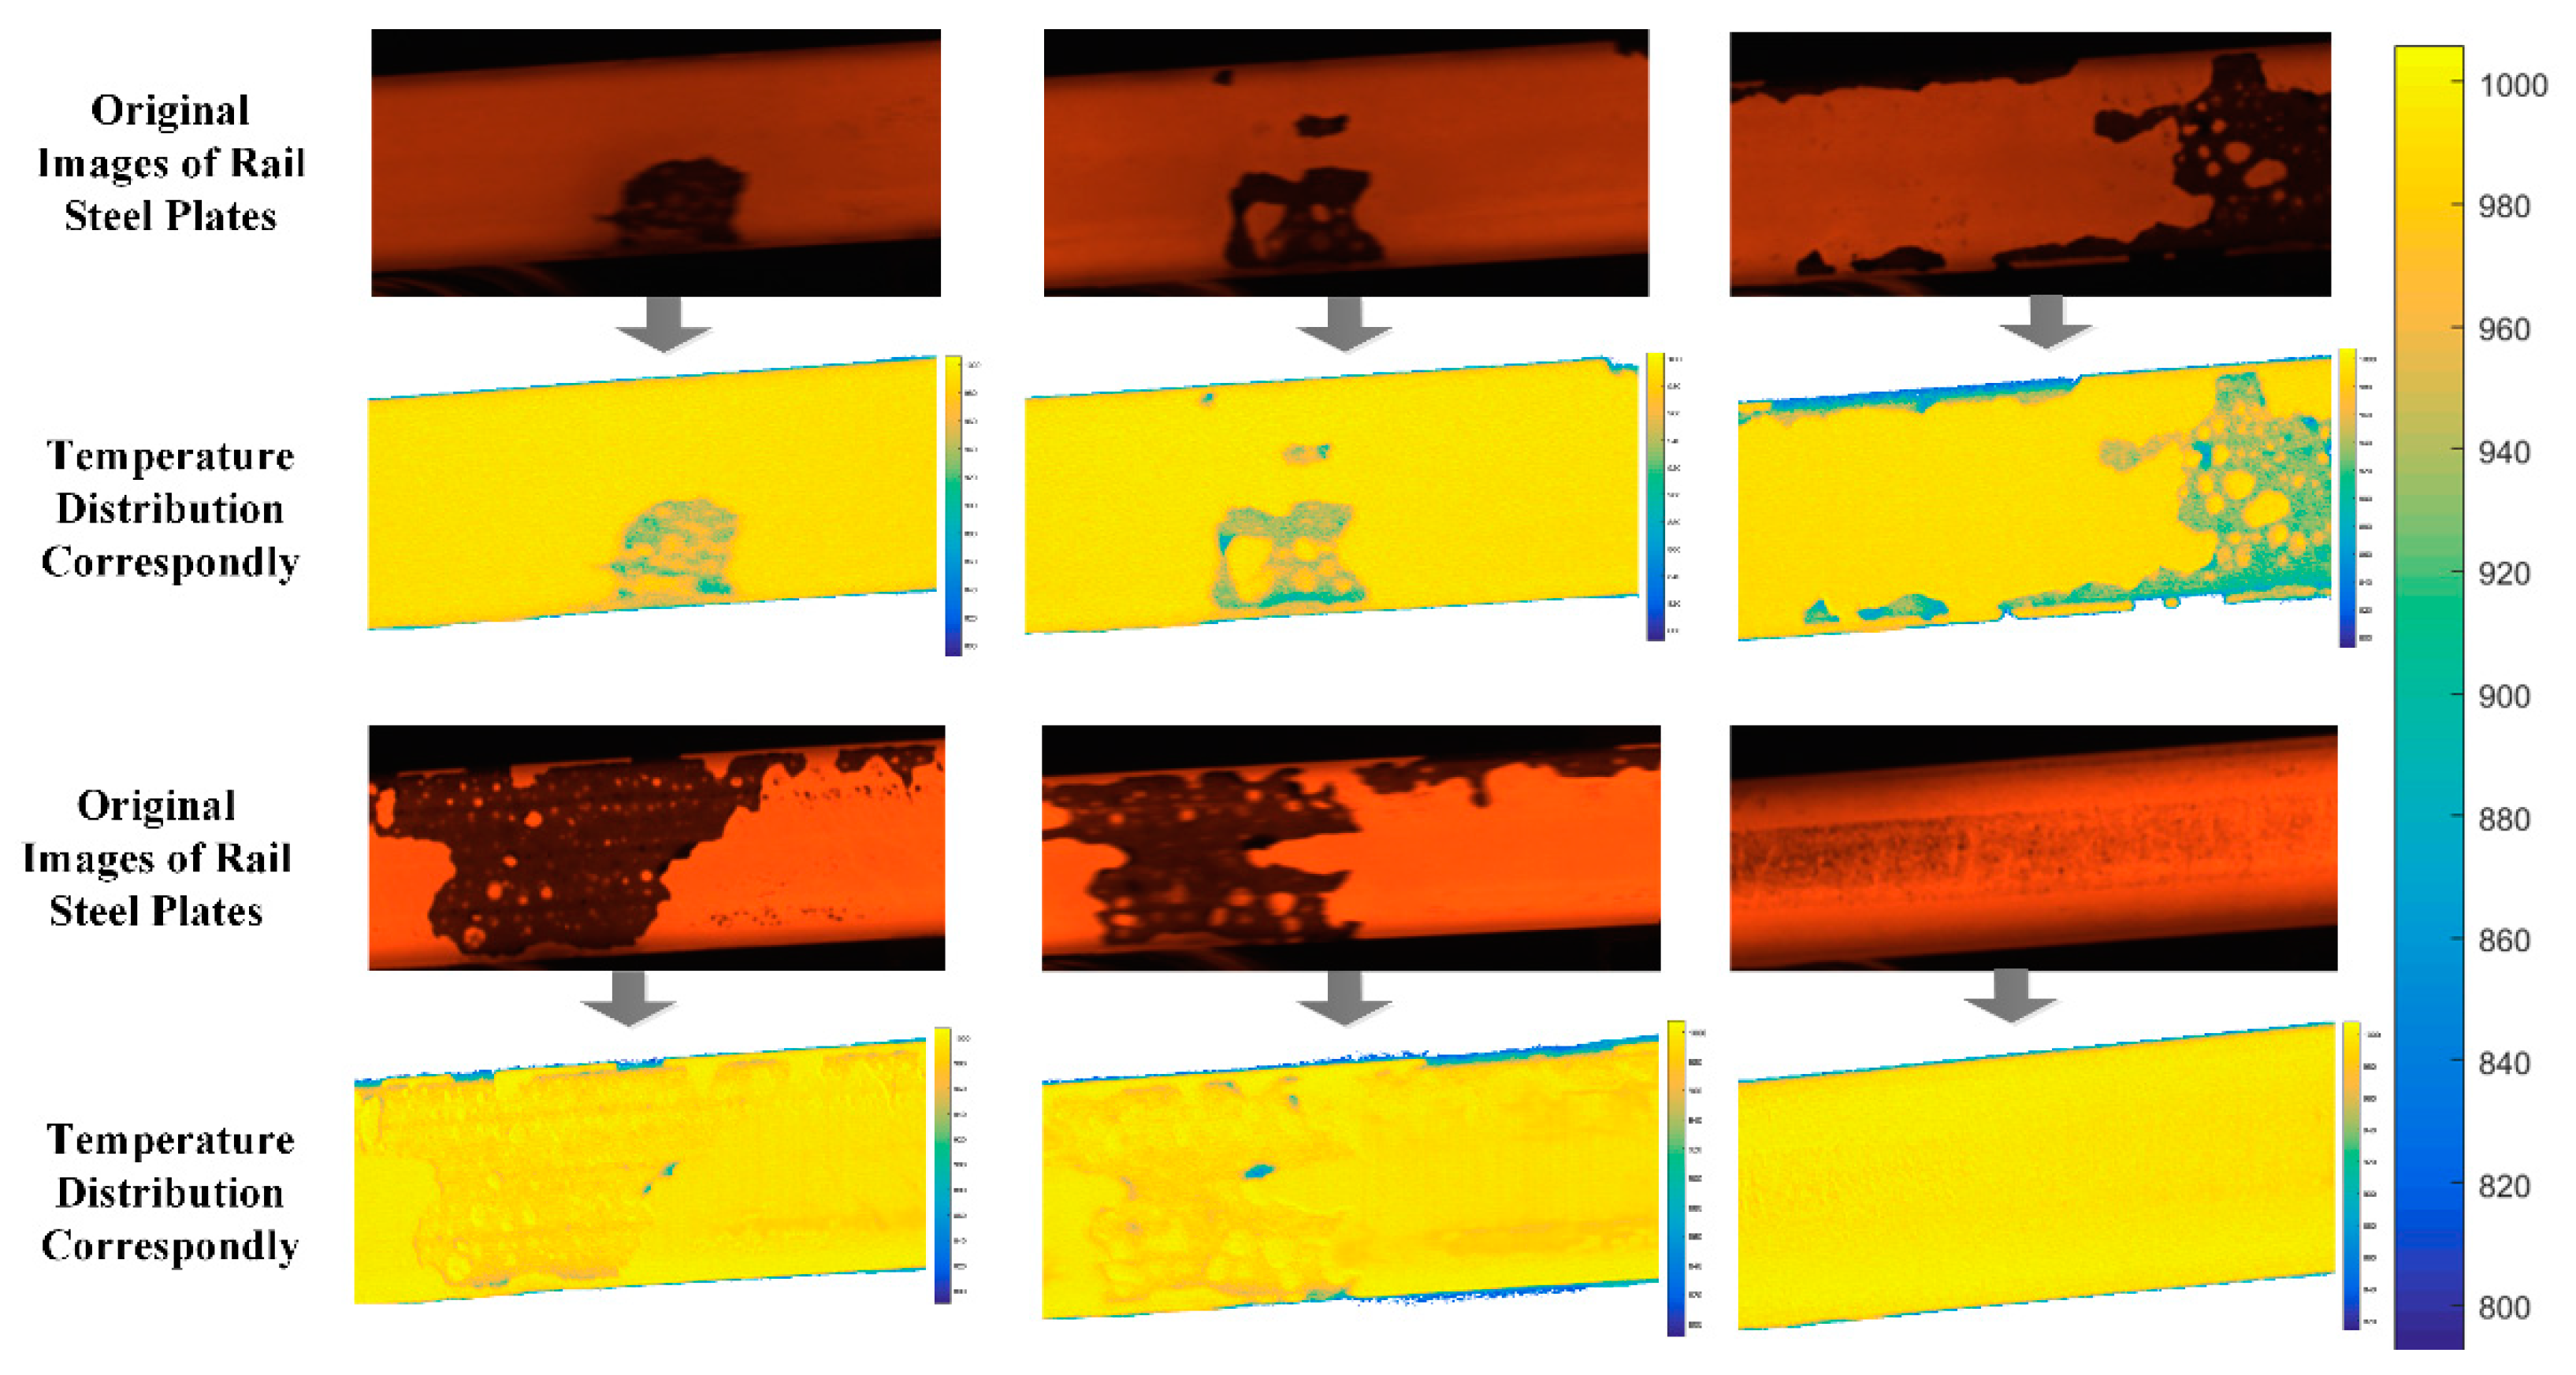
To calculate the temperature distribution of rail steel plates radiation images, the acquired images were first denoised by using a wavelet filtering algorithm, and then the temperature distribution was calculated by using a colorimetric thermometry model based on the emissivity model and blackbody furnace calibration results. Then, the temperature distribution matrix of the plate after the heating zone of two images for red and green wavelengths was substituted and finally calculated; part of those are shown in Figure 6. The temperature of each pixel in the original photos of rail steel plates was computed and presented in the corresponding temperature distribution images, while the background of the original photographs was also erased using the edge-processing approach. The initial rolling pass collects pictures containing iron oxide on the surface of the rail steel plate. As a result, the average temperature of each pixel in the temperature distribution image is identical to the temperature of each original image. Moreover, the temperature in the iron oxide area is 100 °C to 150 °C lower than that of the normal ‘smooth’ surface, although the temperature in the brighter color parts is significantly greater than in the lower ones, indicating that the temperature is not uniformly spread throughout the surface of the rial steel plate during the rolling operation.
The important problem is how to decrease the predicted temperature inaccuracy of rail steel plates, and we have studied three aspects in this research, including an emissivity model, blackbody furnace calibration, and noise filtering method. To begin, the inaccuracy for the emissivity fluctuation with temperature and wavelength is around 1.21%, as shown in Equation (5) of the temperature calculation technique. Second, in Equation (7), the maximum measurement errors between calculated and actual temperatures in the blackbody furnace are within 0.82 percent. Third, the wavelet filter denoising method removed the inaccuracy caused by the high-temperature environment and the digital imaging equipment itself. When the temperature calculation results of rail steel plates in the rolling process are compared to the measurement results of a single-point infrared thermometer, they are within the error range of 0.82% of the biggest blackbody furnace calibration results. This suggests that the temperature estimation inaccuracy of rail steel plates in the rolling process in this article might meet the needs of actual production lines.
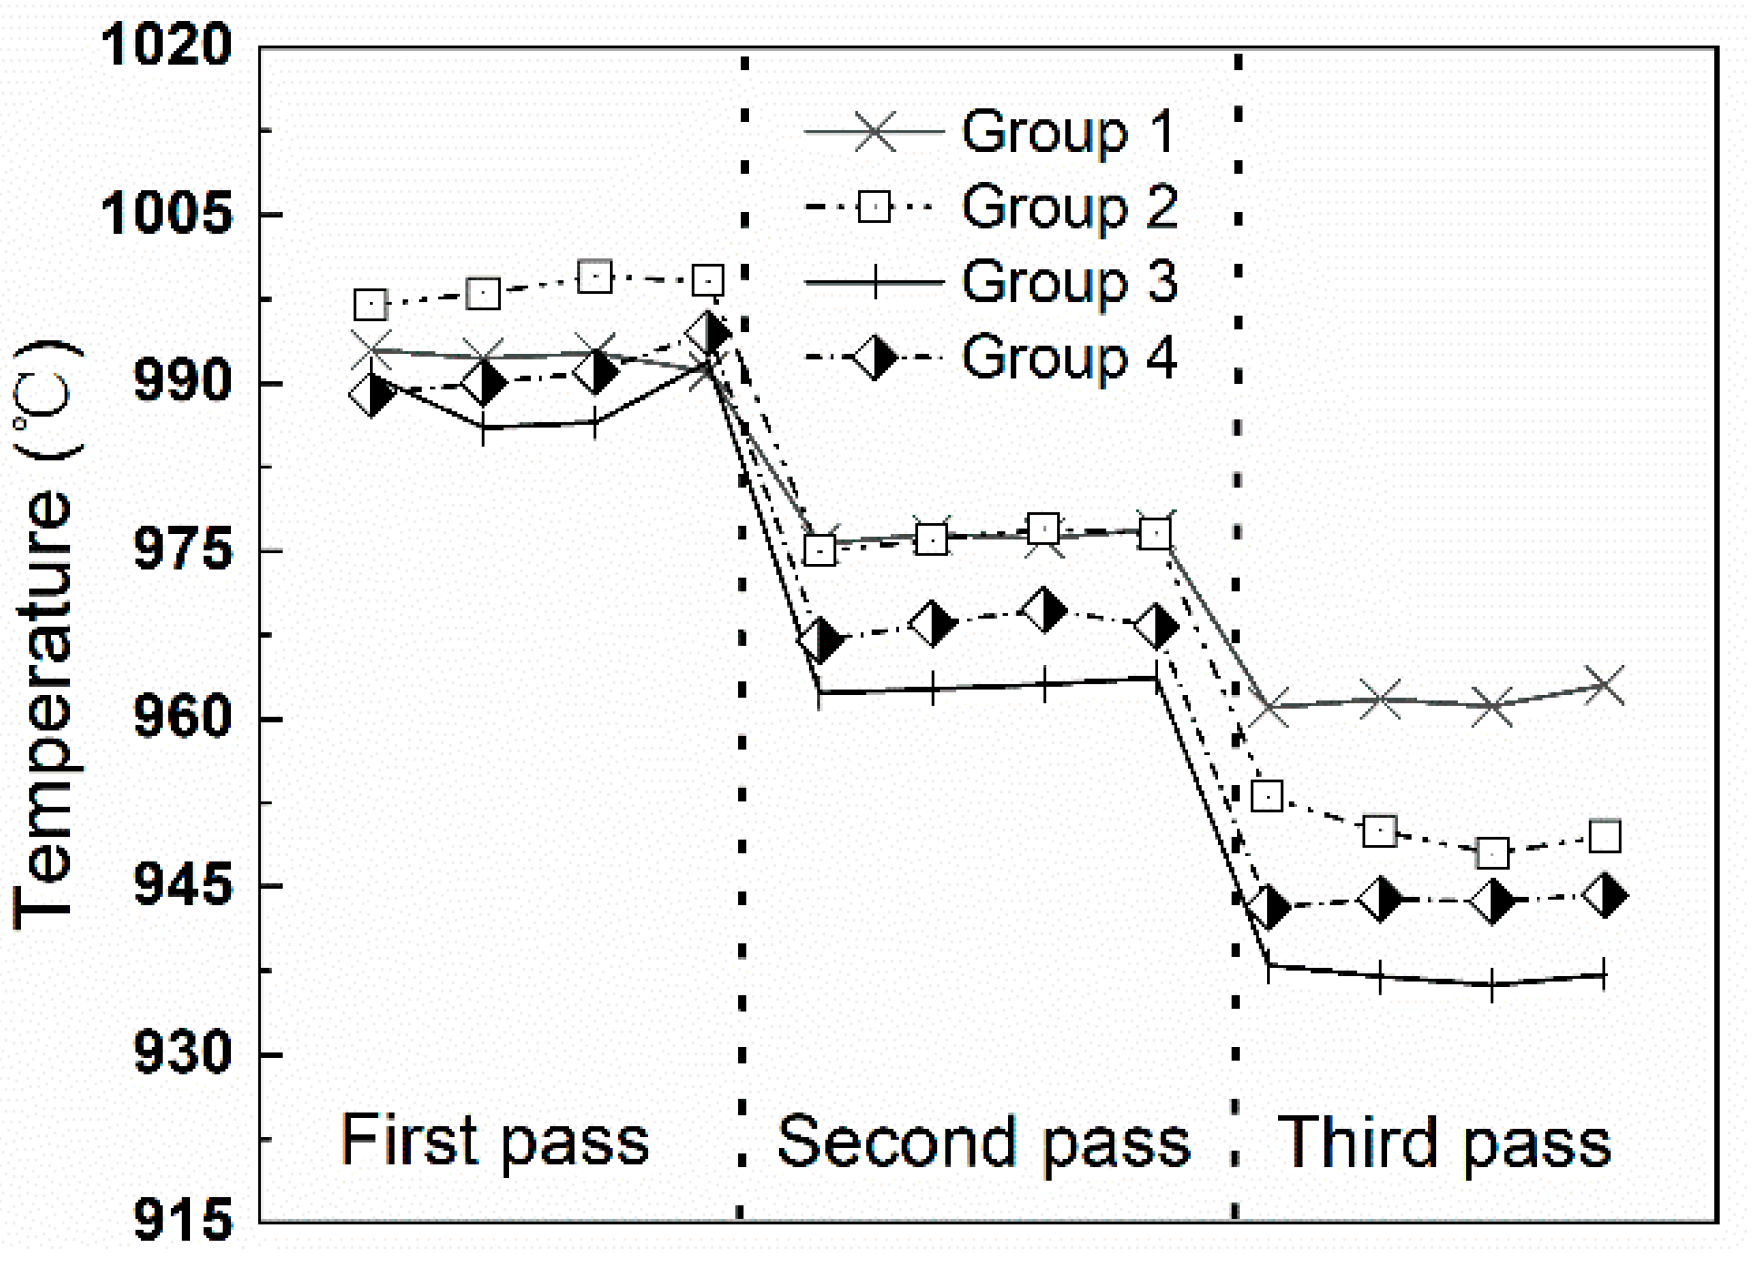
Rolling the prescriptive size and performance of rail steel plate products usually requires several high-temperature rolling passes. Temperature variation in the different passes is a key parameter in determining the cooling rate, which could also determine the control parameters of the rolling process and the performance of final rail steel products. In this paper, four typical images from one certain pass of rail steel plate were selected in each rolling pass, and the temperature distribution was calculated and summarized, as shown in Figure 7. Therefore, Group 1 to Group 4 represent the different rail steel plates that have entered through the areas of the field of view of the digital imaging system in Figure 3. According to practical experience, the temperature of these plates drops to around 1000 °C when it enters the rolling stage after water jet cooling. The calculated results show that the four temperatures in the first pass are in the range of 980 °C to 1000 °C, and the difference in each point at the same pass is nearly approximately 10 °C, indicating that the temperature calculation results for a single pass are reasonable and comply with experience. In the first rolling pass, the average temperatures of each group are not the same due to the inhomogeneity of the furnace temperature control per different batch of rail steel plates. It could also be observed that the temperature of the later pass is lower than that of the front one, showing that the temperature of the plate gradually decreases during the rolling process. This could be explained by the fact that the rail steel plates will go through a series of processes, such as rolling, water spraying, turning, rolling, and water spraying, during the rolling process, causing the surface temperature to show a tendency to decrease, whereas the temperature fluctuates in the range of 920 °C to 960 °C in the final pass. These results could benefit the control of the cooling rate and optimize the rolling model during rolling passes.
6. Conclusions
The rolling process is a critical step in the production of new low-alloy rail steel, and it is directly connected to the quality of U75V rail. However, due to the hazardous environment, incorrect surface emissivity, and complex backgrounds, as one of the important parameters influencing the rolling quality and closed-loop control of the rolling model and process optimization of cooling rates, there is still no extensive online detection system for the surface temperature of rail steel plates. Firstly, the surface temperature of a rail steel plate during the rolling process may be detected using a digital imaging system based on multi-spectral photography and colorimetric thermometry based on an emissivity calculation model and blackbody calibration. Second, the temperature calculation errors introduced by the model and the environment have been decreased by the emissivity model, blackbody furnace calibration, and noise filtering technique. In addition, when compared to the measurement results of a single-point infrared thermometer, the temperature calculation results of rail steel plates in the rolling process are within 0.82% of the biggest blackbody furnace calibration results. Furthermore, the wavelet filter denoising technique is adopted for denoising a high-temperature rail steel plate. Fourth, the temperature in the iron oxide area is 100 °C to 150 °C lower than that of a normal ‘smooth’ surface, whereas the temperature is not equally distributed at different locations of the surface in rail steel plates during the rolling operation. Fifth, the temperature of the plate gradually lowers during the rolling process, with temperatures fluctuating between 920 °C and 960 °C in the last pass, which might help to regulate the cooling rate and improve the rolling model during rolling passes.
Author Contributions
Conceptualization, K.X. and D.Z.; methodology, D.Z.; resources, F.G.; data curation, J.W.; writing, D.Z. All authors have read and agreed to the published version of the manuscript.
Funding
This research was funded by the National Key R&D Program of China, grant number 2021YFB3202400&2021YFB3202403, National Natural Science Foundation of China, grant number 51874022 and Fundamental Research Funds for the Central Universities, grant number FRF-AT-20-04.
Data Availability Statement
Not applicable.
Conflicts of Interest
The authors declare no conflict of interest.
References
- Seo, J.; Hur, H.; Kwon, S. Effect of Mechanical Properties of Rail and Wheel on Wear and Rolling Contact Fatigue. Metals 2022, 12, 630. [Google Scholar] [CrossRef]
- Khan, A.R.; Yu, S.; Wang, H.; Jiang, Y. Effect of Cooling Rate on Microstructure and Mechanical Properties in the CGHAZ of Electroslag Welded Pearlitic Rail Steel. Metals 2019, 9, 742. [Google Scholar] [CrossRef] [Green Version]
- Rodríguez-Garrido, R.; Carballar, A.; Vera, J.; González-Aguilar, J.; Altamirano, A.; Loureiro, A.; Pereira, D. High-Temperature Monitoring in Central Receiver Concentrating Solar Power Plants with Femtosecond-Laser Inscribed FBG. Sensors 2021, 21, 3762. [Google Scholar] [CrossRef] [PubMed]
- Jiang, W.; Long, M.; Chen, D.; Ai, S.; Duan, H. Temperature Distribution in the As-Cast Steel Specimen During Gleeble Hot-Tensile Test and Its Effect on High-Temperature Mechanical Properties. Metall. Mater. Trans. B-Process Metall. Mater. Process. Sci. 2021, 52, 1228–1242. [Google Scholar] [CrossRef]
- Monier, R.; Thumerel, F.; Chapuis, J.; Soulié, F.; Bordreuil, C. Liquid metals surface temperature distributions measurements with a two-colour pyrometer. Measurement 2017, 101, 72–80. [Google Scholar] [CrossRef] [Green Version]
- Gosai, M.; Bhavsar, S.N. Experimental Study on Temperature Measurement in Turning Operation of Hardened Steel (EN36). Procedia Technol. 2016, 23, 311–318. [Google Scholar] [CrossRef] [Green Version]
- Zhang, Y.; Xie, Z.; Hu, Z.; Zhao, S.; Bai, H. Online Surface Temperature Measurement of Plates in Secondary Cooling Zone End-Piece Based on Data Fusion. IEEE Trans. Instrum. Meas. 2014, 63, 612–619. [Google Scholar] [CrossRef]
- He, Q.; Xie, Z. Molten Steel Level Identification Based on Temperature Distribution Distribution Sensed by a Refractory Bar. IEEE Trans. Instrum. Meas. 2018, 67, 2830–2840. [Google Scholar] [CrossRef]
- Zhang, Y.; Lang, X.; Hu, Z.; Shu, S. Development of a CCD-based pyrometer for surface temperature measurement of casting plates. Meas. Sci. Technol. 2017, 28, 65903. [Google Scholar] [CrossRef]
- Qi, P.Y.; Wang, G.; Gao, Z.; Liu, X.; Liu, W. Measurements of Temperature Distribution for High Temperature Rail steel plates Based on Digital Image Correlation. Materials 2019, 12, 3322. [Google Scholar] [CrossRef] [Green Version]
- Wang, H.; Chen, D.; Wang, G.; Long, Y.; Luo, J.; Liu, L.; Yang, Q. Measurement technology for material emissivity under high temperature dynamic heating conditions. Measurement 2013, 46, 4023–4031. [Google Scholar] [CrossRef]
- Shi, D.; Zou, F.; Wang, S.; Zhu, Z.; Sun, J. Effect of surface oxidization on the spectral emissivity of steel 304 at the elevated temperature in air. Infrared Phys. Technol. 2014, 66, 6–12. [Google Scholar] [CrossRef]
- Honnerová, P.; Veselý, Z.; Honner, M. Experimental mathematical model as a generalization of sensitivity analysis of high temperature spectral emissivity measurement method. Measurement 2016, 90, 475–482. [Google Scholar] [CrossRef]
- Larciprete, M.C.; Gloy, Y.S.; Li Voti, R.; Cesarini, G.; Leahu, G.; Bertolotti, M.; Sibilia, C. Temperature dependent emissivity of different stainless steel textiles in the infrared range. Int. J. Therm. Sci. 2017, 113, 130–135. [Google Scholar] [CrossRef]
- Taylor, S.; Wright, J.B.; Forrest, E.C.; Jared, B.; Koepke, J.; Beaman, J. Investigating relationship between surface topography and emissivity of metallic additively manufactured parts. Int. Commun. Heat Mass Transf. 2020, 115, 104614. [Google Scholar] [CrossRef]
- Karthick, S.; Prasanna Raj Yadav, S.; Joel, C.; Senthilnathan, K.; Suresh, R.; Muthukumaran, S. A straightforward trail study on analysis of thickness variation of black nickel coating on stainless steel surface for emissivity. Mater. Today Proc. 2021, 37, 129–132. [Google Scholar] [CrossRef]
- Pierre, T.; Krapez, J.; Orlande, H.R.B.; Rodiet, C.; Le Maux, D.; Courtois, M.; Le Masson, P.; Lamien, B. Simultaneous estimation of temperature and emissivity of metals around their melting points by deterministic and Bayesian techniques. Int. J. Heat Mass Transf. 2022, 183, 122077. [Google Scholar] [CrossRef]
- Touloukian, Y.S.; DeWitt, D.P. Thermal Radiative Properties: Metallic Elements and Alloys; Purdue University, Thermophysical Properties Research Center: West Lafayette, IN, USA, 1970. [Google Scholar]
- Mayr-Schmolzer, B.; Wesemann, I.; Trober, R.; O’Sullivan, M.; Kestler, H.; Sigl, L. A method for measuring the high temperature emittance of refractory metal surfaces. Int. J. Refract. Met. Hard Mater. 2018, 73, 7–12. [Google Scholar] [CrossRef]
- Xing, W.; Shi, D.; Sun, J.; Zhu, Z. Emissivity model of steel 430 during the growth of oxide layer at 800–1100 K and 1.5 μm. Infrared Phys. Technol. 2018, 88, 23–31. [Google Scholar] [CrossRef]
- Ham, S.H.; Carteret, C.; Angulo, J.; Fricout, G. Relation between emissivity evolution during annealing and selective oxidation of TRIP steel. Corros. Sci. 2018, 132, 185–193. [Google Scholar] [CrossRef]
- Suleiman, F.K.; Lin, K.; Daun, K.J. Development of a multivariate spectral emissivity model for an advanced high strength steel alloy through factorial design-of-experiments. J. Quant. Spectrosc. Radiat. Transf. 2021, 271, 107693. [Google Scholar] [CrossRef]
- Li, J.; Huang, Y.; Fu, L.; Fu, T.; Zhang, J. Measurements of spectral emissivity, reflectance and transmittance at high temperatures using laser heating and auxiliary light source. Int. J. Heat Mass Transf. 2022, 183, 122092. [Google Scholar] [CrossRef]
- Wang, P.; Xie, Z.; Hu, Z. Study on the Multi-wavelength Emissivity of GCr15 Steel and its Application on Temperature Measurement for Plates. Int. J. Thermophys. 2016, 37, 129. [Google Scholar] [CrossRef]
- Fu, T.; Xiong, Y.; Liu, J.; Shi, C. Measurements of Temperature and Emissivity Distributions on a High-Temperature Surface Using an Auxiliary Light Source Method. J. Heat Transf.-Trans. ASME 2019, 141, 082702. [Google Scholar] [CrossRef]
- Zhang, Y.; Lu, F.; Wang, W.; Shu, S.; Dong, J.; Tao, X. Noise characterization and compensation for a charge-coupled-device-based pyrometer. Rev. Sci. Instrum. 2021, 92, 054902. [Google Scholar] [CrossRef]
- Liu, H.; Ge, J.; Song, W.; Lan, J. Interference Platee Noise Reduction of CMOS Sensor-Based Digital Holographic Measurement System. IEEE Photonics J. 2021, 13, 1–18. [Google Scholar]
- Volgyesi, L.; Toth, G. Calibration of CCD sensors mounted on geodetic measuring systems. Surv. Rev. 2021, 53, 136–145. [Google Scholar] [CrossRef]
- Zhang, F.; Sun, X.; Xing, J. Research of Multi Points and Multi Spectral Calibration in Two-Dimensional Temperature Distribution Reconstruction Based on CCD. Spectrosc. Spectr. Anal. 2017, 37, 2283–2287. [Google Scholar]
- Zhou, D.; Xu, K.; Bai, J.; He, D. On-line detecting the tuyere coke size and temperature distribution of raceway zone in a working blast furnace. Fuel 2022, 316, 123349. [Google Scholar] [CrossRef]
- Montoya-Rangel, M.; Garza-Montes De Oca, N.; Gaona-Tiburcio, C.; Colás, R.; Cabral-Miramontes, J.; Nieves-Mendoza, D.; Maldonado-Bandala, E.; Chacón-Nava, J.; Almeraya-Calderón, F. Electrochemical Noise Measurements of Advanced High-Strength Steels in Different Solutions. Metals 2020, 10, 1232. [Google Scholar] [CrossRef]
- Draper, T.; Zeltner, D.; Tree, D.; Xue, Y.; Tsiava, R. Two-dimensional flame temperature and emissivity measurements of pulverized oxy-coal flames. Appl. Energy 2012, 95, 38–44. [Google Scholar] [CrossRef]
- González-Cencerrado, A.; Peña, B.; Gil, A. Coal flame characterization by means of digital image processing in a semi-industrial scale PF swirl burner. Appl. Energy 2012, 94, 375–384. [Google Scholar] [CrossRef]
- Zhou, D.; Cheng, S. Measurement study of the PCI process on the temperature distribution in raceway zone of blast furnace by using digital imaging techniques. Energy 2019, 174, 814–822. [Google Scholar] [CrossRef]
Figure 1.
The relationship between wavelength and temperature with an emissivity of ordinary carbon steel in different conditions (online version in color.): (a) wavelength in 1147 K; (b) temperature in 665 nm.
Figure 1.
The relationship between wavelength and temperature with an emissivity of ordinary carbon steel in different conditions (online version in color.): (a) wavelength in 1147 K; (b) temperature in 665 nm.

Figure 2.
The absolute error value of emissivity with wavelengths.

Figure 3.
The diagram of the digital imaging system in the rail steel plates rolling process (online version in color).
Figure 3.
The diagram of the digital imaging system in the rail steel plates rolling process (online version in color).

Figure 4.
The calibration results of the digital imaging system in the rail steel plates rolling process (online version in color).
Figure 4.
The calibration results of the digital imaging system in the rail steel plates rolling process (online version in color).

Figure 5.
The noise filtering results of rail steel plates radiation images (online version in color): (a) results for different filtering methods; (b) PSNR.
Figure 5.
The noise filtering results of rail steel plates radiation images (online version in color): (a) results for different filtering methods; (b) PSNR.

Figure 6.
The part of radiation images and temperature distributions of rail steel plates during rolling processes (online version in color).
Figure 6.
The part of radiation images and temperature distributions of rail steel plates during rolling processes (online version in color).

Figure 7.
The surface temperature of the rail steel plates varies during the rolling passes.


Table 1.
The error analyzes the results of the emissivity model.
| Wavelength/nm | Temperature/K | Calculated Emissivity | Measured Emissivity | Relative Error/% |
|---|---|---|---|---|
| 560 | 1147 | 0.3618 | 0.36 | 0.51 |
| 700 | 1700 | 0.4046 | 0.4098 | 1.21 |
Table 2.
The main compositions of the U75V rail steel plates.
| Plate | Compositions/% | |||||
|---|---|---|---|---|---|---|
| C | Si | Mn | S | P | V | |
| U75V | 0.75 | 0.67 | 0.95 | 0.025 | 0.017 | 0.095 |
Table 3.
Comparison of the calculated temperature with those of the blackbody furnace.
| Setting Temperature/T °C | Calculated Temperature/TC °C | Error γ/% |
|---|---|---|
| 800 | 802.151 | 0.27 |
| 850 | 844.609 | 0.63 |
| 900 | 902.337 | 0.26 |
| 950 | 957.835 | 0.82 |
| 1000 | 1002.013 | 0.20 |
Publisher’s Note: MDPI stays neutral with regard to jurisdictional claims in published maps and institutional affiliations. |
© 2022 by the authors. Licensee MDPI, Basel, Switzerland. This article is an open access article distributed under the terms and conditions of the Creative Commons Attribution (CC BY) license (https://creativecommons.org/licenses/by/4.0/).
Share and Cite
MDPI and ACS Style
Zhou, D.; Gao, F.; Wang, J.; Xu, K. Study of Surface Temperature Distribution for High-Temperature U75V Rail Steel Plates in Rolling Process by Colorimetry Thermometry. Metals 2022, 12, 860. https://doi.org/10.3390/met12050860
AMA Style
Zhou D, Gao F, Wang J, Xu K. Study of Surface Temperature Distribution for High-Temperature U75V Rail Steel Plates in Rolling Process by Colorimetry Thermometry. Metals. 2022; 12(5):860. https://doi.org/10.3390/met12050860
Chicago/Turabian StyleZhou, Dongdong, Feng Gao, Junjian Wang, and Ke Xu. 2022. "Study of Surface Temperature Distribution for High-Temperature U75V Rail Steel Plates in Rolling Process by Colorimetry Thermometry" Metals 12, no. 5: 860. https://doi.org/10.3390/met12050860
Note that from the first issue of 2016, this journal uses article numbers instead of page numbers. See further details here.