
Modification of the Structural, Microstructural, and Elastoplastic Properties of Aluminum Wires after Operation

 , ,
, ,  , ,
, ,
Abstract
:
1. Introduction
2. Materials and Methods
2.1. Samples
2.2. SEM, EDX, and EBSD Experimental Details
2.3. XRD Experimental Details
2.4. Experimental Details of Acoustic and Densitometric Measurement
3. Results
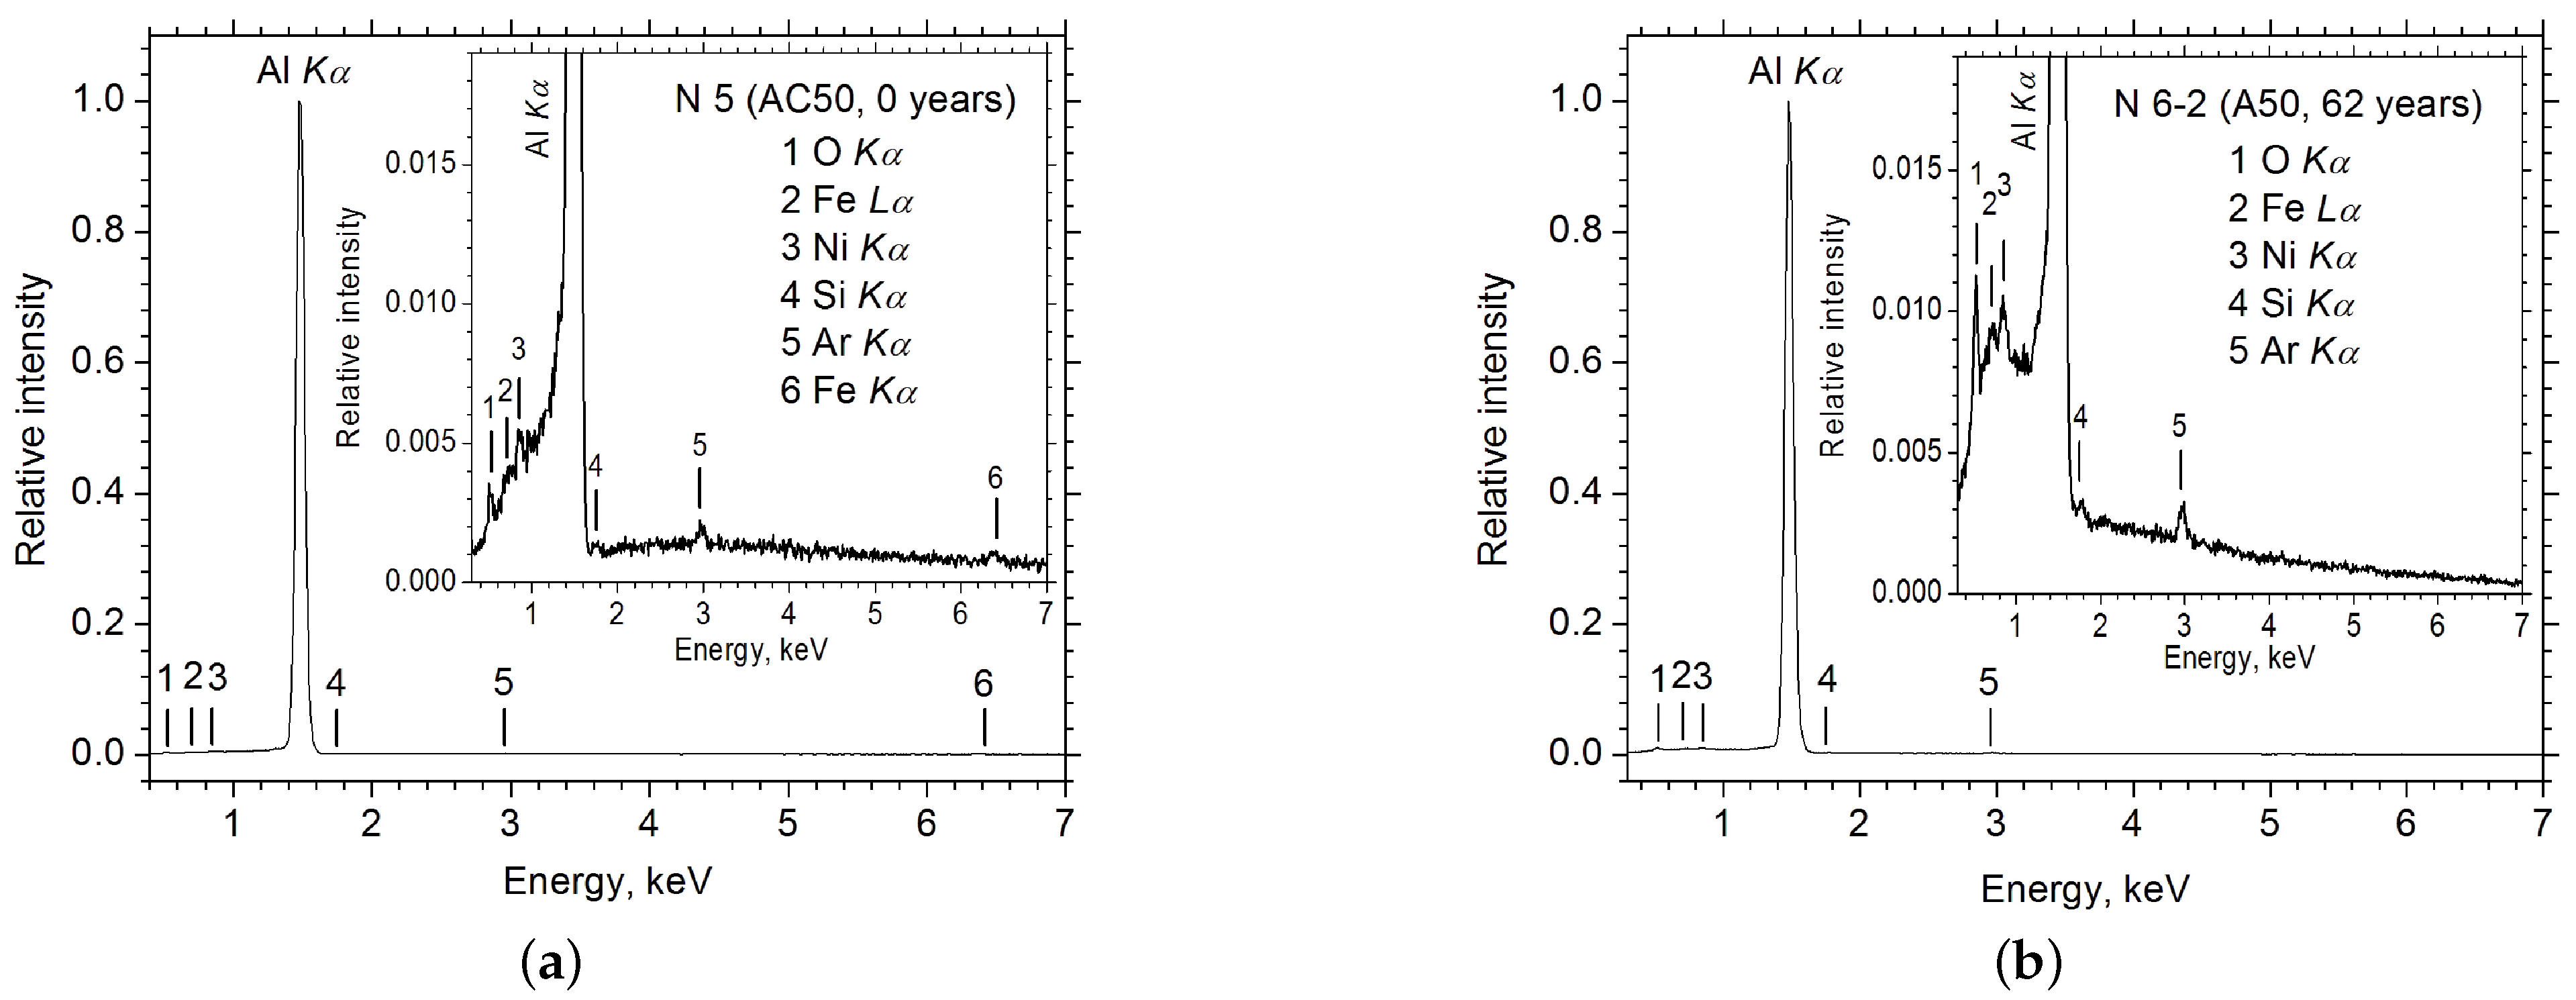
3.1. SEM and EDX Results
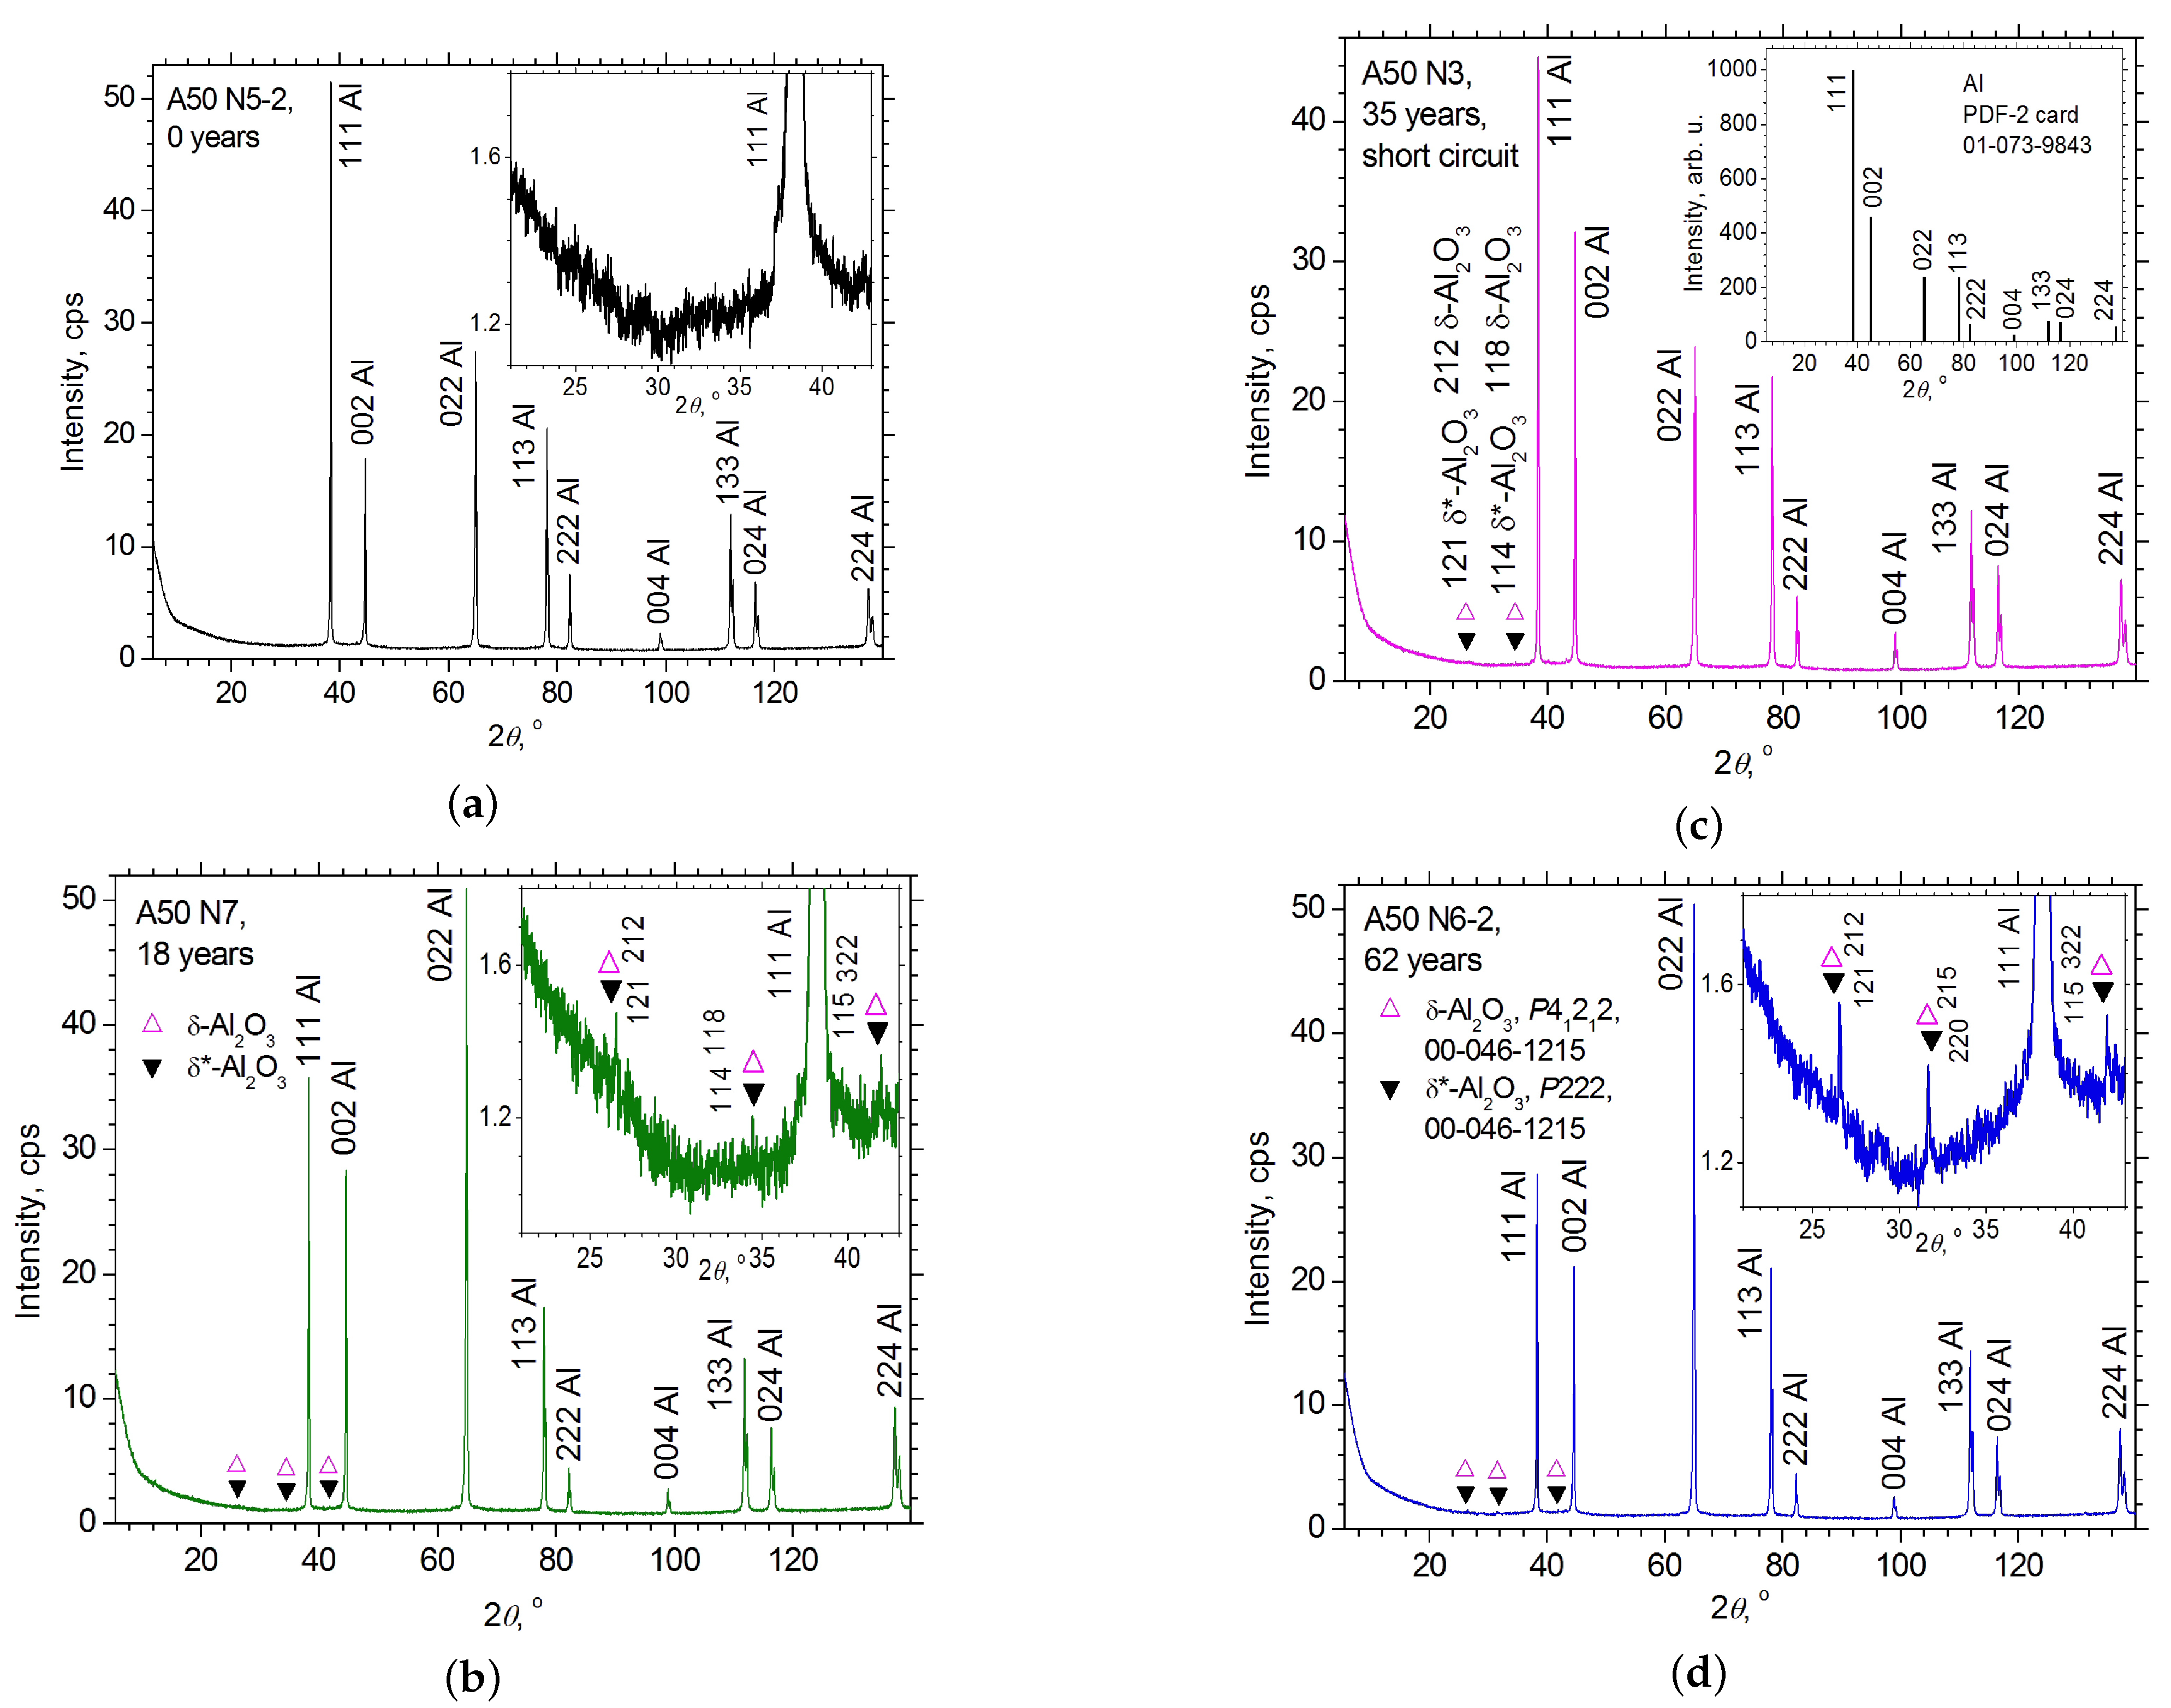
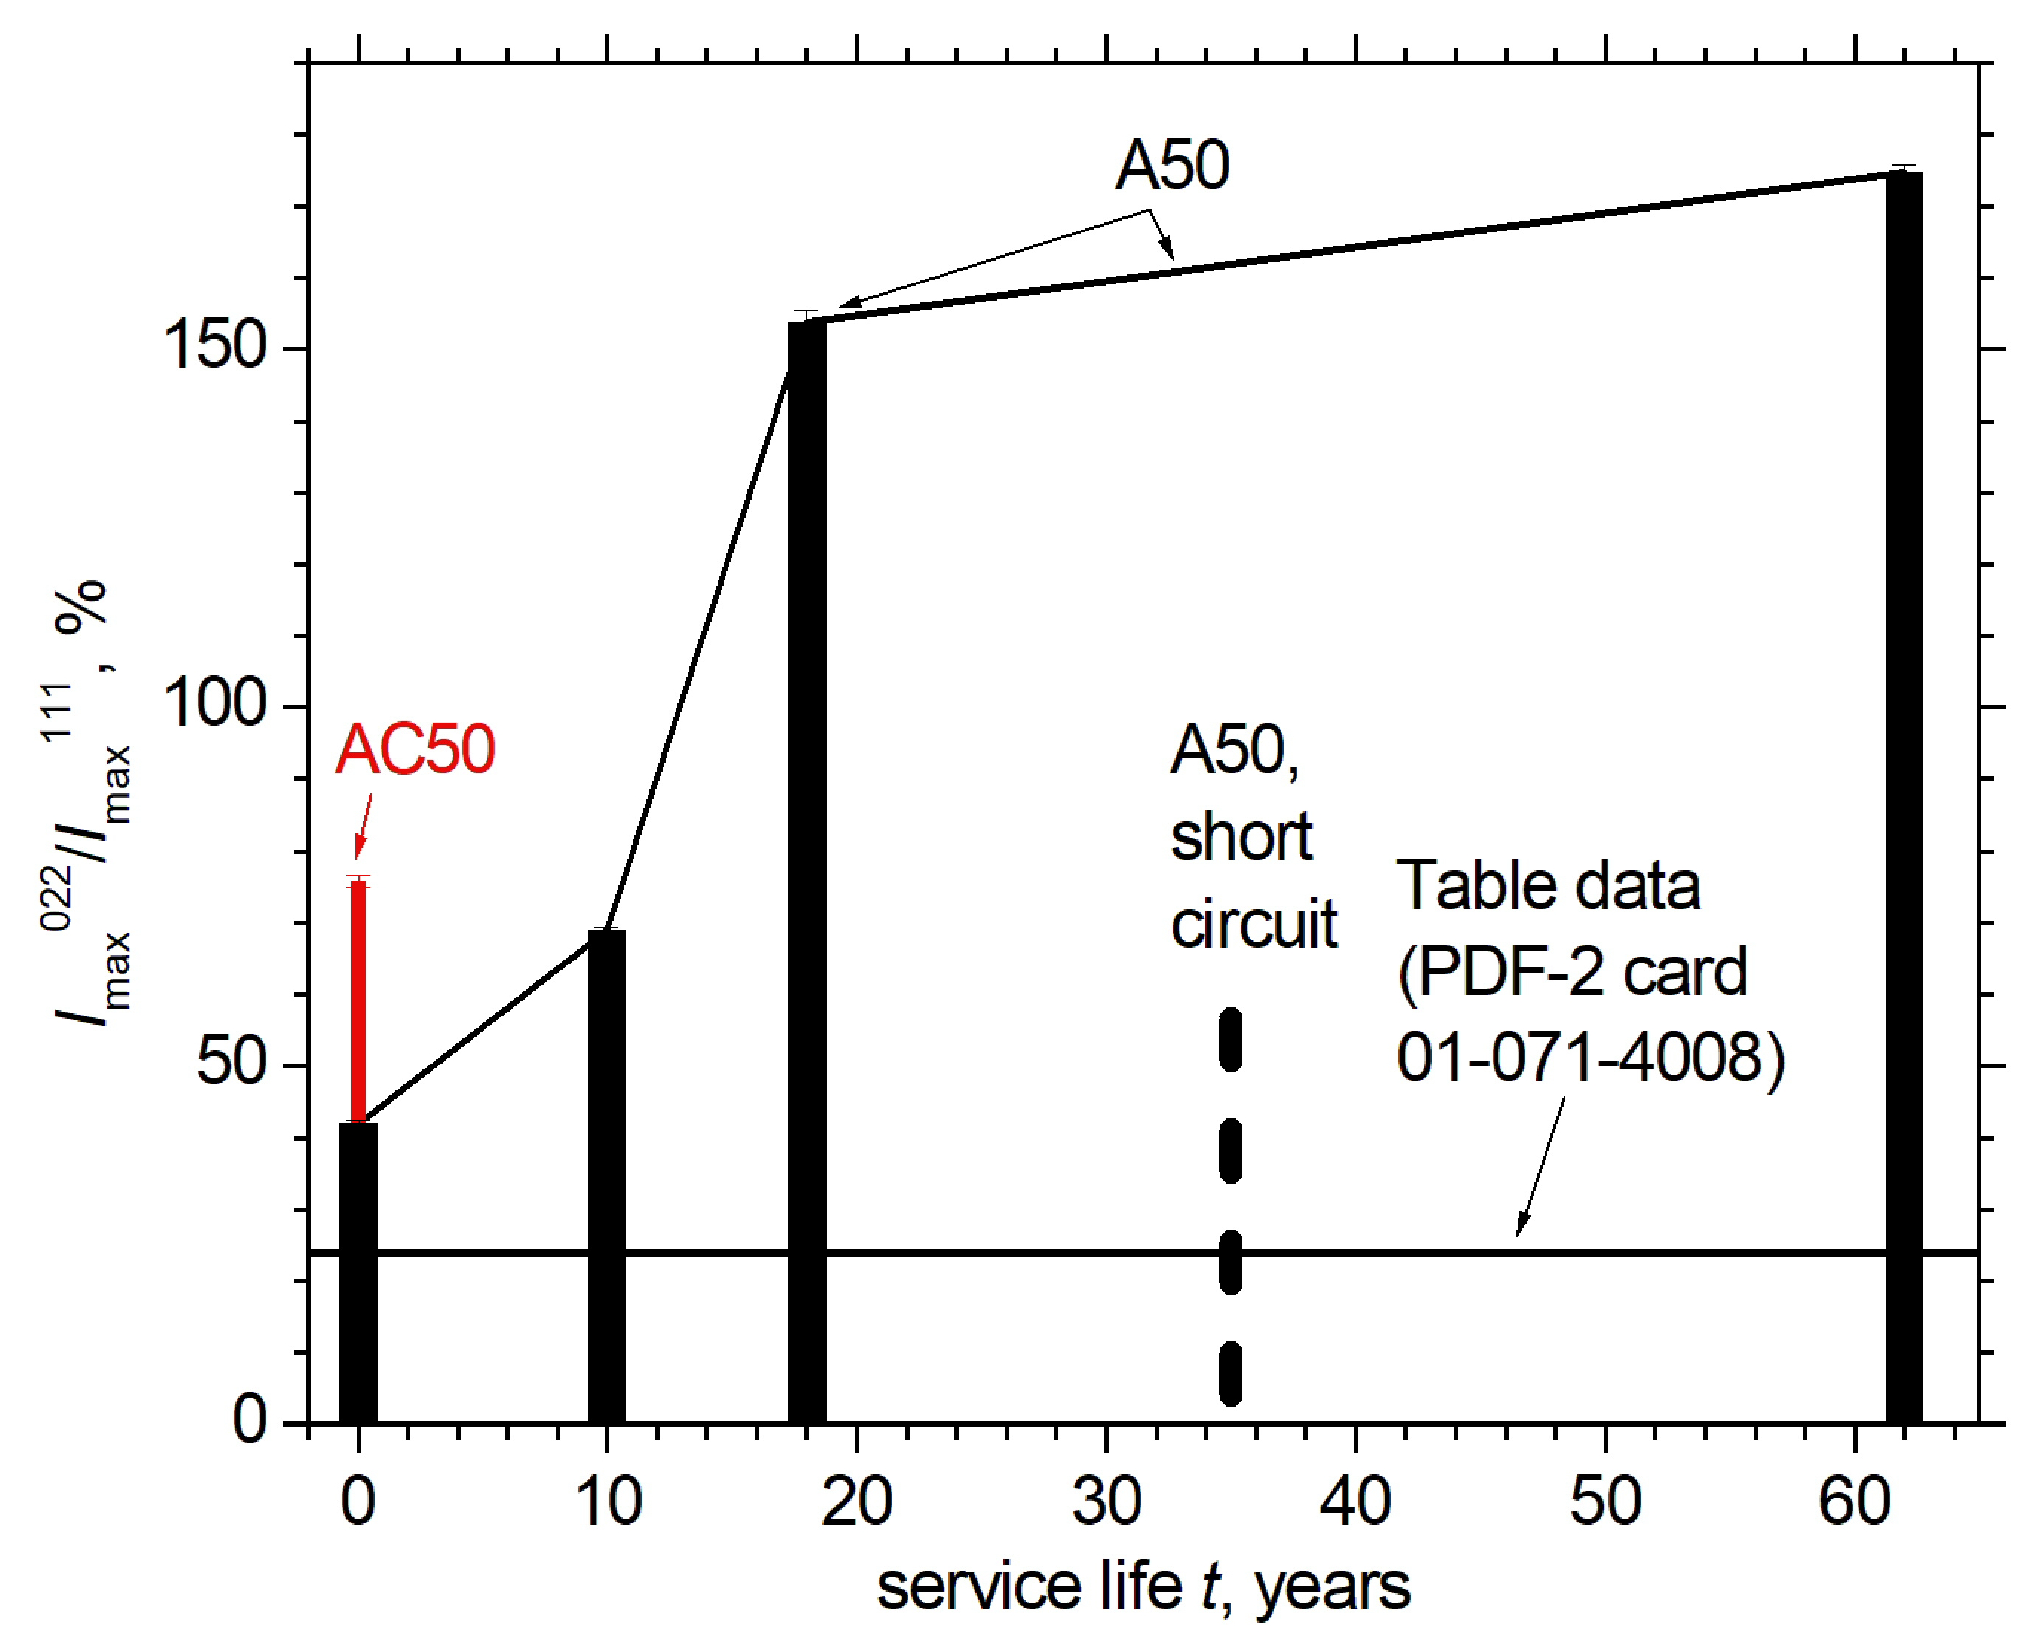
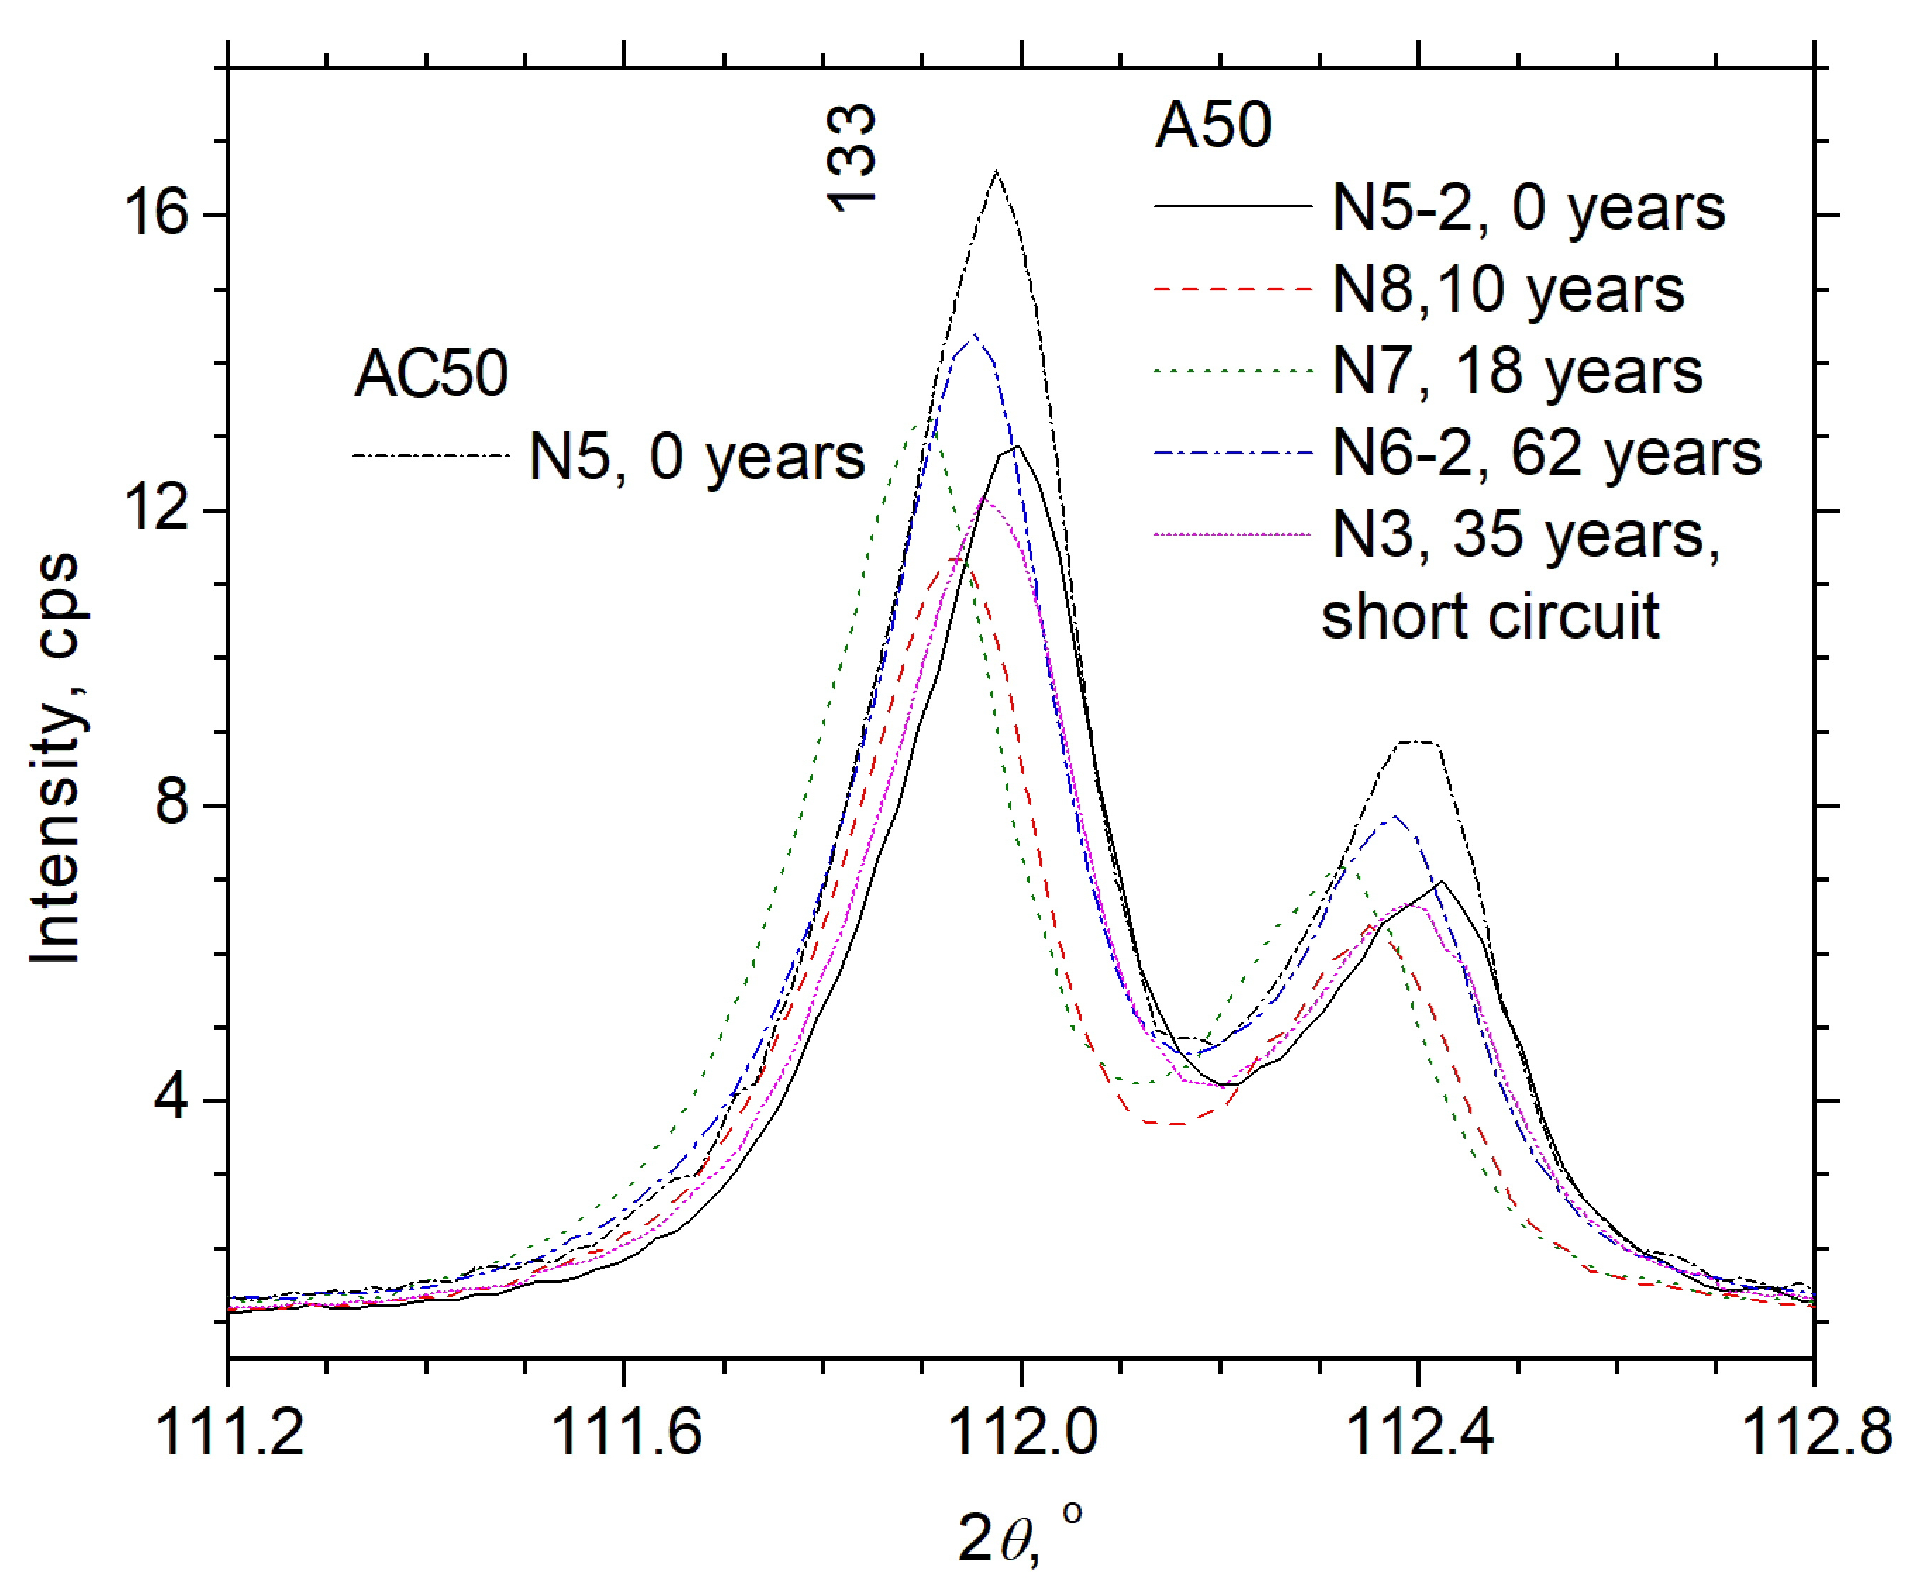
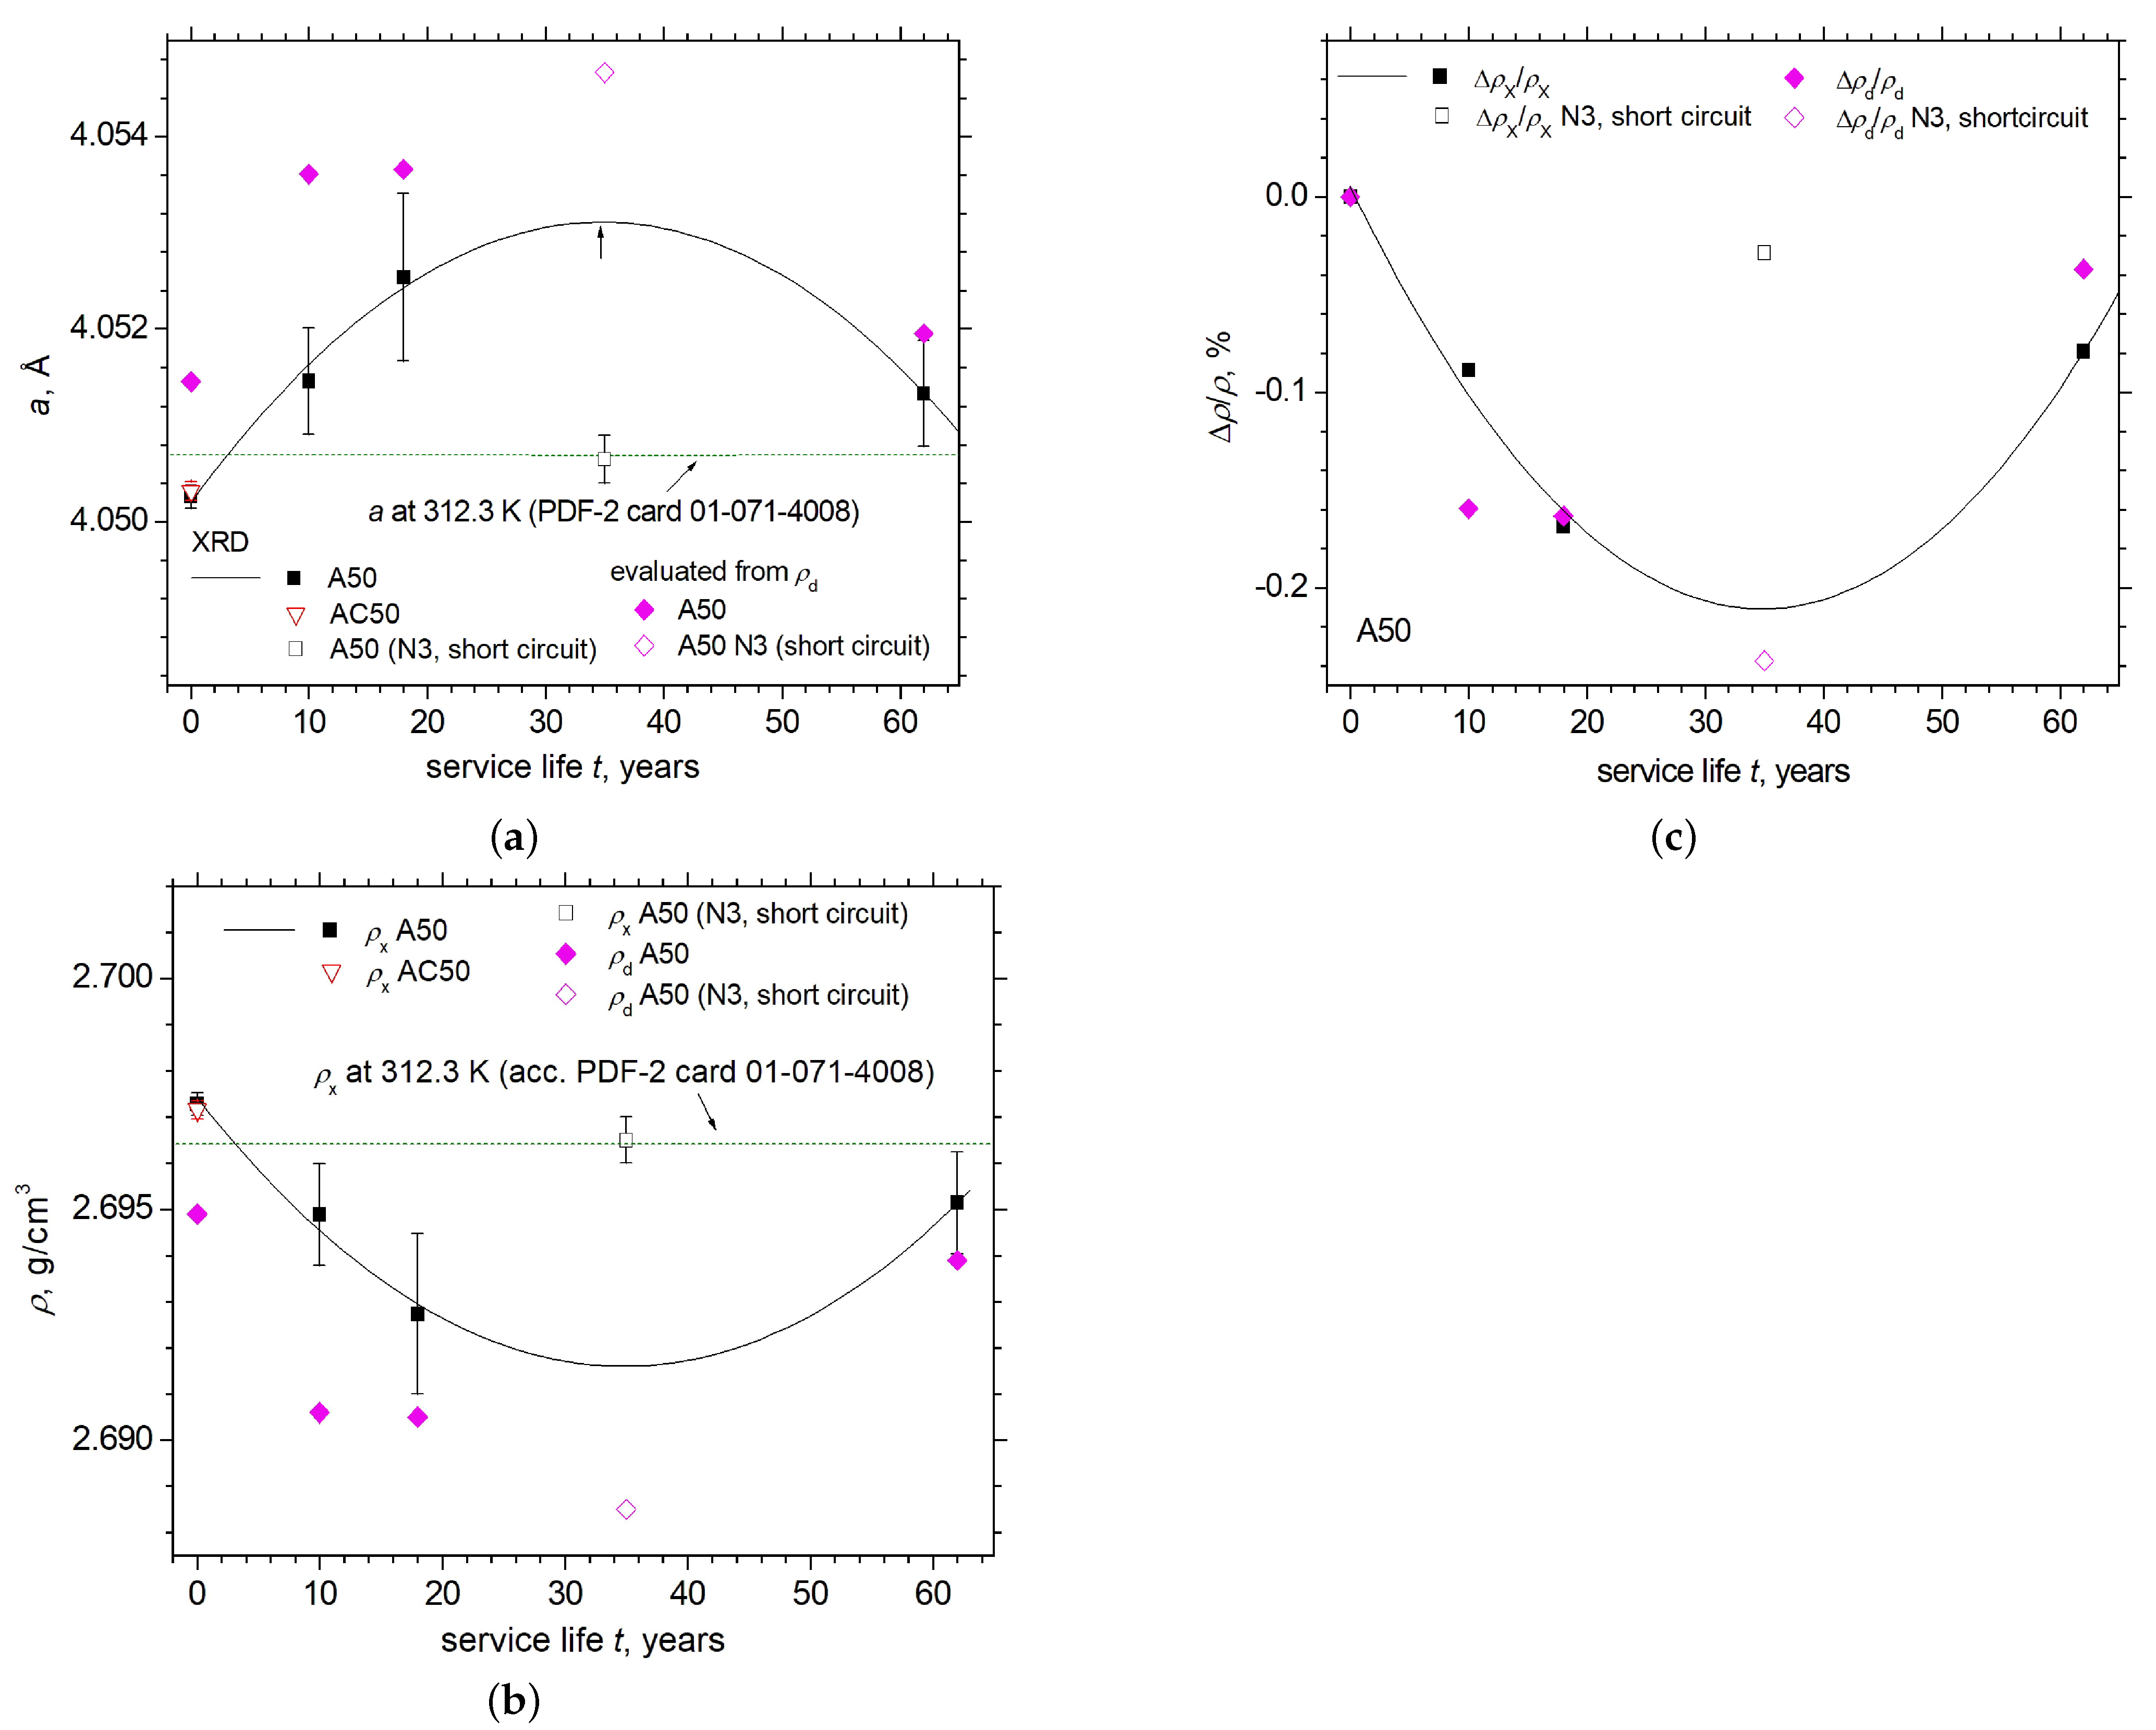
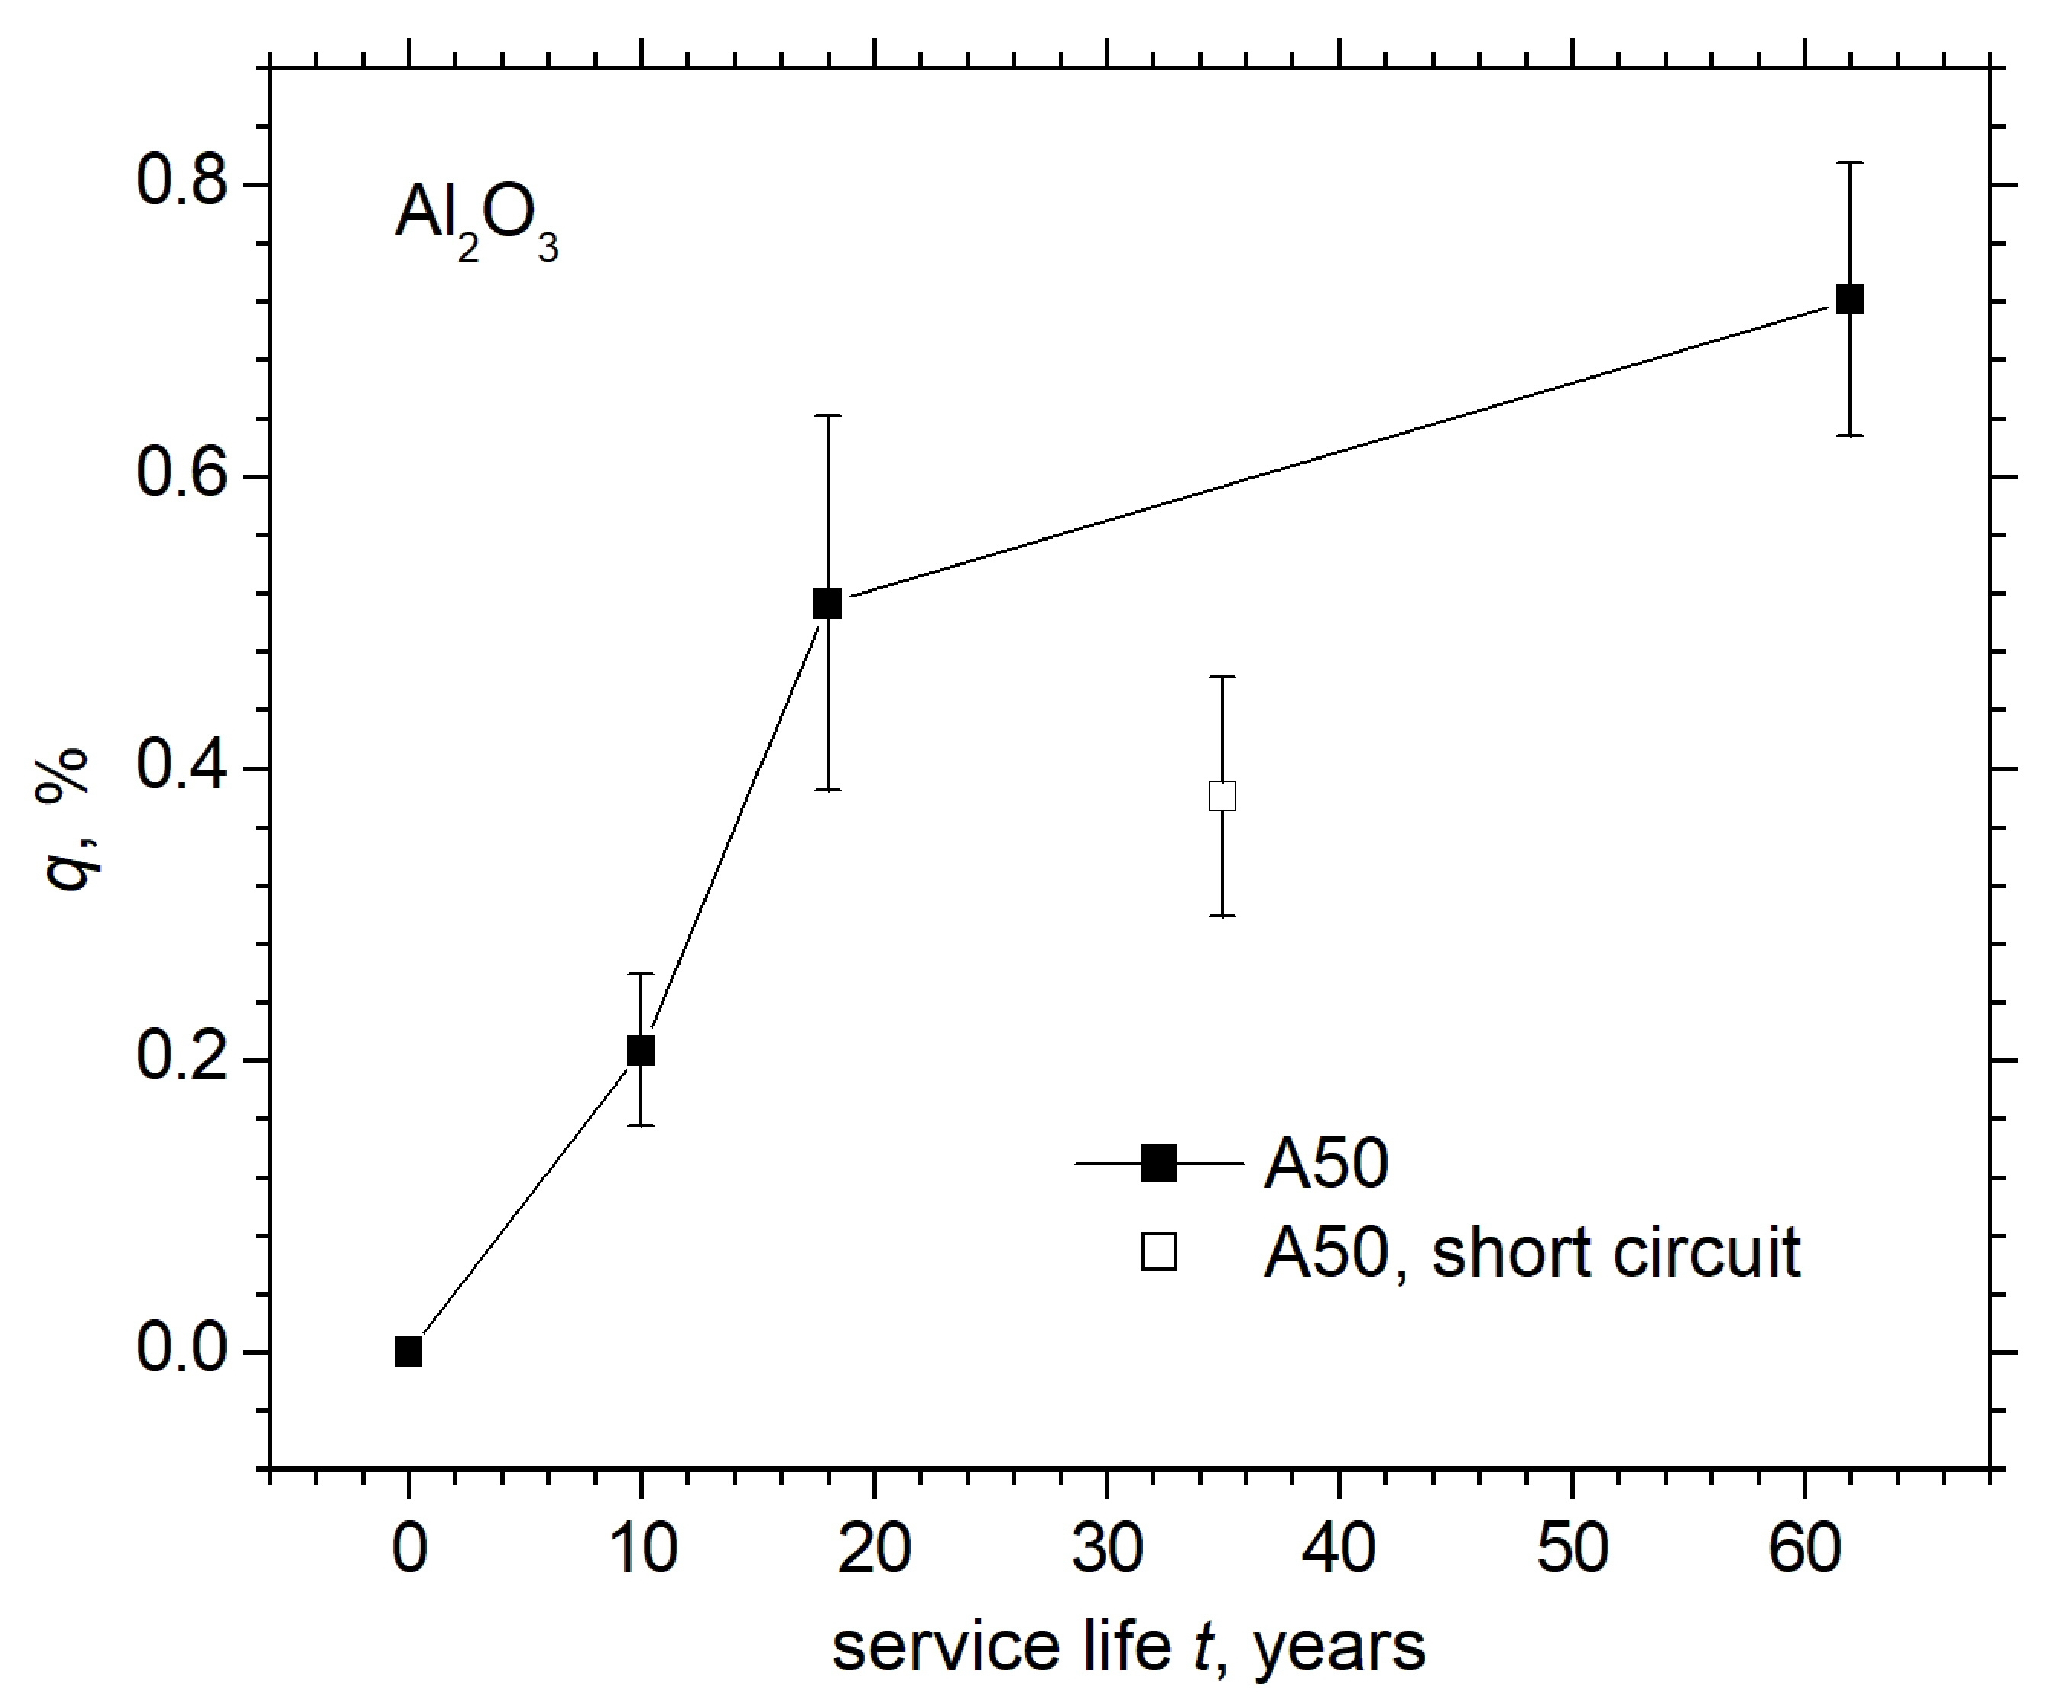
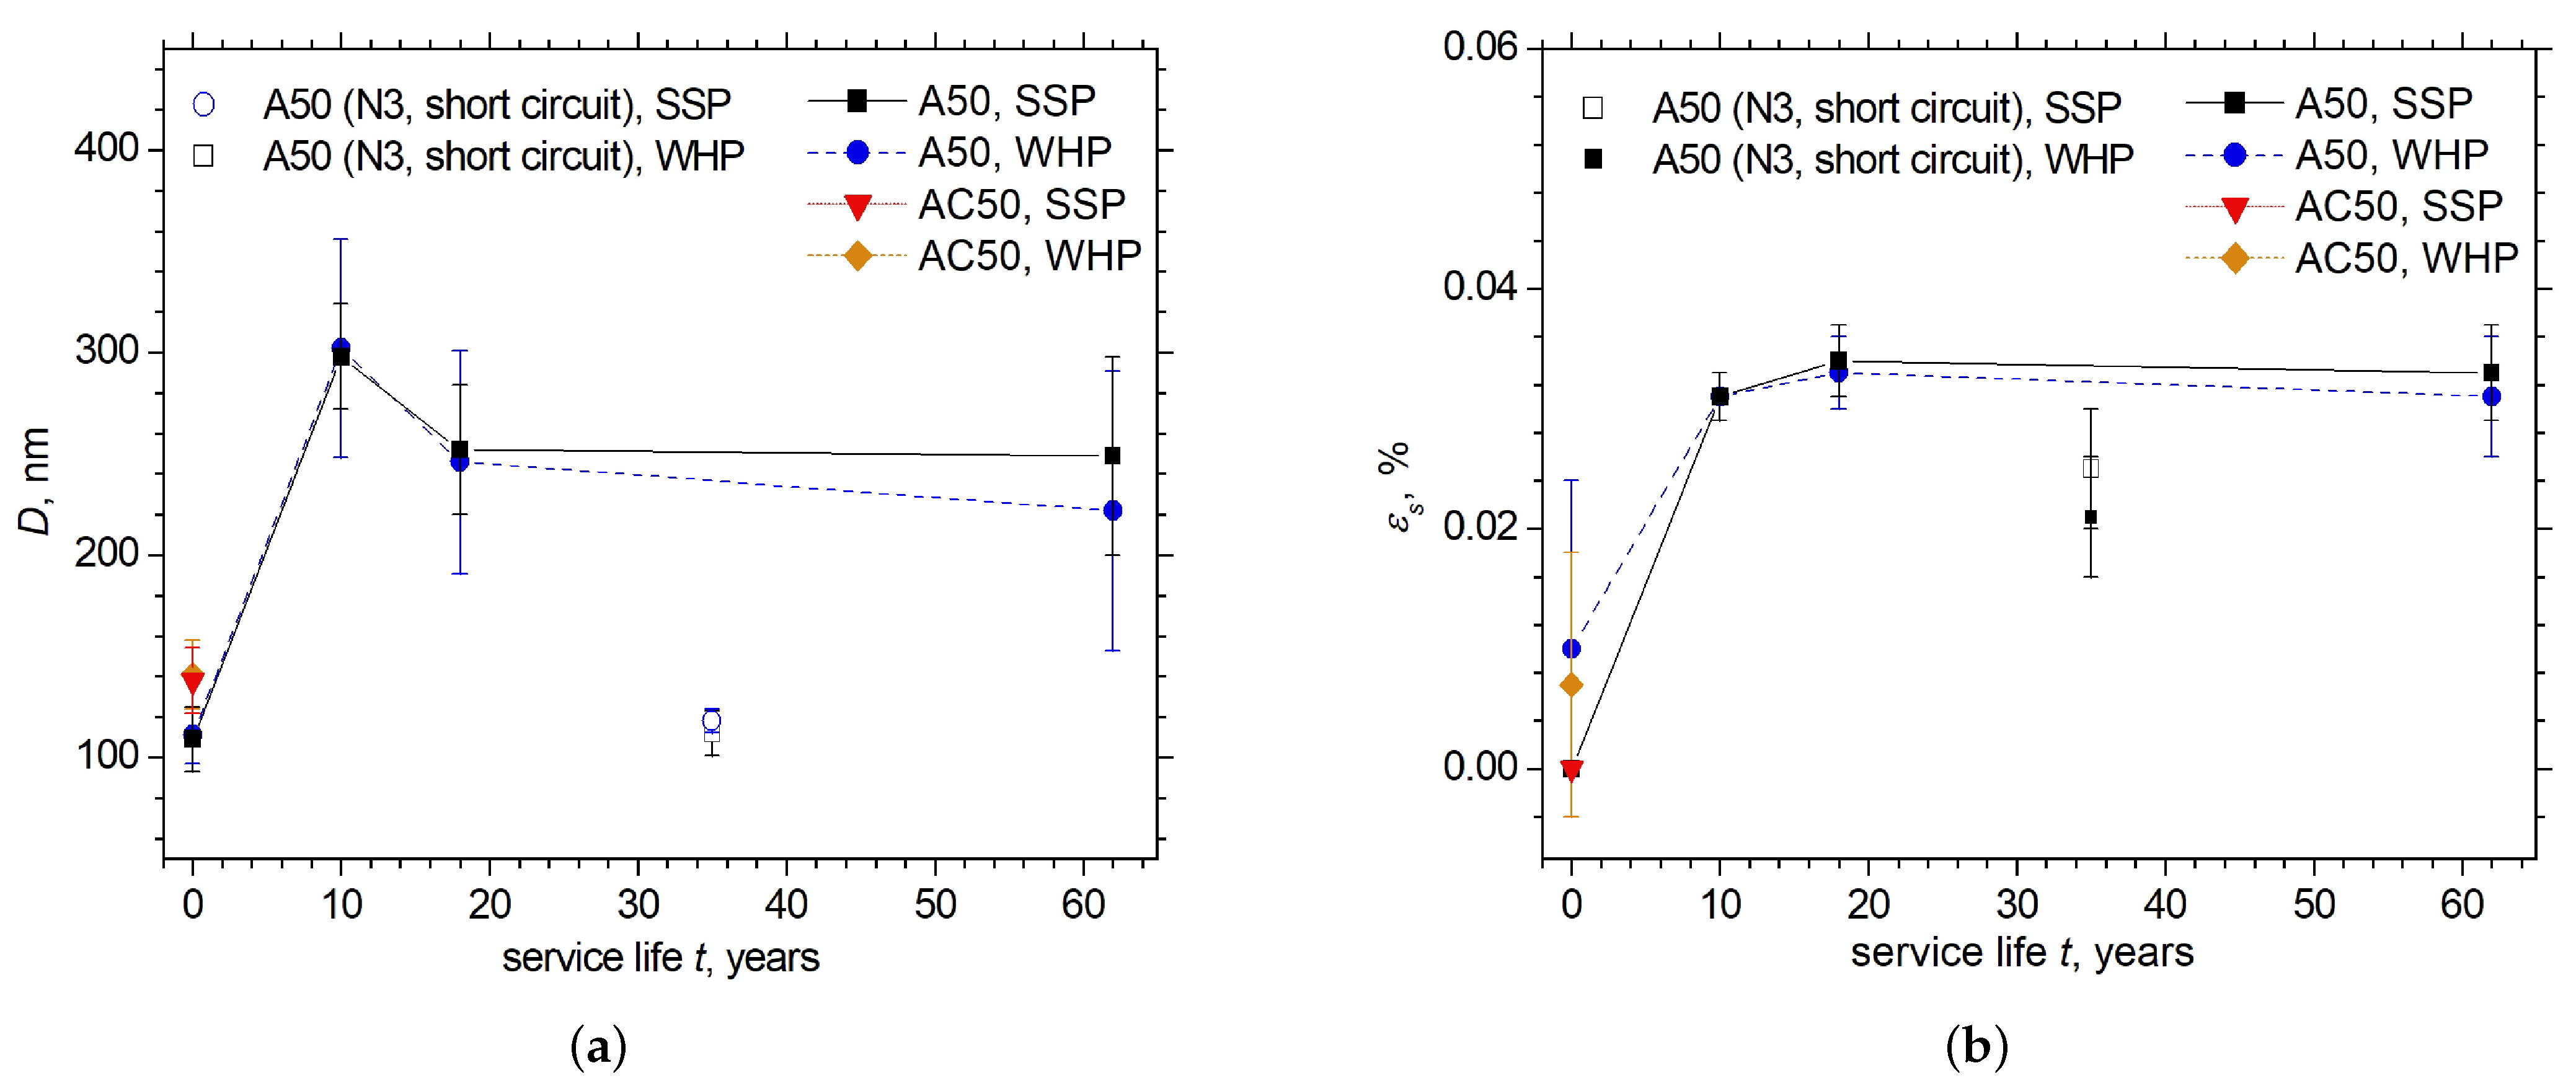
3.2. XRD Results
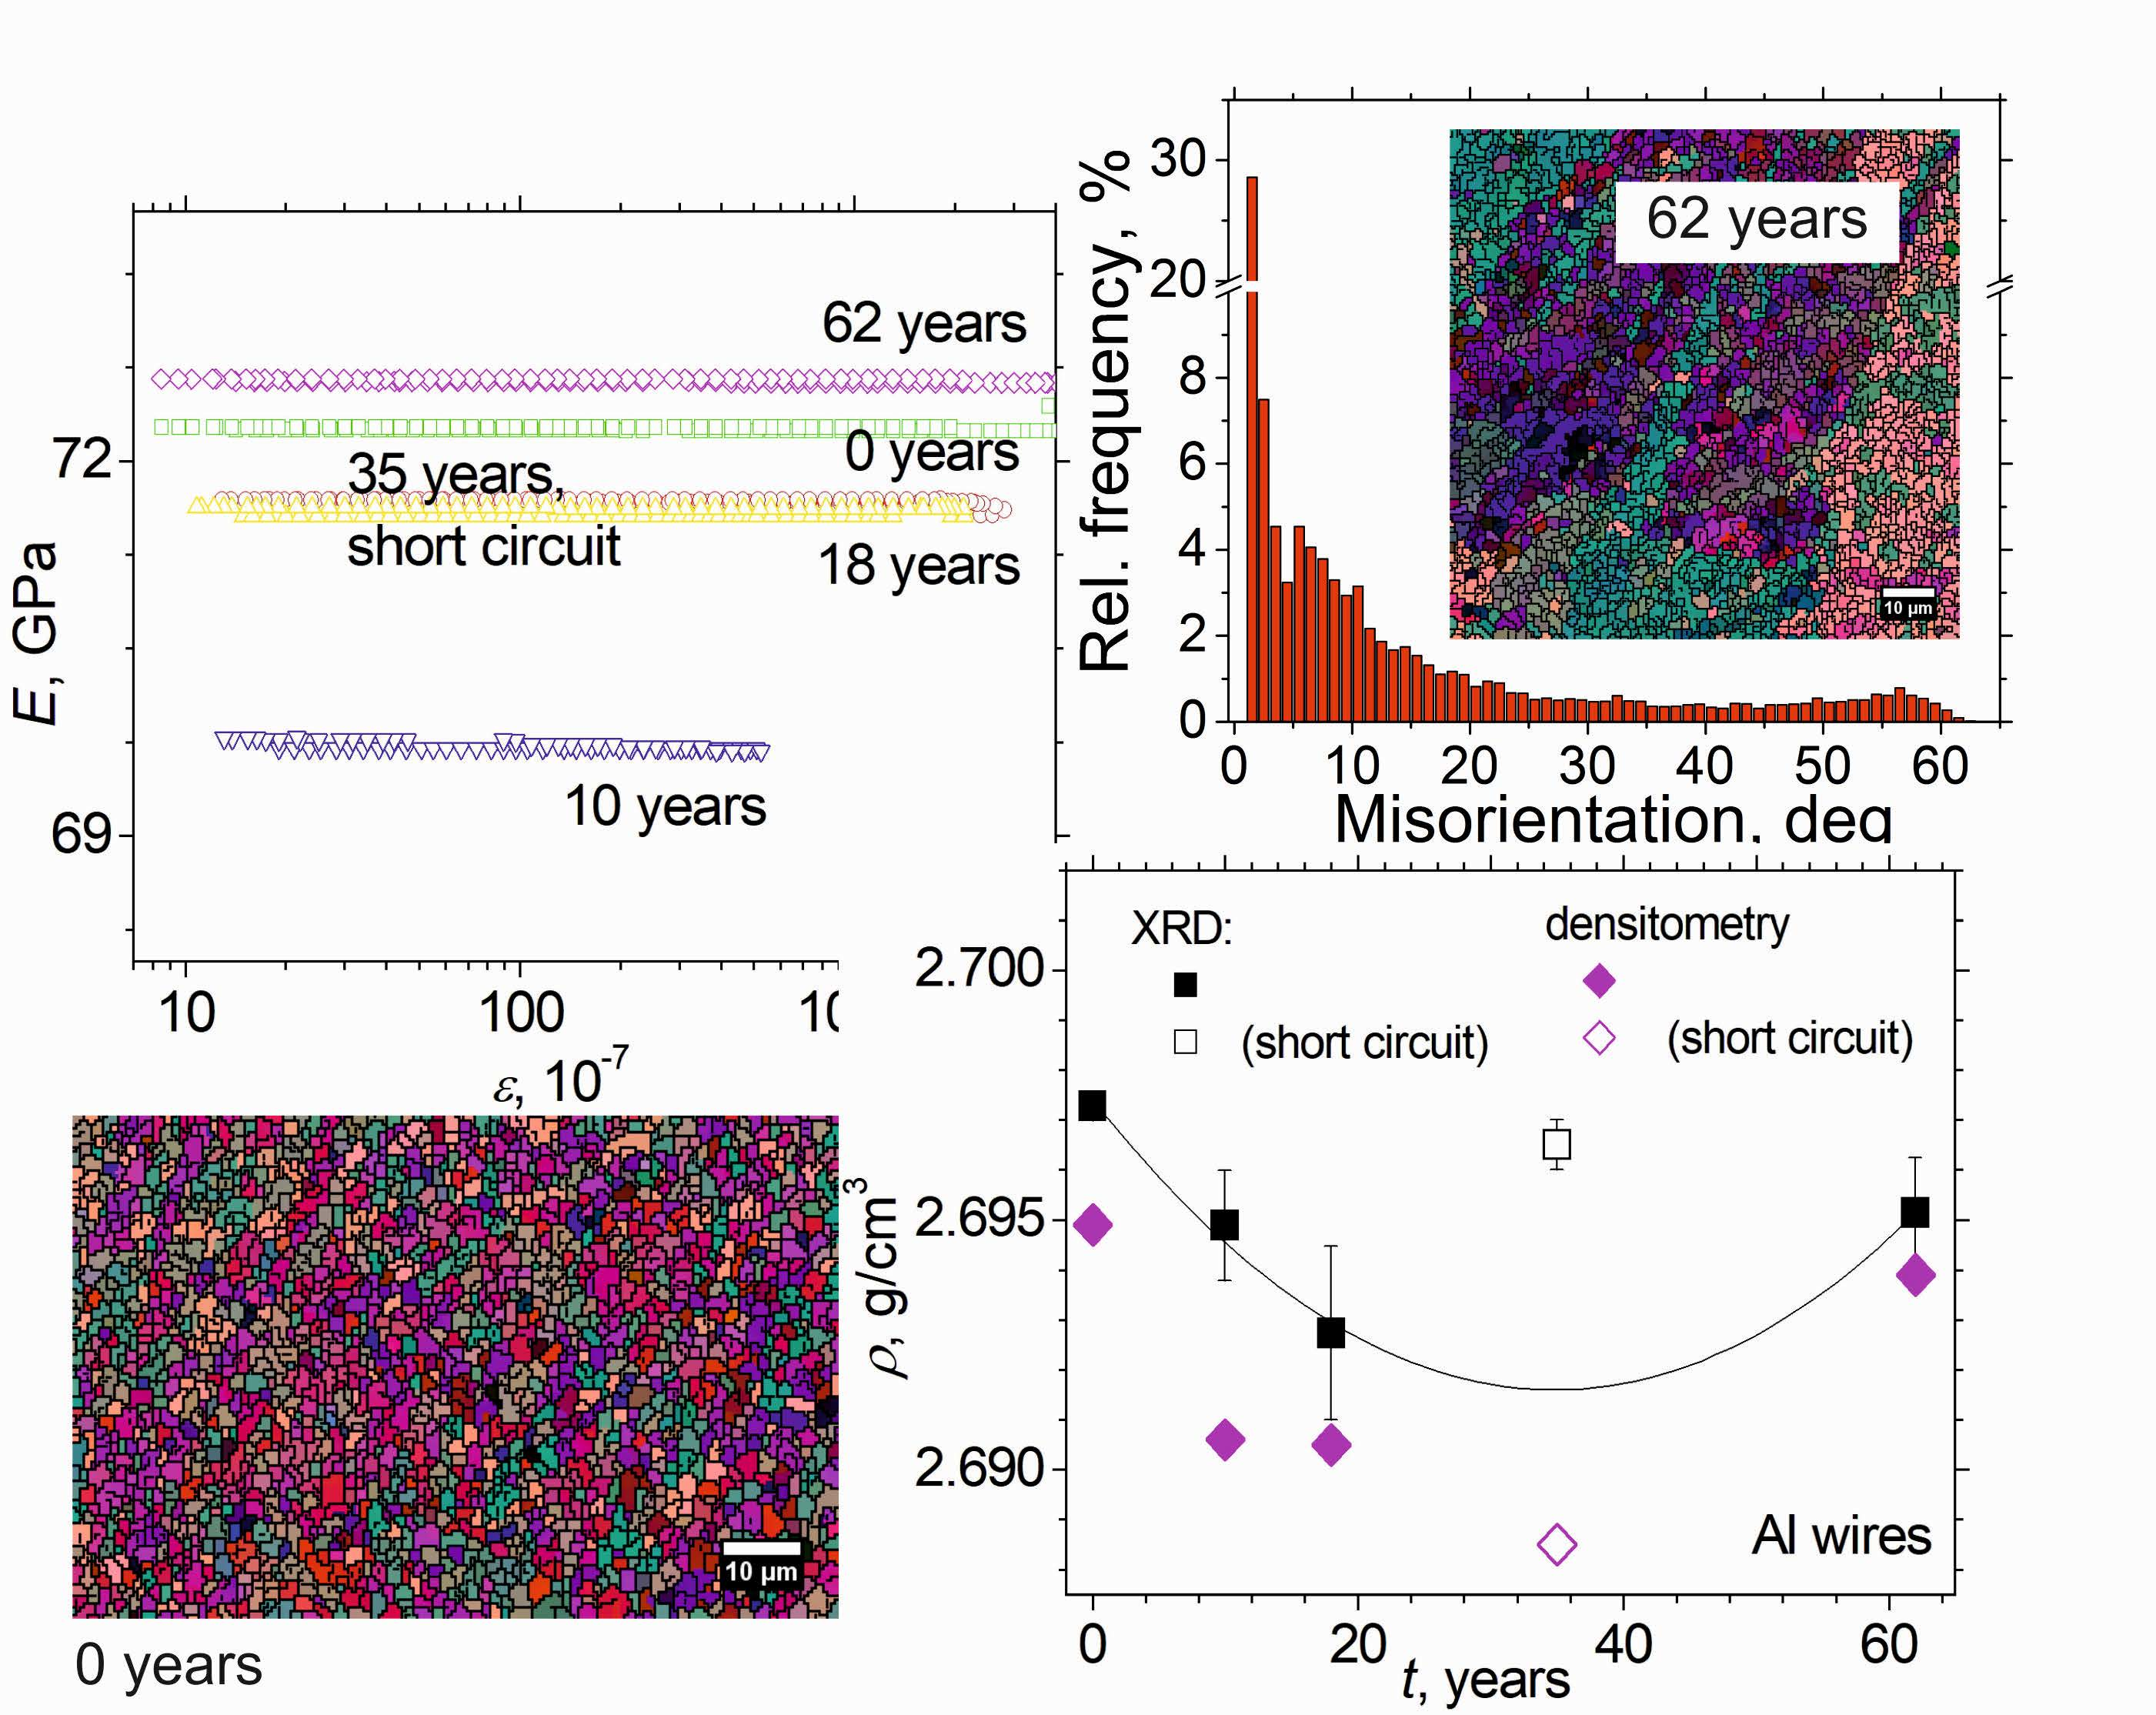
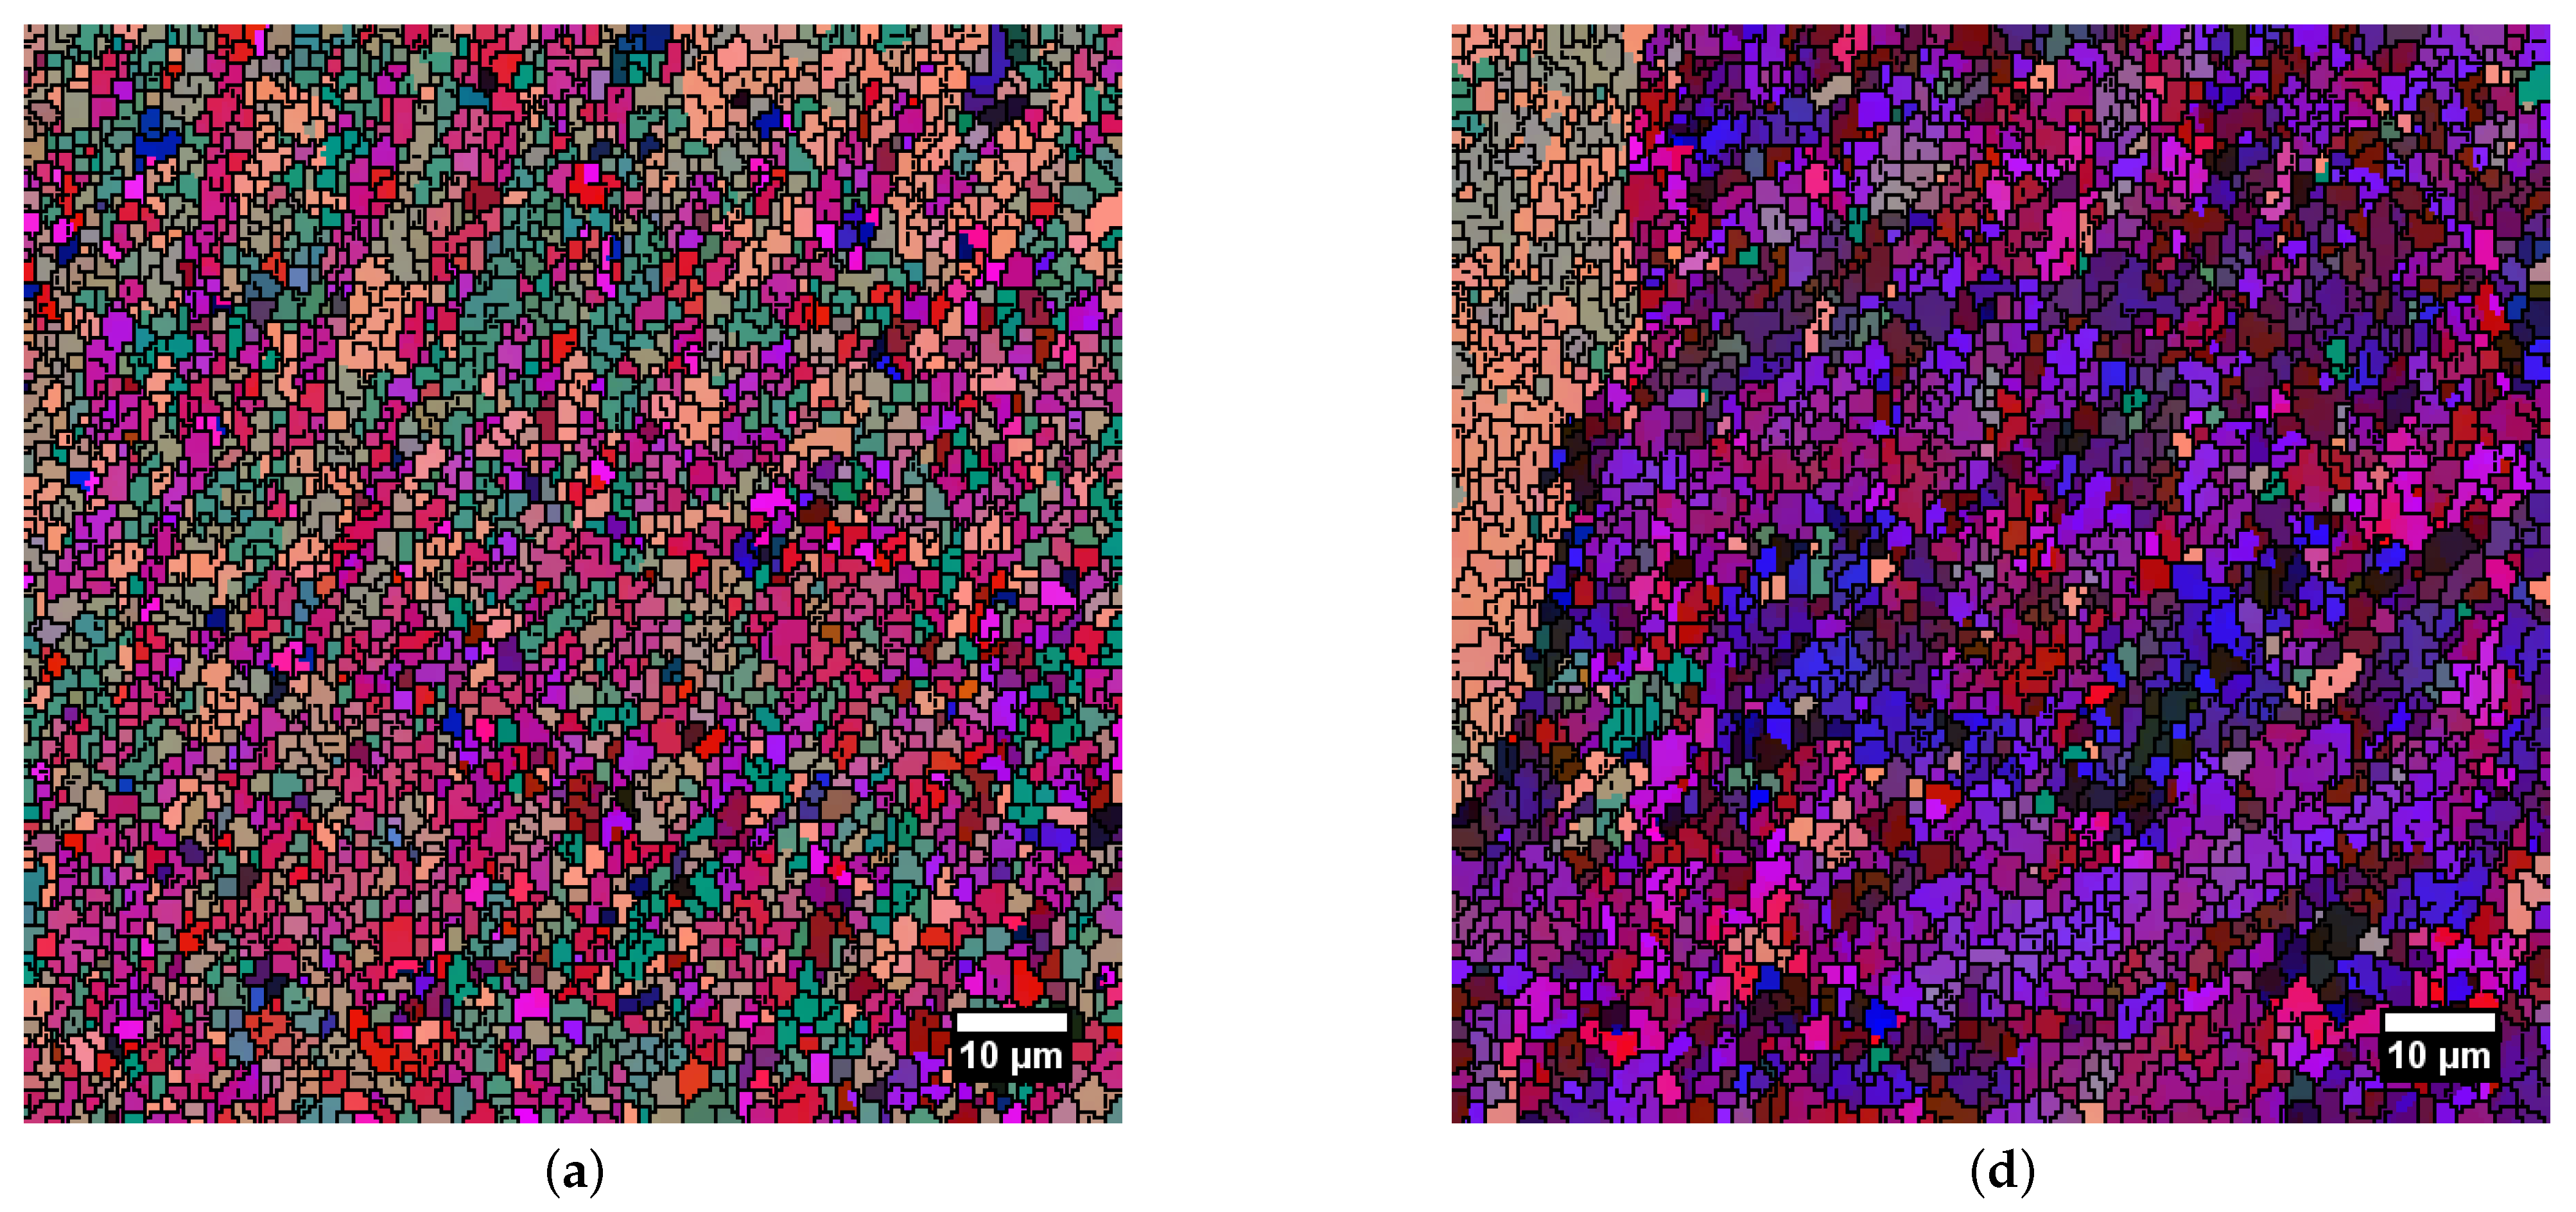
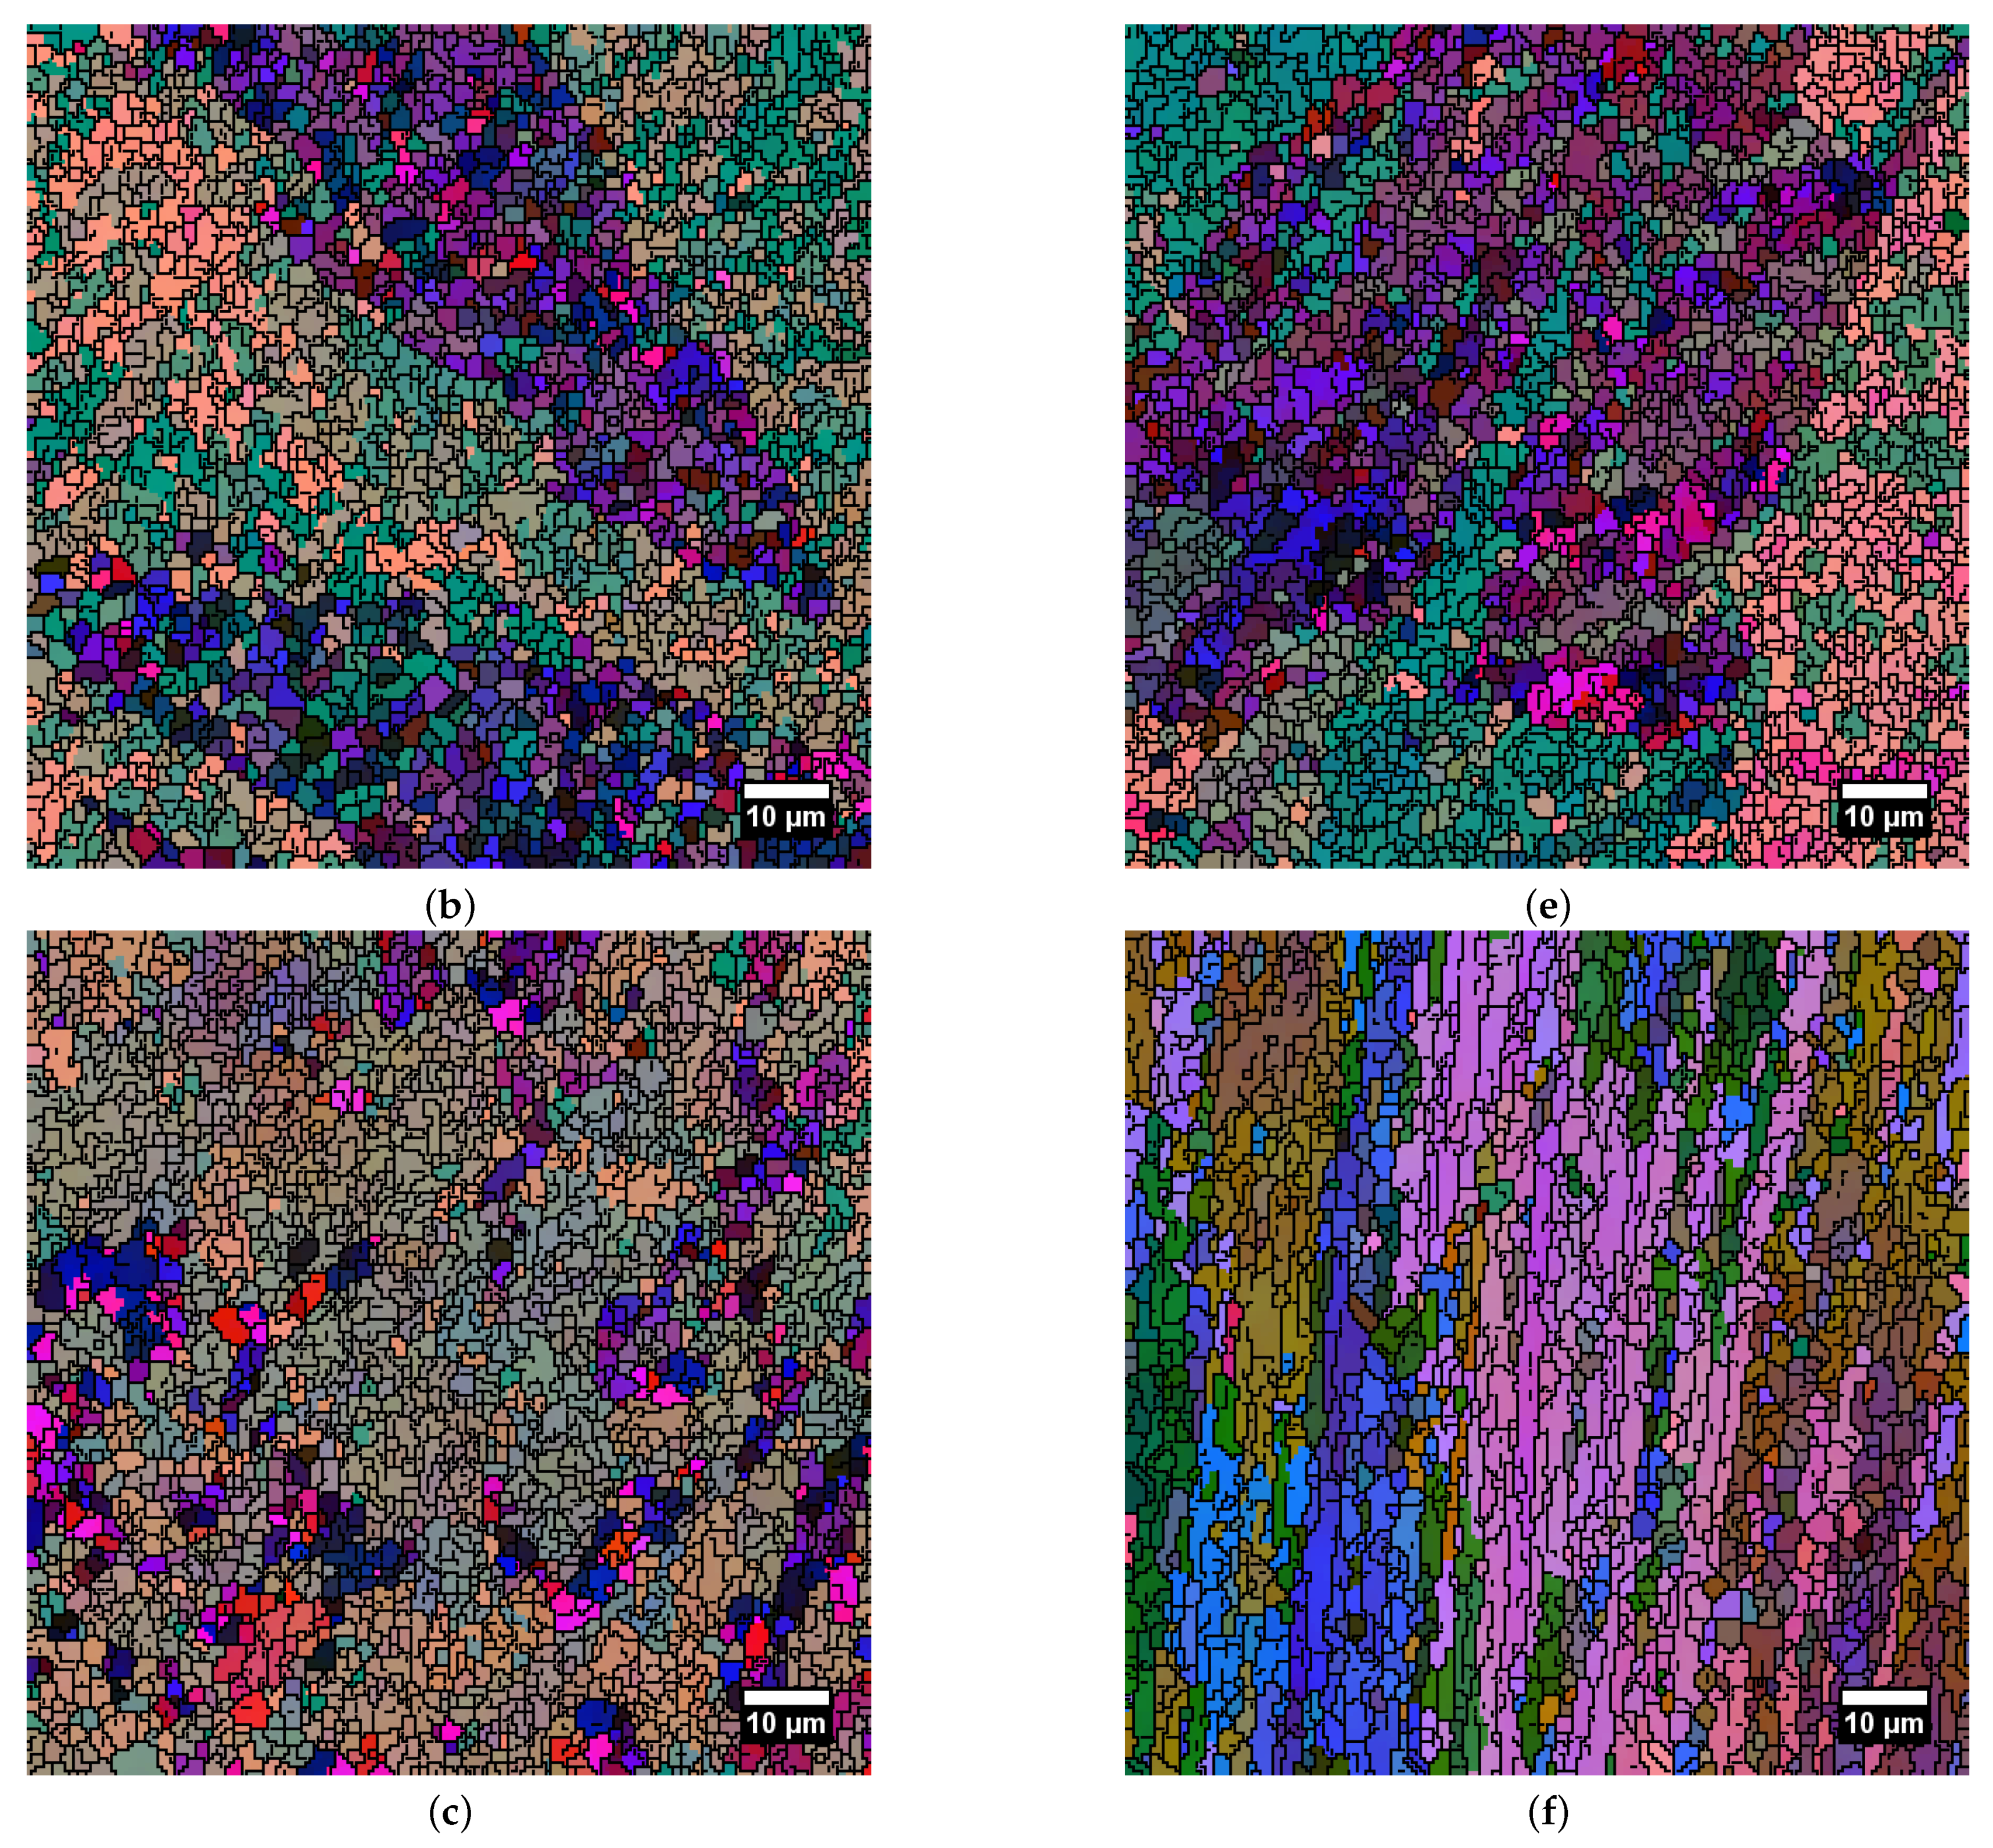
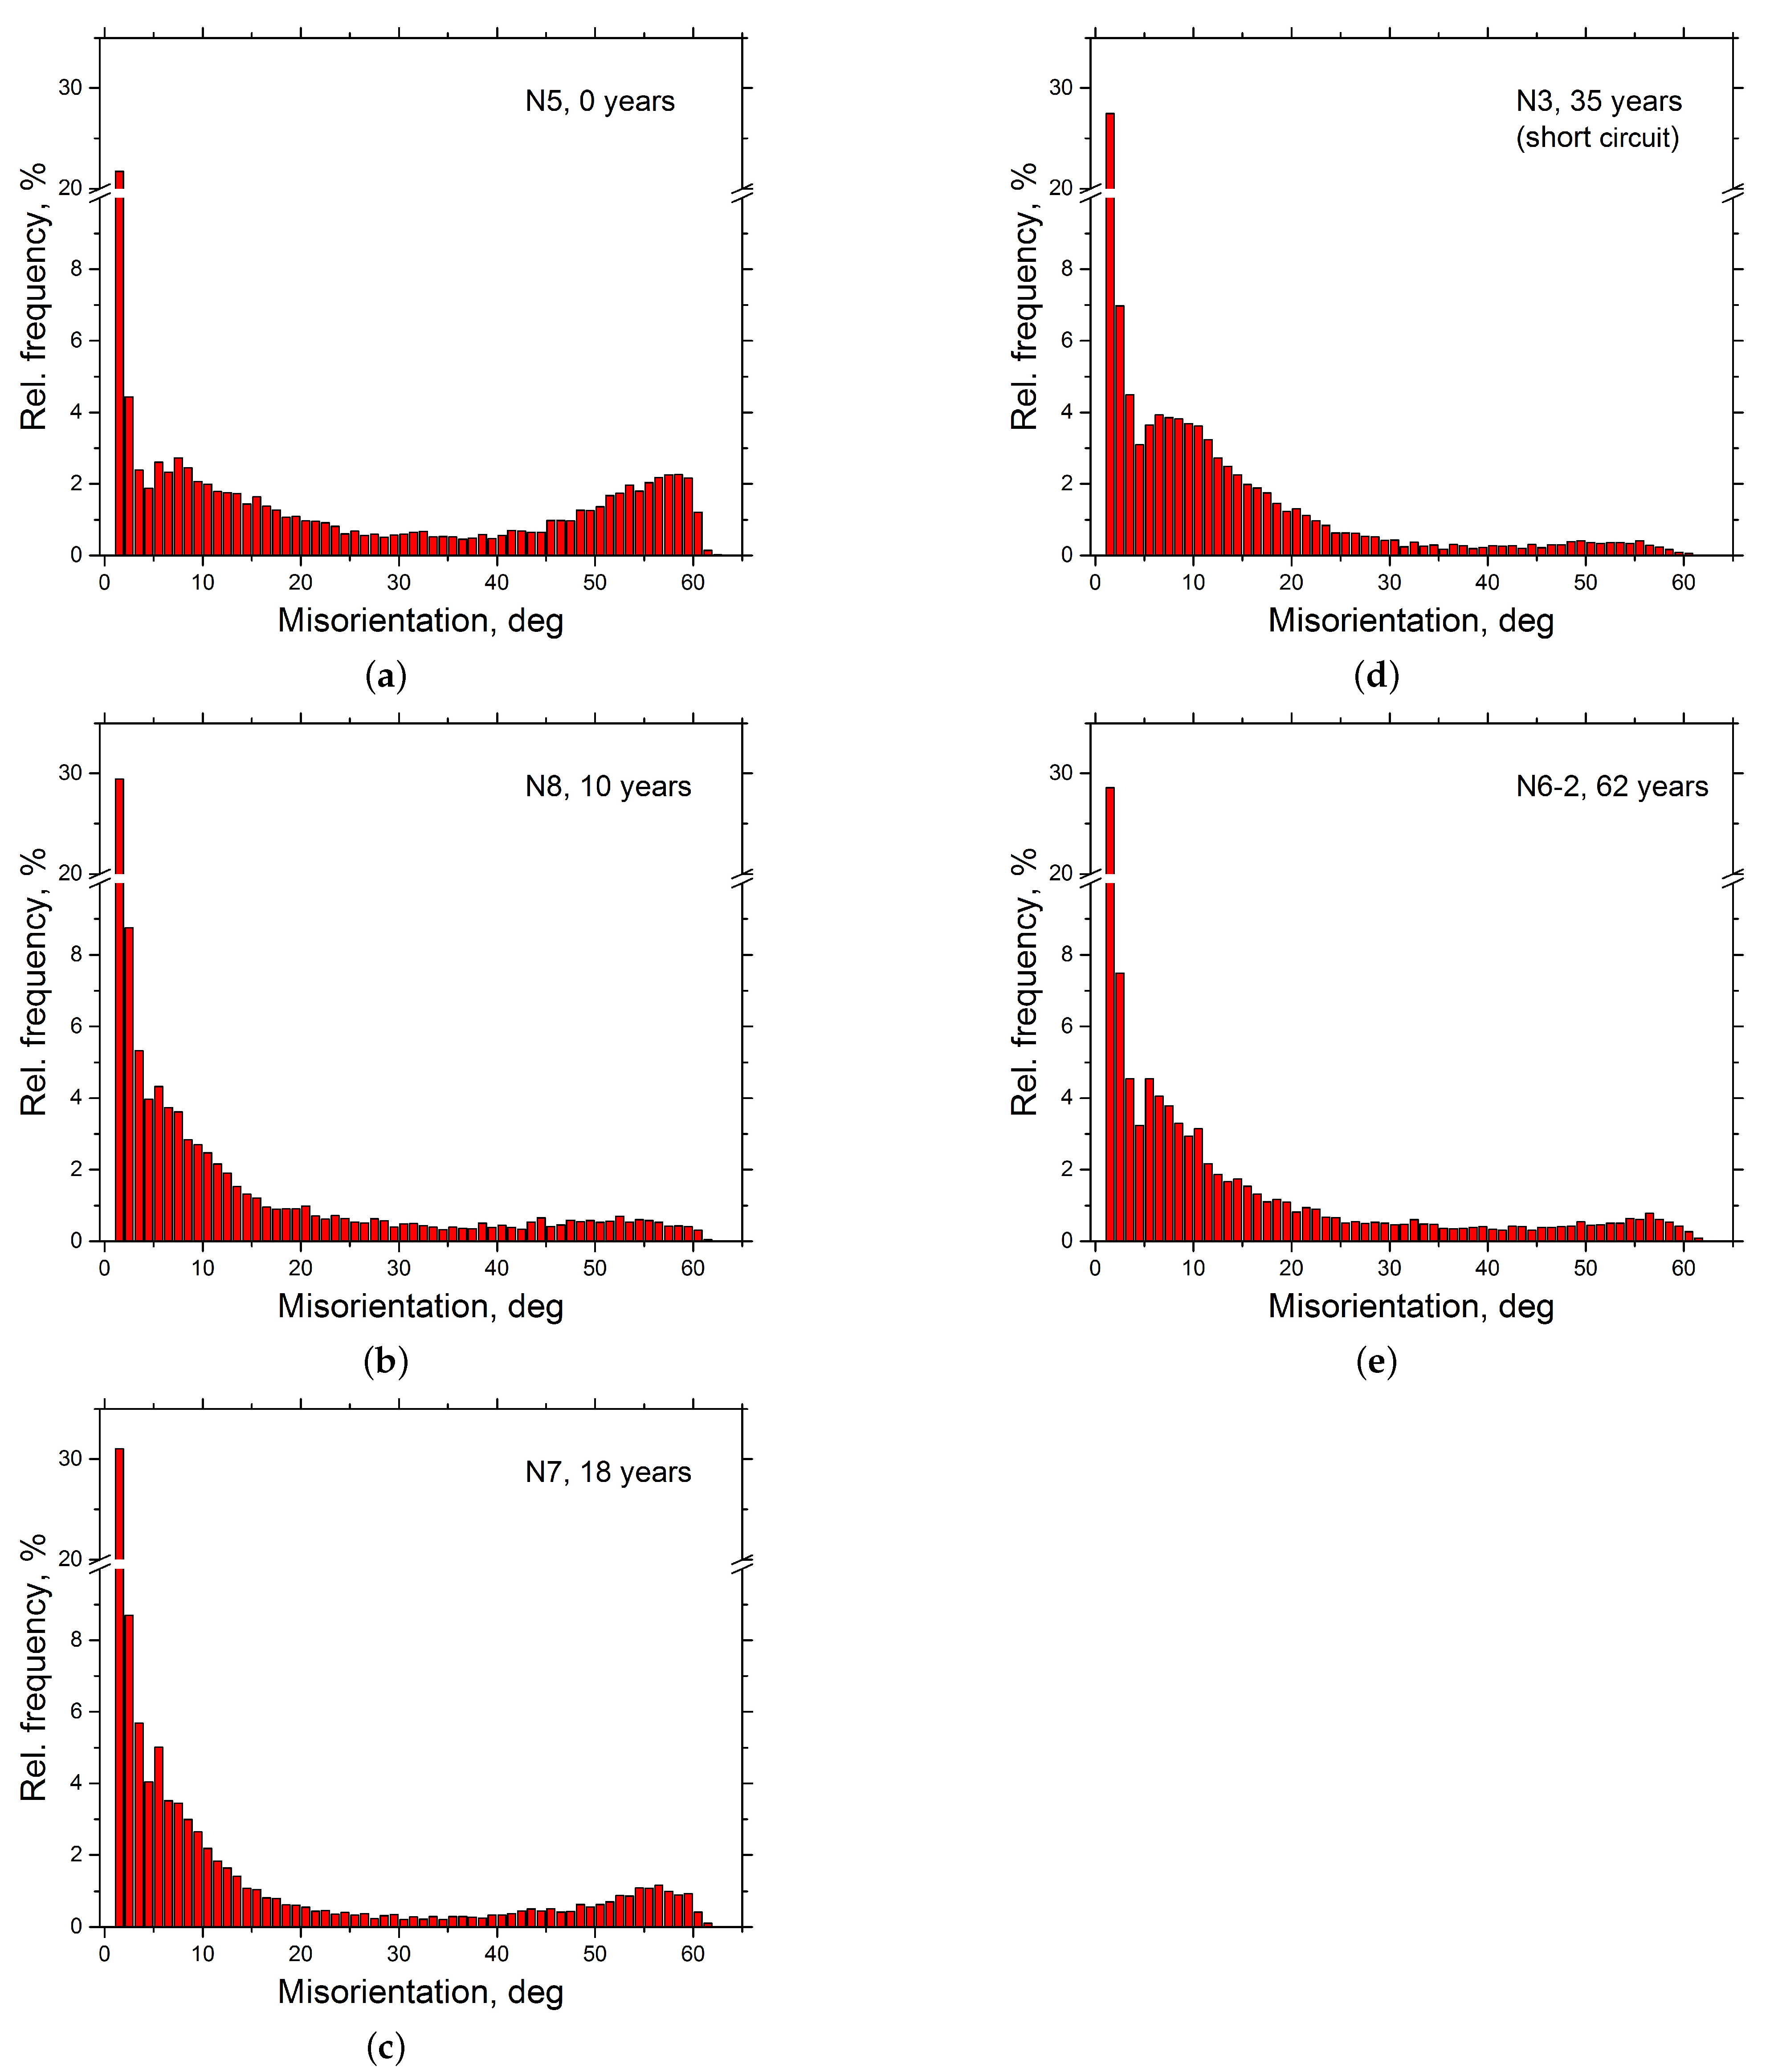
3.3. EBSD Results
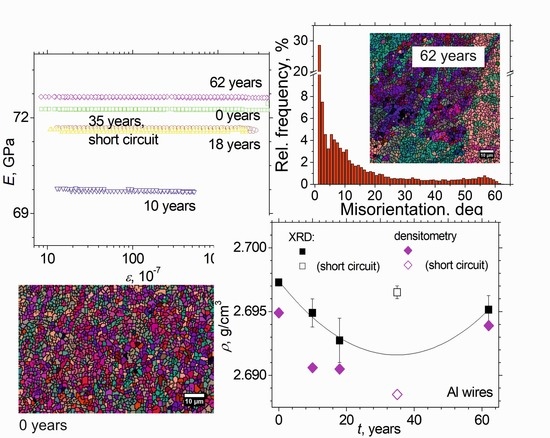
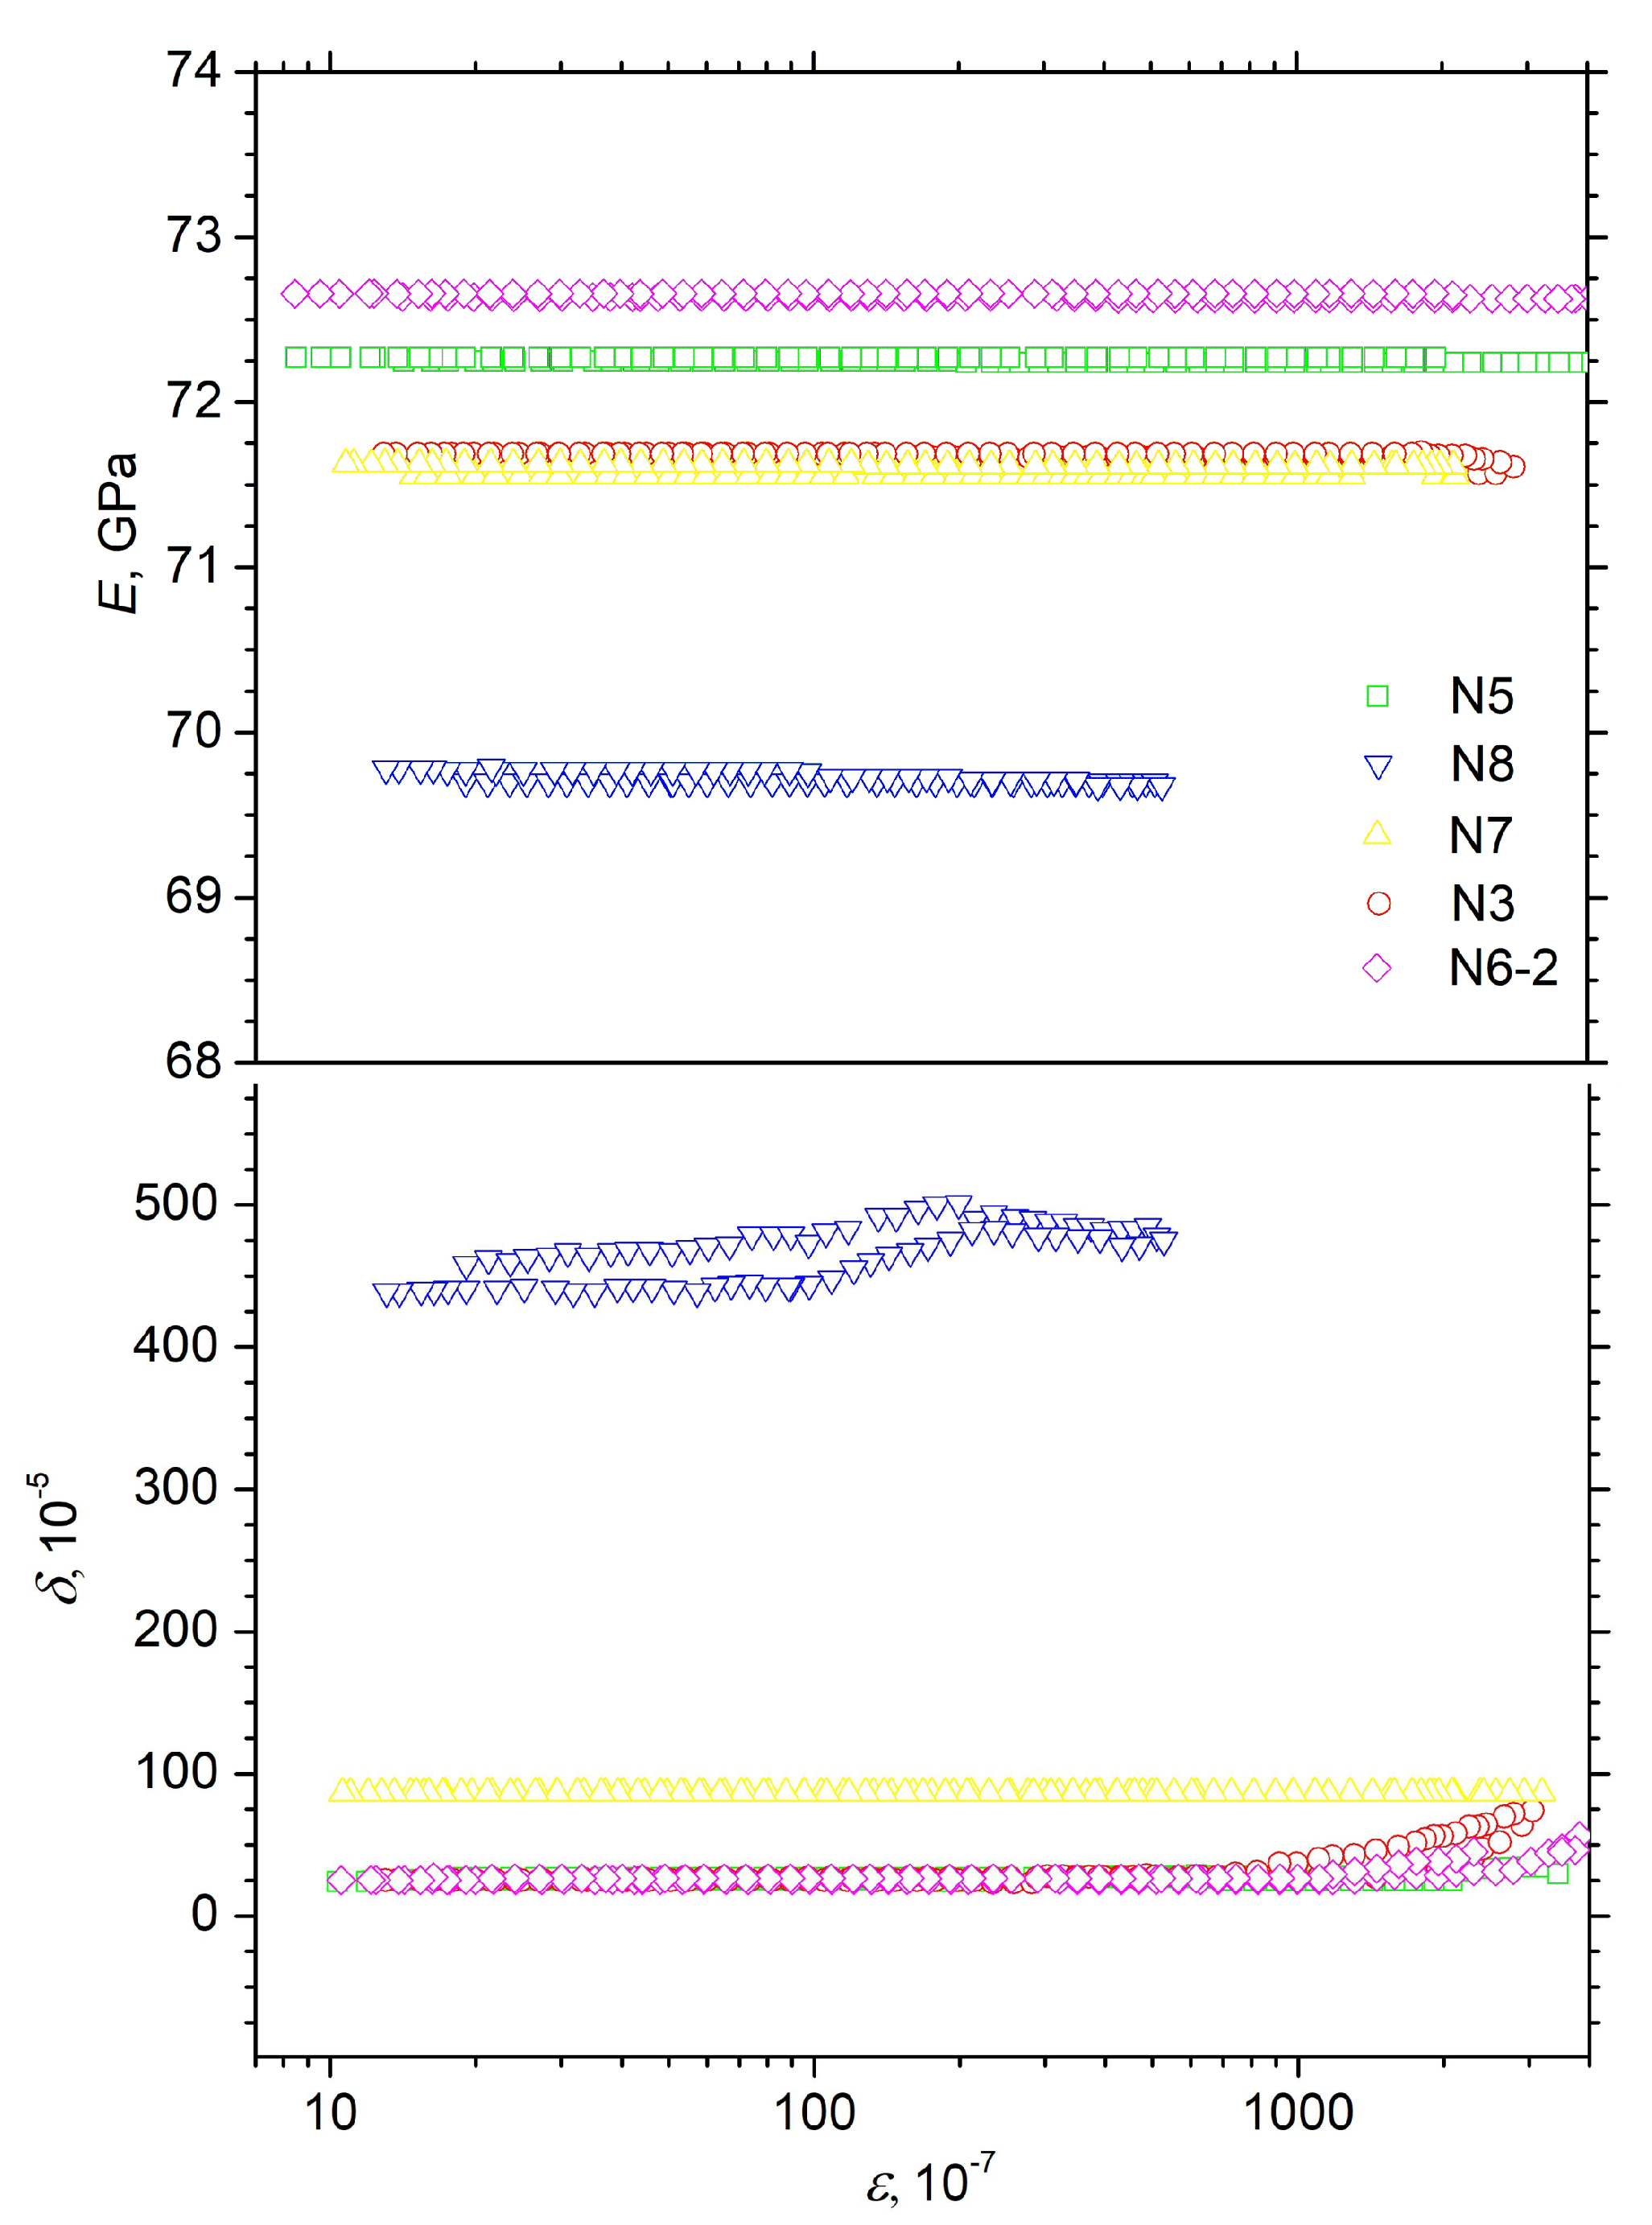
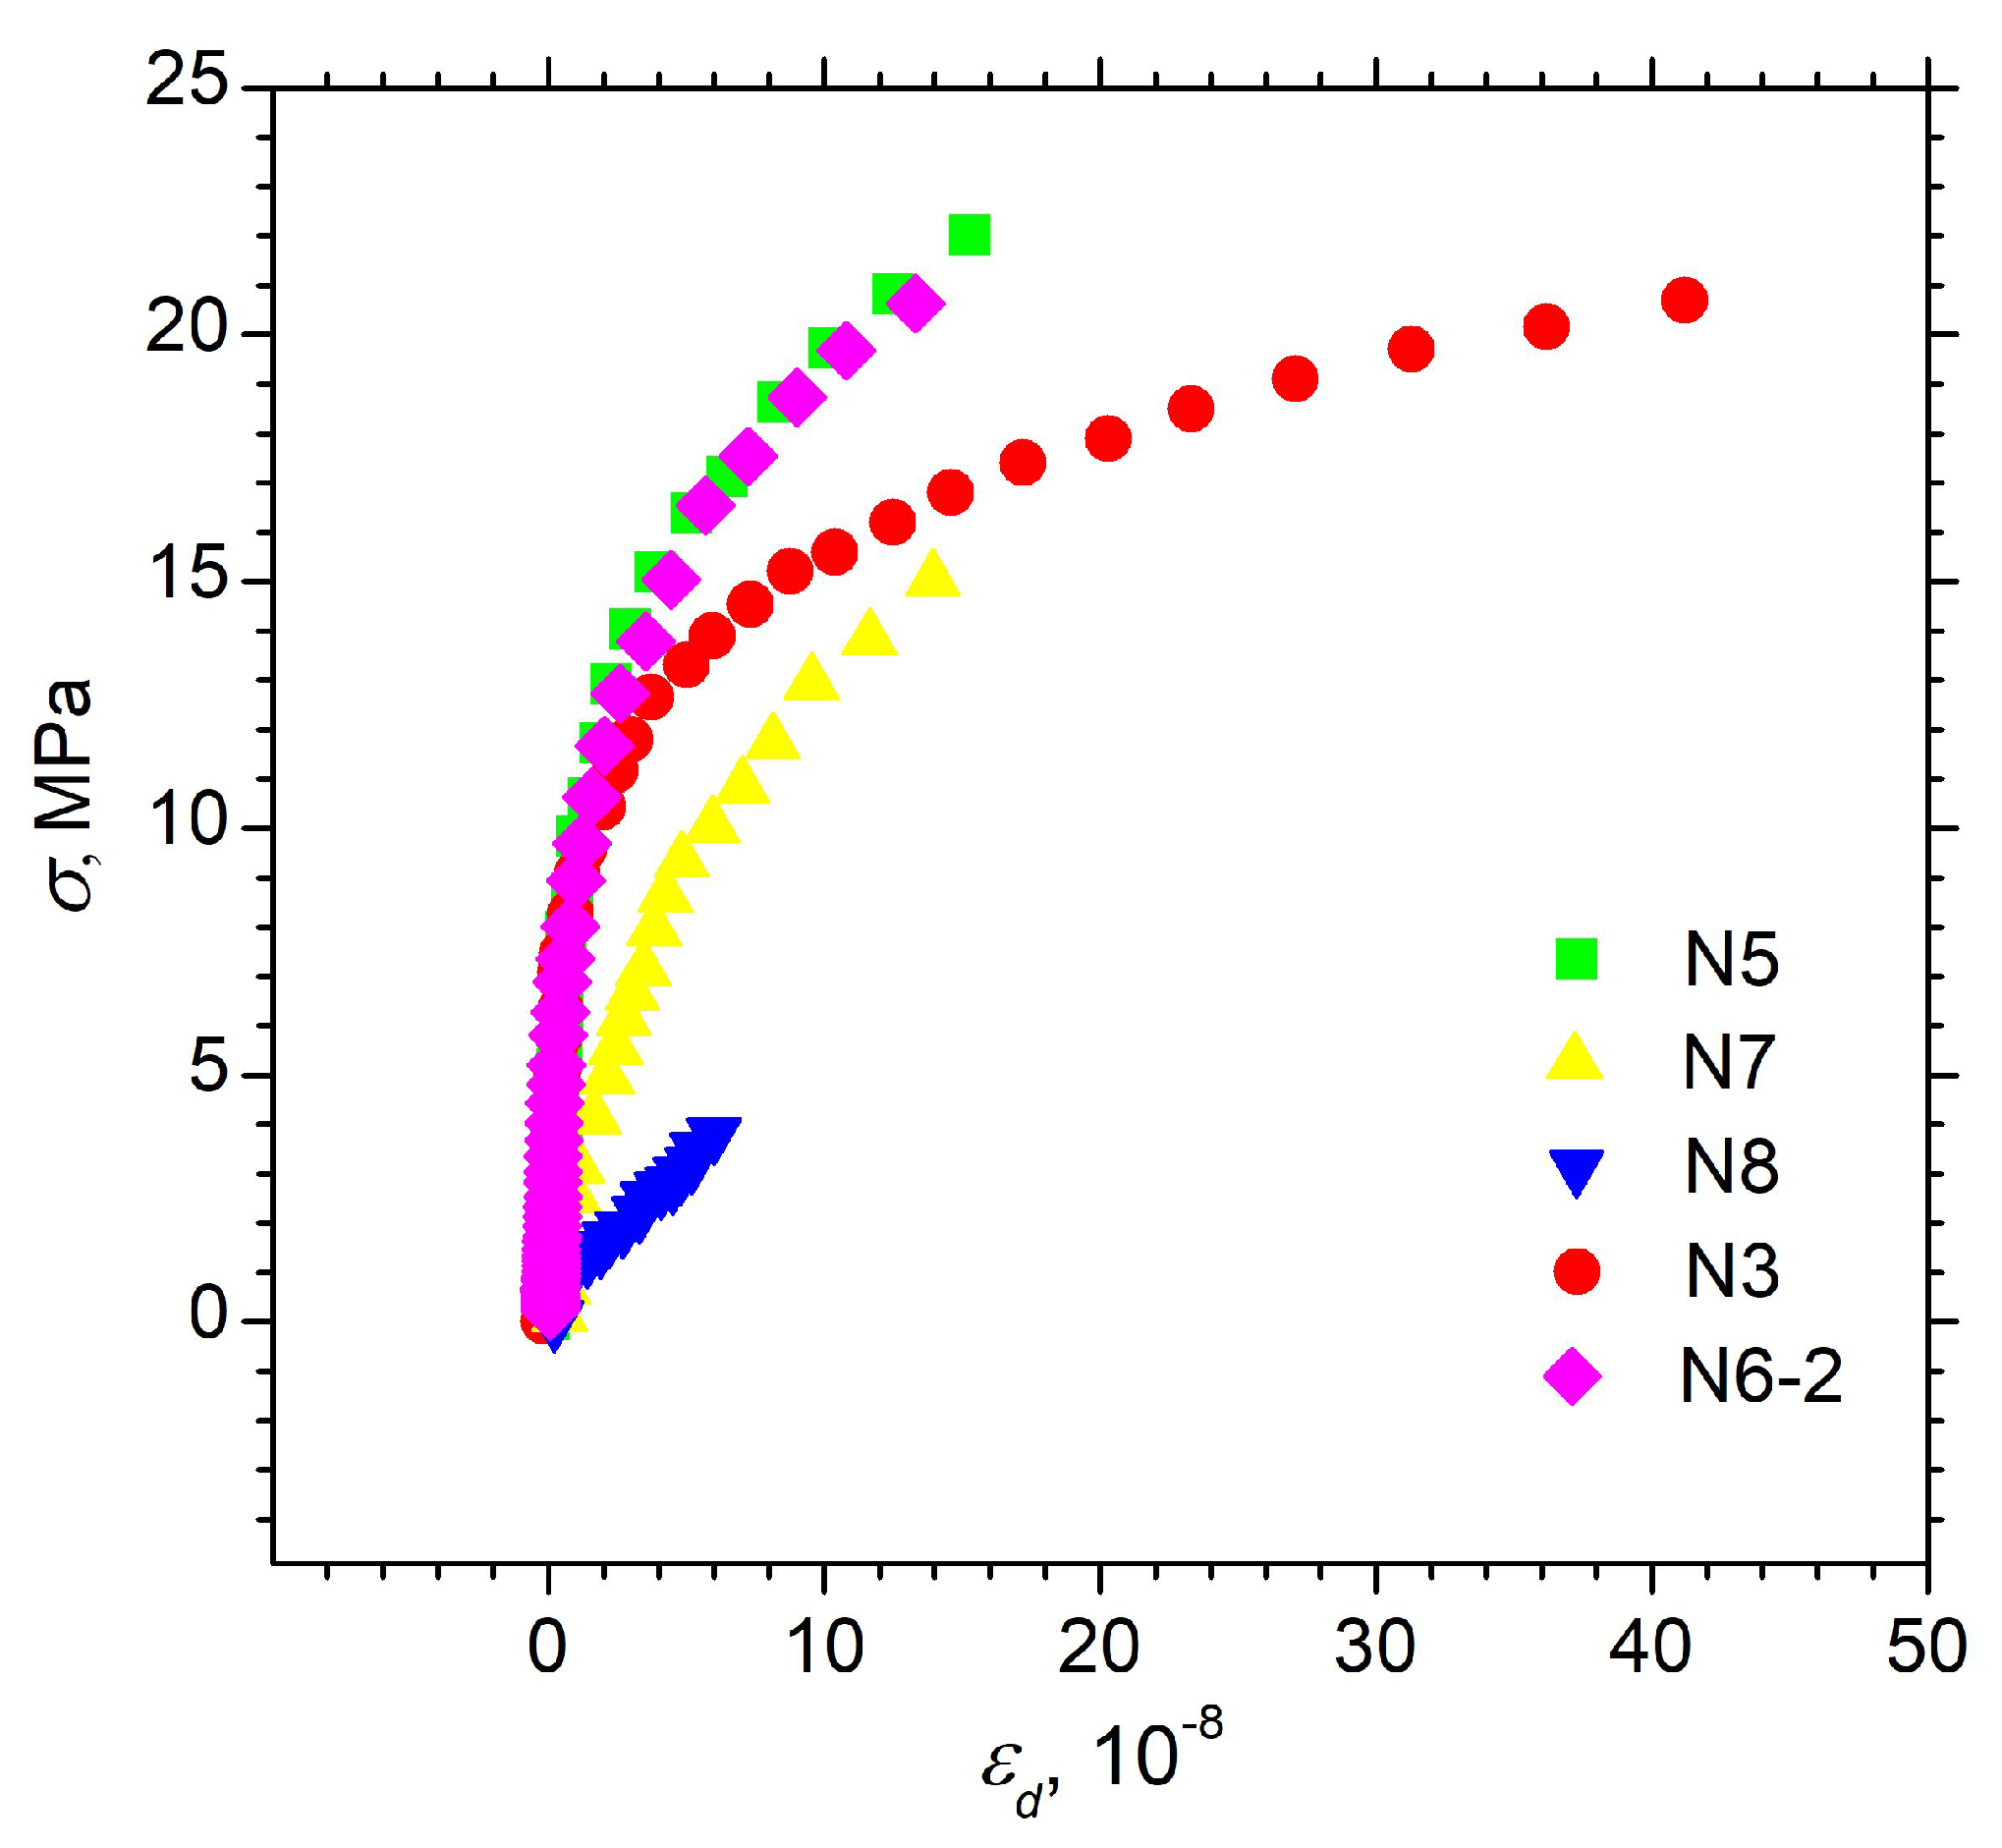
3.4. Results of Elastoplastic and Densitometric Measurements
4. Discussion
5. Conclusions
Supplementary Materials
Author Contributions
Funding
Data Availability Statement
Acknowledgments
Conflicts of Interest
Abbreviations
| AAAC | All Aluminum Alloy Conductor |
| ACSR | Aluminum Conductor Steel Reinforced |
| a.m.u. | atomic mass unit |
| CSAs | coherent scattering areas |
| EBSD | electron backscattering diffraction |
| EDX, EDS | energy-dispersive X-ray microanalysis |
| e.s.d., e.s.d.s | estimated standard deviation(s) |
| OM | optical Microscopy |
| PDF-2 | Powder Diffraction File-2 |
| pV | pseudo-Voigt |
| SEM | scanning electron microscopy |
| SSP | size-strain plot |
| WHP | Williamson-Hall plot |
| XRD | X-ray diffraction |
| i.e. | Latin “id est” |
| etc. | Latin “et cetera” |
| cf. | Latin “confer” |
| full width at half-maximum of XRD reflection | |
| E | Young’s modulus (modulus of elasticity) |
| amplitude-independent decrement of the material | |
| non-linear amplitude-dependent absorption of the material | |
| decrement of material (sum of and ) | |
| microplastic flow stress | |
| Miller indices | |
| interplane distance corresponding to reflection | |
| diffraction angle | |
| half a diffraction angle | |
| - | XRD scanning regime |
| observed Bragg andgle of XRD reflection | |
| correcting shift of the zero of the counter | |
| displacement correction | |
| maximum intensity of XRD reflection | |
| integral intensity of XRD reflection | |
| D | average size of crystallites |
| absolute value of average magnitude of microstrains | |
| vibrational deformation amplitude | |
| non-linear inelastic deformation | |
| coefficient in Scherrer equation | |
| coefficient in Wilson-Stokes equation | |
| integral width of XRD reflection | |
| wavelength | |
| determination coefficient | |
| e | Euler’s number |
| T | temperature |
| penetration depth | |
| the linear absorption coefficient of material | |
| density of material | |
| density of material calculated according to XRD structural data | |
| density of material measured in densitometry experiment | |
| relative error of | |
| relative error of | |
| defect of the Young’s modulus | |
| the relative error of E | |
| magnitude of the density defect | |
| tabulated value of | |
| f | resonance frequency |
| oscillatory stress amplitude (Acoustic (microplastic) deformation) | |
| t | service life |
| volume of the cell | |
| a | unit cell parameter |
| microplastic flow stress (micro-flow limit) |
References
- Shahid, M.A.; Khan, T.M.; Zafar, T.; Hashmi, M.F.; Imran, M. Health diagnosis scheme for in-service low voltage Aerial Bundled Cables using super-heterodyned airborne Ultrasonic testing. Electr. Power Syst. Res. 2020, 180, 106162. [Google Scholar] [CrossRef]
- Kalombo, R.; Martínez, J.; Ferreira, J.; da Silva, C.; Araújo, J. Comparative Fatigue Resistance of Overhead Conductors Made of Aluminium and Aluminium Alloy: Tests and Analysis. Proc. Eng. 2015, 133, 223–232. [Google Scholar] [CrossRef] [Green Version]
- Kul’kov, V.; Sultanov, M.; Kuryanov, V.; Sh, N.D. Electrical reliability simulation based on analysis of fatigue strength of overhead line wires. In Proceedings of the 3rd International Youth Conference on Radio Electronics, Electrical and Power Engineering (REEPE), Moscow, Russia, 11–13 March 2021; p. 9388090. [Google Scholar] [CrossRef]
- Dinmohammadi, F.; Flynn, D.; Bailey, C.; Pecht, M.; Yin, C.; Rajaguru, P.; Robu, V. Predicting Damage and Life Expectancy of Subsea Power Cables in Offshore Renewable Energy Applications. IEEE Access 2019, 7, 54658–54669. [Google Scholar] [CrossRef]
- Radulescu, C.; Ionica, I.; Stihi, C.; Popescu, I.V.; Poinescu, A.A.; Suica-Bunghez, I.R. The behavior of underground power cables under the action of stress factors. Rom. J. Phys. 2014, 59, 1150–1159. [Google Scholar]
- Xia, R.; Meng, S.; Wang, Y. Long Term Reliability Tests of 500 kV XLPE Cable System. In Proceedings of the 2014 International Conference on Power System Technology, Chenghu, China, 20–22 October 2014. No. CP2377. [Google Scholar]
- Yamanaka, S.; Fukuda, T.; Ito, K.; Tomita, J.; Seguchi, T. Use of Residual Voltage for Diagnosis of Electric Power Cables Used in Nuclear Power Stations. Electr. Eng. Jpn. 1997, 119, 18–24. [Google Scholar] [CrossRef]
- Brettschneider, S.; Fofana, I. Evolution of Countermeasures against Atmospheric Icing of Power. Energies 2021, 14, 6291. [Google Scholar] [CrossRef]
- Lu, J.; Hu, J.; Fang, Z.; Qiao, X.; Zhang, Z. Electric Field Distribution and AC Breakdown Characteristics of Polluted Novel Lightning Protection Insulator under Icing Conditions. Energies 2021, 14, 7493. [Google Scholar] [CrossRef]
- Cintula, B.; Eleschova, Z.; Cenky, M.; Janiga, P.; Bendík, J.; Belan, A. Three-Phase and Single-Phase Measurement of Overhead Power Line Impedance Evaluation. Energies 2021, 14, 6314. [Google Scholar] [CrossRef]
- Byakov, A.V.; Eremin, A.V.; Shah, R.T.; Burkov, M.V.; Lyubutin, P.S.; Panin, S.V.; Maruschak, P.O.; Menou, A.; Bencheikh, L. Estimating mechanical state of AA2204 specimen under tension with the use of Lamb wave based ultrasonic technique. Mol. Cryst. Liq. Cryst. 2017, 655, 94–102. [Google Scholar] [CrossRef]
- Ning, Y.; Wang, D.; Li, Y.; Zhang, H. Location of Faulty Section and Faults in Hybrid Multi-Terminal Lines Based on Traveling Wave Methods. Energies 2018, 11, 1105. [Google Scholar] [CrossRef] [Green Version]
- Zagulyaev, D.V.; Konovalov, S.V.; Yaropolova, N.G.; Ivanov, Y.F.; Komissarova, I.A.; Gromov, V.E. Effect of the Magnetic Field on the Surface Morphology of Copper upon Creep Fracture. J. Surf. Investig. X-ray Synchrotron Neutron Tech. 2015, 9, 410–414. [Google Scholar] [CrossRef]
- Alshwawreh, N.; Alhamarneh, B.; Altwarah, Q.; Quandour, S.; Barghout, S.; Ayasrah, O. Electrical Resistivity and Ten sile Strength Relationship in Heat-Treated All Aluminum Alloy Wire Conductors. Materials 2021, 14, 5738. [Google Scholar] [CrossRef] [PubMed]
- Xu, X.; Yu, Z.; Li, Y.; Wang, W.; Xu, L. Microstructural Study of Arc Beads in Aluminum Alloy Wires with an Overcurrent Fault. Materials 2021, 14, 4133. [Google Scholar] [CrossRef] [PubMed]
- Kreislova, K.; Jaglova, M.; Turek, L.; Koukalova, A. Evaluation of corrosion of long-termexposed aluminium conductor. Koroze Ochr. Mater. 2013, 57, 25–34. [Google Scholar] [CrossRef] [Green Version]
- Azevedo, C.R.F.; Cescon, T. Failure analysis of aluminum cable steel reinforced (ACSR) conductor of the transmission line crossing the Paranar River. Eng. Fail. Anal. 2002, 9, 645–664. [Google Scholar] [CrossRef]
- de la Fuente, D.; Otero-Huerta, E.; Morcillo, M. Studies of long-term weathering of aluminium in the atmosphere. Corros. Sci. 2007, 49, 3134–3148. [Google Scholar] [CrossRef]
- Taylor, G.I. The mechanism of plastic deformation of crystals. Proc. R. Soc. A 1934, 145, 362–387. [Google Scholar] [CrossRef]
- Orowan, E. Zur Kristallplastizität. III. Z. Phys. 1934, 89, 634–659. [Google Scholar] [CrossRef]
- Read, T.A. The Internal Friction of Single Metal Crystals. Phys. Rev. 1940, 58, 371–380. [Google Scholar] [CrossRef]
- Kardashev, B.; Chernov, V. Internal friction and impact toughness of structural BCC alloys. Mater. Sci. Eng. A 2009, 521–522, 329–334. [Google Scholar] [CrossRef]
- Kardashev, B.; Kupriyanov, I. Micro- and Macro-Plastic Properties of Be Polycrystals. Sol. Stat. Phenom. 2012, 184, 257–262. [Google Scholar] [CrossRef]
- Diffrac. Suite Eva, Version 5.1.0.5; Brucker AXS: Karlsruhe, Germany, 2019.
- Fawcett, T.G.; Kabekkodu, S.N.; Blanton, J.R.; Blanton, T.N. Chemical analysis by diffraction: The Powder Diffraction File™. Powder Diffr. 2017, 32, 63–71. [Google Scholar] [CrossRef]
- Maunders, C.; Etheridge, J.; Wright, N.; Whitfield, H.J. Structure and microstructure of hexagonal Ba3Ti2RuO9 by electron diffraction and microscopy. Acta Cryst. B 2005, 61, 154–159. [Google Scholar] [CrossRef] [Green Version]
- Levin, A.A.; Levichkova, M.; Hildebrandt, D.; Klisch, M.; Weiss, A.; Wynands, D.; Elschner, C.; Pfeiffer, M.; Leo, K.; Riede, M. Effect of film thickness, type of buffer layer, and substrate temperature on the morphology of dicyanovinyl-substituted sexithiophene films. Thin Solid Film. 2012, 520, 2479–2487. [Google Scholar] [CrossRef]
- Terlan, B.; Levin, A.A.; Börrnert, F.; Simon, F.; Oschatz, M.; Schmidt, M.; Cardoso-Gil, R.; Lorenz, T.; Baburin, I.A.; Joswig, J.O.; et al. Effect of Surface Properties on the Microstructure, Thermal, and Colloidal Stability of VB2 Nanoparticles. Chem. Mater. 2015, 27, 5106–5115. [Google Scholar] [CrossRef]
- Terlan, B.; Levin, A.A.; Börrnert, F.; Zeisner, J.; Kataev, V.; Schmidt, M.; Eychmüller, A. A Size-Dependent Analysis of the Structural, Surface, Colloidal, and Thermal Properties of Ti1−xB2 (x = 0.03–0.08) Nanoparticles. Eur. J. Inorg. Chem. 2016, 2016, 3460–3468. [Google Scholar] [CrossRef]
- Rehani, B.R.; Joshi, P.B.; Lad, K.N.; Pratap, A. Crystallite size estimation of elemental and composite silver nano-powders using XRD principles. Indian J. Pure Appl. Phys. 2006, 44, 157–161. [Google Scholar]
- Scherrer, P. Bestimmung der Grose und der inneren Struktur von Kolloidteilchen mittels Rontgenstrahlen. Nachr. Konigl. Ges. Wiss. Gottingen. 1918, 26, 98–100. (In German) [Google Scholar]
- Stokes, A.R.; Wilson, A.J.C. The diffraction of X rays by distorted crystal aggregates—I. Proc. Phys. Soc. Lond. 1944, 56, 174–181. [Google Scholar] [CrossRef]
- Langford, J.I. A rapid method for analysing the breadths of diffraction and spectral lines using the Voigt function. J. Appl. Cryst. 1978, 11, 10–14. [Google Scholar] [CrossRef]
- Nikanorov, S.P.; Kardashev, B.K. Elasticity and Dislocation Inelasticity of Crystals; Nauka: Moscow, Russia, 1985. (In Russian) [Google Scholar]
- Miller, P.H.; DuMond, J.W.M. Tests for the validity of the X-ray crystal method for determining N and e with aluminum, silver and quartz. Phys. Rev. 1940, 57, 198–206. [Google Scholar] [CrossRef]
- Tsybulya, S.V.; Kryukova, G.N. New X-ray powder diffraction data on δ-Al2O3. Powder Diffr. 2003, 18, 309–311. [Google Scholar] [CrossRef]
- Fargeot, D.; Mercurio, D.; Dauger, A. Structural characterization of alumina metastable phases in plasma sprayed deposits. Mater. Chem. Phys. 1990, 24, 299–314. [Google Scholar] [CrossRef]
- Otte, H.M.; Montague, W.G.; Welch, D.O. X-ray Diffractometer Determination of the Thermal Expansion Coefficient of Aluminum near Room Temperature. J. Appl. Phys. 1963, 34, 3149–3150. [Google Scholar] [CrossRef]
- Slater, J.C. Atomic Radii in Crystals. J. Chem. Phys. 1964, 41, 3199–3204. [Google Scholar] [CrossRef]
- Ye, W.; Hohl, J.; Misra, M.; Liao, Y.; Mushongera, L.T. Grain boundary relaxation in doped nano-grained aluminum. Mater. Today Commun. 2021, 29, 102808. [Google Scholar] [CrossRef]
- Gremaud, G. Dislocation—Point Defect Interactions. Mater. Sci. Forum. 2001, 366–368, 178–246. [Google Scholar] [CrossRef]
- Meyers, M.; Mishra, A.; Benson, D. Mechanical properties of nanocrystalline materials. Progr. Mater. Sci. 2006, 51, 427–556. [Google Scholar] [CrossRef]
- Valiev, R.Z.; Aleksandrov, G.V. Nanostructured Metals Produced by Severe Plastic Deformation; English Translation; Logos: Moscow, Russia, 2000; p. 272. [Google Scholar]
- Valiev, R.Z.; Aleksandrov, G.V. Bulk Nanostructured Metallic Materials: Preparation, Structure and Properties; Akademkniga: Moscow, Russia, 2007; p. 398. (In Russian) [Google Scholar]
- Kardashev, B.K.; Betekhtin, V.I.; Narykova, M.V. Elastoplastic properties of microand submicrocrystalline metals and alloys. Tech. Phys. 2015, 60, 1829–1841. [Google Scholar] [CrossRef]
- Kardashev, B.K.; Betekhtin, V.I.; Kadomtsev, A.G.; Narykova, M.V.; Kolobov, Y.R. Elastic and microplastic properties of titanium in different structural states. Tech. Phys. 2017, 62, 1372–1376. [Google Scholar] [CrossRef]
- Kardashev, B.K.; Plaksin, O.A.; Stepanov, V.A.; Chernov, V.M. Effect of proton and laser irradiation on the elastic and inelastic properties of a V-Ti-Cr alloy. Phys. Solid State 2004, 46, 1449–1455. [Google Scholar] [CrossRef]
- Betekhtin, V.I.; Kadomtsev, A.G.; Kardashev, B.K. Elasticity and inelasticity of microcrystalline aluminum samples having various deformation and thermal histories. Phys. Solid State 2006, 48, 1506–1512. [Google Scholar] [CrossRef]
- Martienssen, W.; Warlimont, H. (Eds.) Springer Handbook of Condensed Matter and Materials Data; Springer: Berlin/Heidelberg, Germany, 2005; Chapter 3.2; pp. 431–476. [Google Scholar] [CrossRef]


| Sample N | Type | Service Life, Years | Damage | Remark |
|---|---|---|---|---|
| 5-2 | A50 | 0 | No damage | Samples under study were cut from one of the edges of sections with a length of ∼1 to ∼3 m |
| 8 | 10 | |||
| 7 | 18 | |||
| 6-2 | 62 | |||
| 3 | 35 | Cutoff and short circuit to the ground. After the cutoff the wire was under the high voltage during 1.5 to 2 h and was partly burned | Section length was 3.2 m; the sample was cut from the undamaged part in the middle | |
| 5 | AC50 | 0 | No damage | Sample under study was cut from one of the edges of the section with a length of ∼1.3 m |
| Observed Preferred Orientation | WHP | SSP | |||
|---|---|---|---|---|---|
| Sample N/Years | [hkl] | , % , % | , Å/, g/cm , nm (Model ) | , nm , % | , nm , % |
| A50 type | |||||
| 5-2/0 | [011] | 42.0(3) 76.4(7) | 4.05026(12)/2.6973(2) 109(16) | 111(14) 0.010(14) | 109(16) 0 |
| 8/10 | [011] | 69.0(4) 66.1(4) | 4.0515(5)/2.6949(11) 139(16) | 302(54) 0.031(2) | 298(26) 0.031(2) |
| 7/18 | [011] | 153.8(1.6) 55.6(6) | 4.0525(9)/2.6927(17) 126(33) | 246(55) 0.033(3) | 252(32) 0.034(3) |
| 3/35 | ∼no | 54.6(4) 141.6(1.5) | 4.0507(2)/2.6965(5) 96(11) | 112(11) 0.021(5) | 118(6) 0.025(5) |
| 6-2/62 | [011] | 174.7(1.1) 42.9(3) | 4.0513(6)/2.6952(11) 128(34) | 222(69) 0.031(5) | 249(49) 0.033(4) |
| AC50 type | |||||
| 5/0 | [011] | 75.8(9) 68.4(9) | 4.05032(10)/2.6972(2) 138(16) | 141(17) 0.007(11) | 138(16) 0 |
| Table data | |||||
| PDF-2 card 01-071-4008, T = 312.3 K | no | — — | 4.050694/2.69642 — | — — | — — |
| PDF-2 card 01-073-9843, T = 298 K | no | 24.0 191.7 | 4.04932(2)/2.6992(4) — | — — | — — |
| Sample N | Service Life, Years | , g/cm | E, GPa | , | , MPa |
|---|---|---|---|---|---|
| 5 | 0 | 2.6949 | 72.2 | 27 | 14.0 |
| 8 | 10 | 2.6906 | 69.8 | 457 | 2.3 |
| 7 | 18 | 2.6905 | 71.6 | 85 | 7.3 |
| 3 | 35 | 2.6885 | 71.6 | 23 | 11.9 |
| 6-2 | 62 | 2.6939 | 72.6 | 23 | 13.1 |
Publisher’s Note: MDPI stays neutral with regard to jurisdictional claims in published maps and institutional affiliations. |
© 2021 by the authors. Licensee MDPI, Basel, Switzerland. This article is an open access article distributed under the terms and conditions of the Creative Commons Attribution (CC BY) license (https://creativecommons.org/licenses/by/4.0/).
Share and Cite
Levin, A.A.; Narykova, M.V.; Lihachev, A.I.; Kardashev, B.K.; Kadomtsev, A.G.; Brunkov, P.N.; Panfilov, A.G.; Prasolov, N.D.; Sultanov, M.M.; Kuryanov, V.N.; et al. Modification of the Structural, Microstructural, and Elastoplastic Properties of Aluminum Wires after Operation. Metals 2021, 11, 1955. https://doi.org/10.3390/met11121955
Levin AA, Narykova MV, Lihachev AI, Kardashev BK, Kadomtsev AG, Brunkov PN, Panfilov AG, Prasolov ND, Sultanov MM, Kuryanov VN, et al. Modification of the Structural, Microstructural, and Elastoplastic Properties of Aluminum Wires after Operation. Metals. 2021; 11(12):1955. https://doi.org/10.3390/met11121955
Chicago/Turabian StyleLevin, Aleksandr A., Maria V. Narykova, Alexey I. Lihachev, Boris K. Kardashev, Andrej G. Kadomtsev, Pavel N. Brunkov, Andrei G. Panfilov, Nikita D. Prasolov, Makhsud M. Sultanov, Vasily N. Kuryanov, and et al. 2021. "Modification of the Structural, Microstructural, and Elastoplastic Properties of Aluminum Wires after Operation" Metals 11, no. 12: 1955. https://doi.org/10.3390/met11121955