Article

Compressive Behaviour of Additively Manufactured Periodical Re-Entrant Tetrakaidecahedral Lattices at Low and High Strain-Rates

1
Department of Mechanics and Materials, Faculty of Transportation Sciences, Czech Technical University in Prague, Na Florenci 25, 110 00 Prague 1, Czech Republic
2
Czech Academy of Sciences, Institute of Theoretical and Applied Mechanics, Prosecká 809/76, 190 00 Prague 9, Czech Republic
*
Author to whom correspondence should be addressed.
Metals 2021, 11(8), 1196; https://doi.org/10.3390/met11081196
Submission received: 30 June 2021 / Revised: 16 July 2021 / Accepted: 23 July 2021 / Published: 27 July 2021
(This article belongs to the Special Issue Advances and Applications in Cellular Metals)

Abstract

:
Compressive deformation behaviour of additively manufactured lattice structures based on re-entrant tetrakaidecahedral unit-cell geometry were experimentally investigated under quasi-static and dynamic loading conditions. Specimens of four different structures formed by three-dimensional periodical assembly of selected unit-cells were produced by a laser powder bed fusion technique from a powdered austenitic stainless steel SS316L. Quasi-static compression as well as dynamic tests using split Hopkinson pressure bar (SHPB) apparatus at two strain-rates were conducted to evaluate the expected strain-rate sensitivity of the fundamental mechanical response of the structures. To evaluate the experiments, particularly the displacement fields of the deforming lattices, optical observation of the specimens using a high-resolution camera (quasi-static loading) and two synchronised high-speed cameras (SHPB experiments) was employed. An in-house digital image correlation algorithm was used in order to evaluate the anticipated auxetic nature of the investigated lattices. It was found that neither of the investigated structures exhibited auxetic behaviour although strain-rate sensitivity of the stress–strain characteristics was clearly identified for the majority of structures.

1. Introduction

In recent years, cellular materials and particularly lattice structures have been extensively studied mostly due to their potential in the weight optimisation of structural components while maintaining the required stiffness and strength [1,2]. Amongst the investigated structures, auxetic meta-materials have introduced a broad scale of unique mechanical properties arising from the negativity of their Poisson’s ratios. These include, e.g., improved capabilities in indentation resistance [3], shear resistance and fracture toughness [4], vibration absorption [5], or deformation energy absorption [6] in comparison to conventional porous solids. These properties arise from the deformation mechanisms given by the geometry of their inner structure, leading to lateral extension when stretched longitudinally and shrinking in the transverse direction when compressed [7].
The occurrence of natural auxetic materials is rather scarce as only a few examples such as iron pyrite monocrystals, cancellous bone tissue, or cat skin have been listed in the literature [8]. Thus, auxetics as we know them are mostly artificially fabricated meta-materials typically based on a periodical or stochastic assembly of unit cells with a specific geometry. Here, two-dimensional and three-dimensional structures may be distinguished based on the spatial distribution of the unit cells [9]. Moreover, there is a further classification of the auxetic structures according to the geometry and interconnection of the unit cells: (a) rigid node rotation, (b) chiral, (c) re-entrant lattice, (d) elastic instability, (e) kirigami fractal cut, (f) origami, (g) star-shape connected, and (h) missing-rib [10,11].
A broad range of applications has been suggested for auxetic structures including smart sensors [12], filters [13], textile fibres [14], biomedical materials [15], or protective devices with enhanced performance in terms of kinetic energy dissipation [16]. Regarding the impact energy absorption capability of auxetic structures, resulting from a stress enhancement occurring under dynamic loading conditions, a significant number of recent studies have focused on investigation into this property [17,18,19]. While some of the authors demonstrated the strain-rate sensitivity of auxetic structures [20,21,22], others indicated rather non-strain-rate-dependent behaviour for specific structures [23]. Thus, further investigation into the possible strain-rate sensitivity of auxetic lattices is still necessary.
To fully exploit the potential of auxetics, precise fabrication methods allowing for the production of geometrically complex structures with high reliability need to be employed [24]. In past decades, additive manufacturing (AM) has progressively developed into a competitive manufacturing method for various kinds of materials and applications [25] to become a matured production technology fulfilling such requirements. The main AM techniques may be classified into (a) fused deposition modelling (FDM), (b) powder bed fusion (PBF), (c) inkjet printing and contour crafting, (d) stereolithography (SLA), (e) direct energy deposition (DED), and (f) laminated object manufacturing (LOM) [25]. It has been demonstrated that the auxetic lattices may be fabricated using all listed techniques. However, recent studies on the dynamic behaviour and impact resistance of auxetics are focused on the investigation of metal-based lattices and, thus, the DED or PBF techniques are the most frequently used [20,26,27].
In this study, we investigate the auxetic structure based on a periodical assembly of a re-entrant tetrakaidecahedral unit-cell first introduced by Choi and Lakes in [28]. However, the available literature does not provide any further details regarding the properties of such an auxetic unit-cell and the resulting lattice beyond the initial study of Choi and Lakes comprising analytical and experimental analyses of a stochastic re-entrant tetrakaidecahedral lattice. The potential of such a unit-cell and lattice in deformation energy mitigation is thus unclear; such potential is also unclear when AM is used for its production instead of thermo-mechanical modification of a non-auxetic foam as considered in the original paper of Choi and Lakes. In our previous study, we performed a finite element investigation into the anticipated auxetic character of such a structure subjected to uni-axial quasi-static compression [29]. Based on our previous findings, we have exploited the advantages of a high-resolution metal PBF AM method to produce four different variants of periodic lattices based on the re-entrant tetrakaidecahedral unit-cell represented either by a beam or a facet analogy. The samples were then subjected to a set of experiments comprising quasi-static uni-axial compression and dynamic compression in a split Hopkinson pressure bar (SHPB) apparatus at two distinct strain-rates to assess the strain-rate sensitivity of their mechanical response. Furthermore, optical measurements involving high-resolution or high-speed camera instrumentation together with an in-house developed digital image correlation (DIC) procedure were employed to evaluate the displacement fields on the deforming lattices to evaluate their strain.

2. Materials and Methods
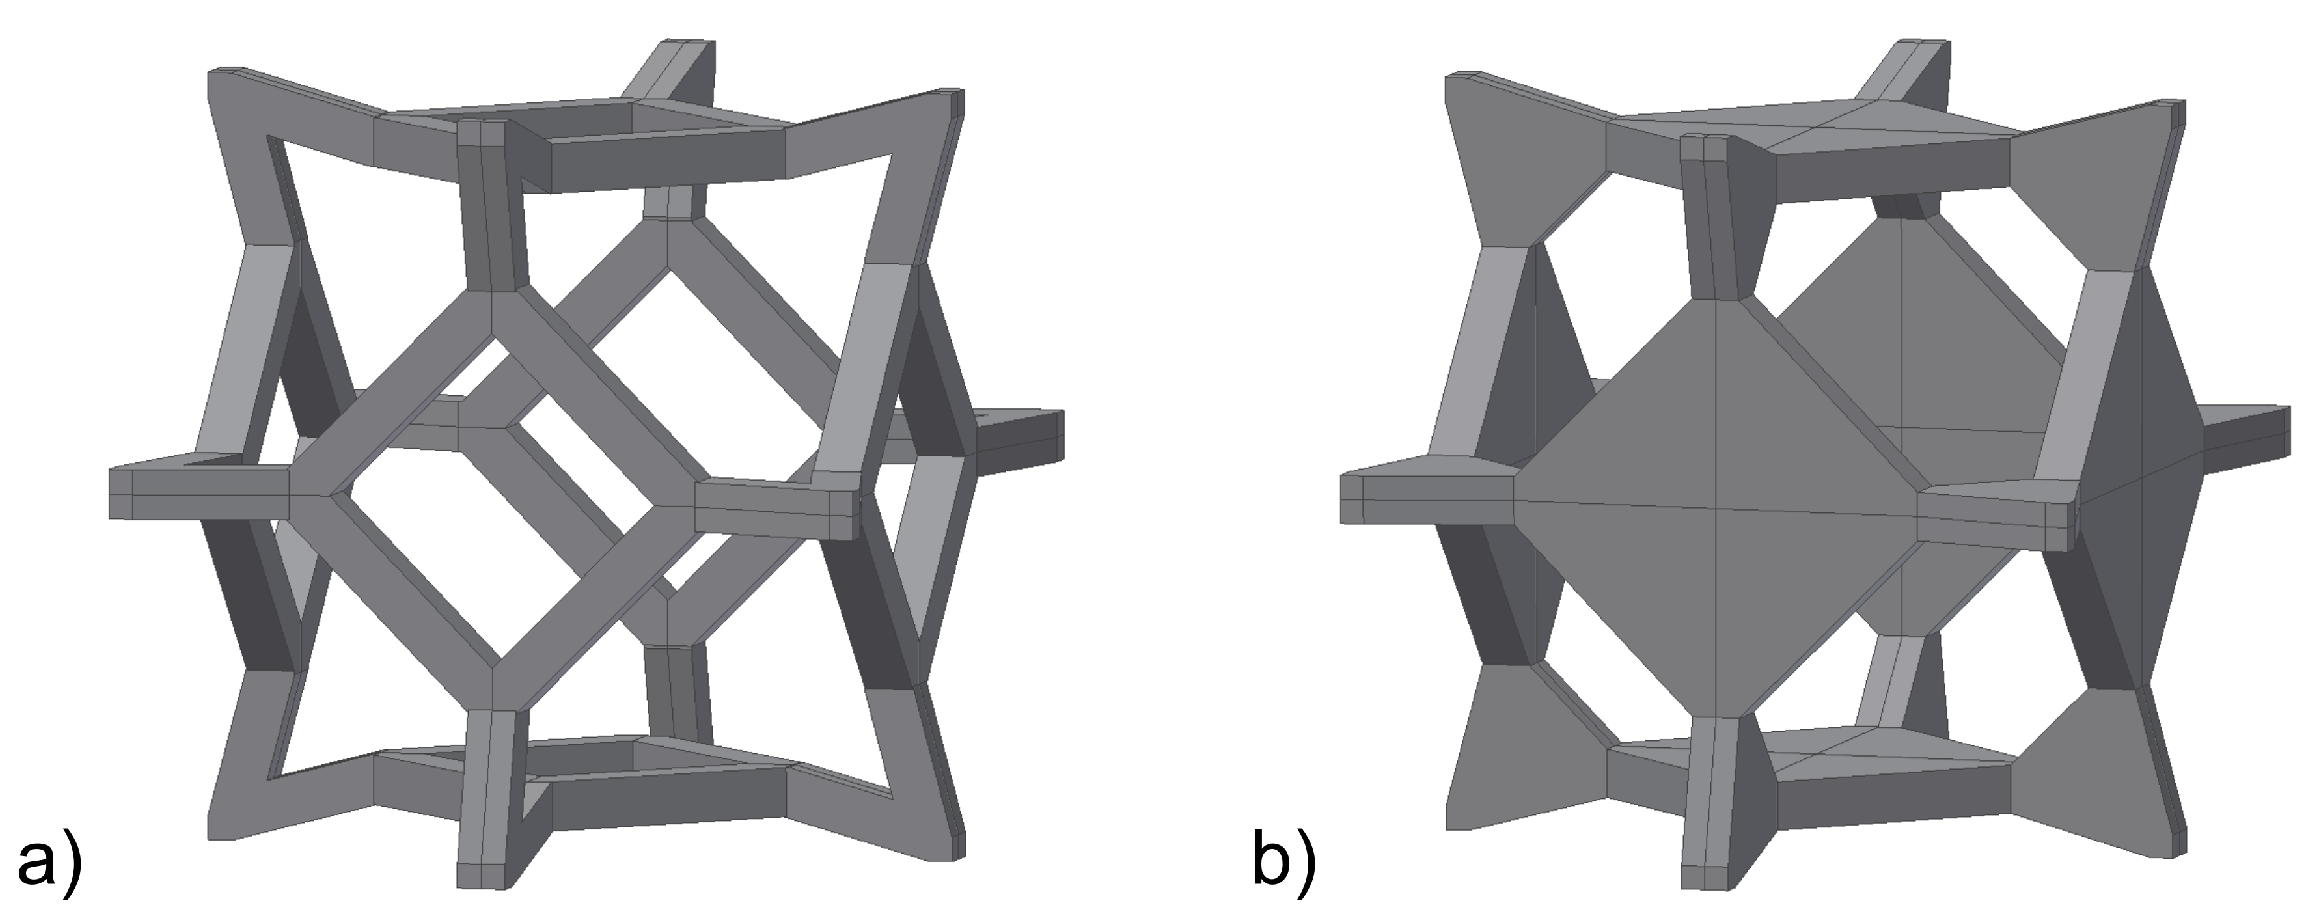
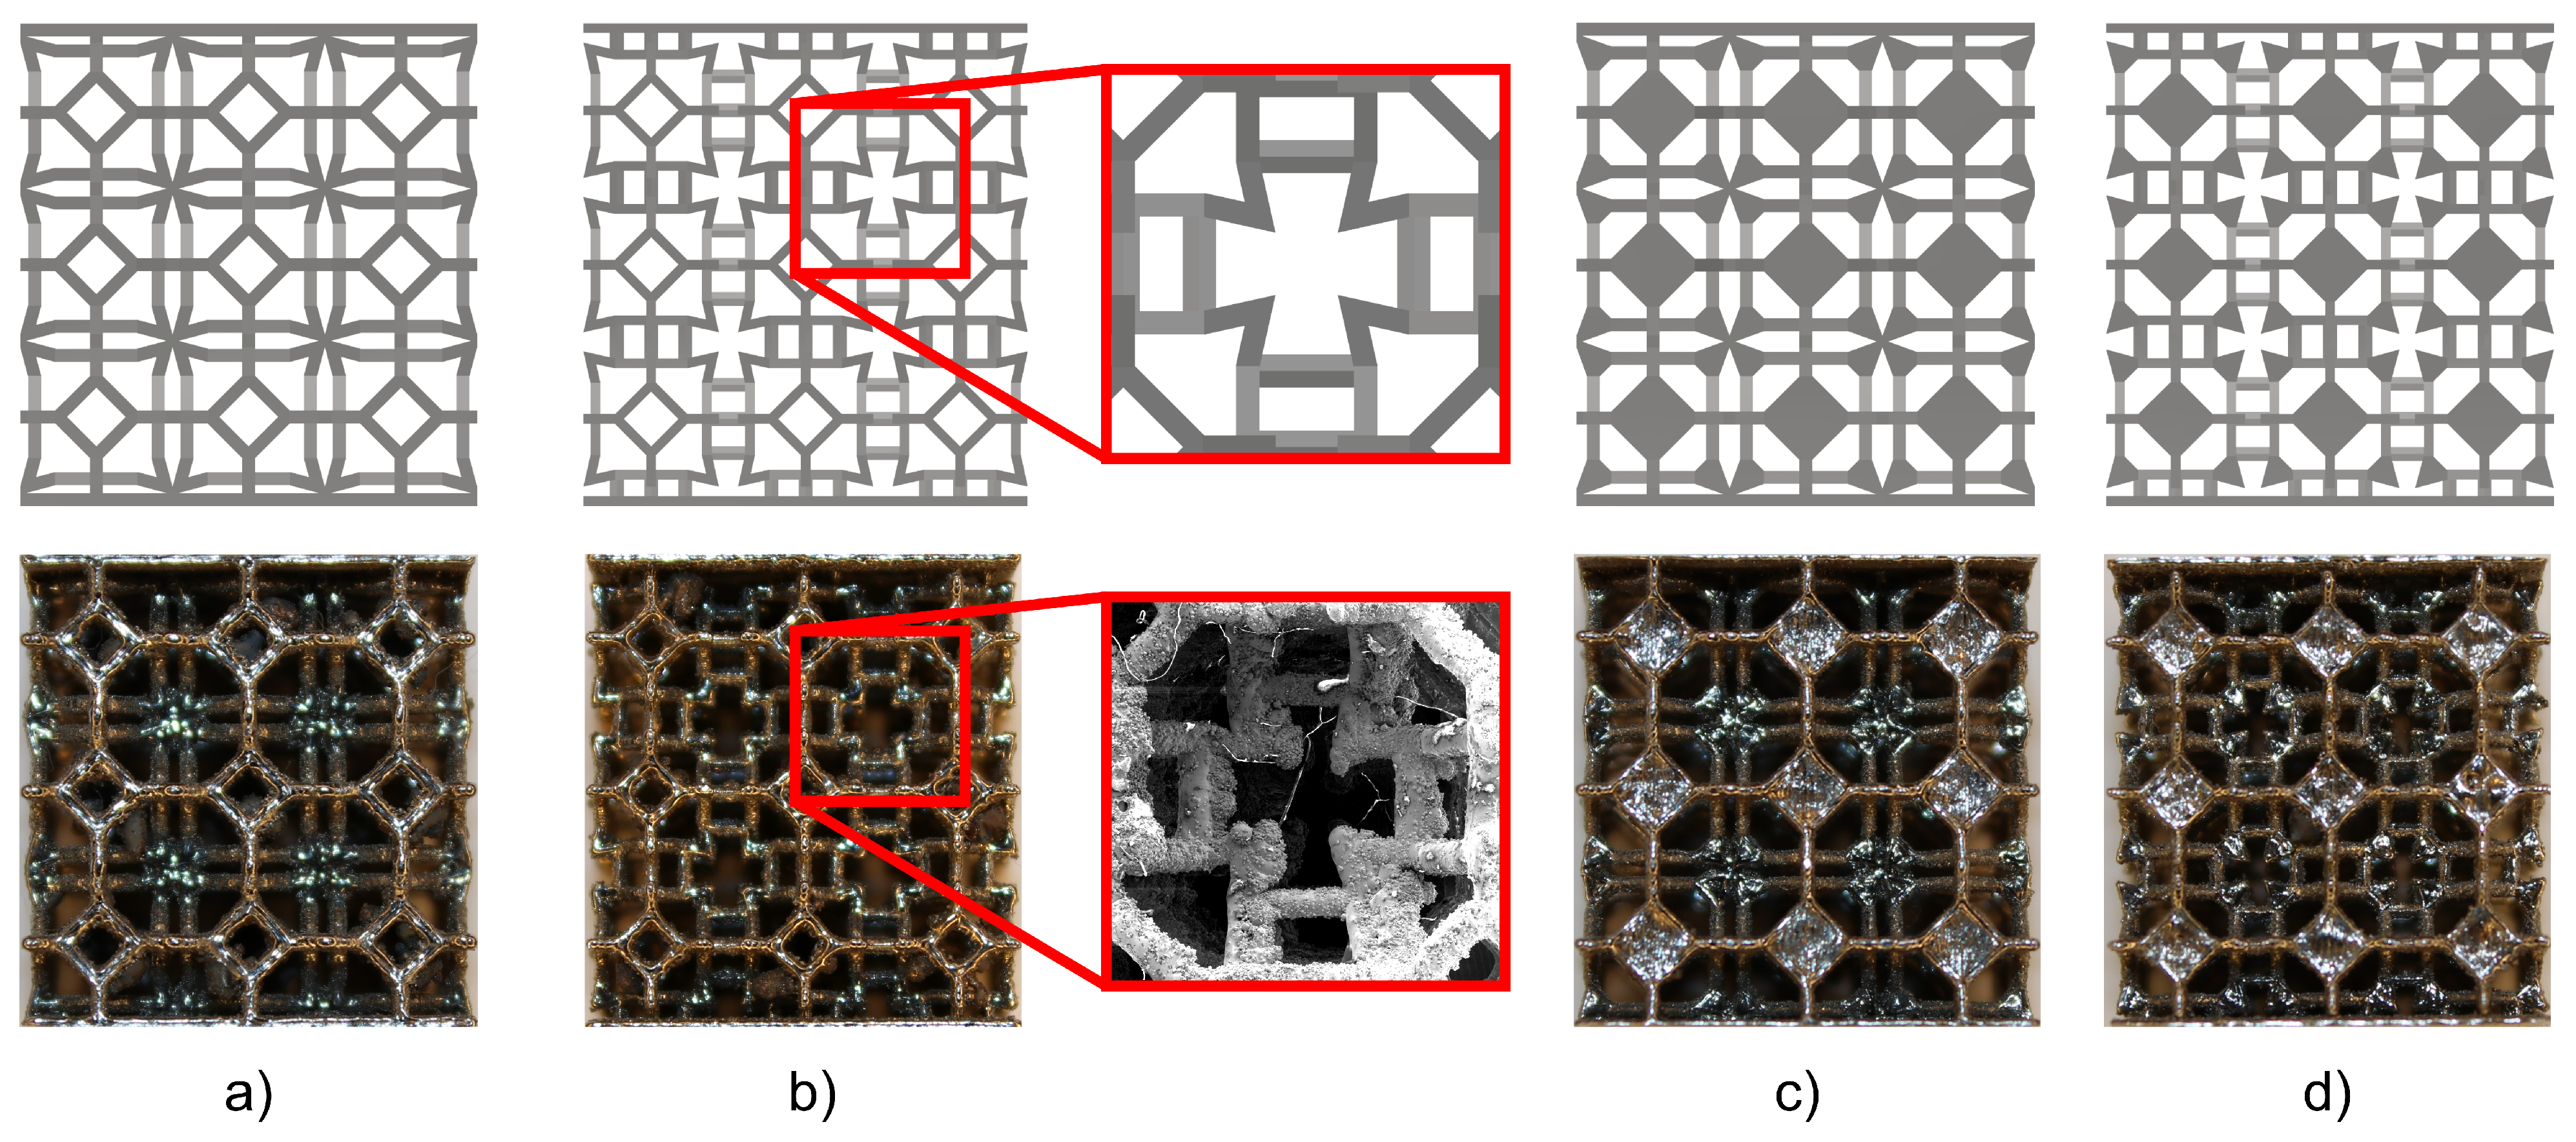
2.1. Specimens

In this study, the lattice structures generated by a periodical assembly of re-entrant tetrakaidecahedral unit-cells were investigated. The unit-cell geometry is based on a conventional tetrakaidecahedron (also known as the Kelvin cell), where its square faces are protruded into the inner space of the cell to form its re-entrant modification. To achieve the auxetic design of the cell, the re-entrant angle as defined by Choi and Lakes [28] may vary in the range 45–90 . Based on a prior numerical analysis [29] two versions of the unit-cell geometry, both with a re-entrant angle of 60 , were considered in this study. The “beam” version is based on the original open-cell design and consists only of struts, while the “facet” version is designed as an assumed stiffer modification of the original cell consisting of both 1D (struts) and 2D (facets) elements. Schemes of the unit-cell geometries are shown in Figure 1.
Moreover, two different spatial configurations of the unit-cells were investigated. Fundamentally, both configurations were based on a uniform periodical assembly of the unit cells along three orthogonal axes. However, one version (denoted as the “direct” version) consisted of the direct interconnection of the neighbouring cells in the vertices of the triangular faces, while the second version (denoted as the “stem” version) was based on the interconnection of the neighbouring cells in the vertices of the rectangular faces via additional inserted beam element-stems. Thus, four different structures illustrated in Figure 2 were analysed in this study.
The 3D-printed specimens of the structures, each containing 27 unit-cells uniformly distributed in 3 × 3 × 3 configuration, were additively manufactured with the utilisation of the AM 250 printing device (Renishaw, UK). The LPBF technique was applied in the manufacturing process, where 50 µm thick layers of powdered austenitic stainless steel (SS316L-0407) with granularity in the range 15–45 µm were melted according to parametric CAD models of the structures with a chessboard scanning strategy and 200 W maximum power of the laser beam. The nominal density of the base additively manufactured material ρ 0 is 7.79 g/ cm 3 and the yield strength is 494 MPa.
The average dimensions of the AM specimens together with values of relative density ρ r and porosity of the structures with respect to the density of the base material used for the production of the specimens are listed in Table 1. The overall dimensions were given by the requirements resulting from the geometry of the SHPB apparatus and the resolution of the manufacturing method. However, the CAD models had overall dimensions on average 1.5% greater than the AM specimens and the designed nominal strut/plate thickness was on average 53% lower than the thickness of the AM specimens. In the first case, the deviations result foremost from the shrinkage of the structure due to temperature changes during the fabrication process. The deviations in the nominal strut/plate thickness result mostly from the limitations of the fabrication method such as the printing resolution, applied scanning strategy, metal powder granularity, and layer thickness. Figure 2b shows the difference between the intended and real geometry of the structure via a detailed picture of the protruded beams in the CAD model (top) and the AM specimen (bottom). The detail of the AM specimen was captured using the secondary electron (SE) imaging method of scanning electron microscopy (SEM). The AM structure exhibited significant deviations in the geometry, especially in the protruded beams where a relatively large amount of material was concentrated compared to the designed parts. Thus, the auxetic behaviour of the specimens could be limited since such behaviour is based on the protruded areas in the re-entrant structures. Moreover, the surface roughness could also affect the crushing behaviour of the structures due to present surface defects.
In total, thirteen specimens of each structure were used in the experimental study; three specimens were tested under quasi-static loading conditions and ten specimens under dynamic loading conditions.
Each of the specimens was manufactured with additional thin plates at its top and bottom faces to enable precise positioning between the loading faces of the testing devices and to preserve boundary conditions in the SHPB apparatus. The outer surface of the plates was treated by fine brushing using a bench-top polishing grinder with an automatic specimen mover (Forcipol 202 and Forcimat 52, Metkon Instruments Inc., Osmangazi/Bursa, Turkey). Furthermore, a thin layer of paint with a speckle pattern was sprayed on the surface of the specimens to achieve a better performance of the DIC tracking algorithm.

2.2. Quasi-Static Experiments

An Instron 3382 (Instron, Norwood, Massachusetts, USA) universal electro-mechanic testing device with a maximum load capacity of 100 kN was used to perform the quasi-static loading. The experiments were displacement driven with a constant loading rate set to 2 mm/min up to a maximum displacement of 10 mm yielding a strain-rate of 0.0015 s 1 . The applied force and cross-head displacement were sampled at 10 Hz frequency. To evaluate the displacement field on the surface of the structures, the experiments were observed with a Manta G-504B (AVT, Nuremberg, Germany) high-resolution monochromatic camera with a TCZR072 (Opto Engineering, Mantua, Italy) bi-telecentric zoom lens at 0.5 fps and a resolution of 2452 × 2056 px. The observed scene was illuminated by a KL2500 (Schott, Mainz, Germany) high-power cold-light LED source. Three specimens of each type were tested under quasi-static loading conditions; thus, twelve quasi-static experiments were performed in total.

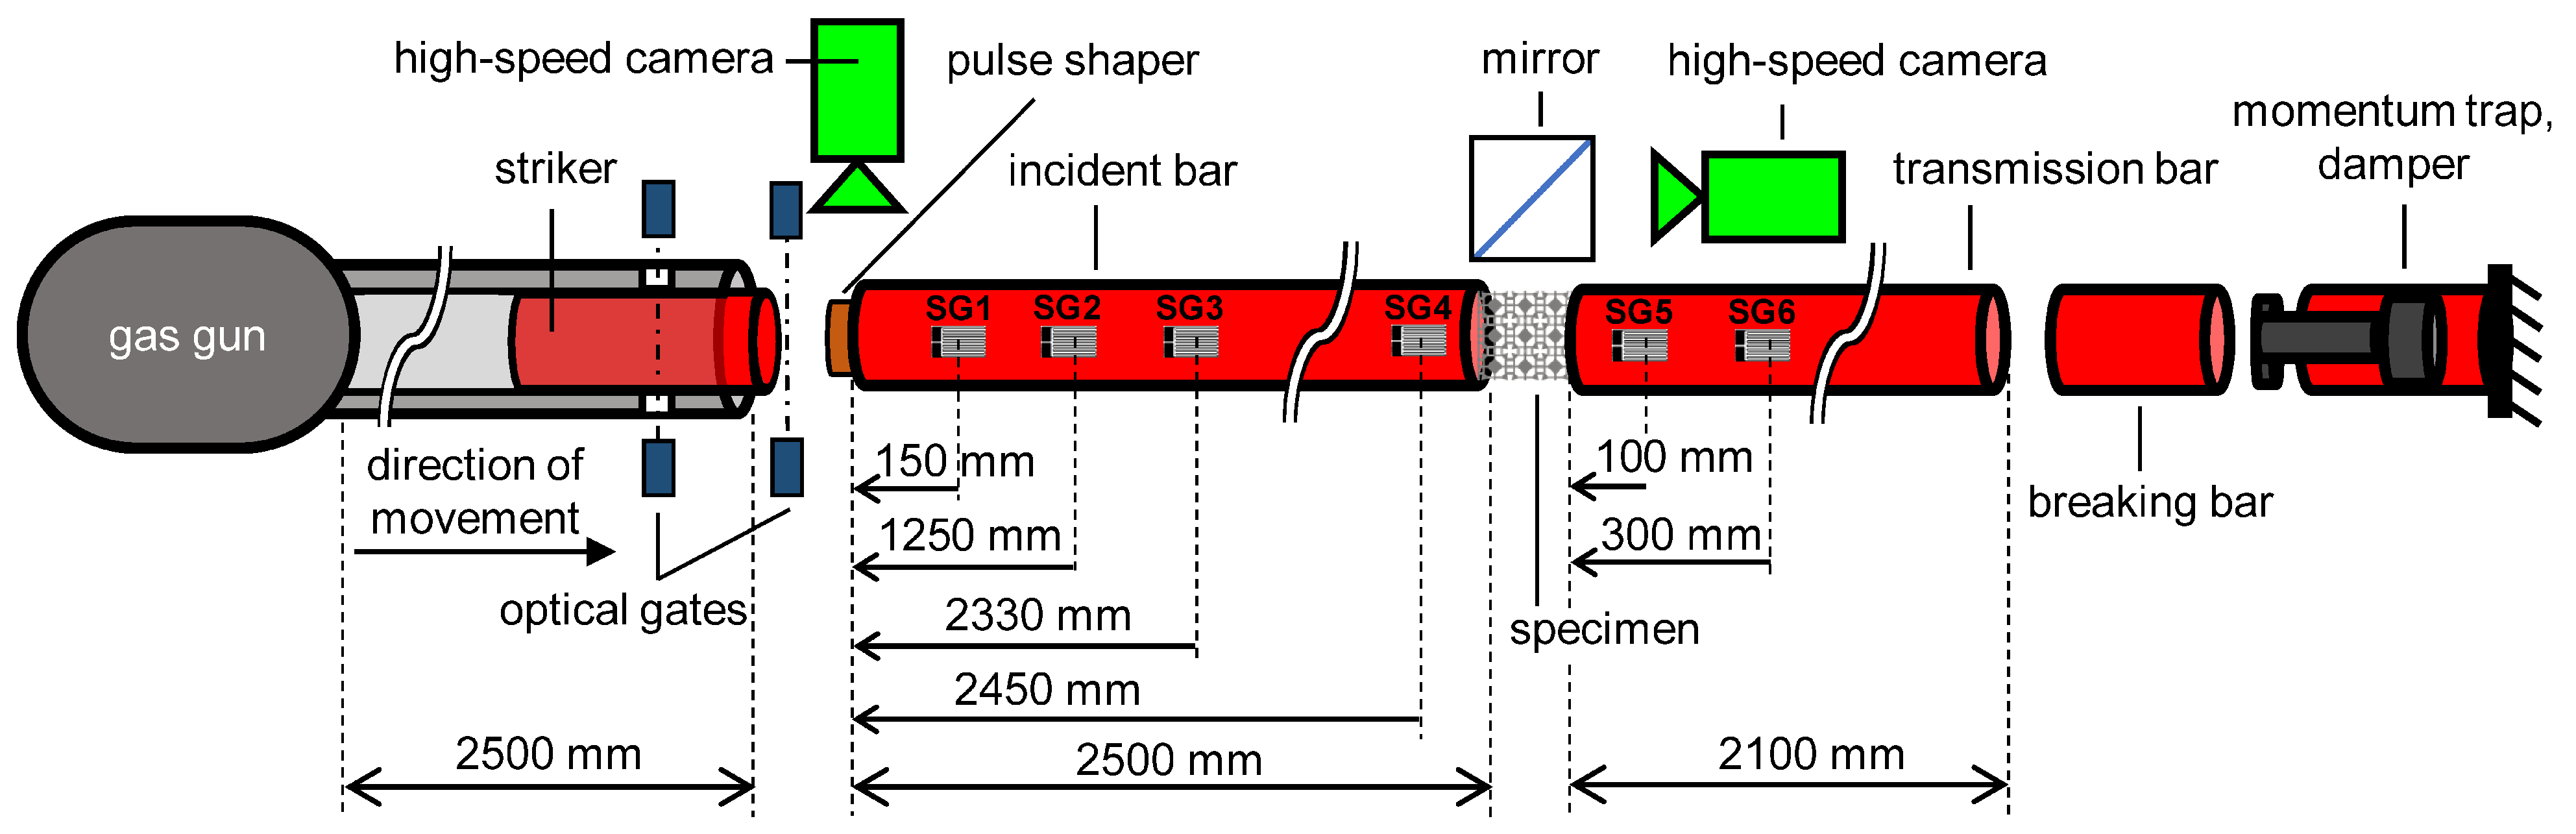
2.3. Dynamic Experiments

The dynamic mechanical response of the structures was tested at two different strain-rates using an SHPB device instrumented with strain gauges and a pair of time-synchronised high-speed cameras. A diagram and schematic overview of the loading device are shown in Figure 3.
The dynamic loading device consisted of a striker bar located in the barrel of a gas-gun, an incident bar, and a transmission bar. All the bars had the same diameter of 20 mm and were made of high-strength aluminium alloy (EN-AW-7075-T6). The length of the incident bar was 2500 mm while the length of the transmission bar was 2100 mm. Precise alignment of the bars was achieved by adjustable stainless-steel housings fitted with polymeric slide bearings (drylin TJUM, IGUS, Rumford, Rhode Island, USA) adjusted with a pair of laser spirit levels. The striker bar was accelerated by a single-stage gas-gun with a maximum pressure of 10 bar generating a strain pulse by an impact of the striker projectile onto the front face of the incident bar. Strain pulse was shaped by a cylindrical copper pulse shaper placed on the front face of the incident bar. To achieve at least 30% of overall deformation, two different striker bar lengths were chosen: (i) 750 mm for an impact velocity of 20 ms 1 yielding an average strain-rate of approx. 1350 s 1 (referred to as a “low-rate” in further text) and (ii) 500 mm for an impact velocity of 48 ms 1 yielding an average strain-rate of approx. 3150 s 1 (referred to as a “high-rate” in further text). The residual energy after the compression of the specimen was dissipated in a damping assembly consisting of a momentum trap and a hydropneumatic damper.
Strain measurements were performed using foil strain gauges (3/120 LY61, HBM, Mainz, Germany) connected in a Wheatstone half-bridge arrangement to compensate for any small deflection of the bars. The signals from the strain gauges were amplified with a gain of 100 (amplifier EL-LNA-2, Elsys AG, Niederrohrdorf, Switzerland) and then recorded using a high-speed data acquisition system (TraNET EPC, Elsys AG, Niederrohrdorf, Switzerland) at a sampling rate of 1 MHz. The experiments were also observed with a pair of time-synchronised high-speed cameras (Fastcam SA-Z, Photron, Tokyo, Japan). The first camera was aimed at the specimen area between the adjacent bar faces via a mirror at an angle of 45 ° and the surface of the bars in the vicinity of the specimen was equipped with a random speckle pattern for the DIC evaluation. The scene was illuminated using a pair of high-power LED lights (Multiled QT, GS Vitec, Bad Soden-Salmünster, Germany). The second camera was aimed at the interface of the incident bar and the striker bar (also equipped with a random speckle pattern on both bars allowing for the DIC evaluation) to capture the initial strain pulse. Illumination of this scene was performed by a single high-power LED light (Veritas Constellation 60, Integrated Design Tools, Inc., Pasadena, California, USA). Both cameras were set to a frame rate of 180 kfps and a resolution of 384 × 200 px. Triggering of the data acquisition systems and cameras was performed using a pair of short-reaction-time through-beam photoelectric sensors (FS/FS 10-RL-PS-E4, Sensopart, Wieden, Germany) allowing for the estimation of the impact velocity.
The number of strain-gauge measuring positions varied for low- and high-rate experiments. For the low-rate tests, four measuring points on the incident bar and two points on the transmission bar were distributed according to the diagram in Figure 3. For the high-rate experiments, only two locations on the incident bar (SG1, SG2) and one location on the transmission bar (SG6) combined with optical measurement using high-speed cameras were used. The first set of experiments at the high rate was successfully measured using strain gauges. However, further high-rate experiments were observed only optically as the strain gauges were repeatedly unbonded due to their extreme loading during the high-velocity impacts. As is demonstrated further in the text, all results of the strain gauges were in full agreement with the DIC results. Thus, only the DIC was used to evaluate the high-rate experiments when the strain gauges were no longer available.
To reveal a possible strain-rate sensitivity of the mechanical response of the structures, five specimens of each type were tested at two different strain-rates. In total, forty experiments under dynamic loading conditions were conducted in this study.

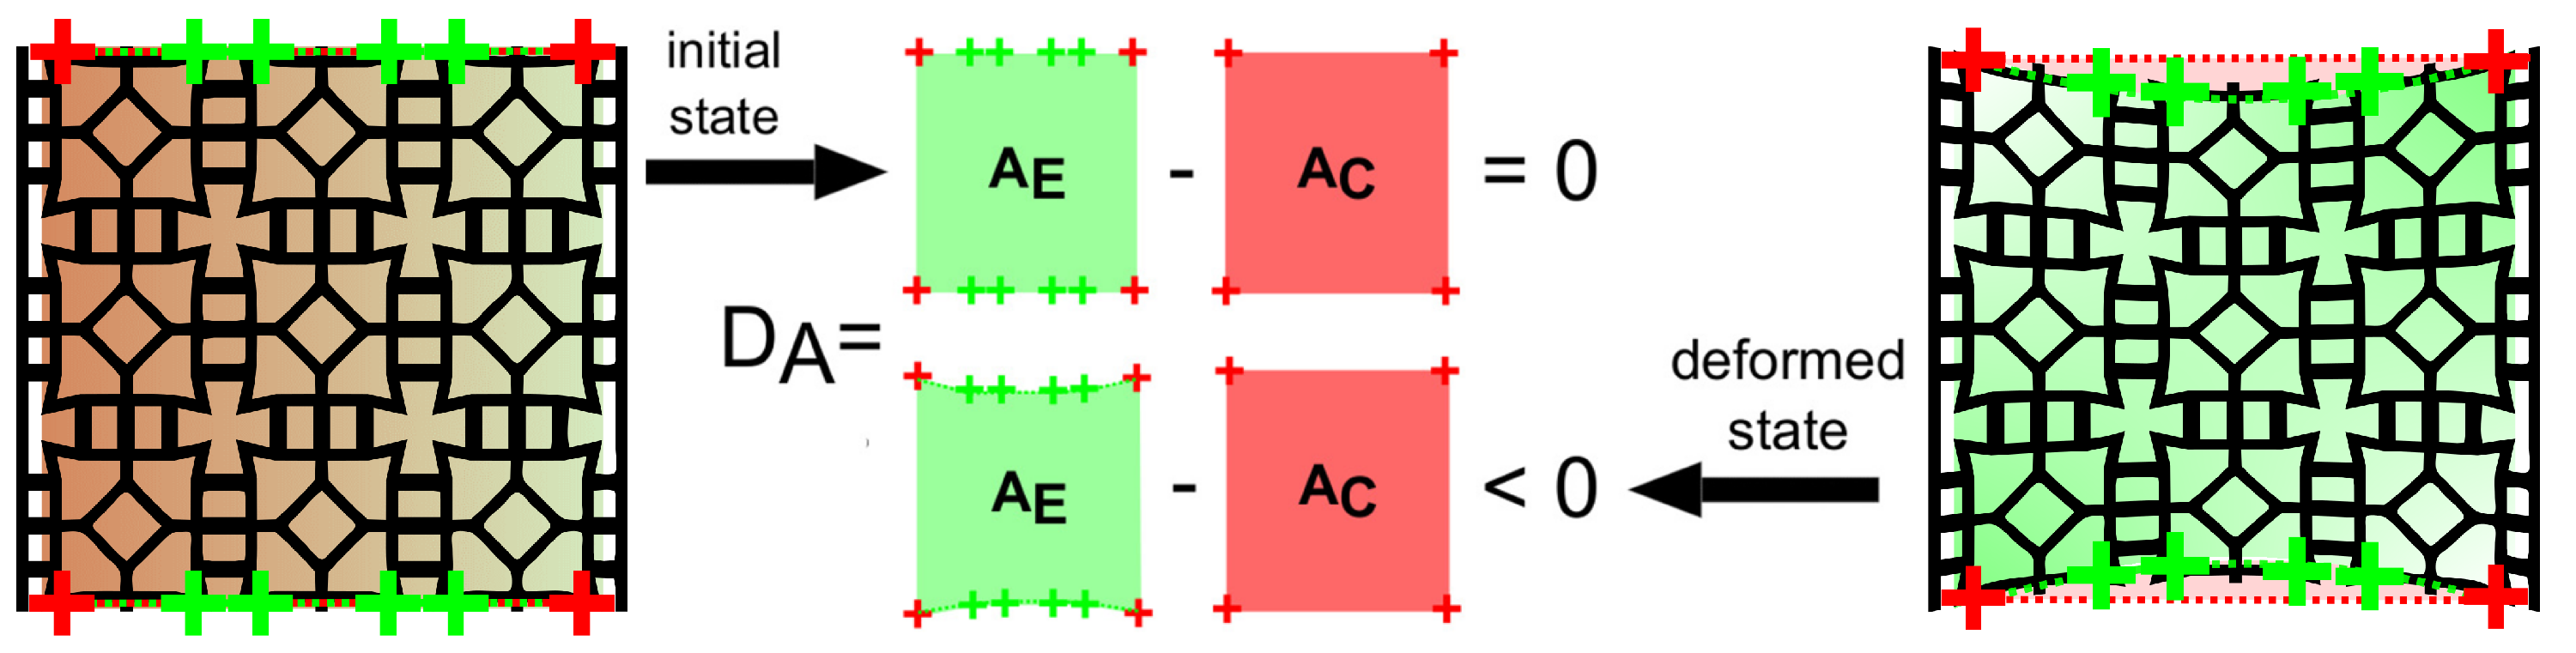
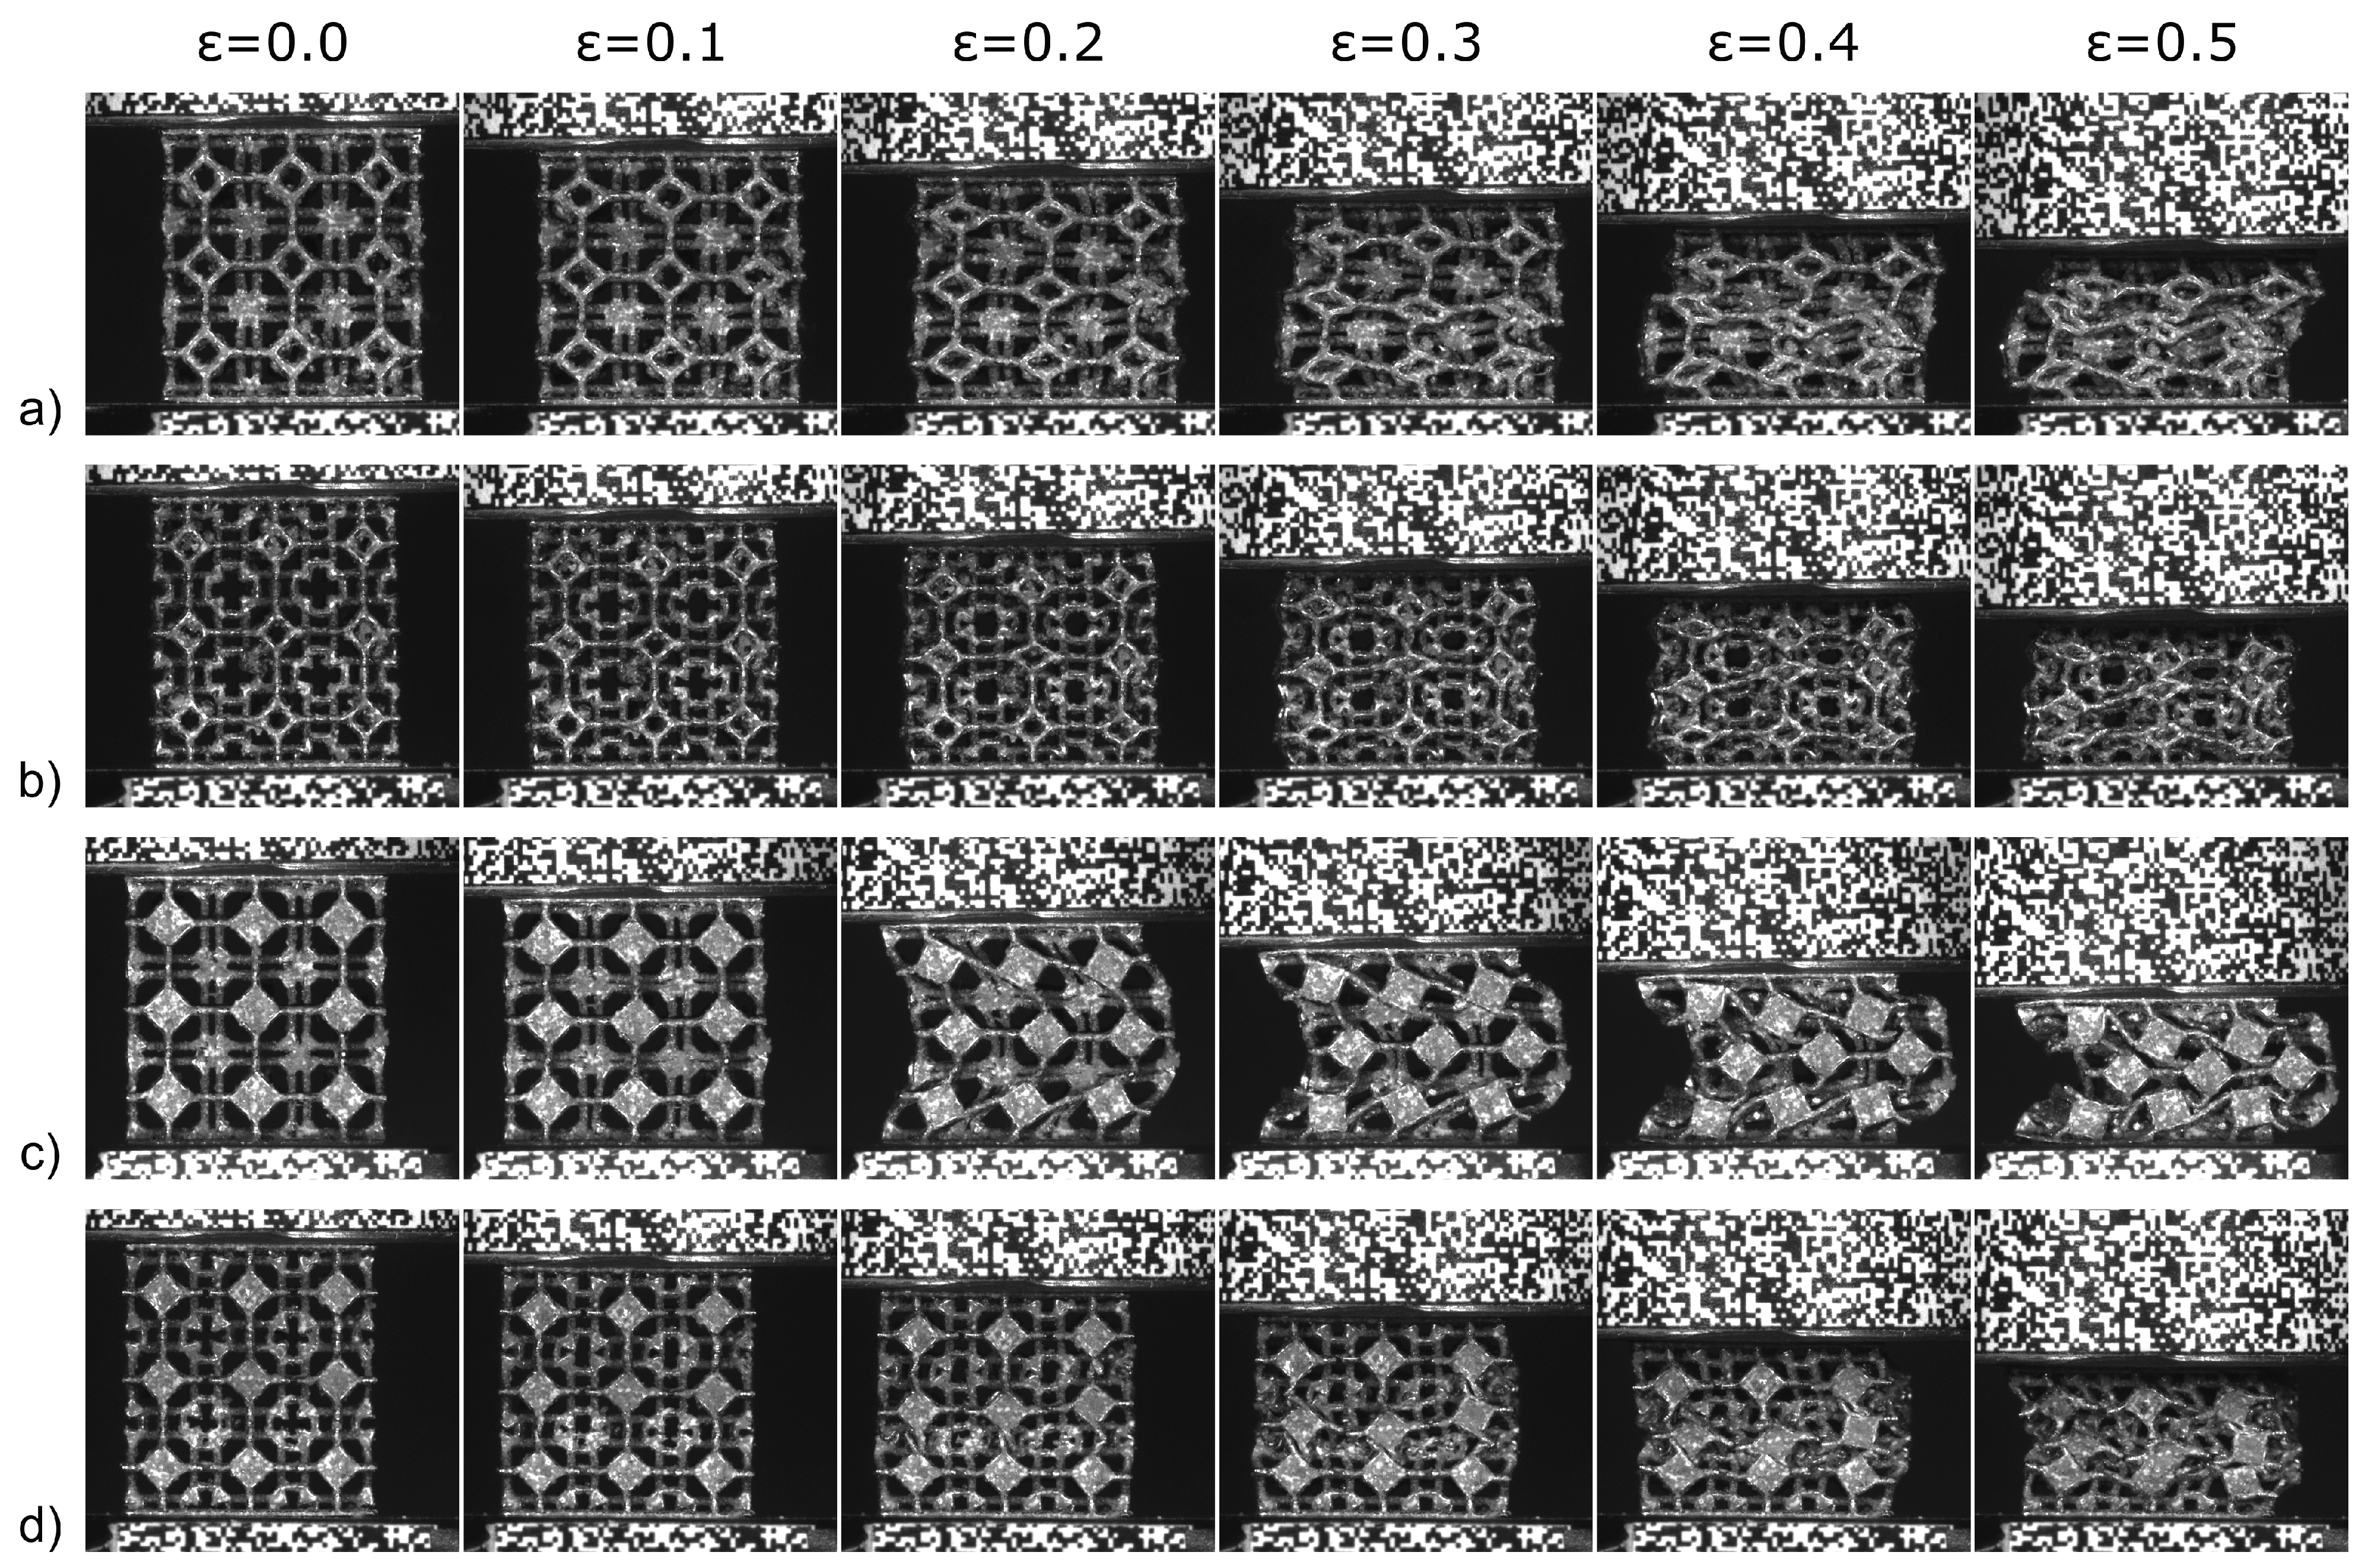
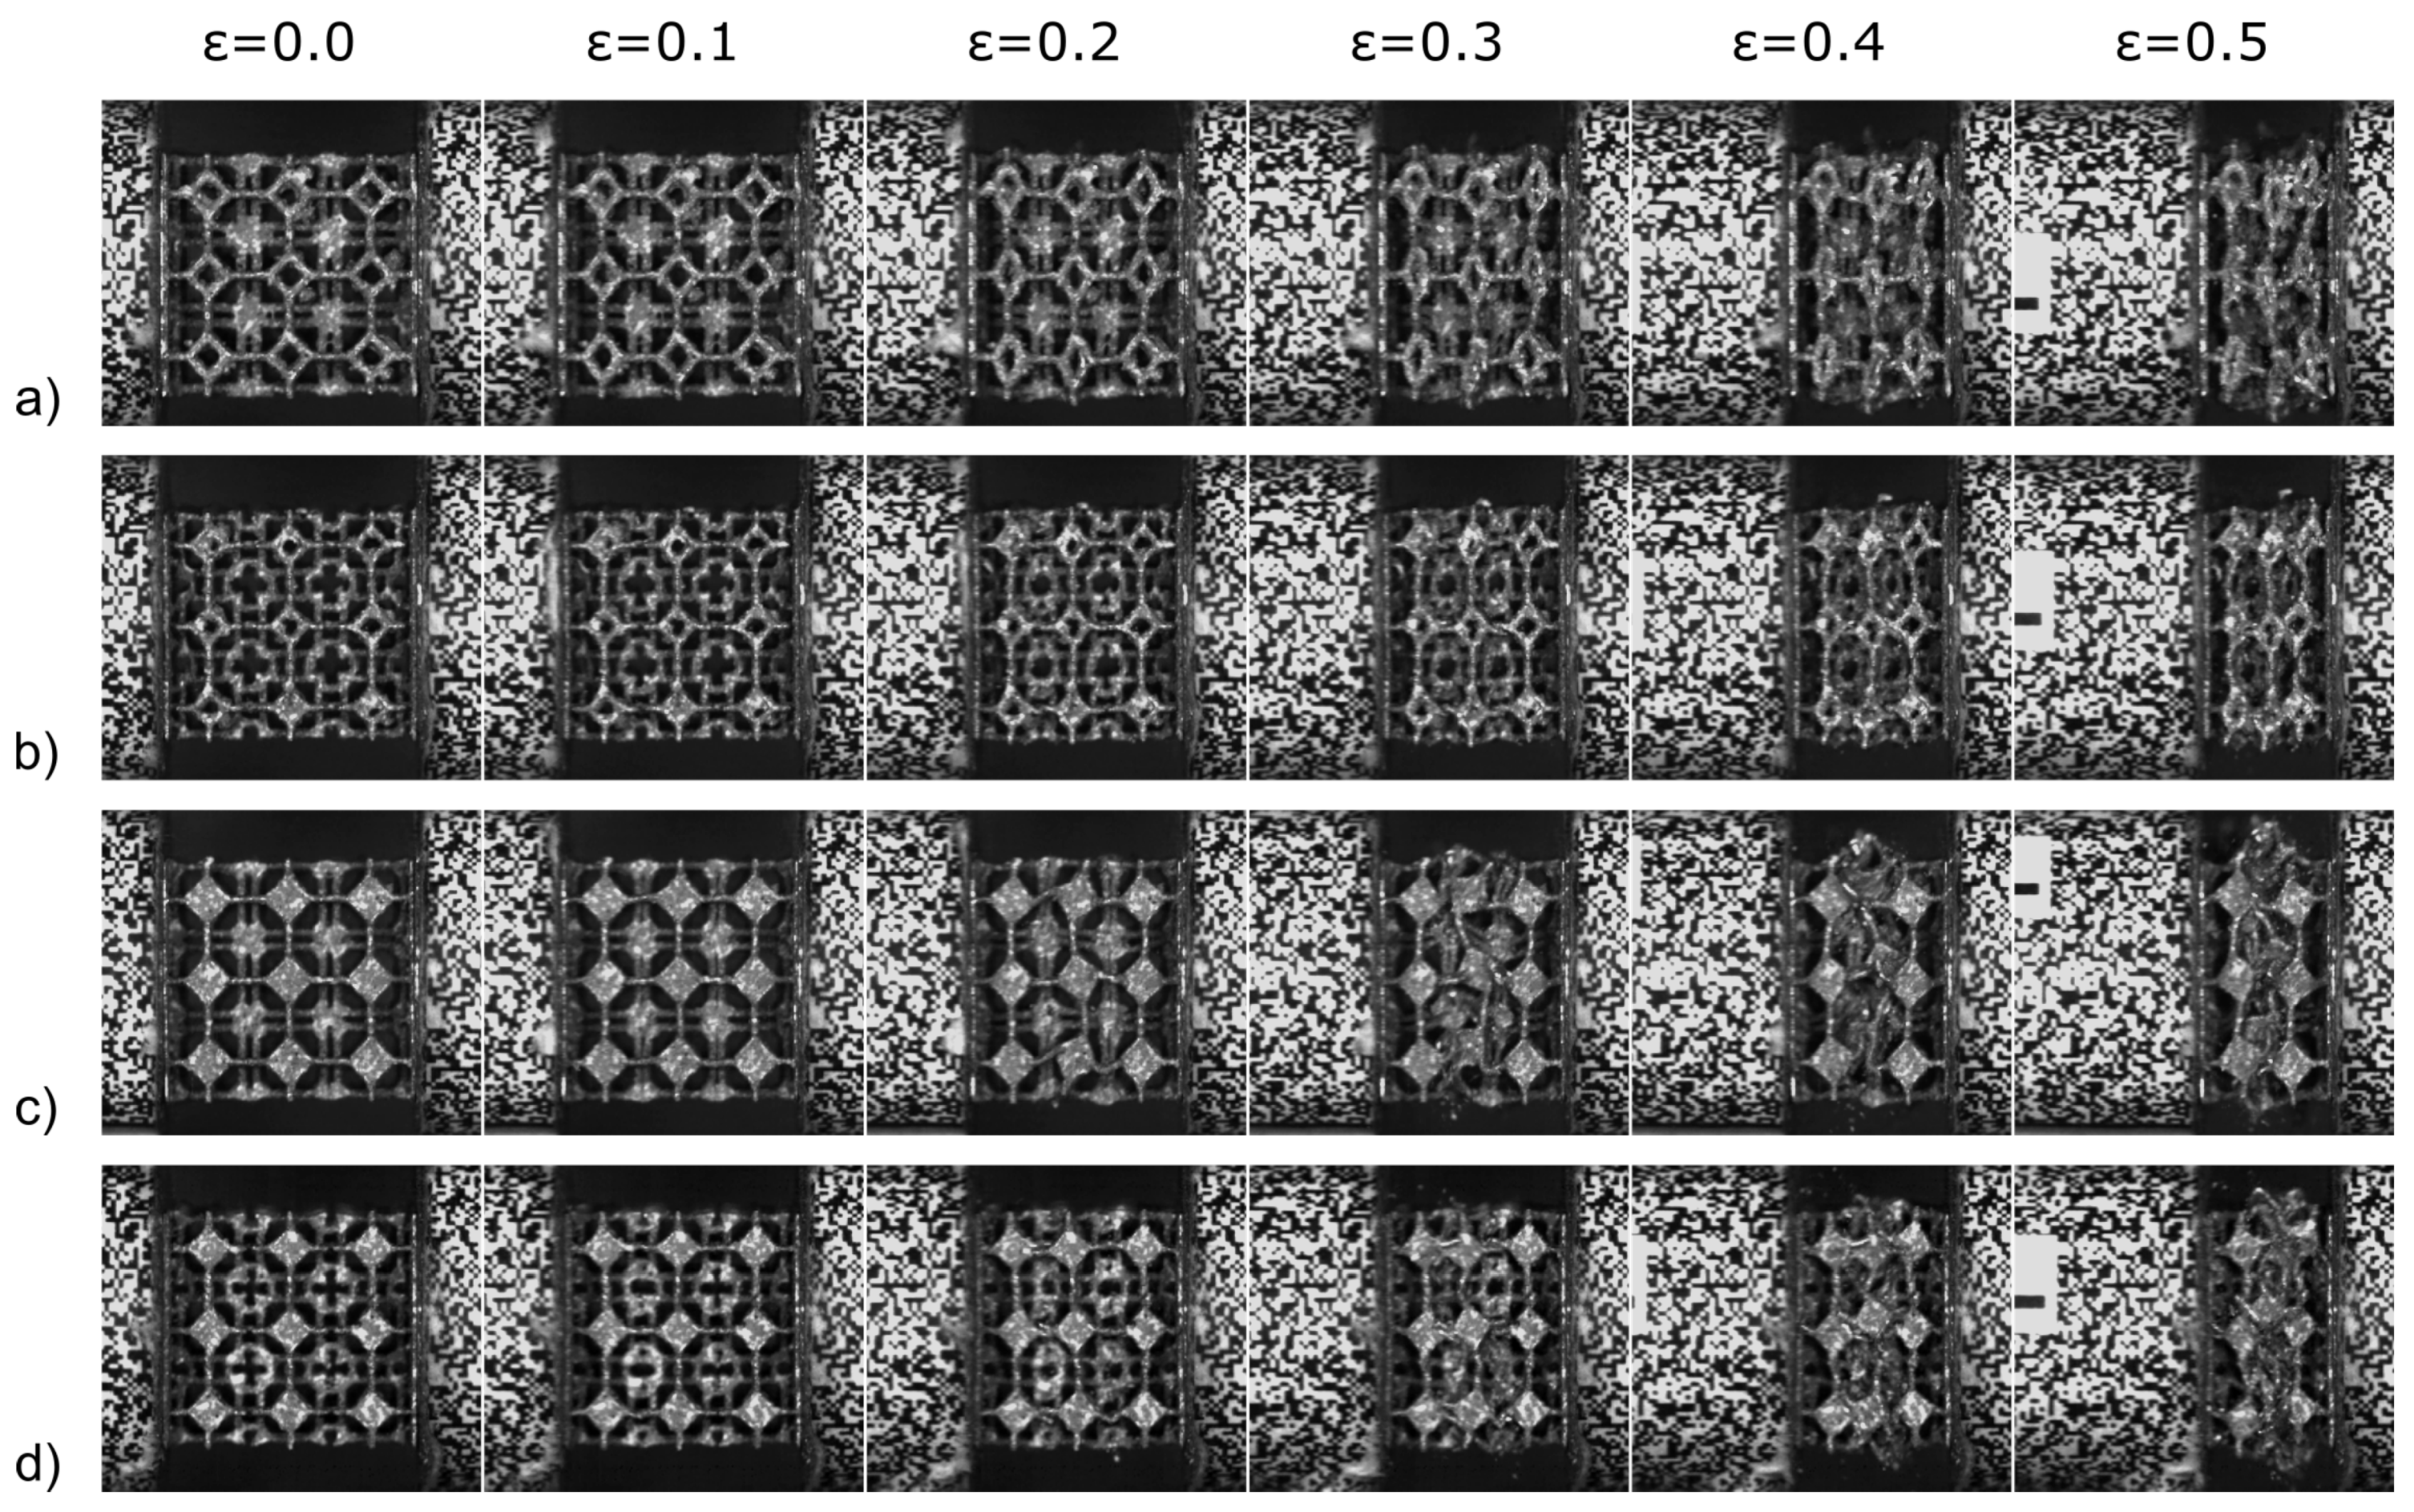
2.4. Digital Image Correlation

The camera recordings from both the quasi-static and dynamic experiments were exported to PNG format with lossless compression and subjected to a DIC analysis to evaluate the captured displacements. DIC is an image processing method that uses tracking and image registration techniques to measure changes in a sequence of images. It is based on the tracking of chosen characteristic correlation points in the image sequence, which captures the process of deformation of the specimen surface [30].
In this study, an in-house-developed DIC software tool compiled using Python programming language and OpenCV library [31] was used for the evaluation of displacement, strain, and velocity fields on the observed surface of the specimens and bars. The DIC tool was implemented as a two-step procedure to achieve sub-pixel tracking precision. First, the correlation was evaluated at the pixel level employing template matching with the use of the sum of squared differences (SSD) method. Then, the pixel level correlation was interpolated using a third-order bivariate spline over the pixel grid. The minimum value of the interpolated bivariate spline indicated the best match (i.e., minimum difference) and, for the minimization of the bivariate spline, the Broyden–Fletcher–Goldfarb–Shanno (BFGS) [32] algorithm was used.
Additionally, the DIC algorithm was applied to evaluate the displacements of the bars during the SHPB experiments due to the failure of the strain gauges in high-rate experiments where the optical measurements remained the sole source of information for reliable evaluation of the respective experiments.
The DIC procedure was used to evaluate the displacements of selected nodes in the lattice structures. To reveal the anticipated auxetic behaviour and its magnitude, the area difference parameter D A was evaluated according to the definition presented in [33]. The value of D A corresponds to
D A = A E A C ,
where A E represents the area of a polygon defined by the actual locations of the edging points of the correlation grid placed in the nodes of the lattice structure and A C represents the area of a trapezoid defined by the four corner points of the current correlation grid. Corresponding pixel sizes for the given sequences of camera recordings from the quasi-static and dynamic experiments were used to express the area difference in mm 2 . According to the relation (1), auxetic behaviour of a structure yields a negative value of the area difference. The principle of the calculation of D A is shown in Figure 4.

3. Results

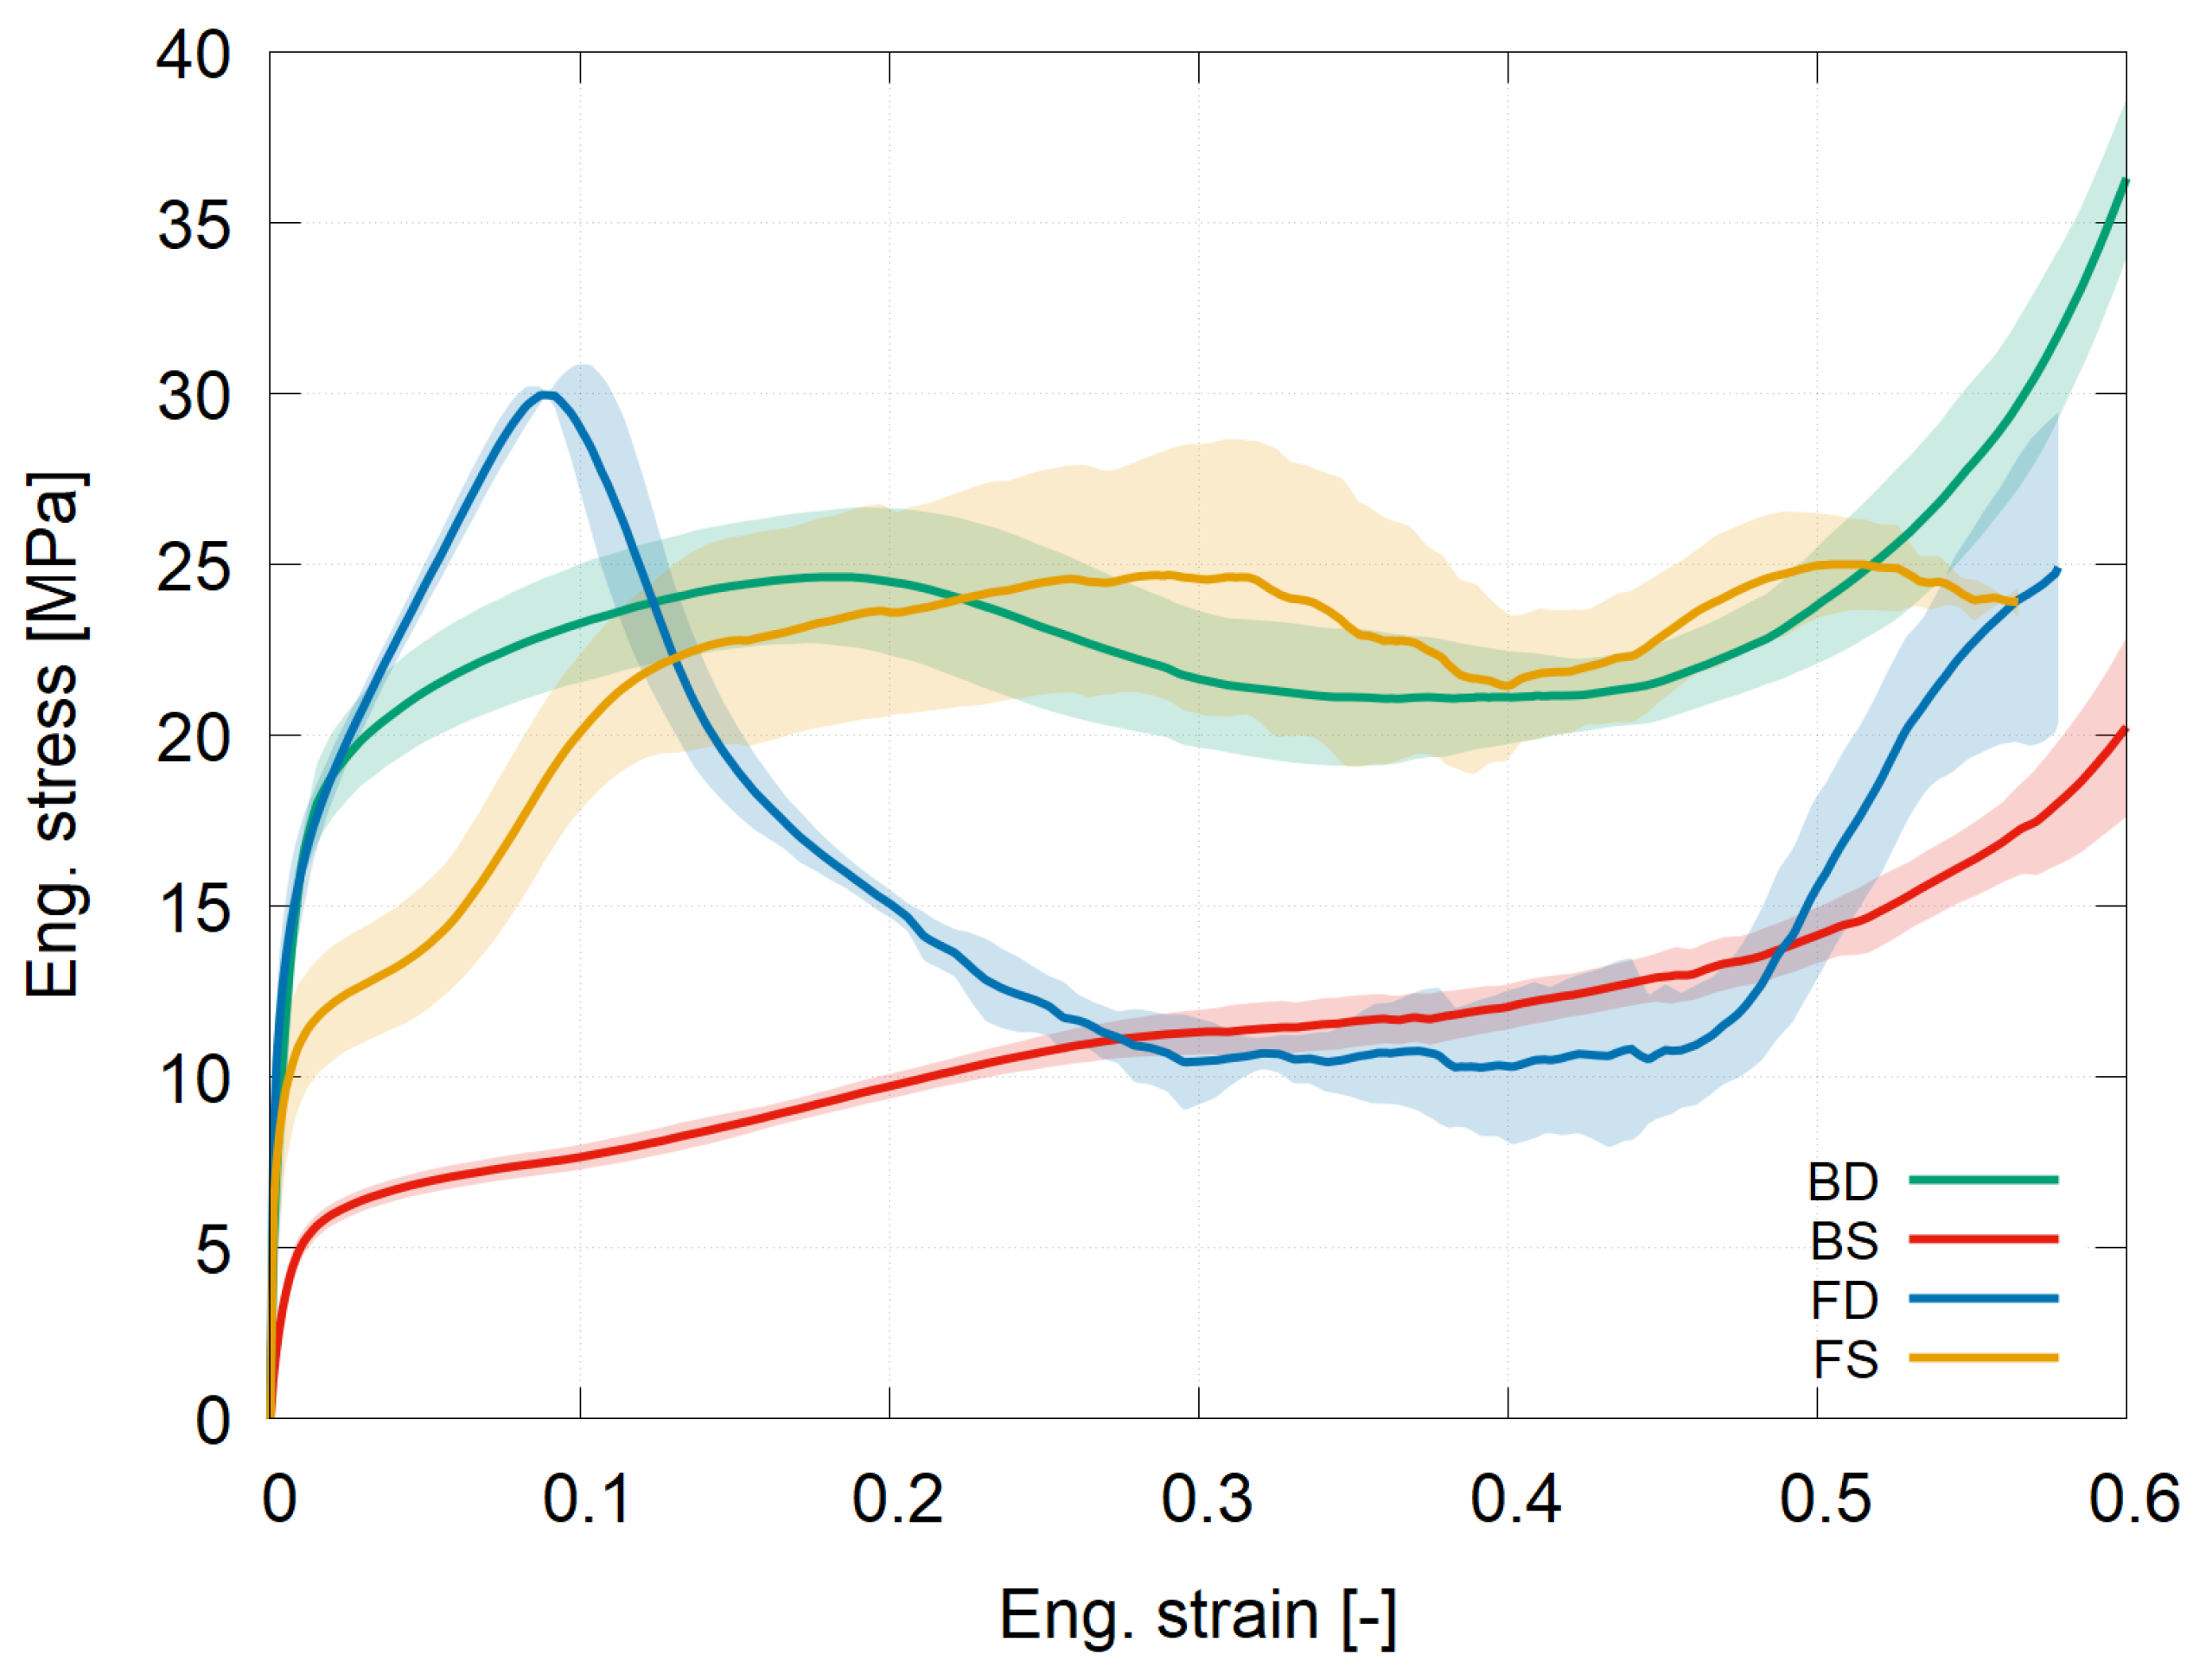
3.1. Fundamental Mechanical Behaviour

The mechanical response of the investigated structures to quasi-static uni-axial compressive loading was expressed by the average engineering stress–strain diagram as illustrated in Figure 5. It can be seen that the deformation behaviour differed significantly depending on the type of lattice. Thus, it was possible to assume that the specific version of the unit cell as well as the method of their interconnection affected the mechanical response in a unique way.

3.1.1. Beam Direct Structure

The beam direct (noted as “BD”) structure exhibited the highest value of initial yield stress among the tested structures corresponding to 18.9 MPa. The stress plateau region between 2.1% and 56% of engineering strain includes a stress peak at 20% of engineering strain where the maximum stress of 24.6 MPa was reached. This peak was followed by a stress decrease occurring due to a loss of stability of the structure, which was revealed by visual inspection (see Figure 6a). The unit cells in this configuration tended to rotate around the relatively rigid interconnecting struts between the individual layers of cells, which resulted in a buckling mode of deformation developing in the structure for strains larger than 20%.

3.1.2. Beam Stem Structure

The beam stem (noted as “BS”) structure exhibited the lowest stiffness among the tested structures with an initial yield stress of 6.2 MPa. Then, a plateau stress region in the range 1.7% to 58% of engineering strain followed by a transition to a densification region was observed. The smooth stress–strain curve without stress oscillations as well as the visual inspection of the specimen during the experiment (captured in Figure 6b) revealed a uniform deformation mechanism without any abrupt collapses of the layers of cells or crushing of struts in the structure leading to a compressive response similar to closed-cell metal foams.

3.1.3. Facet Direct Structure

The mechanical response of the facet direct (noted as “FD”) structure differed from the other structures to the greatest extent. After the initial yield point at 17.1 MPa, however, the transition to plastic deformation was not followed by a typical plateau stress region, but another increase in the value of stress up to 30 MPa at 9% strain occurred. The local maximum of stress was then was followed by a stress release region between 9% and 30% of the engineering strain where the value of stress decreased to approximately 10 MPa. This was followed by a relatively short plateau stress region up to 46% of engineering strain and then a transition to densification. A visual inspection of the deformation processes in the structure revealed a significant buckling of the struts (see Figure 6c). This behaviour results from a poor design of the interconnecting nodes between unit cells in the direct version of the structure, which did not allow a uniform folding of the adjacent layers of the structure, rather leading to a loss of stability during the compression. Overall, the deformation response of this assembly shows similarity to the quasi-static behaviour of two-dimensional and three-dimensional re-entrant honeycomb auxetic lattices [34].

3.1.4. Facet Stem Structure

The facet stem (noted as “FS”) structure exhibited deformation behaviour similar to the BD assembly. After the initial yield stress of 11.6 MPa, the stress monotonically increased to a stress peak where a local stress maximum of 24.6 MPa was reached at 31% of engineering strain. The start of a plateau stress region occurs at 12% of the engineering strain and continues up to the end of the experiment at 56% of the strain. The deformation response may be explained by a specific deformation process of the structure (see Figure 6d). The compression of the structure initially caused bending of the interconnecting struts resulting in rotation of the triangular facets in the unit cells. This resulted in the decrease in slope after the initial yielding of the structure. Then, the neighbouring unit cells came into contact via the rotated triangular facets contributing to a repeated increase in the slope of the stress–strain curve. The development of the plateau stress region corresponds to further bending of the interconnecting stem elements up to the final loss of stability of the structure characterised by cyclic stress release due to buckling at strains higher than 31%.

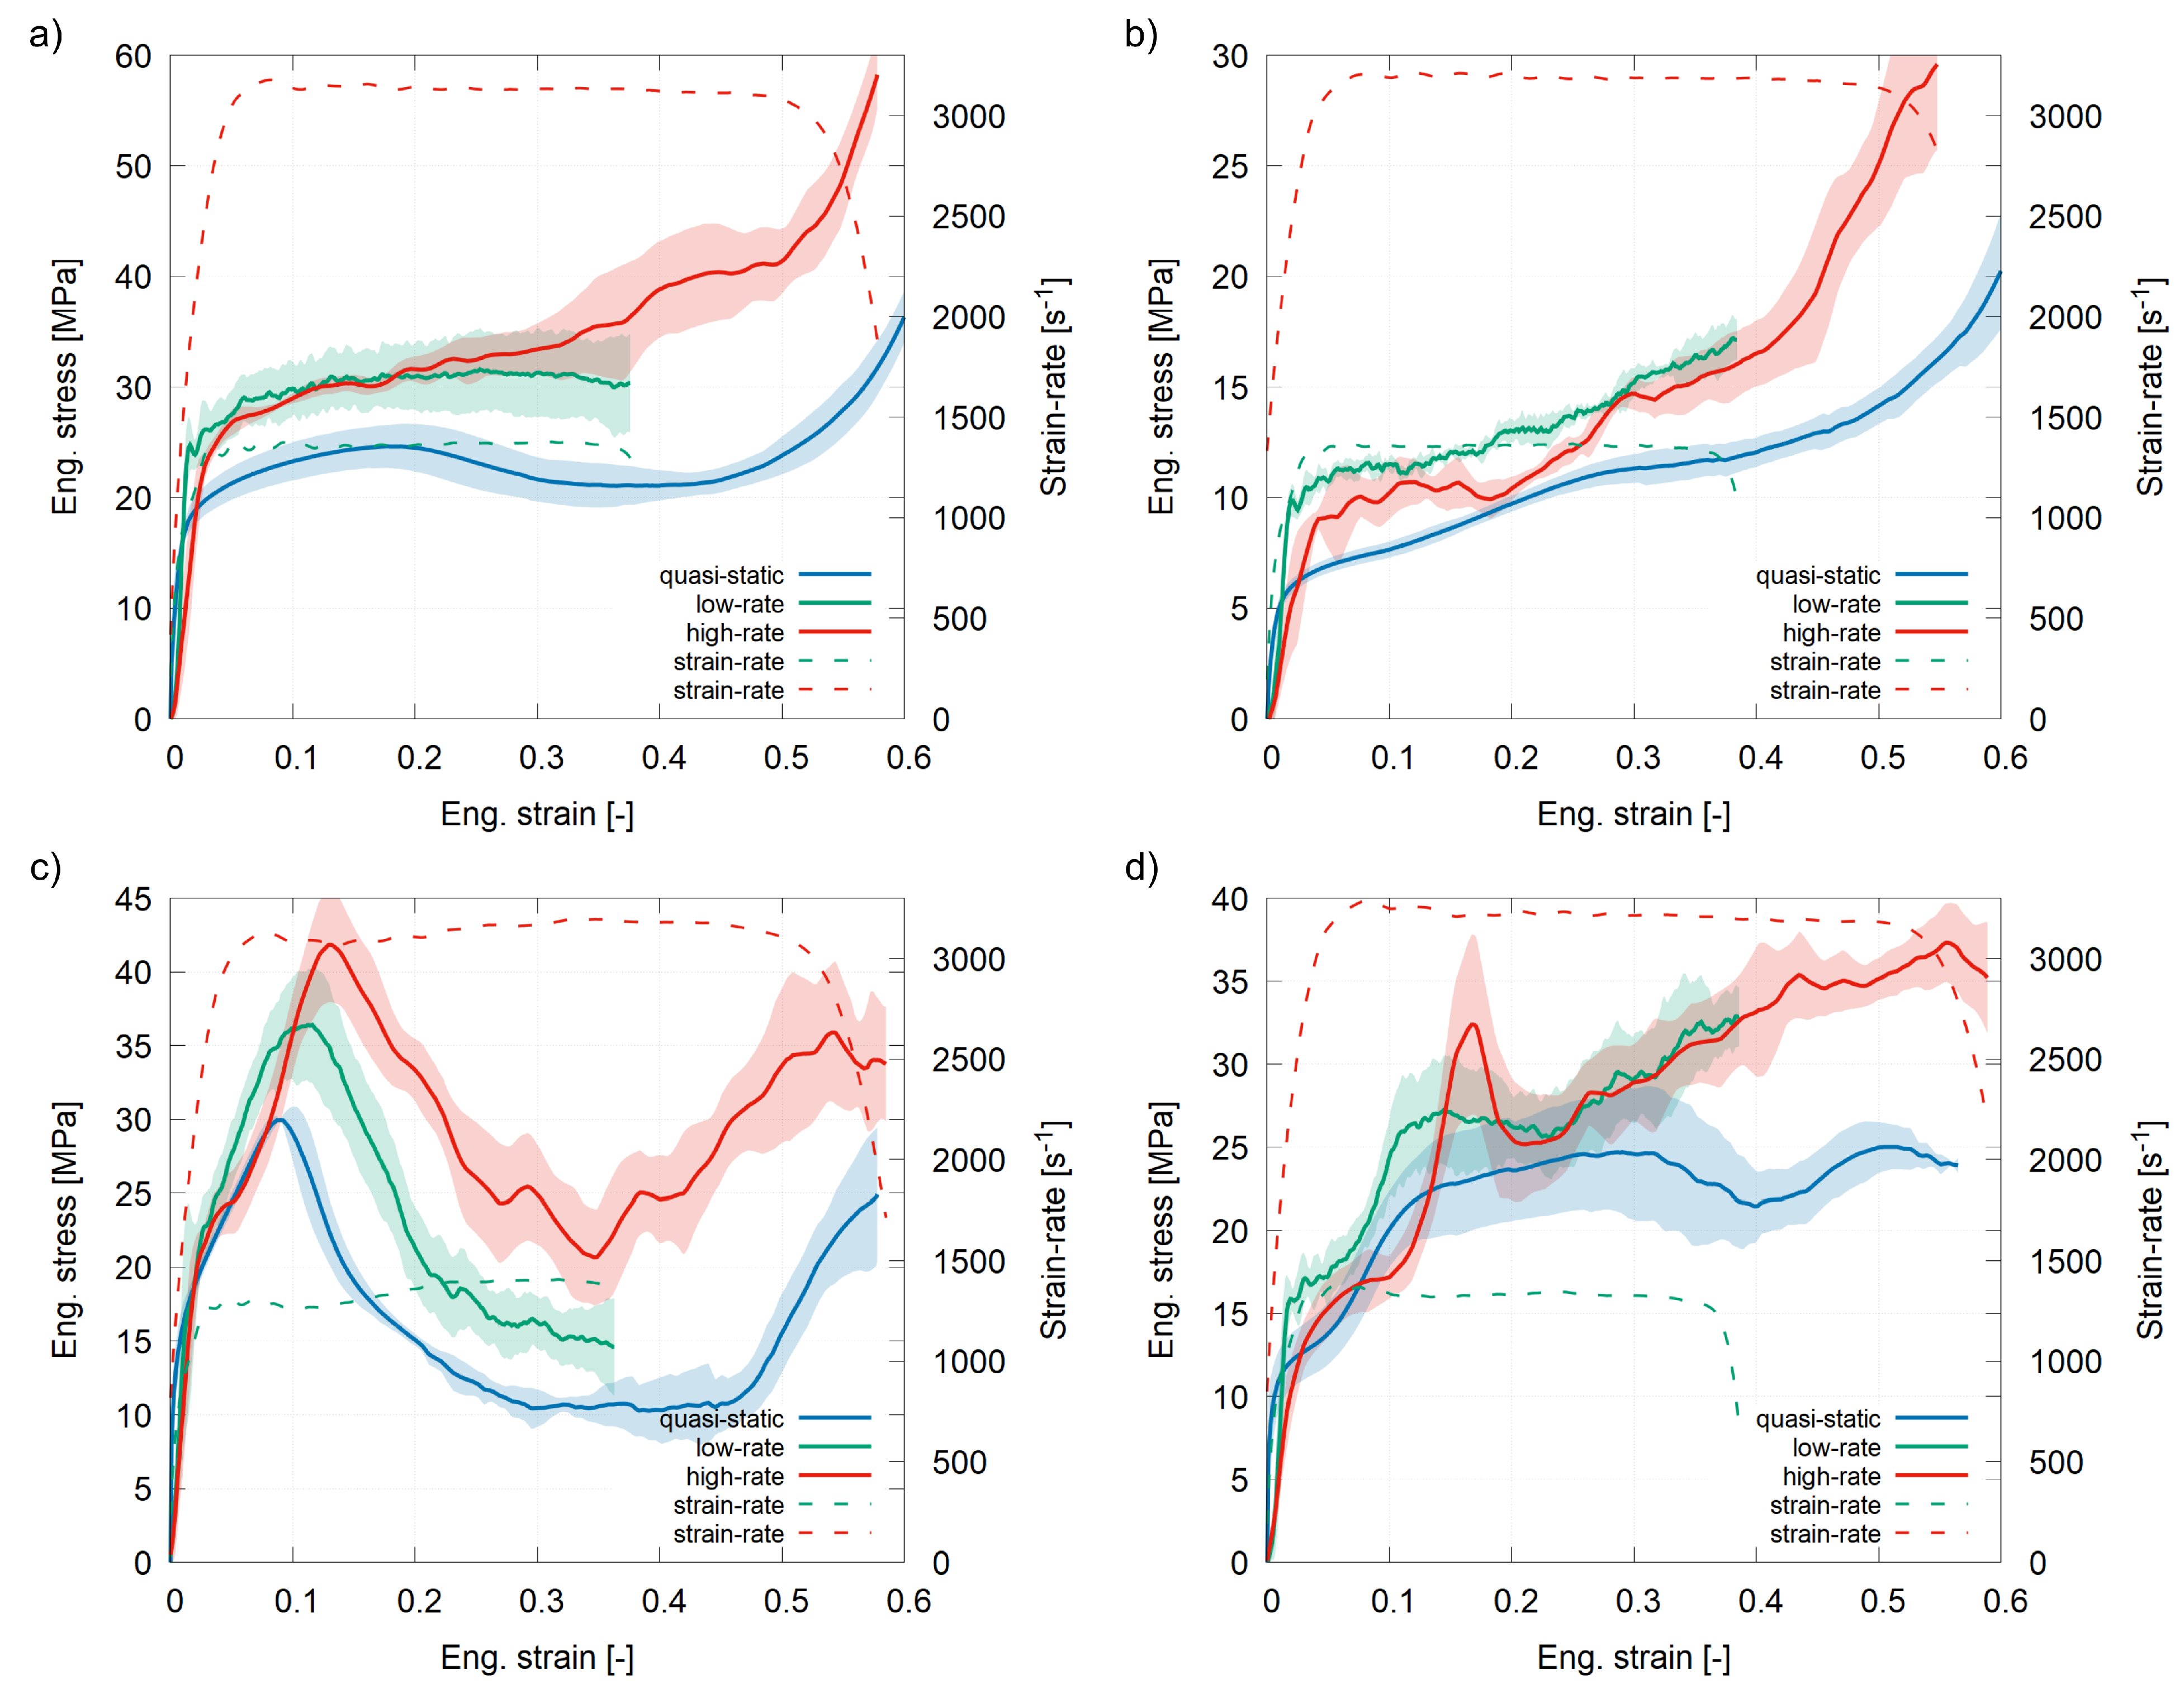
3.2. Strain-Rate Sensitivity

To reveal a possible strain-rate sensitivity of the deformation response, dynamic compression tests using SHPB apparatus were conducted at two different strain-rates. The dynamic experiments were designed and performed to achieve the same strain-rates for all the structures to obtain comparable results. The nominal selected strain-rates were approximately 1350 s 1 (noted as “low-rate”) and approximately 3150 s 1 (noted as “high-rate”). The average stress–strain and strain-rate–strain diagrams obtained from the dynamic experiments compared to the quasi-static results for the particular structures are shown in Figure 7. A representative series of images showing the crushing behaviour of the structures under impact loading is captured in Figure 8.

3.2.1. Beam Direct Structure

The dynamic mechanical response of the BD structure is captured in Figure 7a. For the low-rate experiment, the maximum deformation measured during the first deformation pulse was 37%. The recorded initial yield stress value was 24.8 MPa, which corresponds to an increase by 33.3% in comparison with the quasi-static result. The initial yielding was followed by a plateau stress up to the maximum of the measured strain. The average value of plateau stress was 36% greater than the value acquired from the quasi-static experiments. For the high-rate experiments, the maximum deformation reached during the initial deformation pulse was 58% and the yield stress corresponded to the value of 26.3 MPa, which is 41.2% higher than the quasi-static response. The average plateau stress increased by approximately 47.4% in comparison with the quasi-static results. Moreover, the high-rate deformation curve differed notably from the quasi-static response in terms of the slope of the plateau stress region, which in the high-rate case remained approximately constant up to the densification region without any distinguishable stress releases. This indicates that the buckling mechanism notably affecting the quasi-static response was less significant during the high-rate experiments, which was also confirmed by the visual inspection (see Figure 8a).

3.2.2. Beam Stem Structure

Figure 7b shows the average stress–strain diagrams obtained for the BS structure. The low-rate experiment was in this case evaluated up to the maximum value of deformation equal to 38.5%. The initial yield stress of 9.9 MPa was recorded during the low-rate experiment, which is 59.7% higher than the value acquired from the quasi-static response. Moreover, in comparison to the quasi-static results, the plateau stress is on average 38.2% higher for the low-rate response. During the high-rate experiments evaluated up to 58.3% of deformation, a stress decrease in comparison to the low-rate experiments occurred. The initial yield stress was 9.2 MPa, which is still 48% higher than the quasi-static response. In addition, the plateau stress was on average 29.8% higher in comparison to quasi-static deformation. The decrease in the values of stress between the low-rate and high-rate experiments was caused by wave propagation through the structure. Impact velocity was, in this case, close to a point where the shock effects and damage localization caused by the strain wave propagation would become very profound (see Figure 8b). As demonstrated further in the text (see Section 3.3), the low mechanical impedance of the cell together with the high impact velocity caused the average stress–strain diagram for the BS structure not to be valid until a strain of approximately 0.3 due to the non-equilibrium state of the SHPB experiment. Therefore, the stress decrease in the initial phase of the stress–strain diagram did not represent the overall mechanical response of the structure.

3.2.3. Facet Direct Structure

The dynamic behaviour of the FD structure is expressed by the stress–strain diagrams captured in Figure 7c. The low-rate experiments were evaluated up to 36.4% of deformation and the initial yield stress recorded at this strain-rate was 19.8 MPa, which corresponds to an increase of 15.8% in comparison to the quasi-static response. The stress peak occurred at 11.6% of the engineering strain and its value was 36.4 MPa, which corresponds to an increase of 21.3% in contrast to the quasi-static loading. The high-rate experiments were evaluated up to 59% of deformation. The yield stress recorded at the high-rate was 24.1 MPa, which is 40.9% higher than the quasi-static value and the stress peak of 41.83 MPa, which is 36.3% higher than the quasi-static results. The global maximum of stress also occurred at the highest engineering strain of 13.6%. The shape of the dynamic diagrams for both the investigated strain-rates corresponds to the one obtained during the quasi-static loading. Visual inspection of the deformation mechanism arising from the dynamic compression revealed a persisting tendency of buckling for this structure (see Figure 8c). However, the dynamic buckling results rather from a rotation of individual unit-cells around the interconnection nodes corresponding to the quasi-static behaviour of the BD structure—see Figure 6a.

3.2.4. Facet Stem Structure

The results of the dynamic experiments for the FS structure are captured in Figure 7d. The low-rate experiments were, in this case, evaluated up to 38.7%. The initial yield stress was 15.7 MPa, which is 35.3% higher than the value recorded under quasi-static loading conditions. The average stress–strain curve obtained from the low-rate experiments exhibits a similar trend to the quasi-static curve, although a stress increase from 25% of deformation can be observed, indicating that the plateau stress region is significantly shorter in the range 12% to 25% of the engineering strain. The elevated strain rate in this case accelerated the loss of stability of the stem elements between the layers of the unit-cells in the structure, resulting in this shift of the mechanical response in comparison to the quasi-static behaviour. The high-rate experiments were evaluated up to 59.4% of the engineering strain. The initial yield stress was 15.8 MPa, which is 36.2% higher than the quasi-static value. The high-rate dynamic response is typical with a significant stress peak recorded on average at 17.4% of deformation reaching the value of 32.36 MPa followed by a region of rapid stress release. Visual inspection of the camera recordings from the experiments revealed that the stress release region results from a failure of the interconnecting strut elements crushed due to the rapid load increase and localization leading to the collapse of individual layers in the lattice (see Figure 8d).

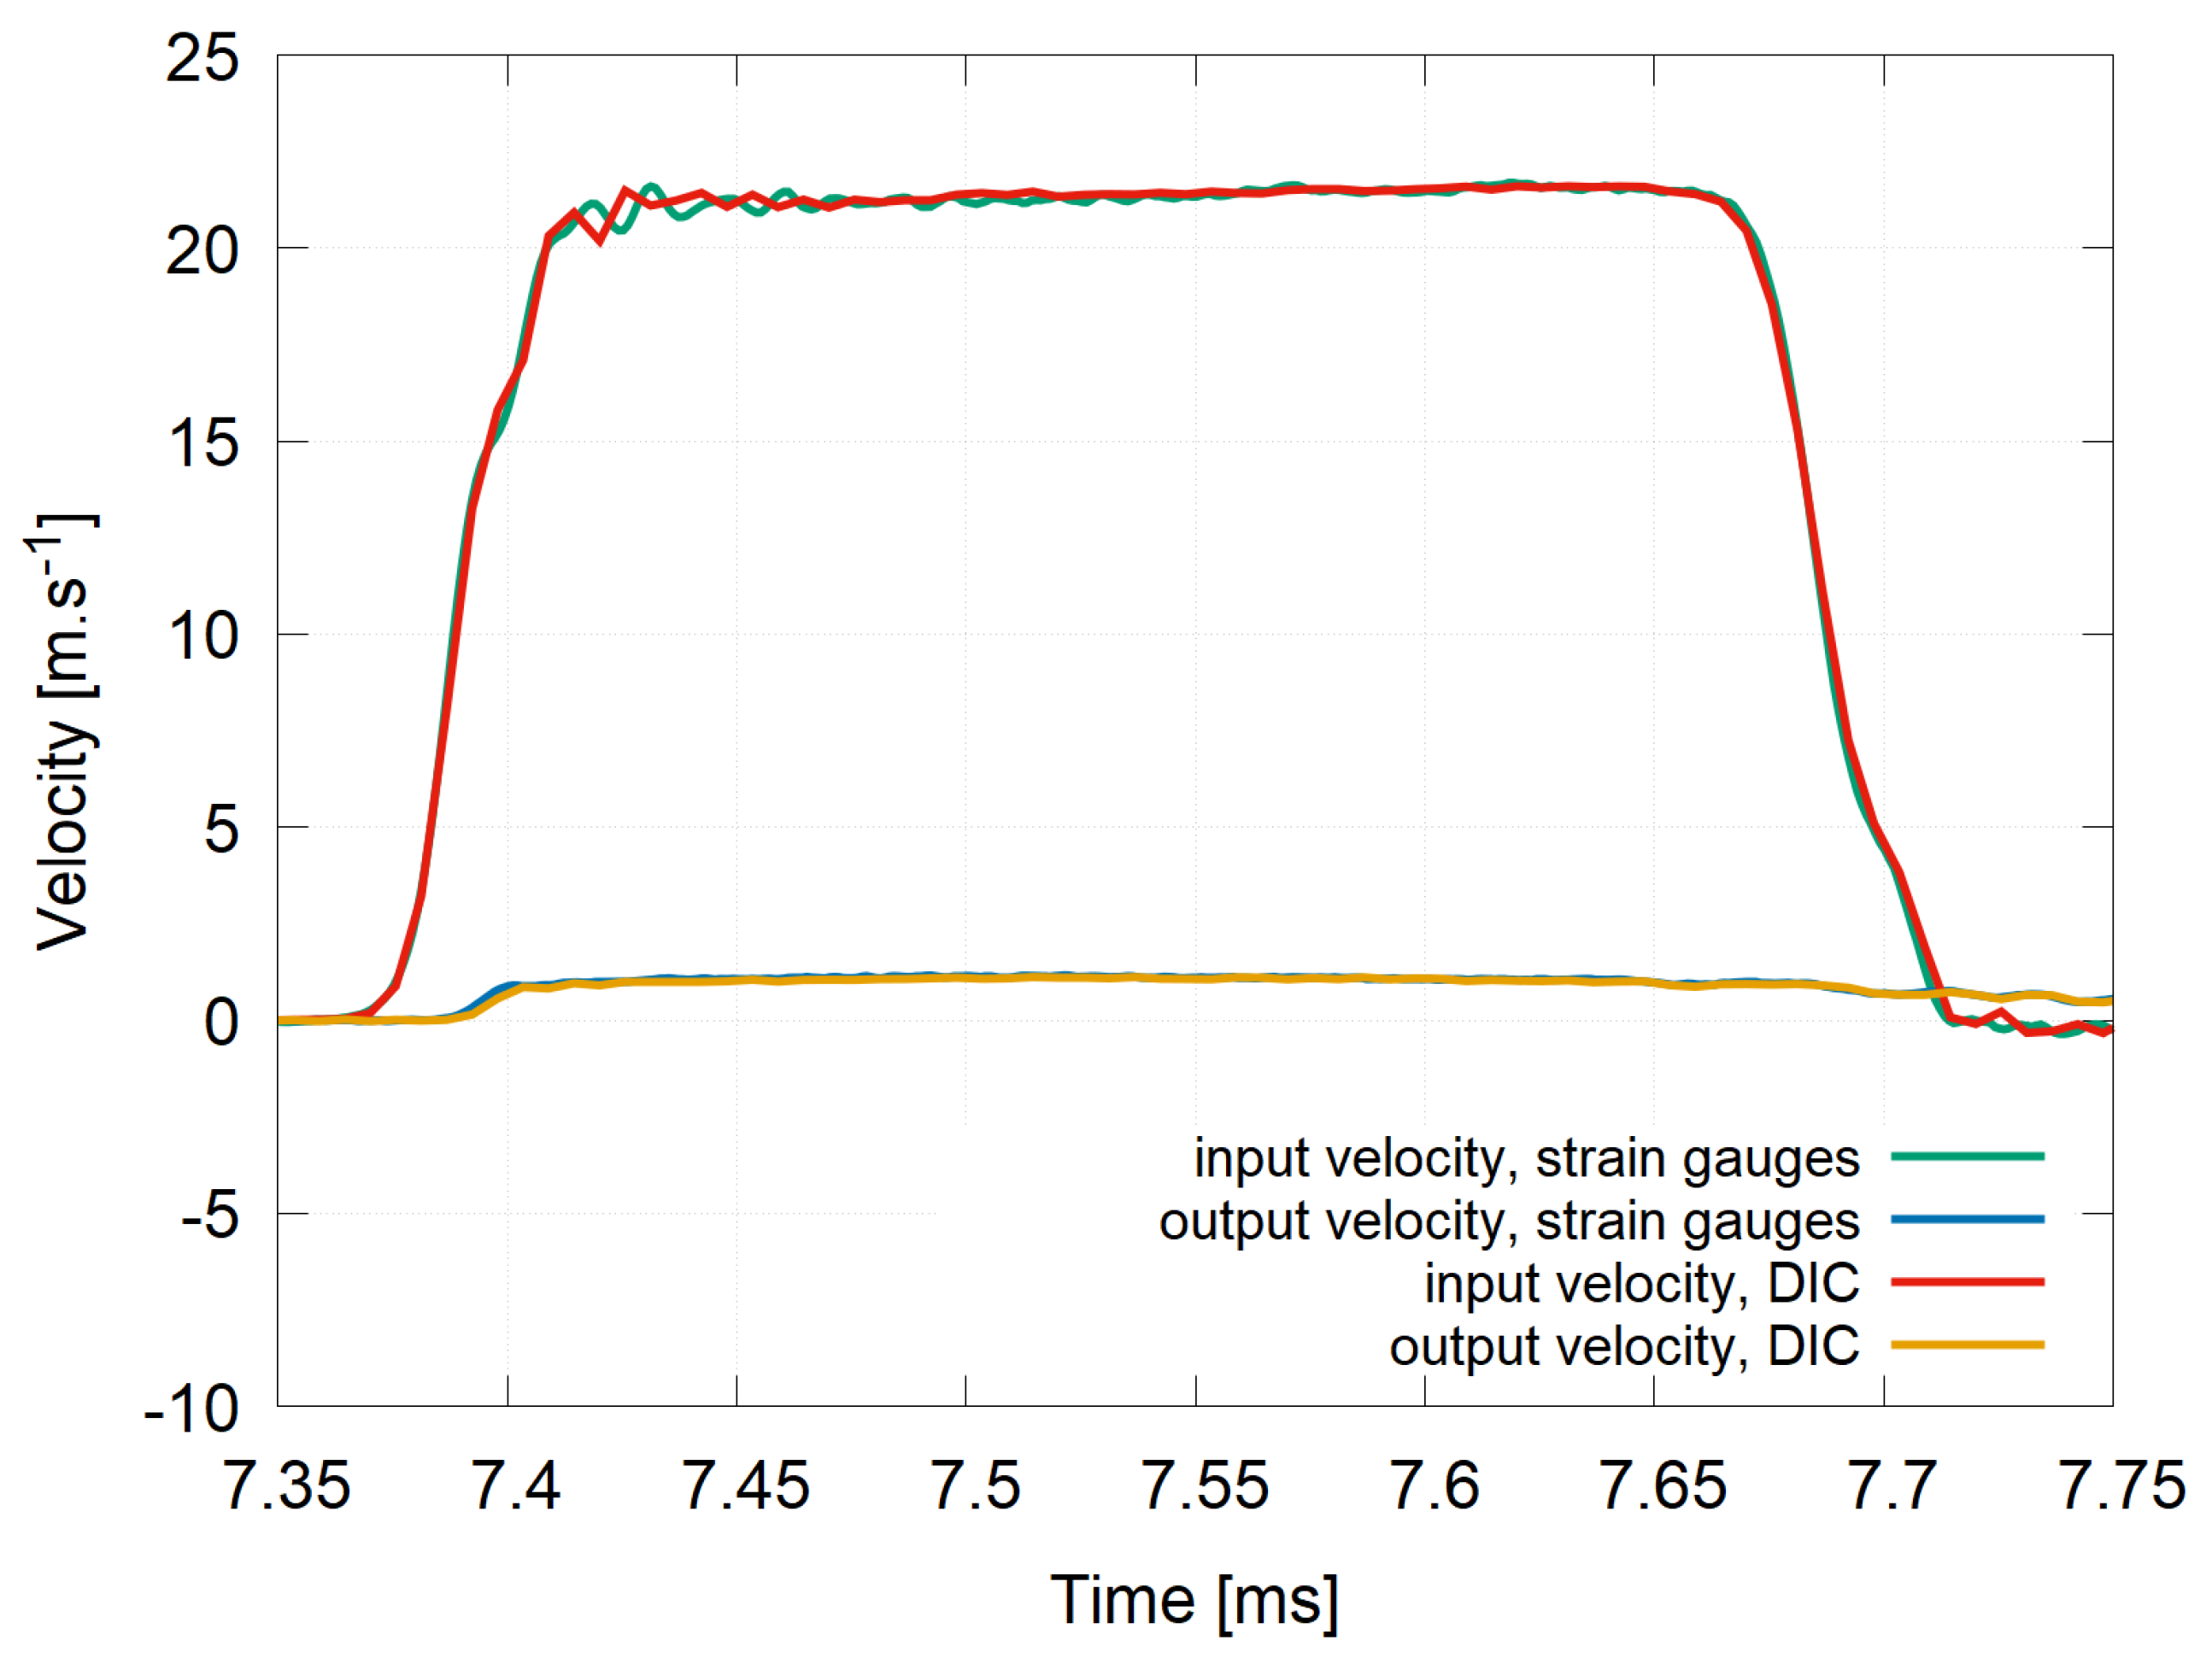
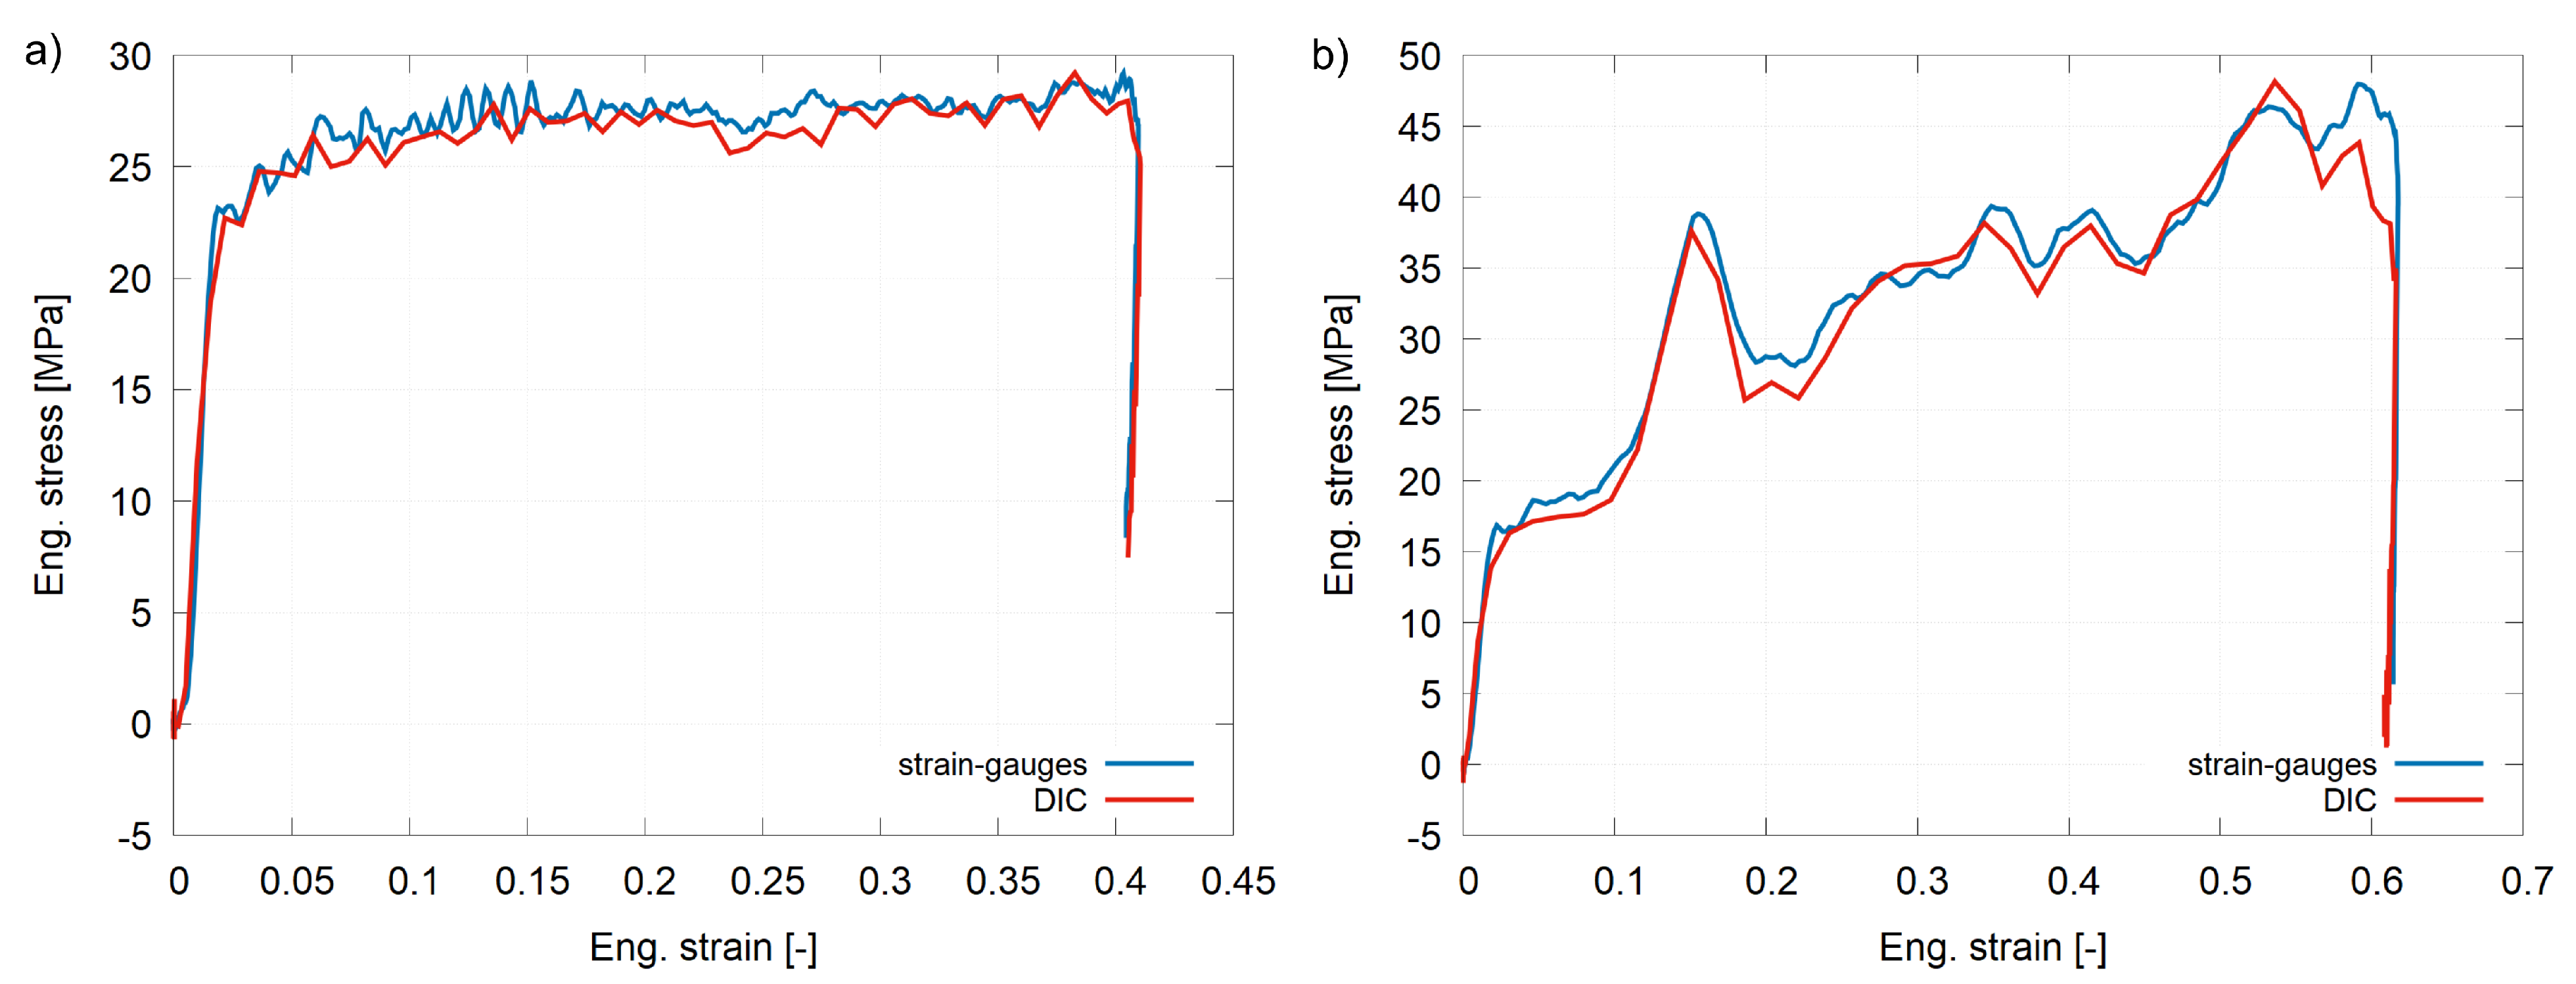
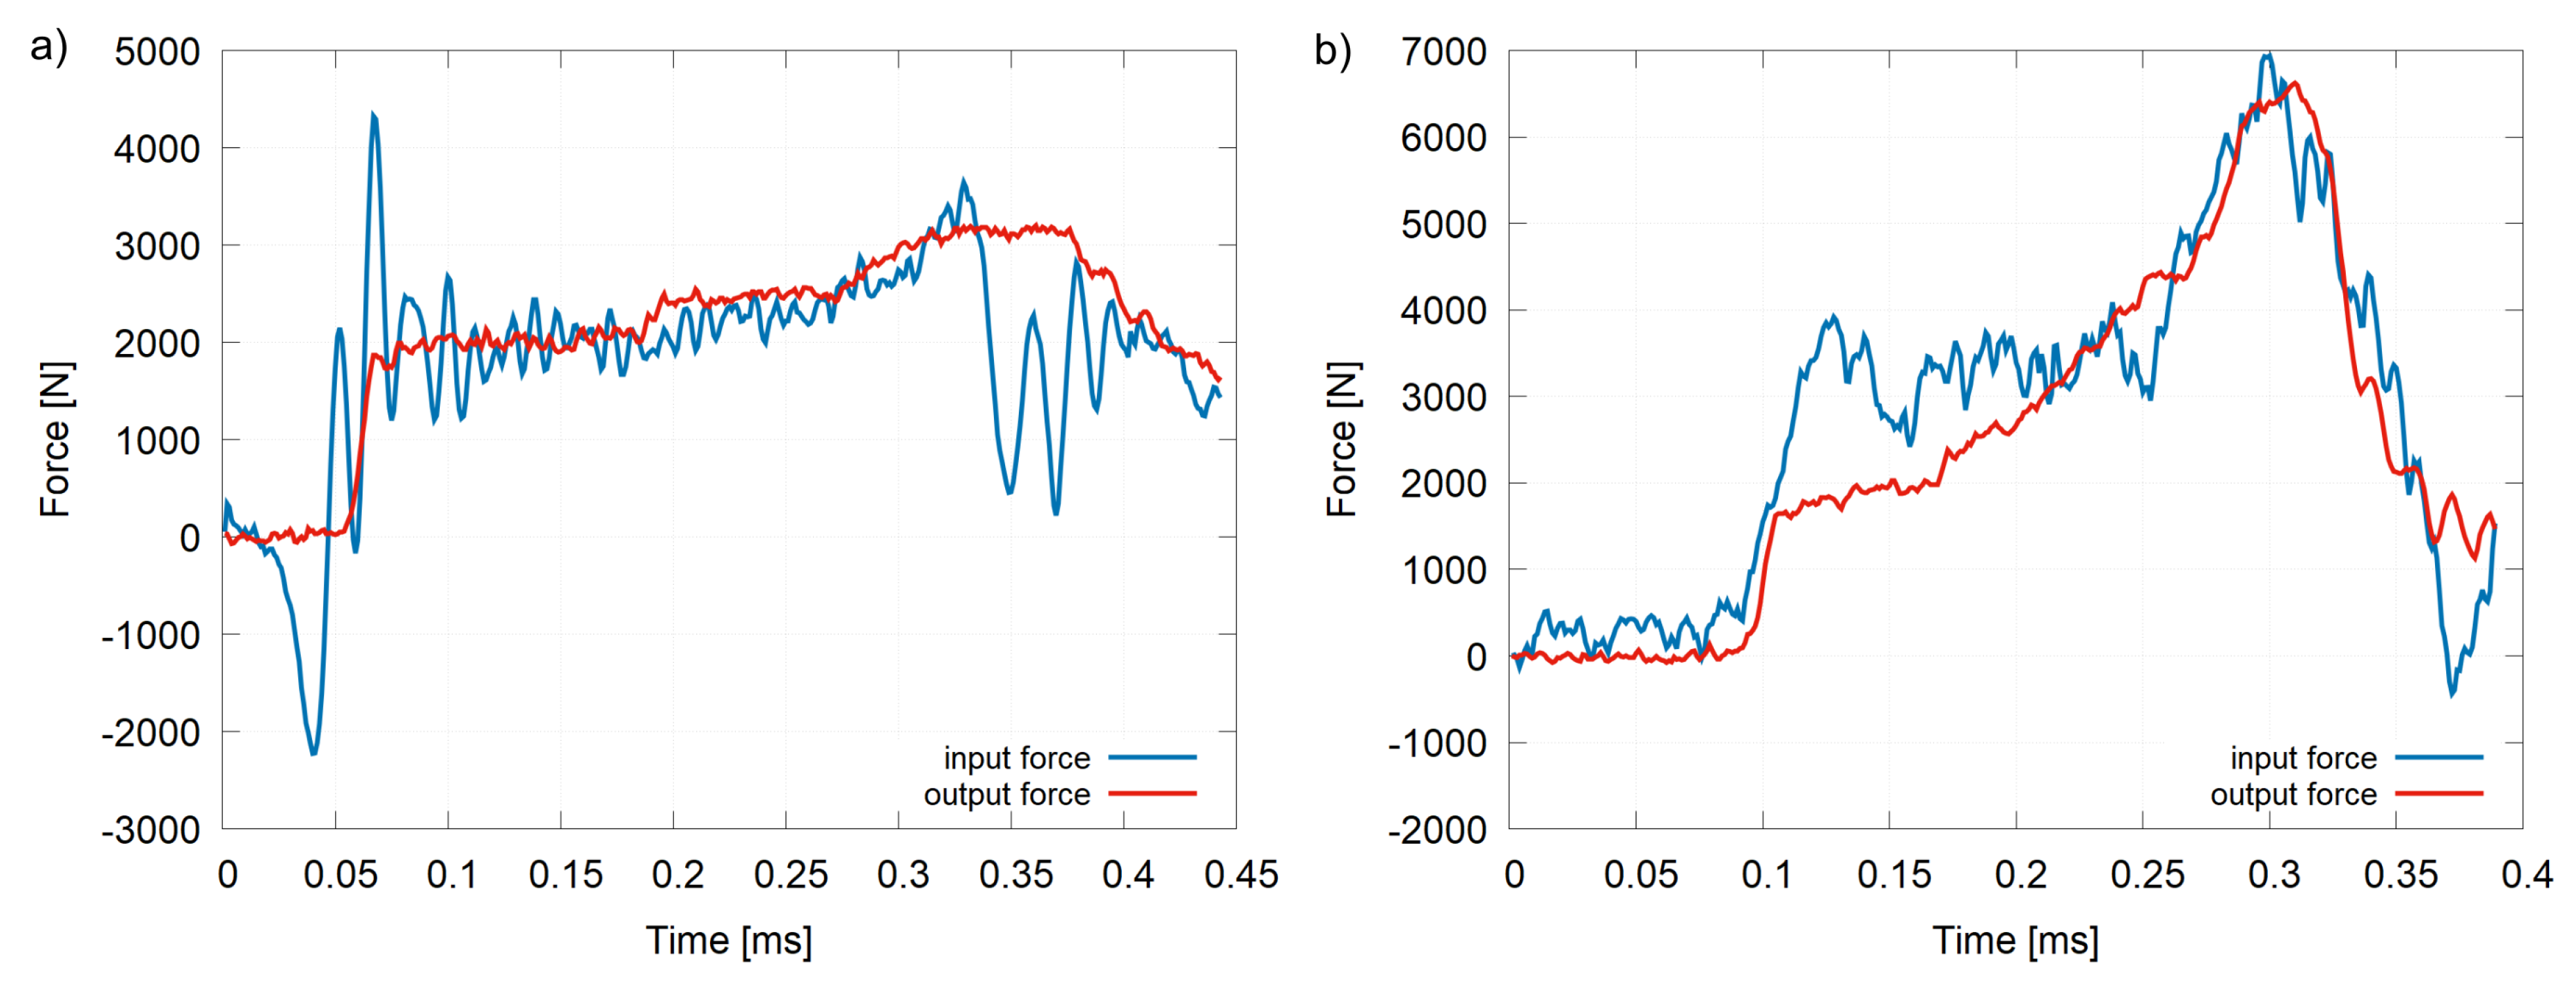
3.3. Validation of Dynamic Experiments
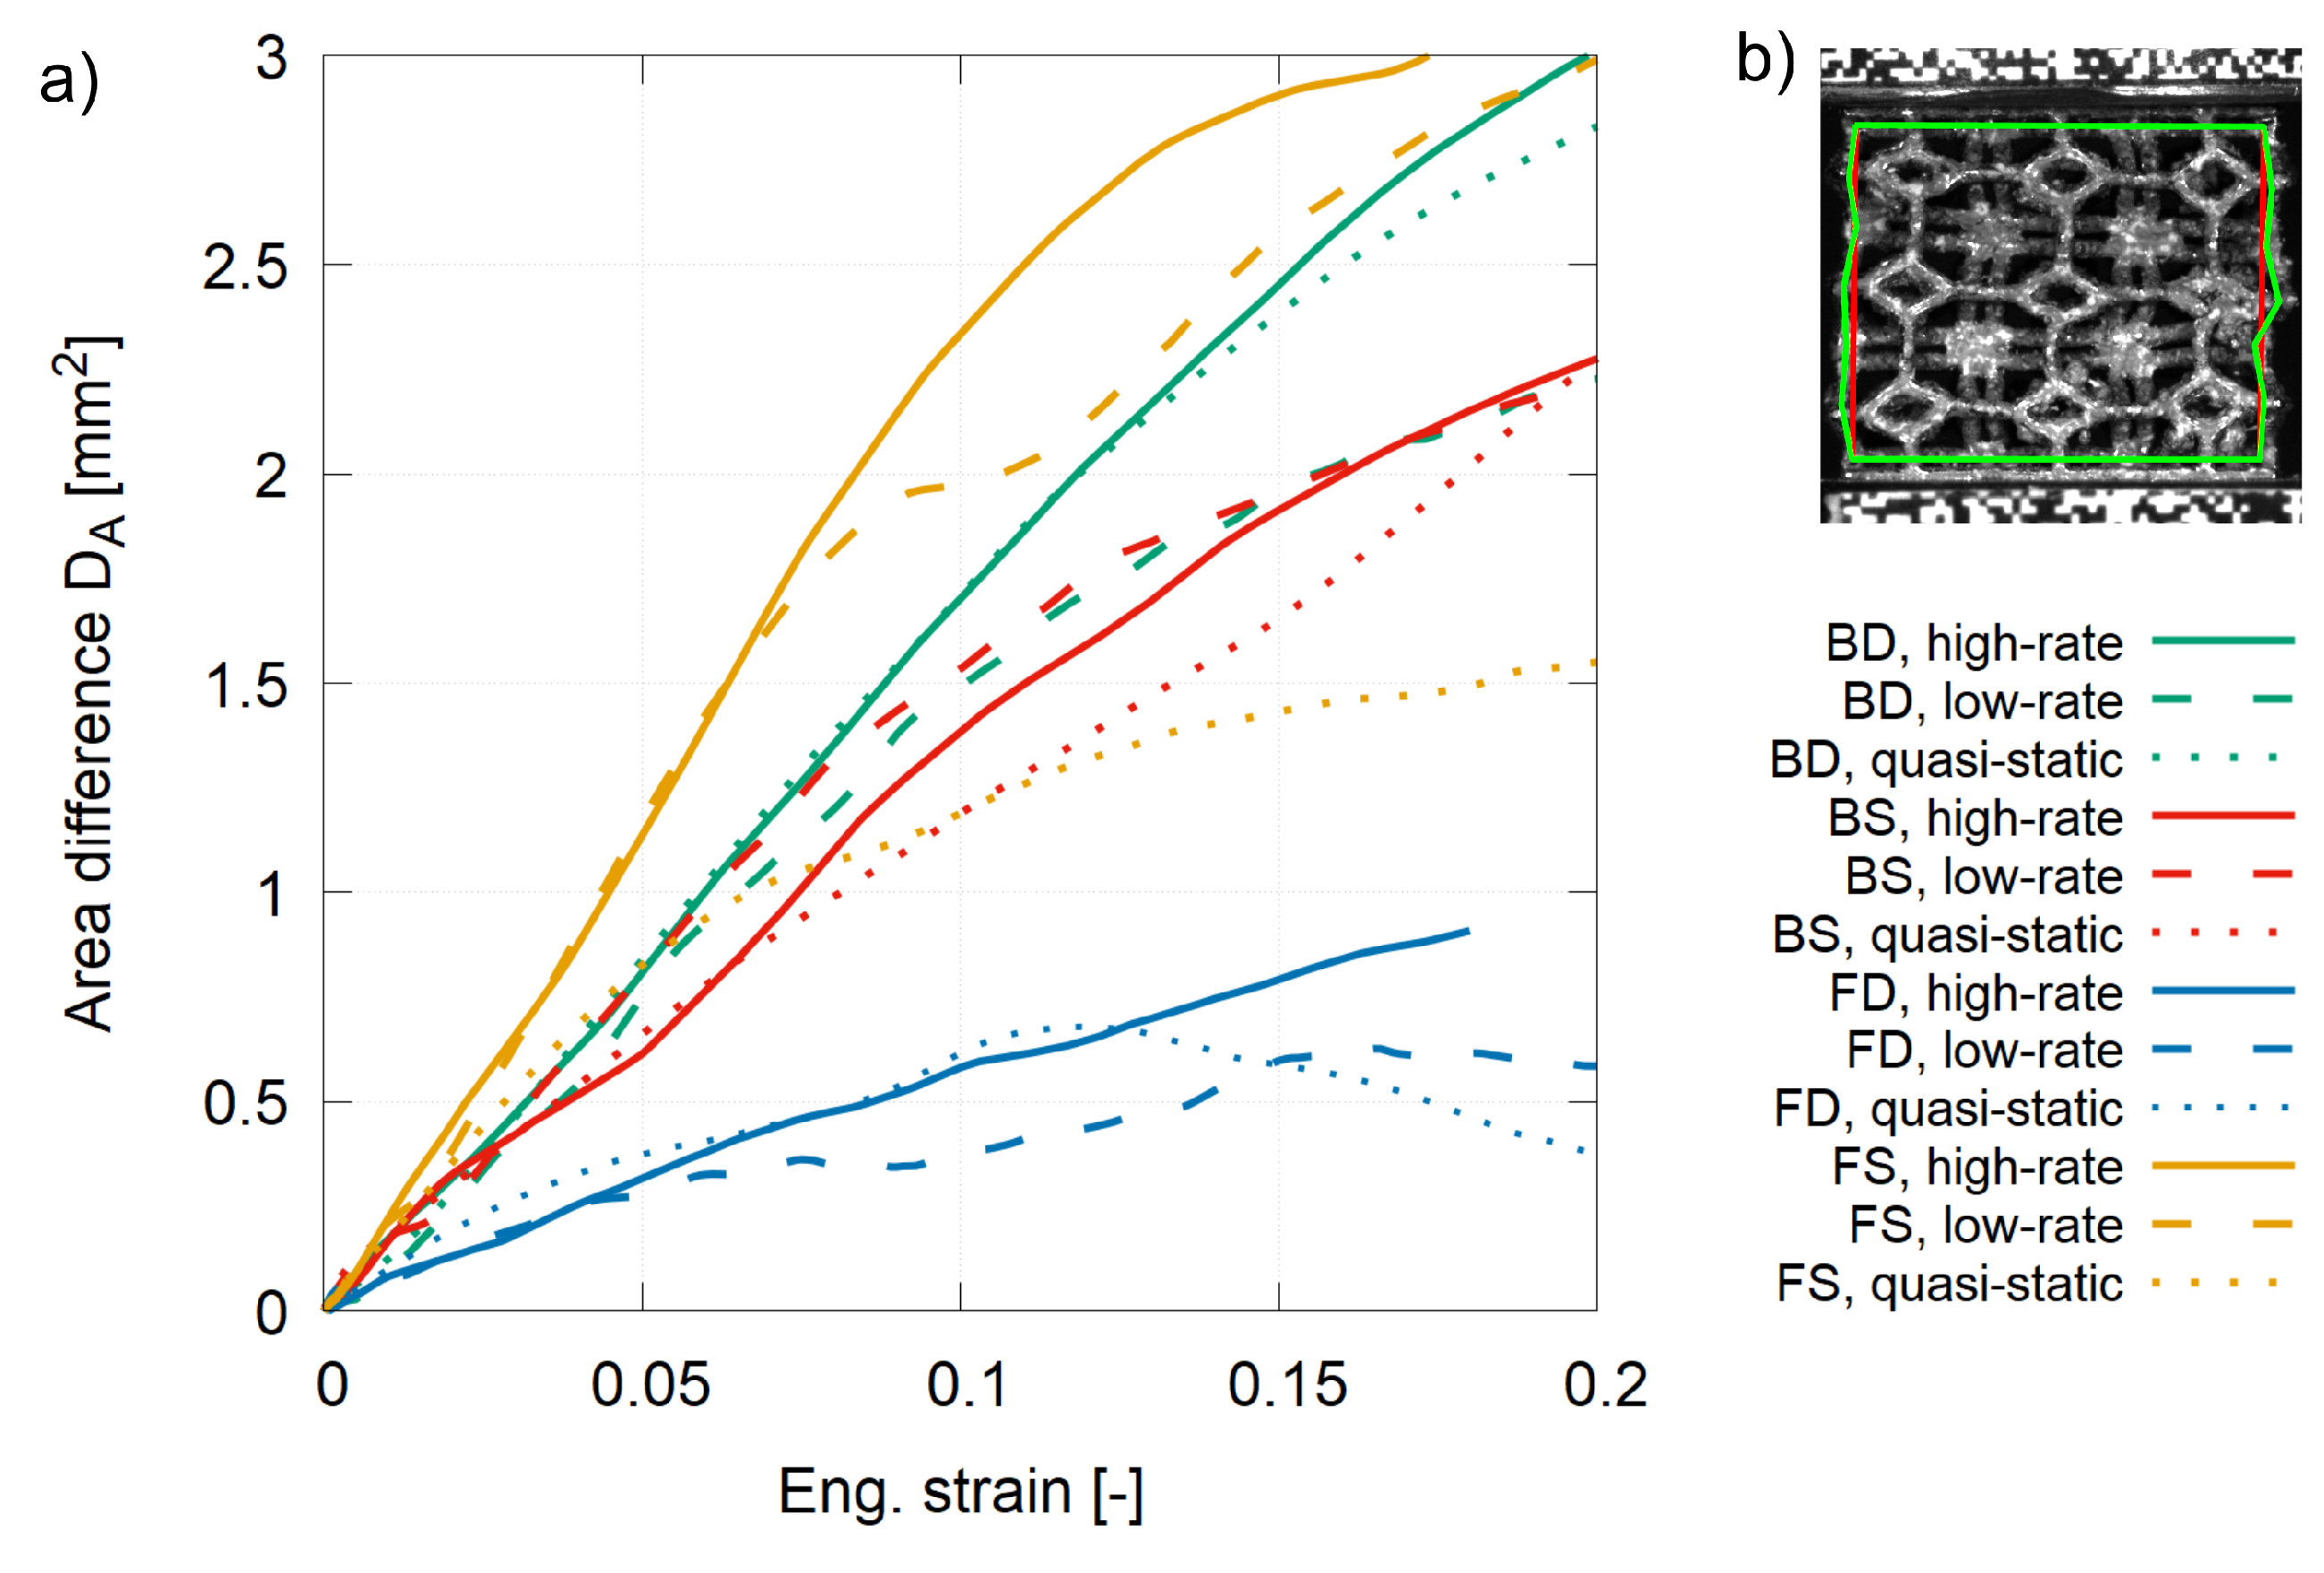
Validation of SHPB experiments is necessary because the data mistreatment can cause significant errors leading to erroneous conclusions. In this context, the velocities calculated from the strain gauge signals and DIC at the interfaces between the bars and the specimen were compared to cross-check the relevance of the measured signals. The Hopkinson bar method is based on elastic wave propagation through slender bars. Therefore, the actual particle velocity at a given cross-section of the bar can be calculated from strain gauge signals by multiplication of the measured strain with elastic wave propagation velocity (in a simple case without superposition of the waves propagating in the bar). Velocities from DIC displacements were calculated by time differentiation. As can be seen in Figure 9, showing a representative plot of the bar’s cross-section velocities at the specimen interfaces, a perfect match for both measurement methods was observed. As the cross-section velocities can be used to calculate all quantities necessary to evaluate an SHPB experiment, the DIC velocities were used for the evaluation of high-strain-rate experiments with an impact velocity of 48 m s 1 where strain gauges could no longer be used because of their extreme fail-rate related to high amplitudes of the strain signals. Here, the DIC method yielded results fully comparable to the strain gauges. Typical stress–strain diagrams evaluated using strain gauges and DIC are compared in Figure 10. The equilibrium of dynamic forces was analysed in all experiments to reveal any tendency to non-uniform deformation caused by strain wave propagation through the specimen or by possible shock effects related to impact velocity (in an ideal case, forces at the incident bar interface quickly converge with the forces at the transmission bar interface). The equilibrium of dynamic forces for the beam stem version is shown in Figure 11. Note that the forces converged quickly at the low rate while their convergence at the high rate was much slower and was not similar until the densification phase. This effect is related to the wave propagation through the specimen when the structure remained in the non-uniform phase to higher strain due to higher impact velocity. The low mechanical impedance of the cell together with the high impact velocity caused the average stress–strain diagram with stress evaluated from the transmission bar not to correspond to the diagram with stress evaluated from the incident bar. Thus, the average stress–strain diagram for the BS structure was not valid until a strain of approximately 0.3.

3.4. Auxeticity

Auxetic behaviour of lattice structures is typically assessed by the evaluation of Poisson’s ratio, which is supposed to gain negative values for auxetic materials [21,22]. However, this property was not evaluated in this study due to the geometry of the investigated specimens. Firstly, due to the restrictions resulting from the geometry of the dynamic experimental setup and the limited precision of the manufacturing method, the number of unit cells did not fulfil the requirements on the representative volume element (RVE) of the structure [29]. Thus, the deformation localisation exerted a strong effect on the overall response of the specimens. The values of transverse strain calculated from the displacements of the edging nodes tracked by the DIC differed along the longitudinal axis significantly due to buckling, bending, or shearing mechanisms occurring during the compression of the structures. Thus, finding a representative field on the observed surface of the specimens for a reliable and comparable evaluation of Poisson’s ratio would not be a straightforward task in this case.
Instead, to evaluate whether the assessed structures exhibited an auxetic behaviour, the area difference D A parameter was calculated for each of the investigated samples. The average values of the area difference for the quasi-static response as well as for each dynamic strain-rate are captured in Figure 12a. The values of the area difference were positive and directly proportional to the increase in engineering strain for all investigated structures under all investigated loading conditions. Thus, the anticipated auxetic character of the structures was not rejected.
A representative example showing the edges used for the calculation of D A in the case of the BD structure is shown in Figure 12b, where the current edges of the area A E are highlighted with a green colour and the red coloured edges belong to the area A C . In this case, A E was calculated to be greater than A C , which corresponds to the positive value of D A . Similar trends could be observed for all structures, whereas the largest values of D A were indicated for the FS version and the least area difference was recognized for the FD structure.
Hence, the auxeticity of the structures was not confirmed in the selected spatial configurations and the investigated geometries of re-entrant tetrakaidecahedral lattices, powdered stainless steel material, and manufacturing technology. This might result from a relatively small re-entrant area (protruded beams forming the “corners” of the cell) in comparison to the overall size of the unit cell and a limited precision of the fabrication process causing significant differences between the real and intended geometry of the structure particularly in the re-entrant area of the cell.

4. Conclusions

Four different additively manufactured lattice structures formed by a periodical assembly of re-entrant tetrakaidecahedral unit-cells were investigated in this study. A description of the fundamental mechanical behaviour of the selected structures was determined from quasi-static uni-axial compression tests. To assess the strain-rate sensitivity of the mechanical response, dynamic compression experiments at two different strain-rates using SHPB apparatus were conducted. Optical measurement methods employing a high-resolution CCD camera and high-speed cameras were applied. An in-house-developed DIC algorithm was used to evaluate the displacements from the camera recordings. Auxeticity of the structure was assessed by evaluation of the area difference parameter. Based on the results obtained from the experimental investigations, it is possible to conclude the following:
  • A strain-rate sensitivity of the deformation behaviour of the investigated structures was evaluated. The increase in recorded values of stress occurred for all structures at both investigated dynamic strain-rates in comparison to the quasi-static response.
  • Strain-rate sensitivity of the tested structures was primarily dependent on the geometry of the unit cell and the inertia effects during the collapse of the individual layers.
  • The structures with the direct interconnection of the unit cells (BD, FD) were more prone to buckling due to the rigidity of the interconnecting nodes causing rotation of the unit cells around these nodes during loading.
  • The structures with interconnecting stem elements between the layers of the unit cells (BS, FS) exhibited a decrease in stiffness under the high-rate loading compared to the low-rate impacts, which resulted in a rapid loss of stability of the stem elements causing a rapid collapse of the structure.
  • Structures that did not exhibit collapse peaks and significant buckling effects showed less significant strain-rate sensitivity between low-rate and high-rate dynamic experiments, while the structures more prone to buckling effects exhibited a significant increase in measured stresses and changes in the mechanical response (inertia-related peaks in stress–strain diagrams, changes in plateau phase).
  • While the lower stresses of the FS version at the high-rate were related to inertia effects (collapse mechanisms of the layers and cells), the lower stresses of the BS version (the weakest structure) were caused by wave propagation through the structure.
  • All structures were less prone to buckling during dynamic loading as the inertia effects and high impact velocity effectively prevented the lateral movement of the layers. The effect was the most profound for the FD version where a significant stress increase between the individual strain rates was observed. This behaviour has been reported for similar cellular structures manufactured from the same material [30,33].
  • The possible auxeticity of the structures resulting from the geometry of the unit cell, which was assumed to be auxetic, was not confirmed for the investigated spatial configurations of the cells, used material, and built technology.

Author Contributions

Conceptualization, M.N., P.K. and T.F.; methodology, M.N., T.F. and P.K.; software, T.F. and V.R.; validation, M.N., T.F. and P.K.; formal analysis, M.N. and T.F.; investigation, M.N., T.F., J.F. and J.Š.; resources, O.J., P.Z. and T.F.; data curation, M.N. and T.F.; writing—original draft preparation, M.N.; writing—review and editing, all authors; visualization, M.N., J.F. and T.F.; supervision, T.F., P.K. and O.J.; project administration, O.J.; funding acquisition, O.J., M.N., J.F. and V.R. All authors have read and agreed to the published version of the manuscript.

Funding

This research was funded by Operational Programme Research, Development and Education in the project INAFYM (CZ.02.1.01/0.0/0.0/16_019/0000766) and the Czech Science Foundation (project no. 19-23675S). Support for the internal projects of the Czech Technical University in Prague no. SGS21/131/OHK2/2T/16, no. SGS20/142/OHK2/2T/16, and no. SGS20/141/OHK2/2T/16 is also acknowledged.

Institutional Review Board Statement

Not applicable.

Informed Consent Statement

Not applicable.

Data Availability Statement

The data presented in this study are available on request from the corresponding author.

Conflicts of Interest

The authors declare no conflict of interest.

References

  1. Banhart, J.; Seeliger, H.W. Aluminium Foam Sandwich Panels: Manufacture, Metallurgy and Applications. Adv. Eng. Mater. 2008, 10, 793–802. [Google Scholar] [CrossRef]
  2. Großmann, A.; Gosmann, J.; Mittelstedt, C. Lightweight lattice structures in selective laser melting: Design, fabrication and mechanical properties. Mater. Sci. Eng. A 2019, 766, 138356. [Google Scholar] [CrossRef]
  3. Alderson, K.; Fitzgerald, A.; Evans, K. The strain dependent indentation resilience of auxetic microporous polyethylene. J. Mater. Sci. 2000, 35, 4039–4047. [Google Scholar] [CrossRef]
  4. Choi, J.B.; Lakes, R. Fracture toughness of re-entrant foam materials with a negative Poisson’s ratio: Experiment and analysis. Int. J. Fract. 1996, 80, 73–83. [Google Scholar] [CrossRef]
  5. Scarpa, F.; Giacomin, J.; Bezazi, A.; Bullough, W. Dynamic behavior and damping capacity of auxetic foam pads. Int. Soc. Opt. Photonics 2006, 6169, 61690T. [Google Scholar] [CrossRef] [Green Version]
  6. Scarpa, F.; Yates, J.R.; Ciffo, L.G.; Patsias, S. Dynamic crushing of auxetic open-cell polyurethane foam. Proc. Inst. Mech. Eng. Part C J. Mech. Eng. Sci. 2002, 216, 1153–1156. [Google Scholar] [CrossRef]
  7. Evans, K.E.; Alderson, A. Auxetic Materials: Functional Materials and Structures from Lateral Thinking! Adv. Mater. 2000, 12, 617–628. [Google Scholar] [CrossRef]
  8. Ren, X.; Das, R.; Tran, P.; Ngo, T.D.; Xie, Y.M. Auxetic metamaterials and structures: A review. Smart Mater. Struct. 2018, 27, 023001. [Google Scholar] [CrossRef]
  9. Mazaev, A.; Ajeneza, O.; Shitikova, M. Auxetics materials: Classification, mechanical properties and applications. IOP Conf. Ser. Mater. Sci. Eng. 2020, 747, 012008. [Google Scholar] [CrossRef]
  10. Wu, W.; Tao, Y.; Xia, Y.; Chen, J.; Lei, H.; Sun, L.; Fang, D. Mechanical properties of hierarchical anti-tetrachiral metastructures. Extrem. Mech. Lett. 2017, 16, 18–32. [Google Scholar] [CrossRef]
  11. Wu, W.; Song, X.; Liang, J.; Xia, R.; Qian, G.; Fang, D. Mechanical properties of anti-tetrachiral auxetic stents. Compos. Struct. 2018, 185, 381–392. [Google Scholar] [CrossRef]
  12. Taherkhani, B.; Azizkhani, M.B.; Kadkhodapour, J.; Anaraki, A.P.; Rastgordani, S. Highly sensitive, piezoresistive, silicone/carbon fiber-based auxetic sensor for low strain values. Sens. Actuators A Phys. 2020, 305, 111939. [Google Scholar] [CrossRef]
  13. Alderson, A.; Rasburn, J.; Ameer-Beg, S.; Mullarkey, P.G.; Perrie, W.; Evans, K.E. An Auxetic Filter: A Tuneable Filter Displaying Enhanced Size Selectivity or Defouling Properties. Ind. Eng. Chem. Res. 2000, 39, 654–665. [Google Scholar] [CrossRef]
  14. Novak, N.; Dobnik Dubrovski, P.; Borovinšek, M.; Vesenjak, M.; Ren, Z. Deformation behaviour of advanced textile composites with auxetic structure. Compos. Struct. 2020, 252, 112761. [Google Scholar] [CrossRef]
  15. Mardling, P.; Alderson, A.; Jordan-Mahy, N.; Le Maitre, C.L. The use of auxetic materials in tissue engineering. Biomater. Sci. 2020, 8, 2074–2083. [Google Scholar] [CrossRef]
  16. Imbalzano, G.; Linforth, S.; Ngo, T.; Lee, P.; Tran, P. Blast resistance of auxetic and honeycomb sandwich panels: Comparisons and parametric designs. Compos. Struct. 2018, 183, 242–261. [Google Scholar] [CrossRef]
  17. Bronder, S.; Adorna, M.; Fíla, T.; Koudelka, P.; Falta, J.; Jiroušek, O.; Jung, A. Hybrid Auxetic Structures: Structural Optimization and Mechanical Characterization. Adv. Eng. Mater. 2021, 23, 2001393. [Google Scholar] [CrossRef]
  18. Lu, Q.; Qi, D.; Li, Y.; Xiao, D.; Wu, W. Impact energy absorption performances of ordinary and hierarchical chiral structures. Thin-Walled Struct. 2019, 140, 495–505. [Google Scholar] [CrossRef]
  19. Zhang, J.; Lu, G.; You, Z. Large deformation and energy absorption of additively manufactured auxetic materials and structures: A review. Compos. Part B Eng. 2020, 201, 108340. [Google Scholar] [CrossRef]
  20. Harris, J.; McShane, G. Impact response of metallic stacked origami cellular materials. Int. J. Impact Eng. 2021, 147, 103730. [Google Scholar] [CrossRef]
  21. Fíla, T.; Koudelka, P.; Zlámal, P.; Falta, J.; Adorna, M.; Neuhäuserová, M.; Luksch, J.; Jiroušek, O. Strain Dependency of Poisson’s Ratio of SLS Printed Auxetic Lattices Subjected to Quasi-Static and Dynamic Compressive Loading. Adv. Eng. Mater. 2019, 21, 1900204. [Google Scholar] [CrossRef]
  22. Mauko, A.; Fíla, T.; Falta, J.; Koudelka, P.; Rada, V.; Neuhäuserová, M.; Zlámal, P.; Vesenjak, M.; Jiroušek, O.; Ren, Z. Dynamic Deformation Behaviour of Chiral Auxetic Lattices at Low and High Strain-Rates. Metals 2021, 11, 52. [Google Scholar] [CrossRef]
  23. Novak, N.; Starčevič, L.; Vesenjak, M.; Ren, Z. Blast response study of the sandwich composite panels with 3D chiral auxetic core. Compos. Struct. 2019, 210, 167–178. [Google Scholar] [CrossRef]
  24. Kolken, H.; Zadpoor, A. Auxetic mechanical metamaterials. RSC Adv. 2017, 7, 5111–5129. [Google Scholar] [CrossRef] [Green Version]
  25. Ngo, T.D.; Kashani, A.; Imbalzano, G.; Nguyen, K.T.; Hui, D. Additive manufacturing (3D printing): A review of materials, methods, applications and challenges. Compos. Part B Eng. 2018, 143, 172–196. [Google Scholar] [CrossRef]
  26. Harris, J.; Winter, R.; McShane, G. Impact response of additively manufactured metallic hybrid lattice materials. Int. J. Impact Eng. 2017, 104, 177–191. [Google Scholar] [CrossRef] [Green Version]
  27. Yang, L.; Harrysson, O.; West, H.; Cormier, D. Compressive properties of Ti–6Al–4V auxetic mesh structures made by electron beam melting. Acta Mater. 2012, 60, 3370–3379. [Google Scholar] [CrossRef]
  28. Choi, J.B.; Lakes, R.S. Nonlinear Analysis of the Poisson’s Ratio of Negative Poisson’s Ratio Foams. J. Compos. Mater. 1995, 29, 113–128. [Google Scholar] [CrossRef]
  29. Neuhäuserová, M.; Koudelka, P. Numerical modelling of compressive characteristics of auxetic structures. Acta Polytech. Ctu Proc. 2018, 18, 38–43. [Google Scholar] [CrossRef] [Green Version]
  30. Fíla, T.; Koudelka, P.; Falta, J.; Zlámal, P.; Rada, V.; Adorna, M.; Bronder, S.; Jiroušek, O. Dynamic impact testing of cellular solids and lattice structures: Application of two-sided direct impact Hopkinson bar. Int. J. Impact Eng. 2021, 148, 103767. [Google Scholar] [CrossRef]
  31. Bradski, G.; Kaehler, A. OpenCV. Dr. Dobb’s J. Softw. Tools 2000, 3. Available online: http://roswiki.autolabor.com.cn/attachments/Events(2f)ICRA2010Tutorial/ICRA_2010_OpenCV_Tutorial.pdf (accessed on 25 June 2021).
  32. Fletcher, R. Practical Methods of Optimization, 2nd ed.; John Wiley & Sons: New York, NY, USA, 1987. [Google Scholar]
  33. Fíla, T.; Koudelka, P.; Falta, J.; Šleichrt, J.; Adorna, M.; Zlámal, P.; Neuhäuserová, M.; Mauko, A.; Valach, J.; Jiroušek, O. Impact Behavior of Additively Manufactured Stainless Steel Auxetic Structures at Elevated and Reduced Temperatures. Adv. Eng. Mater. 2021, 23, 2000669. [Google Scholar] [CrossRef]
  34. Koudelka, P.; Jiroušek, O.; Fíla, T.; Doktor, T. Compressive properties of auxetic structures produced with direct 3D printing. Mater. Tehnol. 2016, 50, 311–317. [Google Scholar] [CrossRef]
Figure 1. Visualisation of the re-entrant tetrakaidecahedral unit cells: (a) beam version and (b) facet version.
Metals 11 01196 g001
Figure 2. Visualizations and images of actual AM specimens of the tested structures: (a) beam direct (BD) version, (b) beam stem (BS) version with detailed pictures of designed (top) and real (bottom) geometry, (c) facet direct (FD) version, and (d) facet stem (FD) version.
Metals 11 01196 g002
Figure 3. The arrangement of the SHPB experimental setup: uni-axial compression with aluminium alloy bars. SG1 to SG6 denote the strain gauge positions.
Metals 11 01196 g003
Figure 4. Area difference evaluation principle.
Metals 11 01196 g004
Figure 5. Quasi-static engineering stress–strain diagrams showing average values and standard deviations of stress for each investigated lattice.
Metals 11 01196 g005
Figure 6. Quasi-static deformation mechanisms for the (a) BD structure, (b) BS structure, (c) FD structure, and (d) FS structure.
Metals 11 01196 g006
Figure 7. Average stress–strain diagrams at various strain-rates for (a) BD structure, (b) BS structure, (c) FD structure, and (d) FS structure.
Metals 11 01196 g007
Figure 8. Deformation behaviour of the (a) BD structure, (b) BS structure, (c) FD structure, and (d) FS structure under dynamic loading conditions.
Metals 11 01196 g008
Figure 9. Velocities evaluated using strain gauges compared with DIC: BD version, low-rate.
Metals 11 01196 g009
Figure 10. Dynamic stress–strain diagrams evaluated using strain gauge signals and DIC, (a) BD structure/low-rate, (b) FS structure/high-rate.
Metals 11 01196 g010
Figure 11. Equilibrium of dynamic forces, (a) BS structure/low-rate, (b) BS structure/high-rate.
Metals 11 01196 g011
Figure 12. (a) Average area difference diagrams at various strain-rates for each structure and (b) a representative example of the edges used for the area difference calculation.
Metals 11 01196 g012
Table 1. Parameters of the samples.
StructureDimensions (mm)Nominal Strut/Plate Thickness (mm)Relative Density ρ r (-)Porosity p (-)
Beam Direct (BD)13.59 × 13.75 × 14.670.530.220.78
Beam Stem (BS)13.20 × 13.19 × 14.530.460.160.84
Facet Direct (FD)13.61 × 13.81 × 14.360.520.190.81
Facet Stem (FS)13.01 × 13.29 × 14.500.470.190.81
Publisher’s Note: MDPI stays neutral with regard to jurisdictional claims in published maps and institutional affiliations.

