Article

Cone Clogging of Submerged Entry Nozzle in Rare Earth Treated Ultra-Low Carbon Al-Killed Steel and Its Effect on the Flow Field and Vortex in the Mold

1
State Key Laboratory of Advanced Metallurgy, University of Science and Technology Beijing, Beijing 100083, China
2
Institute of Ferrous Metallurgy, RWTH-Aachen University, 52072 Aachen, Germany
3
Baotou Iron and Steel Group Corp., Baotou 014010, China
*
Author to whom correspondence should be addressed.
Metals 2021, 11(4), 662; https://doi.org/10.3390/met11040662
Submission received: 4 March 2021 / Revised: 1 April 2021 / Accepted: 9 April 2021 / Published: 19 April 2021

Abstract

:
Two submerged entry nozzles (SENs) used for casting 1300 tons and 260 tons of Al-killed steel were dissected. Several parameters including block rate, nozzle clog angle, port width, and port height of the clogged nozzle were introduced to describe the geometry of clogs in the SENs based on the dissection; furthermore, a geometry model was established to describe the characteristics of the nozzle clogging of the SENs. A large-eddy simulation (LES) coupled with the volume of fraction (VOF) method was adopted to simulate the steel–slag interface’s interaction behavior. The vortex visualization and rotation magnitude were characterized by the Liutex method. Quantitatively, the influence of nozzle clogging resulted in block rates of 0% to 45.9% on the flow and vortex distribution in the mold, and the characteristics of the steel–slag interface fluctuation were well verified in the industrial experiment.

1. Introduction

Nozzle clogging is one of the long-term problems in Al-killed steel casting [1,2,3]. It significantly affects the flow behavior of molten steel in the mold by changing the geometric characterization of the submerged entry nozzle (SEN). The flow behavior of molten steel in the mold dramatically affects the temperature distribution [4,5], inclusion transport [6,7], slag entrapment behavior [8,9], and segregation of the elements [10,11].
Nozzle clogging is a cumulative process of small inclusions in the melt on the refractory wall of the SEN. On the other hand, the clogs deposited on the inner wall of the SEN are easily peeled off periodically and cause a macro defect in final products. Many attempts have been made by previous researchers to study the influence of nozzle clogs on the mold flow [12,13,14]. Considering the complexity and difference in the morphologies of clogs under different casting conditions, the shape of nozzle clogs have been simplified to a cone [12], spherical, tube [14] or cubic shape [15] based on the dissection of clogged SENs, and the nozzle clogs have been placed at the slide gate [12], the nozzle port [14,15,16] or the upper nozzle port and the bottom of SEN [17] for numerical or physical simulations. It was reported that the vortex frequency in the clogged side of the SEN was strengthened after placing a cubic-shaped clog on the nozzle port, based on the simulation of the 1:3 hydraulic model combined with the k-ε model of numerical simulation [15]. The vortex depth was found to be more extensive on the clogged side than the non-clogged side, which caused more severe slag entrapment on the clogged side [16]. When the cubic-shaped clog was placed on the upper nozzle port and the bottom of the SEN, the flow in the mold presented asymmetry. The clogs in side-opened SEN are often distributed near the outlet and the bottom of the SEN, while the clogs in the straight-through nozzle are mainly distributed on the inner wall of the SEN or the outer edge of the outlet. For the straight-through nozzle, spherical clogs in the outlet of the SEN can significantly influence the flow in the mold, while they have little adverse effect on the flow in the mold when they are away from the outlet [14]. The clogs deposited on the refractory material of SEN can roughen the refractory’s surface, which can decrease the thickness of the velocity boundary layer on the refractory and increase the turbulent kinetic energy, strengthening the transportability of inclusions from the melt to the refractory surface [13]. It is still difficult to establish a precise geometry model to quantify the influence of clogs on the flow in the mold.
In this work, models of the geometry of SEN with different block rates were established based on the actual dissection of two SENs with different casting times of Al-killed ultra-low carbon rare-earth treated steel. The large-eddy simulation (LES) turbulent model coupled with the volume of fraction (VOF) model was used to simulate the influence of different block rates on the flow, the vortex, and the steel–slag interface level in the mold. This is beneficial for quantifying a number of critical conditions caused by the nozzle clogging.

2. Experimental Procedure and Methods

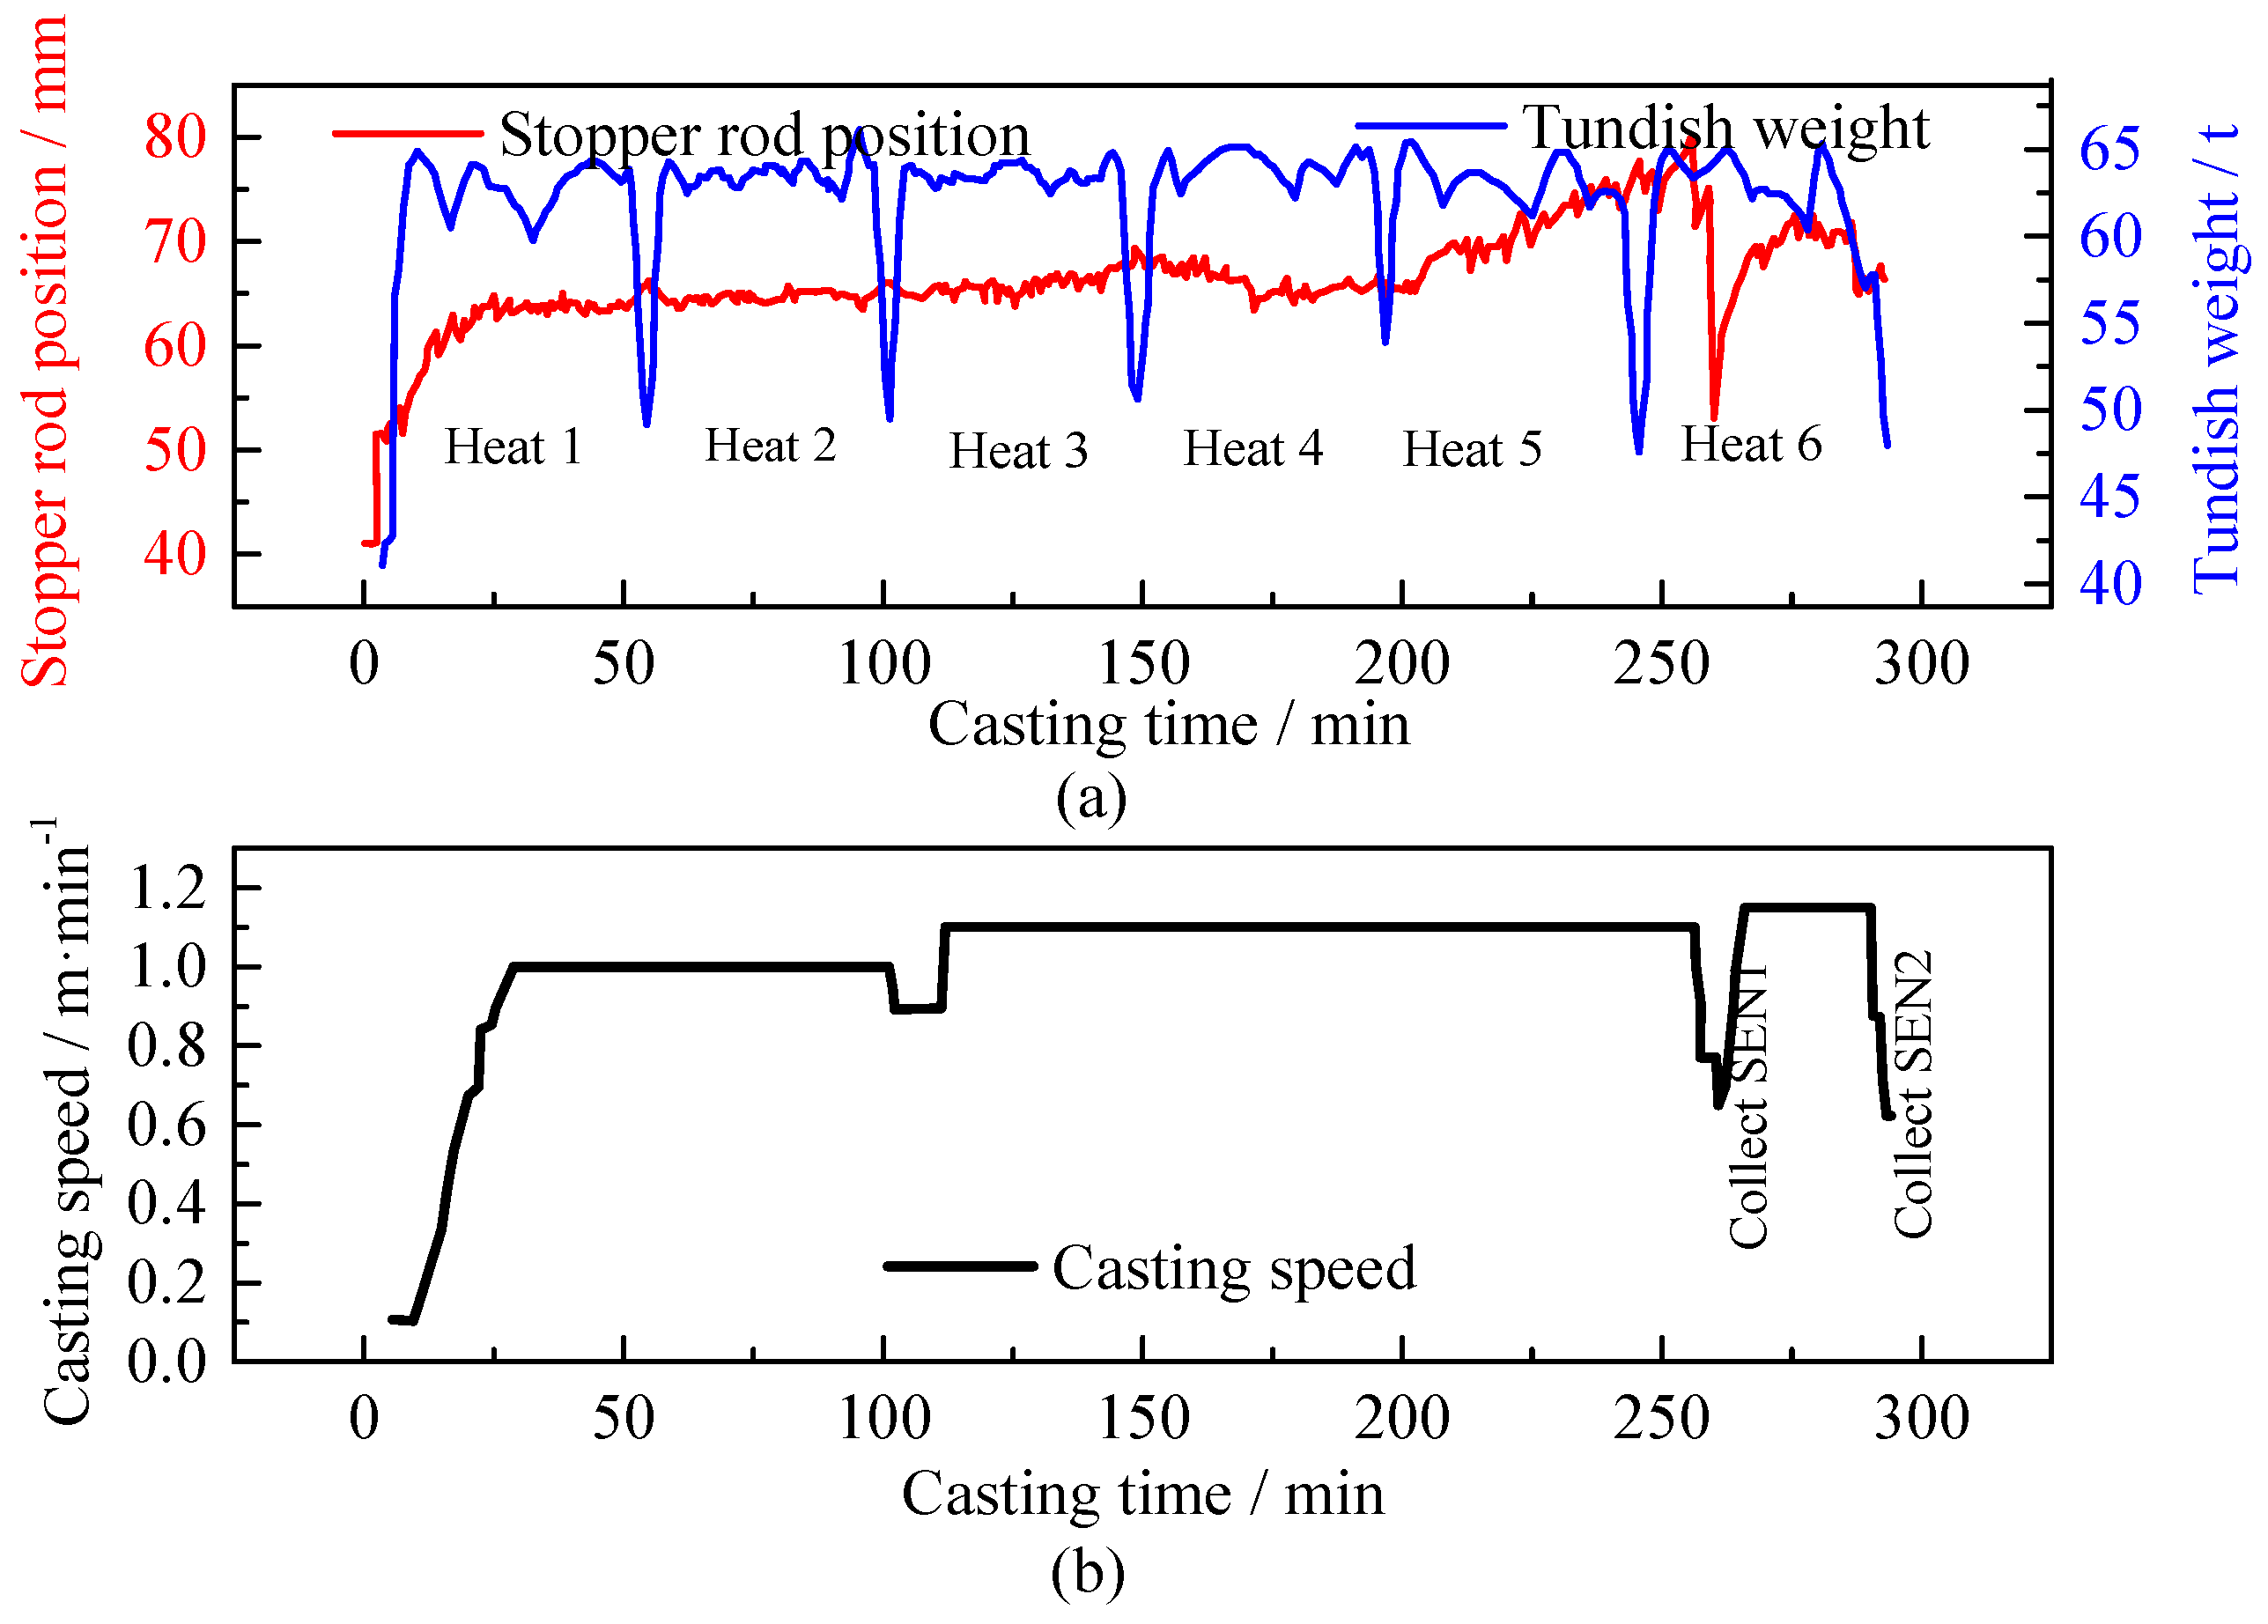
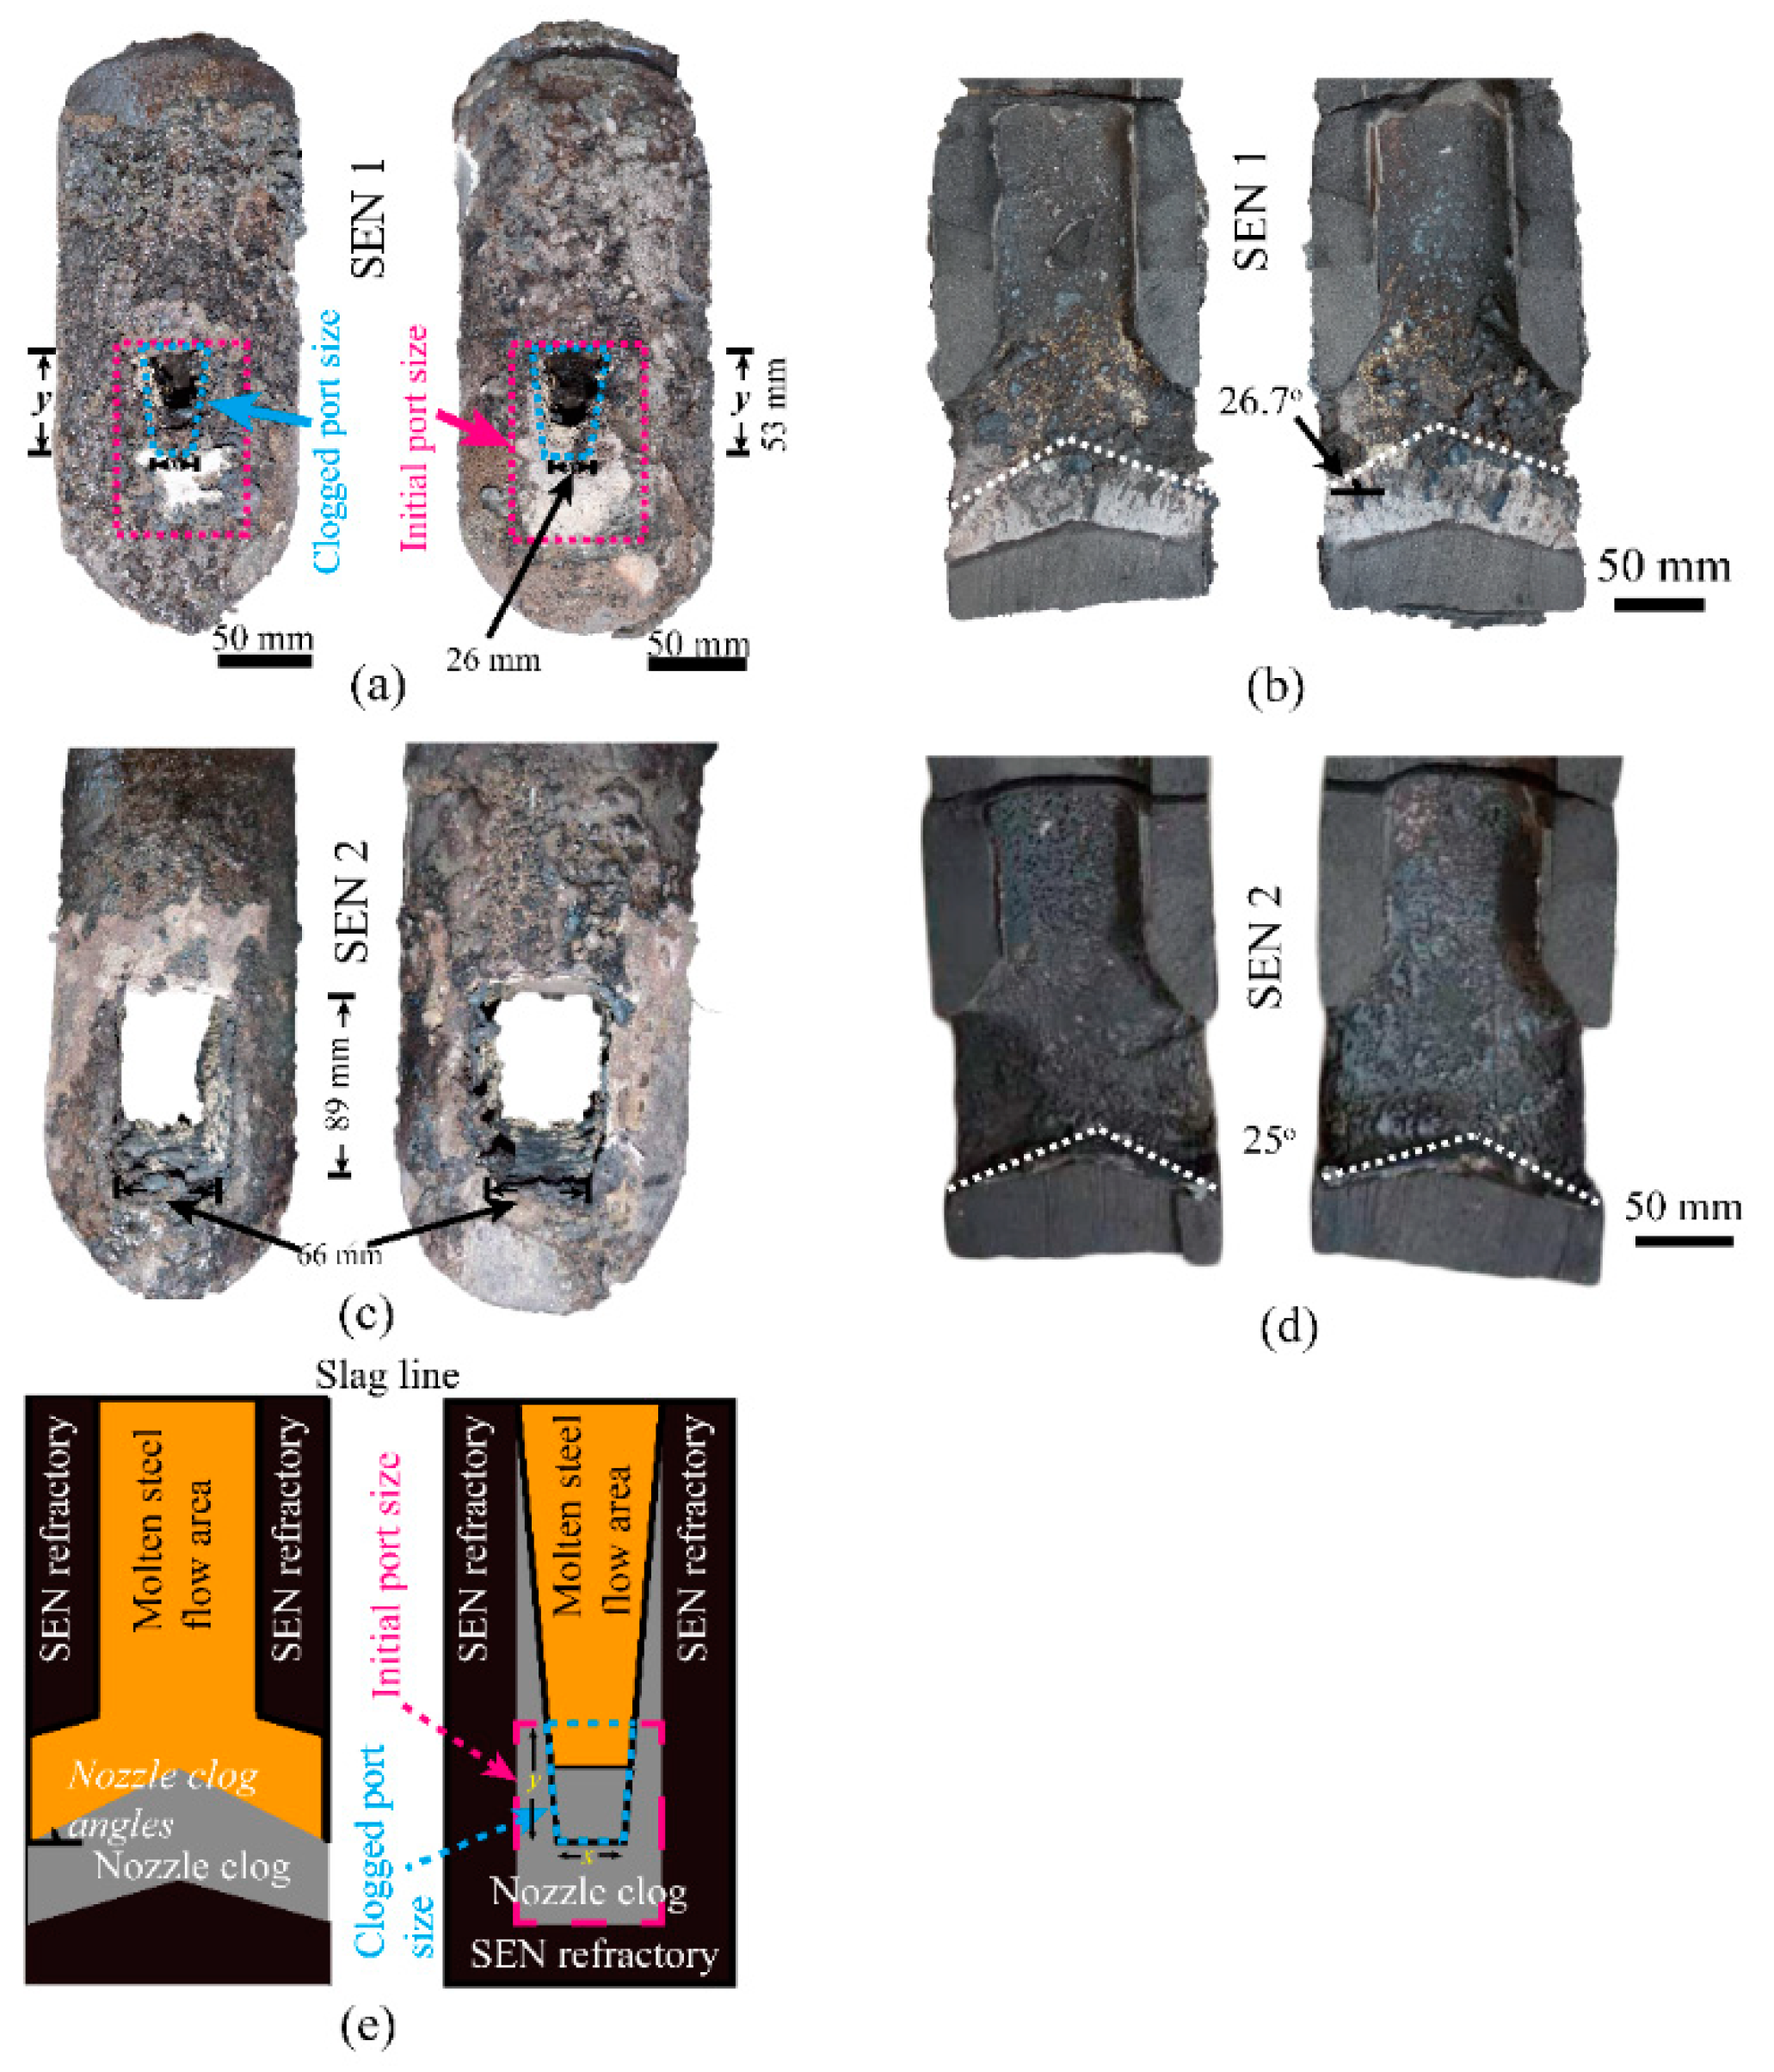
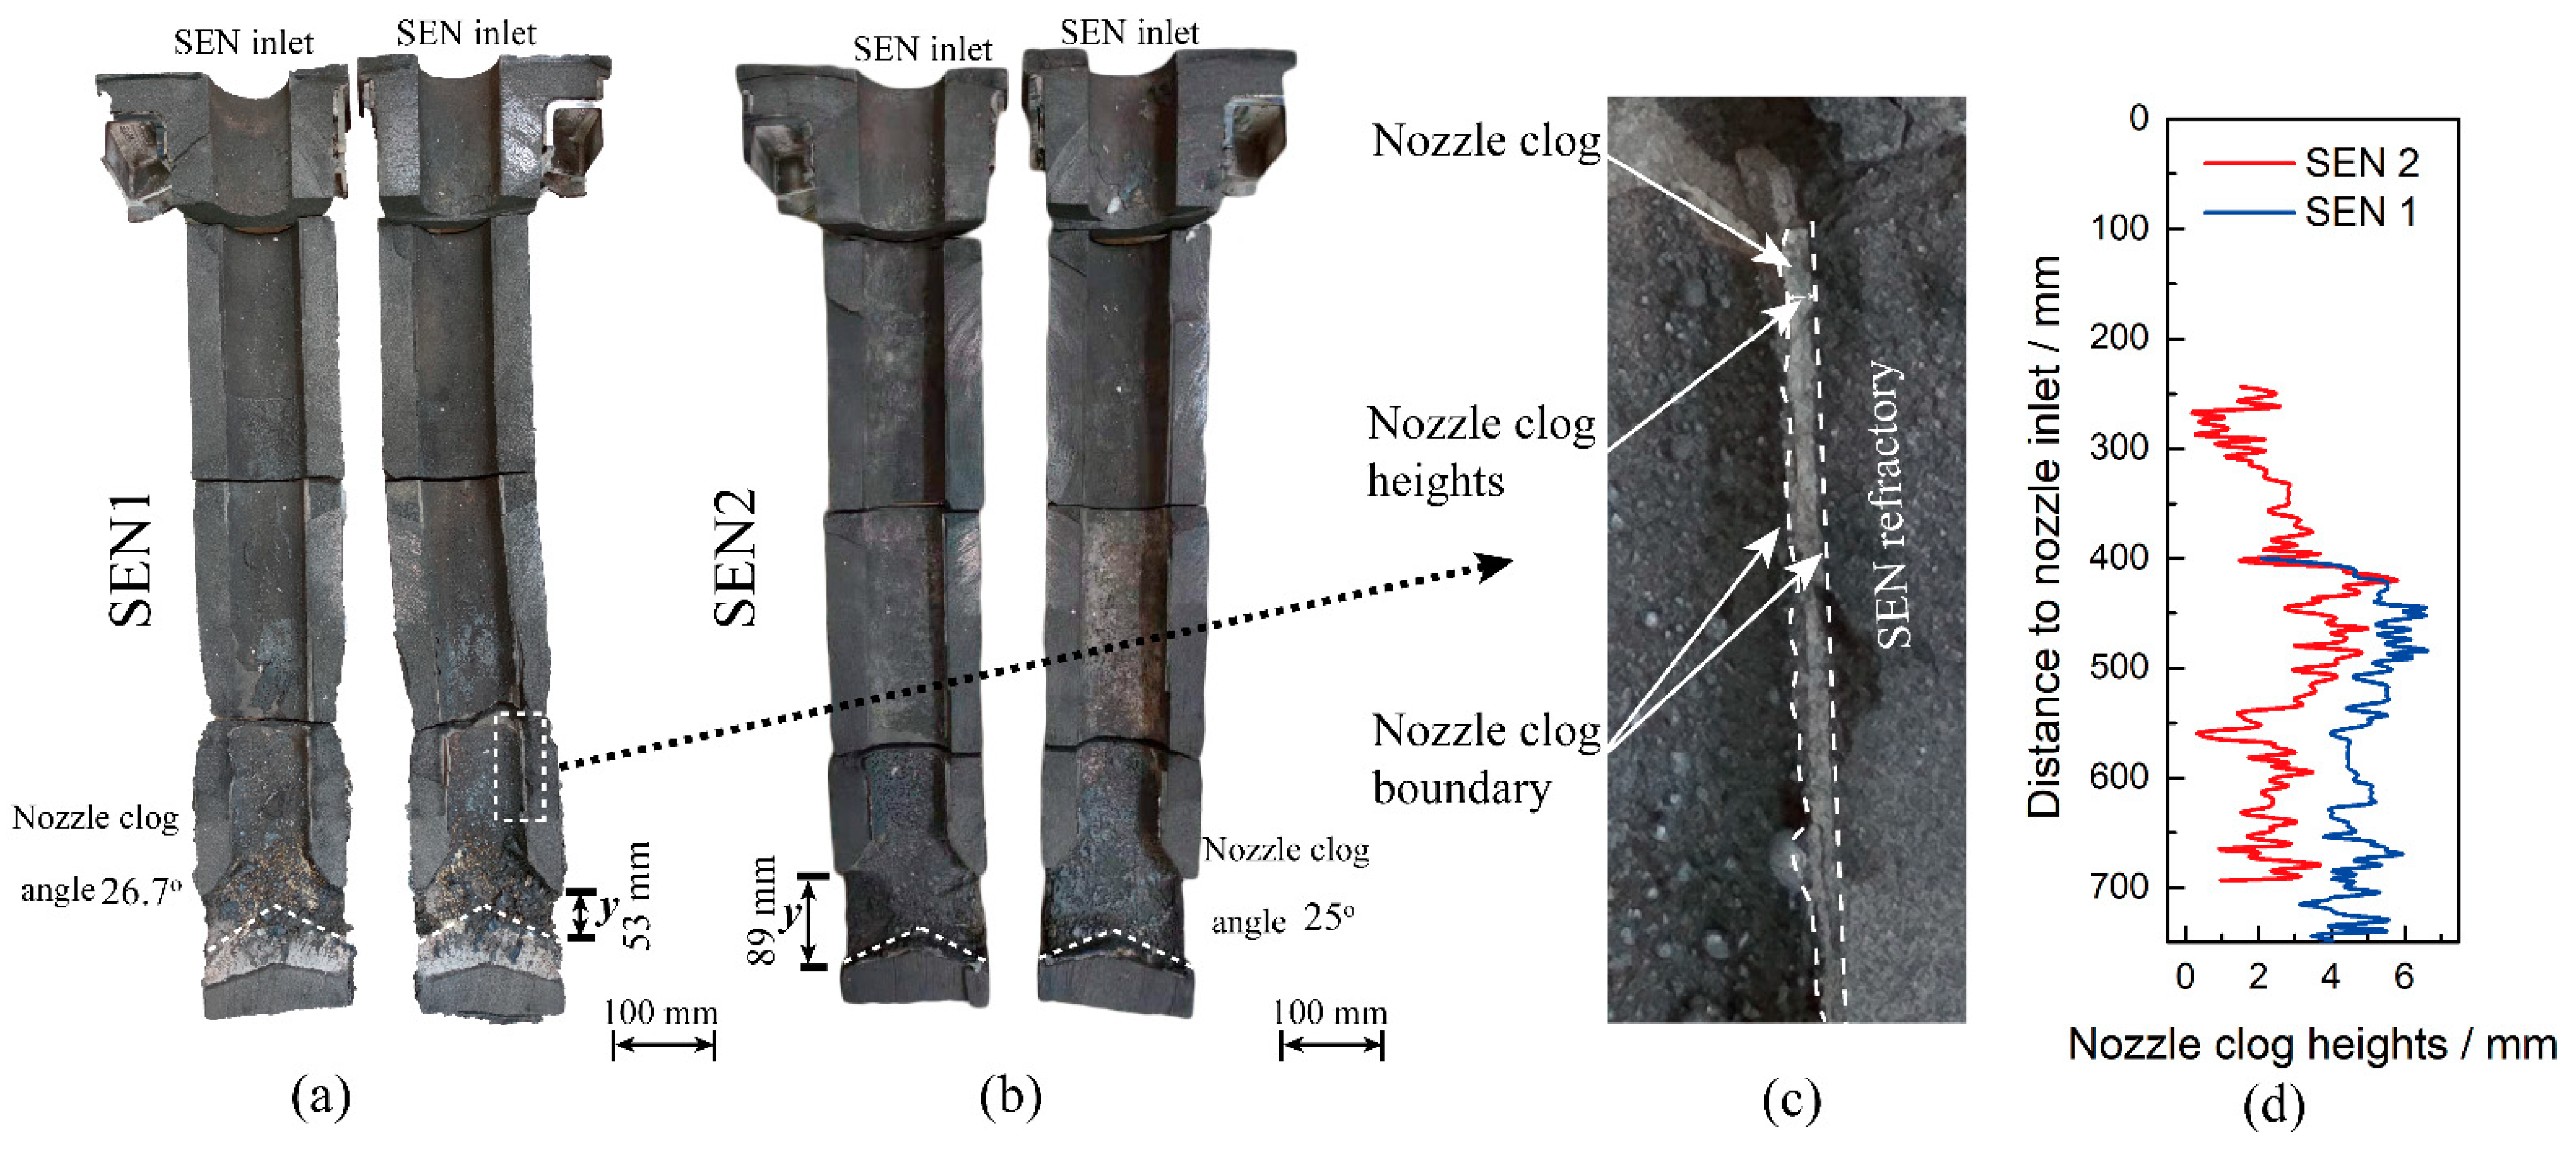
2.1. Description of Clogs’ Morphology in SEN

The experiment was carried out in a steel plant in China to produce ultra-low carbon Al-killed interstitial free steel (ULC-IF) with a basic oxygen furnace (BOF) → Ruhrstah– Heraeus (RH) → continuous casting (CC). The present research work concerns the clog characteristic of SENs in Al-killed rare earth treated steel and its effect on the fluid flow in the mold. After a continuous casting process of six consecutive heats, two SENs at different casting stages were retained to investigate the clog morphology of the SENs through full section dissection. The aluminum was used for the first four heats to kill the residual oxygen in the melt after decarburization in the RH process. Ferrotitanium was added into the melt for alloying. For the fifth and sixth heats, an additional 120 kg of rare earth cerium-ferroalloy with Ce content of 10 wt% was added into the melt in each heat stage, in the RH’s last circulation after the alloying process mentioned above. The first SEN was used for casting 1300 tons of ULC, including around 1040 tons of Al-killed ULC and around 260 tons of Al-killed rare earth treated ULC, covering a total casting time of 260 min. The second SEN was used for casting about 260 tons of Al-killed rare earth treated ULC, covering a total casting time of 40 min.
Figure 1 shows the curve of the tundish weight and stopper position during the casting process of six consecutive heats, and the average casting time per heat was about 50 min. It can be seen that the stopper position increases gently from an average of 63 mm to 70 mm within 149 min of casting (first three heats), then it has a sudden drop when the fourth heat casting is on, which might be due to the clogs peeling off in the SEN. The stopper position increases linearly from 65 mm to the peak of 79.9 mm during the fifth heat stage. Considering the stability of the casting process, a new SEN was applied to replace the clogged nozzle (SEN 1) for the casting in the sixth heat stage through nozzle fast-exchange technology until the end of casting (SEN 2).
The typical morphologies of offline SENs are shown in Figure 2a–d. Here, three parameters were introduced to describe the clog morphology and establish a SEN clog geometry model, as shown in Figure 2e. The parameters x and y represent the port width and height of the clogged nozzle, respectively, and the block rate of the SEN was defined as Equation (1) to quantify the volume of nozzle clogs.
Block   rate = V n V c V n × 100 %
where, Vc is the actual volume of the flow region in the SEN with clogs, m3; and Vn is the initial volume of the flow region in the SEN under the slag-line without clogs.

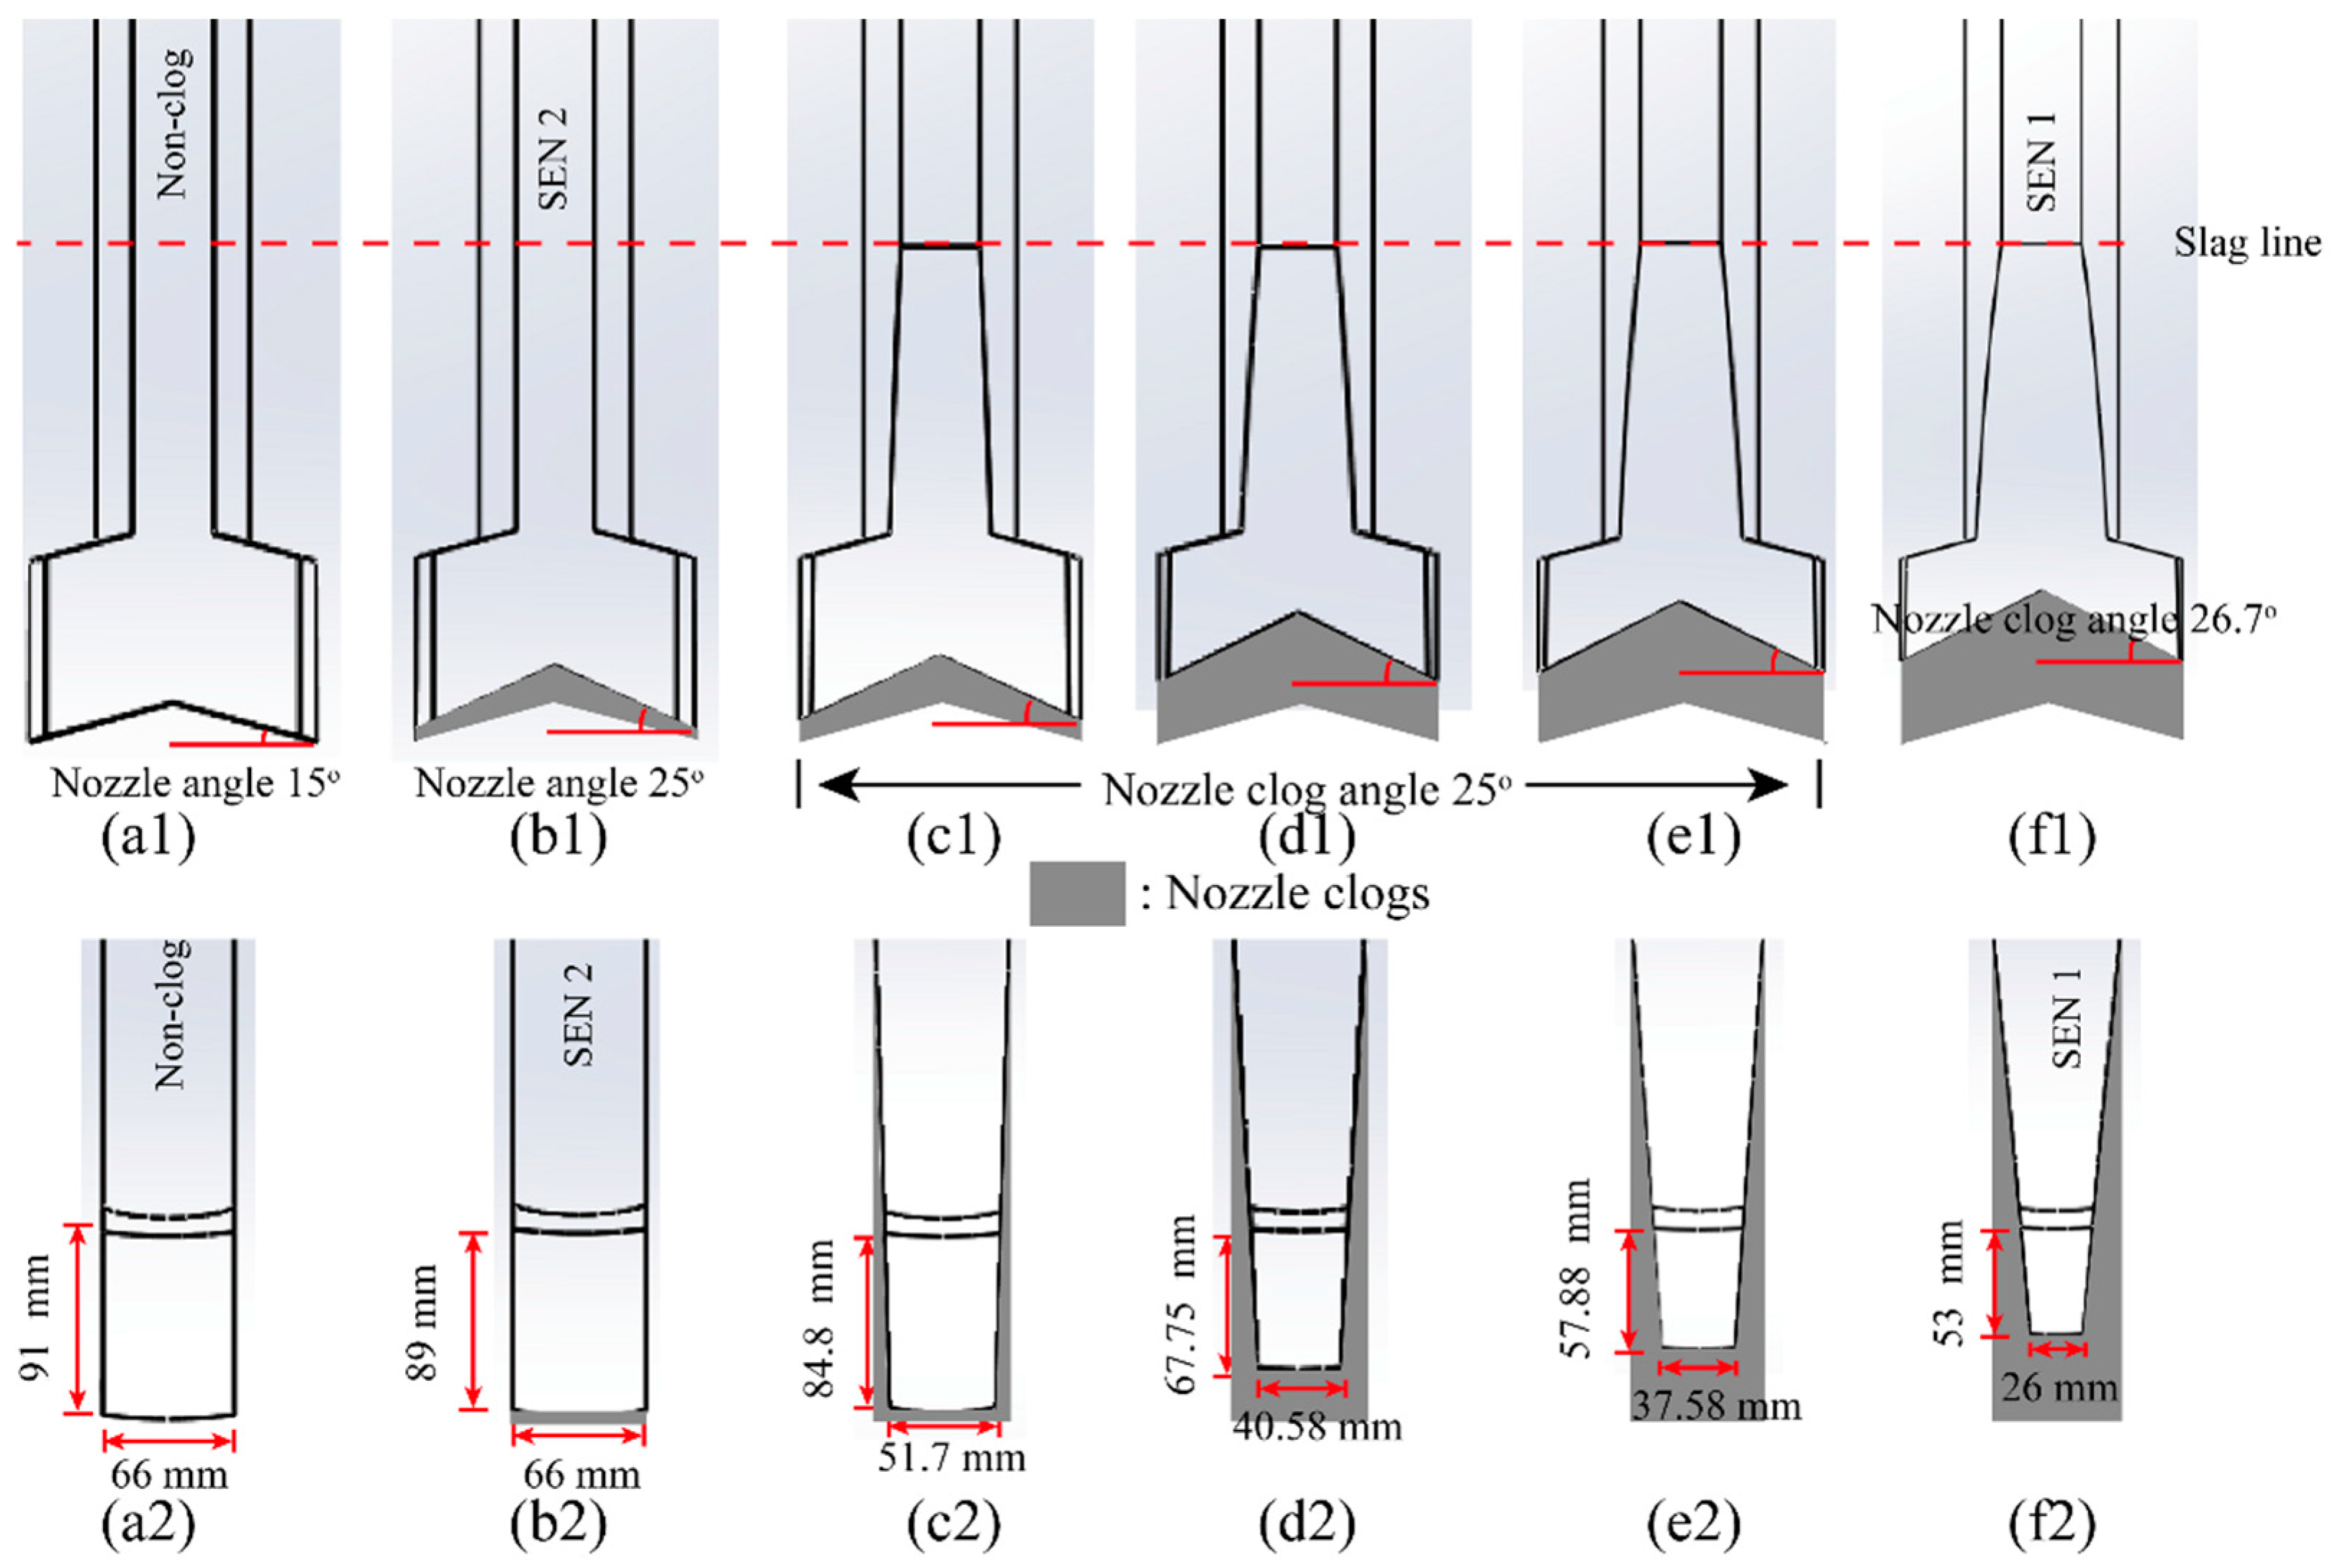
2.2. Geometry Model of SEN Clogging

The basic geometry models with block rates of 45.9% and 10.32% are described according to the dissection results of SEN1 and SEN2, respectively. The initial nozzle clog angle was 26.7° in SEN1 and 25° in SEN2, as shown in Figure 2b,d, and the ratio of x and y is 0.74 in SEN1 and 0.49 in SEN2. The outlet of the SEN shrinks gradually, but the nozzle angle hardly changes with an increase of block rate when comparing SEN1 and SEN2. In order to investigate the effect of clogs at different casting stages on the flow in the mold, three cases with block rates of 23.05%, 38.17%, and 41.34% were designed through the mathematical description of clogs’ morphology, based on the assumption that the clog grows at a specific speed with a fixed nozzle clog angle of 25° and an average ratio (x/y) of 0.615. Figure 3 shows the detailed description of the geometry model of SENs with different block rates. The gray area represents the nozzle clogs in the nozzle. Table 1 shows the detailed geometry information and the block rate calculation parameters.

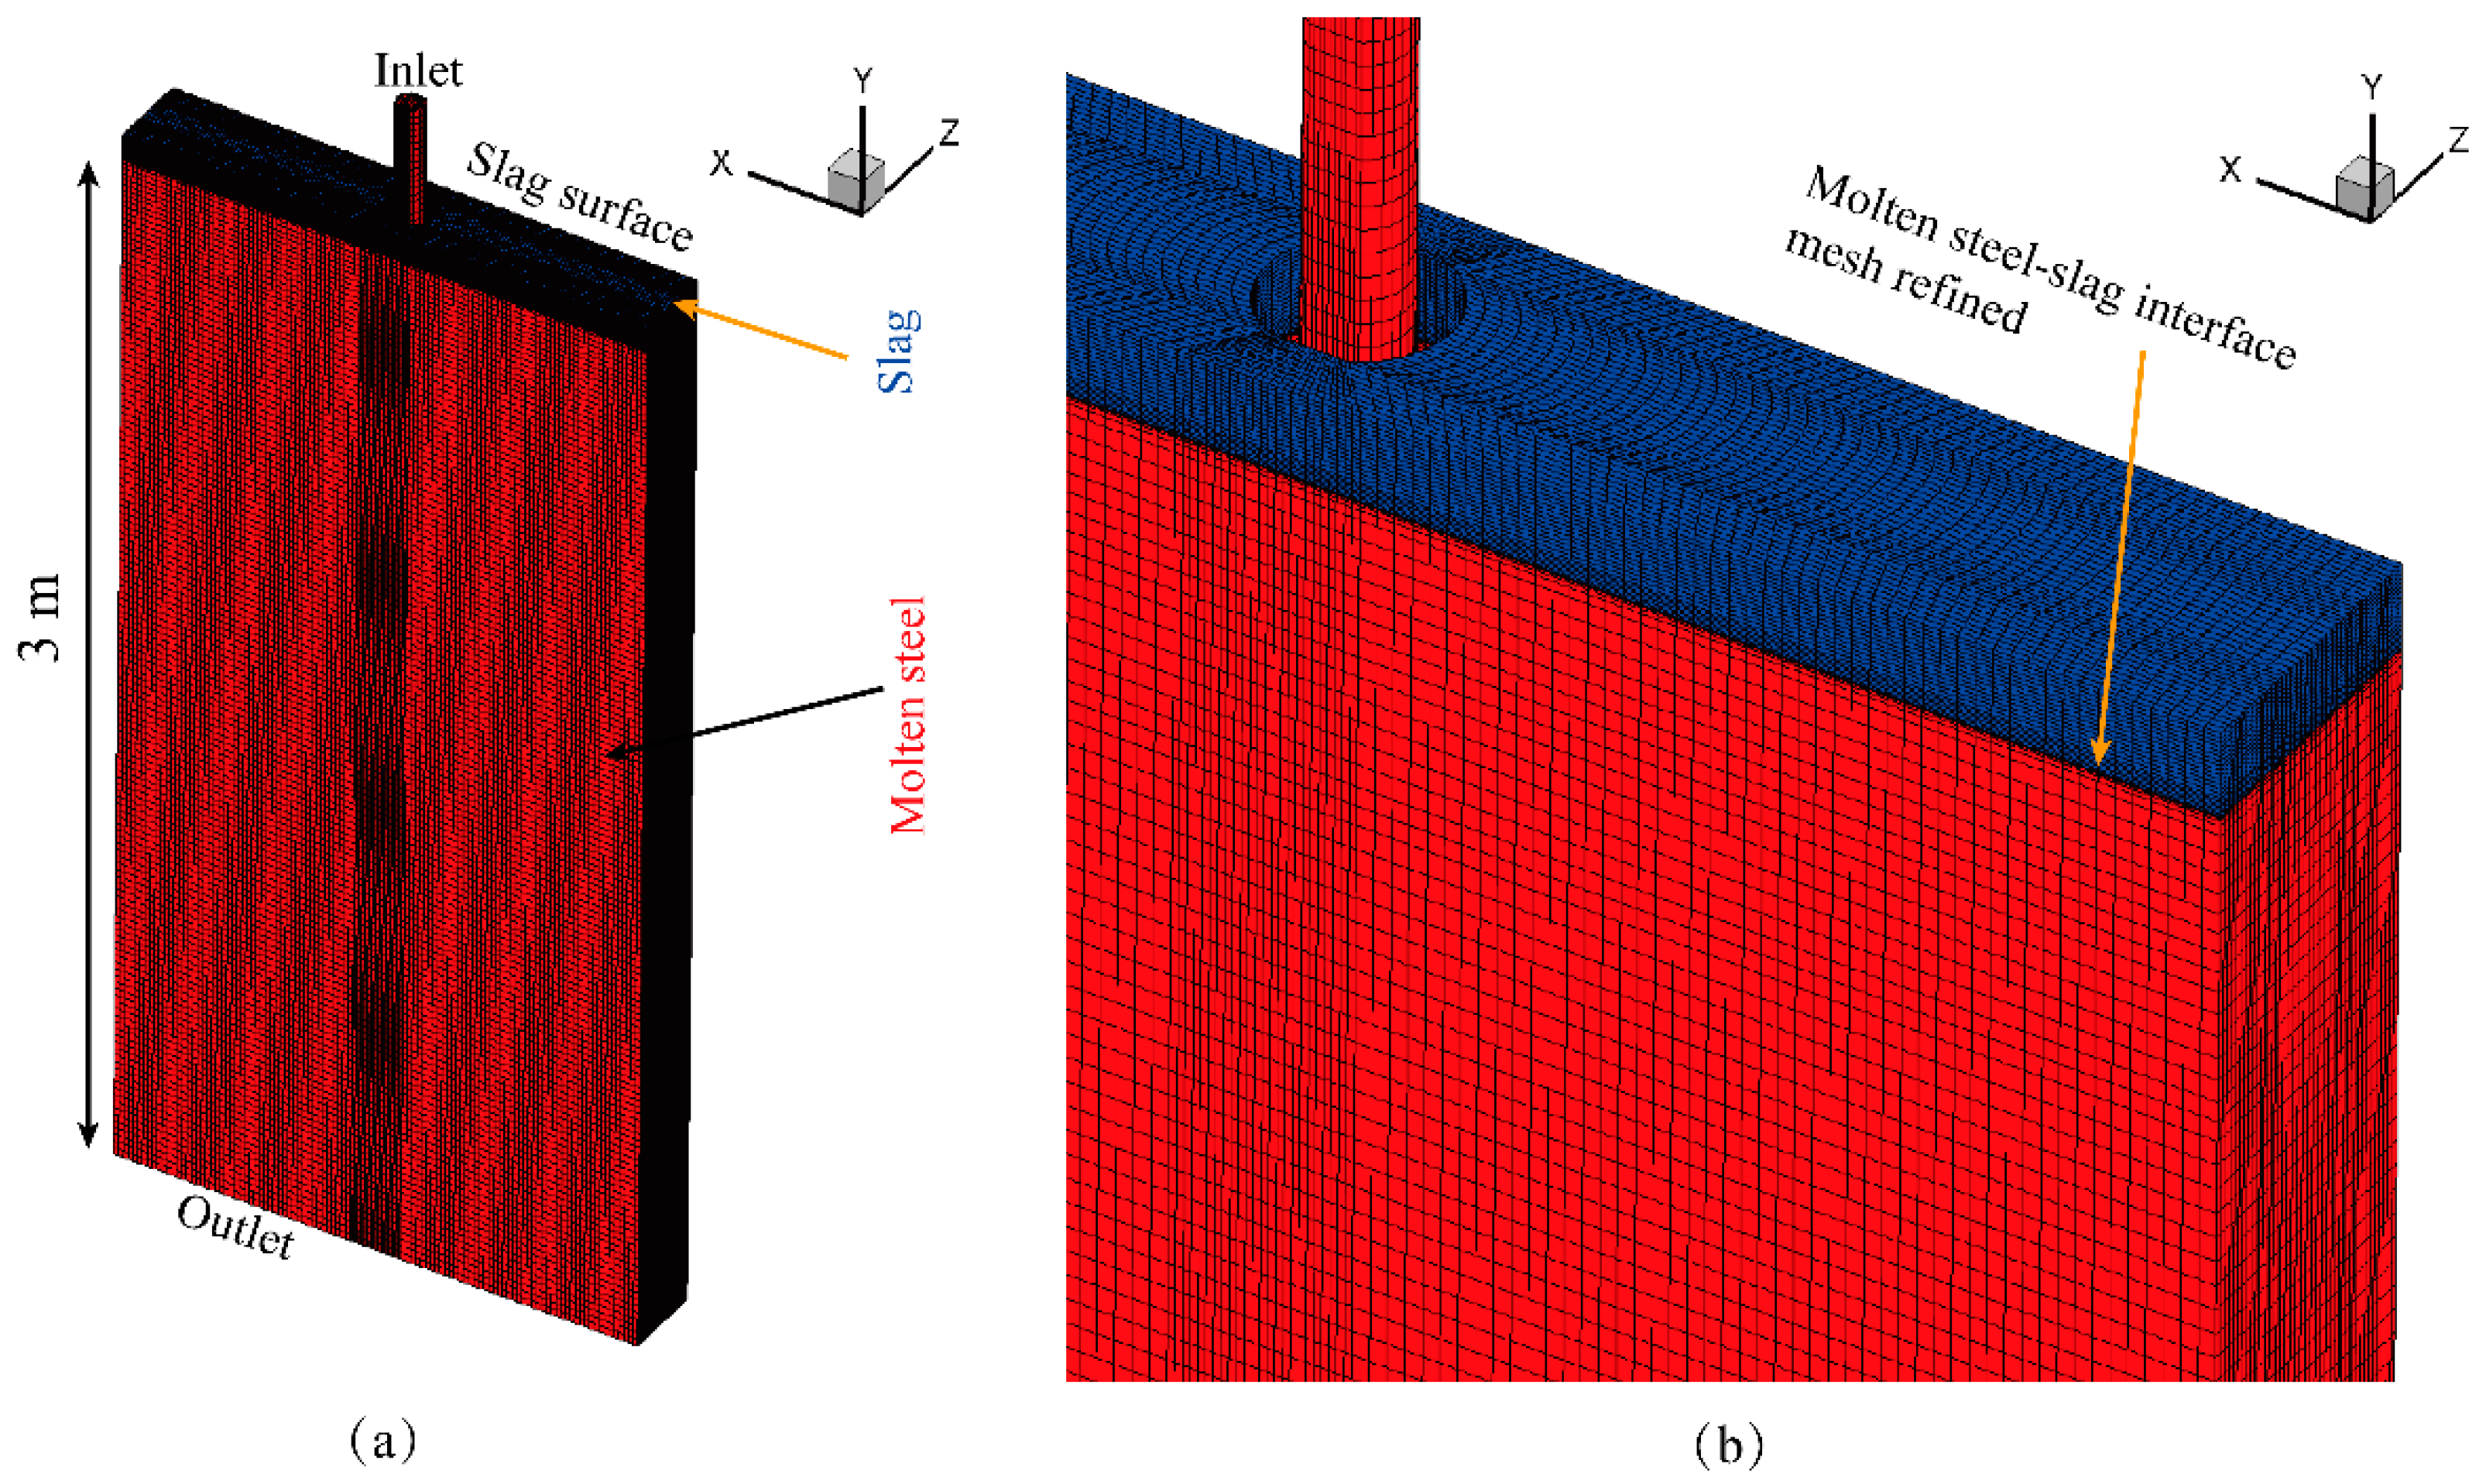
2.3. Numerical Modeling Methods for the Fluid Flow and Slag Layer in the Mold

Several model assumptions were made. The molten steel was an incompressible Newtonian fluid. The heat transfer and the molten steel solidified was neglected. The material properties of the molten steel and molten slag were constant. In the initial condition, the molten steel was full in the SEN and mold. The molten slag was uniform above the molten steel in the mold. The LES model, combined with the VOF model, was applied to simulate the turbulent flow and slag layer fluctuation in the mold using ANSYS Fluent software (ANSYS, Inc., Canonsburg, PA, USA). The VOF model was suitable to simulate the interface between the two kinds of insoluble phase [18]. The ANSYS Fluent official help documents provided the relevant governing equations. The mesh quality was above 0.55. Considering that finer cells could reduce the velocity errors while significantly increasing the simulation time, the present case refers to the recommended cell number in the description of the fluid flow in the mold, which can control the velocity errors below 5% [19]. Based on the research results, the whole model was about 1.2 million cell zones.
The parameters for modeling are listed in Table 2. In this study, the fluid zone was discretized to hexahedral meshes with refinement meshes in the steel–slag interface to capture the interface interaction between steel and slag, as shown in Figure 4. The minimum size of the mesh was in the steel–slag interface, which was 0.5 mm. Previous research also proved it was very fine and the solution was high enough [8]. The LES coupled with the Smagorinsky–Lilly SGS model was adopted, and Cs was the Smagorinsky constant. The Cs was set to 0.12, which was referenced from a previous study [8]. The inlet boundary was defined as velocity inlet and the “No Perturbations” option was selected, the slag surface was defined as a free surface, and the mold bottom was defined as the outflow. The bounded second-order implicit transient formulation and the bounded central-differencing scheme were adopted. The SIMPLE scheme was adapted for coupling the pressure and velocity. The residual continuity, x-velocity, y-velocity, z-velocity, and vf-phase-2 were set at 0.001. The Intel E5-2650 processor at 2.30 GHz (2 processes) with 64 Gb of random-access memory was used. The total calculation time for a case was about 30 h. For each case, the transient simulation lasts 40 s, and the calculation results between the 20 s to 40 s were analyzed.

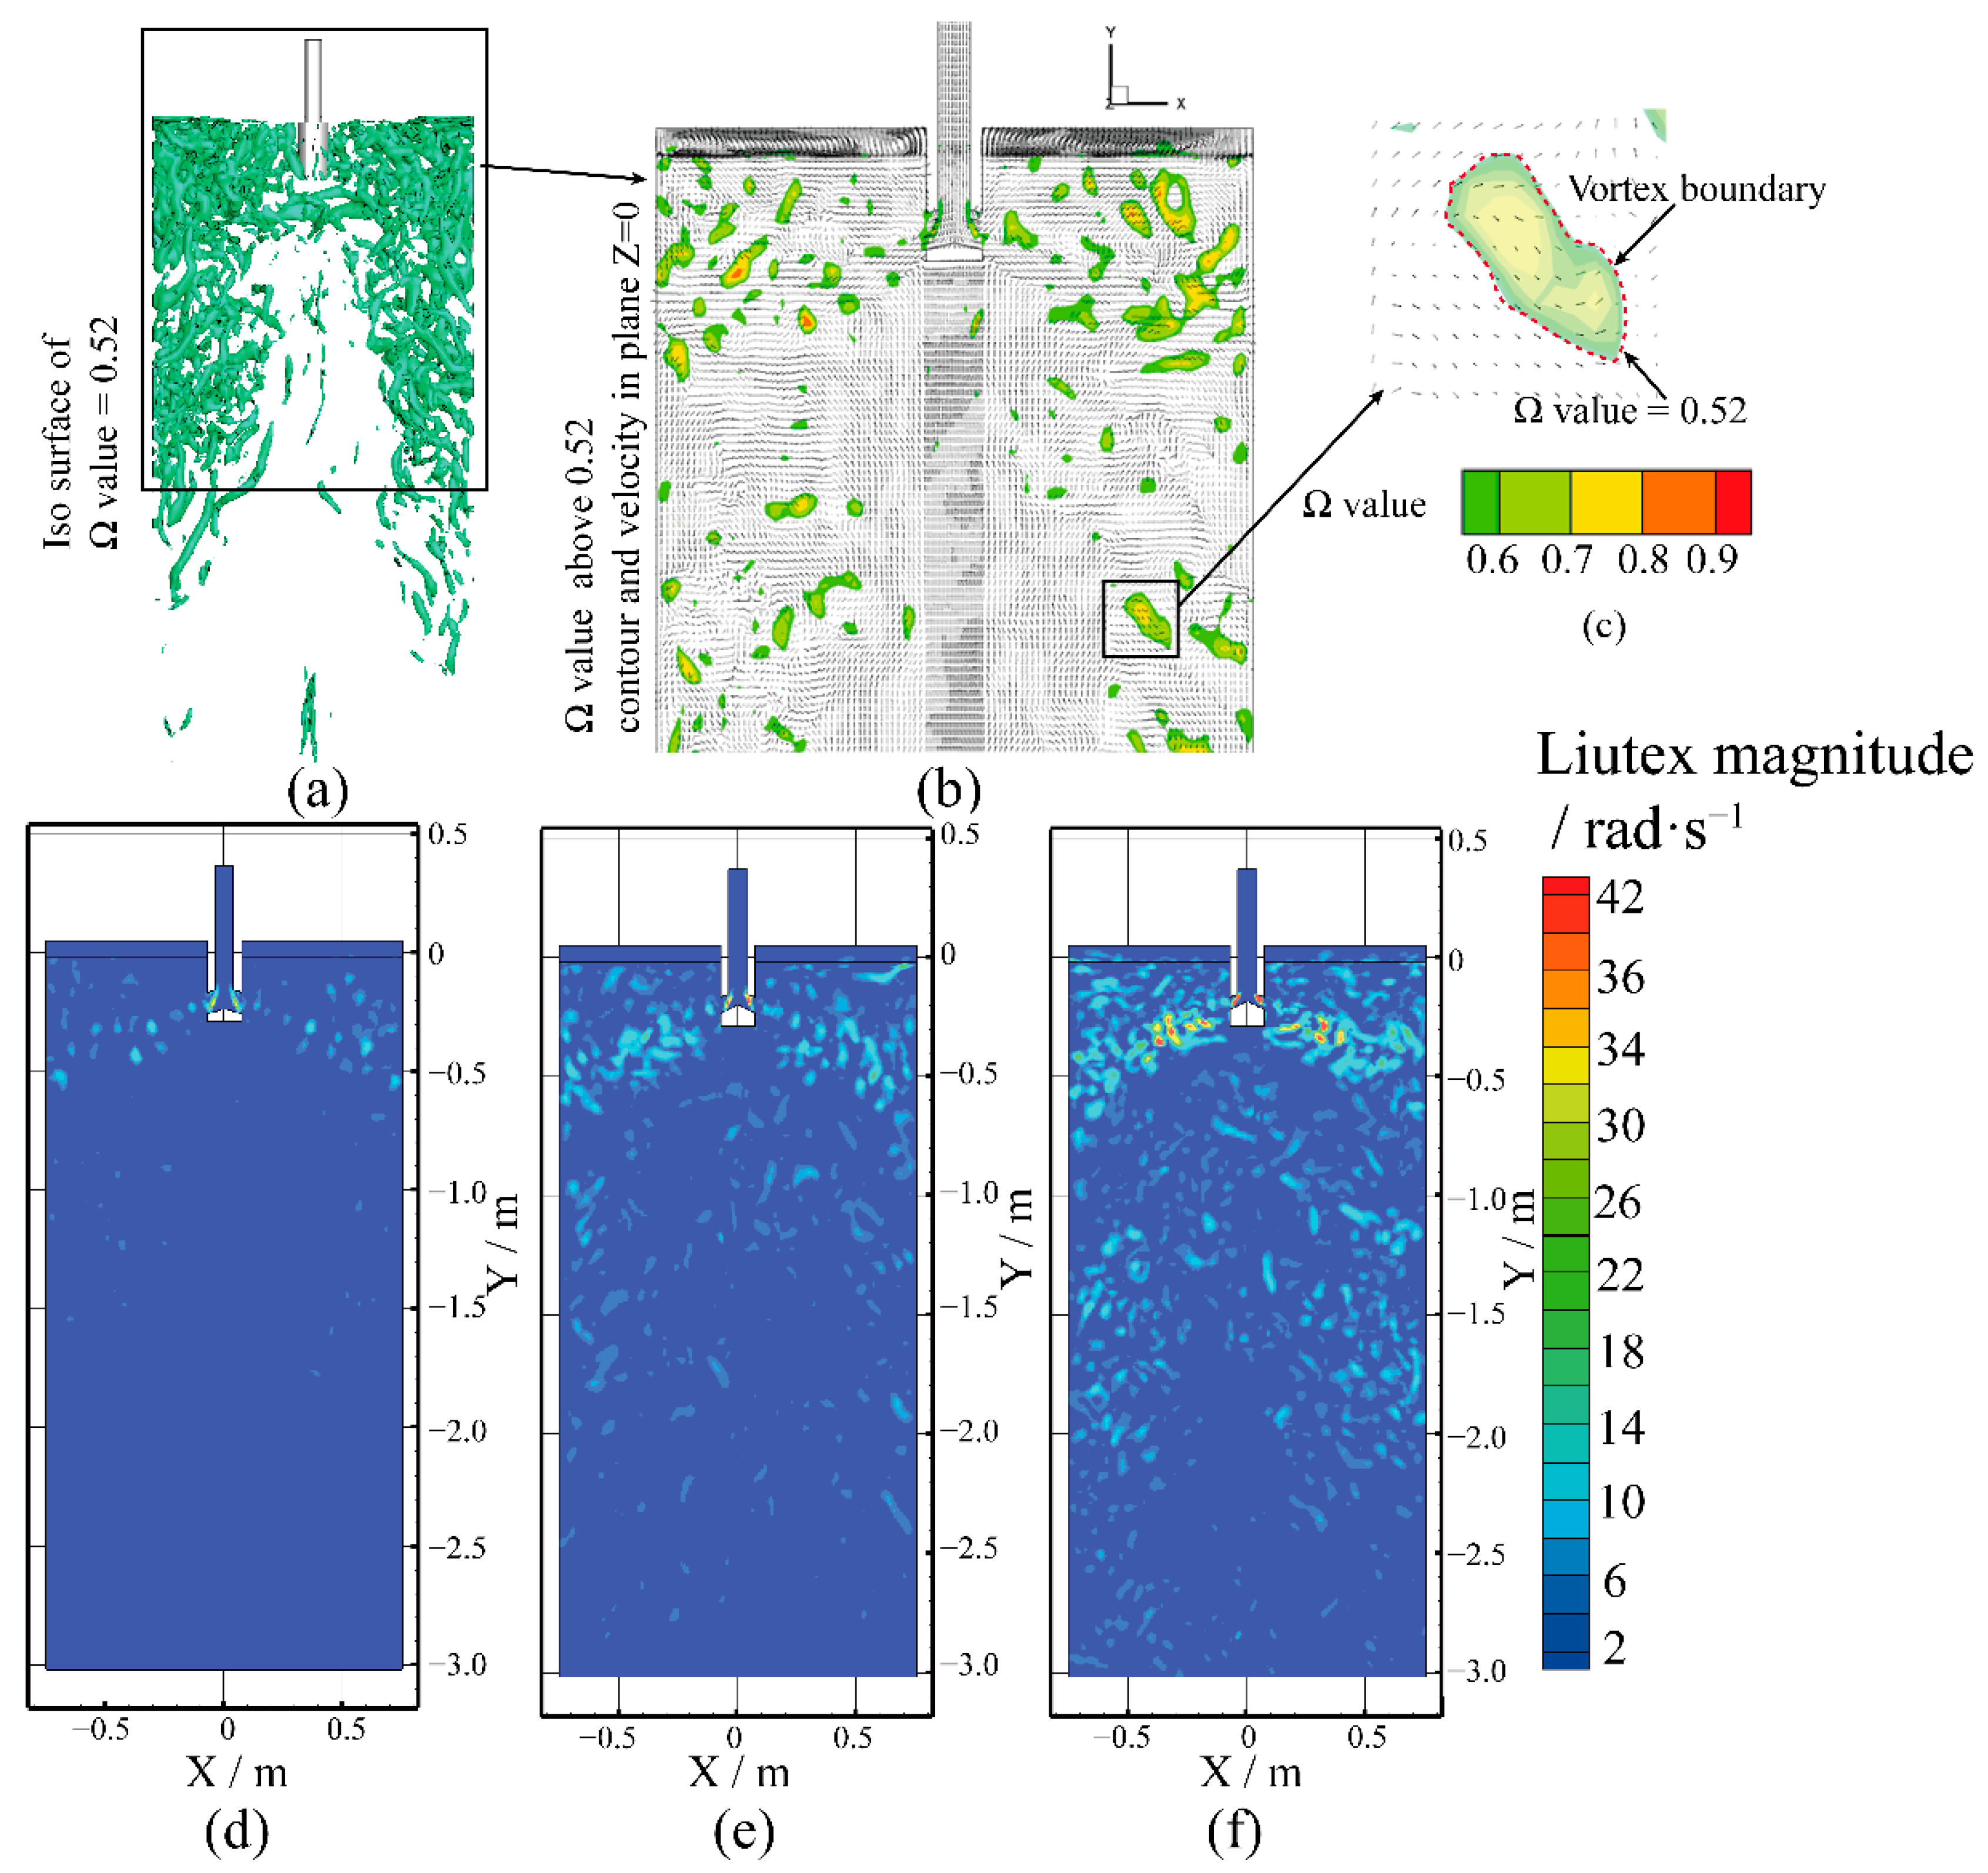
2.4. Vortex Visualization and Quantification in Mold

The vortex represents the rotation flow in the fluid, which plays an essential role in turbulent flow generation and maintenance [20]. The vortex affects the sediment accumulation [21], which was similar to the inclusion transport in the mold. The vortex also affects the slag entrapment in the mold, which was justified by the numerical simulation [22] and water model simulation [16]. The Liutex magnitude reveals the rotation magnitude of the vortex. The Ω method [23,24,25,26] was adopted to visualize the calculation of Equation (2) through to Equation (5). The vortex boundary was determined by the iso-surface of the Ω value of 0.52 recommended by previous research [20,23]. The size and shape of vortex were quantified through Image J (National Institutes of Health, Bethesda, MA, USA.) image processing software. It has been pointed out that the calculation of the Ω value may result in errors when the denominator is too small; thus, Dong et al. [27] introduced a positive value ε in the denominator as described in Equation (6). All of the calculation was carried out under the cartesian coordinates as follows:
v = [ u x u y u z v x v y v z w x w y w z ] = A + B
A = 1 2 ( v + v T ) = [ u x 1 2 ( u y + v x ) 1 2 ( u z + w x ) 1 2 ( u y + v x ) v y 1 2 ( v z + w y ) 1 2 ( u z + w x ) 1 2 ( v z + w y ) w z ]
B = 1 2 ( v v T ) = [ 0 1 2 ( u y v x ) 1 2 ( u z w x ) 1 2 ( u y v x ) 0 1 2 ( v z w y ) 1 2 ( u z w x ) 1 2 ( v z w y ) 0 ]
Ω = B F 2 A F 2 + B F 2 + ε
ε = 0.001 ( B F 2 A F 2 ) max
where, ∇v represents the velocity gradient tensor, A represents the symmetric part of the ∇v, B represents the antisymmetric part of the ∇v, and F represents the norm of a matrix.

3. Results and Discussion

3.1. Macroscopic Features of the SEN Clogging

Two whole SENs were mechanically cut along the centerline, as shown in Figure 5a,b. It was evident that the clogs were mainly distributed below the slag line, that is, the clogs present a tube-shaped distribution on the inner wall of the refractory and a cone-shaped distribution at the bottom of the SEN. Figure 5 shows the enlarged local features of tube-shaped clogs. In order to obtain the thickness feature of the clogs, the thickness of the clogs from the SEN inlet to the nozzle ports was measured at a 2.5 mm interval, and the measurement data was smoothed by cubic interpolation function, as shown in Figure 5d. It can be seen that as the casting time increases, the thickness of the cone-shaped clogs deposited at the bottom increases correspondingly, and the nozzle clog angles of SEN1 and SEN2 reached 26.7° and 25°, respectively. The tube-shaped clogs in SEN 1 were distributed in a range of 400 mm to 750 mm from the SEN inlet with a thickness between 2 mm and 6 mm. Although the thickness in SEN 2 was less than that in SEN 1, the range of tube-shaped clogs on the inner wall of the nozzle was wider than that in SEN 1.

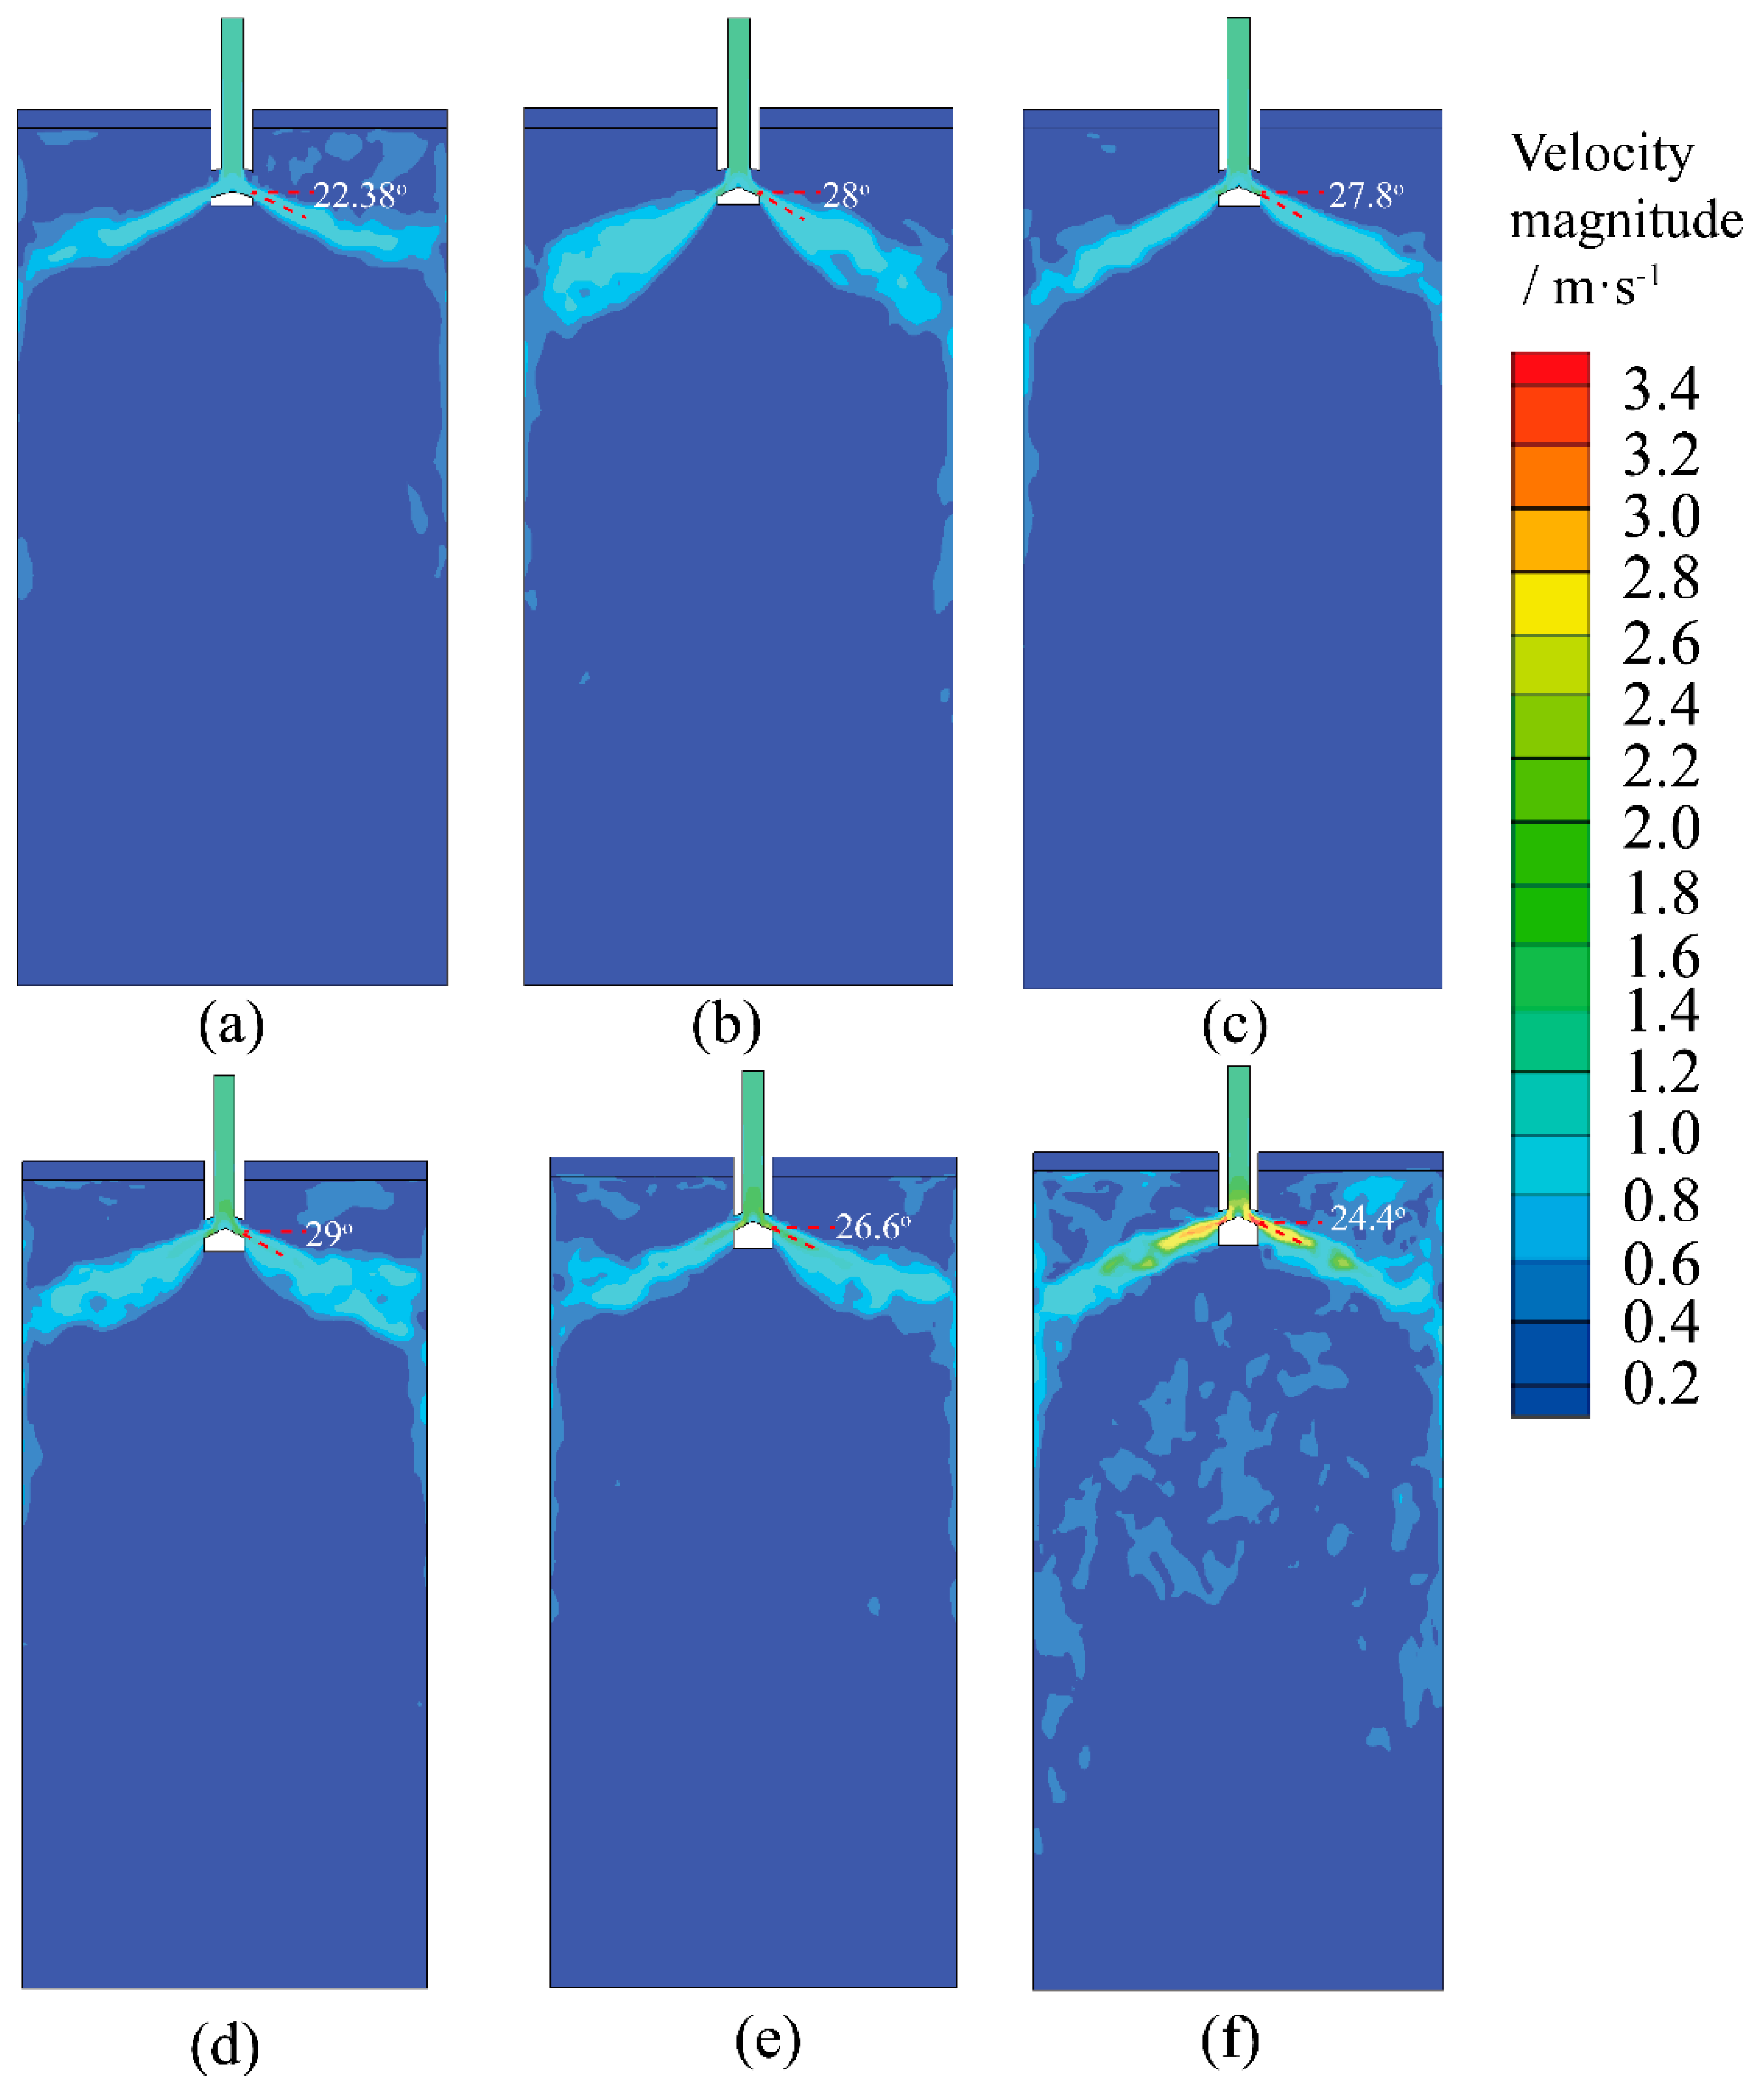
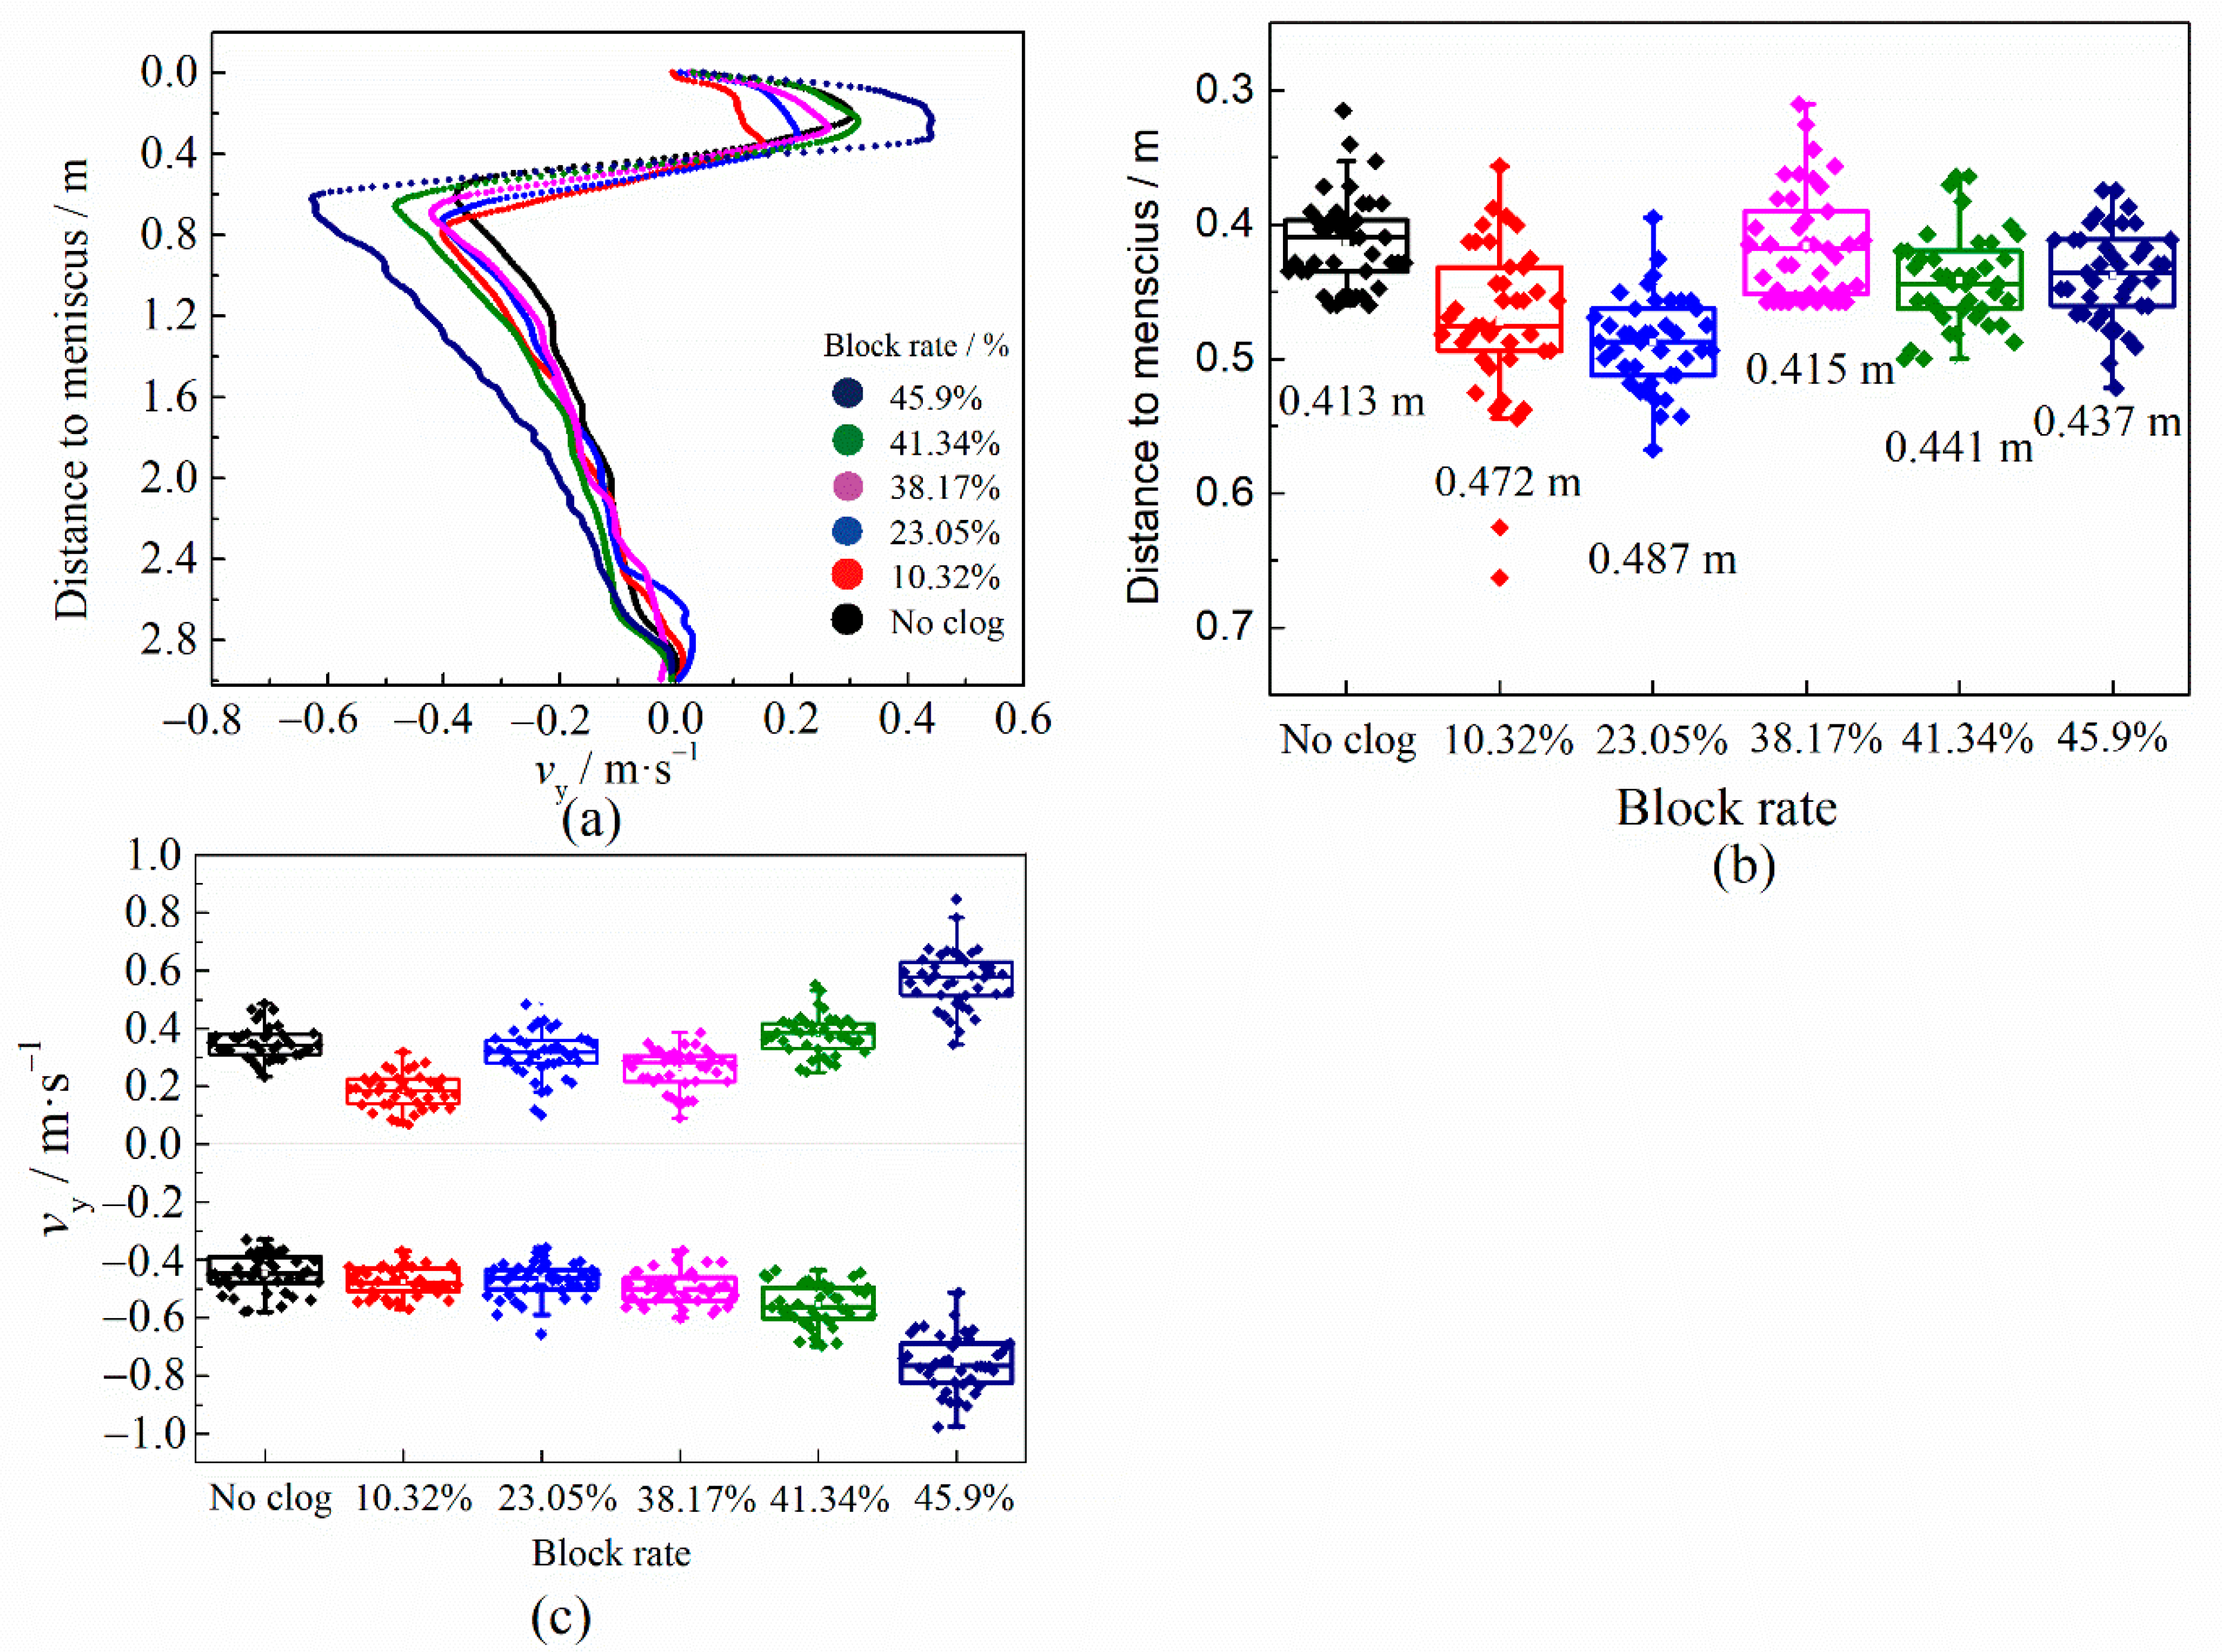
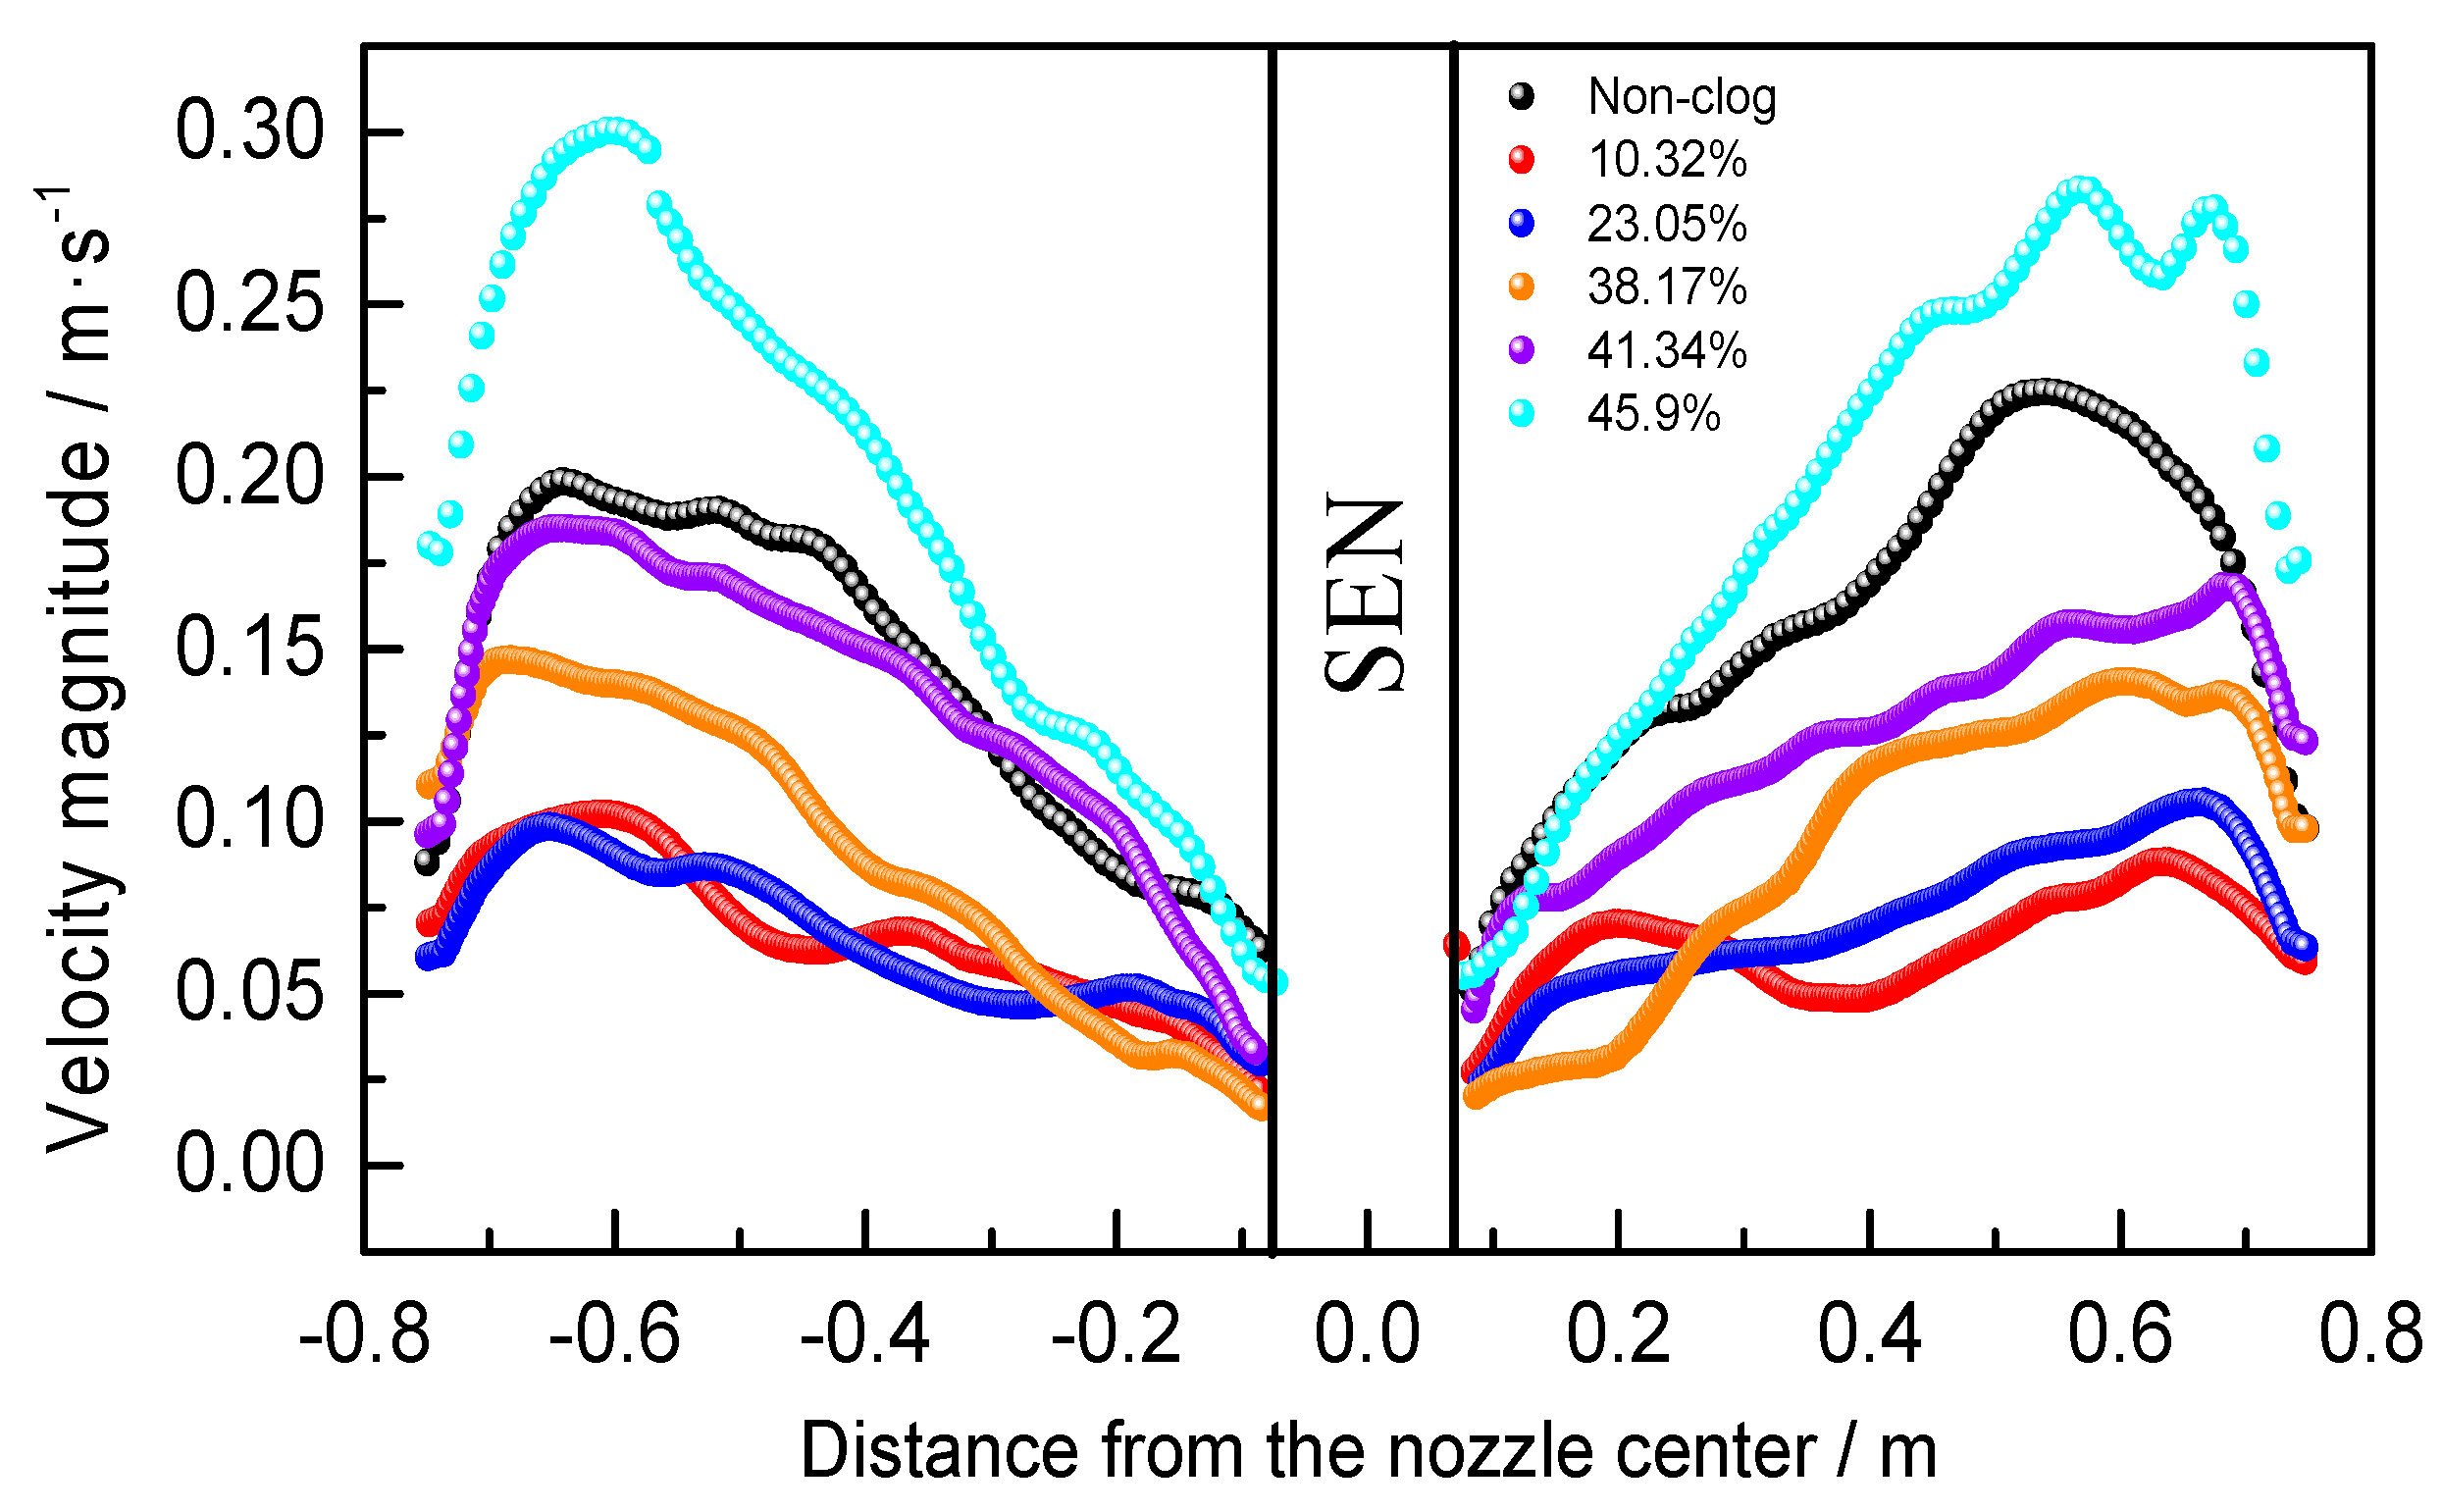
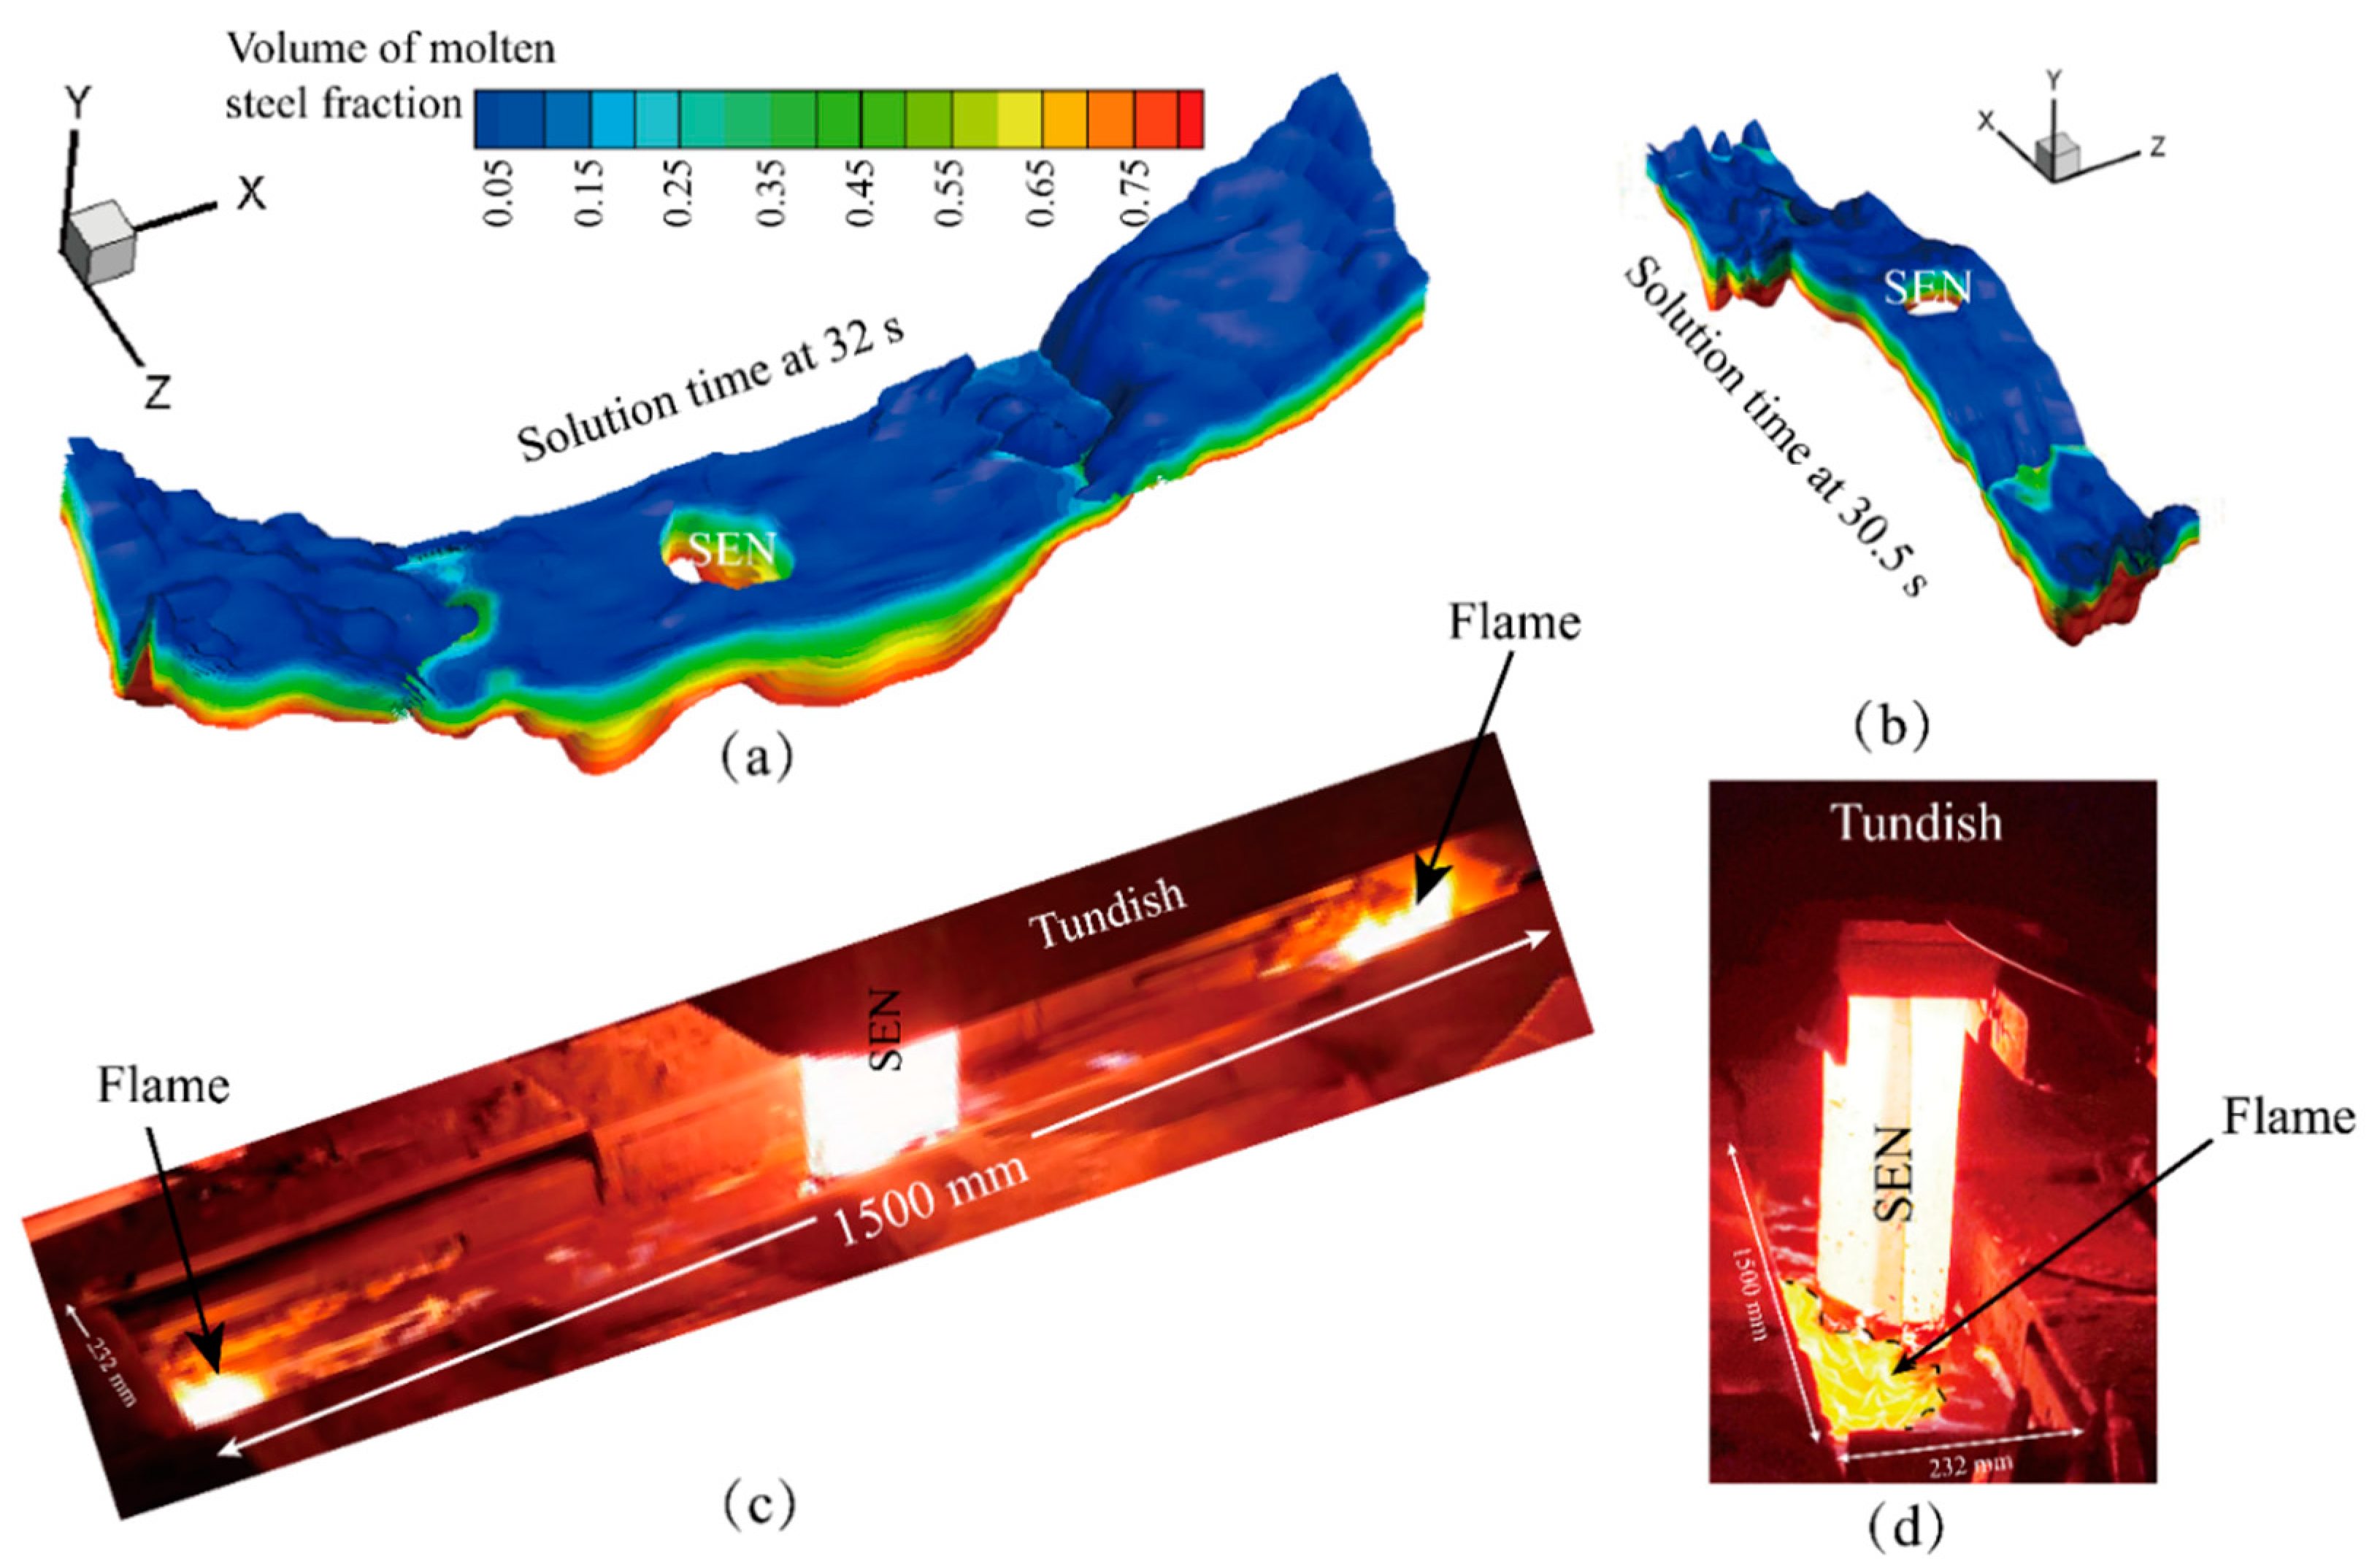
3.2. Effect of the Block Rate on Flow in the Mold

Figure 6 shows the contour of the transient-velocity magnitude at 38.5 s of solution time under different block rates. It was concluded that the jet stream velocity and the angle of the jet stream increased as the block rates increased gradually. The velocity in the outlet of the SEN was greatly enhanced when the block rate reached 41.34%. The cone-shaped clogs located at the bottom of the SEN change the jet stream’s outlet angle and reduce the outlet area, resulting in the stream velocity increase. The jet-stream angle in the outlet of the SEN was 22.38° under the non-clog case, and as the block rate increases, it gradually reaches a maximum of 29° with a block rate of 38.17%, and then the jet-stream angle decreases gradually to 24.4° with a block rate of 45.9%. The velocity magnitude contour was approximately symmetrically distributed along the nozzle center.
Several quantitative indicators were used to evaluate the influence of clogs on the flow of molten steel in the mold, as shown in Figure 7. The velocity in the y-axis (vy), reflecting the strength of upward and downward streams, was greatly influenced by the block rate. The vy near the narrow side of the mold maintained fluctuations within a narrow range of 0.3 to 0.5 m·s−1 on average with a block rate below 38.17%. This was greatly accelerated as the block rate increased from 38.17% to 45.9%, as shown in Figure 7a. The positive vy accelerated the upward stream while the negative vy promoted the downward flow. The jet stream impact-point on the narrow side of the mold changed with the block rates. As shown in Figure 7b, the average distance from the impact point to the meniscus increased from 0.413 m with the non-clog condition to 0.487 m with a 23.05% block rate, and then decreased gradually to a range of 0.415 m and 0.441 m. The jet stream impact point position was affected by two factors, including the changing of clog angles caused by cone-shaped clogs at the bottom of the SEN and the shrinking of the outlet area of the SEN caused by tube-shaped clogs combining with the cone-shaped clogs. It can be seen from Figure 7c that the average vy in the clogged case exceeded that of the non-clog case when the block rate was higher than 41.34%.

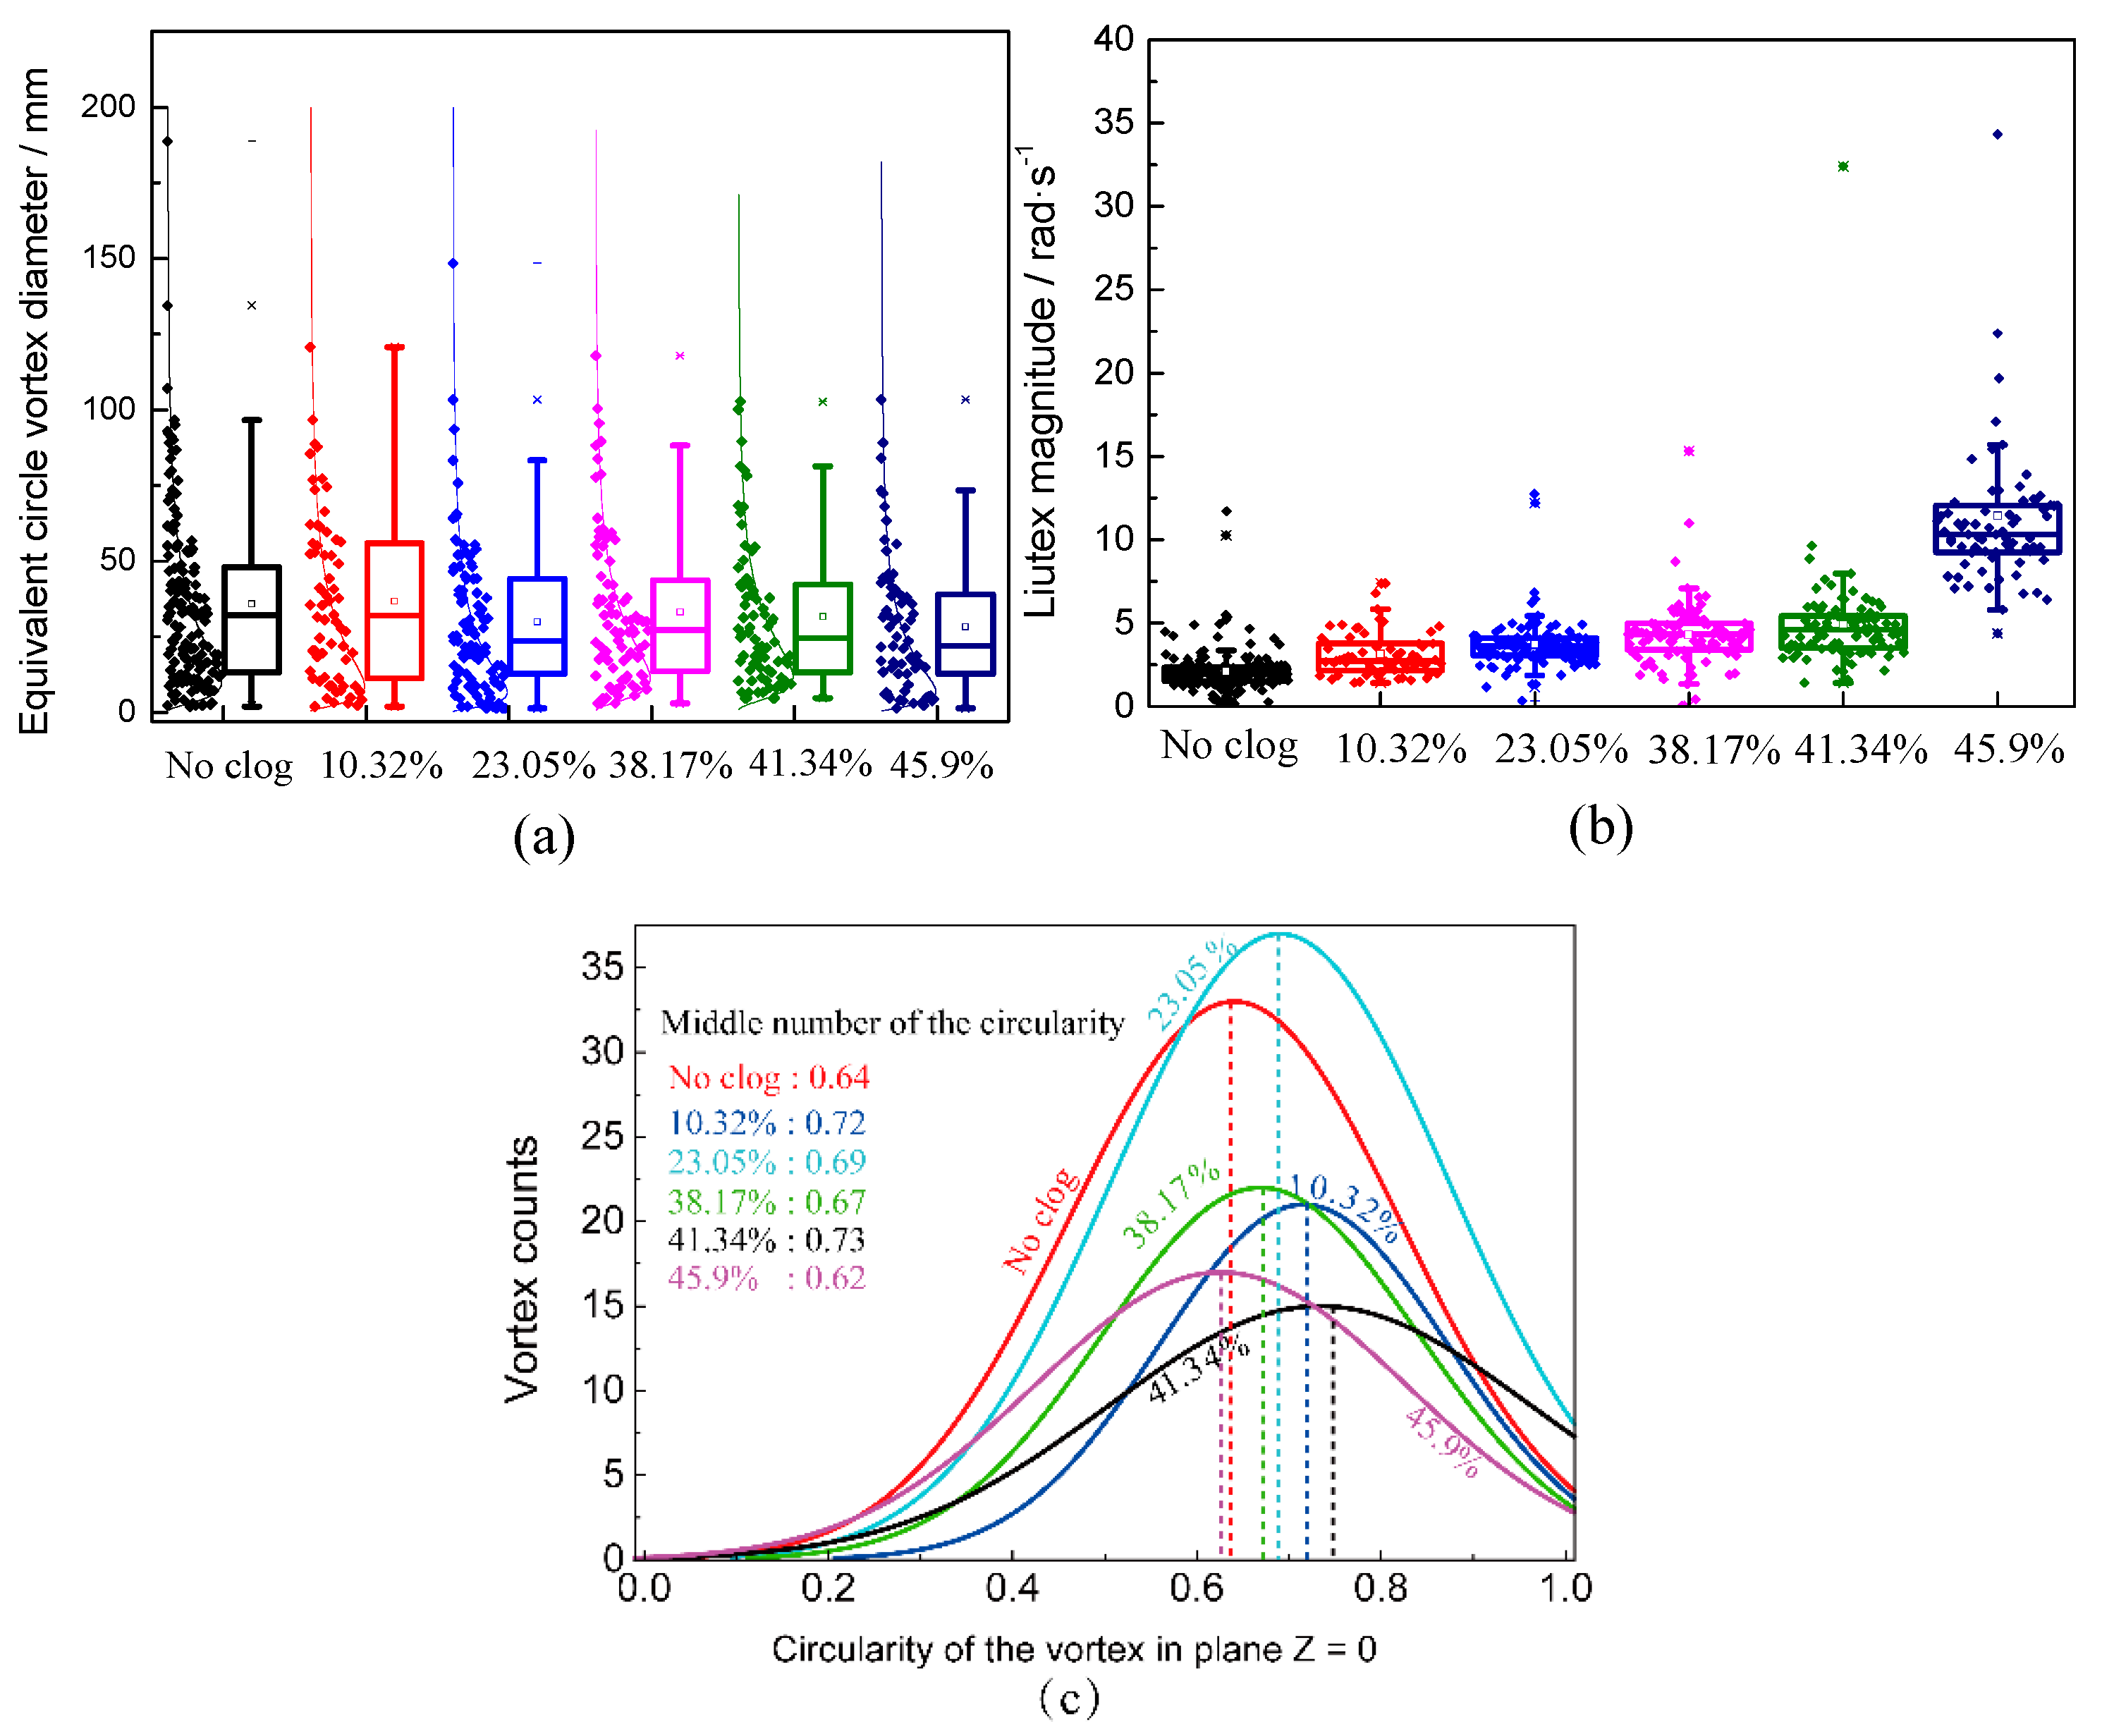
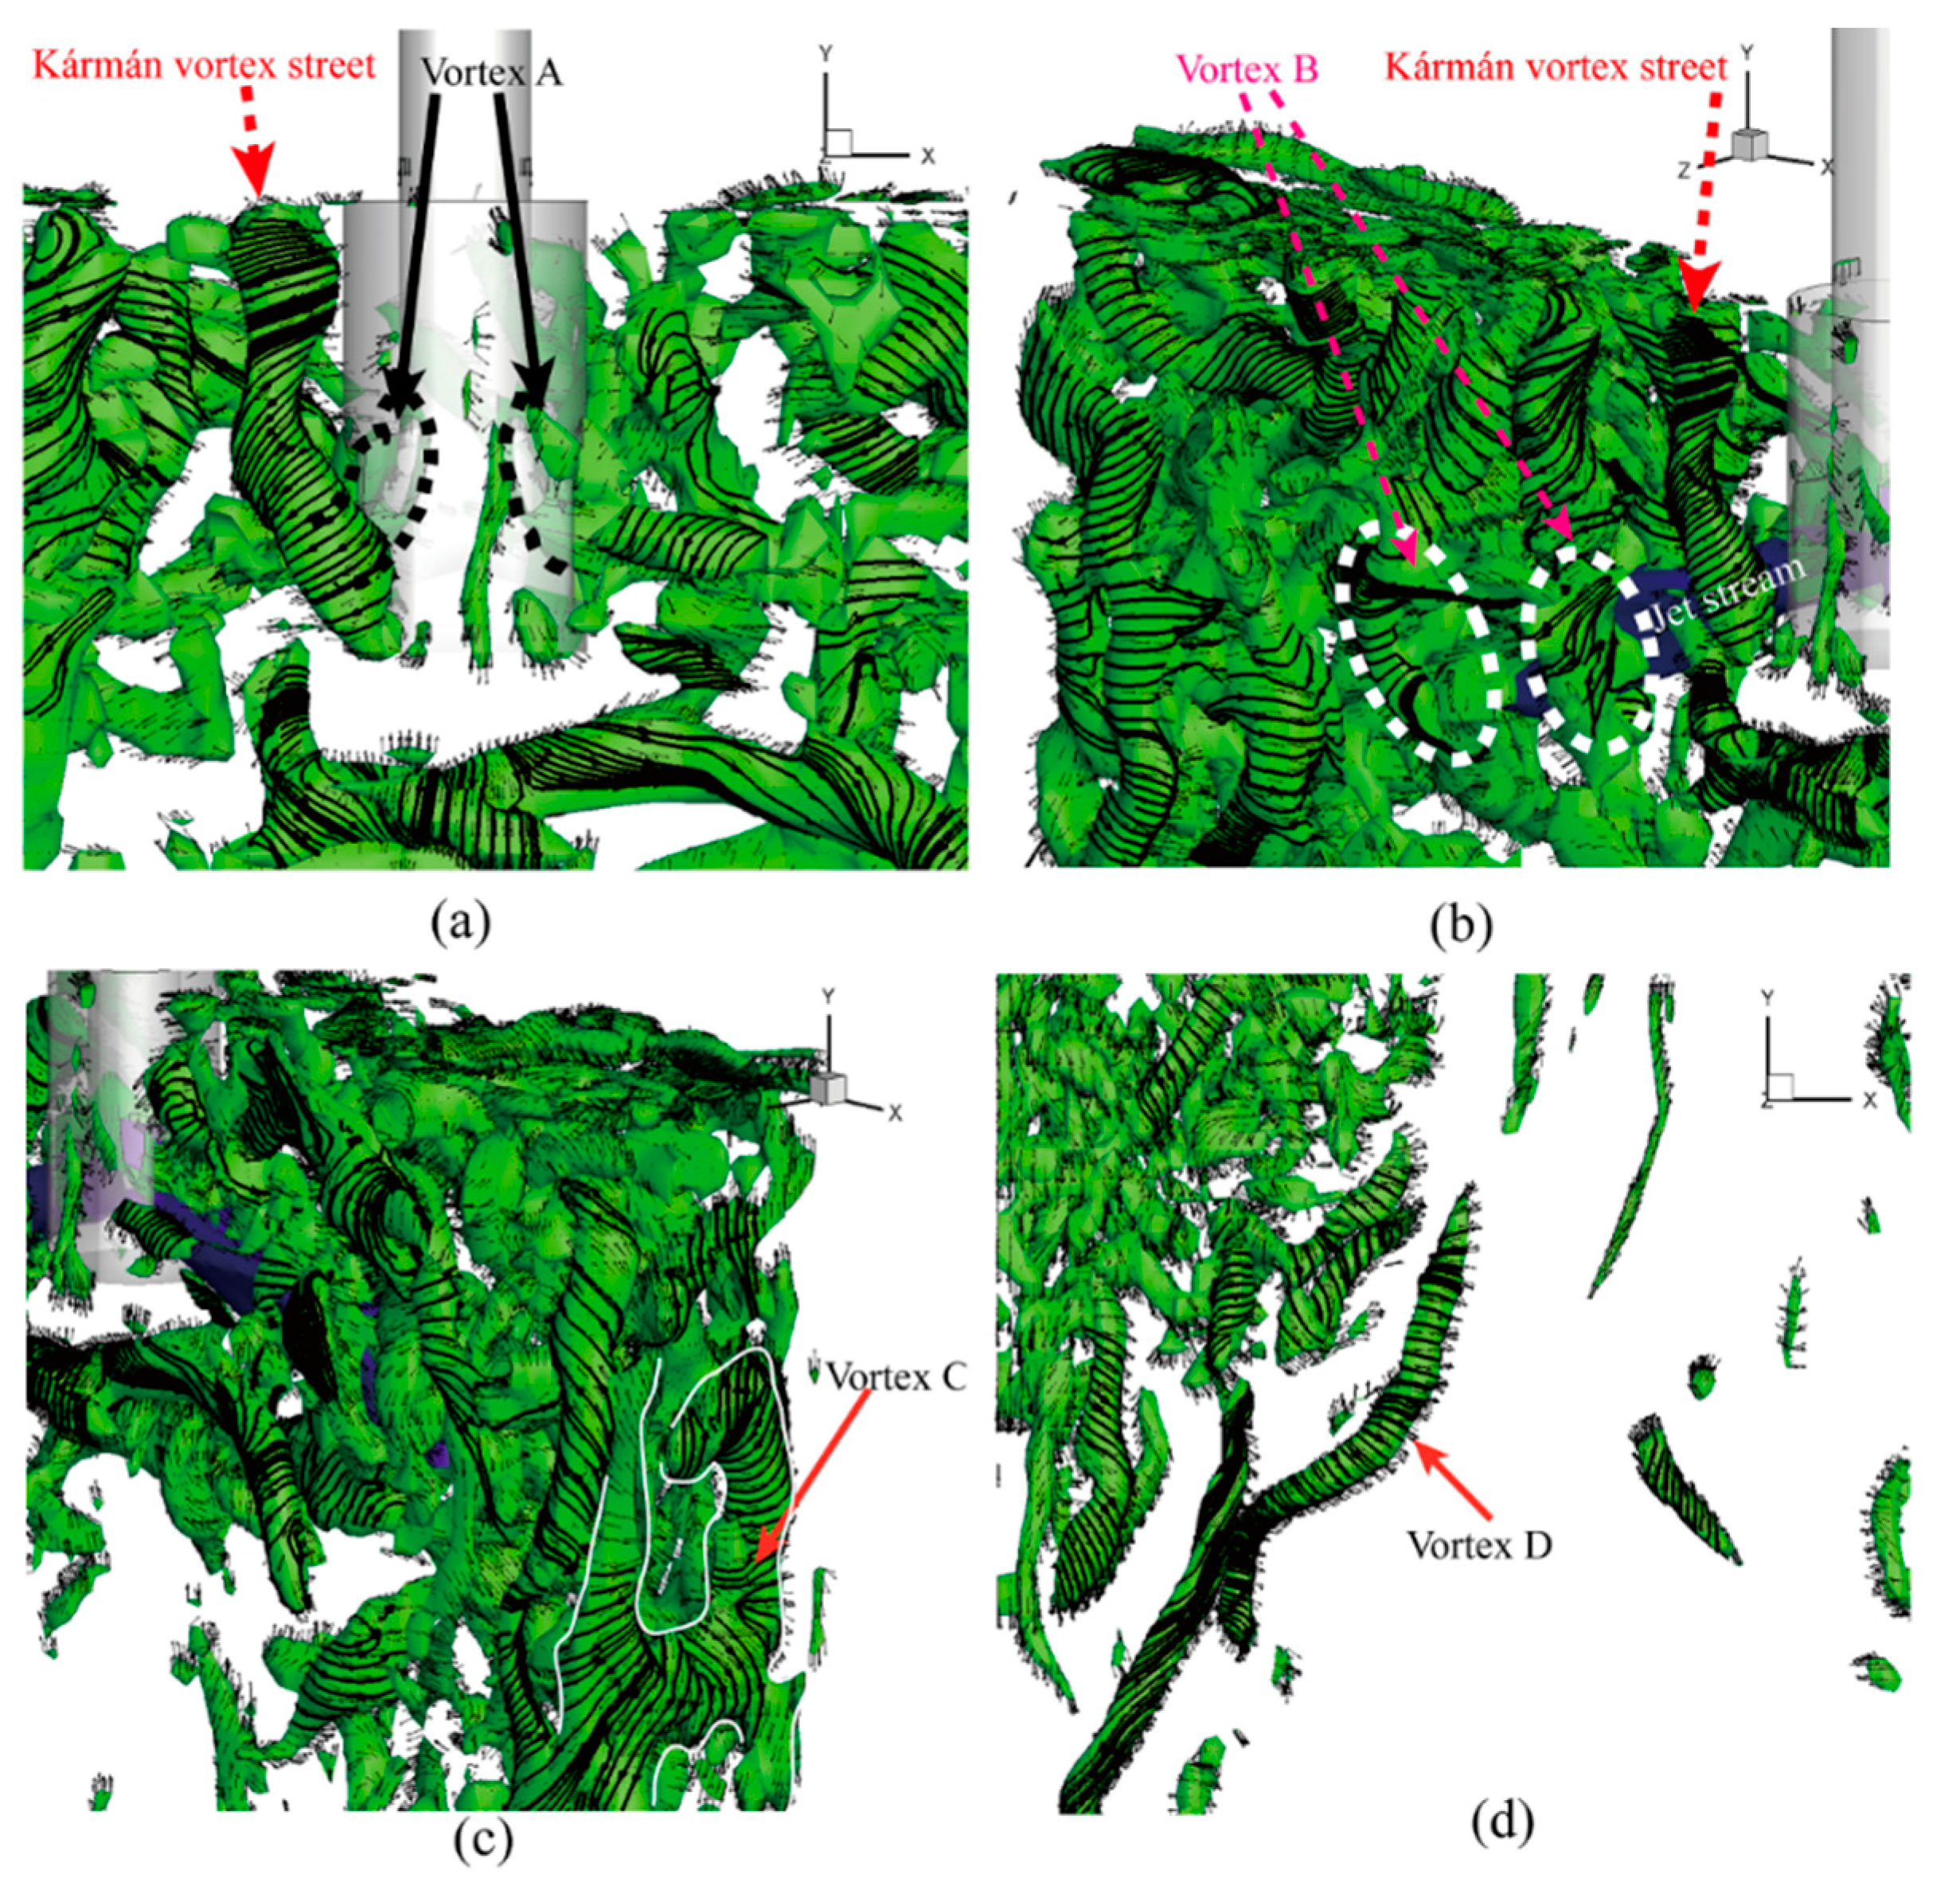
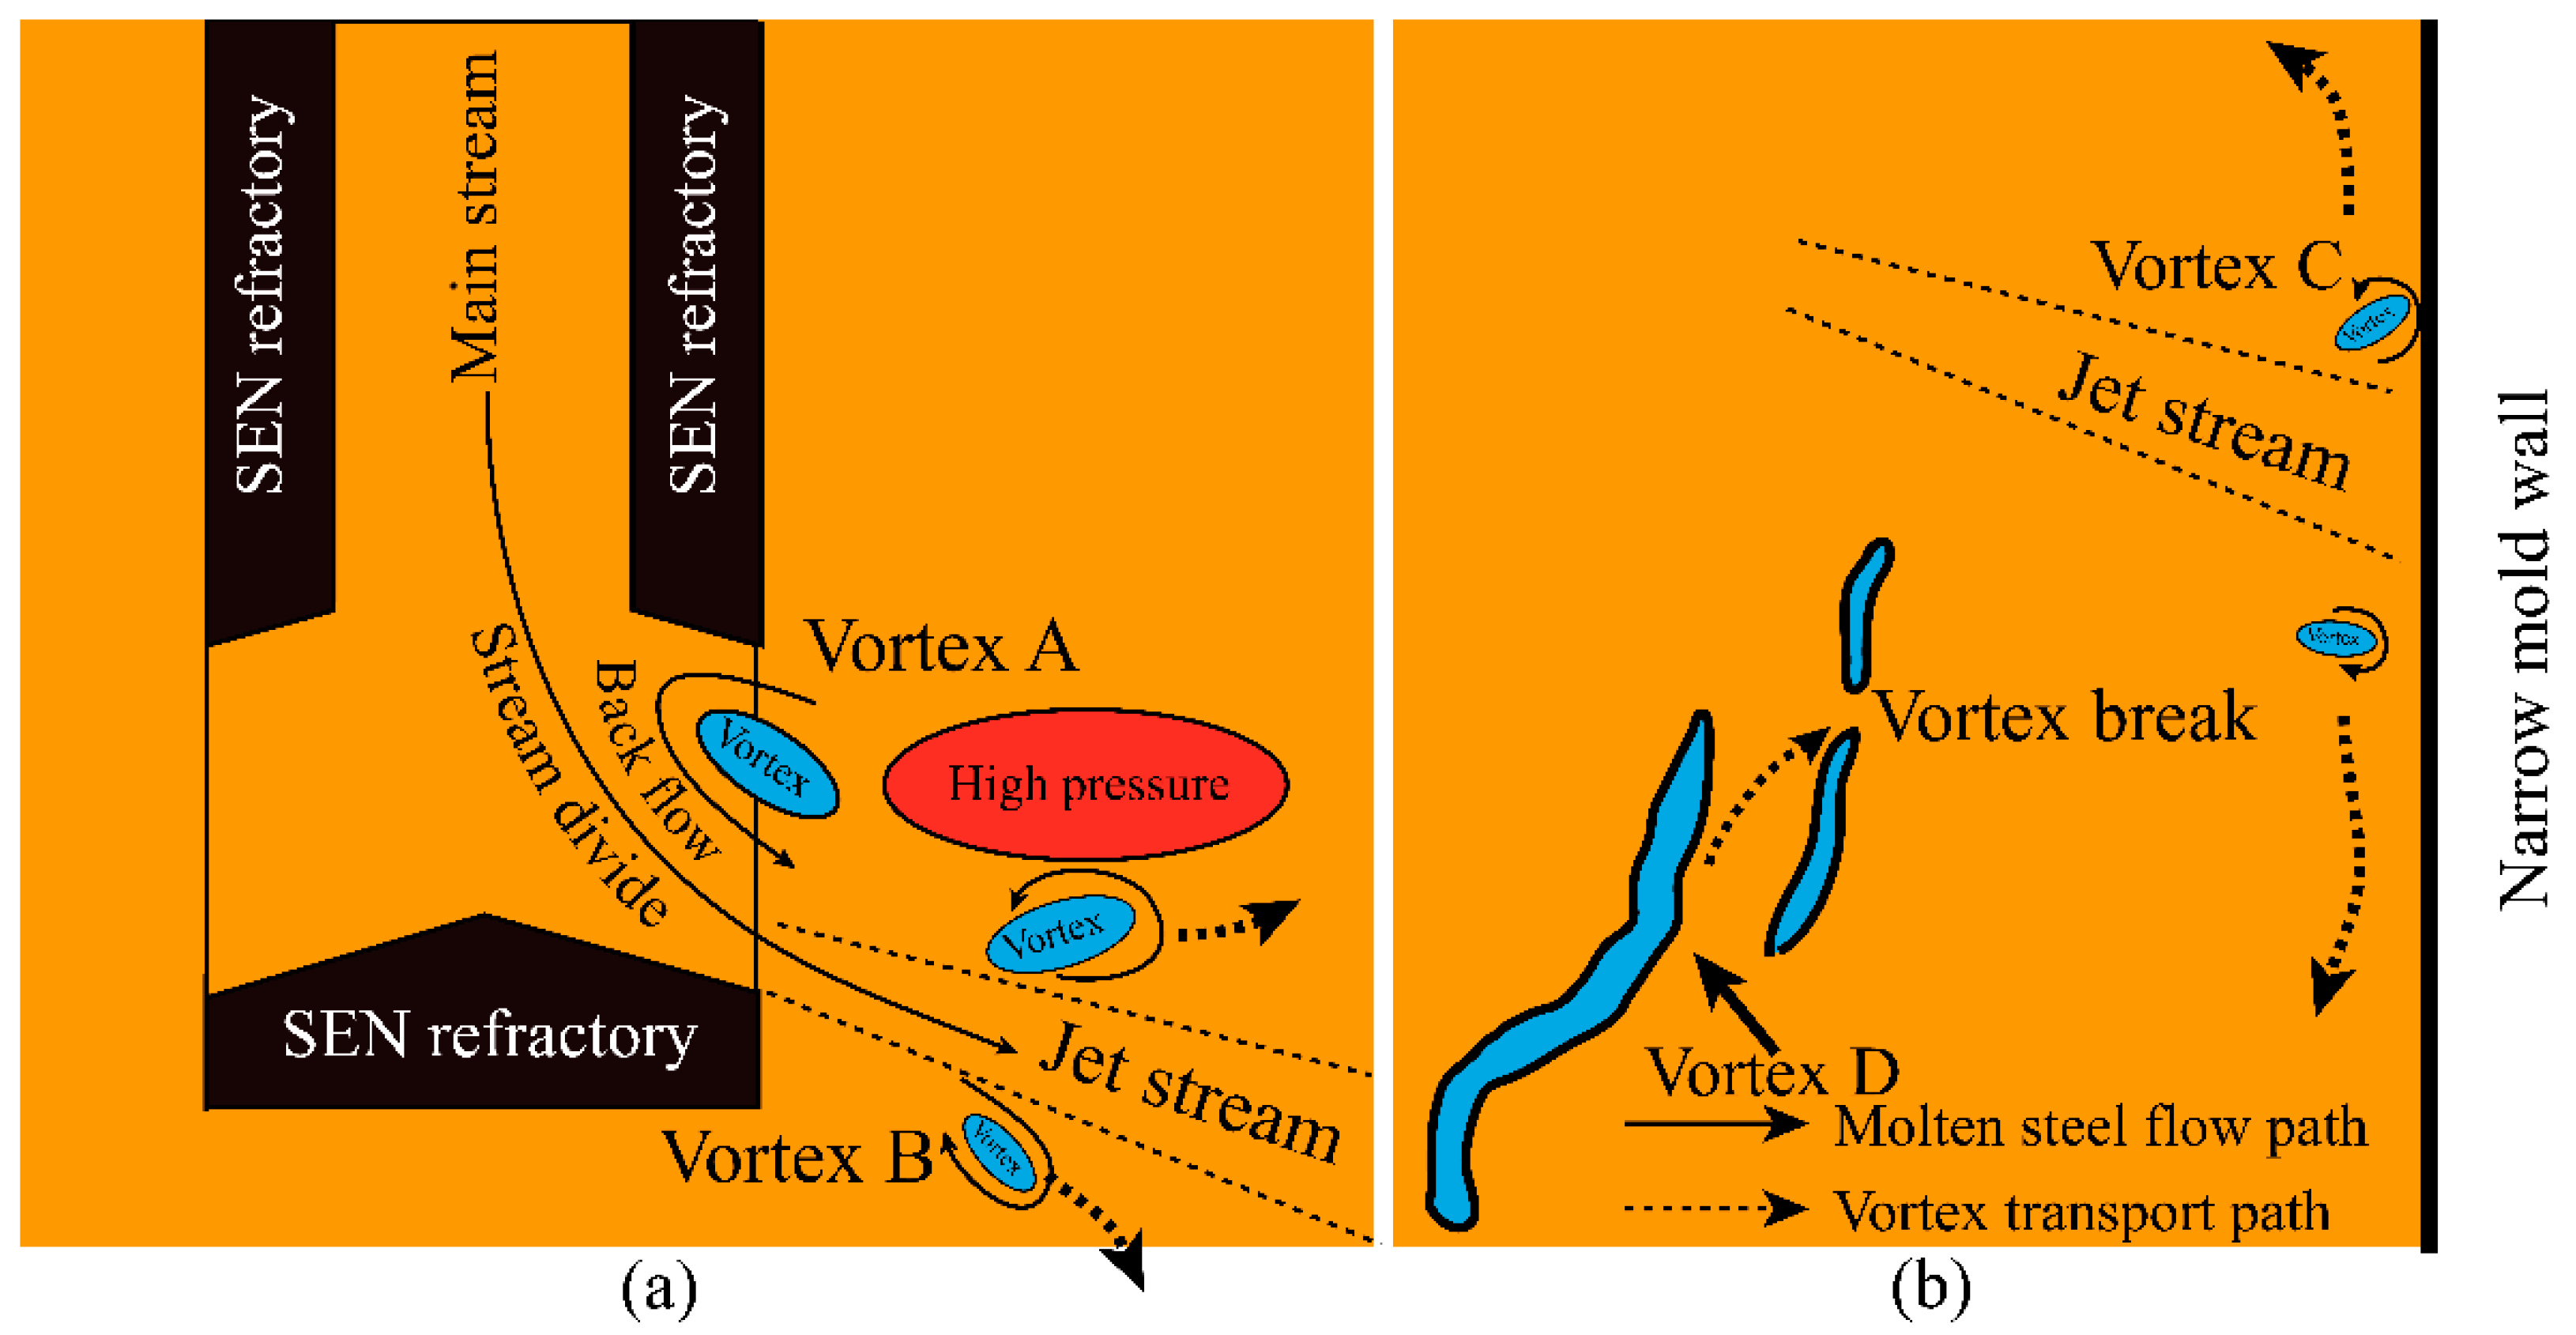
3.3. Effect of the Block Rate on the Vortex in Mold

The vortex in the mold plays an essential role in generating turbulent flow, is closely related to the liquid-level fluctuation, and even slag entrapment [15]. Figure 8 presents the typical vortex visualization feature in the mold found by the Liutex and Ω-method calculation [20,23,24,25,26,27].
As shown in Figure 8a, most of the vortex were distributed on both sides of the narrow side during the casting process, and fewer vortex were found in the center and bottom of the mold. The vortex on the plane Z = 0 were symmetrically distributed on both sides of the mold. The vortex diameter and circularity were quantified by identifying the vortex boundary through the Image J (National Institutes of Health, Bethesda, MA, USA) software, as shown in Figure 8c. It was concluded that the vortex’s rotation magnitude was significantly strengthened as the block rate increased from 0 to 45.9%.
Figure 9 shows the quantitative comparison of vortex indicators with different block rates. The vortex diameter was concentrated in the range of 0 mm and 50 mm following a lognormal distribution, as shown in Figure 9a. It seems that the clogs have little effect on the average diameter and distribution of the vortex. However, the Liutex magnitude increases from 2 rad·s−1 with non-clog to 10 rad·s−1 with a block rate of 45.9%, as shown in Figure 9b, that is, the nozzle clogs strengthen the rotation magnitude of the vortex. The circularity can describe the shape of the vortex, and for a standard circle, the vortex’s circularity was equal to 1. As shown in Figure 9c, the vortex’s circularity and the number of vortex in plane Z = 0 were similar to a quasi-normal curve distribution. The circularities of the vortex in peaks of the curves were concentrated in the range of 0.62 to 0.73.
Typical shapes of the vortex, vector and streamline in the vortex surface at different positions in the mold are shown in Figure 10. Vortexes were formed in four different locations: the nozzle port of the SEN (vortex A), the outer side of the jet stream (vortex B), the narrow side of mold (vortex C), and the lower part of the mold center (vortex D). The jet-stream rushes out of the nozzle to form vortex A near the nozzle port, and vortex B was formed accompanying the jet-stream, then the jet-stream hits the narrow side of the mold and moves around, as shown in Figure 10c. Vortex C near the narrow side of the mold was an ‘O’ shape. A series of tube-shape vortexes in the steel–slag interface caused a Kármán vortex street, as shown in Figure 10b, which have also been reported by previous researchers [16,22]. The vortex was stretched into a long tube shape in the lower area of the mold center, even broken into a small vortex, as shown in Figure 10d. The vector of the vortex surface and part of the vortex has been added to the streamline, which shows that the vortex was rotating.
The vortex exists in the transition between the lamina flow and turbulent flow, or in the counterpressure gradient flow, that is, the flow direction is opposite to the pressure gradient direction. Figure 11 shows that vortex A, vortex B, and vortex C were formed in the counterpressure gradient flow area. The vortex was formed and was transported continuously along the flow direction of the jet stream in the mold. The flow stretches the vortex shape into a strip and causes the vortex to break into a small vortex. Then, the rotation magnitude of the small vortex was weakened until the rotation disappears under the effect of the fluid’s viscosity.

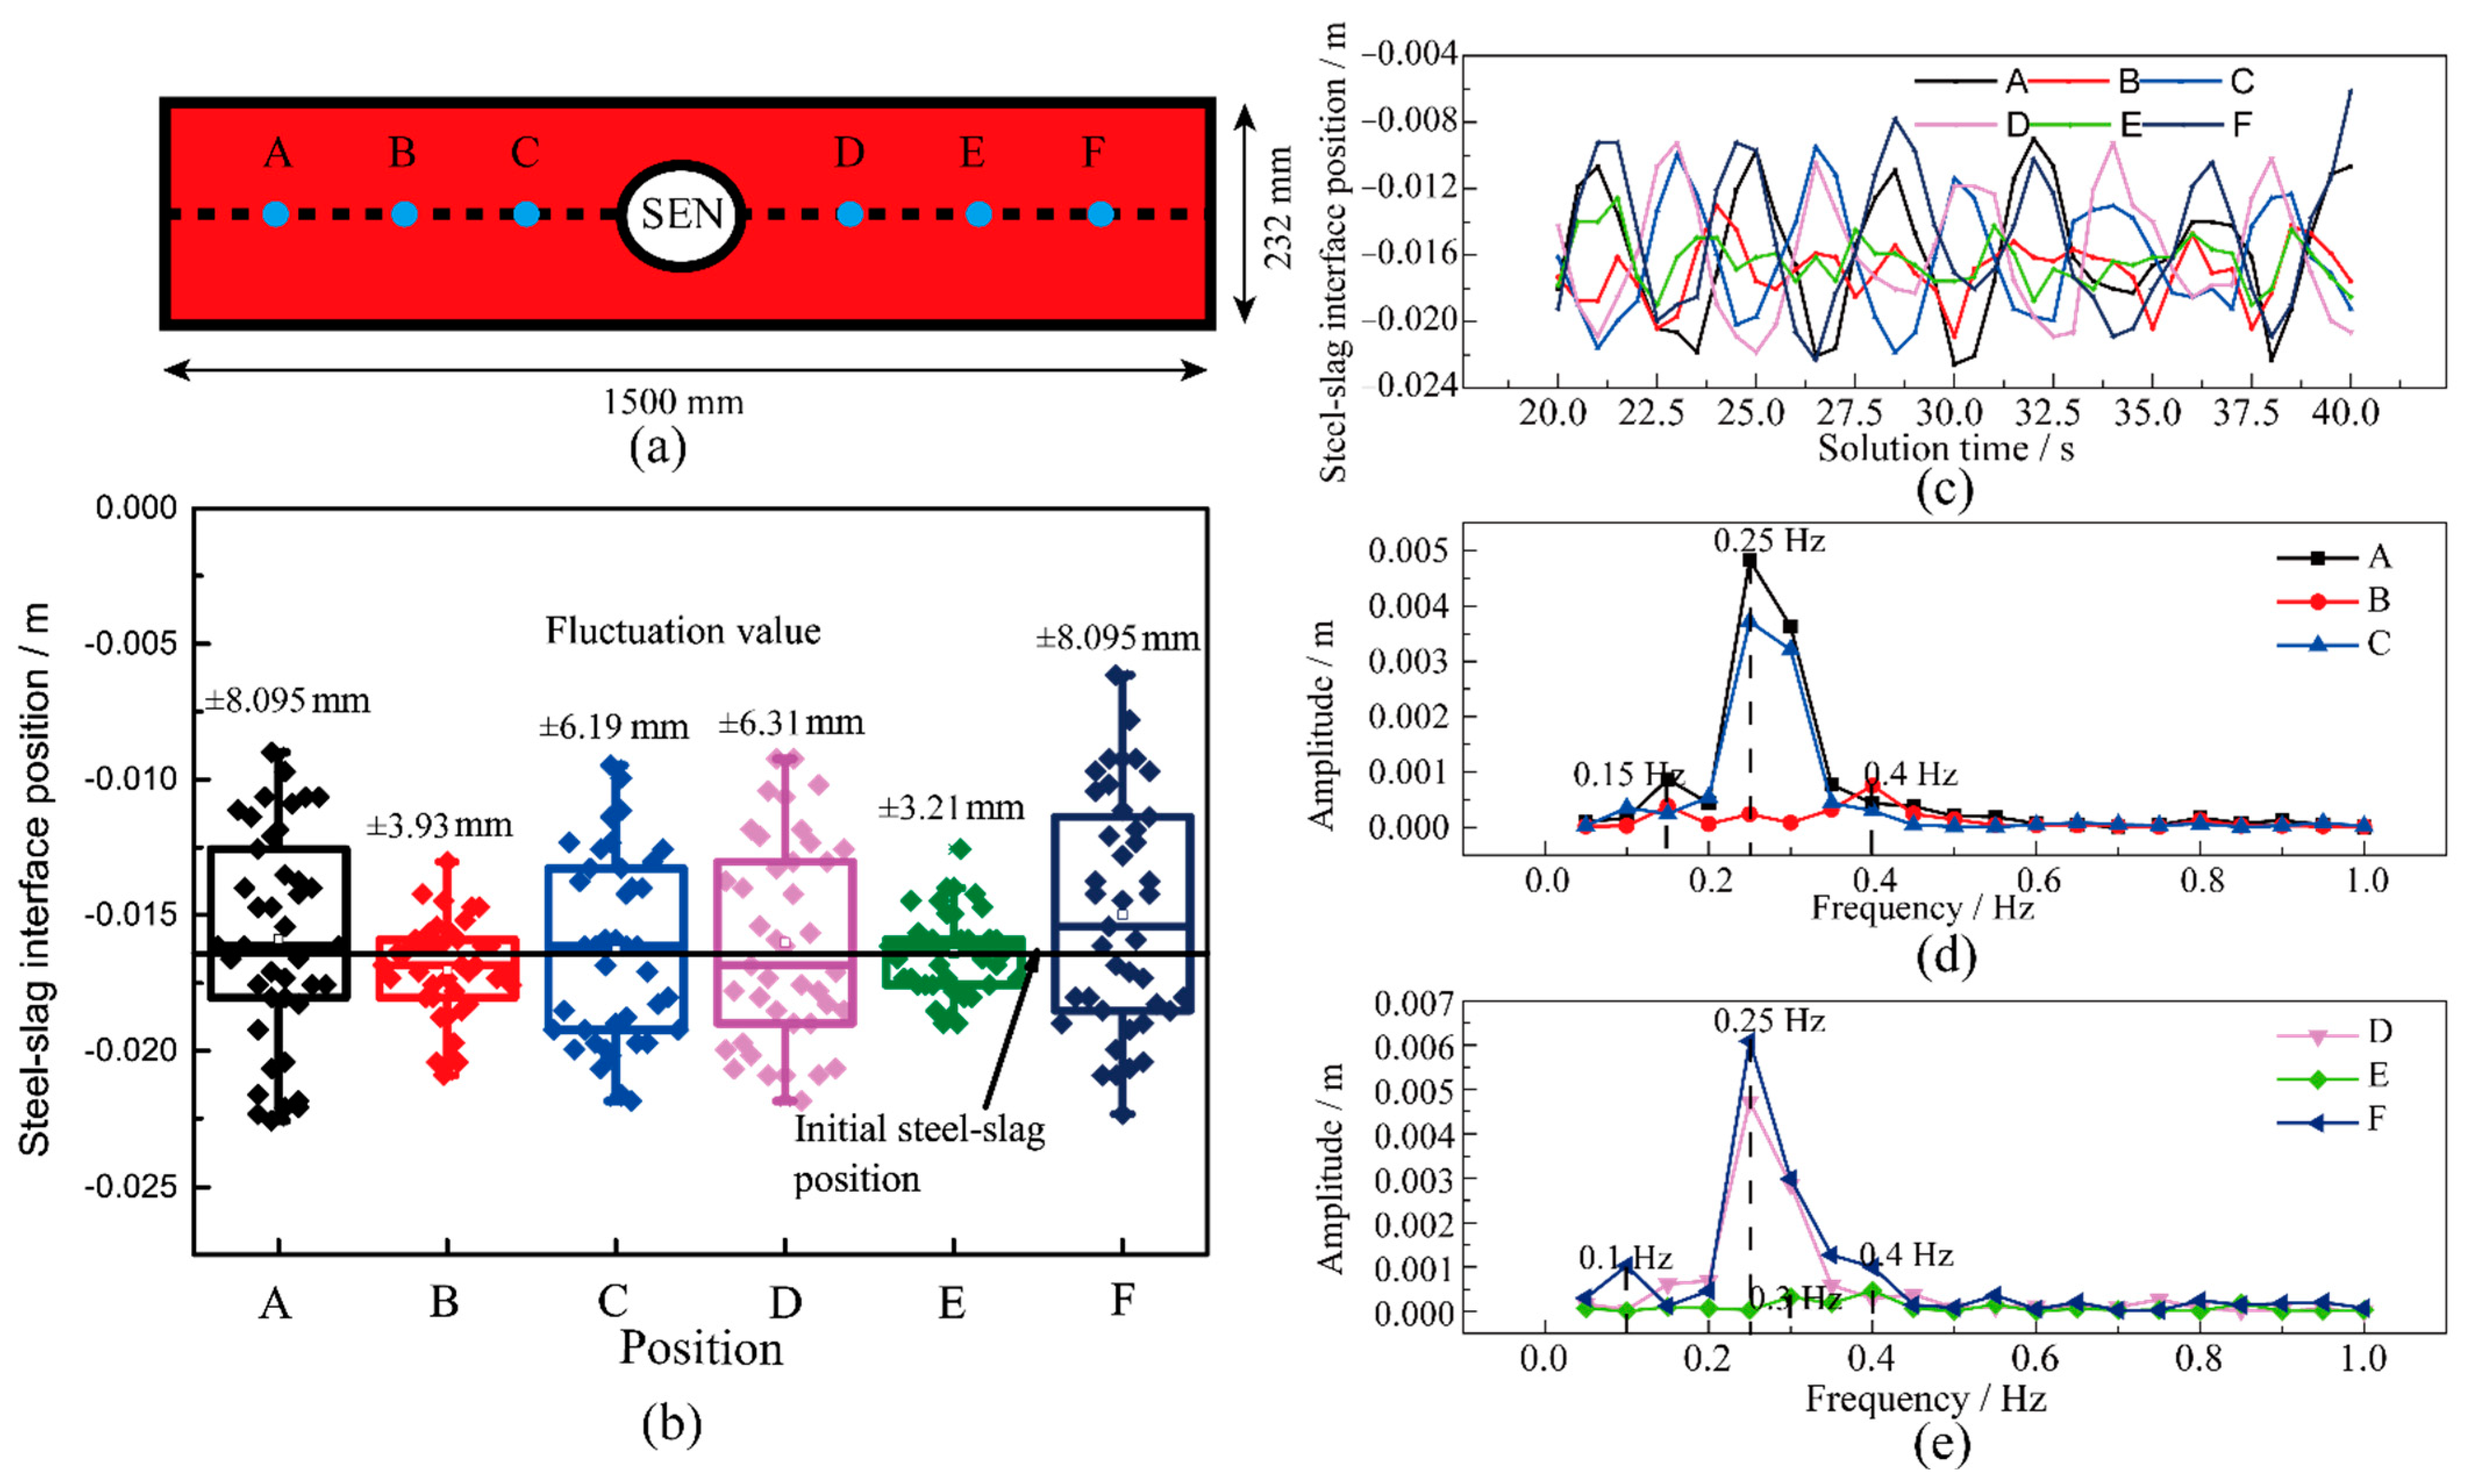
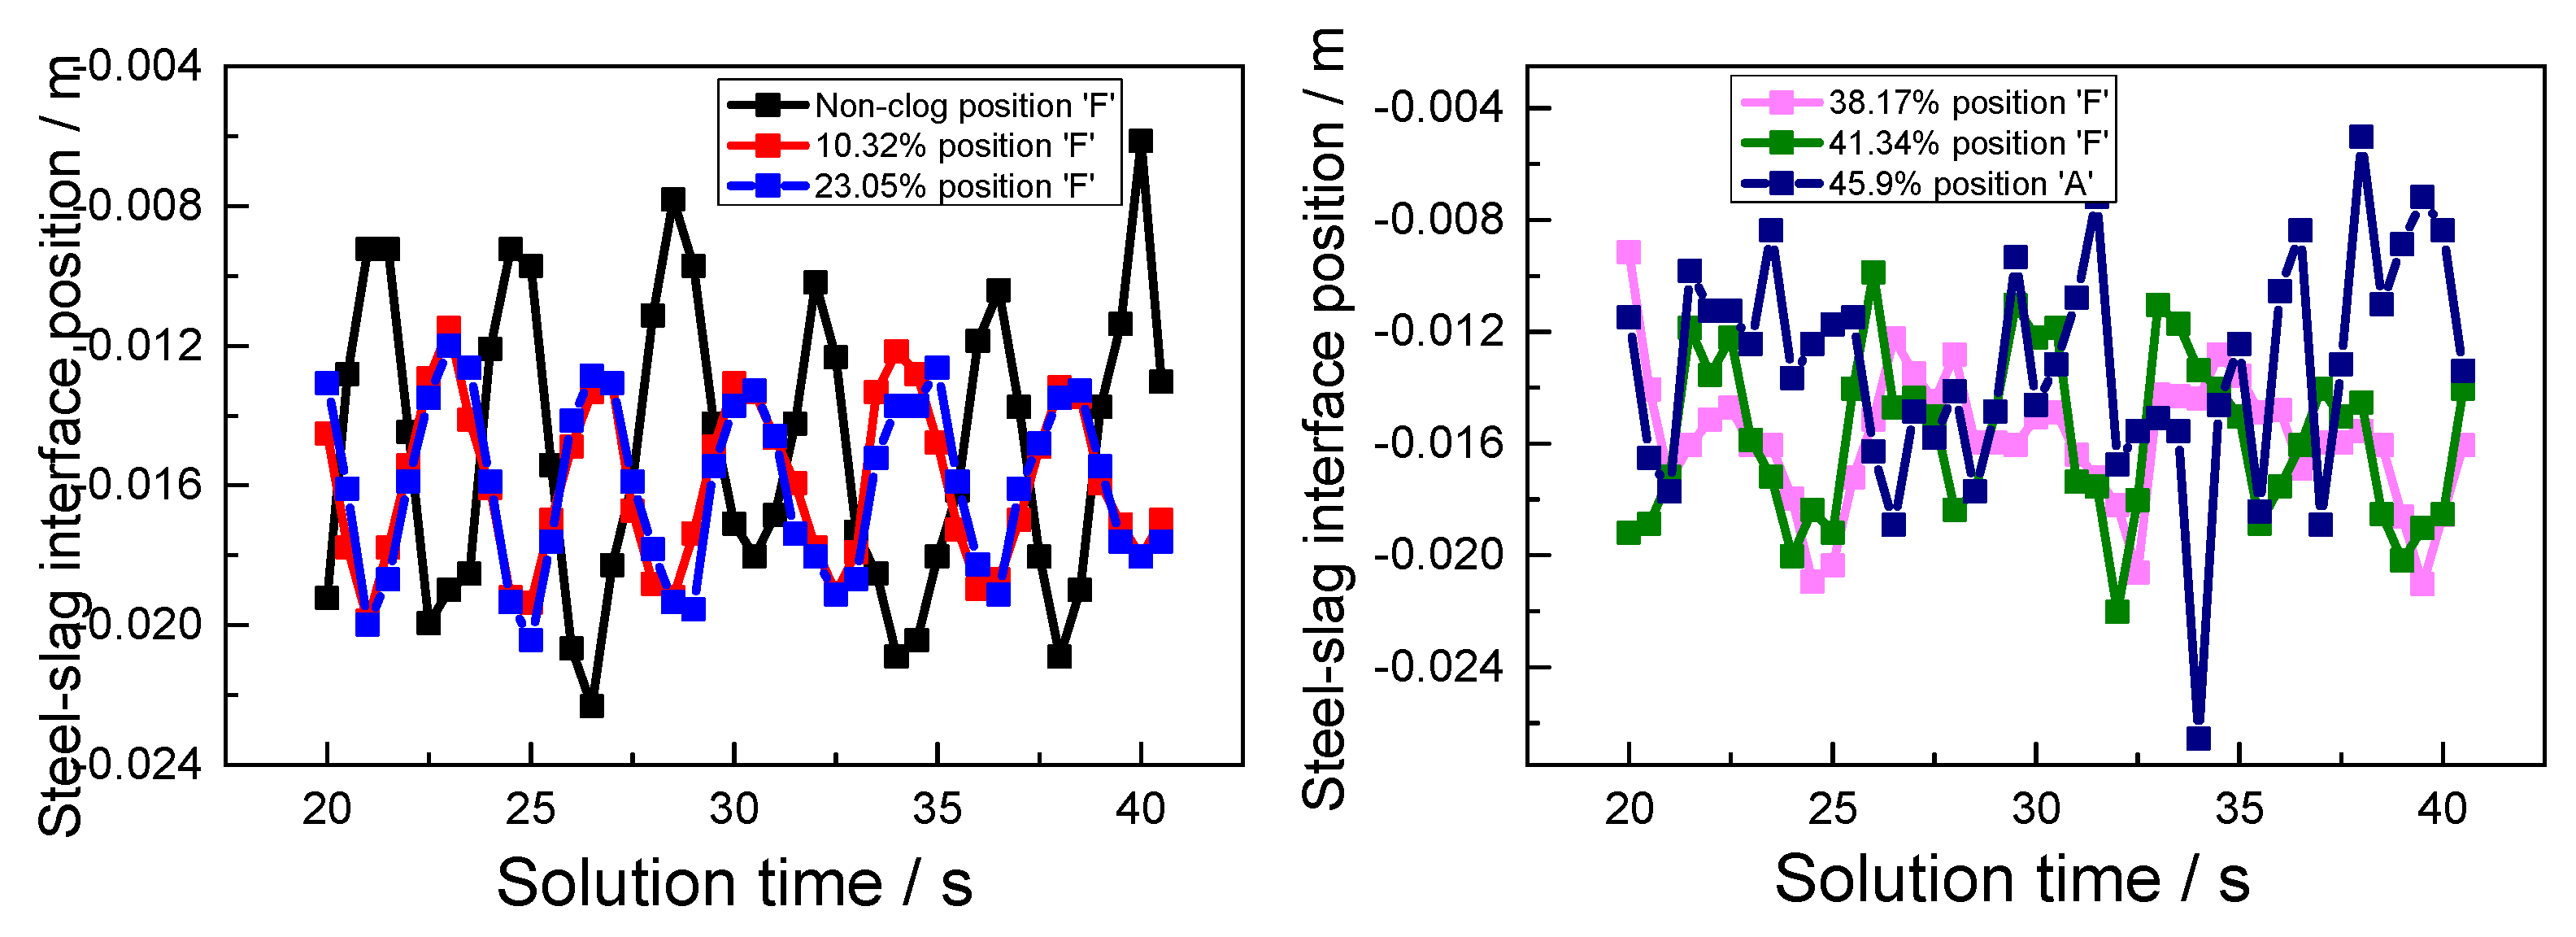
3.4. Effect of the Block Rate on the Steel–Slag Interface and Slag Entrapment

The time-averaged velocity in the steel–slag interface increases gradually from the nozzle center to the narrow side of the mold, reaching the peak at 5/7 of half-width, which was approximately symmetrically distributed, as shown in Figure 12. As the block rate increases from 10.32% to 45.9%, the peak magnitude of time-average velocity in the steel–slag interface increases. The increment in the peak magnitude of time-average velocity presents a positive growth trend. The velocity in the steel–slag interface was closely related to clog angles and the outlet. The velocity of the steel–slag interface was influenced by the changing of clog angles due to the cone-shaped clogs and by the shrinking of the outlet area of the SEN due to the tube-shaped clogs combining with the cone-shaped clogs. By comparing the non-clog case with clogged cases, it was found that the velocity of the steel–slag interface under the non-clog case was higher than that under the clogged cases until the block rate was above 41.34%. It was indicated that the positive contribution to the velocity of the steel–slag interface due to the shrinking of the outlet area of the SEN, caused by the tube-shaped clogs combining with the cone-shaped clogs, cannot compensate for the velocity reduction in the steel–slag interface due to the increase of the clog angles caused by the cone-shaped clogs. That was why the stopper position increased linearly after four casting heats, as seen in Figure 1.
The steel–slag interface morphology is shown in Figure 13a,b. The steel–slag interface level morphology changes between Figure 13a,b. The steel–slag interface elevation leads to mold powder burning, as shown in Figure 13c,d. Some studies have proved that the steel–slag interface level shows cyclical fluctuations [28,29]. The steel–slag interface morphology and fluctuation are relevant to the upper streamflow velocity [30]. When the upper stream velocity is higher, the upstream pushes the slag layer in the two narrow sides of the mold away, resulting in liquid steel exposure, as shown in Figure 13a,c. When the upper stream velocity is smaller, the steel–slag interface level drops at the narrow side of the mold, and the steel–slag interface near the SEN is higher, as shown in Figure 13b,d.
Figure 13 shows the comparison of typical features of the steel–slag interface. The morphology of the steel–slag interface changes between U-shaped (Figure 13a) and W-shaped (Figure 13b), and it shows a periodicity change. The volume of the molten steel was 0.5 in the steel–slag interface fluctuation analysis. The liquid level of steel–slag shows large fluctuations near both of the narrow sides, and the upstream pushes the slag layer away, resulting in the exposure of liquid steel. The slag layers at the narrow sides and near the SEN were thinned to burn due to the steel–slag interface’s fluctuation.
Six different positions, marked ‘A’ to ‘F’ (Figure 14a) were chosen to reveal the periodic change of the steel–slag interface by applying fast Fourier transformation (FFT) to analyze the signal of the steel–slag interface position. It was concluded that the fluctuation frequency of the steel–slag interface was about 0.25 Hz at the positions of A, C, D, and F with no clog, and there was a half-cycle difference between A and C or D and E, as shown in Figure 14d,e, which is similar to a previous report by Teshima et al. [30].
There were two main ways of slag entrapment during the continuous casting process: shearing slag-entrapment and fluctuating slag-entrapment. It was previously reported that the critical velocity of the steel–slag interface causing shearing slag-entrapment was above 0.47 m·s−1 [31]. The maximum velocity found in the present work was less than 0.3 m·s−1, as shown in Figure 12, which means the slag-entrapment did not happen through the shearing of the steel–slag surface. Under this situation, it works by increasing the viscosity and surface tension of mold flux to alleviate the surface fluctuation [31].
Figure 15 shows the original steel–slag interface data from Table 3. The FFT was adopted to transform the time series data into frequency series data. As shown in Table 3, the maximum steel–slag interface fluctuation was at the positions of ‘A’, ‘F’ or both of them. The steel–slag interface fluctuation was decreased from ±8.095 mm with no clog to ±4.185 mm with a block rate of 10.32% because the cone-shaped clogs on the bottom make the impact point move down. When the block rate changes from 10.32% to 45.9%, the fluctuation of the steel–slag interface increases from ±4.185 mm to ±10.765 mm, and the impact point fluctuates between 0.415 m and 0.487 m. This means the upper backflow was strengthened due to the large increment in jet-stream velocity at the outlet of the SEN with a high block rate. As shown in Figure 14, the fluctuation of the steel–slag interface was periodic, and the fluctuation frequency was between 0.146 and 0.29 Hz when the block rate was below 41.34%. The FFT of the steel–slag interface fluctuation in position ‘F’ under the block rate of 38.17% has two fluctuation frequencies. The steel–slag interface fluctuation frequency increased to 0.73 Hz when the block rate was 45.9%. The amplitude magnitude was 0.00185 m under a frequency of 0.29 Hz, and the amplitude magnitude was 0.0012 m under a frequency of 0.146 Hz. The FFT of the steel–slag interface fluctuation in position ‘A’ under the block rate of 45.9% has two fluctuation frequencies. The amplitude magnitude was 0.003 m under a frequency of 0.73 Hz, and the amplitude magnitude was 0.0027 m under a frequency of 0.146 Hz.

4. Conclusions

  • Cone-shaped clogs were found at the bottom of the SENs based on the dissection of two SENs used for casting 1300 tons and 260 tons of Al-killed steel, respectively, and the thickness of the cone-shaped clogs increased with casting time. The tube-shaped clogs were mainly distributed on the inner wall of refractory in the range of 250 mm to 750 mm with a thickness of 2 to 6 mm.
  • The fluctuation of the steel–slag interface increased from ±4.185 mm to ±10.765 mm as the block rate changed from 10.32% to 45.9%, which caused the impact point to fluctuate between 0.415 m and 0.487 m.
  • The vortex’s rotation magnitude was significantly strengthened with an increase in the block rate. Liutex magnitude increased from 2 rad·s−1 with non-clogging to 10 rad·s−1 with a block rate of 45.9%. The vortex diameter was concentrated between 0 mm and 50 mm following a lognormal distribution.
  • The time-averaged velocity in the steel–slag interface increased when the block rate changed from 10.32% to 45.9% and reached the peak at 5/7 of half-width.

Author Contributions

Conceptualization, C.H. and M.W.; methodology, C.H. and M.W.; validation, C.H.; formal analysis, C.H. and M.W.; investigation, C.H., M.W. and Y.B.; resources, H.W., Q.Z. and J.Z.; data curation, C.H.; writing—original draft preparation, C.H. and M.W.; writing—review and editing, C.H., M.W. and D.S.; visualization, C.H.; supervision, M.W. and Y.B.; project administration, M.W.; funding acquisition, M.W. All authors have read and agreed to the published version of the manuscript.

Funding

This research was funded by the National Natural Science Foundation of China, grant number 51774031 and the China Scholarship Council (No. 202006465011). The authors wish to express their gratitude to the foundations for providing financial support.

Institutional Review Board Statement

Not applicable.

Informed Consent Statement

Not applicable.

Data Availability Statement

Data is contained within the article.

Acknowledgments

The Liutex calculation was accomplished using code Liutex released by Chaoqun Liu at the University of Texas at Arlington. The SEN sampling and delivery were accomplished by the engineers that worked in the Baotou Iron and Steel Group Corp. The authors wish to express their gratitude for the necessary help.

Conflicts of Interest

The authors declare no conflict of interest.

References

  1. Singh, S.N. Mechanism of alumina build up in tundish nozzles during continuous casting of aluminum-killed steels. Metall. Trans. B 1974, 5, 2165–2178. [Google Scholar] [CrossRef]
  2. Devi, S.; Singh, R.K.; Sen, N.; Pradhan, N. Study of Calcium Treatment in Steel Ladles for the Modification of Alumina Inclusions to Avoid Nozzle Clogging during Casting. Mater. Sci. Forum 2020, 978, 12–20. [Google Scholar] [CrossRef]
  3. Tiekink, W. Al2O3 in Steel and Its Transformation with Calcium. Ph.D. Thesis, Technische Universiteit Delft, Delft, The Netherlands, 6 July 2012. [Google Scholar]
  4. Thomas, B.G. Review on Modeling and Simulation of Continuous Casting. Steel Res. Int. 2018, 89, 1700312. [Google Scholar] [CrossRef]
  5. Yao, M.; Fang, D.C.; Yin, H.B.; Wang, J.C.; Liu, X.; Yu, Y.; Liu, J.J. Development of an experimental system for the study of the effects of electromagnetic stirring on mold heat transfer. Metall. Trans. B 2005, 36, 475–478. [Google Scholar] [CrossRef]
  6. Thomas, B.G.; Yuan, Q.; Mahmood, S.; Liu, R.; Chaudhary, R. Transport and Entrapment of Particles in Steel Continuous Casting. Metall. Trans. B 2014, 45, 22–35. [Google Scholar] [CrossRef]
  7. Fei, P.; Min, Y.; Liu, C.J.; Jiang, M.F. Effect of continuous casting speed on mold surface flow and the related near-surface distribution of non-metallic inclusions. Int. J. Miner. Metall. Mater. 2019, 26, 186–193. [Google Scholar] [CrossRef]
  8. Zhao, P.; Li, Q.; Kuang, S.B.; Zou, Z.S. Mathematical Modeling of Liquid Slag Layer Fluctuation and Slag Droplets Entrainment in a Continuous Casting Mold Based on VOF-LES Method. High Temp. Mater. Processes 2017, 36, 551–561. [Google Scholar] [CrossRef]
  9. Wang, Y.; Fang, Q.; Zhang, H.; Zhou, J.N.; Liu, C.S.; Ni, H.W. Effect of Argon Blowing Rate on Multiphase Flow and Initial Solidification in a Slab Mold. Metall. Trans. B 2020, 51, 1088. [Google Scholar] [CrossRef]
  10. Huo, Y.K.; Zhao, L.H.; An, H.H.; Wang, M.; Zou, C.D. Model prediction of the effect of in-mold electromagnetic stirring on negative segregation under bloom surface. Int. J. Miner. Metall. Mater. 2020, 27, 319–327. [Google Scholar] [CrossRef]
  11. Li, X.; Wang, M.; Bao, Y.P.; Gong, J.; Wang, X.H.; Pang, W.G. Solidification Structure and Segregation of High Magnetic Induction Grain-Oriented Silicon Steel. Met. Mater. Int. 2019, 25, 1586–1592. [Google Scholar] [CrossRef]
  12. Bai, H.; Thomas, B.G. Effects of clogging, argon injection, and continuous casting conditions on flow and air aspiration in submerged entry nozzles. Metall. Trans. B 2001, 32, 707. [Google Scholar] [CrossRef]
  13. Hua, C.J.; Wang, M.; Zhang, M.Y.; Zheng, R.X.; Bao, Y.P. Effect of submerged entry nozzle wall surface morphologies on boundary layer structure and alumina inclusions transport. Chin. J. Eng. 2020. [Google Scholar] [CrossRef]
  14. Hua, C.J.; Wang, M.; Bao, Y.P. Effect of Nozzle Clogging on the Fluid Flow Pattern in a Billet Mold with Particle Image Velocimetry Technology. Metall. Trans. B 2020, 51, 2871–2881. [Google Scholar] [CrossRef]
  15. Cho, S.; Kim, S.H.; Chaudhary, R.; Thomas, B.G.; Shin, H.J.; Choi, W.Y.; Kim, S.W. Effect of Nozzle Clogging on Surface Flow and Vortex Formation in the Continuous Casting Mold. In Proceedings of the AISTech 2011, Indianapolis, IN, USA, 2–5 May 2011; pp. 85–95. [Google Scholar]
  16. Srinivas, P.S.; Singh, A.; Korath, J.M.; Jana, A.K. A water-model experimental study of vortex characteristics due to nozzle clogging in slab caster mould. Ironmak. Steelmak. 2016, 44, 473–485. [Google Scholar] [CrossRef]
  17. Hashimoto, Y.; Matsui, A.; Hayase, T.; Kano, M. Real-Time Estimation of Molten Steel Flow in Continuous Casting Mold. Metall. Trans. B 2020, 51, 581–588. [Google Scholar] [CrossRef]
  18. Stachnik, M.; Jakubowski, M. Multiphase model of flow and separation phases in a whirlpool: Advanced simulation and phenomena visualization approach. J. Food Eng. 2020, 274, 109846. [Google Scholar] [CrossRef]
  19. Li, Z.; Zhang, L.T.; Ma, D.Z.; Wang, E.G. Numerical Simulation on Flow Characteristic of Molten Steel in the Mold with Freestanding Adjustable Combination Electromagnetic Brake. Metall. Trans. B 2020, 51, 2609–2627. [Google Scholar] [CrossRef]
  20. Liu, C.Q. Liutex-third generation of vortex definition and identification methods. Acta Aerodyn. Sinca 2020, 38, 413–431. [Google Scholar] [CrossRef]
  21. Jakubowski, M. Secondary flows occurring in a whirlpool separator—A study of phenomena—Observation, simulation and measurements. Chem. Process Eng. 2015, 36, 277–289. [Google Scholar] [CrossRef] [Green Version]
  22. Yin, Y.B.; Zhang, J.M. Mathematical Modeling on Transient Multiphase Flow and Slag Entrainment in Continuously Casting Mold with Double-ruler EMBr through LES+VOF+DPM Method. ISIJ Int. 2021, 61, 853–864. [Google Scholar] [CrossRef]
  23. Liu, C.Q.; Gao, Y.S.; Tian, S.L.; Dong, X.R. Rortex A New Vortex Vector Definition and Vorticity Tensor and Vector Decompositions. Phys. Fluids 2018, 30, 035103. [Google Scholar] [CrossRef] [Green Version]
  24. Gao, Y.; Liu, C.Q. Rortex and comparison with eigenvalue-based vortex identification criteria. Phys. Fluids 2018, 30, 85107–85118. [Google Scholar] [CrossRef] [Green Version]
  25. Liu, C.Q. Letter: Galilean invariance of Rortex. Phys. Fluids 2018, 30, 111701. [Google Scholar] [CrossRef]
  26. Liu, C.Q.; Gao, Y.S.; Dong, X.R.; Wang, Y.Q.; Liu, J.M.; Zhang, Y.N.; Cai, X.S.; Cui, N. Third generation of vortex identification methods: Omega and Liutex/Rortex based systems. J. Hydrodyn. 2019, 31, 205–223. [Google Scholar] [CrossRef]
  27. Seath, D.D.; Wilson, D.R. Vortex-airfoil interaction tests. In Proceedings of the AIAA 24th Aerospace Sciences Meeting, Reno, NV, USA, 6–9 January 1986; pp. 1–4. [Google Scholar]
  28. Ren, S.B.; Fan, J.F.; Zhao, J.J.; Li, S. Mathematical simulation of surface wave created in a slab mold. J. Inner Mongolia Univ. Sci. Technol. 2008, 27, 54–58. [Google Scholar] [CrossRef]
  29. Liu, R.; Thomas, B.G.; Kalra, L.; Bhattacharya, T.; Dasgupta, A. Slidegate Dithering Effects on Transient Flow and Mold Level Fluctuations. In Proceedings of the AISTech conference proceedings, Pittsburgh, PA, USA, 6–9 May 2013; pp. 87–98. [Google Scholar]
  30. Teshima, T.; Kubota, J.; Suzuki, M.; Ozawa, K.; Masaoka, T.; Miyahara, S. Influence of casting conditions on the molten steel flow in continuous casting mold. Trans. Iron Steel Inst. Jpn. 1993, 79, 576–582. [Google Scholar] [CrossRef] [Green Version]
  31. Zhang, L.Z.; Li, Y.; Wang, Q.; Yan, C. Prediction model for steel/slag interfacial instability in continuous casting process. Ironmak. Steelmak. 2015, 42, 705–713. [Google Scholar] [CrossRef]
Figure 1. (a) The stopper rod position and tundish weight curve, (b) the casting speed curve.
Metals 11 00662 g001
Figure 2. The typical morphologies of offline submerged entry nozzles (SENs), (a) SEN1 ports, (b) the dissection of the SEN1 bottom, (c) SEN2 ports, (d) the dissection of the SEN2 bottom, (e) schematic of the SEN clog geometry model.
Metals 11 00662 g002
Figure 3. The geometry model in the flow region of SEN under the slag line with different block rates in front view and side view (a1,a2) non-clog, (b1,b2) 10.32%, (c1,c2) 23.05%, (d1,d2) 38.17%, (e1,e2) 41.34%, (f1,f2) 45.9%.
Metals 11 00662 g003
Figure 4. The grids of the part fluid flow domain. (a) the global view, (b) the partial enlarged view.
Metals 11 00662 g004
Figure 5. The macroscopic feature of the clogged SEN. (a) SEN1, (b) SEN2, (c) schematic of the measurement method of the nozzle clog heights, (d) the nozzle clog heights’ distribution.
Metals 11 00662 g005
Figure 6. The contour of transient-velocity magnitude in z = 0 plane under different block rates. (a) Non-clog, (b) 10.32%, (c) 23.05%, (d) 38.17%, (e) 41.34%, (f) 45.9% (solution time at 38.5 s).
Metals 11 00662 g006
Figure 7. The quantitative indicator of the influence of block rate on flow. (a) Time-averaged distribution of vy near the center of the narrow side of the mold, (b) the distribution of steam impact-point on the narrow side, (c) the distribution of the maximum and the minimum of vy.
Metals 11 00662 g007
Figure 8. The typical features of vortex visualization in the mold. (a) Three-dimensional view, (b) two-dimensional view in the plane Z = 0, (c) the schematic of the vortex boundary recognition, and the Liutex magnitude under the case of (d) non-clog, (e) block rate 38.17%, (f) block rate 45.9%.
Metals 11 00662 g008
Figure 9. The statistic distribution of (a) the vortex diameter, (b) the Liutex magnitude, (c) the distribution curve of the vortex circularity.
Metals 11 00662 g009
Figure 10. Typical shapes of the vortex, vector and streamline in the vortex surface at different positions in the mold (solution time at 40 s, under the non-clog case), (a) the nozzle port of the SEN, (b) the outer side of the jet-stream, (c) the narrow side of the mold, (d) the lower part of the mold center.
Metals 11 00662 g010
Figure 11. Mechanism of the vortex formation and transportation at (a) the SEN ports and the jet stream outside, (b) the narrow mold wall and the mold bottom.
Metals 11 00662 g011
Figure 12. Time-averaged velocity magnitude in the steel–slag interface.
Metals 11 00662 g012
Figure 13. Comparison of steel–slag interface feature between (a) simulation result at 32 s, (b) simulation results at 30.5 s, and (c,d) experimental results for casting 260 tons Al-killed ultra-low carbon steel in different views.
Metals 11 00662 g013
Figure 14. (a) Points marked for the analysis of steel–slag fluctuation, (b) fluctuation distribution of the steel–slag interface of the marked points, (c) change in the steel–slag interface with solution time, (d,e) FFT for (c) under the non-clog case.
Metals 11 00662 g014
Figure 15. Steel–slag interface positions for original data in Table 3.
Metals 11 00662 g015
Table 1. The geometry information for the SEN in the flow region.
Vn/mm3Vc/mm3Block Rate/%x/mmy/mmx/y
1,596,143.151,596,143.15Non-clog66.0091.000.73
1,596,143.151,431,449.1110.32 (SEN2)66.0089.000.74
1,596,143.151,228,303.1423.0551.1784.480.61
1,596,143.15986,944.7938.1740.5867.750.60
1,596,143.15936,224.1541.3437.5857.880.65
1,596,143.15863,500.4545.90 (SEN1)26.0053.000.49
Table 2. Main dimensions and parameters.
ItemParameters
SEN length940 mm
SEN inner diameterϕ 78 mm × 66 mm
SEN outer diameterϕ 145 mm × 130 mm
SEN port inclination15°
Immersed depth150 mm
Initial liquid slag layer thickness70 mm
SEN port diameter66 mm × 91 mm
Slab section size1500 mm × 232 mm
Casting speed1.1 m·min−1
Molten steel density7004 kg·m−3
Molten steel viscosity0.0067 kg·m−1·s−1
Liquid slag density2500 kg·m−3
Liquid slag viscosity0.33 Pa·s−1
Steel slag interfacial tension1.345 N·m
Inlet velocity1.425 m·s−1
Table 3. The indexes on steel–slag interface fluctuation.
Block Rate/%Position of the Maximum Fluctuation Numerical Simulation Results of the Steel–Slag Interface Maximum Fluctuation/mmFluctuation Frequency/Hz
Non-clogF±8.0950.25
10.32F±4.1850.29
23.05A, F±4.2150.29
38.17F±5.930.146, 0.29
41.34F±6.490.29
45.9A±10.7650.146, 0.73
Publisher’s Note: MDPI stays neutral with regard to jurisdictional claims in published maps and institutional affiliations.

