Stress Corrosion Cracking in an Extruded Cu-Free Al-Zn-Mg Alloy
by
 , , , and
Adrian Lervik
1,* ,
,
John C. Walmsley
1,2,3,
Lars Lodgaard
4,
Calin D. Marioara
3,
Roy Johnsen
5,
Otto Lunder
3 and
Randi Holmestad
1 1
Department of Physics, Norwegian University of Science and Technology (NTNU), N-7491 Trondheim, Norway
2
Department of Materials Science and Metallurgy, University of Cambridge, Cambridge CB2 3QZ, UK
3
SINTEF Industry, N-7465 Trondheim, Norway
4
Benteler Automotive, 2830 Raufoss, Norway
5
Department of Mechanical and Industrial Engineering, Norwegian University of Science and Technology (NTNU), N-7491 Trondheim, Norway
*
Author to whom correspondence should be addressed.
Metals 2020, 10(9), 1194; https://doi.org/10.3390/met10091194
Submission received: 15 August 2020
/
Revised: 28 August 2020
/
Accepted: 4 September 2020
/
Published: 7 September 2020
Abstract
:Stress corrosion cracking (SCC) in Cu-free Al-Zn-Mg (7xxx) aluminium alloys limits its use in many applications. In this work, we study in detail the microstructure of a peak and slightly overaged condition in an AA7003 alloy using transmission- and scanning electron microscopy in order to provide a comprehensive understanding of the microstructural features related to SCC. The SCC properties have been assessed using the double cantilever beam method and slow strain rate tensile tests. Grain boundary particles, precipitate free zones, and matrix precipitates have been studied. A difference in the SCC properties is established between the two ageing conditions. The dominating difference is the size and orientation of the hardening phases. Possible explanations correlating the microstructure and SCC properties are discussed.
1. Introduction
Wrought Al-Zn-Mg-(Cu) (7xxx) aluminium alloys are of great interest in automotive and aerospace applications due to their high strength-to-weight ratio and formability [1,2]. Replacing heavy components with lighter aluminium alloys will allow for longer travel distance on the same amounts of energy, effectively reducing green house gas emissions. However, the 7xxx alloy series is known for its susceptibility to stress corrosion cracking (SCC), which limits usage in many applications [3]. Both the underlying understanding and the suggested ways to mitigate SCC have been reviewed several times [3,4,5,6,7,8]. However, there are still many unanswered questions concerning the phenomenon especially in understanding how the microstructure influences the cracking behaviour.
SCC in aluminium usually occurs along grain boundaries when a susceptible material is stressed above some critical value in a corrosive environment. Cracking initiates due to mechanical surface defects or from areas corroded by pitting and/or intergranular corrosion (IGC) [4]. The propagation mechanism is a subject of controversy as the fundamental mechanism(s) is not fully understood. Commonly proposed mechanisms include hydrogen embrittlement, anodic dissolution, and passive film rupture [3,4,9]. It is not unlikely that several of these mechanisms occurs simultaneously and affect one another, as suggested by Najjar et al. [10]. In the vicinity of the crack tip the pH is low and the dominating cathodic reaction is proton reduction [11]. This results in hydrogen evolution and diffusion ahead of the crack tip, promoting conditions for local embrittlement [9,10].
Microstructural features often discussed in relation to SCC include grain boundary particles [12,13,14,15,16,17], width and solute concentration in the precipitate free zones (PFZs) [12], and elemental segregation to grain boundaries [18,19,20,21]. In addition, bulk (matrix) precipitates and their interactions with dislocations have been suggested to influence the SCC, as their size and shape may influence the slip characteristics and subsequently affect strain localisation at the grain boundaries [15,22,23,24,25,26,27]. All of these microstructural features are strongly affected by the thermo-mechanical processing of the alloy. Especially, variations in the final age hardening (artificial ageing) stage can drastically change the SCC properties. As such, it is common that a slightly overaged condition has higher SCC resistance than the highest strength yielding condition (peak hardness) in the same alloy [4].
Sarkar et al. demonstrated that with increasing Cu addition to an Al-Zn-Mg alloy, the crack growth rate decreased accordingly [15]. Correspondingly, much work has been conducted in order to understand why Cu additions have such positive effects at reducing SCC susceptibility. It is now generally accepted that Cu- substitution into the - grain boundary particles is the main reason for the improved SCC resistance [15,28,29,30,31]. The equilibrium - phase is highly anodic with respect to the aluminium matrix [32], and with increasing Cu-substitution the potential difference between particle and matrix decreases. However, this explanation is not applicable to the Cu-free systems. Thus, there is a demand for more microstructural understanding of these alloys in respect to SCC behaviour.
In a previous publication, the bulk microstructure of the alloy studied here was reported in detail after both air-cooling and water-quenching from solution heat treatment (SHT), and artificially aged to a peak- (T6) and slightly overaged (T7) condition [33]. Heterogeneous nucleation of - and - particles on grain boundaries and dispersoids was observed after air-cooling. Additionally, the nanoscale hardening precipitates demonstrated different size and orientation relationships with the Al matrix in the two ageing conditions, independent of the prior cooling method from SHT. Here, the characterisation focuses on the grain boundary microstructure (PFZs and grain boundary particles) in addition to SCC testing. This is done in a commercial Cu-free aluminium alloy with variations in Si content, quench rates, and artificial ageing parameters.
2. Experimental
2.1. Materials
Two AA7003 alloys with compositions given in Table 1 were cast and homogenised, before they were pre-heated to 480 °C and extruded at ∼11 mm/s into a solid rectangular profile with dimensions 20 × 25 mm. A subsequent SHT at 480 °C for 30 min. was conducted, before being either water-quenched (WQ) or air-cooled (AC) to room temperature. Subsequent artificial ageing (AA) was carried out at 140 °C for 17 h or 170 °C for 6 h, which designate the peak- (T6) and slightly overaged (T7) tempers, respectively. The samples are further referred to as ‘x-yy-zz’, where x indicates high (H) or low (L) Si content, yy is the quench rate (WQ or AC) and zz is the artificial ageing temper (T6 or T7).
2.2. Double Cantilever Beam
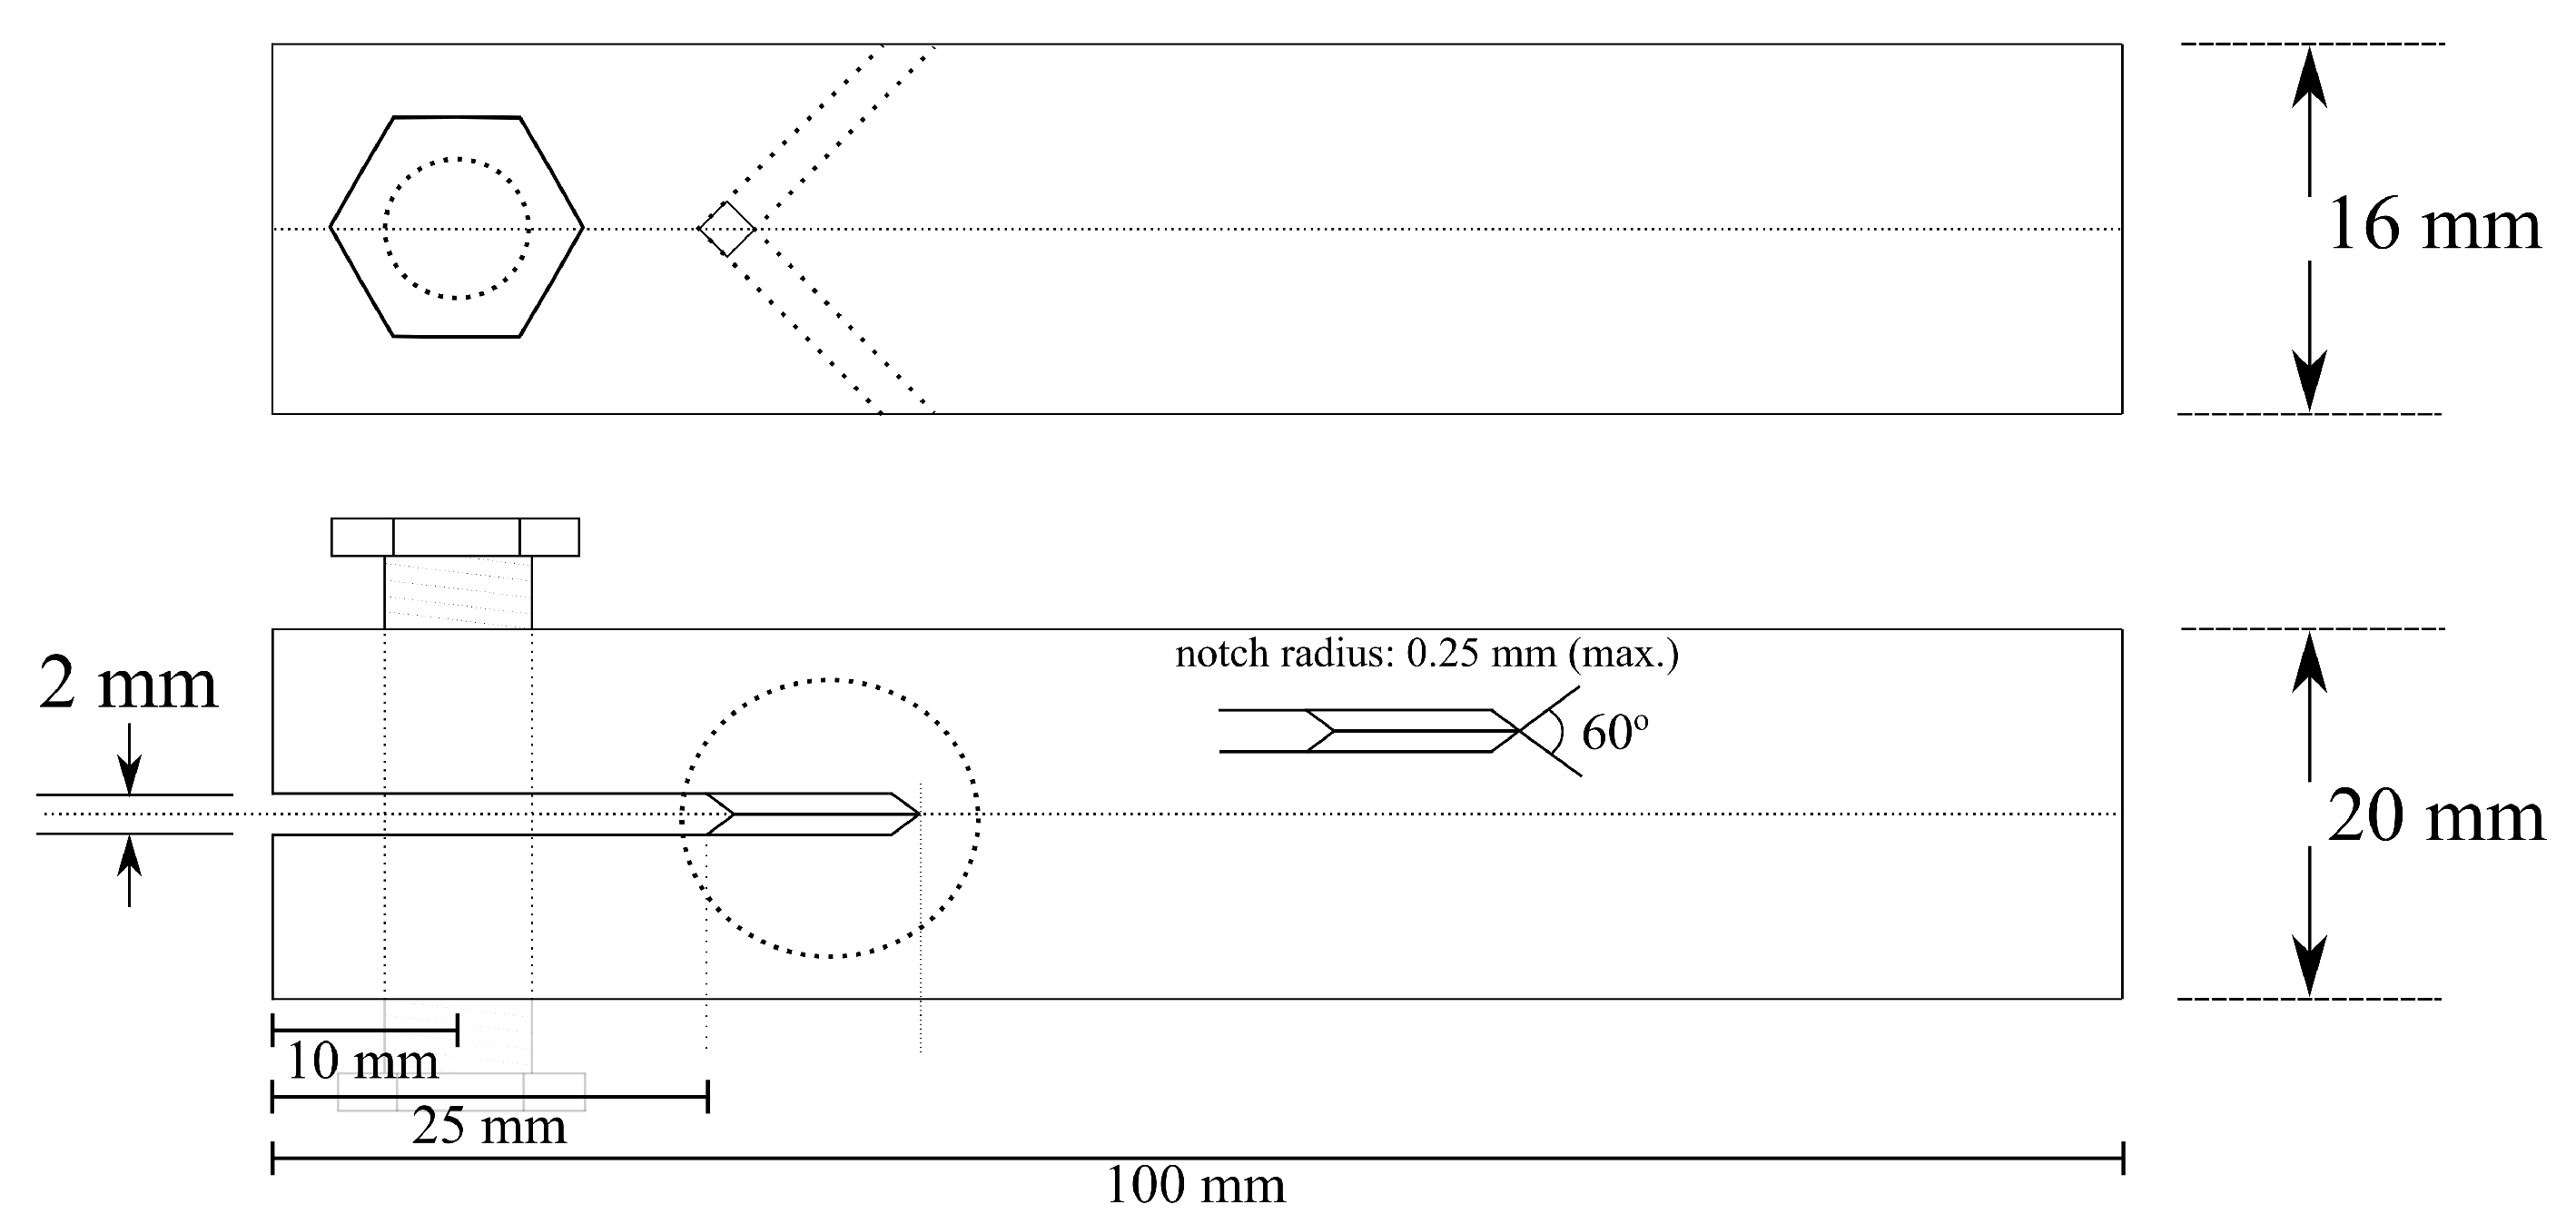
Specimens for double cantilever beam (DCB) testing were machined from the extruded profiles into a geometry initially suggested by Hyatt [34], with some modifications. In the schematic drawing in Figure 1, the V-notch was removed by spark erosion, as it was deemed to be unnecessary for the test. One-third of the samples were subjected to fatigue pre-cracking before bolt loading, while the rest were bolt loaded directly. The initial notch condition had no influence on the measured properties. Crack-tip stress intensity was calculated using the formula:
where , E, h, and a are the deflection at the load point, elastic modulus (70 GPa), half the specimen height, and the crack length measured from the load point, respectively. An initial bolt loading to 25 MPa was applied. The crack tip was kept wet by dripping a few drops of 3.5 wt.% NaCl solution once per day, for a total duration of 1500 h. The crack evolution was measured using an optical microscope. Crack velocity in the stress independent ‘region II (plateau)’ [4], was interpolated to obtain a mean value with corresponding standard deviation. The SCC threshold stress intensities, , were determined from the data points with the lowest crack velocity and K value, and represented in a similar manner. In order to study the fracture surfaces, the specimens were cooled in liquid nitrogen and pulled apart using rapid tensile overload. Three parallels for each condition were measured.
2.3. Slow Strain Rate Testing
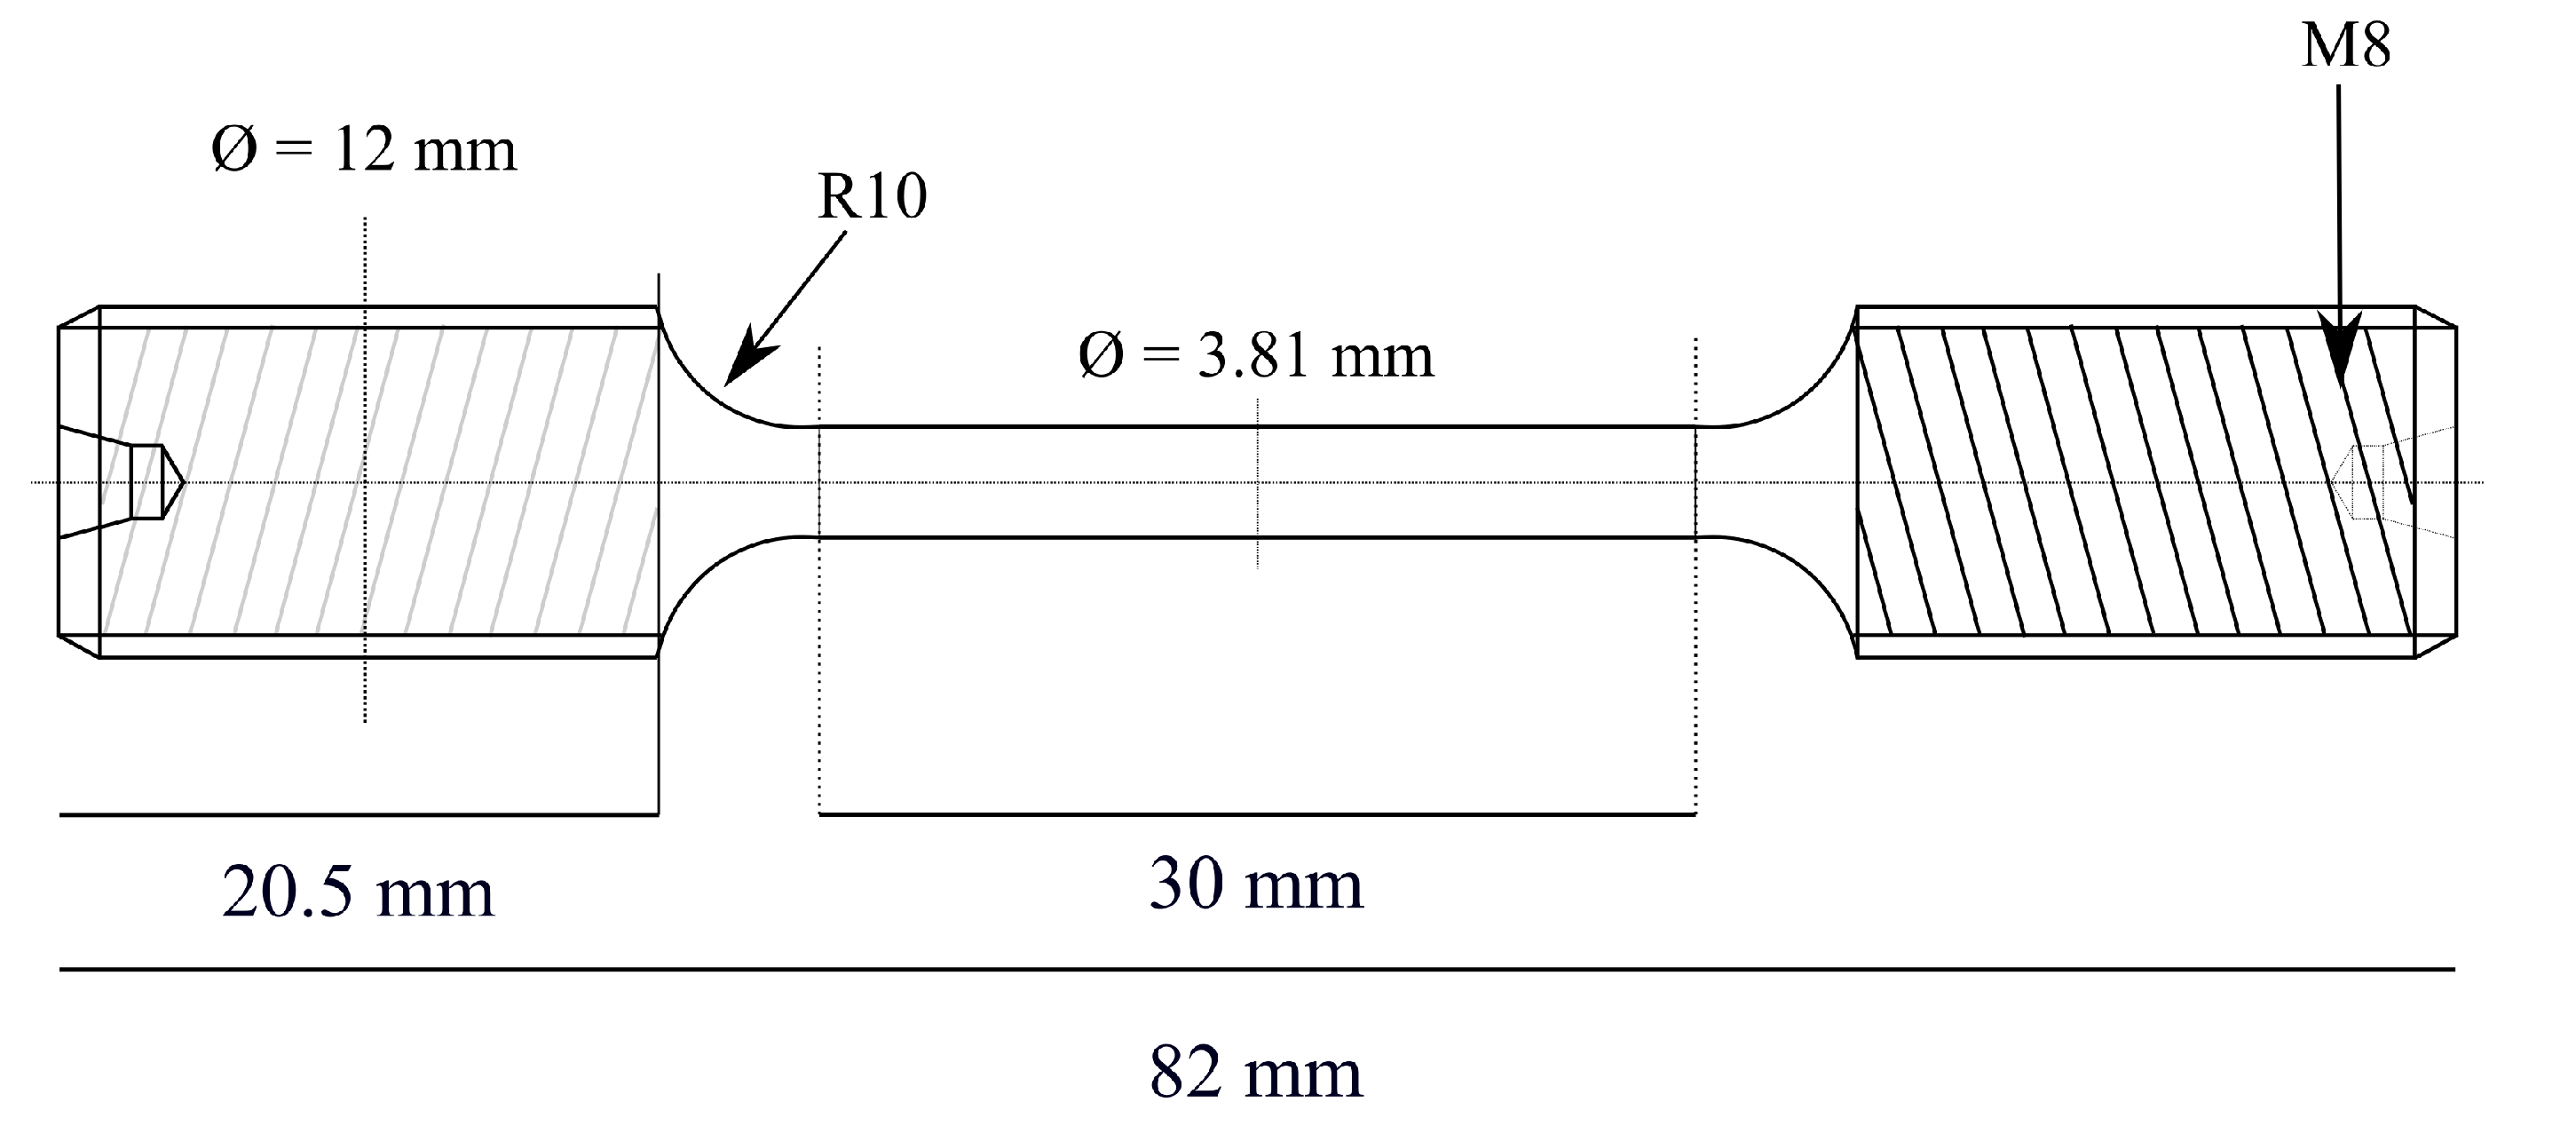
Specimens for slow strain rate testing (SSRT) were machined from the same extruded profile into the geometry given in Figure 2. The samples were washed in ethanol in an ultrasonic bath for 2.5 min. prior to testing. Test environments used were air and 3.5 wt.% NaCl solution with neutral pH and pH 3. An initial strain rate of ms was applied in all cases. Plastic insulators were mounted between the clamps and the sample in order to prevent galvanic effects when testing in solution. The pH and open circuit potential (OCP) were measured during and after each test. One tensile test for each condition, in each environment, was conducted. The fracture surfaces were observed in scanning electron microscopy (SEM) and, from such images, the reduction in area (RA) was estimated according to:
where and are the initial and final cross-section area after fracture, respectively. The reduction in area ratio (RRA) was used as a measure in order to deduce susceptibility to the environment and was done by dividing the RA value obtained in the test solution on the RA acquired in air:
2.4. Potentiodynamic Polarisation
Samples for potentiodynamic polarisation were cut to a dimension of 25 × 20 × 3.5 mm. An electrical contact was soldered to the back of the specimen, before it was embedded in epoxy and ground to a mirror finish using 4000 grit SiC abrasive paper. The samples were left at OCP in 3.5 wt.% NaCl for one hour. Polarisation was started at 100 mV below OCP and increased at a rate of 0.1 mV/s to a maximum current density of 0.05 A/cm, and then back down to OCP.
2.5. Electrical Conductivity
Electrical conductivity was measured using Sigmatest 2.069 unit on samples that were polished with 2000 grit SiC paper. Five measurements on each of the four conditions were conducted.
2.6. Electron Microscopy
Samples for electron backscattered diffraction (EBSD) were mechanically polished down to 0.02 m colloidal silica suspension before a final argon ion thinning step. EBSD scans were conducted on a Zeiss Ultra 55 FEG-SEM (Zeiss, Oberkochen, Germany) while using a Nordif EBSD detector with a working distance of 24 mm, sample tilt of 70°, and <0.3 m step size. Nordif3.0 was used to index the acquired patterns and all subsequent analysis was conducted using MTEX [35]. In addition, secondary electron (SE) and backscattered electron (BSE) images were acquired on the same instrument.
The specimens for transmission electron microscopy (TEM) were prepared by grinding using SiC abrasive paper to ∼100 m foil thickness, punched into 3 mm discs and thereafter electropolished with a Struers TenuPol-5 machine (Struers, Copenhagen, Denmark). An electrolyte consisting of 1/3 HNO and 2/3 CHOH kept at temperatures between −30 and −20 °C with an applied potential of 18 V was used. Finally, a final Ar ion milling step in a PIPS II instrument (Gatan inc., Pleasanton, CA, United States) was applied to remove the outer layers exposed to the electrolyte. The typical conditions for this were 3 kV for 5 min. at ±3°, followed by stepwise reduction in potential down to 0.5 kV for similar durations and angles.
Two TEMs were used in this work. (i) a JEOL JEM-2100F (JEOL, Tokyo, Japan) operated at 200 kV, equipped with an Oxford X-Max 80 silicon drift detector with solid angle of 0.23 sr for energy-dispersive X-ray spectroscopy (EDS). (ii) A double Cs-corrected JEOL ARM200CF (JEOL, Tokyo, Japan) operated at 200 kV using convergence semi-angle of 28 mrad and inner collector angle 48 mrad for high-angle annular dark-field (HAADF)-scanning transmission electron microscopy (STEM) imaging. The microscope is equipped with a Centurio EDS detector (solid angle: 0.98 sr). EDS data were post-processed using the open-source python package HyperSpy [36].
3. Results
3.1. Microstructure
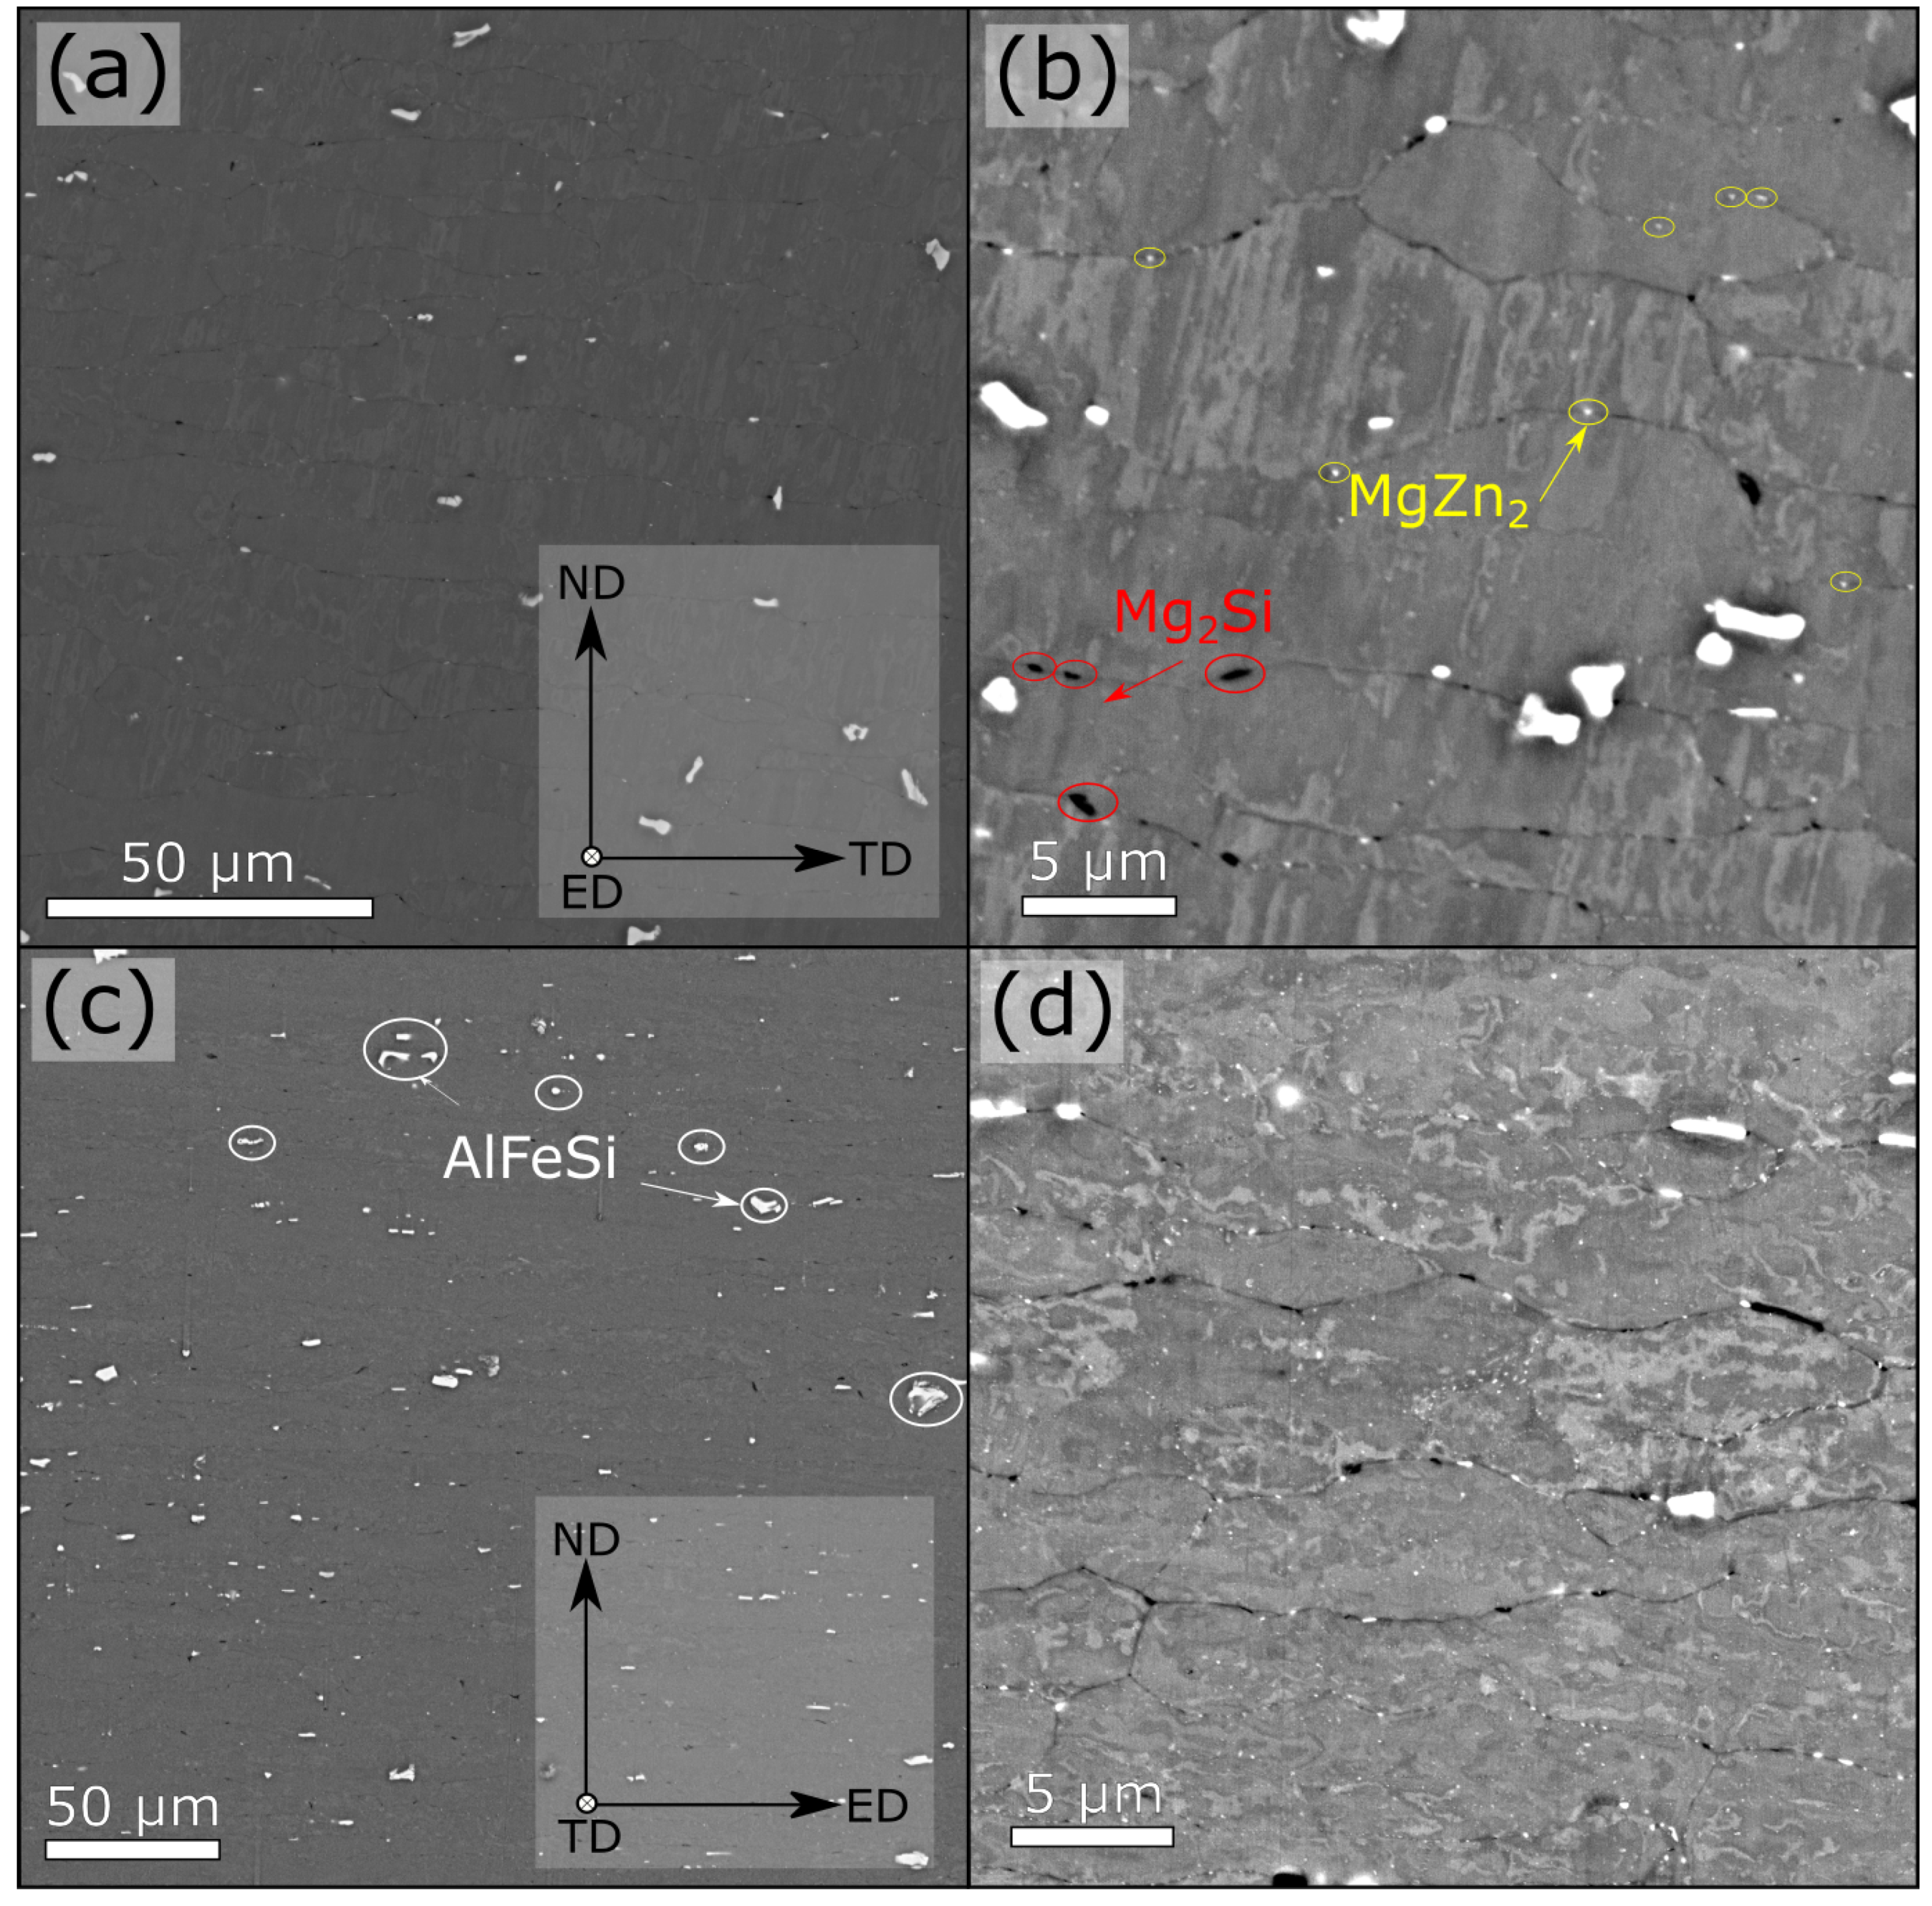
Representative BSE-SEM images at two different magnifications are shown in Figure 3. The images are acquired both parallel (Figure 3a,b) and normal (Figure 3c,d) to the extrusion direction. The large particles visible in the low-magnification images in Figure 3a,c, are primary particles composed of Al-Fe-Si. In Figure 3b,d, the grain structure is visible, with presence of very small high-intensity particles (<0.5 m). These are likely to be the -MgZn, due to their bright contrast, as will be confirmed later using TEM. The images are from the H-AC-T6 condition. In all air-cooled conditions, -MgSi particles are also present on grain boundaries, visible as dark regions in Figure 3b,d. This is the only observable difference between the water-quenched and air-cooled samples. No variation in grain boundary particle size or distribution, between the T6 and T7 tempers, could be established using SEM. The low-Si alloy appears similar to the high-Si alloy, but is expected to contain a lower fraction of -MgSi particles in the air-cooled conditions.
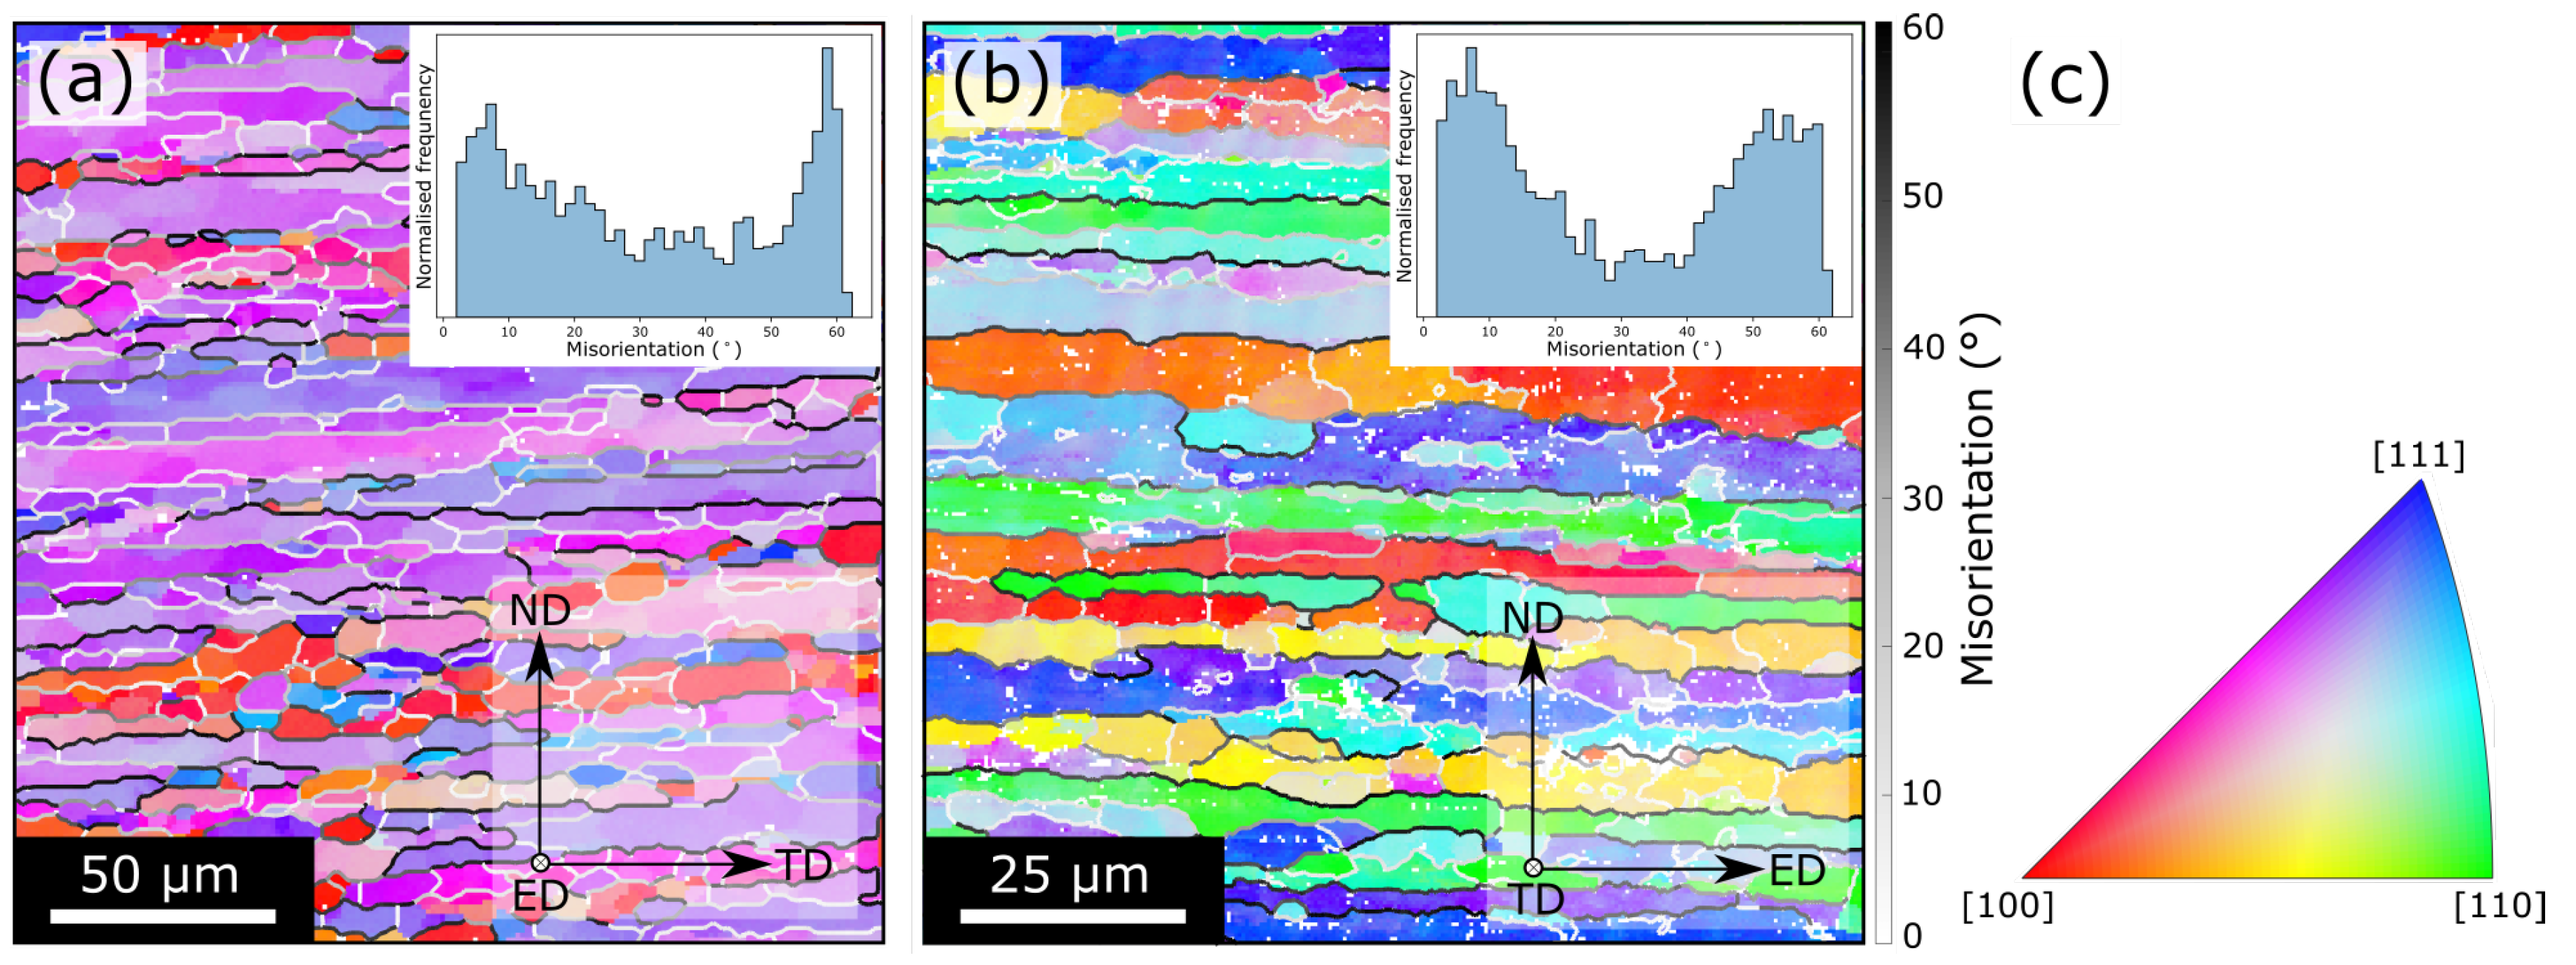
EBSD images acquired along two different orientations are shown in Figure 4. The grains in Figure 4a,b are coloured according to the colour map in Figure 4c, and the grain boundary misorientations are coloured according to the scale in Figure 4b. Figure 4a shows the cross-section of the extrusion direction (ED), where most of the grains are oriented close to either the [111] or [100] directions. Large amounts of low-angle grain boundaries are found between grains with close to similar orientation, and high-angle grain boundaries are present between grains with dissimilar orientations. Most of the grain boundaries are aligned nearly parallel with the transverse direction (TD). In Figure 4b, the cross-section of the TD is shown. A typical extrusion texture is visible, where large fibrous grains are aligned parallel to the extrusion direction and separated by high-angle grain boundaries. Within the grains, there are mostly low-angle grain boundaries. Additionally, very low-angle (< 2°) sub-grain boundaries are present and distinguished by variations in colour within each grain. Both EBSD images are from the H-WQ-T6 condition and it is representative of all conditions of this study.
3.2. Grain Boundaries in TEM
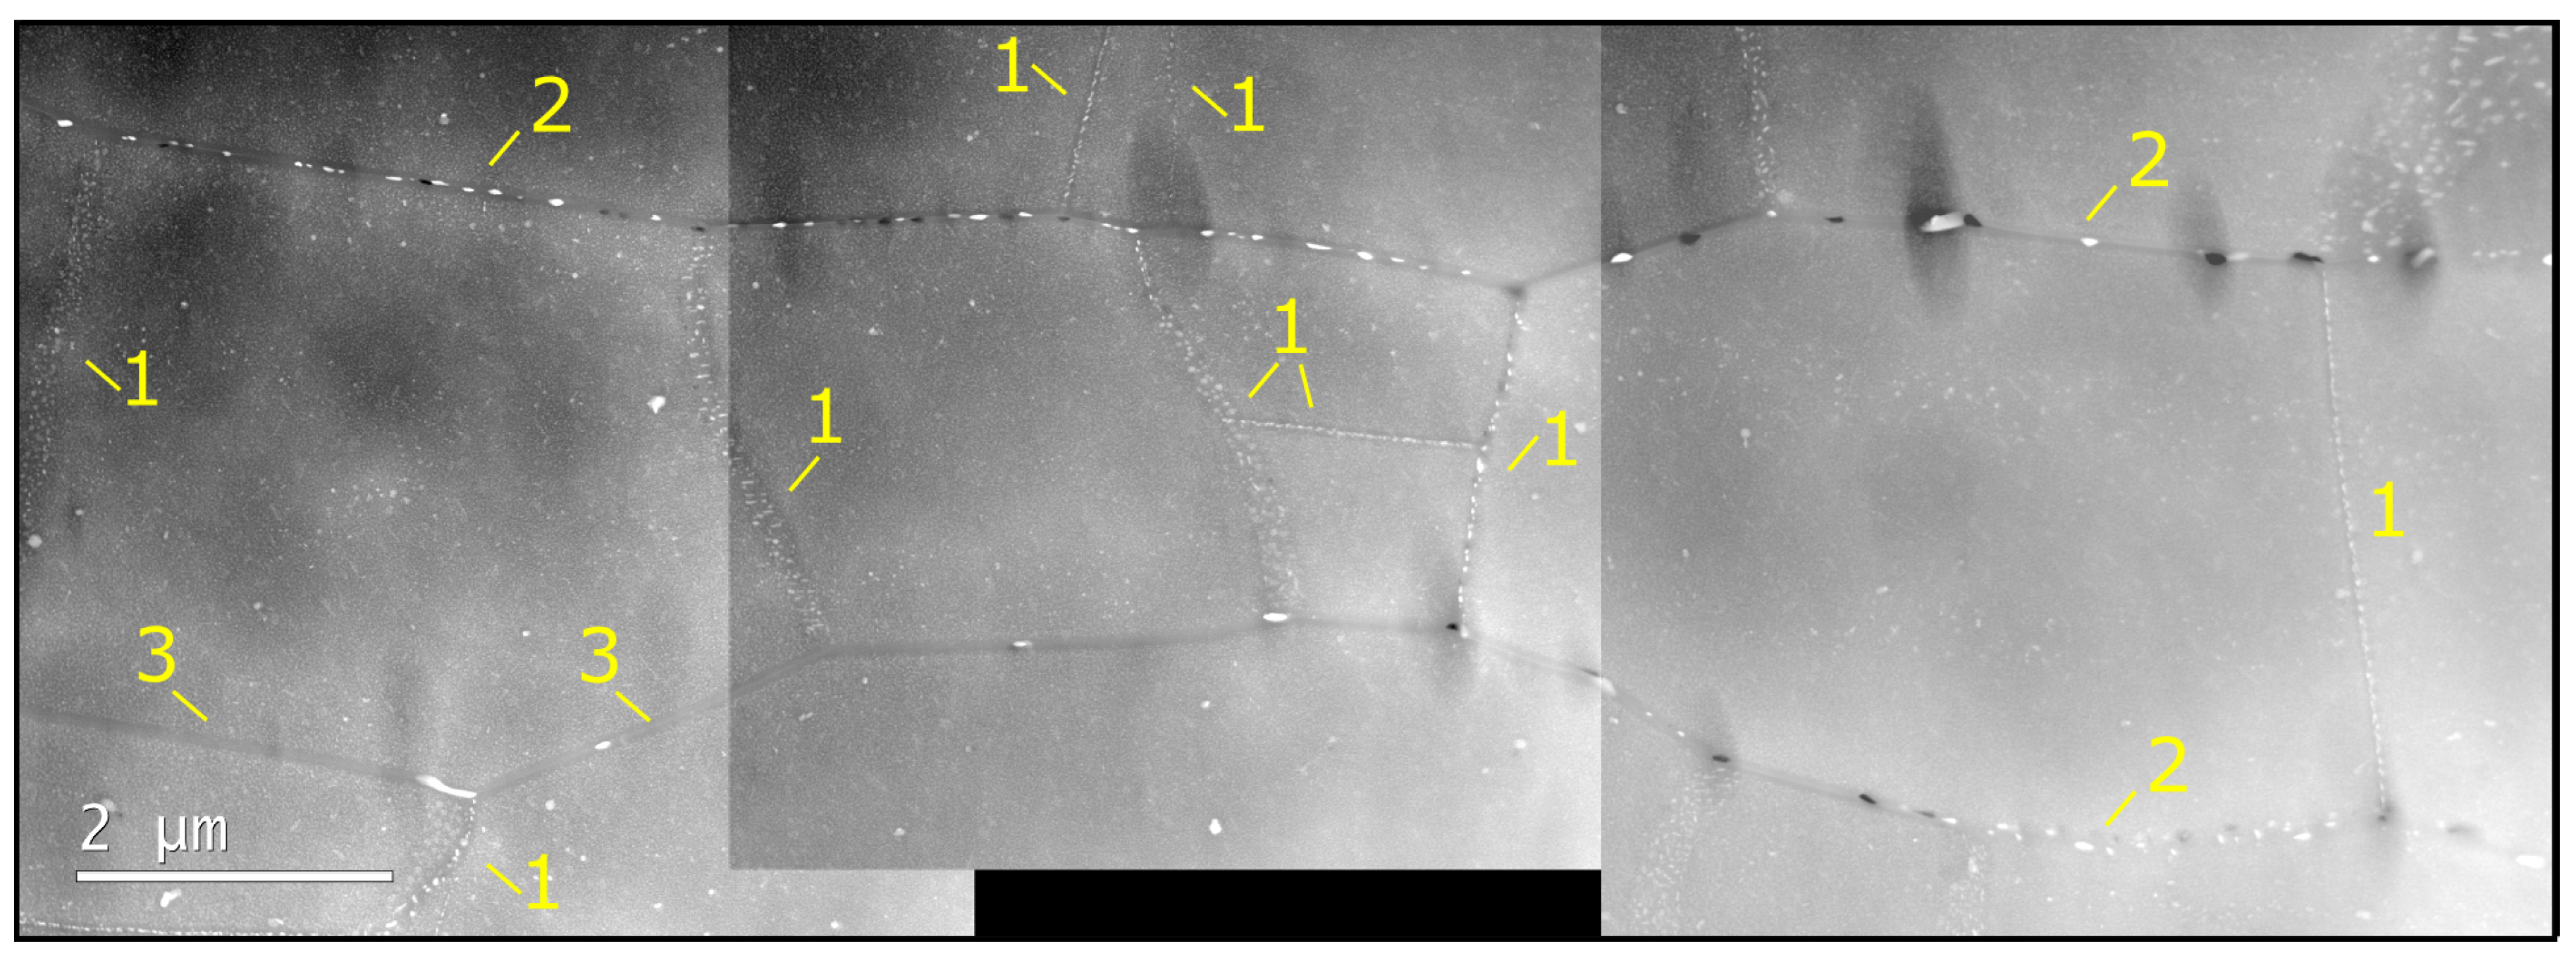
Three distinct grain boundary ‘types’ were observed in all conditions and are shown in the HAADF-STEM images acquired parallel with the extrusion direction in sample H-AC-T7 in Figure 5. Type 1 are sub-grain boundaries with <2° in misorientation, and they are clearly distinguishable by their high density of small particles likely to have formed due to preferential nucleation on dislocations. Type 2 and 3 grain boundaries are not distinguished by misorientation angle, but rather by the presence of particles or not. Type 2 contains precipitated particles, which are larger than those found on the sub-grain boundaries, while type 3 has very few or no particles present. The size of 40–60 grain boundary particles, in both type 1 and type 2 grain boundaries, was measured for two conditions, and is presented in Table 2. The average value of the particle size increases slightly in the T7 condition as compared to the T6 condition. However, there are large variations in the measured data that are manifested in the standard deviations. Large scatter in particle sizes and densities are found within the same material, and even along the same grain boundary segment. This is likely related to the particles nucleation plane and/or coherency of the adjacent grains.
A typical cell structure with high density of MgZn grain boundary particles is shown in Figure 6a–c. These bright-field (BF)-STEM images were acquired viewing perpendicular to the extrusion direction for sample H-WQ-T6. In Figure 6c, the grain boundary particles are seen from different projections and demonstrate their puck-like shape. Type 2 grain boundaries with particles of different size and morphology are shown in the two BF-STEM images in Figure 6d,e. In Figure 6d, the long axes of the particles are aligned in the same direction and show a similar strong diffraction contrast. This indicates that they are all nucleated relative to one of the grains. In Figure 6e, the particles appear more randomly oriented. Figure 6f shows a HAADF-STEM image of a type 3 grain boundary with no particles present. Similar observations were made in all the conditions studied in this work.
The average widths of PFZs, measured from 10 type 2 and type 3 grain boundaries, are given in Table 2 with corresponding standard deviations. The H-WQ-T6 condition has an average width of 80 nm, which is slightly smaller than the three other conditions with PFZs at around 110 nm.
The composition of approximately 150 grain boundary particles from each condition of the high-Si alloy, was measured using EDS spot analysis in microscope (i), and the average Zn/Mg ratio is shown in Table 2 under ‘Multiple’. Particles in the T7 tempers exhibit a higher average Zn/Mg ratio regardless of the cooling method from SHT. The T6-AC temper has the lowest average Zn/Mg ratio of 1.64. Note that, within the same condition, there are large variations in the grain boundary particle compositions, which can be seen in the scattered plots of the data shown in Supplementary Figure S1. In addition, a particle composition analysis from a single grain boundary particle in each condition was obtained from microscope (ii) and is given Table 2. No clear difference can be deduced based on these results. The Al amount is likely to be overestimated due to the surrounding matrix, although it has previously been shown that Al may incorporate into the -MgZn phase [37,38].
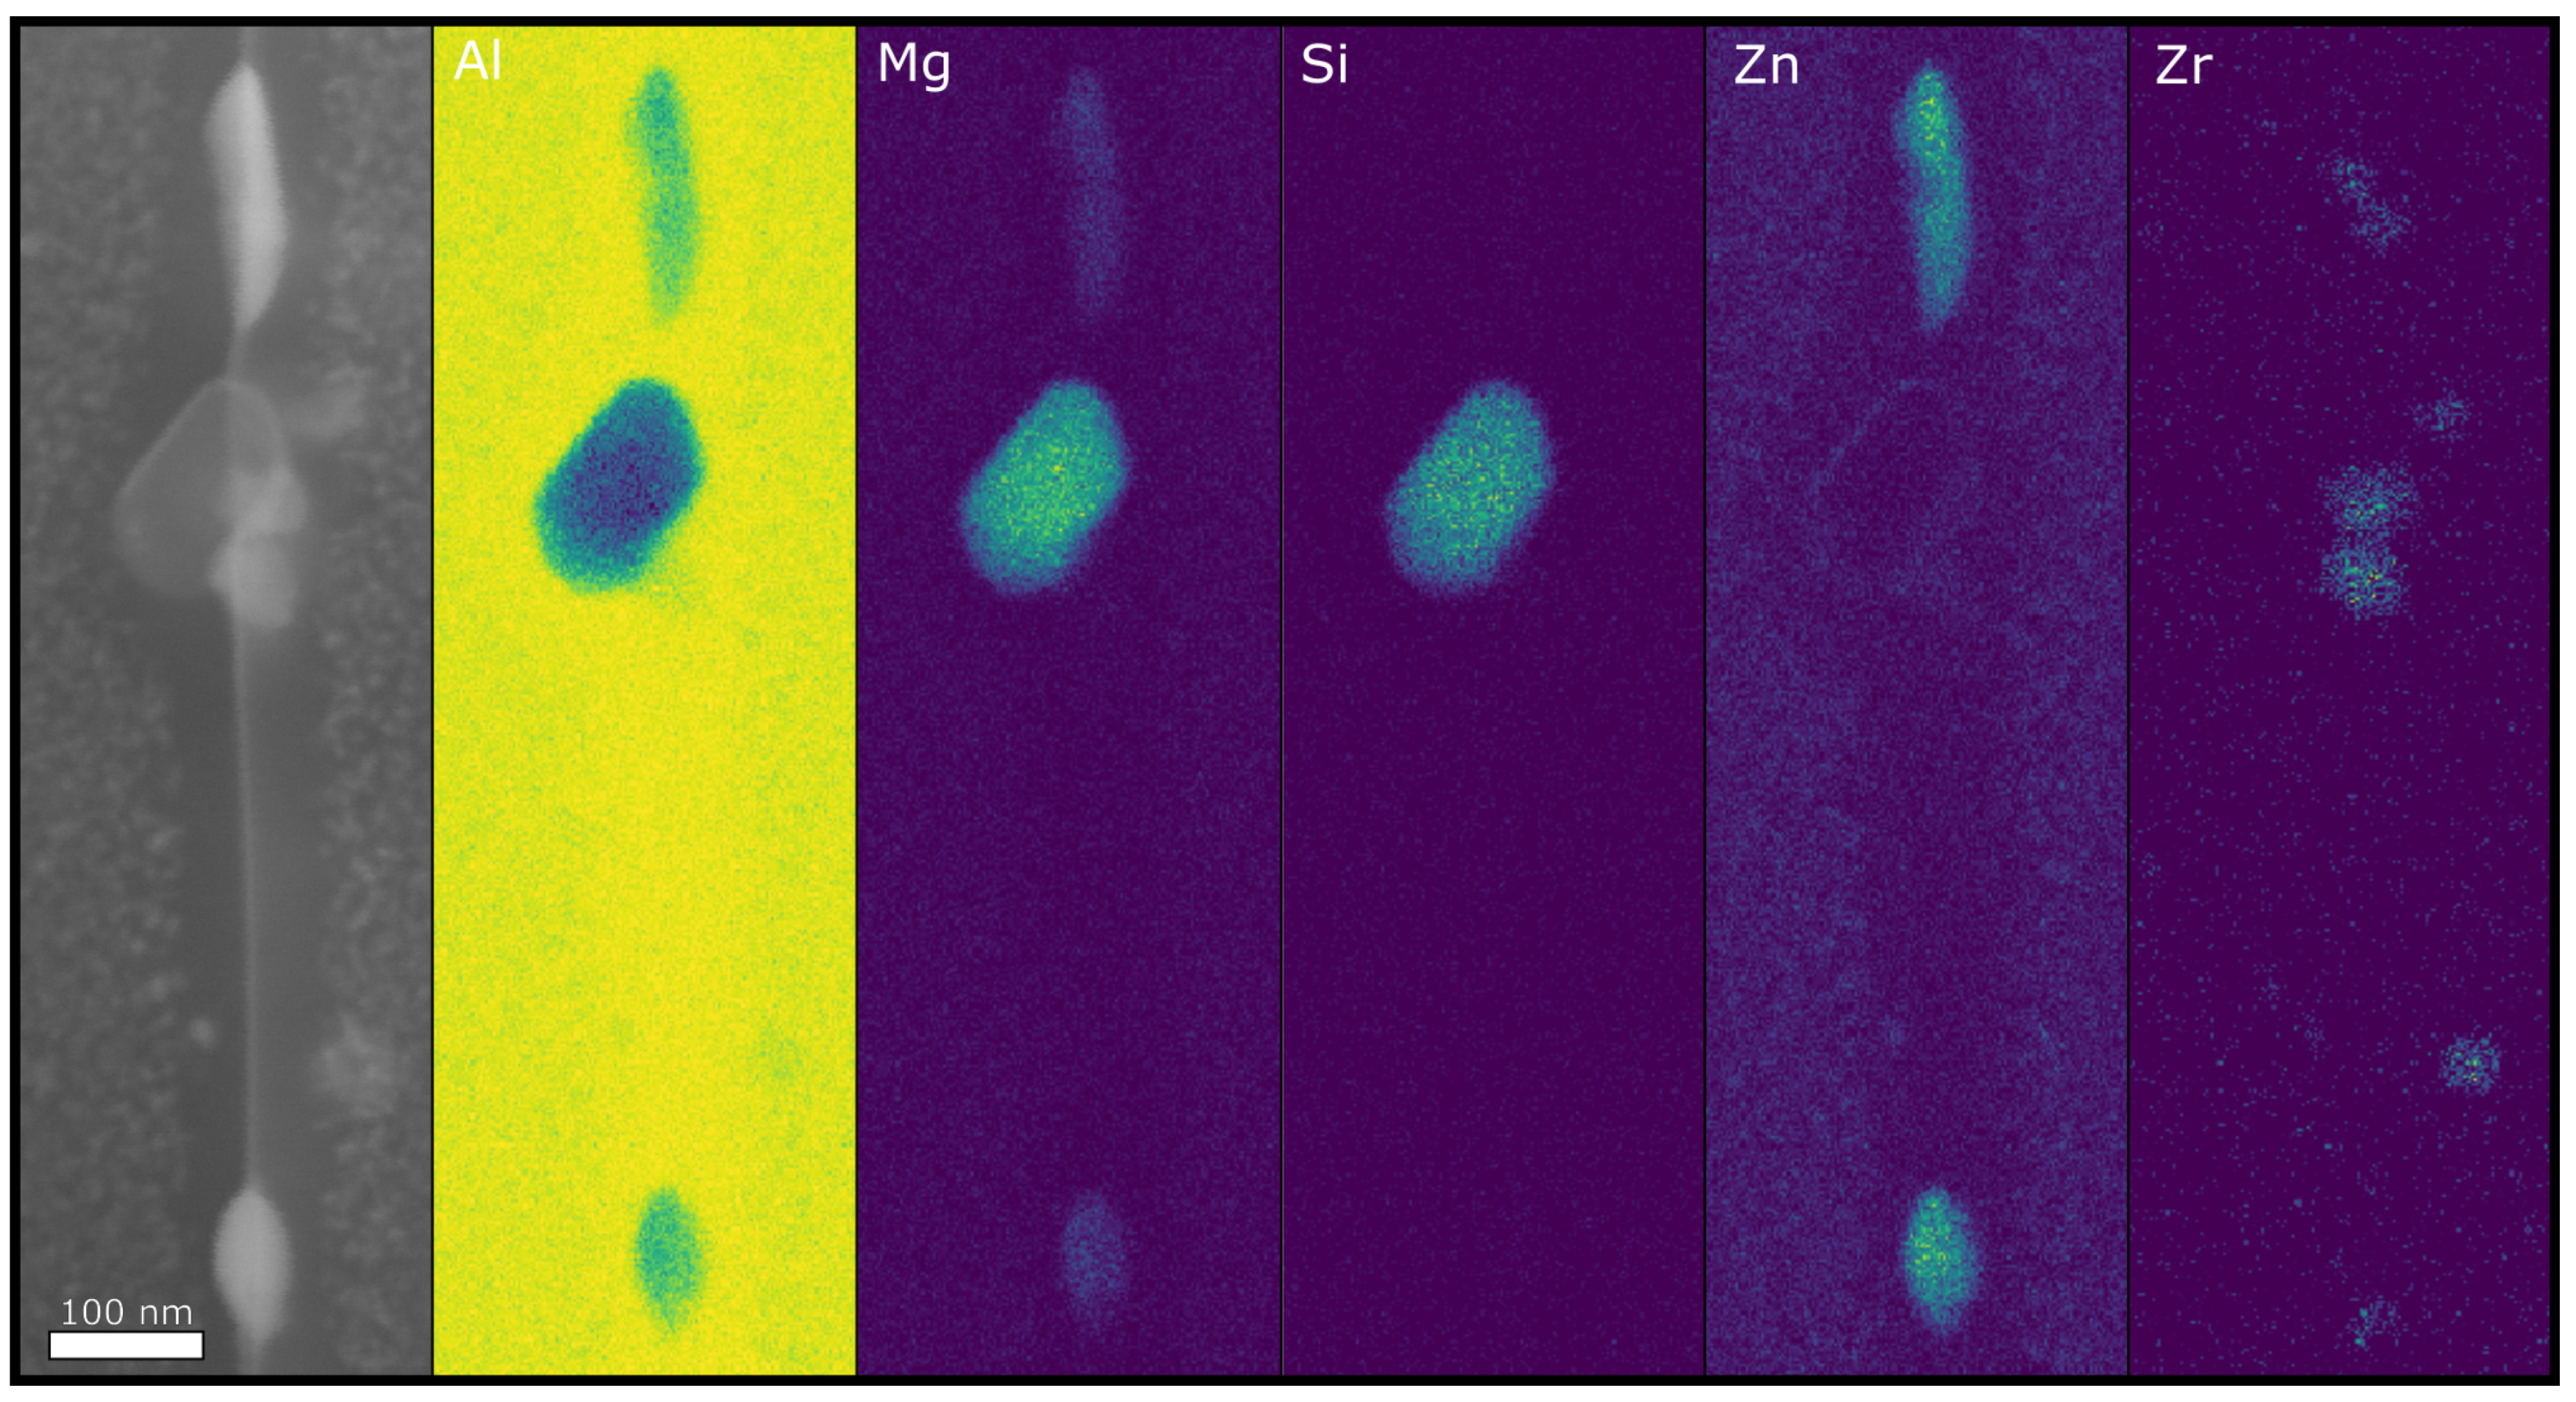
In addition, there are -MgSi particles present along grain boundaries for the air-cooled conditions. An example is shown in Figure 7, where a MgSi and two MgZn particles are present. Note that there are also AlZr dispersoids close to the MgSi particles, which makes it uncertain what the nucleation site is in this example.
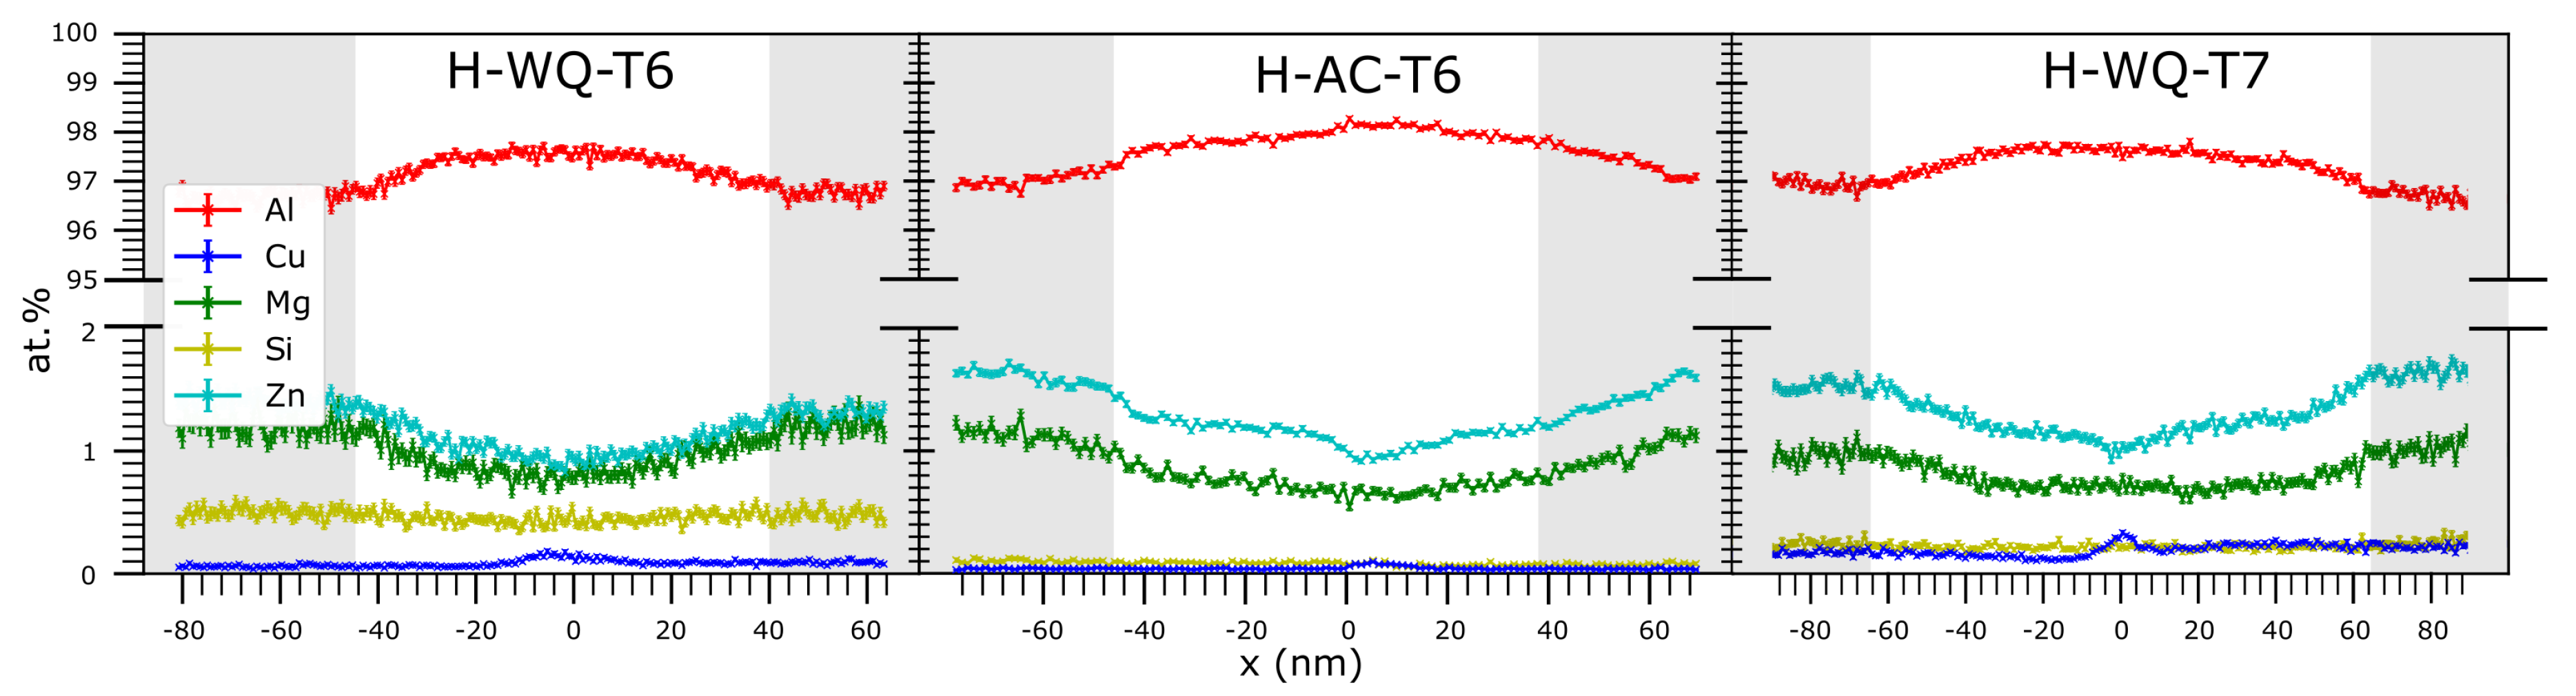
The solute concentrations across grain boundaries viewed edge-on, including the bulk and PFZ of the adjacent grains, were measured using EDS on the type 3 grain boundaries. Data from an EDS map are represented as a linescan where each point represents the average and corresponding standard error of the mean as a function of distance from the boundary. This is shown in Figure 8 for H-AC-T6, H-WQ-T6, and H-AC-T7. It can be observed that both Mg and Zn are depleted in the PFZs as compared to the bulk. In addition, conditions H-AC-T6 and H-WQ-T7 have a higher relative amount of Zn when compared to Mg than condition H-WQ-T6. Moreover, sample H-WQ-T6 consistently demonstrated an enhanced Si signal. In some cases an enhanced Cu signal was found at grain boundaries, but no indications of Mg or Zn segregation were observed in any of the conditions.
3.3. Matrix Precipitates
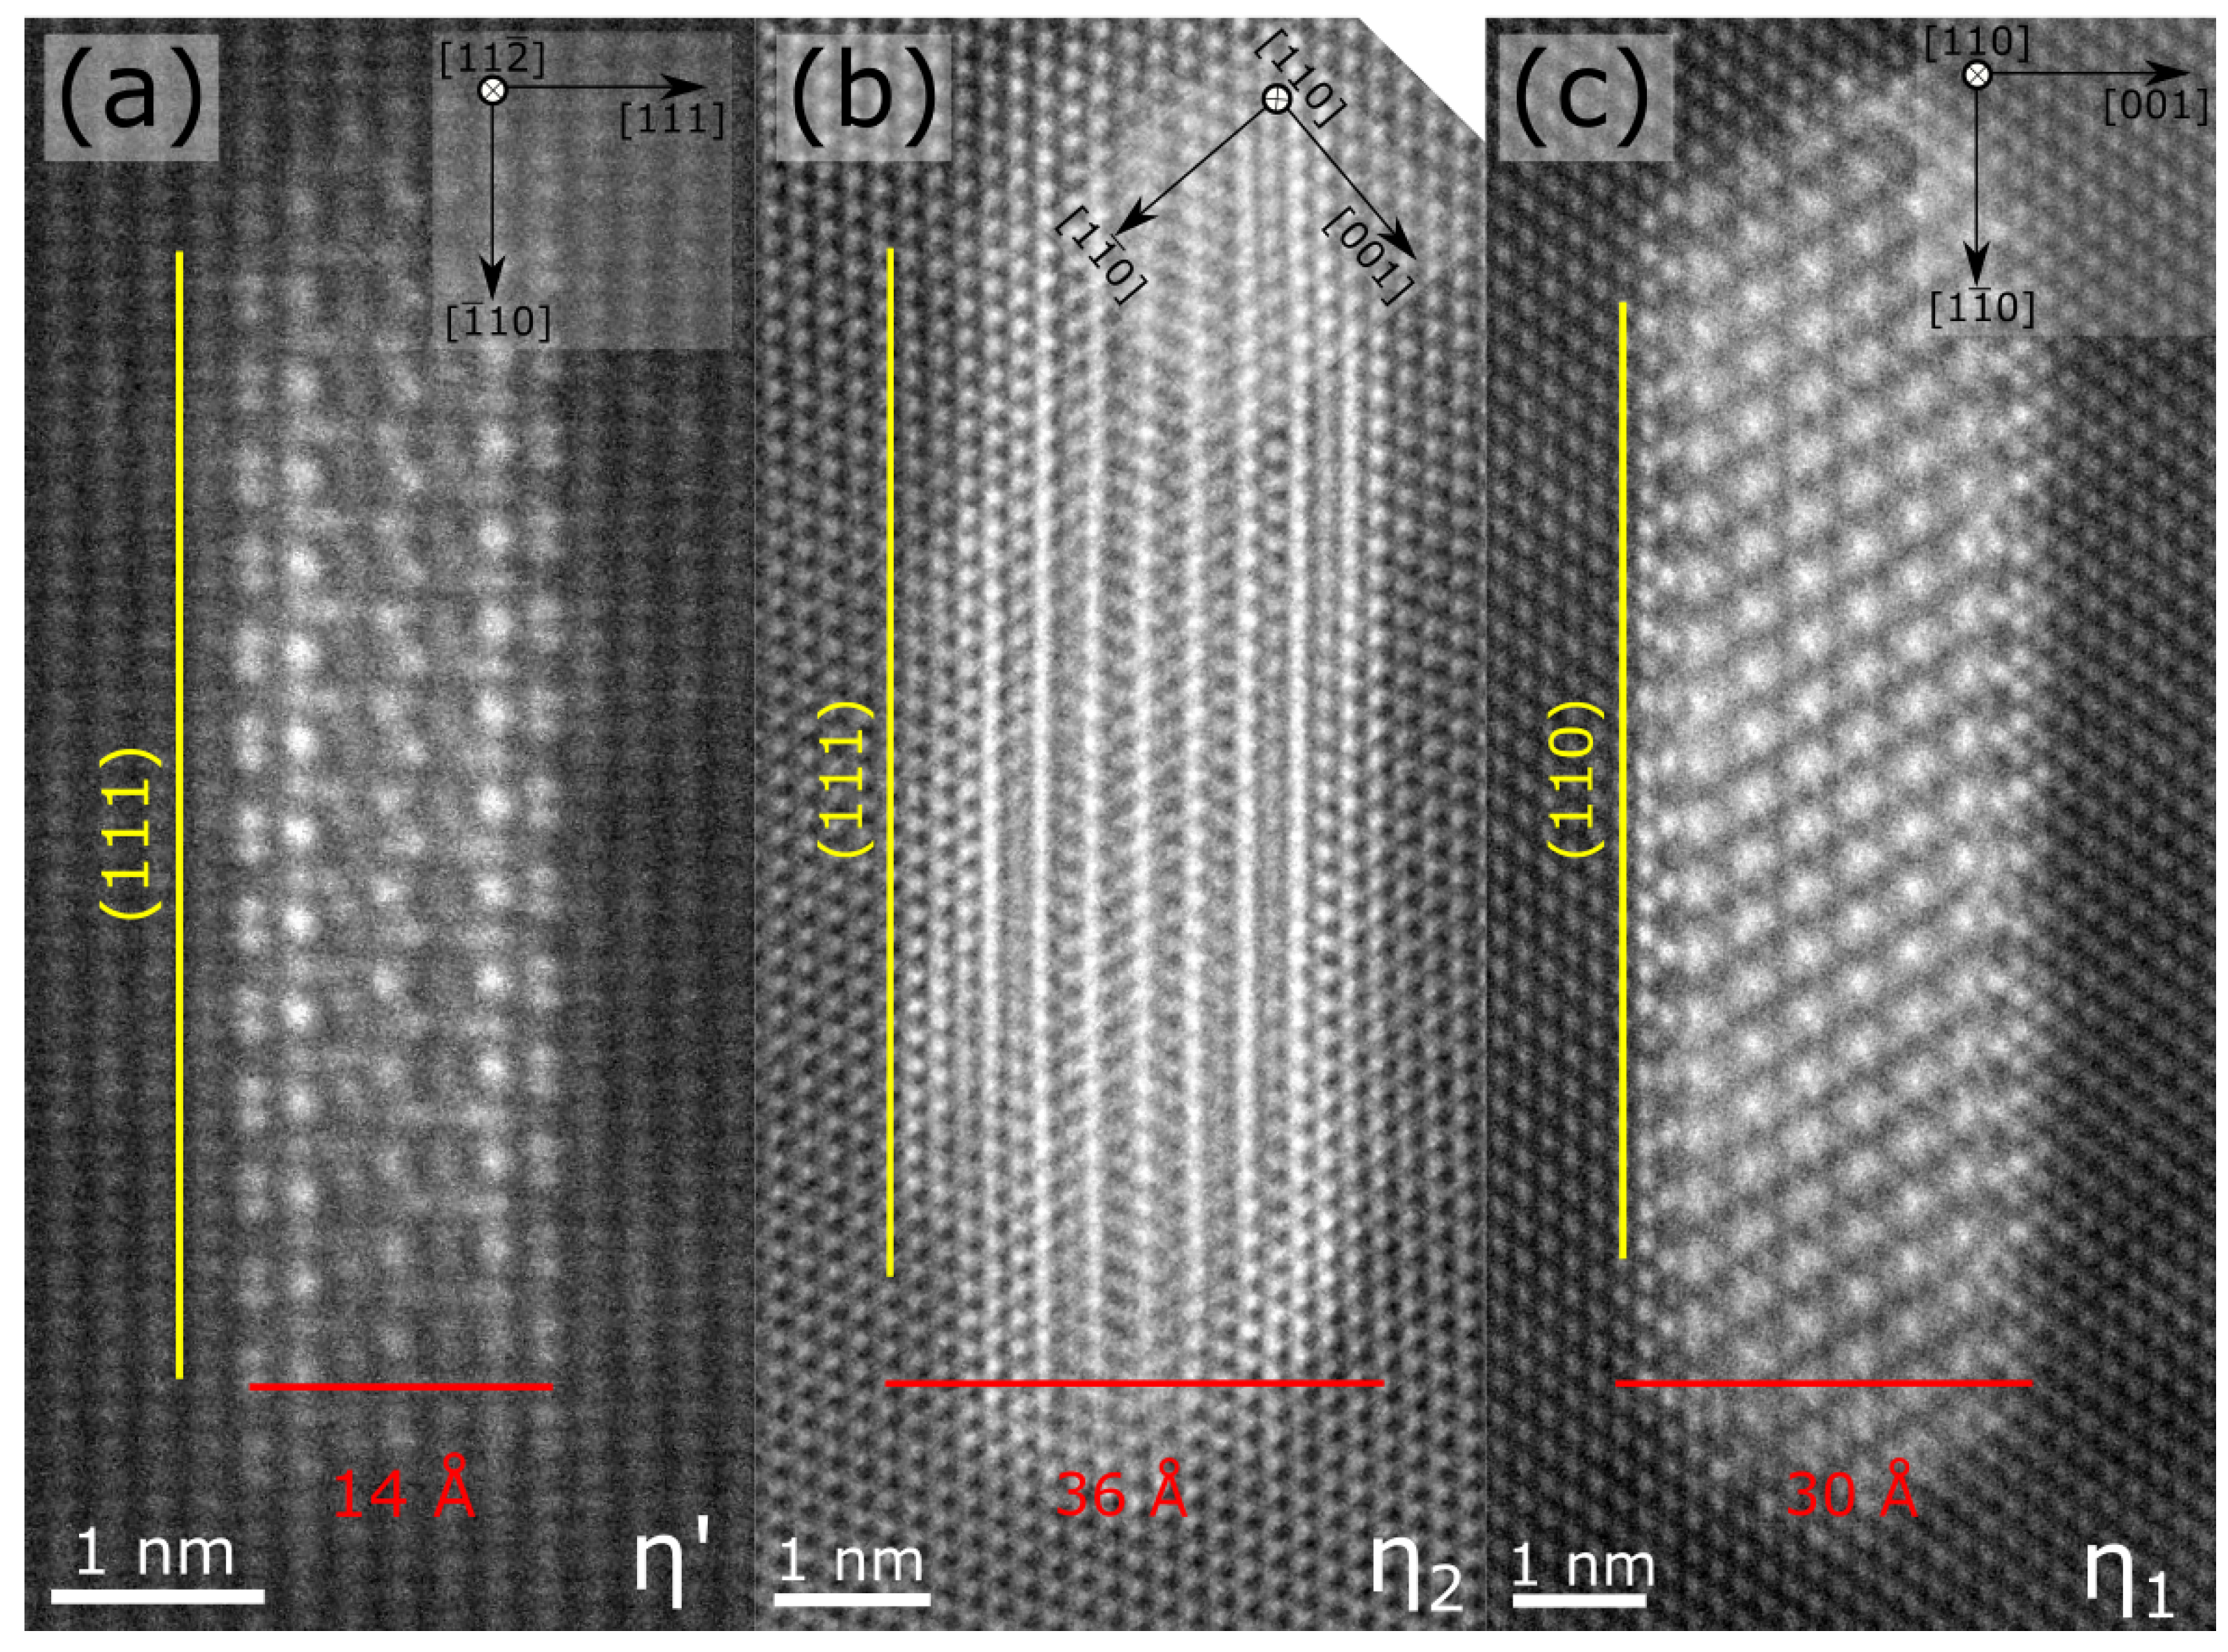
In our previous work, we demonstrated that the T6 and T7 tempers consisted of bulk precipitates that differed both in orientation relationship and size, independent of the prior cooling rate from SHT [33]. The T6 temper consisted of and precipitates, while the T7 temper had and precipitates. Precipitates in the T7 temper are larger both in thickness and diameter. This is shown in Figure 9, where Figure 9a shows an precipitate imaged along [11] in H-WQ-T6. Figure 9b,c are the and precipitates, respectively, projected along [110] in sample H-WQ-T7. has a (110) interface plane, while the two others lie on the (111) plane.
3.4. Electrical Conductivity
The electrical conductivity of the different conditions was measured and the results are given in Table 3. The measured values are slightly higher for the T7 tempers. There is no measurable effect between the two different cooling methods from SHT.
3.5. DCB Testing
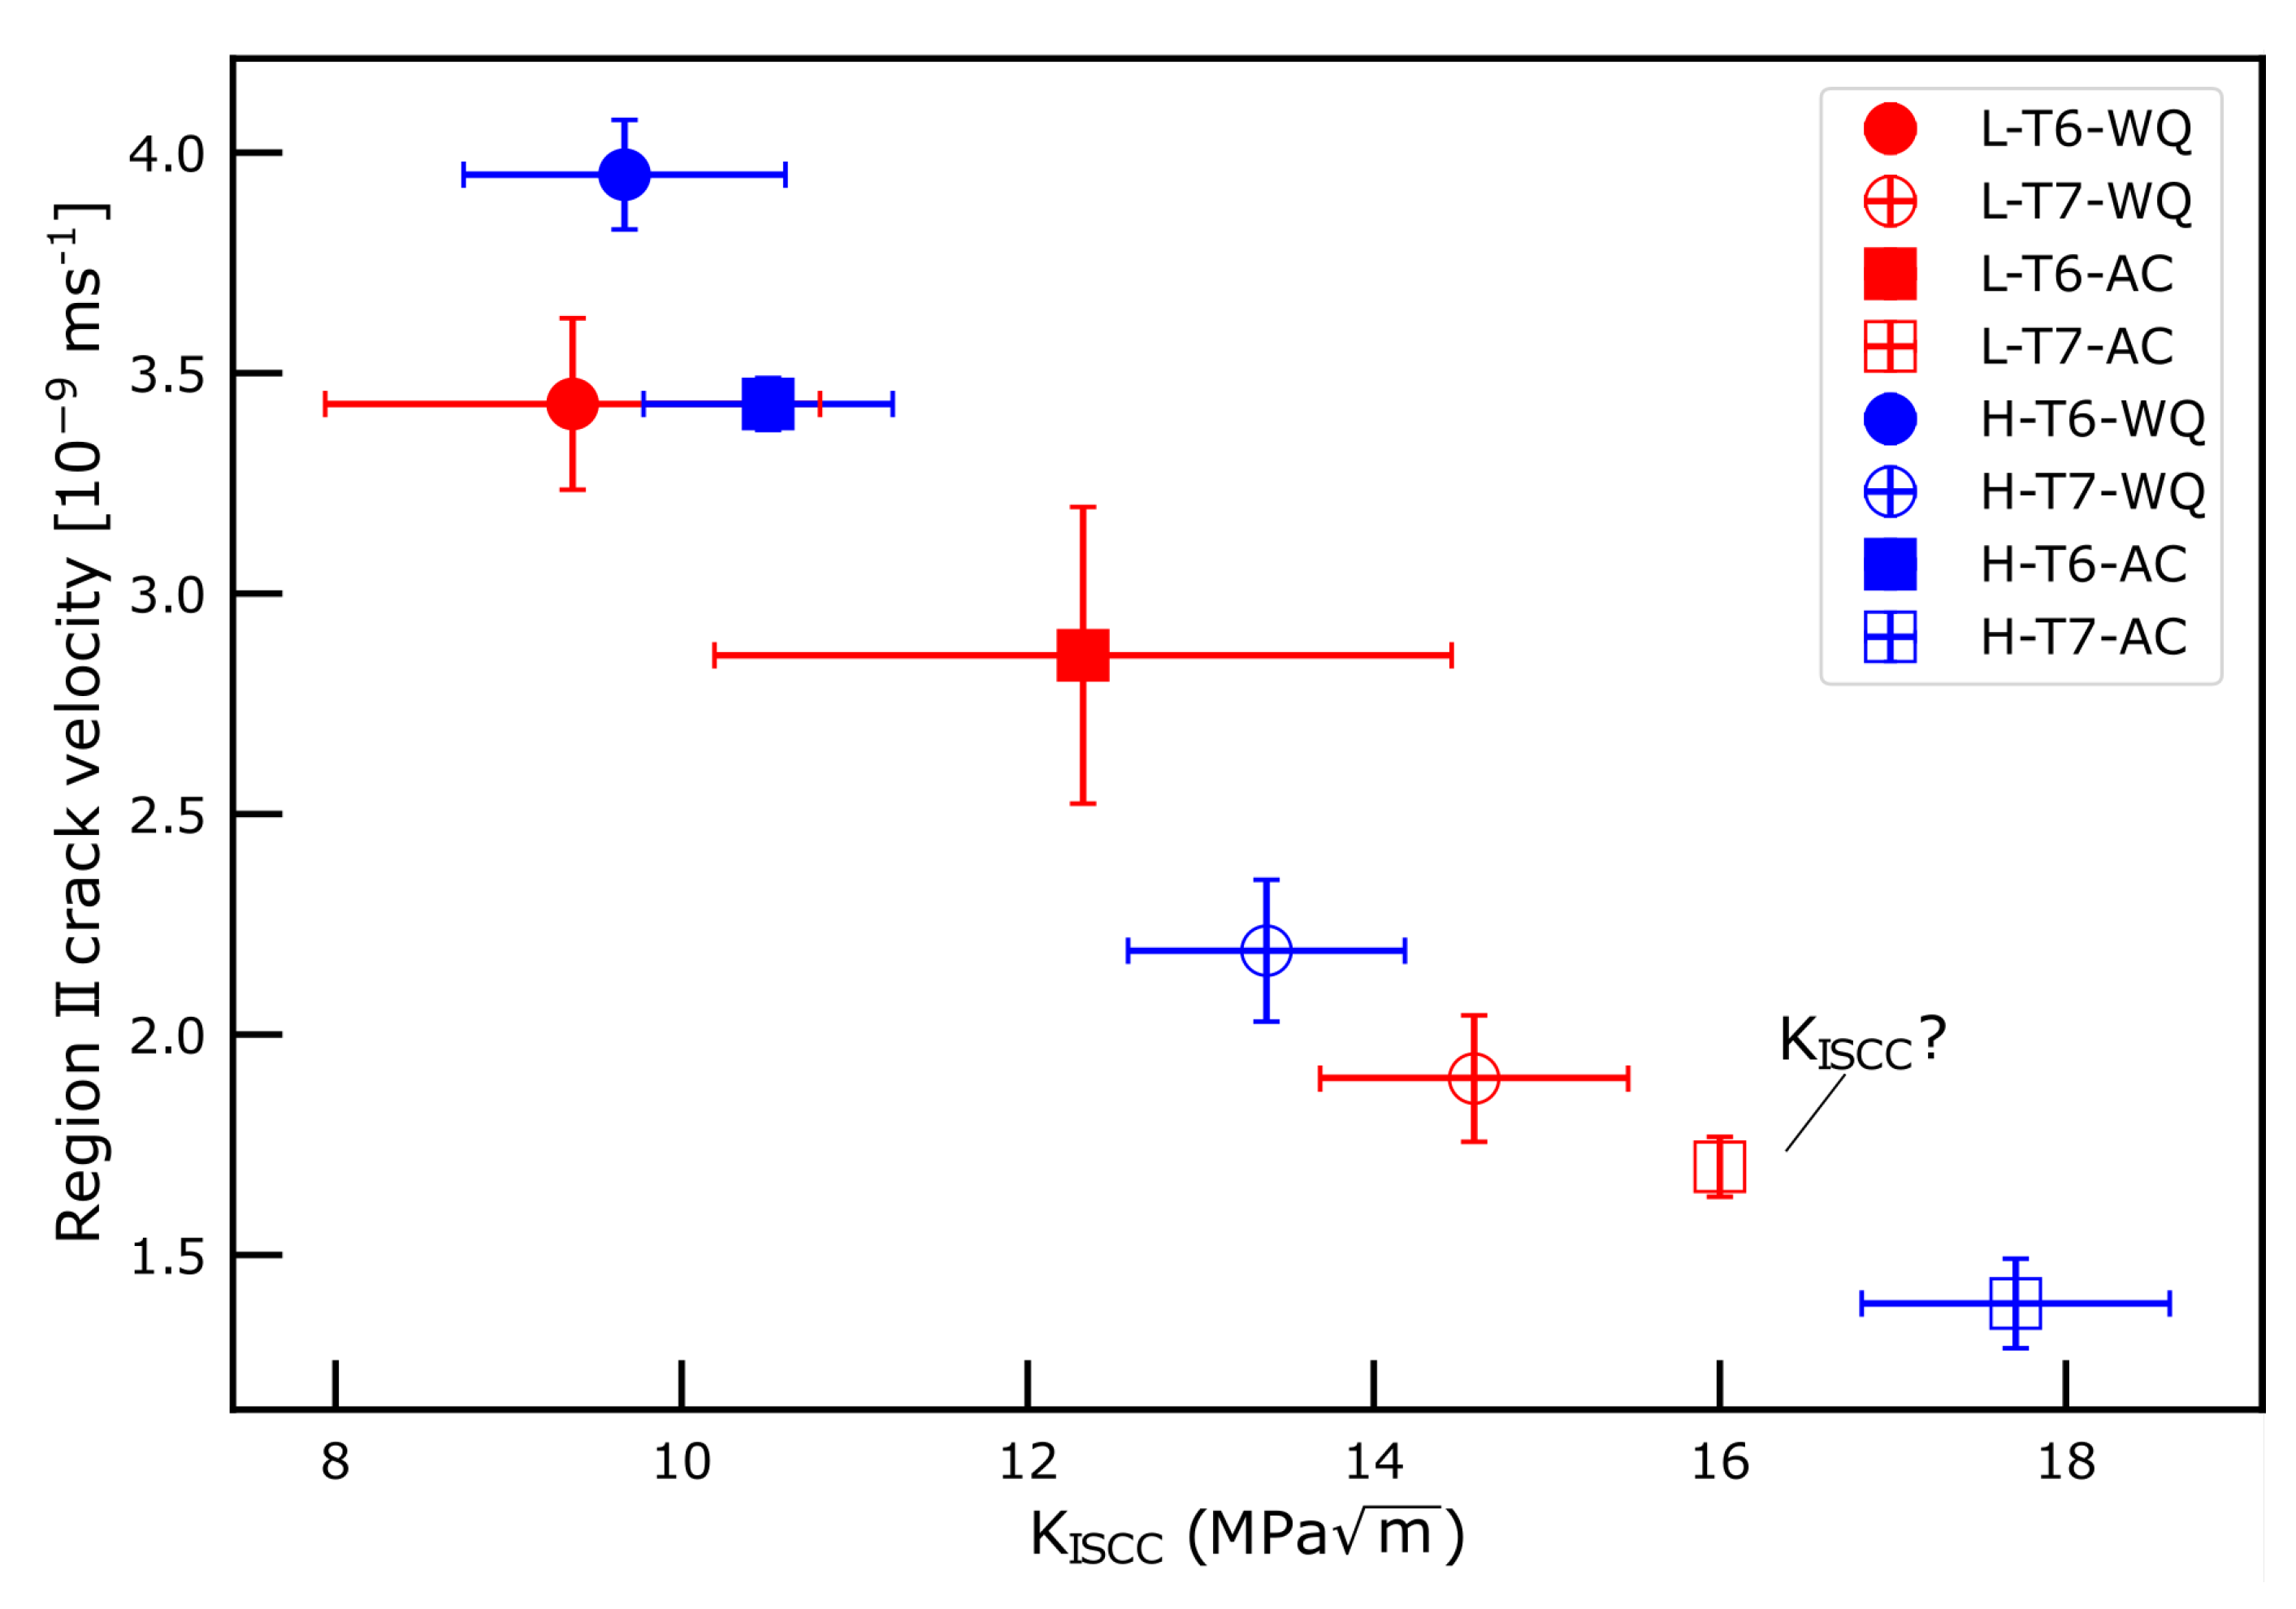
The results from the DCB tests are shown in Figure 10, where the region II (plateau) crack velocity is shown together with the estimated K values. Region II crack velocities are all within the same order of magnitude ( ms−1), with the lowest values in the T7 tempers. A higher K value is found in the T7 tempers. Air-cooling increases the K value to slightly higher values than their water-quenched counterparts. All conditions, except L-T7-AC, exhibit a clear drop in crack velocity at lower K values. The difference in Si levels does not show any clear trend and it has a limited effect on the properties measured here. The conventional crack velocity vs. stress intensity graph, from which the data presented in Figure 10 are obtained, is found in Supplementary Figure S2.
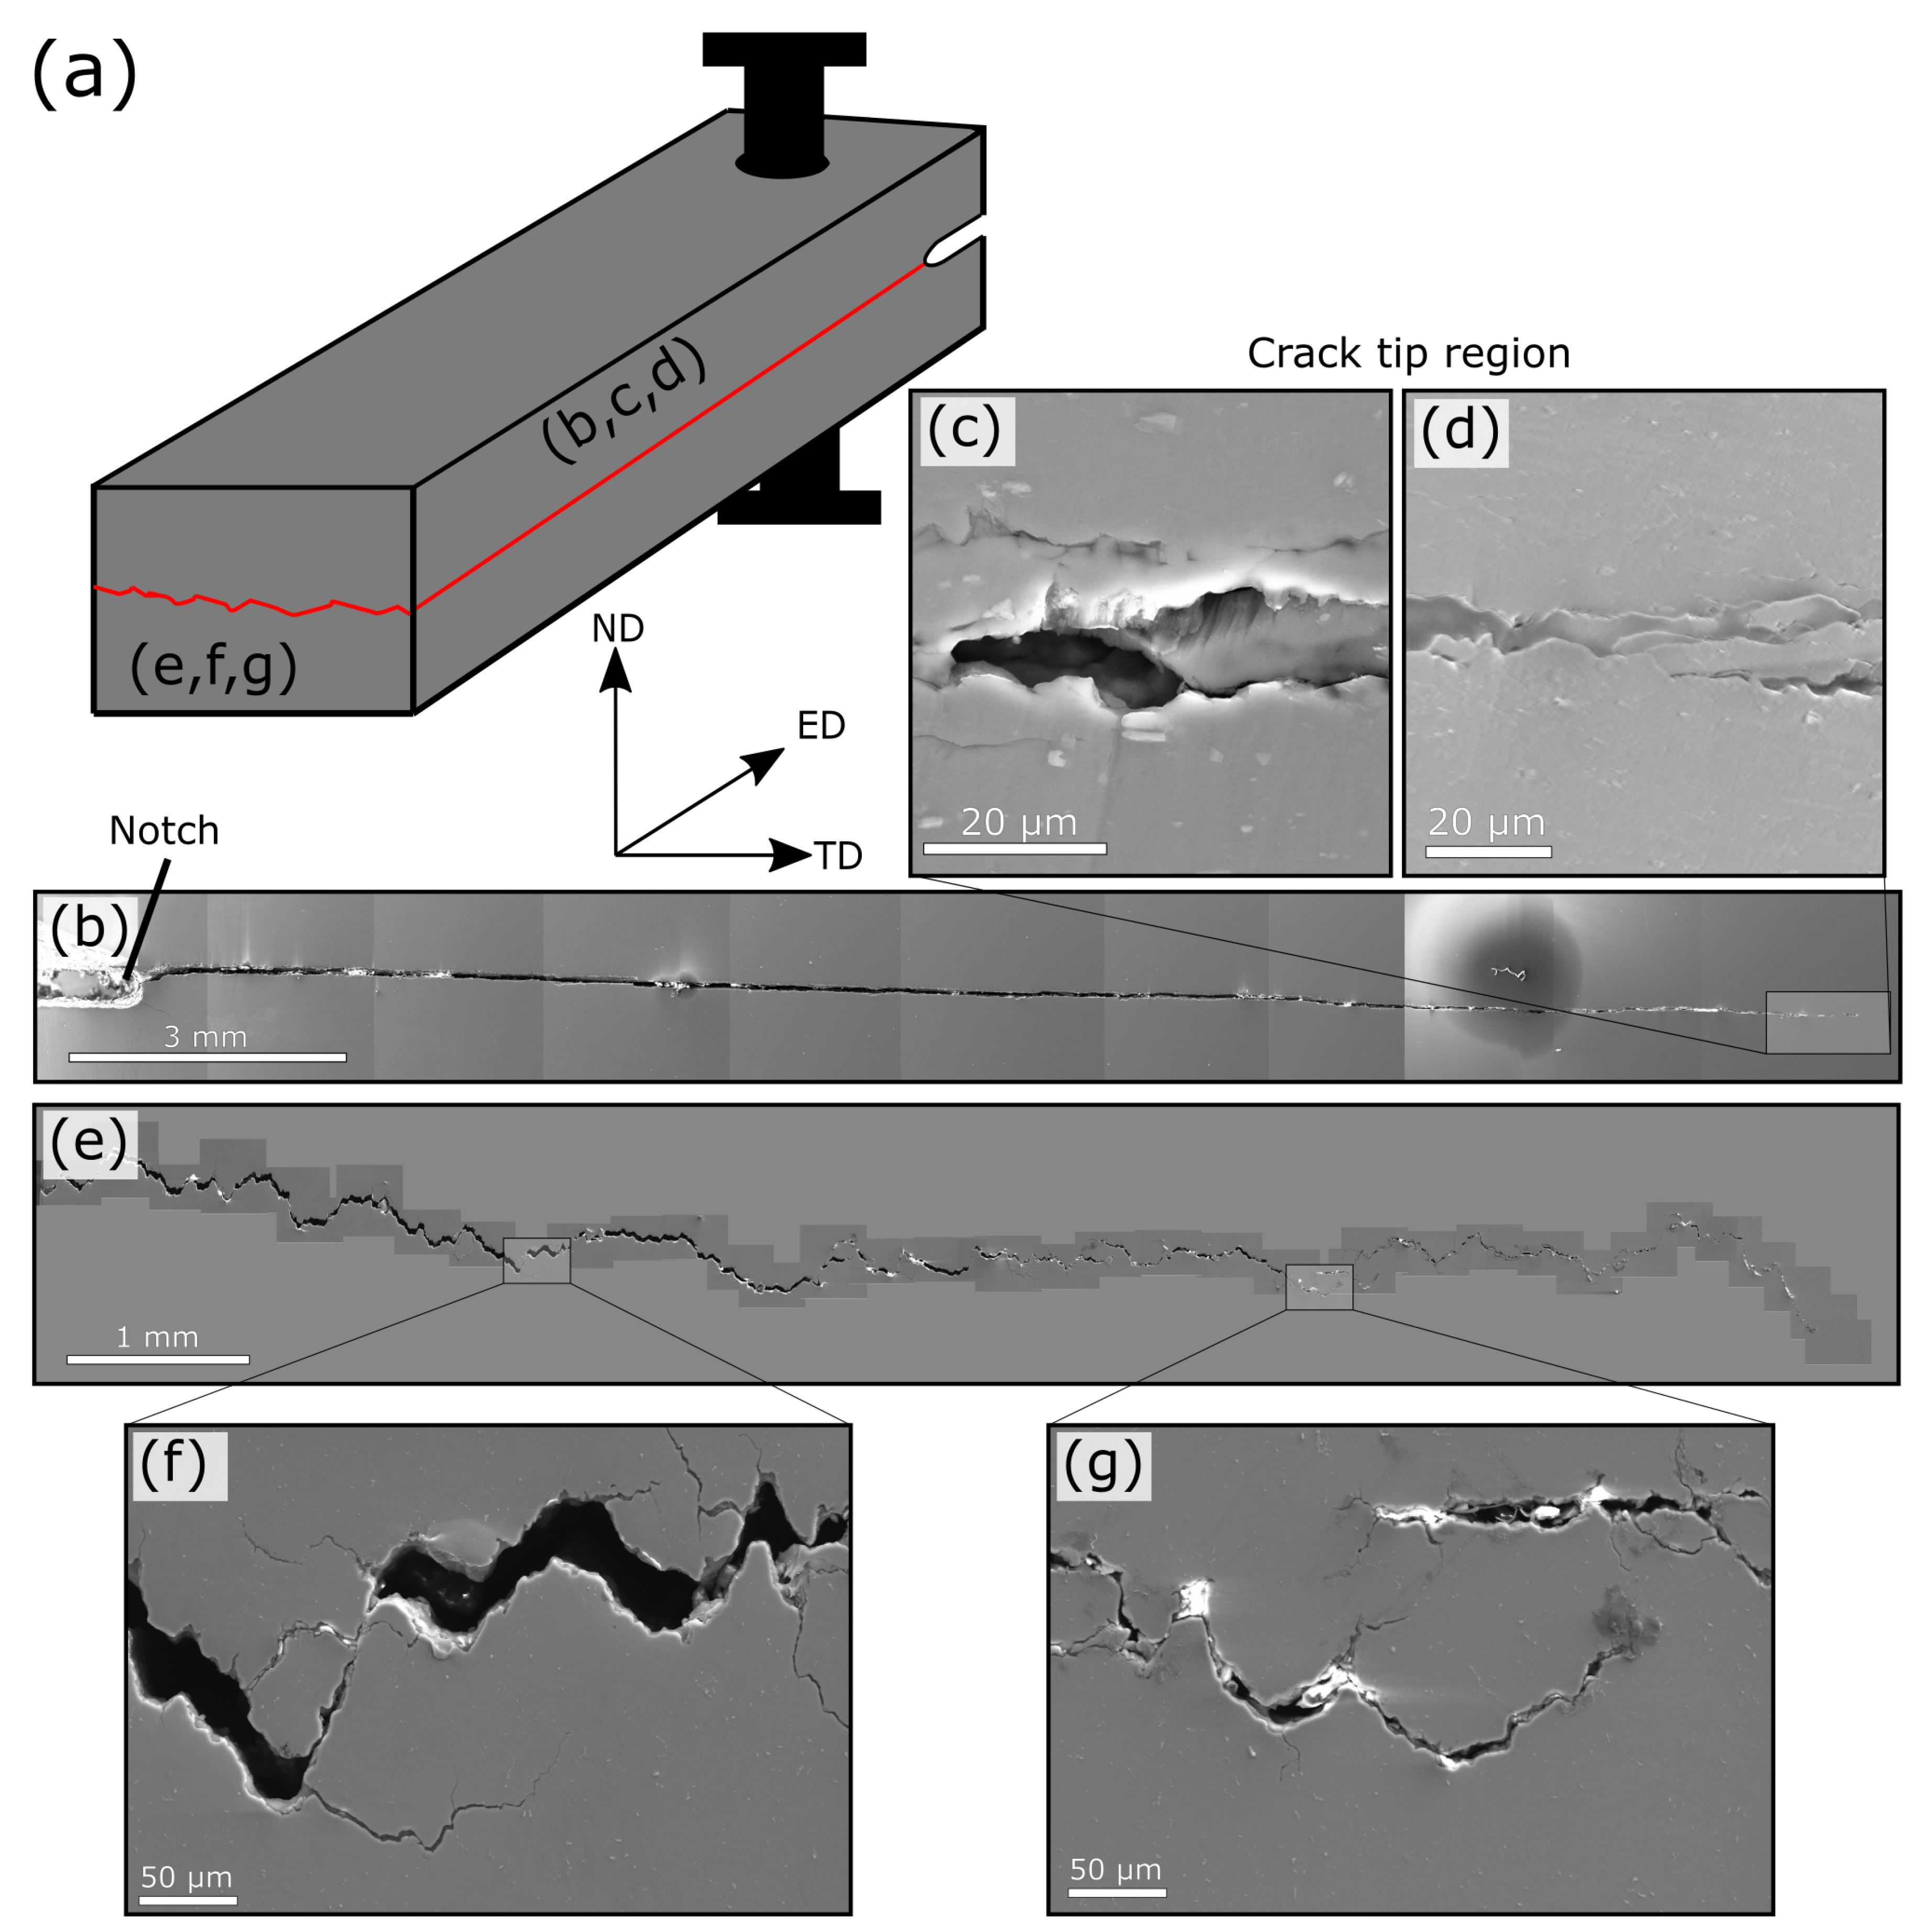
The cracks on the DCB specimens were studied in SEM in the directions both parallel and normal to the extrusion direction. Figure 11a shows a schematic figure, where the red lines indicate the cracks. Along the extrusion direction the cracks follow nearly a straight line as shown in Figure 11b. Higher magnification images of the crack tip region are shown in Figure 11c,d, demonstrating that the cracks follow the grain boundaries between the fibrous grains aligned along the ED direction. In order to see the cracks in the transverse cross-section, DCB samples were cut along the transverse direction, as the crack had not passed through the entire specimen during the test period. This crack is demonstrated in Figure 11e, where two selected SE-SEM images are shown in Figure 11f,g. It can be seen that these cracks are not as straight as the ones along the extrusion direction, and more crack branching can be seen clearly in Figure 11f,g.
Figure 12 shows some of the samples were pulled apart and the fracture surface of a T6 and T7 condition. It can be seen that the crack front is slightly deeper in the center of the specimens than at the edges. SE-SEM images of the fracture surfaces are shown in Figure 12c,d, where the fibrous grains are seen to remain along the extrusion direction. The fracture surfaces clearly demonstrate that the cracks are intergranular. Note that the SEM images do not capture the depth of field, which is more clear in the earlier presented Figure 11e.
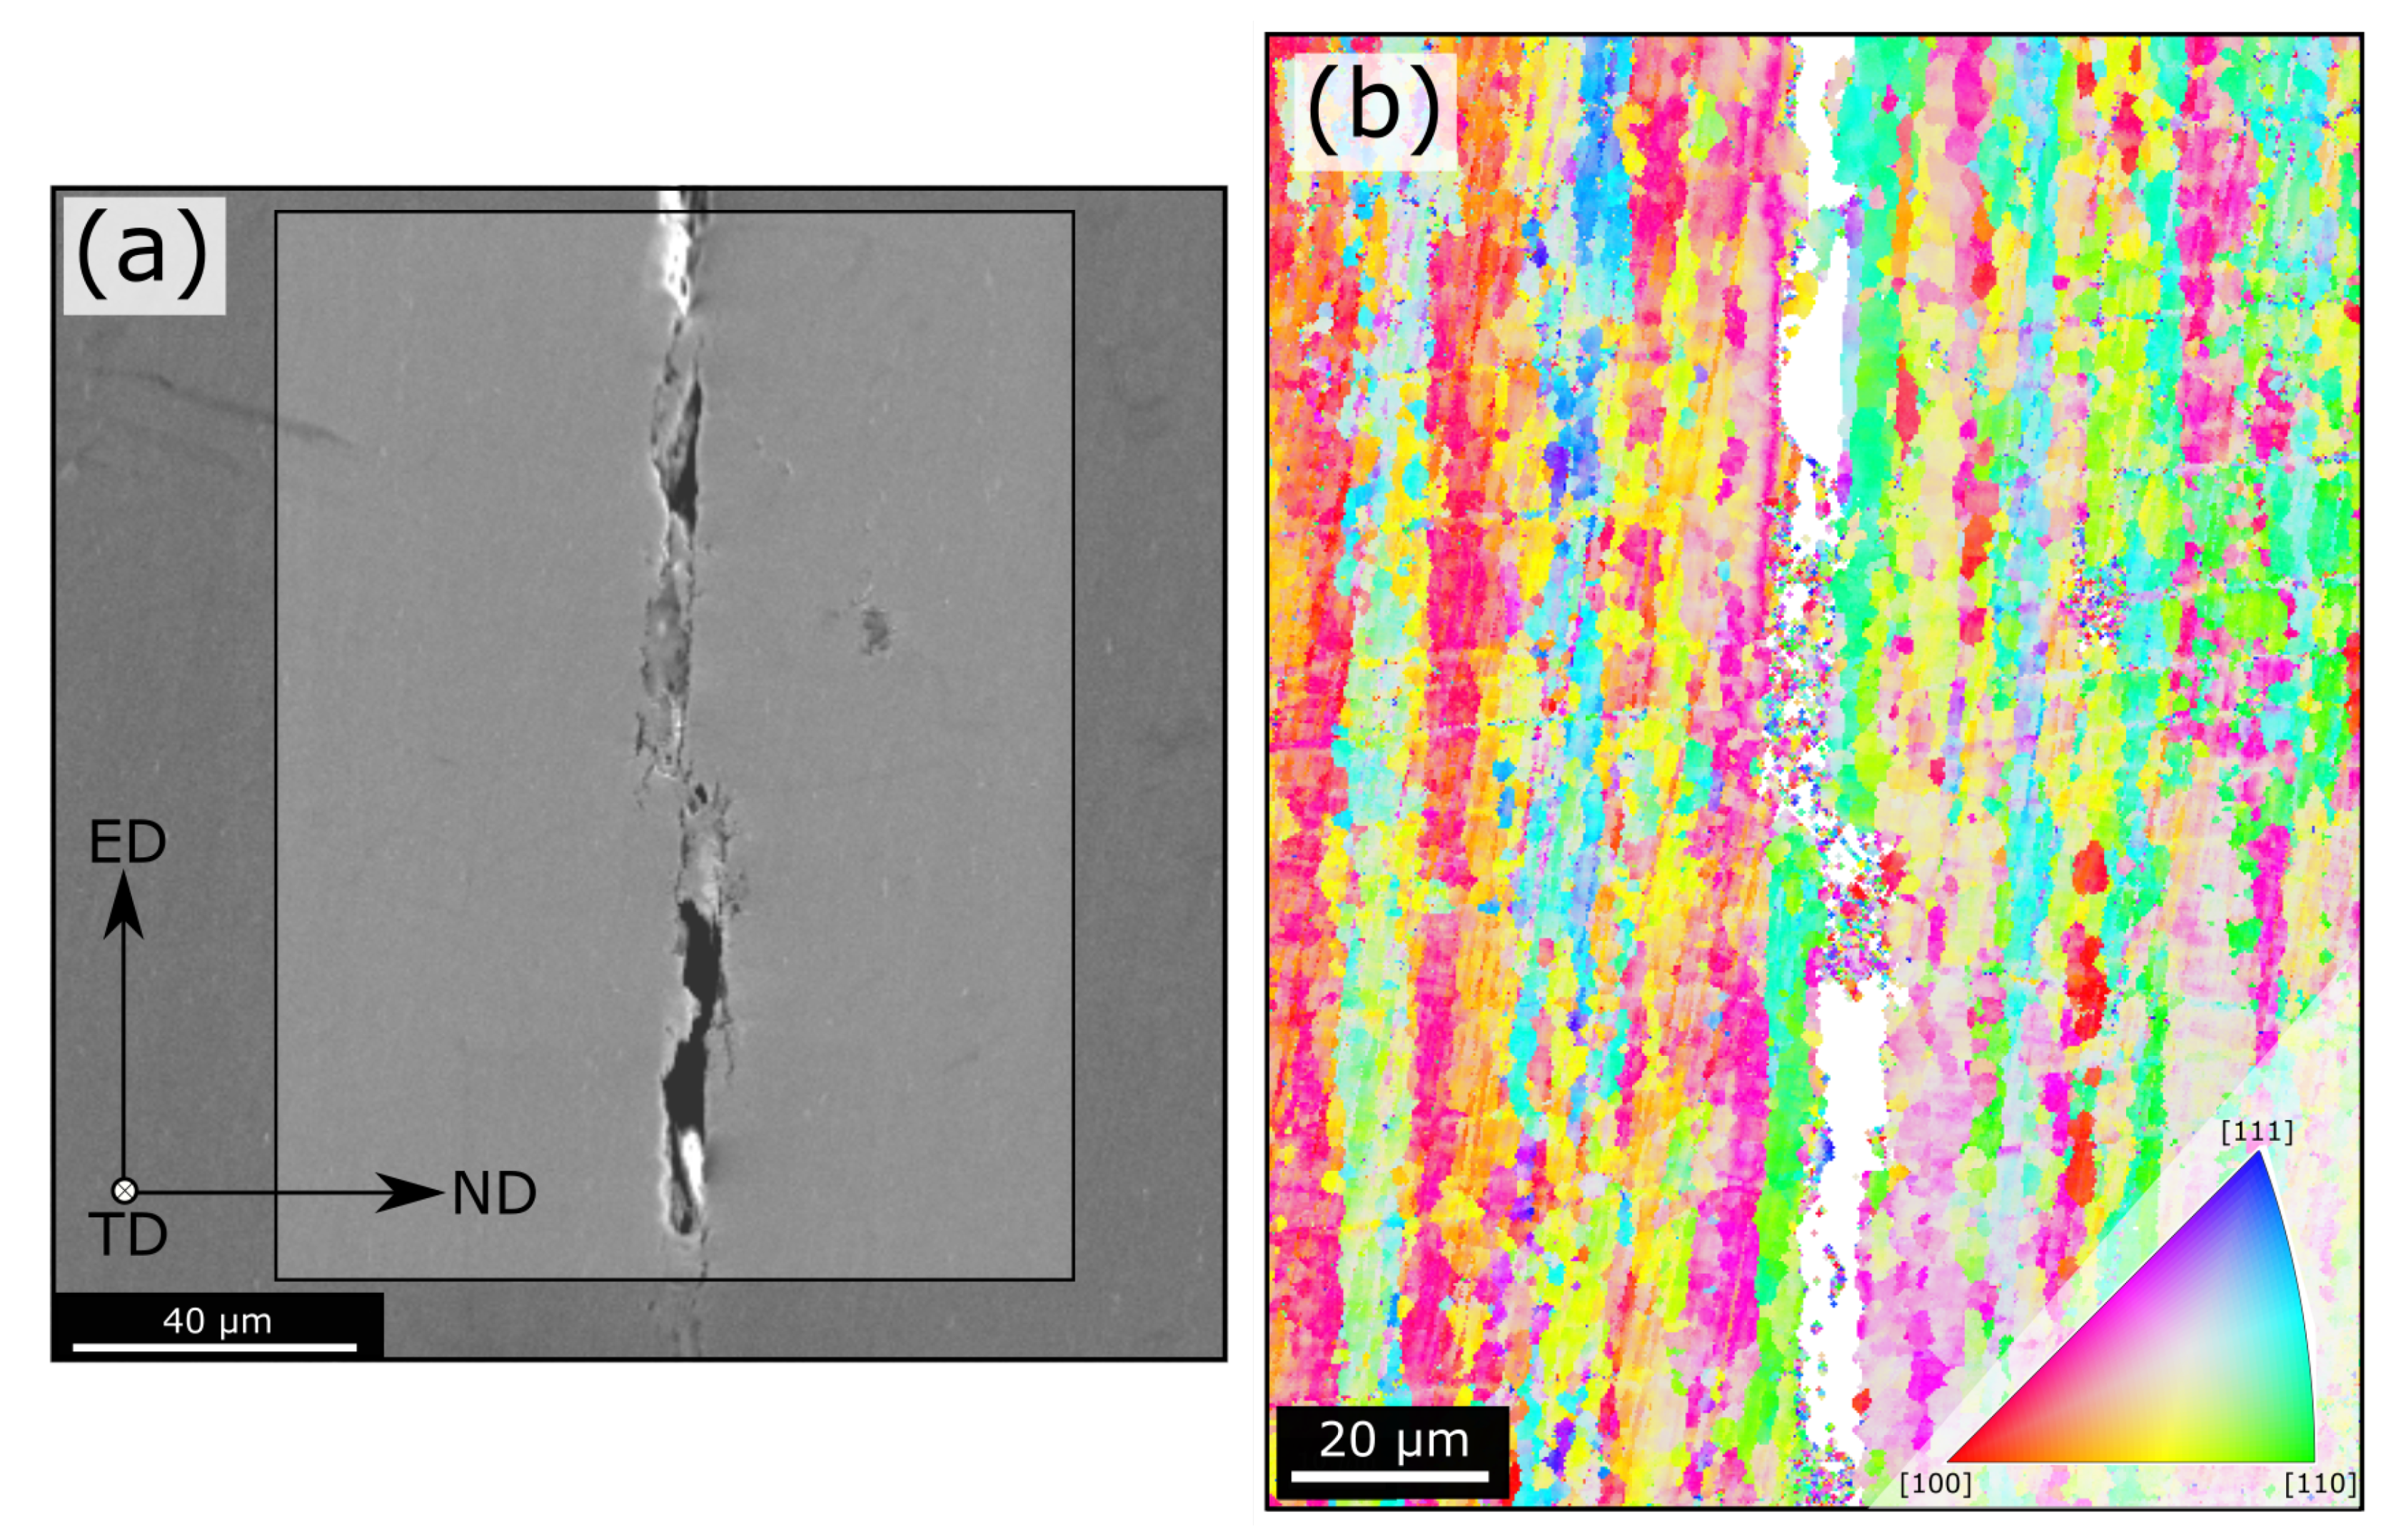
EBSD was conducted on the cracked DCB specimens in order to reveal which grain boundaries are susceptible to SCC, and it is shown in Figure 13. The cracks seem to predominately follow the high-angle grain boundaries that separate the long fibrous grains, as discussed earlier with respect to Figure 4b.
3.6. Slow Strain Rate Tests
The results from SSRT are summarised in Table 4. T7 tempers exhibit lower ultimate tensile strength (UTS) and yield strength (YS) than the T6 tempers, but have higher total elongation and reduction in area (RA) values. The YS and UTS values for all samples are similar when testing in air or solution. No clear trends in the total elongation can be established when testing in solution. However, all T7 tempers demonstrate a higher RRA value (less change) when compared to the T6 tempers in both test solutions. This means that the T7 tempers are more resistant to changes in RA when testing in solution. The two different Si levels do not demonstrate any clear difference in the measured properties. The stress-strain curves are given in Supplementary Figure S3 for the interested reader.
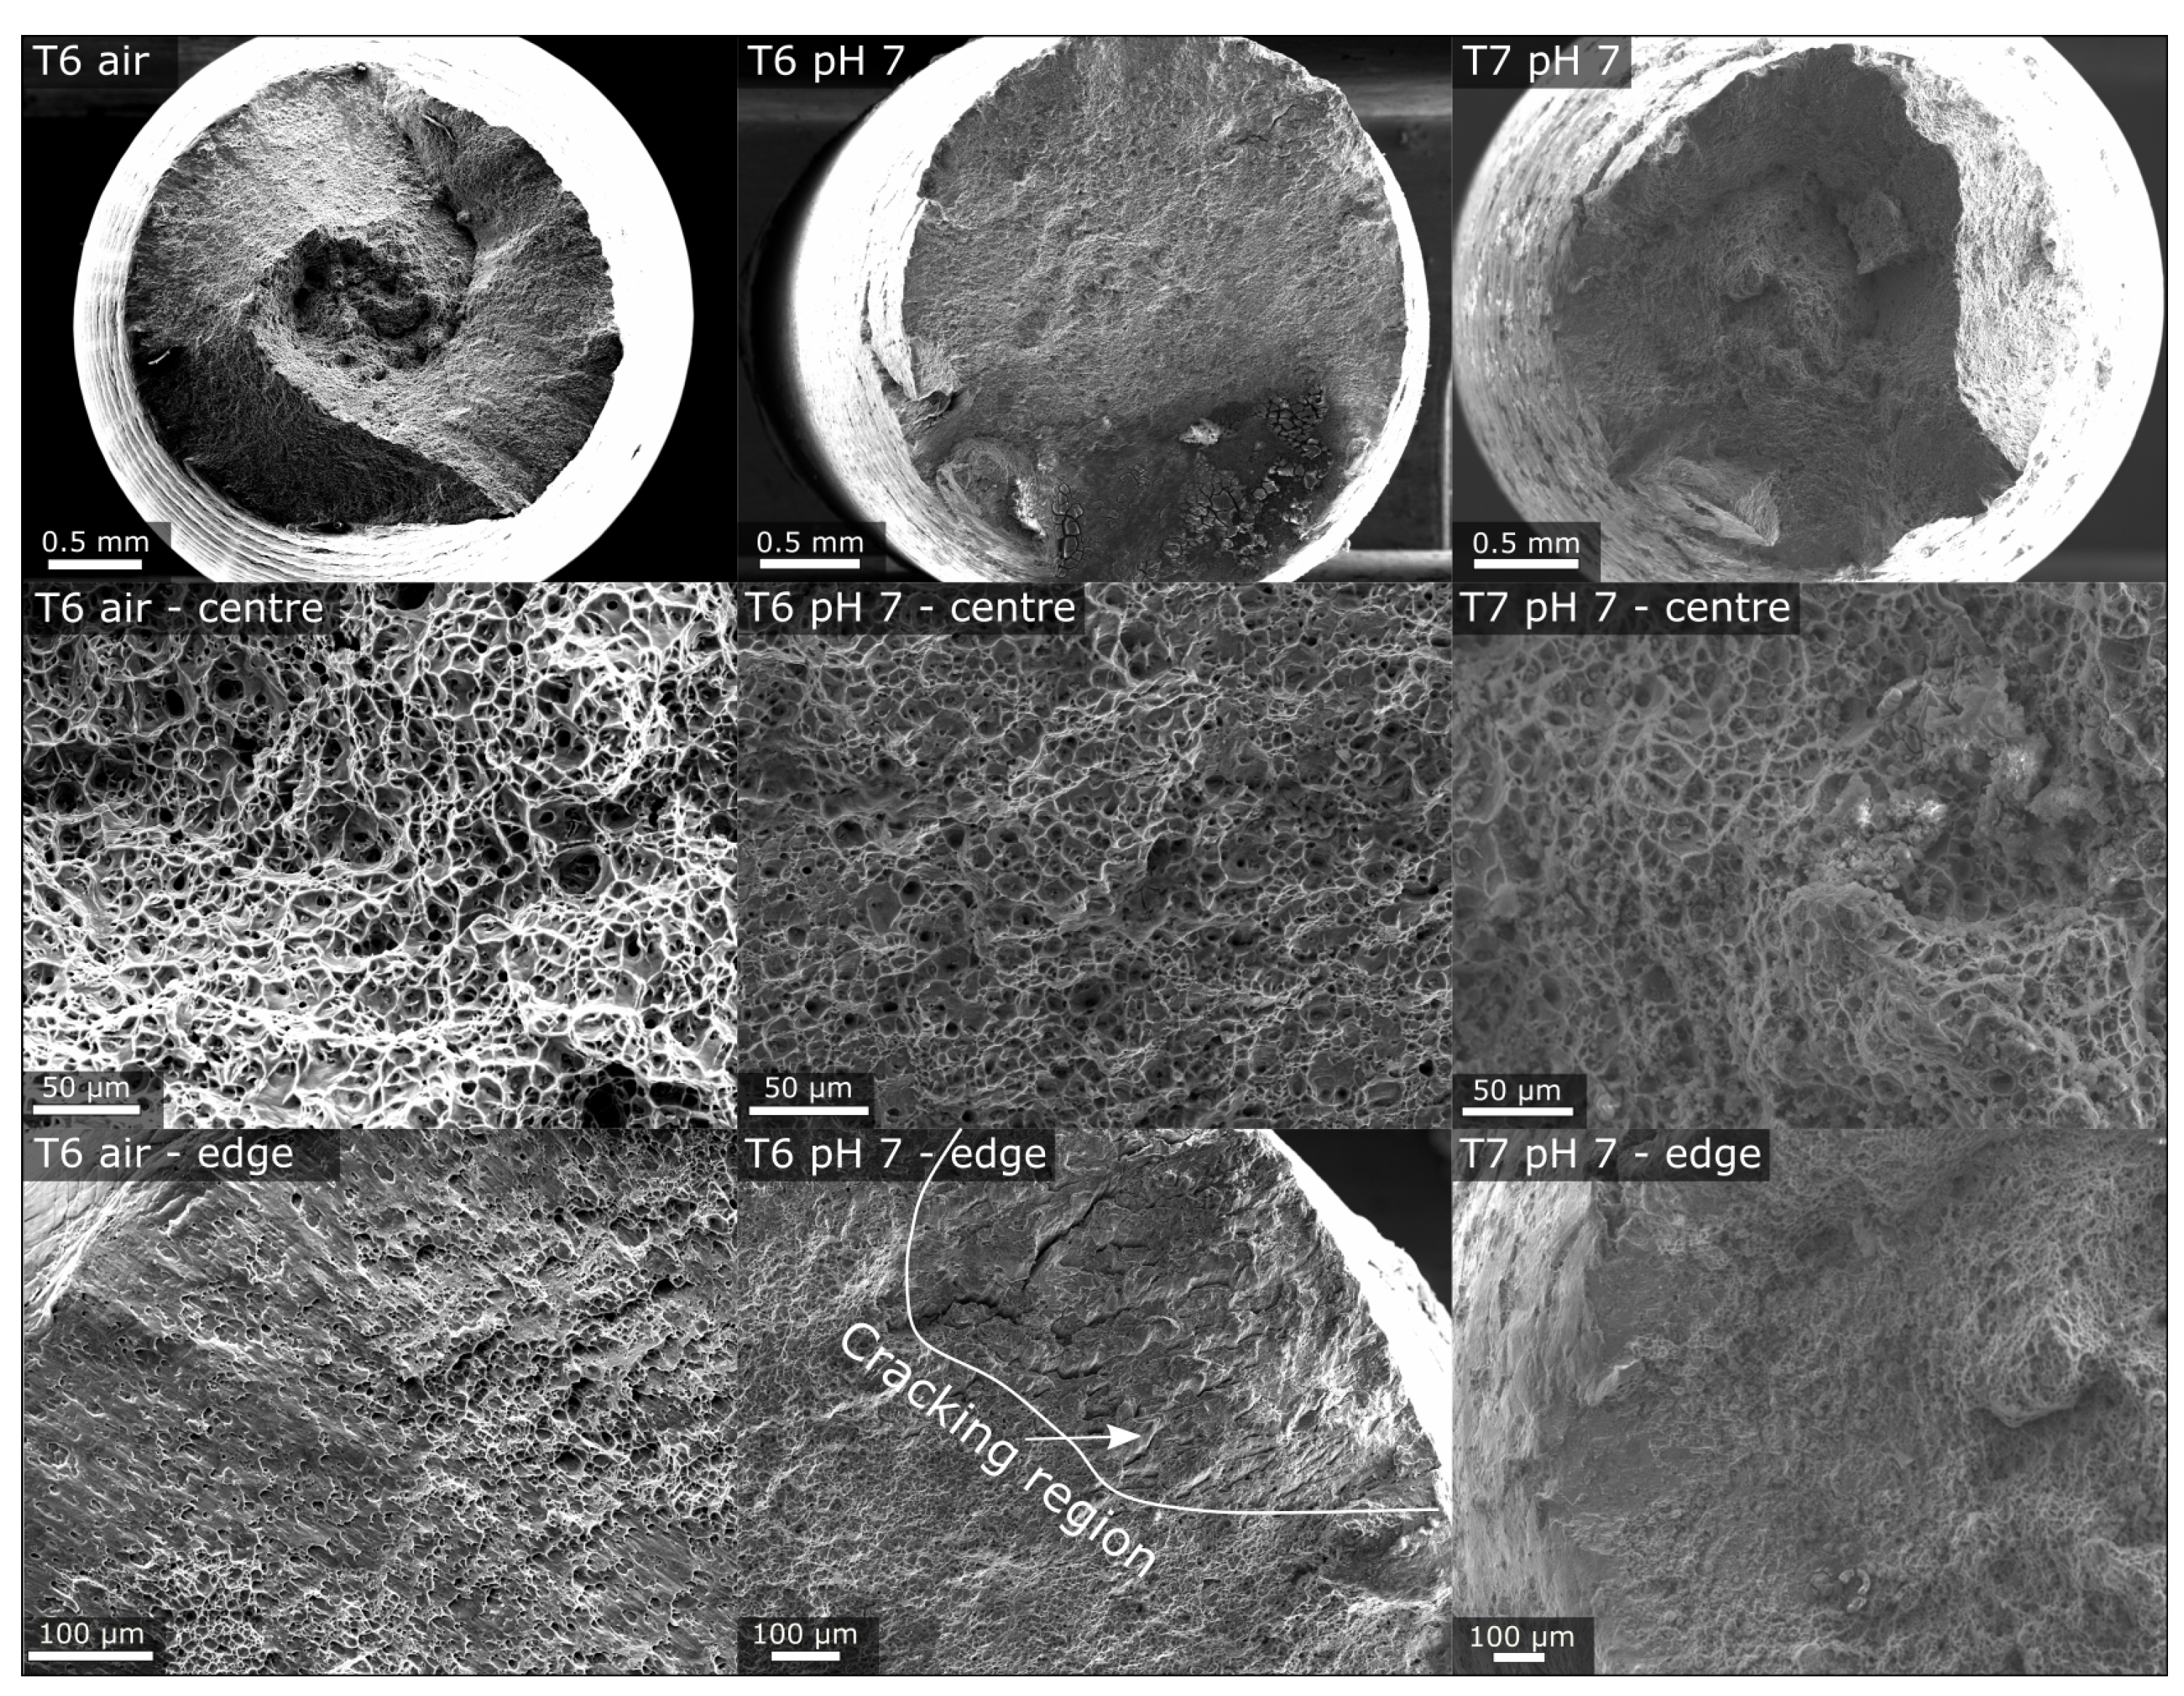
Representative fracture surfaces of the SSRT specimens are shown in Figure 14. The samples fractured in air, regardless of their ageing parameters, all demonstrate a ductile failure in the center of the specimen. A flat fracture region is found closer to the edge. Samples stressed in 3.5 wt.% NaCl at pH 7 similarly have ductile failure in the centre of the specimen with some corrosion products between. However, there is an apparent difference between the T6 and T7 samples, regardless of the pH in the test solution. This is the appearance of cracks, always present close to the edge in the T6 specimens. These may penetrate up to ∼600 m into the specimen from the outer surface. In one case, the crack penetrated through the entire cross-section (Supplementary Figure S4). It is important to emphasise that this cracking behaviour was not observed in the T7 tempers, and also not when the T6 tempers were strained in air. The cracks observed in Figure 14 have a depth along the tensile axis (extrusion direction) of up to 1 mm. This is revealed by embedding the whole specimen in epoxy and polishing the sample in towards the center of the round tensile specimen, and is shown in Supplementary Figure S5 for a T6 condition.
3.7. Polarisation Curves
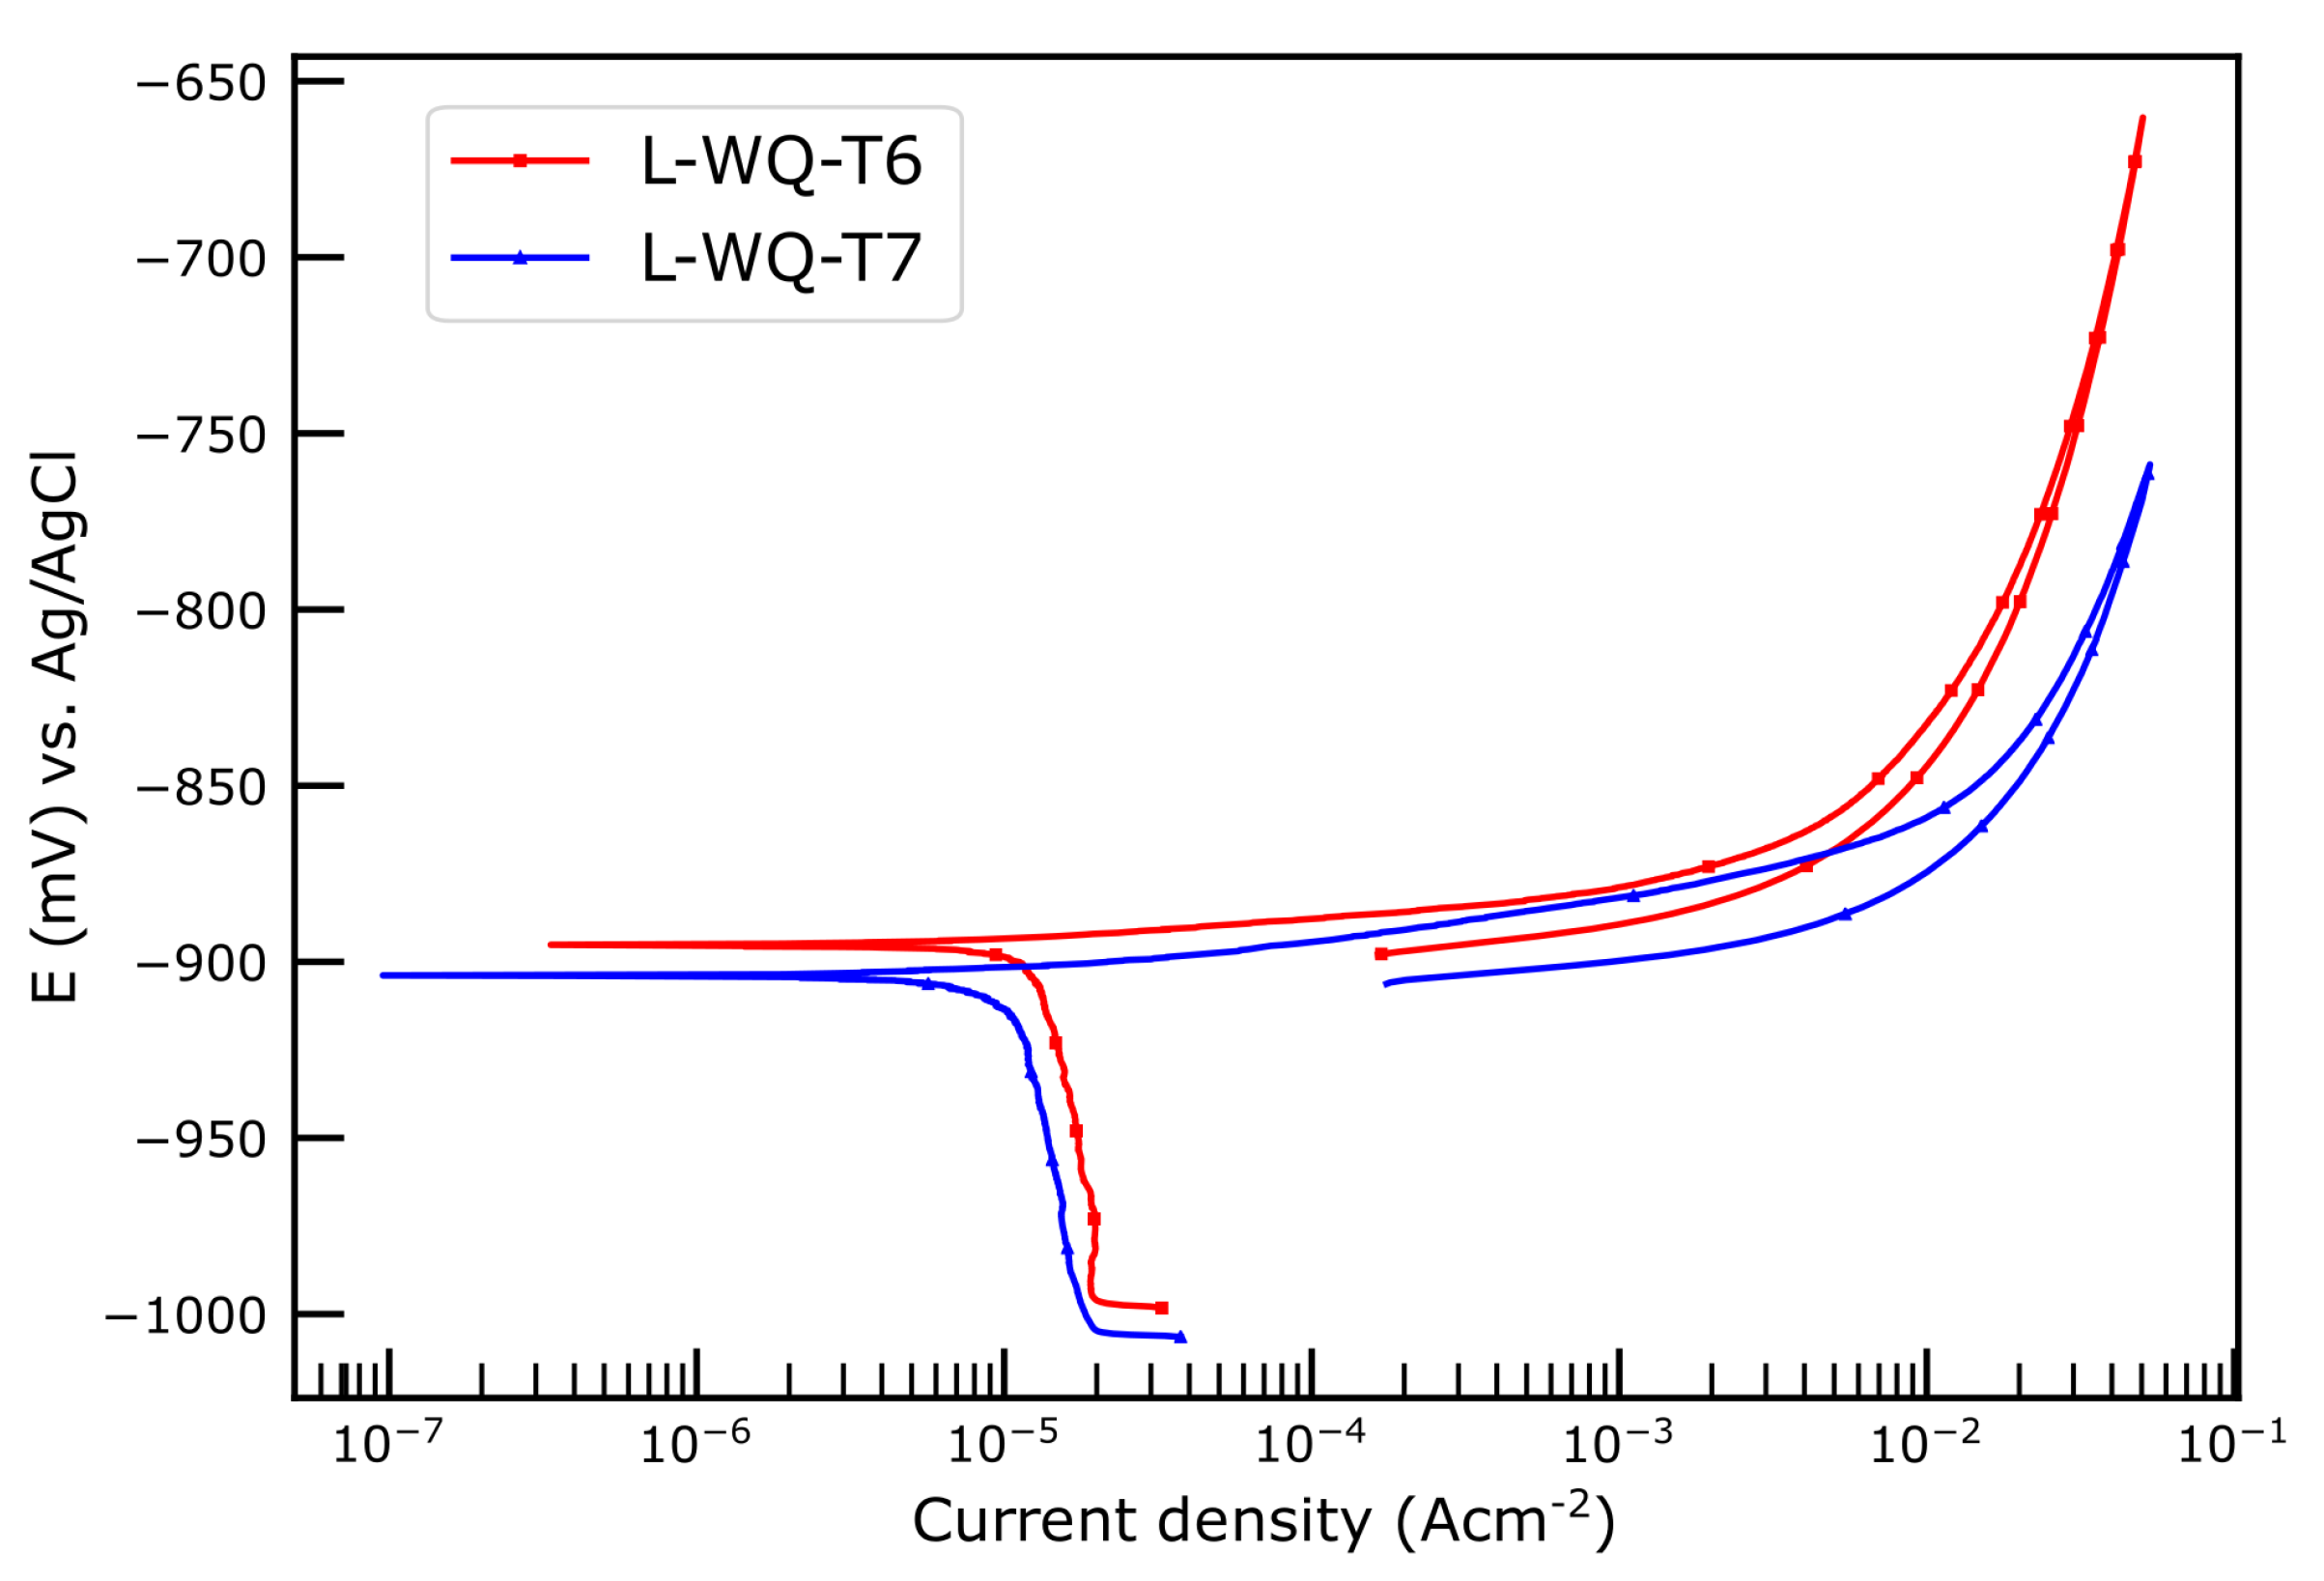
Two of the conditions which demonstrated clear difference in the measured SCC properties were subjected to potentiodynamic polarisation. This result is shown in Figure 15, where it can be seen that the WQ-T6 and the WQ-T7 tempers exhibit similar polarisation behaviour. The corrosion potential is ∼10 mV lower for the T7 temper.
4. Discussion
In the present work, nearly all of the microstructural features believed to have an effect on SCC have been studied. The only clear difference observed, between the different conditions, is variation in the bulk hardening precipitates, which changes in size and orientation with the Al matrix. If this is the primary reason for the increased SCC resistance in the T7 tempers is somewhat uncertain. However, our results are in agreement with other studies that have previously suggested that these precipitates alter the deformation mode (slip characteristics) and influence the strain localisation at the grain boundaries [23,39]. Higher strain localisation is likely to influence the crack propagation, but also the hydrogen diffusion and trapping behaviour. Guyot & Cottignies suggested that the yield stress decrease due to overageing was associated with coarsening of precipitates resulting in a transition from shearing to Orowan by-passing at a critical precipitate radius of 3 nm [40]. This fits well with our observations. In recent years, the hydrogen distribution within Cu-free Al-Zn-Mg alloys has been studied and it has been suggested that the bulk precipitates are important in hydrogen trapping [41,42,43]. Motionless dislocations have also been demonstrated as important hydrogen trapping sites [44]. A relative study of the hydrogen trapping ability of the hardening precipitates with different interface planes is yet to be carried out and may provide further insights into the difference between the T6 and T7 tempers.
When comparing the DCB results for the T6 and T7 tempers, the T7 tempers have consistently slightly lower region II crack velocities (cf. Figure 10). However, little or no changes in the grain boundary chemistry could be established. This was shown by the microstructural characterisation, where only limited differences in concentration of solute elements in the PFZs, widths of PFZs, electrical conductivity, polarisation behaviour, or in the grain boundary particle compositions, could be established. A large difference in the conductivity would indicate notable differences in the solute levels. The T6 conditions have slightly lower conductivity than the T7 conditions. This means that more solute is consumed by precipitates in the T7 conditions. The average Zn/Mg ratio for grain boundary particles in H-AC-T6 was lower than for the other conditions. A lower Zn content in the grain boundary particles should provide a lower potential difference between the MgZn phases and surrounding PFZs. However, this condition did not exhibit greater SCC resistance than any of the T7 tempers. The PFZs solute concentrations presented are likely to be subjected to errors in the absolute value, but their relative difference should provide an indication of differences between the conditions. When comparing the results in Figure 8 to the SCC results, it seems unlikely that PFZs solute content has any significant influence on the SCC properties of the conditions studied here. The flat Si curve across the grain boundary in sample H-WQ-T6 is questionable, but similar curves were observed several times only for this condition.
Type 2 and type 3 grain boundaries show no clear correlation between particle distribution and misorientation angles. It is more likely related to grain boundary termination plane. That is, if one of the adjacent grains terminates with a plane, then it is more likely to precipitate the equilibrium -MgZn phase. This has been reported by others [45,46]. However, as the -MgZn hardening precipitates have several possible interface planes for nucleation in bulk Al [33,47,48], it is not unlikely that other boundary termination planes also play a role for these grain boundary particles. This may cause large variations even along the same grain boundary, as suggested by Butler & Swan [49]. Grain boundary defects, such as ledges, may also act as preferential nucleation sites [46,49]. Zhao et al. demonstrated how a grain boundary may decompose into facets with different segregation and precipitation behaviour [50]. The spacing between grain boundary particles may have influence on the presented SCC results, but the statistics from the methods used in this work could not be applied in drawing any conclusions related to this due to the enormous variations between grain boundaries within the same sample. More statistical methods, such as three-dimensional (3D) focused ion beam (FIB) [51] or X-ray based methods are better suited for this purpose.
In agreement with the work of others, we find that that the cracks predominately follow the high-angle grain boundaries that separate the large fibrous grains. Tang et al. found that the cracks tend to propagate at high-angle grain boundaries with a large difference in the Schmid factor of the neighbouring grains [52]. Day & Dent studied SCC and reported that cracks propagated along high-angle grain boundaries decorated with fewer, larger particles than the low-angle sub-grain boundaries [27]. The grain boundaries that are presented here must act differently with respect to a potential SCC propagation mechanism. The low-angle grain boundaries have a near continuous distribution of anodic MgZn type particles, which may facilitate a dissolution type failure. High-angle grain boundaries are likely to be more susceptible to stress-localisation, as larger differences between neighbouring grains may limit slip across the interface. Strain localisation may again increase hydrogen segregation and, thus, promote local conditions for embrittlement. Therefore, more site specific grain boundary analysis should be applied in future work. A possible method is by using FIB to carve out a region in front of the crack tip in order to understand which types of grain boundaries are susceptible to cracking.
Air-cooling from SHT results in heterogeneous nucleation of -MgSi particles on grain boundaries. She et al. reported an improved SCC with increasing Si content and higher area fraction of -MgSi particles [53]. Singh et al. reported hydrogen bubble formation within the crack tip, which was associated with the anodic dissolution of the -MgSi particles [54]. The differences in Si content for the two alloys studied here did not show any clear difference. Greater variations in the Si content might have shown observable differences in SCC behaviour.
It is likely that stressing the specimens along the TD direction (as opposed to the ED direction done here) would have resulted in clear differences in elongation before failure. However, SSRT is a ‘fast’ test, in comparison to other more static long exposure tests. The corrosion processes in a crack may not have time to occur prior to fracture. Alternative approaches with SSRT could have been to: (1) apply a load to some % of the YS, and immerse the samples at this fixed load for longer periods. (2) Hydrogen pre-charging of the samples prior to tensile testing. Regardless, there are clear difference in the SCC between the T6 and T7 tempers with respect to observations in cracking behaviour and the RRA values. Other testing methods are also possible and must be considered in future works. Some test methods have been reviewed for EN AW-7075 by Magaji et al. [55].
Although not studied here, the residual stresses may have effect on the measured results. Robinson et al. demonstrated large residual stresses associated with water-quenching an AA7075 alloy, which could be reduced by 25–40% after overageing [56]. However, in this work, its influence should be limited as there were little differences in SCC properties between the water-quenched and air-cooled samples.
5. Conclusions
In the present work, the stress corrosion cracking properties of an extruded Al-Zn-Mg alloy with two different Si contents have been studied in two ageing parameters following two different quenching conditions from solution heat treatment. The main findings are:
- Overageing (T7) increases the K value and decreases the region II crack velocity. This is likely related to differences in bulk precipitates, which may change the slip characteristics from shearing in T6 to looping in T7, and ultimately affect the degree of strain localisation at the grain boundaries.
- Low-angle sub-grain boundaries have a near continuous distribution of small grain boundary particles, while other grain boundaries vary greatly in particle density and may have none, few, or many particles present.
- The cracks follow predominantly the high-angle grain boundaries between the fibrous grains.
- Cracking behaviour observed in SSRT, only occurred in the T6 tempers.
- The small variations in Si content between the alloys herein have no clear influence on the measured SCC properties.
These findings are expected to be relevant in future studies concerning stress corrosion cracking and microstructure in similar extruded Cu-free Al-Zn-Mg alloys.
Supplementary Materials
The Supplementary Materials are available at https://www.mdpi.com/2075-4701/10/9/1194/s1. Figure S1. Results from 150 EDS point analysis of grain boundary particles in different tempers acquired using microscope (i) (see main text for details). The Al at.% is shown as function of the Zn/Mg ratio. Figure S2. Results from the double cantilever beam tests represented in a conventional crack velocity against stress intensity (K-V) figure. Figure S3. Stress-strain curves for the 4 tempers with two different Si contents, tested in air and 3.5 wt% NaCl solution with different pH. Figure S4. The fracture surface of sample H-AC-T6 (tested in 3.5 wt.% NaCl at pH = 3) imaged using secondary electron (SE)-scanning electron microscopy (SEM), demonstrating a visible crack penetrating through the entire cross-section. Figure S5. A slow strain rate testing (SSRT) sample embedded in epoxy and polished to reveal the depth extent of the secondary cracks (as in figure A4). Figures (a) and (b) are optical microscopy images and (c)-(e) are backscattered electron (BSE)-SEM images.
Author Contributions
Conceptualization, A.L. and L.L.; Methodology, A.L.; Formal analysis, A.L.; Investigation, A.L.; Resources, L.L. and R.J.; Data curation, A.L.; Writing—original draft preparation, A.L.; Writing—review and editing, A.L., J.C.W., L.L., C.D.M., R.J., O.L. and R.H.; Visualization, A.L.; Supervision, J.C.W., R.H., O.L., R.J. and C.D.M. All authors have read and agreed to the published version of the manuscript.
Funding
This work was supported by the KPN project “FICAL” (NFR: 247598), co-financed by The Research Council of Norway (NFR), and the industrial partners Hydro, Gränges, Benteler Automotive Raufoss AS and Steertec Raufoss. The (S)TEM work was conducted on the NORTEM (NFR: 197405) infrastructure at the TEM Gemini Centre, Trondheim, Norway.
Acknowledgments
Benteler Automotive Raufoss AS is greatly acknowledged for providing the material. Ellen S. Skilbred is greatly acknowledged for assisting with the SSRT experiments.
Conflicts of Interest
The authors declare no conflict of interest.
References
- Dursun, T.; Soutis, C. Recent developments in advanced aircraft aluminium alloys. Mater. Des. 2014, 56, 862–871. [Google Scholar] [CrossRef]
- Jensrud, O. High Strength Aluminium Alloys Extrusions—A Review of the Thermo-Mechanical-Process in High Performance Profile Manufacturing. Progress in Extrusion Technology and Simulation of Light Metal Alloys. Key Eng. Mater. 2012, 491, 11–18. [Google Scholar] [CrossRef]
- Speidel, M.O. Stress corrosion cracking of aluminum alloys. Metall. Trans. A 1975, 6, 631–651. [Google Scholar] [CrossRef]
- Rao, A.C.U.; Vasu, V.; Govindaraju, M.; Srinadh, K.V.S. Stress corrosion cracking behaviour of 7xxx aluminum alloys: A literature review. Trans. Nonferrous Met. Soc. China 2016, 26, 1447–1471. [Google Scholar] [CrossRef]
- Holroyd, N.J.H.; Scamans, G.M. Stress corrosion cracking in Al-Zn-Mg-Cu aluminum alloys in saline environments. Metall. Mater. Trans. A 2013, 44, 1230–1253. [Google Scholar] [CrossRef] [Green Version]
- Holroyd, N.J.H.; Scamans, G.M. Crack propagation during sustained-load cracking of Al-Zn-Mg-Cu aluminum alloys exposed to moist air or distilled water. Metall. Mater. Trans. A 2011, 42, 3979–3998. [Google Scholar] [CrossRef]
- Braun, R. Environmentally assisted cracking of aluminium alloys. Materialwissenschaft und Werkstofftechnik 2007, 38, 674–689. [Google Scholar] [CrossRef]
- Burleigh, T.D. The Postulated Mechanisms for Stress Corrosion Cracking of Aluminum Alloys: A Review of the Literature 1980–1989. Corrosion 1991, 47, 89–98. [Google Scholar] [CrossRef]
- Lynch, S. Hydrogen embrittlement phenomena and mechanisms. Corros. Rev. 2012, 30, 105–123. [Google Scholar] [CrossRef]
- Najjar, D.; Magnin, T.; Warner, T. Influence of critical surface defects and localized competition between anodic dissolution and hydrogen effects during stress corrosion cracking of a 7050 aluminium alloy. Mater. Sci. Eng. A 1997, 238, 293–302. [Google Scholar] [CrossRef]
- Bland, L.G.; Locke, J.S. Chemical and electrochemical conditions within stress corrosion and corrosion fatigue cracks. npj Mater. Degrad. 2017, 1, 12. [Google Scholar] [CrossRef] [Green Version]
- Cornish, A.J.; Day, M.K.B. The effect of variable quenching conditions on the relationship between the stress-corrosion resistance, tensile properties, and microstructure of high-purity Al-Zn-Mg alloy. J. Inst. Met. 1971, 99, 377–384. [Google Scholar]
- Poulose, P.K.; Morral, J.E.; McEvily, A.J. Stress corrosion crack velocity and grain boundary precipitates in an Al-Zn-Mg alloy. Metall. Trans. 1974, 5, 1393–1400. [Google Scholar] [CrossRef]
- Christodoulou, L.; Flower, H.M. Hydrogen embrittlement and trapping in Al6%Zn-3%Mg. Acta Metall. 1980, 28, 481–487. [Google Scholar] [CrossRef]
- Sarkar, B.; Marek, M.; Starke, E.A. The effect of copper content and heat treatment on the stress corrosion characteristics of Ai-6Zn-2Mg-X Cu alloys. Metall. Trans. A 1981, 12, 1939–1943. [Google Scholar] [CrossRef]
- Puiggali, M.; Zielinski, A.; Olive, J.M.; Renauld, E.; Desjardins, D.; Cid, M. Effect of microstructure on stress corrosion cracking of an Al-Zn-Mg-Cu alloy. Corros. Sci. 1998, 40, 805–819. [Google Scholar] [CrossRef]
- Sun, X.; Zhang, B.; Lin, H.; Zhou, Y.; Sun, L.; Wang, J.; Han, E.H.; Ke, W. Correlations between stress corrosion cracking susceptibility and grain boundary microstructures for an Al–Zn–Mg alloy. Corros. Sci. 2013, 77, 103–112. [Google Scholar] [CrossRef]
- Viswanadham, R.K.; Sun, T.S.; Green, J.A. Grain boundary segregation in Al-Zn-Mg alloys-Implications to stress corrosion cracking. Metall. Mater. Trans. A 1980, 11, 85–89. [Google Scholar] [CrossRef]
- Scamans, G.M.; Holroyd, N.J.H.; Tuck, C.D.S. The role of magnesium segregation in the intergranular stress corrosion cracking of aluminium alloys. Corros. Sci. 1987, 27, 329–347. [Google Scholar] [CrossRef]
- Song, R.G.; Tseng, M.K.; Zhang, B.J.; Liu, J.; Jin, Z.H.; Shin, K.S. Grain boundary segregation and hydrogen-induced fracture in 7050 aluminium alloy. Acta Mater. 1996, 44, 3241–3248. [Google Scholar] [CrossRef]
- Song, R.G.; Dietzel, W.; Zhang, B.J.; Liu, W.J.; Tseng, M.K.; Atrens, A. Stress corrosion cracking and hydrogen embrittlement of an Al–Zn–Mg–Cu alloy. Acta Mater. 2004, 52, 4727–4743. [Google Scholar] [CrossRef]
- Vasudevan, A.K.; Sadananda, K. Role of slip mode on stress corrosion cracking behavior. Metall. Mater. Trans. A 2011, 42, 405–414. [Google Scholar] [CrossRef]
- Wu, L.M.; Wang, W.H.; Hsu, Y.F.; Trong, S. Effects of Microstructure on the Mechanical Properties and Stress Corrosion Cracking of an Al-Zn-Mg-Sc-Zr Alloy by Various Temper Treatments. Mater. Trans. 2007, 48, 600–609. [Google Scholar] [CrossRef] [Green Version]
- Baumgartner, M.; Kaesche, H. Intercrystalline Corrosion and Stress Corrosion Cracking of AlZnMg Alloys. Corrosion 1988, 44, 231–239. [Google Scholar] [CrossRef]
- Hardwick, D.A.; Thompson, A.W.; Bernstein, I.M. The effect of copper content and microstructure on the hydrogen embrittlement of Al-6Zn-2Mg alloys. Metall. Trans. A 1983, 14, 2517–2526. [Google Scholar] [CrossRef]
- Albrecht, J.; Thompson, A.W.; Bernstein, I.M. The role of microstructure in hydrogen-assisted fracture of 7075 aluminum. Metall. Trans. A 1979, 10, 1759–1766. [Google Scholar] [CrossRef]
- Day, M.K.B.; Cornish, A.J.; Dent, T. The relationship between structure and stress-corrosion life in Al-Zn-Mg alloy. Met. Sci. J. 1969, 3, 175–182. [Google Scholar] [CrossRef]
- Knight, S.P.; Birbilis, N.; Muddle, B.C.; Trueman, A.R.; Lynch, S.P. Correlations between intergranular stress corrosion cracking, grain-boundary microchemistry, and grain-boundary electrochemistry for Al-Zn-Mg-Cu alloys. Corros. Sci. 2010, 52, 4073–4080. [Google Scholar] [CrossRef]
- Goswami, R.; Lynch, S.; Holroyd, N.J.H.; Knight, S.P.; Holtz, R.L. Evolution of grain boundary precipitates in Al 7075 upon aging and correlation with stress corrosion cracking behavior. Metall. Mater. Trans. A 2013, 44, 1268–1278. [Google Scholar] [CrossRef]
- Gupta, R.K.; Deschamps, A.; Cavanaugh, M.K.; Lynch, S.P.; Birbilis, N. Relating the Early Evolution of Microstructure with the Electrochemical Response and Mechanical Performance of a Cu-Rich and Cu-Lean 7xxx Aluminum Alloy. J. Electrochem. Soc. 2012, 159, C492–C502. [Google Scholar] [CrossRef]
- Chen, J.; Zhang, X.; Zou, L.; Yu, Y.; Li, Q. Effect of precipitate state on the stress corrosion behavior of 7050 aluminum alloy. Mater. Charact. 2016, 114, 1–8. [Google Scholar] [CrossRef]
- Birbilis, N.; Buchheit, R.G. Electrochemical Characteristics of Intermetallic Phases in Aluminum Alloys An Experimental Survey and Discussion. J. Electrochem. Soc. 2005, 152, B140–B151. [Google Scholar] [CrossRef] [Green Version]
- Lervik, A.; Marioara, C.D.; Kadanik, M.; Walmsley, J.C.; Milkereit, B.; Holmestad, R. Precipitation in an extruded AA7003 aluminium alloy: Observations of 6xxx-type hardening phases. Mater. Des. 2019, 186, 108204. [Google Scholar] [CrossRef]
- Hyatt, M.V. Use of Precracked Specimens in Stress Corrosion Testing of High Strength Aluminum Alloys. Corrosion 1970, 26, 487–503. [Google Scholar] [CrossRef]
- Bachmann, F.; Hielscher, R.; Schaeben, H. Texture Analysis with MTEX—Free and Open Source Software Toolbox. In Solid State Phenomena; Texture and Anisotropy of Polycrystals III; Trans Tech Publications Ltd.: Stafa-Zurich, Switzerland, 2010; Volume 160, pp. 63–68. [Google Scholar] [CrossRef] [Green Version]
- de la Peña, F.; Prestat, E.; Fauske, V.T.; Burdet, P.; Jokubauskas, P.; Nord, M.; Ostasevicius, T.; MacArthur, K.E.; Sarahan, M.; Johnstone, D.N.; et al. hyperspy/hyperspy: HyperSpy v1. 5.2. zndo 2019. [Google Scholar] [CrossRef]
- Dumont, M.; Lefebvre, W.; Doisneau-Cottignies, B.; Deschamps, A. Characterisation of the composition and volume fraction of η′ and η precipitates in an Al–Zn–Mg alloy by a combination of atom probe, small-angle X-ray scattering and transmission electron microscopy. Acta Mater. 2005, 53, 2881–2892. [Google Scholar] [CrossRef]
- Zhao, H.; Gault, B.; Ponge, D.; Raabe, D.; De Geuser, F. Parameter free quantitative analysis of atom probe data by correlation functions: Application to the precipitation in Al-Zn-Mg-Cu. Scr. Mater. 2018, 154, 106–110. [Google Scholar] [CrossRef] [Green Version]
- Wu, H.; Fan, G. An overview of tailoring strain delocalization for strength-ductility synergy. Prog. Mater. Sci. 2020, 113, 100675. [Google Scholar] [CrossRef]
- Guyot, P.; Cottignies, L. Precipitation kinetics, mechanical strength and electrical conductivity of AlZnMgCu alloys. Acta Mater. 1996, 44, 4161–4167. [Google Scholar] [CrossRef]
- Oger, L.; Lafouresse, M.C.; Odemer, G.; Peguet, L.; Blanc, C. Hydrogen diffusion and trapping in a low copper 7xxx aluminium alloy investigated by Scanning Kelvin Probe Force Microscopy. Mater. Sci. Eng. A 2017, 706, 126–135. [Google Scholar] [CrossRef] [Green Version]
- Tsuru, T.; Yamaguchi, M.; Ebihara, K.; Itakura, M.; Shiihara, Y.; Matsuda, K.; Toda, H. First-principles study of hydrogen segregation at the MgZn2 precipitate in Al-Mg-Zn alloys. Comput. Mater. Sci. 2018, 148, 301–306. [Google Scholar] [CrossRef]
- Tsuru, T.; Shimizu, K.; Yamaguchi, M.; Itakura, M.; Ebihara, K.; Bendo, A.; Matsuda, K.; Toda, H. Hydrogen-accelerated spontaneous microcracking in high-strength aluminium alloys. Sci. Rep. 2020, 10, 1–8. [Google Scholar] [CrossRef] [Green Version]
- Oger, L.; Malard, B.; Odemer, G.; Peguet, L.; Blanc, C. Influence of dislocations on hydrogen diffusion and trapping in an Al-Zn-Mg aluminium alloy. Mater. Des. 2019, 180, 107901. [Google Scholar] [CrossRef]
- Unwin, P.N.; Nicholson, R.B. The nucleation and initial stages of growth of grain boundary precipitates in Al-Zn-Mg and Al-Mg alloys. Acta Metall. 1969, 17, 1379–1393. [Google Scholar] [CrossRef]
- Gronsky, R.; Furrer, P. Grain Boundary Precipitation in Aluminum Alloys: Effect of Boundary Structure. Metall. Trans. A 1981, 12, 121–127. [Google Scholar] [CrossRef] [Green Version]
- Chung, T.F.; Yang, Y.L.; Shiojiri, M.; Hsiao, C.N.; Li, W.C.; Tsao, C.S.; Shi, Z.; Lin, J.; Yang, J.R. An atomic scale structural investigation of nanometre-sized η precipitates in the 7050 aluminium alloy. Acta Mater. 2019, 174, 351–368. [Google Scholar] [CrossRef]
- Bendo, A.; Matsuda, K.; Lervik, A.; Tsuru, T.; Nishimura, K.; Nunomura, N.; Holmestad, R.; Marioara, C.D.; Shimizu, K.; Toda, H.; et al. An unreported precipitate orientation relationship in Al-Zn-Mg based alloys. Mater. Charact. 2019, 158, 109958. [Google Scholar] [CrossRef]
- Butler, E.P.; Swann, P.R. In situ observations of the nucleation and initial growth of grain boundary precipitates in an Al-Zn-Mg alloy. Acta Metall. 1976, 24, 343–352. [Google Scholar] [CrossRef]
- Zhao, H.; Huber, L.; Lu, W.; Peter, N.J.; An, D.; De Geuser, F.; Dehm, G.; Ponge, D.; Neugebauer, J.; Gault, B.; et al. Interplay of Chemistry and Faceting at Grain Boundaries in a Model Al Alloy. Phys. Rev. Lett. 2020, 124, 106102. [Google Scholar] [CrossRef] [PubMed] [Green Version]
- Singh, S.S.; Loza, J.J.; Merkle, A.P.; Chawla, N. Three dimensional microstructural characterization of nanoscale precipitates in AA7075-T651 by focused ion beam (FIB) tomography. Mater. Charact. 2016, 118, 102–111. [Google Scholar] [CrossRef] [Green Version]
- Tang, J.; Zhang, Y.; Ye, L.; Qu, M.; Wu, J.; Zhang, Z.; Liu, S.; Deng, Y. Effect of Grain Boundary and Crystallographic Orientation on the Stress Corrosion Behavior of an Al-Zn-Mg Alloy. J. Mater. Eng. Perform. 2019, 28, 2954–2966. [Google Scholar] [CrossRef]
- She, H.; Chu, W.; Shu, D.; Wang, J.; Sun, B.d. Effects of silicon content on microstructure and stress corrosion cracking resistance of 7050 aluminum alloy. Trans. Nonferrous Met. Soc. China 2014, 24, 2307–2313. [Google Scholar] [CrossRef]
- Singh, S.S.; Stannard, T.J.; Xiao, X.; Chawla, N. In Situ X-ray Microtomography of Stress Corrosion Cracking and Corrosion Fatigue in Aluminum Alloys. Jom 2017, 69, 1404–1414. [Google Scholar] [CrossRef]
- Magaji, N.; Mayrhofer, R.; Kröger, B.; Schnatterer, C.; Zander, D. Comparison of test methods used to analyze stress corrosion cracking of differently tempered 7xxx alloys. Mater. Corros. 2019, 70, 1192–1204. [Google Scholar] [CrossRef]
- Robinson, J.S.; Pirling, T.; Truman, C.E.; Panzner, T. Residual stress relief in the aluminium alloy 7075. Mater. Sci. Technol. 2017, 33, 1765–1775. [Google Scholar] [CrossRef]
Figure 1.
Schematic drawing of the DCB specimens used in this work.

Figure 2.
Schematic drawing of the round tensile specimens used for slow strain rate testing.

Figure 3.
Representative BSE-SEM images from sample H-AC-T6, acquired both parallel (a,b) and normal (c,d) to the extrusion direction. Large Al-Fe-Si containing primary particles can be seen in (a,c), and tiny -MgZn particles are visible on the grain boundaries in (b,d). The black regions on the grain boundaries in (b,d), are -MgSi particles, which are only present in air-cooled samples.

Figure 4.
Representative EBSD images acquired along two different directions in (a,b). The inset shows the grain boundary misorientation angle vs. frequency. The grains are coloured according to the colour scheme in (c). Grain boundary misorientations are colour coded according to the scale in (b).
Figure 4.
Representative EBSD images acquired along two different directions in (a,b). The inset shows the grain boundary misorientation angle vs. frequency. The grains are coloured according to the colour scheme in (c). Grain boundary misorientations are colour coded according to the scale in (b).

Figure 5.
HAADF-STEM image showing the typical microstructure found in TEM. Three distinct types of grain boundaries are observed. (1) Low-angle (< 2°) sub-grain boundaries with high number densities of particles. (2) Grain boundaries with fewer, but larger particles, and (3) grain boundaries with no or very few particles. The image is acquired parallel to the extrusion direction for sample H-AC-T7. Similar observations were made in all conditions.

Figure 6.
BF-STEM images of a cell structure consisting of sub-grain boundaries (type 1) with high density of grain boundary particles in (a–c). (d,e) shows two type 2 grain boundaries with particles of different size, shape and distance between. (f) is a HAADF-STEM image of a type 3 grain boundary, where no particles are present and the PFZs are clearly visible. (c) is acquired in sample H-AC-T6, while the rest is from H-WQ-T6, all obtained parallel to the extrusion direction. The particles are the MgZn phase.

Figure 7.
A HAADF-STEM image and corresponding EDS maps from a grain boundary in the sample H-AC-T6. Both MgZn and -MgSi particles are present if the material has been air-cooled from SHT. AlZr dispersoids are also found in connection with this grain boundary.
Figure 7.
A HAADF-STEM image and corresponding EDS maps from a grain boundary in the sample H-AC-T6. Both MgZn and -MgSi particles are present if the material has been air-cooled from SHT. AlZr dispersoids are also found in connection with this grain boundary.

Figure 8.
Elemental composition profiles across a type 3 grain boundary in three selected conditions. The width of the PFZs is indicated by the white area, and the ‘0’ position marks the location of the grain boundary core. The relative solute levels are similar, but the H-WQ-T6 condition exhibits a Zn/Mg ratio closer to one in addition to an enhanced Si level.

Figure 9.
HAADF-STEM images of the different precipitates present in the conditions studied. (a) shows the precipitate acquired in H-WQ-T6 along [11]. (b,c) are the and precipitates, respectively, projected along [110] in sample H-WQ-T7. and are present in T6. and are present in T7.
Figure 9.
HAADF-STEM images of the different precipitates present in the conditions studied. (a) shows the precipitate acquired in H-WQ-T6 along [11]. (b,c) are the and precipitates, respectively, projected along [110] in sample H-WQ-T7. and are present in T6. and are present in T7.

Figure 10.
Results from the DCB tests. Average region II crack velocity and K values from three parallels with corresponding standard deviation. The K value of the L-T7-AC temper is uncertain as it did not demonstrate a clear drop in crack velocity at low K values, which all other conditions did. There is a clear trend that the K values are higher for the T7 tempers.

Figure 11.
A schematic figure of a cracked DCB specimen in (a), where the base has been cut along the transverse direction to reveal the crack. SE-SEM images of the crack along the extrusion direction and the transverse directions are shown in figures (b,e), respectively. (c,d) are higher magnification SE-SEM images of the crack tip along the extrusion direction. (f,g) are two higher magnification images of cracks in the transverse direction.

Figure 12.
DCB specimens pulled apart using a tensile overload for conditions H-WQ-T6 and H-WQ-T7 in (a,b), respectively. (c,d) are SE-SEM images aquired at different magnification of the fracture surface within the SCC front area in (a).
Figure 12.
DCB specimens pulled apart using a tensile overload for conditions H-WQ-T6 and H-WQ-T7 in (a,b), respectively. (c,d) are SE-SEM images aquired at different magnification of the fracture surface within the SCC front area in (a).

Figure 13.
(a) SE-SEM image of a DCB crack in sample H-WQ-T6. (b) Corresponding EBSD map from the highlighted area in (a). Cracking predominantly follows the high-angle grain boundaries separating the long fibrous grains aligned along the extrusion direction (ED).
Figure 13.
(a) SE-SEM image of a DCB crack in sample H-WQ-T6. (b) Corresponding EBSD map from the highlighted area in (a). Cracking predominantly follows the high-angle grain boundaries separating the long fibrous grains aligned along the extrusion direction (ED).

Figure 14.
Fracture surfaces of selected samples in air and in solution, with highlighted features in the centre and close to the edge. The main difference is the cracking behaviour observed in the T6 tempers when testing in solution, as highlighted for T6 in pH 7.
Figure 14.
Fracture surfaces of selected samples in air and in solution, with highlighted features in the centre and close to the edge. The main difference is the cracking behaviour observed in the T6 tempers when testing in solution, as highlighted for T6 in pH 7.

Figure 15.
Potentiodynamic polarisation curves of two selected samples that demonstrate clear difference in SCC behaviour.
Figure 15.
Potentiodynamic polarisation curves of two selected samples that demonstrate clear difference in SCC behaviour.


Table 1.
Alloy compositions (in wt.%) measured using optical emission spectroscopy.
| Alloy | Fe | Mg | Si | Zn | Cu | Zr | Ti | Al | Zn/Mg |
|---|---|---|---|---|---|---|---|---|---|
| 7003-H | 0.20 | 0.68 | 0.11 | 5.56 | 0.01 | 0.17 | 0.02 | Bal. | 8.20 |
| 7003-L | 0.20 | 0.71 | 0.05 | 5.65 | <0.01 | 0.15 | 0.01 | Bal. | 8.20 |
Table 2.
Compositional analysis using TEM-EDS of grain boundary particles (GBPs) in each condition acquired in microscope (ii). Average Zn/Mg ratio of ∼150 GBPs acquired using microscope (i) represented in the column named ‘Multiple’. Average GBP size with corresponding standard deviation measured at grain boundaries with dense and non-dense particle distribution in the two conditions with the largest difference in measured SCC properties. Average width of PFZs acquired from 10 grain boundaries in each condition.
| Single GBP Composition (at.%) | Multiple | GBP Size (nm) | PFZ (nm) | ||||
|---|---|---|---|---|---|---|---|
| Al | Zn | Mg | Avg. Zn/Mg | Type 1 (Sub-GB) | Type 2 | ||
| H-WQ-T6 | 47.0 ± 4.4 | 36.7 ± 3.1 | 16.5 ± 2.1 | 2.21 | 23.0 ± 8.9 | 65.1 ± 30.2 | 80 ± 6 |
| H-WQ-T7 | 49.5 ± 10.4 | 36.5 ± 7.6 | 13.9 ± 3.7 | 2.56 | 107 ± 15 | ||
| H-AC-T6 | 60.4 ± 5.2 | 28.2 ± 3.9 | 11.2 ± 2.4 | 1.64 | 103 ± 13 | ||
| H-AC-T7 | 53.9 ± 7.9 | 32.9 ± 5.9 | 13.0 ± 3.3 | 2.57 | 34.9 ± 8.2 | 88.9 ± 27.0 | 116 ± 10 |
Table 3.
Electrical conductivity measurements of the four studied conditions, represented by the average value and standard deviation of five independent measurements.
Table 3.
Electrical conductivity measurements of the four studied conditions, represented by the average value and standard deviation of five independent measurements.
| H-WQ-T6 | H-WQ-T7 | H-AC-T6 | H-AC-T7 | |
|---|---|---|---|---|
| MS/m | 26.15 ± 0.16 | 27.15 ± 0.13 | 26.13 ± 0.11 | 27.23 ± 0.09 |
Table 4.
Results from SSRT in air and 3.5 wt.% NaCl with pH 7 and pH 3. The yield strength (YS), ultimate tensile strength (UTS), total elongation, and reduction in area (RA) are given. The reduction in area ratio (RRA) are calculated based from the RA values and they demonstrate less change for the T7 tempers.
| YS (MPa) | UTS (MPa) | Total Elongation (%) | RA (%) | RRA (%) | ||||||||||
|---|---|---|---|---|---|---|---|---|---|---|---|---|---|---|
| ID | Air | pH 7 | pH 3 | Air | pH 7 | pH 3 | Air | pH 7 | pH 3 | Air | pH 7 | pH 3 | pH 7 | pH 3 |
| L-WQ-T6 | 362 | 365 | 366 | 376 | 379 | 380 | 14.4 | 17.8 | 13.7 | 49.3 | 32.4 | 36.6 | 0.66 | 0.74 |
| H-WQ-T6 | 357 | 359 | 371 | 374 | 379 | 386 | 15.5 | 15.6 | 14.4 | 56.4 | 44.5 | 40.9 | 0.79 | 0.72 |
| L-WQ-T7 | 311 | 323 | 316 | 322 | 335 | 328 | 15.7 | 14.4 | 14.9 | 63.7 | 61.1 | 49.2 | 0.96 | 0.77 |
| H-WQ-T7 | 322 | 315 | 319 | 333 | 327 | 332 | 15.9 | 15.2 | 15.4 | 65.0 | 56.8 | 46.2 | 0.87 | 0.71 |
| L-AC-T6 | 354 | 361 | 367 | 372 | 380 | 384 | 14.4 | 15.6 | 14.5 | 56.9 | 44.5 | 40.9 | 0.71 | 0.78 |
| H-AC-T6 | 358 | 355 | 354 | 375 | 373 | 373 | 16.1 | 14.7 | 14.9 | 58.8 | 40.6 | 34.9 | 0.69 | 0.59 |
| L-AC-T7 | 315 | 315 | 315 | 326 | 329 | 329 | 14.7 | 16.4 | 16.3 | 57.6 | 58.1 | 59.7 | 1.01 | 1.03 |
| H-AC-T7 | 313 | 311 | 314 | 324 | 322 | 328 | 14.7 | 16.1 | 14.5 | 60.6 | 50.7 | 57.9 | 0.84 | 0.95 |
© 2020 by the authors. Licensee MDPI, Basel, Switzerland. This article is an open access article distributed under the terms and conditions of the Creative Commons Attribution (CC BY) license (http://creativecommons.org/licenses/by/4.0/).
Share and Cite
MDPI and ACS Style
Lervik, A.; C. Walmsley, J.; Lodgaard, L.; D. Marioara, C.; Johnsen, R.; Lunder, O.; Holmestad, R. Stress Corrosion Cracking in an Extruded Cu-Free Al-Zn-Mg Alloy. Metals 2020, 10, 1194. https://doi.org/10.3390/met10091194
AMA Style
Lervik A, C. Walmsley J, Lodgaard L, D. Marioara C, Johnsen R, Lunder O, Holmestad R. Stress Corrosion Cracking in an Extruded Cu-Free Al-Zn-Mg Alloy. Metals. 2020; 10(9):1194. https://doi.org/10.3390/met10091194
Chicago/Turabian StyleLervik, Adrian, John C. Walmsley, Lars Lodgaard, Calin D. Marioara, Roy Johnsen, Otto Lunder, and Randi Holmestad. 2020. "Stress Corrosion Cracking in an Extruded Cu-Free Al-Zn-Mg Alloy" Metals 10, no. 9: 1194. https://doi.org/10.3390/met10091194
Note that from the first issue of 2016, this journal uses article numbers instead of page numbers. See further details here.